effectiveness of sediment basin and silt traps at oil
TRANSCRIPT

EFFECTIVENESS OF SEDIMENT BASIN AND SILT TRAPS AT
OIL PALM PLANTATIONS
NUR SYAHIZA BINTI ZAINUDDIN
A project report submitted in partial fulfillment of the
requirements for the award of the degree of Master of
Engineering (Civil-Environmental Management)
Faculty of Civil Engineering
Universiti Teknologi Malaysia
JUNE 2007

iii
To
Beloved parents;
Mr. Zainuddin Said & Mrs. Jamilah Yusoff
&
Beloved sisters & brothers;
Halawati, Aini, Nazmi & Syafiq
For all of their patience and understanding
In the past, present, and future

iv
ACKNOWLEDGEMENT
“In the name of God, the most Gracious, the most Compassionate”
First & foremost, it is pleasure to record my love and gratitude to my parents,
Mr. Zainuddin Said and Mrs. Jamilah Yusoff, and my family for their love, patience,
support, encouragement and sustaining my spirits.
I wish to extent my sincerest thanks to PM Dr Mohd Ismid bin Mohd Said,
from whom I received the greatest supervisor throughout my work. His criticisms
and suggestions have been extremely valuable in the development of this study.
Without his patience and unfailing support and guidance, this report would not have
been same as presented here.
I also would like to express my special thanks to Mr. Zaidi Zin from IZ
Environmind Sdn. Bhd. and his staff, for supplying invaluable data and maps which
are crucial for this study. Thanks again to them for the kindness and helping hand
whenever I encountered difficulties while accomplishing the project.
Finally, I would like to extend my appreciation and thanks to all my beloved
friends and for those who had given me assistance directly or indirectly for their
understanding during ups and downs as I pursued my Master degree.
May all the good deeds that were done will be blessed by Allah. Wassalam…

v
ABSTRACT
In recent year, there has been an increasing comment over deterioration of
water quality in many river systems in Malaysia. Therefore, this study analyse
the effectiveness of implementing various types of sediment basin and silt trap in
oil palm plantation located at Gua Musang. The district of Gua Musang is a
major producer of oil palm plantation in Kelantan with the total area of 55 191
hectares. The aim of this study is to identify whether the water from this oil palm
plantation be a part of contributor of the problem happened in Sg. Kelantan
which is nowadays become shallow and polluted because of sedimentation
problem. In this study there were three sediment basins has been analysed. A
field measurement on suspended solid, turbidity and sediment loading was
carried out before and after sediment basin. The range of Suspended Solid is
between 5 mg/L to 50 mg/L before the sediment basins and 1 mg/L to 14 mg/L
after sediment basins. Turbidity gives a result between 4.7 NTU to 79.0 NTU
before the sediment basins and 5.8 NTU to 42.0 NTU after the sediment basins.
From these data, total sediment loading per hectares was calculated and
compared to the amount calculate by using USLE and MSLE formula. Beside
that, the examination upon efficiency of sediment elimination was done and each
sediment basin gave a result of 80%, 37.5% and 72%. However from
questionnaire analysis on environmental awareness, the result shows that most
developers and their workers awareness are still in moderate and low level.

vi
ABSTRAK
Dewasa ini isu berkenaan kemerosotan kualiti air sungai-sungai yang terdapat
di Malaysia semakin meningkat. Oleh yang demikian, kajian ini bertujuan untuk
mengenalpasti keberkesanan kepelbagaian perangkap keladak yang dilaksanakan di
ladang kelapa sawit di Gua Musang sebagai salah satu usaha pengawalan
kemerosotan kualiti air. Daerah Gua Musang merupakan kawasan perladangan
kelapa sawit utama di negeri Kelantan dengan keluasan 55 191 hektar. Matlamat
kajian ini adalah untuk mengenalpasti samada aliran yang mengalir dari ladang
kelapa sawit ini turut menyumbang kepada masalah yang berlaku di Sungai Kelantan
di mana pada hari ini didapati semakin cetek & dan tercemar akibat daripada masalah
pemendapan. Tiga perangkap keladak dianalisis. Pengukuran terhadap beberapa
parameter kualiti air seperti pepejal terampai, kekeruhan dan beban sediment dibuat
sebelum dan selepas perangkap keladak. Pepejal terampai memberi keputusan antara
5 mg/L hingga 50 mg/L sebelum perangkap keladak manakala 1 mg/L hingga 14
mg/L untuk selepas perangkap keladak. Kekeruhan memberi nilai antara 4.7 NTU
hingga 7.90 NTU dan 5.8 NTU hingga 42 NTU masing-masing untuk sebelum dan
selepas perangkap keladak. Daripada data tersebut, beban sedimen dikira dan
perbandingan dibuat dengan menggunakan kaedah USLE dan MSLE. Selain itu,
pemeriksaan terhadap keberkesanan penyingkiran keladak juga dianalisis dan ketiga-
tiga perangkap yang dikaji masing-masing memberi peratus 80%, 37.5% dan 72%.
Walaubagaimanapun, daripada keputusan analisa soal selidik, didapati tahap
kesedaran terhadap kepentingan alam sekitar dikalangan pengusaha dan pekerjanya
masih di peringkat sederhana dan perlu dipertingkatkan.

vii
TABLE OF CONTENT
CHAPTER PAGE
TITLE i
DECLARATION ii
DEDICATION iii
ACKNOWLEDGEMENT iv
ABSTRACT v
ABSTRAK vi
TABLE OF CONTENT vii
LIST OF TABLE xi
LIST OF FIGURE xiii
LIST OF PHOTO xv
LIST OF SYMBOL xvi
LIST OF ABBREVIATION xvii
LIST OF APPENDICES xviii
I INTRODUCTION
1.1 Preamble 1
1.2 Problem Statement 2
1.3 Aim of Study 6
1.4 Objective 6
1.5 Scope of Study 6

viii
II LITERATURE REVIEW
2.1 Introduction 8
2.2 Application of Sediment Basin 8
2.2.1 Sediment Basin Efficiency 10
2.3 Application of Silt trap 11
2.4 Suspended Solids 11
2.4.1 Factors affecting Settlement of TSS 12
2.5 Fundamental of Sedimentation 13
2.5.1 Newton’s and Stokes’ Sedimentation 14
Laws
2.5.2 Hazen’s Surface Load Theory 14
2.6 Sediment Loading 15
2.7 Pollutant Load Modeling System 15
2.7.1 Universal Soil Loss Equation (USLE) 16
2.7.2 Modified Soil Loss Equation (MSLE) 16
2.7.3 Event Mean Concentration (EMC) 17
2.7.4 Pollutant Export Rate Method 18
2.8 Soil Erosion 18
2.8.1 Theory of Erosion by Water 19
2.8.2 Primary Factors Influencing Soil Erosion 19
By Water
2.8.3 Soil and Water Erosion Pollution Control 21
2.9 Oil Palm Plantation 21
2.9.1 Typical Project Activities 22
2.9.1.1 Pre-Development 22
2.9.1.2 Nursery Development 23
2.9.1.3 Site Preparation 23
2.9.1.4 Field Establishment 24
2.9.1.5 Maintenance & Harvesting 24
2.10 Environmental Preservation 25
2.11 Effect of Rainfall Distribution and Climates 25
Change on Oil Palm Plantation
2.12 Summary 27

ix
III METHODOLOGY
3.1 Data Requirement 28
3.2 Primary Data 28
3.3 Secondary Data 29
3.3.1 Water Quality Parameter 29
3.3.2 Rainfall Distribution Data 31
3.4 Method of Analysis 31
3.4.1 Trend analysis 31
3.4.2 Comparison with Standard Requirement 31
3.4.3 Questionnaire Study 32
3.4.3.1 Survey Question 32
3.4.3.2 Data Interpretation 33
IV STUDY AREA
4.1 Introduction 34
4.2 Project Site Background 37
4.3 Existing Physical Environment 39
4.3.1 Surrounding Land Use 39
4.3.2 Topography 39
4.4 Meteorology Characteristic 41
4.4.1 Average Rainfall 41
4.5 Existing Drainage Pattern 43
4.6 Existing Sediment Basin & Silt Trap 43
V RESULT AND DISCUSSION
5.1 Introduction 49
5.2 Sediment Basin and Silt Trap Analysis 50
5.2.1 Total Suspended Solids (TSS) 50
5.2.2 Turbidity 51
5.2.3 Other Water Quality Parameters 51
5.2.4 Sediment Elimination Efficiency 53
5.2.5 Sediment Basin Design Efficiency 54

x
5.2.5.1 Sizing of Sediment Basin 54
5.2.5.2 Settling Zone 56
5.3 Erosion Risk Analysis 57
5.3.1 Total Sediment Loading Estimation 58
5.3.1.1 Flowrate 58
5.3.1.2 Sediment Loading Estimation 58
5.3.2 Assessment of Factors Influencing Soil 60
Erosion And Sedimentation
5.3.2.1 Rainfall Factor (R) 60
5.3.2.2 Soil Erodibility (K) 60
5.3.2.3 Length-Slope Factor (LS) 61
5.3.2.4 Cover Management Factor (C) 61
5.3.2.5 Conservation Practice Factor (P) 62
5.3.2.6 Management Factor (VM) 62
5.3.3 Assessment of Soil Erosion Rates using 62
USLE Methods
5.3.4 Assessment of Soil Erosion Rates using 63
MSLE Methods
5.4 Water Quality Analysis 65
5.4.1 River Classification based on WQI 65
5.4.2 Trend Analysis for Suspended Solids 68
Parameter
5.5 Correlation Between Planting Stage and Rainfall 70
Distribution Analysis
5.6 Questionnaire Analysis 72
5.7 Discussion 76
VI CONCLUSION AND RECOMMENDATIONS
6.1 Conclusion 79
6.2 Recommendations 80
REFERRENCES 82
APPENDICES 88

xi
LIST OF TABLE
NO
TITLE
PAGE
1.1 Flood impact in Kelantan 3
1.2 Statistics of oil palm land area at Malaysia 4
2.1 Factors contribute to erosion phenomenon 19
3.1 Date on purpose sampling process for plantation 1 30
3.2 Date on purpose sampling process for plantation 2 30
3.3 Topic in the questionnaire 32
3.4 Questionnaire scale 33
4.1 Cultivated area by district in Kelantan 36
4.2 Characteristic for each project site 41
4.3 Characteristic for each sediment basin located in both study
areas
44
5.1 Suspended solids result 50
5.2 Turbidity result 51
5.3 Water quality result for each of sediment basins found in the
study area
52
5.4 Dry sediment basin sizing guidelines 55
5.5 Sediment basin size required based on MASMA guideline 56
5.6 Characteristic for each sediment basin 56
5.7 Sediment loading estimation per hectare per year 59
5.8 Exponent m based on slope percent 61
5.9 Erosion analysis using USLE method 63
5.10 Erosion analysis using MSLE method 63

xii
5.11 Classification for soil erosion risk 64
5.12 Water quality index (WQI) results for Sg. Wah and Sg.
Sungkai
65
5.13 Water Quality Index (WQI) (DOE, 1986) 66
5.14 Water quality monitoring results for Sg. Wah and Sg.
Sungkai
67

xiii
LIST OF FIGURE
NO
TITLE
PAGE
1.1 Satellite view of Kelantan River 3
2.1 Percent reduction in TSS vs. the TSS concentrations in the
inflow
13
2.2 Example of flow disturbances in a basin 14
2.3 Flow diagram of typical oil palm plantation development
activities
26
4.1 Location of Gua Musang 35
4.2 Total percentage for each types of plantation area at Gua
Musang
36
4.3 The location plan for both project sites 38
4.4 Topography map of plantation 1 project site 40
4.5 Topography map of plantation 2 project site 40
4.6 Trend of rainfall distribution at Cameron Highlands rainfall
station
42
4.7 Sediment basin cross section 44
4.8 Location of SB1 and SB2 in plantation two site area 47
4.9 Location of SB3 in plantation 2 site area 48
5.1 Suspended solids trend at Sg. Wah 68
5.2 Suspended solids trend at Sg. Sungkai in plantation 1 69
5.3 Suspended solids trend at Sg. Sungkai in plantation 2 70
5.4 Correlation between planting stage and rainfall amount 71
5.5 Result from questionnaire analysis for part A 73

xiv
5.6 Result from questionnaire analysis for part B 73
5.7 Result from questionnaire analysis for part C 74
5.8 Result from questionnaire analysis for part D 74
5.9 Result from questionnaire analysis for part E 75
5.10 Result from questionnaire analysis for part F 75

xv
LIST OF PHOTO
NO
TITLE
PAGE
2.1 Sediment basin can be temporary or permanent 10
2.2 Sediment basin are used to trap sediments on larger
construction sites
10
4.1 Well establish sediment basin found in plantation 1 labeled
as SB1
45
4.2 Condition of SB2 sediment basin which is still in
construction phase
46
4.3 Single sediment basin (SB3) found located in plantation 2
site area
46
xvi
LIST OF SYMBOL
A - Catchment area
a - An empirical coefficient
C - Erosion control practice factor
Ĉ - EMC of pollutant
E - Mean annual soil loss
e - An empirical exponent
ha - hectare
K - Factor of the soil erodibility
km - Kilometer
L - Annual load of Pollutant
m - Meter
mg - Milligram
P - Factor expressing the effects of conservation
R - Rainfall erosivity factor
S - Slope steepness factor
s - second
V - Settling zone
VM - Vegetation management factor
VR - Annual runoff depth
W - Average width
Y - Zone depth

xvii
LIST OF ABBREVIATION
AN - Ammoniacal Nitrogen
BOD - Biochemical Oxygen Demand
COD - Chemical Oxygen Demand
DO - Dissolved Oxygen
DOE - Department of Environment
EIA - Environmental Impact Assessment
EME - Environmental Monitoring Exercise
EMP - Environmental Monitoring Plan
INWQSM - Interim national Water Quality Standard for
Malaysia
IZE I. Z. Environmind
JUPEM - Jabatan Ukur dan Pemetaan
KHSB - Kapasiti Harapan Sdn. Bhd.
MPOB - Malaysian Palm Oil Board
MSLE - Modified Soil Loss Equation
POMs Palm Oil Mills
PVSB - Peransang Venture Sdn. Bhd.
SS - Suspended Solid
TSS - Total suspended solids
USLE - Universal Soil Loss Equation
WQI - Water Quality Index

xviii
LIST OF APPENDICES
NO
TITLE
PAGE
1.1 Articles in The Star Newspaper (28/03/07) Report on
Kelantan’s Lojing Highlands in Danger of Being Logged
Bare
88
1.2 Article in The Star Newspaper (28/03/07) Report on Forest
Reserve Under Treat Issue
89
3.1 Records of Monthly Rainfall Amount 90
3.2 Records of Number Of Raindays 91
3.3 DOE Water Quality Index Classes 92
3.4 Interim National Water Quality Standards For Malaysia 93
3.5 Questionnaire Form 95
5.1 Sediment Basin Types 97

CHAPTER I
INTRODUCTION
1.1 Preamble
When land is disturbed either for construction, agriculture, road building,
mining, logging, or other activities, the soil erosion rate increase from 2 to 40 000
times (Goldman et. al., 1986). The effect of this phenomenon is millions of tons of
the soil end up in our rivers, lakes, and reservoirs. Each year, billions of dollars have
to spend by land developers or property owner in order to cleaning up sediment and
repairing eroded stream banks, gullied hillsides, washed-out roads, mud chocked
drains and other erosion damage.
Most erosion will cause sediment problem and this can be greatly reduced by
proper planning and maintenance. Some of the methods are by using sediment basin
and silt trap. We should bear in mind that these structures does not stop erosion.
They only trap eroded soil before it can reach water body or adjacent property.
Generally, a sediment basin is designed to remove and retains portions of the
sediment being carried by runoff. In essence, they work by slowing the velocity of
runoff and letting suspended soil particles settle by gravity. During periods of heavy
rainfall sediment basin or silt trap constructed in oil palm plantation site must be
fully function to soakaways retain water and soil run-off. Therefore, leaf matter left

2
on slope from trimming the palm trees to harvest the fruit should be used to reinforce
terraces or to otherwise create erosion barriers on contours. The other way is by
construct silt pits along roads and in fields to trap eroded soil carried in runoff.
From management aspect, before any land is to be developed for oil palm
cultivation, an Environment Impact Assessment (EIA) must be undertaken to ensure
that there are no adverse effects on the environment arising from the cultivation of
the crop. A detailed Environmental Monitoring Plan (EMP) with institutional
reporting requirements, and parameters for monitoring of water quality,
agrochemical usage, impact on aquatic life, changes in forest and wildlife and other
impacts as based on public consultations must be included in the EIA study.
Environmental monitoring, auditing and surveillance must be conducted to
ensure that all the works done are comply with the regulations and conditions lay
down by the Department of Environment (DOE) prior to the commencement of a
project.
1.2 Problem Statement
Kelantan River or namely as Sungai Kelantan in Malay language is the major
river in Kelantan, Malaysia. It drains a catchment area of about 12 000 km² in north-
east Malaysia and flows northwards into the South China Sea. The rainfall over the
area varies between 0 mm in the dry season (March-May) to 1750 mm in the
monsoon season (November-January). The average runoff from the area is about 500
m³/s. Figure 1.1 shows the satellite view of Kelantan River.
The Kelantan River regularly overspills its banks either during the months of
November to February because of the northeast monsoon season or others reason.
Some of the worst floods in recent years are listed in table 1.1 (Hazalizah, 2005).

3
Figure 1.1: Satellite view of Kelantan River
(source: http://www.worldwindcentral.com)
Table 1.1: Flood impact in Kelantan
Year Evacuees Deaths Damage (US$1000)
2004 10 476 12 3 767
2003 2 228 2 1 461
2001 5 800 0 2 227
1993 13 587 0 3 98
1988 41 059 0 *
1986 7 963 0 1 603
1983 33 815 0 *
* Data not available

4
This flood phenomenon occurs because of many reasons. Latest issues
contribute to this problem was report in The Star newspaper on 28 March 2007
where the last frontier in Lojing Highlands, Kota Bharu state with lush forest reserve
is now in danger of being log bare and will give big impact on the state’s ecology.
The articles of this report are shown in Appendix 1.1 and 1.2. The existing impact
has been studied and the result found that nowadays Kelantan River is become
shallow and cannot provide irrigation resources to paddy farmers nearby. If this
problem is not protected, it will affect the state’s future natural resources which may
be compromised by excessive logging. The purpose of logging activities carried out
at this area is for development of oil palm plantation.
Oil palm (Elaeis guineensis) was first introduced into Malaysia as an
ornamental plant in 1870 (Williams et. al., 1970). The cultivation of oil palm has
grown every year since 1960 when the Malaysian government embarked on a
massive agricultural diversification programme. It has now become the cornerstone
of the country's agricultural sector, with a planted area of 4 165 215 hectares in 2006
(MPOB, 2006). Table 1.2 shows the statistics of oil palm land area at Malaysia for a
few latest years. From that total area, Kelantan was covered about 80 152 hectares
and Gua Musang is the main oil palm manufacturer for this state. Based on Country
& Land Office of Gua Musang, the total area of oil palm cultivation in 2001 situated
in Gua Musang is 51 170.5 hectares.
Table 1.2: Statistics of oil palm land area at Malaysia
Land Area (ha) under Oil Palm Cultivation (1975-2006)
1980 1985 1990 1995 2000 2003 2004 2005 2006
1 023 306 1 482 399 2 029 464 2 540 087 3 376 644 3 802 040 3 880 000 4 051 374 4 165 215
(Source: MPOB Malaysia, 2006)
Oil palm cultivation can cause erosion and sedimentation during its operation.
This sediment will wash away into the lakes, rivers and waterways. Although this
sediment is only a fraction of the total sediment load, it is a major source of pollution

5
of many lakes, streams and river. Eroded soil contains nitrogen, phosphorus, and
other nutrients (Goldman et. al., 1986). When carried into water bodies, these
nutrients trigger algal bloom that reduce water clarity, deplete oxygen, lead to fish
kills and create odors. Turbidity from sediment also reduces in-stream
photosynthesis, which leads to reduce food supply and habitat.
To prevent eroded soil or sediment from polluted the nearest river or stream,
one of the methods that can be implementing is by using sediment basin or silt trap.
Nowadays, there is very little performance data on sediment or silt structures at one
site. All too often these structures have been constructed with major flaws which
prevent good performance. In other cases, these sediment basin and silt trap have
been properly constructed but not monitored or maintained.
The fact is, those structures required maintenance and cleaning at regular
intervals. If too much sediment is allowed to accumulate in them, they will cease to
function. Little or no settling will occur, and trapped sediment will be resuspended
and washed away. Finally, sediment basin can pose a safety hazard to human when
water is impounded in them.
Awareness on above phenomenon was the main reason why this study was
conducted. Two main areas were chosen around Gua Musang. First project site was
initiated by Kapasiti Harapan Sdn. Bhd. (KHSB) which is located at PT 4957 &
4958, Mukim Ulu Nenggiri, Daerah Bertam, Gua Musang, Kelantan Darul Naim.
This oil palm site is situated adjacent to the north, south and east of Hutan Rizab
Sungai Betis and west of Hutan Rizab Sungai Papan. Total area for this project site is
3 000.00 acres (1, 214.06 hectares).
The second project site was initiated by Peransang Venture Sdn. Bhd.
(PVSB). PVSB have been given responsibility to develop approximately 2,000.00
acres (809.39 hectares) land located at PT 5011, Mukim Ulu Nenggiri, Daerah
Bertam, Gua Musang, Kelantan into an oil palm plantation project. This project site
is located adjacent to the north, south, west and east of Hutan Rizab Sungai Betis.
Both project sites are situated near the main river and small rivulets which found
scattered within the project area. Therefore, it is important to study the effectiveness

6
of sediment basin and silt trap constructed at both side in order to check the
efficiency.
1.3 Aim of Study
The aim of this study primarily at deriving the level of effectiveness and
awareness on sediment basin and silt trap implemented in oil palm plantation at Gua
Musang.
1.4 Objective
The objective of this study was three-fold, namely:
i. To determine the efficiency of sediment basin and silt trap implemented in oil
palm plantation.
ii. To analyze the trend of water quality at the project sites.
iii. To identify the level of environmental awareness among developers or
planters involve in oil palm plantation project.
1.5 Scope of Study
The scope of the study covers all types of sediment basin and silt trap located
at two oil palm plantation given below:
i. Oil palm plantation at PT 4957 & 4958, Mukim Ulu Nenggiri, Daerah
Bertam, Gua Musang, Kelantan Darul Naim which initiated by Kapasiti
Harapan Sdn. Bhd. (KHSB), and

7
ii. Oil palm plantation at PT 5011, Mukim Ulu Nenggiri, Daerah Bertam, Gua
Musang, Kelantan Darul Naim which initiated by Peransang Venture Sdn.
Bhd. (PVSB).
This study will concentrate on deriving the effectiveness of sediment basin
and silt trap implemented in oil palm plantation in Gua Musang. The effectiveness
will be determined based on considering a few factors. Suspended solid and turbidity
are the main parameter studied for both sediment basin and silt trap. Assessment on
water quality of water bodies on selected parameters namely pH, Dissolved Oxygen
(DO), temperature, Biochemical Oxygen Demand (BOD), Chemical Oxygen
Demand (COD), Suspended Solid (SS), Ammoniacal Nitrogen (AN), E-Coli and Oil
& Grease are also conducted to analyze water quality at the site.
Beside that, erosion risk analysis was also done by comparing with Universal
Soil Loss Equation (USLE) method and Modified Soil Loss Equation (MSLE)
method. This study also conducted interview session with project proponent and
workers in order to analyze their level of environmental awareness on implementing
oil palm plantation project.

CHAPTER II
LITERATURE REVIEW
2.1 Introduction
Since mankind first cultivated plants, agriculture has had an impact on the
environment. While the intensity of cultivation can exacerbate those impacts, all
agriculture, including subsistence farming, has environmental and social impacts
both on the farm and in the surrounding areas. The planting of oil palm is no
exception (S. Lord and J. Clay, 2006). The past few decades have seen the rapid
growth of the oil palm industry in Malaysia, in terms of cultivated area and volume
of production. Today, oil palm dominates the landscape throughout the country and
the industry has become a major contributor to Malaysia’s export earnings (Teoh
Cheng Hai, 2000).
2.2 Application of Sediment Basin
A sediment basin is a temporary basin formed by excavation or by
constructing an embankment so that sediment-laden runoff is temporarily detained
under quiescent conditions, allowing sediment to settle out before the runoff is
discharged. It may be suitable for use on larger projects with sufficient space for

9
constructing the basin. Sediment basins are man-made depressions in the ground
where runoff water is collected and stored to allow suspended solids to settle out.
They are used in conjunction with erosion control measures to prevent off-site
sedimentation. Their primary purpose is to trap sediment and other course material.
Sediment basin should be among the first structures installed when grading
begins, and they should remain place until the drainage area is stabilized. The
location of basins should be carefully thought out during the planning phase. A
sediment basin will usually be built near a low point on a site so it can trap a large
amount of polluted runoff. It should not, however, be constructed where it will trap a
substantial amount of clean runoff along with the dirty. The sediment must be
trapped before it reaches a natural stream (Goldman et. al., 1986).
Based on California Stormwater BMP Handbook (2003), it state that to
improve the effectiveness of the basin, it should be located to intercept runoff from
the largest possible amount of disturbed area. The best locations are generally low
areas. Drainage into the basin can be improved by the use of earth dikes and drainage
swales. The basin must not be located in a stream but it should be located to trap
sediment-laden runoff before it enters the stream. The basin should not be located
where its failure would result in the loss of life or interruption of the use or service of
public utilities or roads.
Sediment basins utilize a release structure to control the discharge, and
normally have an emergency spillway to release the flow from larger storms. If
properly planned, the basins may also serve as permanent stormwater management
facilities, such as detention basins, or permanent sediment removal structures. Photo
2.1 and 2.2 shows the example of sediment basin.

10
Photo 2.1: Sediment basin can be temporary or permanent
Photo 2.2: Sediment basin are used to trap sediments on larger construction sites
2.2.1 Sediment Basin Efficiency
The trapping efficiency of a basin is a function of the particle size distribution
of the inflowing sediment. Assuming ideal settling conditions, all particles with size
and density equal to or larger than those of the design particle will be retain in the

11
basin. In addition, some smaller particles will be captured while the basin is
dewatering and the overflow rate has decreased. Ideal basin efficiency corresponds to
the percent of soil equal to or larger than the design particle size. The only way to
increase this efficiency is by increase the surface area of the basin.
In California, for example, many development projects are required by local
ordinances to provide a stormwater detention basin for post-construction flood
control, desilting, or stormwater pollution control. A temporary sediment basin may
be constructed by rough grading the post construction control basins early in the
project. Sediment basins trap 70-80 % of the sediment that flows into them.
Therefore, they should be used in conjunction with erosion control practices such as
temporary seeding, mulching, diversion dikes, etc., to reduce the amount of sediment
flowing into the basin.
2.3 Application of Silt trap
Silt trap may be designed in the same way as basins. The major difference
from basins is that traps serve areas smaller than 5 acres (2 ha). It is much easier to
install and also more easily to moved to keep up with grading activities. A silt trap
can be formed by excavation or by construction of environments. The outlet may be
an earth or stone spillway, a pipe riser or a storm drain inlet. This last option is very
commonly employed, since it utilizes permanent facilities at the site. In all other
cases, outlet protection must be provided to prevent further erosion as the treated
runoff leaves the trap (Goldman et. al., 1986).
2.4 Suspended Solids
Total suspended solids (TSS) include all particles suspended in the water that
can be trapped by a filter. Suspended solids can include inorganic materials and
organic materials like detritus, live organisms, and sewage. Large amounts of

12
suspended solids can reduce lake clarity, reduce light availability necessary for
growth of healthy macrophyte (rooted aquatic plant) communities, and harm fish and
other aquatic organisms.
High total suspended solids can also cause an increase in water temperature
because the particles can trap heat from the sun. Additionally, high solids
measurements can indicate high levels of nutrients, bacteria, metals, and other
chemicals since many of these pollutants are attached to sediment. Management
practices that prevent soil loss and erosion can help to maintain low total suspended
solids concentrations. Some of these practices are: erosion control during
construction and development, streamside vegetated buffer maintenance,
conservation tillage, storm water detention, and wetland restoration.
2.4.1 Factors affecting Settlement of TSS
The following factors seem to be significance in describing the settling
characteristics of TSS and associated pollutants (Ben and Peter, 1993):
� Pollutant load in stormwater by type
� The percentages of settleable pollutants
� Particle size distribution
� Distribution of the solids by their settling velocities
� Distribution of pollutants by settling velocities
� Particle volume distribution of the solids and
� The density of the settleable pollutants
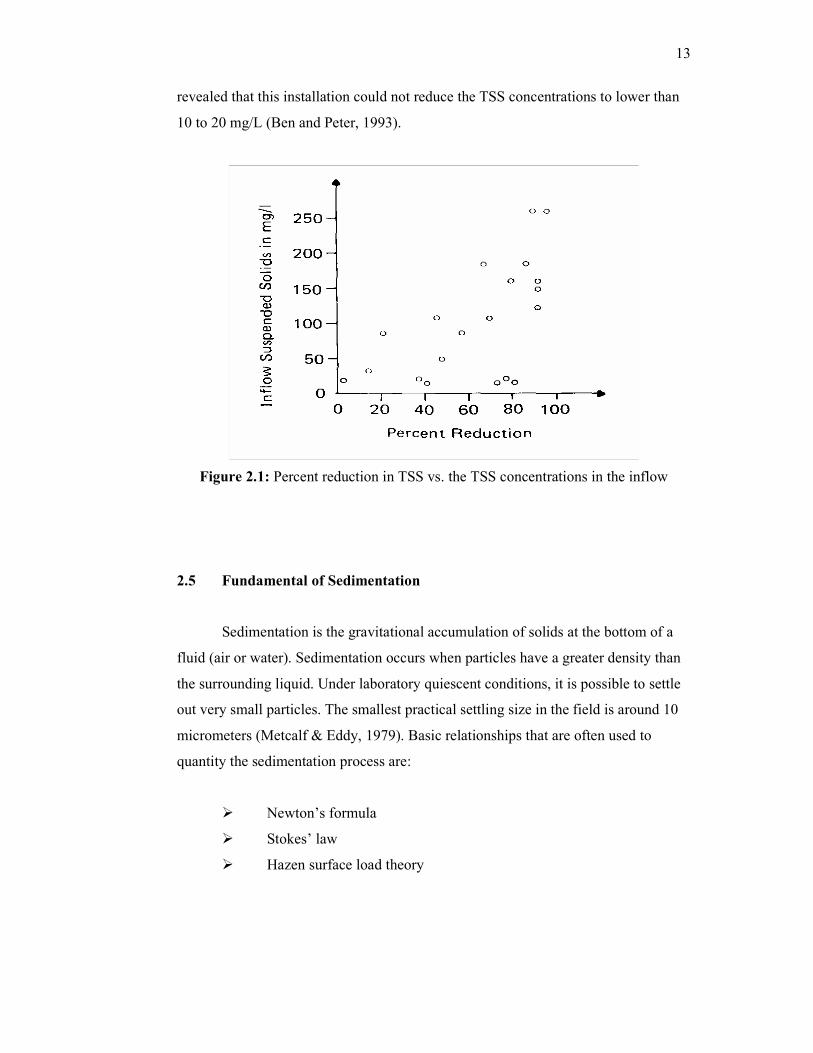
Stockholm’s Water and Sewer Works (1978), one of water works department,
found that the rate of sedimentation is dependent on the initial concentration of TSS
in stormwater. Figure 2.1 compares data of incoming TSS concentrations against the
percent reduction in TSS in stormwater collected at a sedimentation tunnel near
Stockholm. A clear trend supporting a correlation between incoming TSS
concentrations and its removal can be seen in this figure. The same study also
13
revealed that this installation could not reduce the TSS concentrations to lower than
10 to 20 mg/L (Ben and Peter, 1993).
Figure 2.1: Percent reduction in TSS vs. the TSS concentrations in the inflow
2.5 Fundamental of Sedimentation
Sedimentation is the gravitational accumulation of solids at the bottom of a
fluid (air or water). Sedimentation occurs when particles have a greater density than
the surrounding liquid. Under laboratory quiescent conditions, it is possible to settle
out very small particles. The smallest practical settling size in the field is around 10
micrometers (Metcalf & Eddy, 1979). Basic relationships that are often used to
quantity the sedimentation process are:
� Newton’s formula
� Stokes’ law
� Hazen surface load theory

14
2.5.1 Newton’s and Stokes’ Sedimentation Laws
For spherical particles falling through a liquid, Newton’s suggest that fall
velocity is directly proportional to the square of the particle diameter and the
difference in the densities between the particle and the fluid. In water, Stokes’ law is
applicable to particles having an equivalent spherical diameter of up to 100 microns.
The particles density has a significant effect on the fall velocity.
2.5.2 Hazen’s Surface Load Theory
Hazen’s surface load theory assumes that for a particle to be permanently
removed from the water column, it must reach the bottom of a basin before the water
carrying it leaves the basin. Consider a long rectangular basin of length, L, width, W,
and depth, D.
This theory presupposes that the flow through the basin is uniform and
laminar. Unfortunately, these are not the conditions found in practice. A field
installation can experience multilayered flow, turbulence, eddies, circulation
currents, diffusion at inlets and outlets, etc. (see figure 2.2). Some investigators
speculated that under turbulent conditions, no more than 60% of the removal
predicted using Hazen theory is achieved (Ben and Peter, 1993).
Figure 2.2: Example of flow disturbances in a basin
15
2.6 Sediment Loading
Sediment load in watercourses typically does not follow a build up or
washoff process. Rather, it is more likely to be influenced by erosion processes in the
catchments area. Sediment load on exposed area s is also largely dominated by
erosion (MASMA, 2000). According to Hewlett (1982), sediment load can be
divided into three categories. There are:
i. Suspended Load
� Contains organic and inorganic particulate matter that is suspended in
and carried by moving water.
ii. Dissolved Load
� All organic and inorganic material carried in solution by moving
water.
iii. Bed load
� Coarse materials such as gravel, stones, and boulders that move along
the bottom of the channel. These materials move by skipping, rolling,
and sliding.
However, in this study concentration is given only on one type of sediment
load namely as suspended load.
2.7 Pollutant Load Modeling System
Pollutant load is the amount of stress placed upon an ecosystem by pollution,
physical, released into it by man-made or natural means. A number of empirical
approaches have been proposed as a basis for calculating pollutants loads such as:
i. Universal Soil Loss Equation (USLE)
ii. Modified Soil Loss Equation (MSLE)
16
iii. Event Mean Concentration (EMC)
iv. Pollutant Export Rate Method
2.7.1 Universal Soil Loss Equation (USLE)
In the search for a model for planning erosion measures at sites, the Universal
Soil Loss Equation (USLE) is the most widely used as predictive method (MASMA,
2000). Erosion that cause by rainfall and surface runoff may be expressed as the
relation between the erosity of rainfall and soil erodibility. W. H. Wishmeier and D.
D. Smith was specified on the basis of wide range observations of the erosion
processes and the effects of the other factors. Their equation, namely as the is written
as shown in Equation 2.1.
E = R . K . L . S . C . P ...(Eq. 2.1)
Where;
E = Mean annual soil loss (t/ha)
R = Rainfall erosivity factor
K = Factor of the soil erodibility
L = Factor of slope length
S = Slope steepness factor
C = Erosion control practice factor
P = Factor expressing the effects of conservation
2.7.2 Modified Soil Loss Equation (MSLE)
Modified Soil Loss Equation (MSLE) is originally modified from USLE
method. USLE has been modified by FRIM for Malaysian conditions (MASMA,
2000). The equation is shown in Equation 2.2 below. In this equation, vegetation

17
management factor (VM) is combination of two factors C and P used in the original
USLE.
E = R . K . L . S . VM ...(Eq. 2.2)
Where;
E = Mean annual soil loss (t/ha)
R = Rainfall erosivity factor
K = Factor of the soil erodibility
L = Factor of slope length
S = Slope steepness factor
VM = Vegetation management factor
2.7.3 Event Mean Concentration (EMC)
Event mean concentration (EMC) is primary information for non-point source
pollution assessment of a watershed. EMCs for various types of agriculture such as
dairy, row crop farming under different climate and geologic conditions are not fully
developed, yet. MASMA (2000) state that although the definition of EMC relate to a
single rainfall event, the assumption is often made that the EMC is the same for all
events. Therefore, in this method the load is approximated by the simple equation as
shown in Equation 2.3.
L = 10-4. Ĉ. VR. A …(Eq. 2.3)
Where;
L = Annual load of Pollutant (kg)
Ĉ = EMC of pollutant (mg/L)
VR = Annual runoff depth (mm)
A = Catchment area (ha)

18
2.7.4 Pollutant Export Rate Method
An alternative to the use of the simple EMC is to represent pollutant loads as
a function of runoff. The form of the function should be derived by regression
analysis of real data. If locally-collected data is to be used, the statistical effects of a
small sample size and sampling errors should be taken into account (MASMA,
2000). The general form of the pollutant rate equation is shown in Equation 2.4.
L = a. Re …(Eq. 2.4)
Where;
L = Event load in (kg/km2/day)
a = An empirical coefficient
R = Event stormwater runoff (mm/day)
e = An empirical exponent
2.8 Soil Erosion
Erosion can be qualifies as a major environmental problem worldwide. It can
affect the land and its inhabitants either in direct or indirect ways. Soil erosion is an
issue where the adage “think globally, act locally,” is clearly apropos. Think
globally, because soil erosion is a common problem that has, does, and will continue
to impact the global community. Act locally, because effective erosion control
requires action at the hillslope, field, stream channel and upland watershed scales
(Toy et. al., 2001).
Soil erosion is an insidious process that attacks the most productive topsoil
layer first and may cause decreasing productivity at imperceptible rates over
extended periods. Thus, the decline in soil productivity at increasing the productivity
often is masked by planting high-yield crop breeds and by increasing the applications
of fertilizers and pesticides where financial resources are available to permit these
investments (Follett et. al., 1985).

19
2.8.1 Theory of Erosion by Water
Erosion is caused by surface runoff and results from complex natural process.
The process of water erosion results and develops owing to surface runoff which is
affected by a number of factors and interrelation. Water erosion is best examined
within the spatial context of a watershed. Water flow and its paths are central to the
study of water erosion.
Water erosion and sedimentation include the processes of detachment,
entrainment, transport, and deposition of soil particles. The major forces driving
these processes are shear stresses generated by raindrop impact and surface runoff
over the land surface. Water erosion is a function of these forces applied to the soil
by raindrop impact and surface runoff relative to the resistance of the soil to
detachment.
Once set in motion, soil particles are referred to as sediment. Sediment
delivery is amount of eroded material delivered to a particular location, such as from
the eroding portions of hillslope (soil loss) or outlet of a watershed (Sediment yield)
(Toy, et. al., 2001).
2.8.2 Primary Factors Influencing Soil Erosion By Water
There are a few factors contribute to erosion. Some of the factors are
described in table 2.1 below.
Table 2.1: Factors contribute to erosion phenomenon
No Factor Description
1 Climate • Climate influences erosion directly or indirectly.
• Precipitation is the single most important climatic variable

20
affecting water erosion.
• Erosion by rainfall occurs from raindrops striking soil, and
water flowing over the soil.
2 Soil • Soil produces sediment by erosion that can fill reservoir and
water conveyance channels, be a pollutant itself, and carry
adsorbed chemicals that degrade water quality in streams,
lakes, etc.
• Soil texture is the single most important soil property in
many applications, especially in erosion.
• Soils that are high in clay have low soil erodibility values
because these soils are resistant to detachment.
• Soils that are high in sand also have low soil erodibility
values but the erosivity index is based on total kinetic
energy and rainfall intensity.
3 Topography • Also refers to the geometry of land surface.
• The important geometric variables are slope length and
steepness, shape in the profile view, and shape in the plan
view.
• Uniform slopes are the simplest slope.
• Erosion increases along uniform slopes because of the
accumulation of runoff along the slope.
4 Land Use • Land use refers to both general land use and the
management applied to that land.
• Erosion occurs in exactly the same way on all land uses.
• Land use activities affect the forces applied to the soil and
the resistance of the soil either by the erosive agents of
raindrop impact or surface runoff.
5 Vegetation • Vegetation canopy is the aboveground part of the vegetation
that intercepts raindrops but does not touch the soil surface
to affect surface runoff.
• Erosion is reduced as the amount of biomass in the soil is
increased by vegetation type and production (Renard et al.,
1997).
21
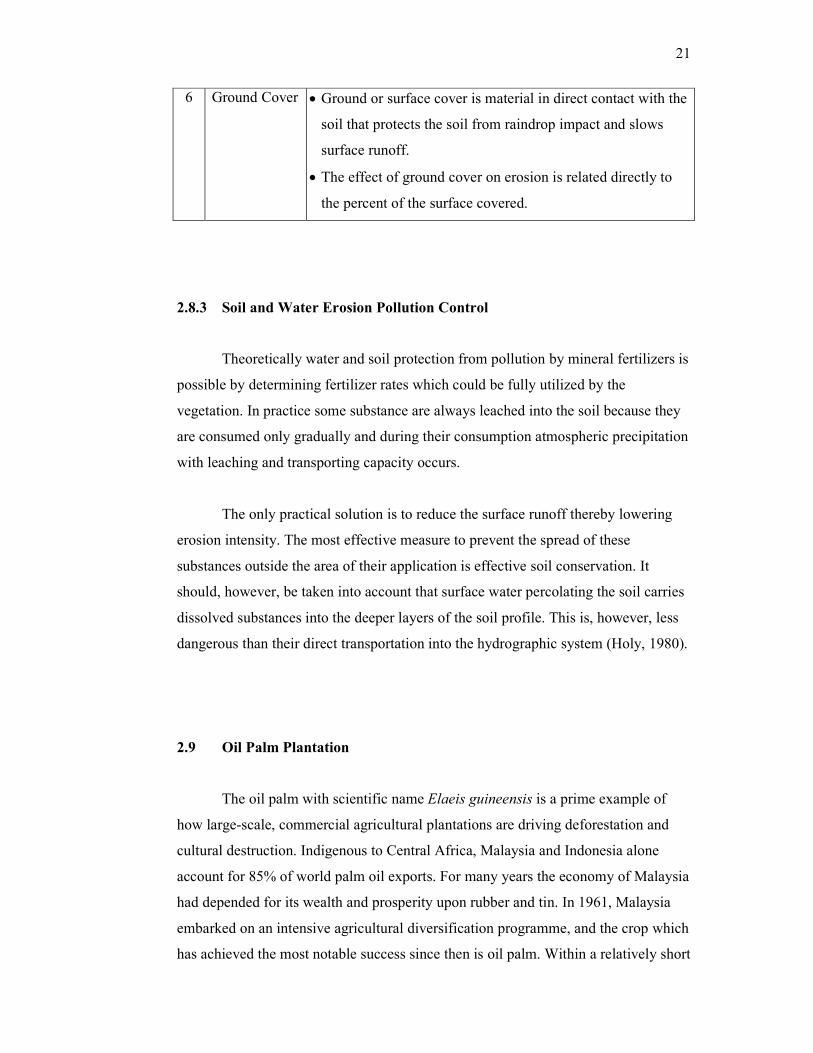
6 Ground Cover • Ground or surface cover is material in direct contact with the
soil that protects the soil from raindrop impact and slows
surface runoff.
• The effect of ground cover on erosion is related directly to
the percent of the surface covered.
2.8.3 Soil and Water Erosion Pollution Control
Theoretically water and soil protection from pollution by mineral fertilizers is
possible by determining fertilizer rates which could be fully utilized by the
vegetation. In practice some substance are always leached into the soil because they
are consumed only gradually and during their consumption atmospheric precipitation
with leaching and transporting capacity occurs.
The only practical solution is to reduce the surface runoff thereby lowering
erosion intensity. The most effective measure to prevent the spread of these
substances outside the area of their application is effective soil conservation. It
should, however, be taken into account that surface water percolating the soil carries
dissolved substances into the deeper layers of the soil profile. This is, however, less
dangerous than their direct transportation into the hydrographic system (Holy, 1980).
2.9 Oil Palm Plantation
The oil palm with scientific name Elaeis guineensis is a prime example of
how large-scale, commercial agricultural plantations are driving deforestation and
cultural destruction. Indigenous to Central Africa, Malaysia and Indonesia alone
account for 85% of world palm oil exports. For many years the economy of Malaysia
had depended for its wealth and prosperity upon rubber and tin. In 1961, Malaysia
embarked on an intensive agricultural diversification programme, and the crop which
has achieved the most notable success since then is oil palm. Within a relatively short

22
period, Malaysia became the world’s largest commercial producer and exporter of
palm oil.
Oil palm plantation development is defined as opening up of land areas for
the purpose of cultivating oil palm and carrying out other related activities such as
land clearing, biomass management and disposal, earthworks, planting and
replanting activities. Oil palm is basically a low land tropical crop and, as such, is
confined to area with an elevation that is less than 300 meters above sea level where
the humid tropical environment is most prevalent. The cultivation of oil palm is also
influenced by the nature of the topography, in particular, the slope.
Slope which is considered suitable for oil palm cultivation is range from 0 to
20°. Area which have slope exceeding 20° are considered unsuitable for its
cultivation due to serious problem of workability, field operations and maintenance,
harvesting, maneuverability of farm vehicles and the high risks of soil erosion looses
which are detrimental to the environment.
2.9.1 Typical Project Activities
2.9.1.1 Pre-Development
This stage involves the conduct of feasibility studies, application or
acquisition of land, preparation of EIA, and survey of boundary and plantation
blocks. The project proponent has to identify the site as suitable for the proposed
project activity. Beside that, a preliminary EIA study is also conducted during this
stage to identify potential environmental impact that would arise from the proposed
activity. The report has to be submitted to the authority, where approval is required
before the project can take off the ground by the project proponent (PEIA Gua
Musang, 2003).

23
2.9.1.2 Nursery Development
Nursery technique for oil palm has been evolved by planters over the years.
Normally one ha nursery will cater for a planting area of 100 ha. This stage will
prepare high quality seedlings for field planting when the plantation proper site has
been developed. When it is intended to raise seedlings by planting them into the
ground, it is usual to keep the seedlings for a period of about 4 months in a pre-
nursery where they can be better tended and will reach a size more suitable for
planting out.
At the pre-nursery stage, oil palm seedlings respond well to nitrogen
fertilizer. A suitable fertilizer treatment consist of mixing 2 oz. of a high nitrogen
fertilizer mixture containing the major nutrients nitrogen, phosphorus, potassium and
magnesium with 1 oz. of ammonium phosphate or urea in 4 gal. of water and
applying this by water-can to each bed of about 500 seedlings. Ideally, the fertilizers
should be spread over a small circle surrounding each seedling and worked lightly
into the soil.
2.9.1.3 Site Preparation
The preparation of estate land for planting must of course be synchronized
with the production of the seedlings from the nursery. In most cases land for planting
in Malaysia will either under jungle or planted with rubber, coconuts or other
plantation trees which are due for replacement. Normally the existing vegetation is
cleared and removed to enable earthworks (particularly terracing & drainage works).
Consequently, land clearing is carried out by felling or up-rooting the trees and
burning. Clearing and burning of jungle and other larger stands of vegetation
produces some marked changes in soil fertility and in the susceptibility of the soil to
erosion.
Cover crops will be planted and maintained during this stage. The purpose is
to cover the soil and take the place of planting the usual cover legumes. It also

24
provides a secondary source income during the establishment phase of the plantation.
Terrace are constructed so that run-off water during heavy rains flows laterally to
appropriate outlet drains which lead the water to a suitable discharge point such as a
stream, or grassy slope, a stony area, etc.
Where outlet drains are required, the drainage areas themselves should be
erosion resistant. Another aspect to consider in site preparation aspect is planning of
road system. Road system may take the form of a grid which is integrated with the
drainage system.
2.9.1.4 Field Establishment
Field lining and holing will be carried out. Suitable seedling from the nursery
will be transplanted on prepared planting field. In carrying out planting operations,
the sitting of planting holes should be done prior to digging, so as not hold up the
holing gang.
Equilateral or triangular spacing is used for growing oil palms, and the most
convenient method of marking the holes when skilled provision is available is to
work from an accurately placed base line across a field, sighting each new line the
correct perpendicular distance from the base line and then marking off the palm
positions in each line.
2.9.1.5 Maintenance & Harvesting
Planted palm trees are maintained by manuring and control of diseases, weed
and pests. Weed and cover control forms the major task of field maintenance. Soil
cover tends to prevent erosion and loss of organic matter from the soil. Leaching of
nutrients is also reduced and soil structure and rainfall acceptance is improved.
Harvesting will normally commence within 2.5 to 3 years after field planting. The

25
correct time to harvest bunches is when the fruits become loose and can be
dislodged. Unnecessary handling and bruising of the fruits should be avoided. After
completion of the productive life span (20 to 25 years), decision will be made on
either to replant or abandon the oil palm plantation.
A project flow diagram for a typical activities related to oil palm plantation
development is shown in Figure 2.3.
2.10 Environmental Preservation
Currently, concern for the preservation of the environment takes a high
priority in the development and exploitation of land without exceptions. When
developing land for oil palm cultivation, special considerations must be given to the
protection of the environment.
However, it does not provide as much protection of the virgin jungle. Thus
when the need arises to replace the jungle with oil palm, careful evaluation must be
done to ensure that economic gains from the cultivation of oil palm are not negated
by land degradation. Oil palm should only be cultivated when it causes negligible
damage to the environment (Yusof. et. al., 1993).
2.11 Effect of Rainfall Distribution and Climates Change on Oil Palm
Plantation
The oil palm requires a warm tropical climate and a high rainfall, and for this
reason its cultivation is at present confined to lowland areas of the humid equatorial
regions of the world (Williams et. al., 1970). Climates change affecting erosion
phenomenon at oil palm plantation. Based on Preliminarily EIA report conducted at
oil

26
Nursery Establishment � Access road � Base camp � Site clearing - under brushing & clear felling � Biomass management & disposal � Earthworks, drainage & irrigation � Planting and maintenance of seedlings
Site Preparation � Access road � Base camp � Utilities provision � Site clearing - under brushing & clear felling � Biomass management & disposal � Earthworks, drainage, infrastructure � Cover crop establishment
Field Establishment � Field lining & holing � Final culling � Transplanting
Maintenance & Harvesting � Fertilizer application � Use of control agro-chemicals � General field upkeep � Harvesting � Transportation of FFB to POMs
Replanting � Nursery establishment � Removal of old palm trees � Biomass management & disposal � Field lining and holing � Transplanting of mature seedlings � Maintenance & field upkeep � Harvesting & transportation of FFB
Figure 2.3: Flow diagram of typical oil palm plantation development activities
Abandonment � Evacuation of plantation staff & workers � Removal of equipment, machinery & structures � Site restoration/ rehabilitation

27
palm plantation in Gua Musang, the relationship between precipitation characteristics
run-off and soil is complex. In a study of 19 independent variables measuring rainfall
characteristics, the most important single measure of the erosion producing factor of
a rainstorm was the product, which is rainfall intensity.
2.12 Summary
The past few decades have seen the rapid growth of the oil palm industry in
Malaysia, in terms of cultivated area and volume of production. There is evidence to
suggest that cultivation activities has little long term effect on soil loss since
abandoned plots quickly are recolonized by vegetation. However, where fallow
periods are reduced or where the ground is left bare between row crops, sheet erosion
is high (Department of Environment, 1996). It is therefore important to look at the
specific land management practices used by farmers and to assess the risk of erosion
and sediment produced associated with particular types of land use with erosion risk
assessment methods.
A sediment basin was designed to capture increased amounts of sediment from earth
disturbance sites and will improve environmental quality. Evaluation and analysis on
sediment basins is needed to determine if traps are an appropriate treatment for such
an array of streams. Consideration has to be given in many factors which contribute
to the effectiveness of sediment basin such as the efficiency in reducing sediment
amount, the design criteria, sediment loading transport, etc. Perhaps, the final
outcome will help in facilitate integration of environmental considerations for
sustainable management of tropical forests.

CHAPTER III
METHODOLOGY
3.1 Data Requirement
This study took into consideration from various sources, including site
surveying, questionnaire, preliminary EIA report, etc. To fulfill study objectives, data
and information used in this study was classified into two groups, namely as primary
and secondary data. All the data are needed to quantify the effectiveness of sediment
basin implemented in the study area and sediment removal efforts on river channel
characteristics and substrates, and relate them to river water quality.
3.2 Primary Data
Primary data were obtained from field measurement, questionnaire survey
and laboratory test. A site visit was conducted in order to assess the real condition at
site. Water sample is taken before and after sediment basin and laboratory analysis
was conducted to analyze the water. Data and information which was categorized as
primary data in this study are:
� Suspended solids

29
� Turbidity
� Questionnaire Data
3.3 Secondary Data
Secondary data includes of rainfall distribution, previous records of water
quality and project planting phases and scheduling. Rainfall data used in this study
are collected from IZE consultant. For water quality analysis, a few parameter was
considered such as BOD, COD, pH, DO, AN, SS, heavy metal, etc. Detail
explanations on types of secondary data requirement are discussed in next sub topic.
3.4.1 Water Quality Parameter
Water quality data were obtained from I.Z Environmind Sdn. Bhd. (IZE). IZE
is environmental consultant which appointed to develop the Environmental
Management Plan (EMP) document as well as to conduct Environmental Monitoring
Exercise (EME) for the oil palm plantation project.
The data used in this study was obtained from previous EME recorded
starting from august 2005 to November 2006 for plantation 1 and from January 2006
until November 2006 for plantation 2. From that interval, 10 frequencies are gathered
for plantation 1 and 8 frequencies are gathered in plantation 2. Table 3.1 and 3.2
shows the date and the purpose for each sampling.
EME was carried out in order to fulfills Department of Environment (DOE)
requirements stipulated in the Preliminary Environment Impact Assessment (EIA)
Condition of Approval ref: AS (B)D 11/123/000/023 (18) for the oil palm plantation
project. It consist of a few environmental components such as water quality, noise
measurement, air quality, waste management, on-site assessment, etc. However, this

30
study only concern on water quality monitoring aspect which was conducted with
frequency of monthly and quarterly.
Table 3.1: Date on purpose sampling process for plantation 1
No Monitoring Date Purpose
1 28/08/05 EME No. 1
2 29/09/05 EME No. 2
3 19/10/05 EME No. 3
4 15/11/05 EME No. 4
5 24/12/05 EME No. 5
6 12/01/05 EME No. 6
7 14/02/06 EME No. 7
8 16/05/06 EME No. 8
9 21/08/06 EME No. 9
10 14/11/06 EME No. 10
Table 3.2: Date on purpose sampling process for plantation 2
No Monitoring Date Purpose
1 14/01/06 EME No. 1
2 15/02/06 EME No. 2
3 17/03/06 EME No. 3
4 25/04/06 EME No. 4
5 17/05/06 EME No. 5
6 26/06/06 EME No. 6
7 24/07/06 EME No. 7
8 10/10/06 EME No. 8

31
3.3.2 Rainfall Distribution Data
Rainfall data used in this study are also acquired from the IZ Environmind
Sdn. Bhd. It is based on the data collected at Cameron Highlands station. This station
is located at 04º 28' N and 101º 22' E and the data used are ranging from year 2001
until 2005. Appendix 3.1 and 3.2 shows the records of monthly rainfall amount and
records of number of raindays used in this study.
3.4 Method of Analysis
3.4.1 Trend analysis
Rainfall distribution data will be used to see the correlation with project
implementation scheduling. This is important especially to predict the erosion
phenomenon occur at the site area. Beside that, analyses on suspended solid trend for a
specific time frame are also analyzed. This analysis is based on suspended solid data at the
nearest river located at the downstream from sediment basin location.
3.4.2 Comparison with Standard Requirement
Water Quality result will be compared with existing standard produced by
Department of Environment (DOE). Two standards are used in this study and will be
using as a references are:
i) Water Quality Index (WQI) (see Appendix 3.3)
ii) Interim National Water Quality Standard for Malaysia (INWQSM)
(See Appendix 3.4)

32
3.4.3 Questionnaire Study
Another important part in this study is questionnaire. The main purpose is to
identify the level of environmental awareness from various levels of workers
including project developer, supervisor and general workers on development of oil
palm plantation. It surveys the experiences of all workers towards achieving
sustainable development on implementing oil palm plantation. All the information
given is classified as a secret and will be used for research purpose only. From this
survey, the understanding or prediction of human behavior or conditions related to
this issue can be made.
3.4.3.1 Survey Question
The body of the questionnaire consists of several parts. There are six parts in
this questionnaire. Details of the sections and their topic are shown in table 3.3. Full
version of questionnaire used for this study can be referring in Appendix 3.5.
Table 3.3: Topic in the questionnaire
Part Topic
A Understanding
B Land Management
C Water management practice
D Farm development aspect
E Design criteria
F Maintenance aspect
Part A more towards general understanding on environment issue. The
question in this part is very simple, quick and easy to answer. It is based on general
attitude towards environment. Moving to part B, it focuses more on land
management aspect. Respondents are needed to give feedback based on their
33
knowledge on managing the land including crop, fertilizer, soil, sediment basin and
silt trap management.
The next part (part C) requires respondent to answer questions related to
water management. In this part, concern are given more on water issues such as
water shortage, importance of water tested, waterway development, etc. Part D
address issues about farm development. This part consists of a few issues such as
terracing, erosion, landslide, etc. while part E and F consists of the questions related
to sediment basin and silt trap implementation. Part E will focus on sediment basin
design criteria and part F finally covers more on maintenance aspect.
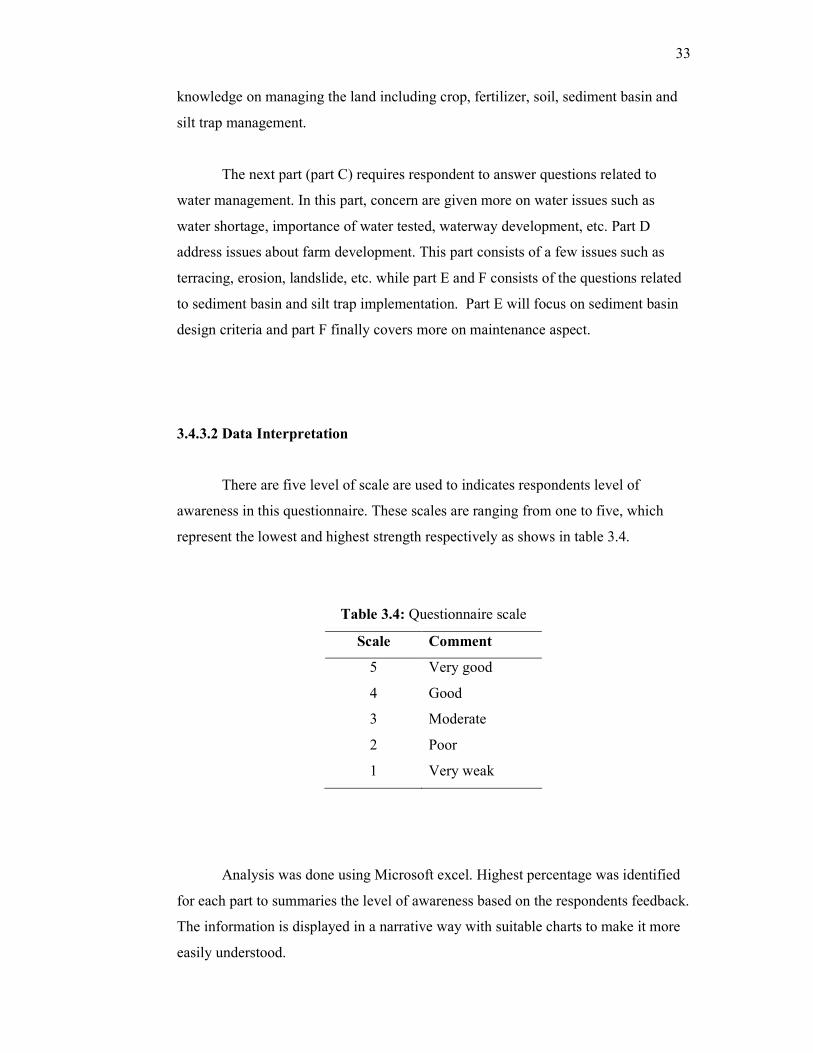
3.4.3.2 Data Interpretation
There are five level of scale are used to indicates respondents level of
awareness in this questionnaire. These scales are ranging from one to five, which
represent the lowest and highest strength respectively as shows in table 3.4.
Table 3.4: Questionnaire scale
Scale Comment
5 Very good
4 Good
3 Moderate
2 Poor
1 Very weak
Analysis was done using Microsoft excel. Highest percentage was identified
for each part to summaries the level of awareness based on the respondents feedback.
The information is displayed in a narrative way with suitable charts to make it more
easily understood.

CHAPTER IV
STUDY AREA
1.1 Introduction
Gua Musang is a town and territory in Kelantan, Malaysia. It is the largest
district in Kelantan and administered by the Gua Musang District Council. As shown
in figure 4.1 below, Gua Musang district is bordered by the state of Pahang to the
south, Terengganu to the east, Perak to the west and the Kelantanese districts of
Kuala Krai and Jeli to the north. The total area and population of Gua Musang
district is about 8,177 km² and 80,167.
Gua Musang is located near a few numbers of places of interest in Malaysia
such as Taman Negara, Buddhist Temple, Sg. Nenggiri etc. Beside that, Gua Musang
is surrounded by limestone hills and caves, which have become popular with cavers
and rock climbers. Therefore, it is important to ensure the surrounding environment
is well protected and in safe condition.
Environmental degradation should be avoided in order to sustain our
environment in term of balancing a growing economy, protection for the
environment, and social responsibility. In other words, it is important to protect the
natural systems of the planet and providing a high quality of life for peoples.

35
Figure 4.1: Location of Gua Musang
As shows in table 4.1, Gua Musang is the largest cultivated area in Kelantan
state. It rich with a few types of plantation such as oil palm, rubber, coconut, paddy,
fruits etc. Figure 4.2 shows the percentage for each types of plantation area. It shows
that the major cultivated area is oil palm plantation and this district was become the
major producer of oil palm plantation in Kelantan with the total area of 51,191
hectares as shows in table 4.1.

36
Coconut
0.15%
Oil Palm
61.02%
Rubber
28.97%
Other Industrial Crop
0.40%
Vegetable
0.31%
Fruits
9.00%
Others Food Crops
0.15%
Table 4.1: Cultivated area by district in Kelantan
District Total Area (ha) Total Oil Palm Cultivated Area (ha)
Bachok 14 971 43
Gua Musang 73 662 55 191
Jeli 11 400 3 441
Kota Bharu 32 443 12
Kuala krai 44 427 6 396
Machang 30 677 1 338
Pasir Mas 49 692 1 463
Pasir Puteh 24 905 481
Tanah merah 40 658 11 094
Tumpat 12 825 0
Total 335 660 79 459
..
Figure 4.2: Total percentage for each types of plantation area at Gua Musang

37
1.2 Project Site Background
This study focus on two site of oil palm plantation area owned by two developers
as list below:
iii. Plantation 1; Oil palm plantation at PT 4957 & 4958, Mukim Ulu Nenggiri,
Daerah Bertam, Gua Musang, Kelantan Darul Naim which initiated by
Kapasiti Harapan Sdn. Bhd. (KHSB), and
iv. Plantation 2; Oil palm plantation at PT 5011, Mukim Ulu Nenggiri, Daerah
Bertam, Gua Musang, Kelantan Darul Naim which initiated by Peransang
Venture Sdn. Bhd. (PVSB).
Both sites are located nearby with each others and located adjacent to the
north, south and east of Hutan Rizab Sungai Betis and west of Hutan Rizab Sungai
Papan. Figure 4.3 shows the location plan for both project sites. The project sites are
located within an area embarked by the Kelantan’s State Economic Planning Unit
(UPEN) for agriculture activities. It is part of the state government plan for
establishment of contiguous various type of plantation area throughout the state.
Beside that, Orang Asli community settlement also found scattered nearest
project sites area especially in Pos Belau and Kuala Betis area. Both locations as
shown in figure 4.3 are situated at the south and north west of project sites. These
project sites can be access from the existing Pos Belau-Kuala Betis logging track via
Simpang pulai-Lojing-Gua Musang-Kuala Berang new highway.

38
Sources: Jabatan Ukur dan Pemetaan (JUPEM)
Figure 4.3: The location plan for both project sites
Project Site I
Project Site II

39
1.3 Existing Physical Environment
1.3.1 Surrounding Land Use
Mostly, ex-logging trees is found as a dominant land use within 2 km around
surrounding both area which belongs to the state Government of Kelantan, Hutan
Rizab Sungai Betis at the north side and Hutan Rizab Batu Papan at the east side. It
was also noted that there is a teak forest plantation area developed at the south of
project site boundary for plantation 1 site and at the east of project site boundary for
plantation 2 sites. Beside that, other oil palm plantation owned by others developers
also found scattered around project sites. Most parts, hilly areas are a dominant
feature in this area.
For plantation 1 project site, Sg. Sungkai, Sg. Kengatong and Sg. Berok are
the major river found scattered at the north, east and west side. However, for
plantation 2 site area Sg. Sungkai, Sg. Kemantoh and Sg Berok are found located at
the northeast and east part. A partial of Banjaran Gunung Ayam which is the highest
mountain in this area found located at the west side of plantation 1 project site and at
the northwest part for plantation 2 project sites. Other than that, Simpang Pulai-
Lojing-Gua Musang-Kuala Berang new highway is also included in 2-3 km radius
from the project sites. There is no major and minor Orang Asli settlement is found
located.
1.3.2 Topography
Both project areas are generally hilly in terrain, flat at a certain portion of the
area and covered mostly by the low commercial value of trees. The main river found
runs nearest both project sites is Sg. Berok. It’s located at the east of the project sites.
Figure 4.4 and 4.5 shows the topography map for each project site. Others
characteristics for each site are summaries in table 4.2 below.

40
Figure 4.4: Topography map of plantation 1 project site
Figure 4.5: Topography map of plantation 2 project site

41
Table 4.2: Characteristic for each project site
Characteristic Plantation 1 Plantation 2
Total area 3,000.00 acre
(1,214.06 hectares)
2,000.00 acre
(809.39 hectares)
Latitude 4˚ 47΄ 11˝ N to 4˚ 51΄ 03˝ N 4˚ 45΄ 05˝ N to 4˚ 48΄ 35˝ N
Longitude 101˚ 44΄ 36˝ E to 101˚ 46΄ 39˝ E 101˚ 43΄ 25˝ E to 101˚ 45΄ 44˝ E
Altitude Range 50m to 200m 200m to 400m
Rivulets and
River
� Sg. Sungkai
� Sg Kemantoh
� Sg. Kengatong
� Sg. Wah
� Sg. Pelatok
� Sg. Sungkai
� Sg. Kemantoh
� Sg. Kengatong
1.4 Meteorology Characteristic
1.4.1 Average Rainfall
District of Gua Musang receives a good amount of rainfall. This phenomenon
is influence by the location where it’s located along the east coast of Peninsular
Malaysia. Rainfall data recorded at Cameron Highland was used in this study. As
shown in Appendix A and B, the annual mean of rainfall is about 2 743.82 mm with
mean raindays of 19 days per month. Figure 4.6 below shows the trend of rainfall
intensity for District of Gua Musang. It shows that the monthly rainfalls
approximately fluctuate along the whole year.
Rainfall amount is began rise highly during September till the end of the year.
In the months of September to December, the amount of rainfall and the
corresponding number of rainy days is high, particularly, during the Northeast
Monsoon. During the Southeast Monsoon, the rainfall is relatively low, as the wind
does not carry much moisture across the mainland (PEIA at Gua Musang, 2002).

42
Records of Monthly Rainfall Amount at Cameron Highlands Rainfall Station
0
100
200
300
400
500
600
Ja
n
Ma
c
Ma
y
Ju
l
Se
p
No
v
Ja
n
Ma
c
Ma
y
Ju
l
Se
p
No
v
Ja
n
Ma
c
Ma
y
Ju
l
Se
p
No
v
Ja
n
Ma
c
Ma
y
Ju
l
Se
p
No
v
Ja
n.
Ma
c
Ma
y
Ju
l
Se
p
No
v
Months
Rainfall Amount (mm)
Figure 4.6: Trend of rainfall distribution at Cameron Highlands rainfall station
2001 2002 2003 2004 2005

43
1.5 Existing Drainage Pattern
Both project sites consist of several numbers of small rivulets which scattered
within the project site boundary. These small rivulets are considered a seasonal earth
drain that would only drain water during the heavy rainstorms period. For both
project sites, the seasonal small rivulet flows in both directions (east and southeast)
and joins the Sg. Sungkai, Sg. Kemantoh, Sg. Kengatong, Sg. Wah, Sg. Pelatok etc.
and eventually flows into Sg. Berok.
Sg. Berok is considered a main river and flow from south west to the
northeast of plantation 1 side area and flow towards the northeast side area for
plantation two. It was estimated that 100% water flow within both project sites area
would be catered by Sg. Berok.
4.6 Existing Sediment Basin & Silt Trap
Sediment basins are man-made depressions in the ground where runoff water
is collected and stored to allow suspended solids to settle out. During field
observation on site, there are two sediment basin labeled as SB1 and SB2 found
located in plantation 1 and only one which is labeled as SB3 is located in plantation
2. All sediment basins are in rectangular shape as illustrate in figure 4.7 below.
However, there is no silt trap structure is found build up in both study area.
Characteristic each of sediment basins is shown in table 4.3.
Based on the information gathered from plantation 1 developer, SB1 was
operating almost two years. The catchments area for this sediment basin is 42.40 ha.
It was build with proper design. The inlet and outlet diameter is about 0.5 meter and
it was located at the downstream area. The water from this sediment basin was
discharge to nearest river known as Sg. Wah.

44
Figure 4.7: Sediment basin cross section
Table 4.3: Characteristic for each sediment basin located in both study areas
Sediment
Basin
Length
(m)
Width
(m)
Depth
(ft)
SB1
4.0
3.5
5
Plantation 1
SB2
3.5
2.0
5
Plantation 2
SB3
50
50
8
While for SB2, the catchments area for this sediment basin is 31.50 ha and
the water will be discharge to Sg. Sungkai. This sediment basin is situated nearest
accessible track located at the downstream area. However, during site observation
SB2 is still in construction phase and not operate well yet. Around the sediment
basin, soil is still under improper management and this phenomenon is temporarily
affecting the efficiency of this sediment basin.
Length
Width
Inlet
Outlet
45
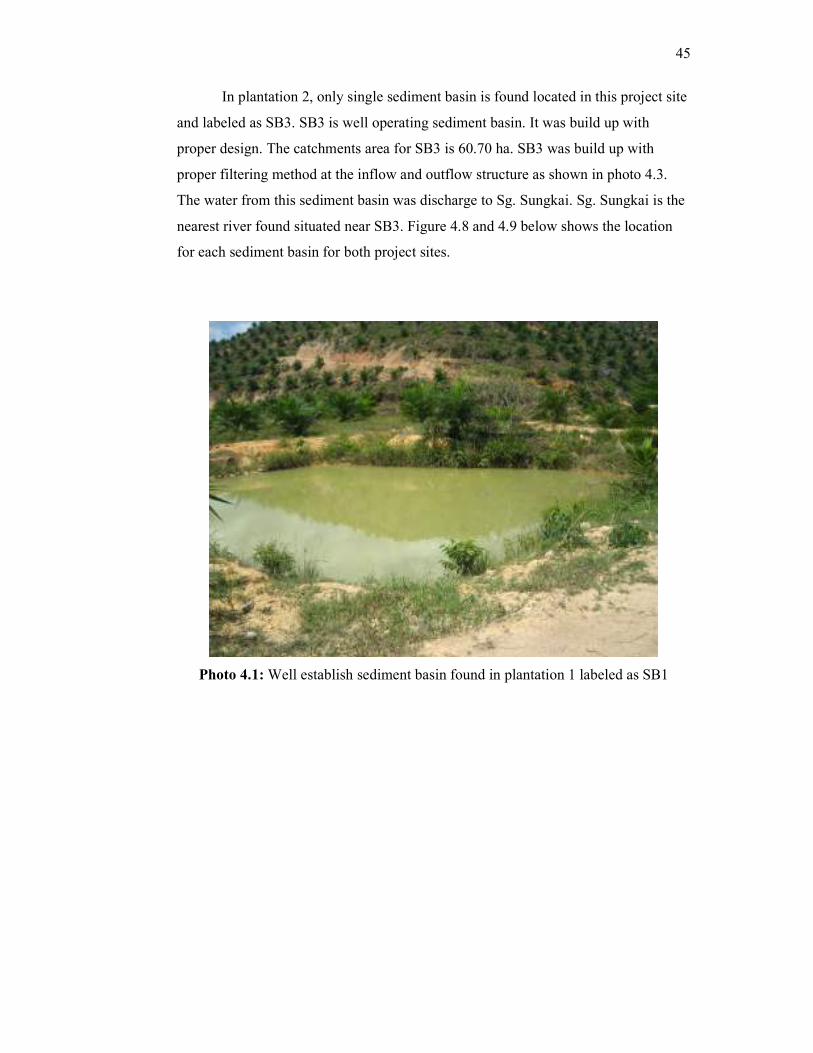
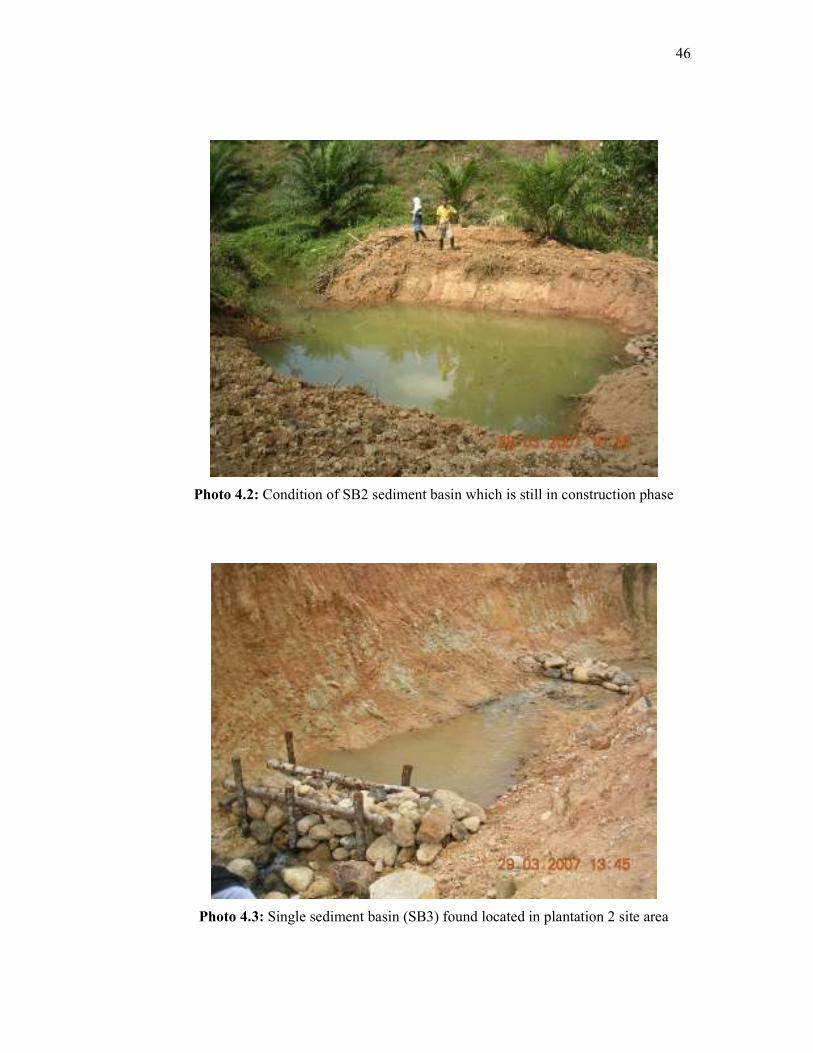
In plantation 2, only single sediment basin is found located in this project site
and labeled as SB3. SB3 is well operating sediment basin. It was build up with
proper design. The catchments area for SB3 is 60.70 ha. SB3 was build up with
proper filtering method at the inflow and outflow structure as shown in photo 4.3.
The water from this sediment basin was discharge to Sg. Sungkai. Sg. Sungkai is the
nearest river found situated near SB3. Figure 4.8 and 4.9 below shows the location
for each sediment basin for both project sites.
Photo 4.1: Well establish sediment basin found in plantation 1 labeled as SB1
46
Photo 4.2: Condition of SB2 sediment basin which is still in construction phase
Photo 4.3: Single sediment basin (SB3) found located in plantation 2 site area

47
S. Pelatok
S. B
ero
k
S. Akoh
baiS. Gam
101 45' E
S. Keman toh
S. Keng atong
ngaBela
S.
S. Sungkai
S. Jenut
S. Wah
Kg. Sungkai
S. Ib
oh
SUNGAI BETIS
HUTAN RIZAB
S. T
erla
101 45' E
04 50' 0
N04 50' 0
N
o
o
BATU PAPAN
HUTAN RIZAB
LEGEND:
Ex-logging Tracks
Existing River & Small Rivulets
Buffer Zone Area
Source: Digitize From Topo Map Sheet 63, Directorate of National Mapping, Malaysia, 1994
S. B
ero
k
Mus
ang
Hig
hway
S. Wah
Sim
pan
g P
ulai
-Loj
ing-
Gua
Interceptor Drain Area
N
0
04 48' N
004 48'
0.5km
N
Sediment Basin Type A
Sediment Basin Type B
0
B5
B4
B9B15
B14B12B8B3
B2 B7 B11 B13
B10B6B1
B17
B10
B18
B16
B8
B7 B9
B10A
B6
B5
B4
B3
B2
B1
Sediment Basin Type D
Sediment Basin Type C
Silt Trap Type B
Silt Trap Type A
Silt Trap Type CST C
ST A
ST B
SB C
SB D
SB B
SB A
SBD
SBC
STC
STD
STC
STD
SBD
SBC
STASTC
SBE
SBD
SBD
STB
STBSTD
ST D Silt Trap Type D
Figure 4.8: Location of SB1 and SB2 in plantation 1 site area
SB1
SB2

48
Figure 4.9: Location of SB3 in plantation 2 site area
S. K
engatong
S . S u n g k a i
S . S u n g ka i
S . Jenut
S . 'A '
S . 'B '
S o u rc e : D ig it iz e F ro m T o p o M a p S h e e t 6 3 , D ire c to ra te o f N a tio n a l M a p p in g , M a la y s ia 1 9 9 4
R iv e rs
E x is tin g lo g g in g tra c k
L E G E N D :
B 7B 6
B 1
B 2
B 3
B 4
B 5
B 8
B 1 0B 9
S . K e m a n to h
P ro p o s e d s ite o ffic e ,
B u ffe r z o n e
w o rk e r q u a rte rs &n u rs e ry
B lo c k b o u n d a ry
S e d im e n t B a s in T y p e A ,B ,C ,
S B E
D iv e rs io n C h a n n e l/E a rth D ra in
S B D
S T B S T B
S B E
S T B
S B BS T B
S B D
S T B
S T A
S B B
S T B
S B D
S B E
S ilt T ra p T p e A ,B ,C ,D ,E o r F
D ,E o r F
SB3

CHAPTER V
RESULT AND DISCUSSION
5.1 Introduction
In order to evaluate the effectiveness of sediment basin, a few factors such as
its design, size, location, etc. were taken into consideration. Various analysis was
used so that it will help to enhance the accuracy of final result. Begin with analyzing
the sediment basin itself either from the design aspect, location, it efficiency in
removal pollutant etc, next consideration is on surrounding environment condition.
River water quality which is located nearest sediment basin, for example, can figure
out the effectiveness of existing sediment basin build up at that area.
Erosion rate is another analysis that can reflect the effectiveness of sediment
basin structure. Comparison is done with others method of analyzing such as by
using USLE and MSLE method in order to check the efficiency.
Beside technical aspect, consideration was also given in management aspect
and farming practice among developers and planters. The level of environmental
awareness on this issue was analyzed. This aspect is very important because good
management will produced better environment condition on plantation area.

50
5.2 Sediment Basin and Silt Trap Analysis
Analysis was done by analyzing mainly on suspended solid and turbidity.
Analysis of solids content in water can be use as an indicator in determining
treatment efficiency as well as determining compliance with various regulatory
agencies. However, for a better result this analysis was supported by others water
quality parameter analysis such as turbidity, dissolved oxygen, BOD, pH etc.
To test the effectiveness of these sediment basins, collection a number of
water quality samples was done on 28 March 2007 and 29 March 2007. The aim is to
analyze water quality before it flow into the sediment basin (inflow) and after the
water is discharge from sediment basin (outflow).
5.2.1 Total Suspended Solids (TSS)
Table 5.1 below shows the result obtained from laboratory analysis on
suspended solid on each water sample taken during site observation.
Table 5.1: Suspended solid result
Suspended Solid (mg/L) Sediment Basin
Inflow Outflow
SB1 5.0 1.0
SB2 8.0 5.0
SB3 50.0 14.0
Total suspended solid result showed that the entire sediment basins are likely
to function well when the amount of suspended solid (SS) at the outflow was lower
than inflow. All samples range between 1.0 to 50 mg/L where these amounts indicate
that the water is in good condition. Based on Interim National Quality Standard for
Malaysia (INWQSM), these values are within Class I and II (Appendix 3.4).

51
5.2.2 Turbidity
Measurement of turbidity is a key test of water quality. Table 5.2 below
summaries the result for each water samples. SB1 and SB2 are not giving a satisfied
result compared to SB3. This may be influence by the method used during laboratory
analysis.
Fluids can contain suspended solid matter consisting of particles of many
different sizes. While some suspended material will be large enough and heavy
enough to settle rapidly to the bottom container if a liquid sample is left to stand (the
settleable solids), very small particles will settle only very slowly or not at all if the
sample is regularly agitated or the particles are colloidal. These small solid particles
cause the liquid to appear turbid.
Table 5.2: Turbidity result
Turbidity (NTU) Sediment Basin
Inflow Outflow
SB1 4.7 5.8
SB2 9.5 13.3
SB3 79.0 42.0
5.2.3 Other Water Quality Parameters
Water quality is the physical, chemical and biological characteristics of
water. The primary bases for such characterization are parameters which relate to
drinking water, safety of human contact and for health of ecosystems. General
perception of water quality is that of a simple property that tells whether water is
polluted or not. Assessment on other water quality parameter of water bodies inflow
and outflow sediment basin structures was made as list in table 5.3.

52
Table 5.3: Water quality result for each of sediment basins found in the study area
Plantation1 Plantation 2 Sediment Basin
SB1 SB2 SB3 Parameter
Before After Before After Before After Temperature 36.10 36.65 36.87 36.57 33.20 33.10 pH 7.62 7.67 7.50 7.73 7.70 7.70 DO 5.20 7.20 5.07 4.87 6.55 6.50 BOD5 0.94 1.28 1.86 1.07 0.71 0.75 Sulfide 0.00 0.01 0.01 0.03 0.14 0.08 Nitrate 0.02 0.01 0.10 0.07 0.01 0.02 Phosphorus 0.08 0.06 0.11 0.13 0.06 0.11 A-Nitrogen 0.07 0.17 0.05 0.06 1.00 0.69 TDS 76.00 79.50 54.00 55.00 338.00 356.00 Conductivity 153.00 159.50 108.67 111.00 622.00 630.00
At all sampling stations, dissolve oxygen (DO) readings measured are in
range of 4.87 to 7.20 mg/L which roughly indicates that the water is in moderate
condition. For a good water quality, adequate dissolved oxygen is needed and
necessary. Fish growth and activity usually require 5 to 6 mg/L of dissolved oxygen.
As DO level in water dropped below than 5mg/L, aquatic life is put under stress.
Thus, it is important for the DO in water maintained above 5 mg/L to sustain the
aquatic life. SB2 gave low DO at the outflow due to non complete construction yet.
BOD5 measured were in range of 0.71 to 7.86 mg/L. Based on National
Water Quality Standard for Malaysia (NWQSM), this value of BOD recorded fall
within Class I and III and would indicate that the water is in good condition and the
level of organic pollutant to be in low level.
pH is a measure of the acidity or alkalinity of a solution. Solutions with a pH
less than seven are considered acidic, while those with a pH greater than seven are
considered basic (alkaline). The pH readings of all sampling water recorded in range
of 7.73 to 7.70 which fall under Class I based on the NWQSM.
Nutrient group can provide food for plants and microorganisms. Too little is
not good and too much can kill a system by causing algal blooms that use a large
amount of the oxygen in the water suffocating the fish population. Ammoniacal

53
nitrogen (AN) level for all water samples were low between range of 0.05 to1.00
mg/L whilst phosphorus, nitrate and sulfide are in range of 0.06 to 0.13 mg/L, 0.01 to
0.10 mg/L and 0 to 0.14 mg/L. The major sources of nutrient may come from the
logging activities as well as other oil palm plantation area occurred at the
surrounding study area.
5.2.4 Sediment Elimination Efficiency
Sediment basin efficiency can be analyzed after solid content at inflow and
outflow was obtained. The percentage of efficiency was obtained by using equation
5.1 below:
E (%) =│ 1- (Co ⁄ Ci) │ x 100 …(Eq. 5.1)
i) For SB1,
E (%) =│ 1- (1.0 ⁄ 5.0) │ x 100
= 80%
ii) For SB2,
E (%) =│ 1- (5.0 ⁄ 8.0) │ x 100
= 37.5%
iii) For SB3,
E (%) =│ 1- (14.0 ⁄ 50.0) │ x 100
= 72%
Based on above results, the sediment elimination efficiency gave low
percentage compared to the percentage which stated by Department of Environment
(DoE). DoE was state that the sediment basin must at least have 85% of sediment
54
elimination efficiency. This happen when it found that all sediment basins did not
have any suitable filter or proper detention either at inflow or outflow channels.
However, SB1 gave a better percentage compared to SB2 and SB3. Even this
sediment basin did not have any filter, SB1 was build up with a good condition.
For SB2, the percentage is the lowest compared to SB1 and SB3. This is
influence by a few factors. The main factor is this structure is still in construction
phase during field observation is done. Therefore, a lot of soil around the area is still
didn’t manage well yet. Eroded soil is high especially during heavy rain.
Steep bank is one of the factor influence the sediment elimination efficiency
for SB3. This condition will cause high particles wash away into the sediment basin
and it become worst when it disturbed downstream area. To get best result of
sediment elimination efficiency, water velocity should be reduced. It will give the
particles more time to settle and water discharge will have better quality.
5.2.5 Sediment Basin Design Efficiency
Based on California Stormwater BMP Handbook, Sediment basins are
designed practically effective in removing sediment down to about the medium silt
size fraction. Sediment-laden runoff with smaller size fractions such as fine silt and
clay may not be adequately treated unless chemical treatment is used in addition to
the sediment basin. In this study, comparison between existing sediment basin and
specification produced by MASMA was done for the purpose of definitive sediment
basin efficiency.
5.2.5.1 Sizing of Sediment Basin
The effective design and operation of sediment basins depends primarily on
the natural of the soil materials likely to be eroded and washed into the basin

55
(MASMA, 2000). Appendix 5.1 lists the three different soil types which apply to
sediment basin design and operation for each soil type. This approach is based in part
on recommendations from the NSW Department of Housing (1998). In this study,
the entire sediment basin in the study area can be classified as a dry sediment basin
types. This is based on the types of soil where the surrounding soil is coarse-grained
sand and sandy loam. The sizing guidelines for dry sediment basins for normal
situations produced by MASMA are given in table 5.4 below.
Table 5.4: Dry sediment basin sizing guidelines
Time of Concentration of Basin Catchment
(minutes) Parameter Design
Storm 10 20 30 45 60
3 month ARI 333 250 200 158 121 Surface Area
(m2/ha) 6 month ARI n/a 500 400 300 250
3 month ARI 400 300 240 190 145 Total Volume
(m3/ha) 6 month ARI n/a 600 480 360 300
Sediment basin is design for 3 month ARI design storm event with 30
minutes time of concentration. Based on MASMA guideline, the required surface
area and total volume for the whole sediment basin catchments area are list in table
5.5 below.
� The required surface area per hectare = 200 m2/ha
� The required total volume per hectare = 240 m3/ha

56
Table 5.5: Sediment basin size required based on MASMA guideline
Surface area required on site
(m2)
Total volume required on site
(m3)
SB1 = 200 m2/ha x 42.40 ha
= 8 480 m2
= 240 m3/ha x 42.40 ha
= 10 176 m3 Plantation 1
SB2 = 200 m2/ha x 31.50 ha
= 6 300 m2
= 240 m3/ha x 31.50 ha
= 7 560 m3
Plantation 2
SB3 = 200 m2/ha x 60.70 ha
= 12 140 m2
= 240 m3/ha x 60.70 ha
= 14 568 m3
5.2.5.2 Settling Zone
Sedimentation occurs in the settling zone. This value is assumed as half from
the total volume obtained from table 5.5 above. Settling zone depth is assumed as 0.6
m (MASMA, 2000). Table 5.6 below summaries the required settling zone and
others sediment basin characteristic measured during site observation.
Table 5.6: Characteristic for each sediment basins
Plantation 1 Plantation 2
SB1 SB2 SB3
Settling zone, V (m3) 5088 3780 7284
Zone Depth, Y (m2) 0.6 0.6 0.6
Average width, W (m) 3.5 2.0 50
Average Length, L (m) 4.0 3.5 50
� Settling zone dimension checking

57
MASMA was enactive that the basin length (L) to width (W) ratio should be
greater than 2:1. If not, baffles should be provided to prevent short-circuiting. Beside
that, the basin length (L) to settling depth (Y) ratio should be less than 200:1.
i) For SB1
� L / Y ratio = 4.0 / 0.6 = 6.67 < 200 Ok
� L / W ratio = 4.0 / 3.5 = 1.14 < 2 Not Ok
� Average surface area = 4.0 x 3.5
= 14 m2 < 8 480 m2 Not Ok
ii) For SB2
� L / Y ratio = 3.5 / 0.6 = 5.83 < 200 Ok
� L / W ratio = 3.5 / 2.0 = 1.75 < 2 Not Ok
� Average surface area = 3.5 x 2.0
= 7 m2 < 6 300 m2 Not Ok
iii) For SB3
� L / Y ratio = 50 / 0.6 = 83.33 < 200 Ok
� L / W ratio = 50 / 50 = 1.00 < 2 Not Ok
� Average surface area = 50.0 x 50.0
= 2 500 m2 < 12 140 m2 Not Ok
5.3 Erosion Risk Analysis
The risk of erosion to agricultural land is one of the serious and long term
problems. In order to determine the total hectarage of oil palm plantation at risk from

58
soil erosion and their location, the highly cropped areas at risk to soil erosion by
water were identified.
5.3.1 Total Sediment Loading Estimation
The suspended sediment load carried by water is highly variable in space and
time (Laguionie et al., 2006). Sediment loading from agricultural areas is a major
cause of stream impairment. The combined influence of watershed physiographic,
landuse, and climatic factors determine rates of sediment loading (Thomas et. al.,
2005).
5.3.1.1 Flowrate
Flowrate is needed in order to estimate the sediment loading. Because of the
location for each sediment basin is located near river stream, the flowrate amount
used is based on the flowrate relate to the river. SB1 is located nearest Sg. Wah and
the average flowrate is 0.129 m3/s. While SB2 and SB3 are located nearest Sg.
Sungkai and the average flowrate is 0.132 m3/s.
5.3.1.2 Sediment Loading Estimation
i) For SB1
� Inflow
Sediment loading = 5.0 mg/L x 0.129 m3/s x 1000L/m3
= 645 mg/s
= 6.45 x 10⁻⁷ ton/s

59
� Outflow
Sediment loading = 1.0 mg/L x 0.129 m3/s x 1000L/m3
= 129 mg/s
= 1.29 x 10⁻⁷ ton/s
ii) For SB2
� Inflow
Sediment loading = 8.0 mg/L x 0.132 m3/s x 1000L/m3
= 1 056 mg/s
= 1.06 x 10⁻⁶ ton/s
� Outflow
Sediment loading = 5.0 mg/L x 0.132 m3/s x 1000L/m3
= 660 mg/s
= 6.60 x 10⁻⁷ ton/s
iii) For SB3
� Inflow
Sediment loading = 50.0 mg/L x 0.132 m3/s x 1000L/m3
= 6 600 mg/s
= 6.60 x 10⁻⁶ ton/s
� Outflow
Sediment loading = 14.0 mg/L x 0.132 m3/s x 1000L/m3
= 1 848 mg/s
= 1.85 x 10⁻⁶ ton/s
Table 5.7: Sediment loading estimation per hectare per year
SB1 SB2 SB3
Inflow Outflow Inflow Outflow Inflow Outflow
Sediment quantity, 10-6 (ton/s) 0.64 0.13 1.06 6.60 6.60 1.85
Catchment area (ha) 42.40 42.40 31.50 31.50 60.70 60.70
Total sediment load (ton/ha.yr) 0.48 0.10 1.06 0.66 3.44 0.96

60
5.3.2 Assessment of Factors Influencing Soil Erosion and Sedimentation
5.3.2.1 Rainfall Factor (R)
The rainfall factor (R) is a measure of the erosive energy of the rainfall. It is
express in units of cumulative value of storm rainfall intensity index (EI), for a fixed
period of time (MASMA, 2000). The factor E is the total energy for a rainfall and I30
is the rainfall’s maximum 30-minute intensity (VT Soil Erosion, 2004). Rainfall
factor can be defined as equation 5.2 below. Annual rainfall (P) for this study area is
2 744 mm. While the maximum I30 is 30 mm/hr.
R = (E . I30) / 170.2 …(Eq. 5.2)
Where,
E = 9.28 P – 8 838.15 …(Eq. 5.3)
= 9.28 (2 744) – 8 838.15
= 16 626 J/m2
Therefore,
R = (16 626 x 30) / 170.2
= 2 930 ton.m/ha.hr
5.3.2.2 Soil Erodibility (K)
The soil erodibility (K) is the rate of soil loss per unit of rainfall erosivity
factor for a specified soil. It is based on five soil parameters. There are percent silt,
percent sand, organic matter content (OM), soil structure (S) and permeability (P) of
the soil profile. K can be defined by using equation 5.4 below.
K = 2.1 x 10⁻⁶ (12 – OM) M1.14 + 0.0325 (S – 2) + 0.025 (P – 3) …(Eq. 5.4)
Where,

61
M = (% Silt + % Sand) (100 - % Clay) …(Eq. 5.5)
5.3.2.3 Length-Slope Factor (LS)
The length steepness factor (LS) is a combination between the effects of
slope and length of eroding surface. It is the ratio of soil loss per unit area from a
slope land to that from a standardized measured plot (MASMA, 2000). Wischmeier
(1975) was defined LS as state in equation 5.6 below. Slope length was measured
from the highest point to the centre or sediment basin. Percent of slope (S) is
obtained from diversification between highest and lowest point and divided with
slope length. The exponent m is based on percent of slope on site as shown in table
5.8.
LS = (λ / 22.13)m (0.065 + 0.046S + 0.0065S2) …(Eq. 5.6)
Table 5.8: Exponent m based on slope percent
m value Percent of slope (%)
0.2 S < 1
0.3 1 < S < 3
0.4 3 < S < 5
0.5 5 < S < 12
0.6 S > 12
5.3.2.4 Cover Management Factor (C)
The Cover Management factor, C is a ratio, which compares the soil loss
from an area with specified cover and management to that from a field under a
standard cultivated continuous fallow. It also depends upon a period of time within
62
which weather effects would have varying influences (VT Soil Erosion, 2004). In
this study, C is taken as 0.33 for SB1 and SB2 area and 1.00 for SB3 area.
5.3.2.5 Conservation Practice Factor (P)
The Conservation Practice Factor, P is the ratio of soil loss for a given
practice to that where there is no conservation practice with farming up and down the
slope. It can be expressed as a ratio of the soil loss with practices, such as contouring,
strip cropping or terracing (VT Soil Erosion, 2004). The value of P factor for this
study is list in table 5.9.
5.3.2.6 Management Factor (VM)
The vegetation management factor (VM) is defined as the ratio of soil loss
from a field subject to a system of control measures to that from the same site
without any control provision. It combines two factors C and P used n original USLE
(MASMA, 2000). Vegetation management can be determining by using equation 5.7.
The fraction of impervious area (IA) is assumed as 0.05 while the factor C is depends
on the effect of various control practices.
VM = C. (1 - IA) …(Eq. 5.7)
5.3.3 Assessment of Soil Erosion Rates using USLE Methods
The soil erosion rate calculation using USLE method is shown in table 5.9. It
was calculated based on each sediment basin catchments area. The purpose is to
compare the soil loss amount by using model and existing condition on site. The soil
erosion rates is obtained by multiplying together the factors of Rainfall Erosivity, R,

63
Soil Erodibility, K, Slope Length and Steepness, LS, Cover Management factor, C
and Conservation Practice Factor, P as explained in equation 5.8.
E = R. K. LS. C. P …(Eq. 5.8)
Table 5.9: Erosion analysis using USLE method
Sediment
Basin
Area
(ha)
Average
Slope
R K LS C P E
(ton/ha.yr)
SB1 42.40 10.5 2930.58 0.10 0.11 0.33 0.45 4.79
SB2 31.50 16.0 2930.58 0.10 0.16 0.33 0.52 8.05
SB3 60.70 16.0 2930.58 0.10 0.16 1.00 0.35 16.41
5.3.4 Assessment of Soil Erosion Rates using MSLE Methods
Same with USLE method, soil erosion rate calculation using MSLE method
was calculated based on each sediment basin catchments area. The difference is on
vegetation management factor (VM) where this factor is combination two factors C
and P used in the original USLE. MSLE is written as equation 5.9 below and table
5.10 summaries the MSLE calculation for study area.
qc = R. K. LS.VM …(Eq. 5.9)
Table 5.10: Erosion analysis using MSLE method
Sediment Basin Area
(ha)
Average
Slope
R K LS VM E
(ton/ha.yr)
SB1 42.40 10.5 2930.58 0.10 0.11 .0.31 9.99
SB2 31.50 16.0 2930.58 0.10 0.16 0.31 14.54
SB3 60.70 16.0 2930.58 0.10 0.16 0.31 14.54

64
The classification of soil erosion risk for this study area was based on the
classification provided by the Department of Agricultural as shown in table 5.11.
Comparison was done between USLE and MSLE method. Based on table 5.11, the
soil erosion rate produced by both methods can be classified as average risk.
However, the amount produced by MSLE is too large compared to USLE and when
comparison is done with actual sediment loading on side, the amount is still low than
amount produced from USLE. Therefore, USLE is more practical to implement in
plantation area.
MSLE used vegetation management (VM) factor instead of cover
management (C) and conservation practice (P) factor. The VM factor takes into
account the interaction between vegetation cover and soil surface conditions into a
single factor. It is difference with USLE method where C and P factor is considered
in separate factor.
Observed or measured sediment yield values are often useful as comparison
whether the values obtained from modeling are reasonable or not. This is especially
crucial when using empirical model such as USLE that doesn’t require local
calibration and validation during the modeling process (Zulkifli and Toshionori,
2003).
Table 5.11: Classification for soil erosion risk
Soil Erosion Rates
(ton/ha.yr)
Classification
(Risk)
0 – 10 Low
10 – 50 Average
50 – 100 Above Average
100 – 150 High
> 150 Very High

65
5.4 Water Quality Analysis
5.4.1 River Classification based on WQI
The river classification was determined by using Department of Environment
Water Quality Index (DOE WQI). All sampling station is located at downstream area
from sediment basin location. The water flow to the rivers also influenced by water
discharge from the sediment basin.
Therefore, the purpose to analyze these water qualities is to see the
effectiveness of sediment basin build up at upstream area and helping in determining
the final finding. Table 5.12 summaries WQI results based on DOE WQI. The data
obtained is based on the latest water quality monitoring done in both study area.
Table 5.12: Water quality index (WQI) results for Sg. Wah and Sg. Sungkai
Plantation 1 Plantation 2
Sampling Stations
Sg. Wah Sg. Sungkai Ss. Sungkai Parameter
W1 W2 W3
pH 7.79 8.02 7.69
BOD5 1.13 1.96 0.18
COD 23.00 13.00 1.00
DO 7.10 7.20 5.90
SS 60.00 44.00 7.00
AN 0.82 0.76 0.17
SIpH 93.76 90.71 94.88
SIBOD5 95.52 91.93 99.62
SICOD 70.86 81.81 97.77
SIDO 98.19 98.90 84.45
SISS 70.99 76.81 93.69
SIAN 64.66 67.01 99.67
WQI 83.40 85.54 94.48
Class (WQI) II II I
Classification Clean Clean Clean
It was observed that two sampling station namely Sg. Wah and Sg. Sungkai
located in plantation 1 are within Class II and Sg. Sungkai which is located in
plantation 2 is within Class I. This classification is based on Water Quality Index
(WQI) as shown in table 5.13. According to Department of Environment (1986),
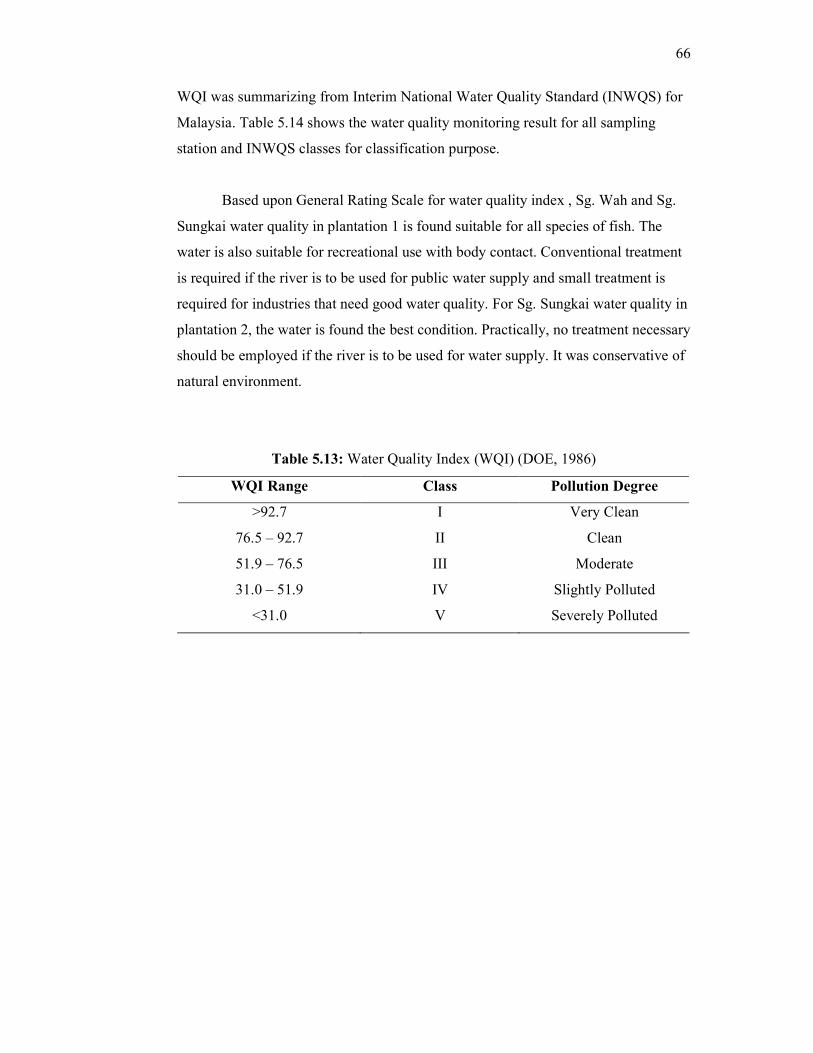
66
WQI was summarizing from Interim National Water Quality Standard (INWQS) for
Malaysia. Table 5.14 shows the water quality monitoring result for all sampling
station and INWQS classes for classification purpose.
Based upon General Rating Scale for water quality index , Sg. Wah and Sg.
Sungkai water quality in plantation 1 is found suitable for all species of fish. The
water is also suitable for recreational use with body contact. Conventional treatment
is required if the river is to be used for public water supply and small treatment is
required for industries that need good water quality. For Sg. Sungkai water quality in
plantation 2, the water is found the best condition. Practically, no treatment necessary
should be employed if the river is to be used for water supply. It was conservative of
natural environment.
Table 5.13: Water Quality Index (WQI) (DOE, 1986)
WQI Range Class Pollution Degree
>92.7 I Very Clean
76.5 – 92.7 II Clean
51.9 – 76.5 III Moderate
31.0 – 51.9 IV Slightly Polluted
<31.0 V Severely Polluted

67
Table 5.14: Water quality monitoring results for Sg. Wah and Sg. Sungkai
Plantation 1 Plantation 2 NWQSM Classess Sampling Stations
Sg. Wah Sg. Sungkai Sg. Sungkai Parameter
W2 W8 W8 I IIA IIB III IV V
Temperature 24.60 24.60 28.50 - + 20˚C - + 20˚C - - pH 7.79 8.02 7.69 6.5 - 8.5 6 - 9 6 - 9 6 - 9 5 - 9 - Dissolved Oxygen 7.10 7.20 5.90 7 5 - 7 5 - 7 3 - 5 < 3 < 1 COD 23.00 13.00 1.00 10 25 25 50 100 >100 BOD5 1.13 1.96 0.18 1 3 3 6 12 >12 Suspended Solids 60.00 44.00 7.00 25 50 50 150 300 300 Iron 0.07 0.13 0.66 NL 1 1 1 5 >5 Sulfide 0.11 0.09 0.02 - - - - - - Nitrate 0.03 0.03 0.10 - - - - - - Phosphorus 0.14 0.23 0.37 NL 0.2 0.2 0.1 - - Zinc 0.06 0.05 0.02 NL 5 5 0.4* 2 >2 Manganese 0.17 0.16 0.10 NL 0.1 0.1 0.1 0.2 >0.2 A-Nitrogen 0.82 0.76 0.17 0.1 0.3 0.3 0.3 2.7 >2.7 E-Coli 501.20 396.80 157.60 100 5,000 5,000 50,000 50,000 >50,000 Oil & Grease 1.90 2.20 12.50 NL 40 ; N 40 ; N N - - Turbidity * * 2.70 5 50 50 - - -

68
5.4.2 Trend Analysis for Suspended Solids Parameter
Back to the basic problem occur in Sg. Kelantan as discuss in chapter one, the
river was become shallow and polluted because of sedimentation problem.
Therefore, this trend analysis is done in order to identify the trend of suspended solid
or suspended sediment in the nearest river. The data obtained is based on monitoring
work from 28 August 2005 until 14 November 2006 for plantation 1 site area and
from 14 January 2006 to 10 November 2006 for plantation 2.
Figure 5.1 shows the trend of total suspended solids at Sg. Wah in plantation
1 site area. The sampling station is located at the downstream area from sediment
basin location and therefore, this trend can be used as an indicator of pollution in
water. The suspended solid reading for all monitoring at Sg. Wah is range between
44 mg/L to 654 mg/L. At the beginning, the trend is likely to have high range and it
was decrease towards. This is influence by the activity carrying out during the
sampling time.
Comparison of SS Value on each monitoring exercise
0
200
400
600
800
1000
1200
28/08/0
5
29/09/0
5
19/10/0
5
15/11/0
5
24/12
/05
12/1/2
006
14/02/0
6
16/05
/06
21/08/0
6
14/11/0
6
Monitoring Date
Total Suspended Solid (mg/L)
Figure 5.1: Suspended solids trend at Sg. Wah

69
SB2 will discharge the water into Sg. Sungkai stream. Based on figure 5.2,
TSS result for this river is range between 60 mg/L to 3 205 mg/L. On 28 August
2006, the amount of TSS result is found high with 3 205 mg/L. This is because of
high rainfall amount received during that date. However, the TSS is decrease back to
60 mg/L and can be said that the water is still protected from pollution.
Based on figure 5.3, the water discharge from SB3 in plantation 2 is likely to
have low amount of TSS. The graph shows that TSS value is range between 2 mg/L
to 66 mg/L. These values are within Class I, II and III based on NWQSM. Therefore,
this river classification can be said it is still in good condition.
Comparison of SS Value on each monitoring exercise
0
500
1000
1500
2000
2500
3000
3500
28/08/0
5
29/09/0
5
19/10/0
5
15/11/0
5
24/12/0
5
12/1/2
006
14/02/0
6
16/05/0
6
21/08/0
6
14/11/0
6
Monitoring Date
Total Suspended Solid (mg/L)
Figure 5.2: Suspended solids trend at Sg. Sungkai in plantation 1

70
Comparison of SS Value on each monitoring exercise
0
10
20
30
40
50
60
70
14/01/0
6
15/02/0
6
17/03/0
6
25/04/0
6
17/05/0
6
26/06/0
6
24/07/0
6
10/10/2
006
Monitoring Date
Total Suspended Solid (mg/L)
Figure 5.3: Suspended solids trend at Sg. Sungkai in plantation 2
5.5 Correlation Between Planting Stage and Rainfall Distribution Analysis
Figure 5.4 shows the correlation between planting phase with rainfall
distribution for both project sites. Rainfall data used in this study is based on
Cameron Highlands station. Normally, oil palm plantation project encompasses five
stages. There are pre-planning stage, site preparation, planting, operation and
maintenance and harvesting stage.
During site preparation, critical activities are involved such as cutting trees,
site clearing, construction of road, terracing, etc. this activities will exposed soil
surface to the erosion agent especially rainfall and function as the major producer
impact of sediment. Therefore, it is important to ensure that this activity is doing in a
suitable climate and proper management is needed to fulfill this requirement for a
better result of environmental protection.

71
Correlation between schedule for project implementation and rainfall amount based on Cameron Highlands rainfall
station
0
100
200
300
400
500
600
Ja
n
Ma
c
Ma
y
Ju
l
Se
p
No
v
Ja
n
Ma
c
Ma
y
Ju
l
Se
p
No
v
Ja
n
Ma
c
Ma
y
Ju
l
Se
p
No
v
Ja
n
Ma
c
Ma
y
Ju
l
Se
p
No
v
Ja
n.
Ma
c
Ma
y
Ju
l
Se
p
No
v
Months
rainfall amount (mm)
PRE-PLANNING
SITE PREPARATION
PLANTING
OPERATION & MAINTENANCE
HARVESTING
2001 2002 2005 2004 2003
Figure 5.4: Correlation between planting stage and rainfall amount

72
5.6 Questionnaire Analysis
The aim of this questionnaire analysis is to identify the level of
environmental awareness among developers and their workers. There are 22
respondent was successfully give respond and examined from both project sites.
From that total amount, 23% feedback is from management level and the rest is from
the general workers. The workers are come from various background identities. Most
of the workers are come from Myanmar, Indonesia and Thailand country. Only small
numbers of workers are Malaysian.
All workers have their own job such as lorry driver, truck driver, nursery
stage workers, fruit cut, etc. Majority the workers have been involved in oil palm
plantation between range of 1-4 years while from respondents age aspect, it was
found that the range is between 17 to 51 years old.
Figure 5.5 until 5.10 shows the result obtained from questionnaire analysis.
Part A, C, E and F give highest percentage on poor level while for part B and D, the
highest percentage is on moderate level. Therefore, it shows that from management
and farming practice, both project sites is still weak. Something must be done on it.
However, based on interview session observation, a good responding is get
from workers on level of management. They were well understood and aware on
environmental issues. It is difference with the response getting from general labor.
They was not concern on environmental issues. One of the factor contribute to this
problem is from communication aspect. The management level workers must well
concern on this issues in order to produce a better plantation practice.

73
Figure 5.5: Result from questionnaire analysis for part A
PART A : UNDERSTANDING ON ENVIRONMENT
9%
27% 64%
very good good moderate poor very weak
PART B : LAND MANAGEMENT PART B : LAND MANAGEMENT PART B : LAND MANAGEMENT PART B : LAND MANAGEMENT
50%
14% 36%
very good good moderate poor very weak
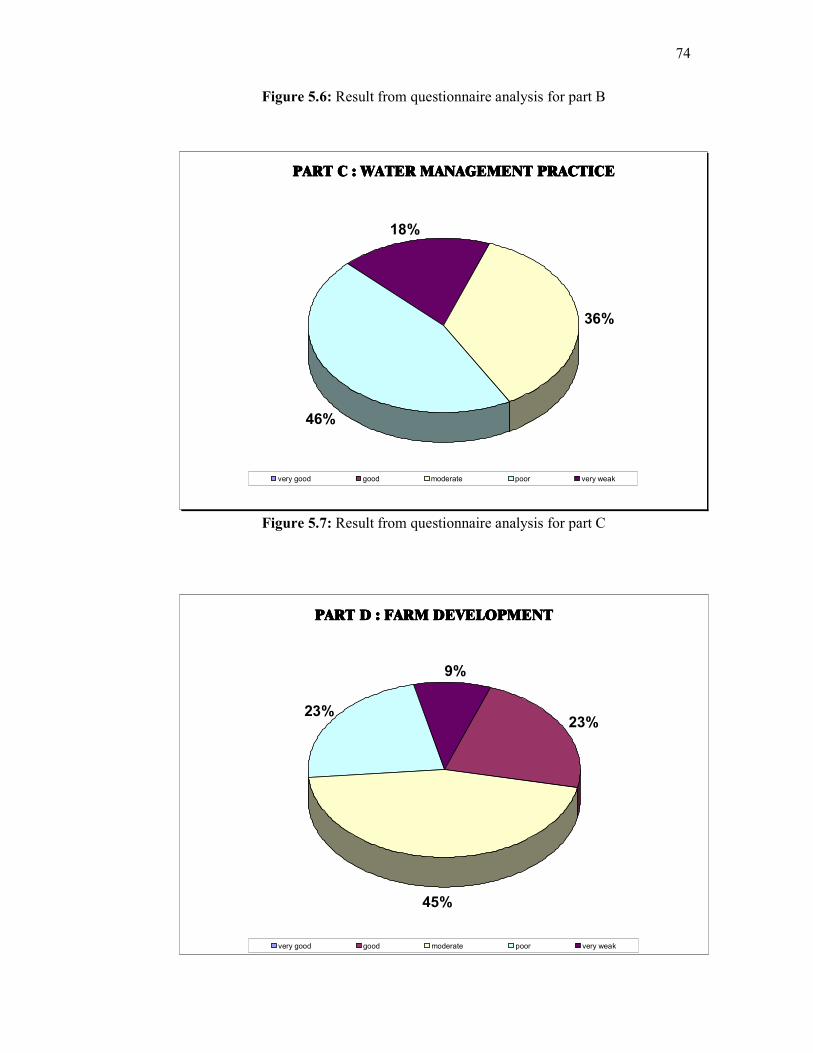
74
Figure 5.6: Result from questionnaire analysis for part B
Figure 5.7: Result from questionnaire analysis for part C
PART C : WATER MPART C : WATER MPART C : WATER MPART C : WATER MANAGEMENT PRACTICEANAGEMENT PRACTICEANAGEMENT PRACTICEANAGEMENT PRACTICE
36%
46%
18%
very good good moderate poor very weak
PART D : FARM DEVELOPMENT PART D : FARM DEVELOPMENT PART D : FARM DEVELOPMENT PART D : FARM DEVELOPMENT
23%
45%
23%
9%
very good good moderate poor very weak

75
Figure 5.8: Result from questionnaire analysis for part D
Figure 5.9: Result from questionnaire analysis for part E
PART E : DESIGN CRITERIAPART E : DESIGN CRITERIAPART E : DESIGN CRITERIAPART E : DESIGN CRITERIA
27%
73%
very good good moderate poor very weak
PART F : MAIPART F : MAIPART F : MAIPART F : MAINTENANCENTENANCENTENANCENTENANCE
5%
36% 50%
9%
very good good moderate poor very weak

76
Figure 5.10: Result from questionnaire analysis for part F
5.7 Discussion
Large-scale agricultural practices have been identified as major contributors
to environmental stress on the ecological health of rivers systems (Cooper, 1993;
Nixon, 1995). The increased use of artificial fertilisers combined with the removal of
natural vegetation for cultivation has caused a world-wide trend of increasing
nutrient and sediment loads in river systems (Berka et al., 2001; Gabrick and Bell,
2003).
Oil palm plantations create a variety of impacts on the surrounding
environment. Impacts of oil palm include loss of native vegetation, erosion of soil,
sedimentation of streams, rivers and estuaries, introduction of pesticides and
fertilisers and water and air pollutants (Keu, 2000). Sedimentation of rivers is
recognized as a major environmental problem associated with oil palm plantations.
Erosion and subsequent sedimentation would have been particularly
significant during the establishment of oil palm plantations. Other clearing and
forestry activities would also have contributed. Erosion still occurs because of the
lack of buffers and the need to maintain cleared zones around oil palms. It can
contribute to turbidity and, the movement of contaminated soils and excess nutrients
to the waterways. Soil erosion and sedimentation causes substantial waterway
damages and water quality degradation, and remains as one of the main
environmental concerns as study conducted in the Great Lakes Basin (Da Ouyang et.
al., 2005). A number of factors such as drainage area size, basin slope, climate, land
use and land cover affect sediment delivery processes.
Techniques for erosion control such as stream-bank stabilization and
revegetation of eroding upland areas reduce only part of a stream's sediment load.
Edward et. al., (1983) was conducted a study on Poplar Creek and he was
demonstrated that an in-stream sediment basin can trap and remove almost all sand
bedload sediments. Other advantages of sediment basins are that they can produce
down cutting to create deeper pools and improve streambed composition. Sediment

77
basins should be used with caution in streams with erodible beds that have no areas
of erosion-resistant streambed to prevent possible excessive down cutting. Sediment
basins can be used with other techniques, or they can be used alone to renovate sand-
choked streams not amenable to the usual erosion-control treatments.
Another study on sediment basin was conducted by Gaylord et. al., (1983)
and he found that a sediment basin excavated in a Michigan reduced the sandy
bedload sediment by 86%. The results suggested that in-stream sediment basins are
an effective means for removing sand bedload and that even small amounts of
moving-sand bedload sediments can have a major impact especially on a trout
population.
Hansen et. al., (1983) in their study at Michigan Rivers state that sediment
traps are widely used to remove excess sand bed load. However, little information
exists to evaluate the effectiveness of sediment trapping efforts in restoring desirable
river substrates and channel habitats. Effectiveness of sediment removal efforts likely
varies among river reaches with results ranging from beneficial to benign.
Soil loss is usually measured at plot scales that provide rates of erosion on a
hillslope ( Wischmeier and Smith, 1965). As soil particles move down slope, some
are redeposited in depressions, accumulated behind structures such as fallen trees or
filtered by litter and undergrowth. As a result sediment yield measured at a
catchment outlet is often smaller than those eroded on hillslopes (Wasson et al,
1996). Several studies on sediment yield from forested and disturbed catchments
have been documented in the tropics (Baharuddin, 1988; Lai, 1993; Douglas et al.,
1993). The observed sediment yield values vary considerably to the extent that
generalization of values by activities or landuse alone, say forest harvesting, is
difficult.
Erosion and sediment delivery processes are controlled by complex
interactions of topography, rainfall, soil, vegetation cover, and management
practices. Therefore, obtaining actual sediment yield for various catchment
conditions require a large number of experimental catchments or plots that are
expensive and time consuming. Furthermore, extrapolating results from small
78
catchments to a larger scale of landscape is not a straight forward exercise (Zulkifli
and Toshionori, 2003).
A number of models have been developed to estimate the sediment delivery
ratio and sediment yield. They can generally be grouped into two categories. One is
called statistical or empirical models such as the Universal Soil Loss Equation
(USLE). These models are statistically established and are based on observed data,
and are usually easy to use and are computationally efficient. Another category of
models can be called parametric, deterministic, or physically based models. These
models are developed based on the fundamental hydrological and sedimentological
processes. They may provide detailed temporal and spatial simulation but usually
require extensive data input (Da Ouyang et. al., 2005).
To archive sediment reduction goals, it is important to identify areas with
high sediment yield that can be of dredging concern. Controlling sediment loads also
requires knowledge and quantitative assessment of soil erosion and the sediment
transport process. An overall analysis on the stream need to be conducted in order to
assess and compare their relative loadings of sediments, state of conservation
practices, and their potential for further reductions to sediment and contaminant
loading.

CHAPTER VI
CONCLUSION & RECOMMENDATIONS
6.3 Conclusion
The present study showed that the effectiveness of sediment basin
implemented in oil palm plantation was influenced by a few factors. It is based on
the result from various analyses. Observation on field found that the numbers of
sediment basin build up in both plantation areas were not enough. More sediment
basin is needed to build up in order to protect water quality at the area. Even
suspended solid analysis gave a good result at the inflow and outflow of sediment
basin, when it comes to turbidity analysis, the result was not in good condition.
However, the result is still in a good class where it showed that the water was not
polluted because of plantation activities.
Erosion risk expressed as annual soil loss rate. From erosion risk analysis,
both projects can be said in a good condition. However, should take into account that
this analysis is only considered the area where the sediment basin was located. If the
whole project area is considered, the amount of erosion rate will be greater. From
management on site, it can be conclude that both project developers must take an
action to enhance their level of awareness especially to their general workers. Proper
management and erosion control is needed to ensure the good quality of water in the
downstream areas. Since mankind first cultivated plants, agriculture has had an

80
impact on the environment. It is therefore important that conservation practices are
incorporated in future land management to prevent deterioration of water quality.
6.4 Recommendations
Below are a few recommendations in order to enhance the effectiveness of
sediment basin and silt trap implemented in oil palm plantation:
i. Sediment basin should be used in conjunction with erosion control
practices such as temporary seeding, mulching, diversion dikes, etc. to
reduce the amount of sediment flowing into the basin. Sediment basins
are most effective when designed with a series of chambers.
ii. Sediment basin also should be located so as to intercept the largest
possible amount of runoff from the disturbed area. The best locations are
generally on relatively flat terrain downstream from disturbed areas.
iii. Applying "management measures" which mean as construction
management methods that prevent or reduce erosion potential and ensure
the proper functioning of BMPs. Well considered construction
management can dramatically reduce the cost of erosion and sediment
problems. Be sure that the structural sediment control BMPs are in place
before land disturbing
activities begin.
iv. Beside consider technical aspect, management factor also should be put as
an important factor in order to enhance water quality in the plantation
area. All authorities such as Department of Irrigation and Drainage(DID)
and Department of Environment (DoE) should do a monitoring in interval
time regularly. Beside that, authorities are recommended to cooperate
together with developers so that they can monitor all the activities done

81
during plantation. With a systematic and consistence management,
environment can be protected.

82
REFERRENCES
Alexander, G.R., and E.A. Hansen. (1986). Sand Bed Load in a Brook Trout
Stream. North American Journal of Fisheries Management 6:9-23.
B. Gregersen, J. Aalbæk, P.E. Lauridsen, M. Kaas, U. Lopdrup, A. Veihe and P. van
der Keur (2003). Land Use and Soil Erosion in Tikolod, Sabah, Malaysia.
ASEAN Review of Biodiversity and Environmental Conservation (ARBEC).
Baharuddin K. (1988) Effect of Logging on Sediment Yield in a Hill Dipterocarp
Forest in Peninsular Malaysia. Journal of Tropical Forest Science, 1(1): 56-66.
Balamurugan, G. (1991). Sediment balance and delivery in a humid tropical
urban river basin: the Kelang river, Malaysia. Catena 18: 271-287.
Berka C., Schreier H. and Hall K. (2001). Linking Water Quality with
Agricultural Intensification in a Rural Watershed. Water, Air and Soil
Pollution 127:389-401.
C. N. Williams and Y. C. HSU (1970). Oil Palm Cultivation in Malaya: Technical
and Economic Aspects., University of Malaya, Kuala Lumpur.
Cooley, K.R. and J.R. Williams. (1983). Applicability of the Universal Soil Loss
Equation (USLE) and modified USLE to Hawaii. In: El-Swaify, S.A.,
Moldenhauer, W.C. and A. Lo (eds.) Soil erosion and conservation, Soil
Conservation Society of America 509-522.

83
Cooper C.M. (1993). Biological Effects of Agriculturally Derived Surface Water
Pollutants on Aquatic Systems – A Review. Journal of Environmental Quality
22:402-408.
Deborah Soloman (1997). Identification of Cropping Areas at Risk to Soil
Erosion in England. Mansfield, England.
Department of Irrigation and Drainage Malaysia (2000). Manual Saliran Mesra
Alam Malaysia.Chapter 15-Pollutant Estimation. JPS Malaysia.
Department of Irrigation and Drainage Malaysia (2000). Manual Saliran Mesra
Alam Malaysia.Chapter 39-Erosion and Sediment Control Measures. JPS
Malaysia.
Department of Irrigation and Drainage Malaysia (2000). Manual Saliran Mesra
Alam Malaysia.Chapter 41-Erosion and Sediment Control Plan. JPS
Malaysia.
Douglas, I., T. Greer, K. Bidin and W. Sinun (1993) Impact of Road and
Compacted Ground on Post-Logging Sediment Yield in a Small Drainage
Basin, Sabah, Malaysia. In Proceeding of the Yokohama Symposium on
Hydrology of Warm Humid Regions, July 1993. IAHS Publ., no 216: 213-218.
Dr Yusof Basiron, Prof. Dr. Jalani Sukaimi, Prof. Dr. Hj. Badri Muhamad, Dr.
Ahmad Ibrahim, Dr. Loke Kwong Hung, Mohd Nasir Hasan Basri (1993);
Existing and potential oil palm areas in Peninsular Malaysia; PORIM
Occasional Paper No.29, Kuala Lumpur, Malaysia.
Dr. Terrence J. Toy, Dr. George R. Foster, Dr. Kenneth G. Renard (2001), Soil
Erosion: Processes, Prediction, Measurement, and control., John Wiley &
Sons, Inc.
Edward A. Hansen, Gaylord R. Alexander, William H. Dunn (1983). Sand Sediment
in a Michigan Trout Stream Part I. A Technique for Removing Sand

84
Bedload from Streams. North American Journal of Fisheries Management
1983; 3:355–364.
Environmental Impact Assessment (EIA) Guidelines for Oil Palm Plantation
Development, State Environmental Conservation Department (ECD), Sabah
Malaysia; Third Draft; November 2000.
Environmental Software and Services GmbH AUSTRIA (1995-2006). WaterWare:
The Kelantan River Malaysian case study. Waterware Water Resources
Information Management System. Retrieved on April 14, 2006.
Folly, A. (1997). Land use planning to minimise soil erosion — a case study from
the Upper East Region in Ghana. Geographica Hafniensia A6, Publications,
Institute of Geography, University of Copenhagen, Denmark.
Foolett, R. F., and B. A. Stewart (eds.). 1985. Soil Erosion and Crop Productivity.
American Society of Agronomy, Crop Science Society of America, Soil
Science of Society of America, Madison, WI.
Gabric A.J. and Bell P.R.F. (1993). Review of the Effects of Non-Point Nutrient
Loading on Coastal Ecosystems. Australian Journal of Marine and Freshwater
Research 44:261-283.
Gaylord R. Alexander1 And Edward A. Hansen (1983). Sand Sediment in a
Michigan Trout Stream, Part II. Effects of Reducing Sand, Bedload on a
Trout Population. North American Journal of Fisheries Management 1983;
3:365–372.
Hazalizah Binti Hamzah (2005). Roadmap toward Effective Flood Hazard
Mapping in Malaysia JICA region focused training course on flood hazard
mapping. Retrieved on April 14, 2006.
Hewlett, J.D. (1982). Principles of Forest Hydrology. Athens, Georgia: University
of Georgia Press.

85
Keu S.T. (2000). Review of Previous Similar Studies on the Environmental
Impacts of Oil Palm Plantation Cultivation on People, Soil, Water and
Forests. Submitted to Faculty of Horticulture, Chiba University. Masters thesis.
Lai, F.S. (1993) Sediment Yield from Logged, Steep Upland Catchments in
Peninsular Malaysia. In: Proceeding of the Yokohama Symposium, Hydrology
of Warm Humid Regions, IAHS Publ. no 216: 219-229.
Mati, B. (1999). Erosion hazard assessment in the Upper Ewaso Ngiro basin of
Kenya: application of GIS, USLE and EUROSEM. Ph.D. Thesis, Cranfield
University at Silsoe, UK.
MetCalf & Eddy Inc. (1979). Wastewater Engineering, Treatment, Disposal and
Reuse, 2nd edition. McGraw-Hill.
Milos Holy (1980). Erosion and Environment. Pergamon Press. Pg 152-153.
Morgan, R.P.C. (1974). Estimating regional variations in soil erosion hazard in
Peninsular Malaysia. Malay. Nat. J. 28: 94-106. (1986). Soil Erosion and
Conservation, Longman, UK.
Nixon, S.W. (1995). Coastal Marine Eutrophication: A Definition, Social Causes
and Future Consequences. Ophelia 41:199-219.
P. Laguionie, J. Lefrançois, A. Crave and P. Davy (2006). Estimation Of A Long-
Term Mean Sediment Load. European Geosciences Union. Université de
Rennes 1, Campus de Beaulieu, 35042 Rennes Cedex, France.
Renard, K. G., G. R. Foster, G. A. Weesies, and D. K. McCool, and D. C. Yoder.
1997. Predicting Soil Erosion by Water: A Guide to Conservation Planning
with the Revised Univesal Soil Loss Equation (RUSLE). USDA Agricultural
Handbook 703. U. S. Government Printing Office, Washington, DC.

86
Renard, K.G., G.R. Foster, G.A. Weesies and J.P. Porter. (1991). RUSLE, Revised
Universal Soil Loss Equation. Journal of Soil and Water Conservation 46(1):
30-33.
S. Lord and J. Clay (2006). Environmental Impacts of Oil Palm – Practical
Considerations in Defining Sustainability for Impacts on the Air, Land and
Water. Oil Palm Research Station, Papua New Guinea.
Steven J. Goldman, Katharine Jackson, Taras A. Bursztynsky, P.E, (1986). Erosion
and Sediment Control Handbook. McGraw-Hill Inc. United State of
America.
Steven J. Goldman, Katharine Jackson, Taras A. Bursztynsky, P.E, (1986). Erosion
and Sediment Control Handbook. McGraw-Hill Inc. United State America.
Stockholm’s Water and sewer Works (1978). Stormwater studies at Jarvafaltet
Swedish.
Teoh Cheng Hai (2000). Land Use and the Oil Palm Industry in Malaysia. WWF
Forest Information System Database.
The Star, 28 March 2007.
Thomas Johnson, Xiao Huang, John Furlow, Catriona Rogers, Randall Freed, Diana
Pape (2005). The Effectiveness of Riparian Buffers for Reducing Sediment
Loading to Streams Under Alternative Climate Change Scenarios. USEPA
ORD Global Change Research Program.
Wasson, R.J., Olive, L.J. and Rosewell, C. (1996) Rate of Erosion and Sediment
Transport in Australia. In D.E.Walling and R. Webb (Eds.) Erosion and
Sediment Yield: Global and Regional Perspectives. IAHS Publ.

87
Wischmeier, W.H. and D.D. Smith (1965) Predicting Rainfall-Erosion Losses
from Cropland East Of the Rocky Mountains: Guides for Selecting and
Practices for Soil and Water Conservation. USDA Handbook no 282.
Zulkifli Yusop (UTM) Toshionori OKUDA (NIES) (2003). Studies on Evaluation
of Logging Impacts on Soil Erosion and Water-shed Ecosystem -
Preliminary Results. NIES.

88
APPENDIX 1.1 Articles in The Star newspaper (28/03/07) report on Kelantan’s Lojing Highlands in danger of being logged bare

89
APPENDIX 1.2 Article in The Star newspaper (28/03/07) report on forest reserve under treat issue

90
APPENDIX 3.1
Records of Monthly Rainfall Amount
Station : Cameron Highlands
Lat : 04 28’ N
Long. : 101 22’ E
Ht. above M.S.L : 1545.0 m
Unit : mm
Month Jan. Feb. Mar. Apr. May June July Aug. Sept. Oct. Nov. Dec. Annual
2001 141.50 137.20 245.40 310.70 197.20 89.70 50.20 99.20 274.80 429.20 413.70 242.90 2631.70
2002 26.00 8.90 84.90 421.50 301.60 254.50 167.00 282.40 366.20 412.30 334.00 157.30 2816.60
2003 102.00 118.00 266.60 185.70 235.40 300.70 289.00 362.00 157.00 47.40 313.50 175.50 2975.80
2004 44.20 102.40 248.90 256.40 262.20 75.60 213.80 161.90 444.90 322.90 175.30 103.10 2411.60
2005 24.50 99.30 190.40 217.90 199.80 227.20 235.00 137.10 157.40 450.40 401.20 543.20 2883.40

91
APPENDIX 3.2
Records of Number of Raindays
Station : Cameron Highlands
Lat : 04 28’ N
Long. : 101 22’ E
Ht. above M.S.L : 1545.0 m
Month Jan. Feb. Mar. Apr. May June July Aug. Sept. Oct. Nov. Dec. Annual
2001 26 12 20 28 18 10 11 16 20 26 29 18 234
2002 10 2 11 22 19 14 15 16 23 27 21 23 203
2003 16 15 19 21 13 22 17 22 22 28 27 17 239
2004 11 10 23 20 18 10 17 15 27 27 26 12 216
2005 9 7 12 18 24 14 17 16 17 30 24 27 215

92
Appendix 3.3
DOE Water Quality Index Classes
Classes Parameter Unit
I II III IV V
Ammoniacal Nitrogen mg/l < 0.1 0.1 - 0.3 0.3 - 0.9 0.9 - 2.7 > 2.7
Biochemical Oxygen Demand mg/l < 1 1 - 3 3 - 6 6 - 12 > 12
Chemical Oxygen Demand mg/l < 10 10 - 25 25 - 50 50 - 100 > 100
Dissolved Oksigen mg/l > 7 5 - 7 3 - 5 1 - 3 < 1
pH mg/l > 7.0 6.0 - 7.0 5.0 - 6.0 < 5.0 > 5.0
Total Suspended Solids mg/l < 25 25 - 50 50 - 150 150 - 300 > 300
Water Quality Index > 92. 7 76.5 - 92.7 51.9 - 76.5 31.0 - 51.9 < 31.0

93
Appendix 3.4
INTERIM NATIONAL WATER QUALITY STANDARDS FOR MALAYSIA
CLASSES PARAMETERS UNIT I IIA IIB III IV V Ammoniacal Nitrogen mg/l 0.1 0.3 0.3 0.9 2.7 >2.7
BOD mg/l 1 3 3 6 12 >12
COD mg/l 10 25 25 50 100 >100
DO mg/l 7 5 - 7 5 - 7 3 - 5 <3 <1
pH 6.5 - 8.5 6 - 9 6 - 9 5 - 9 5 - 9 -
Colour TCU 15 150 150 - - -
Elec. Conductivity * umhos/cm 1000 1000 - - 6000 -
Floatables N N N - - -
Odour N N N - - -
Salinity (% ) % 0.5 1 - - 2 -
Taste N N N - - -
Total Dissolved Solid mg/l 500 1000 - - 4000 -
Total Suspended Solid mg/l 25 50 50 150 300 300
Temperature (C) oC - Normal +20C - Normal
+20C - -
Turbidity (NTU) NTU 5 50 50 - - -
Faecal Coliform ** counts/100mL 10 100 400 5000
(20000)a 5000 (20000)a -
Total Coliform counts/100mL 100 5000 5000 50000 50000 >50000
Notes
N : No visible floatable materials or debris or No objectionable odour, or No objectionable taste * : Related parameters, only one recommended for use ** : Geometric mean a : maximum not to be exceeded

94
Class Uses CLASS I : Conservation of natural environment water supply 1 - practically no treatment necessary. Fishery 1 - very sensitive aquatic species CLASS IIA : Water Supply II - conventional treatment required Fishery ll - sensitive aquatic species CLASS IIB : Recreational use with body contact CLASS III : Water Supply lll - extensive treatment required Fishery lll - common, of economic value, and tolerant species livestock drinking CLASS IV : Irrigation

95
Appendix 3.5
QUESTIONNAIRE FORM
The purpose of this questionnaire is to study the level of environmental awareness among developers or planters involve in oil palm plantation project. All the information given is classified as a secret and will be used for research purpose only. Please tick (√) the best describing yours.
RESPONDENT BACKGROUND
Age : ___________________________________ Race : ___________________________________ Sex : Male Female Position status : ___________________________________ Name of Farm : ___________________________________ Periods of involvement in Oil Palm Plantation sector: x ≥ 20 years 15 years ≤ x ≤ 19 years 10 years ≤ x ≤ 14 years 5 years ≤ x ≤ 9 years x ≤ 4 years PART A UNDERSTANDING
1.1 Grade knowledge of "Environmental Problem"
1.2 Personally feelling affected by environmental problems in plantation area
1.3 Environmental protection regulations and measures implemented
1.4 Implementation of formal, written EIA or EMP requirement 1.5 Consciousness on agricultural activities today can lead to the
destruction and reduction of natural 1.6 General attitude towards the environment 1.7 Identification of potential problem that may occur
PART B LAND MANAGEMENT
2.1 Fertilisers utilizing in "environmentally appropriate" quantities
2.2 Application of sediment basin/silt trap at site
2.3 Crops uses in operation to avoid erosion
2.4 Managing the crop residues
2.5 Awareness on changes in the preparing and working with the soil
PART C WATER MANAGEMENT PRACTICE
3.1 Awareness on shortage of freshwater because of environmental contamination
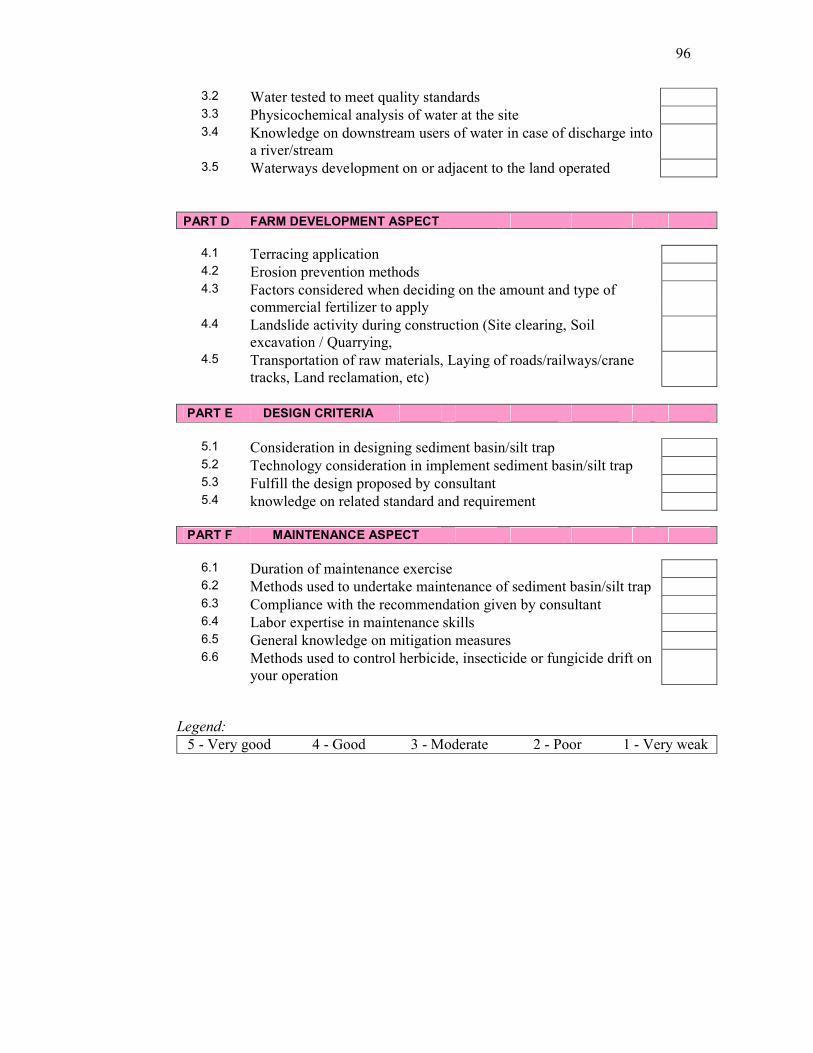
96
3.2 Water tested to meet quality standards 3.3 Physicochemical analysis of water at the site 3.4 Knowledge on downstream users of water in case of discharge into
a river/stream 3.5 Waterways development on or adjacent to the land operated
PART D FARM DEVELOPMENT ASPECT
4.1 Terracing application
4.2 Erosion prevention methods
4.3
Factors considered when deciding on the amount and type of commercial fertilizer to apply
4.4 Landslide activity during construction (Site clearing, Soil excavation / Quarrying,
4.5
Transportation of raw materials, Laying of roads/railways/crane tracks, Land reclamation, etc)
PART E DESIGN CRITERIA
5.1 Consideration in designing sediment basin/silt trap
5.2 Technology consideration in implement sediment basin/silt trap
5.3 Fulfill the design proposed by consultant
5.4 knowledge on related standard and requirement
PART F MAINTENANCE ASPECT
6.1 Duration of maintenance exercise
6.2 Methods used to undertake maintenance of sediment basin/silt trap
6.3 Compliance with the recommendation given by consultant
6.4 Labor expertise in maintenance skills
6.5 General knowledge on mitigation measures
6.6 Methods used to control herbicide, insecticide or fungicide drift on your operation
Legend:
5 - Very good 4 - Good 3 - Moderate 2 - Poor 1 - Very weak

97
Appendix 5.1
Sediment Basin Types
Soil description Soil type Basin Type
Coarse-grained sand,
sandy loam: less than
33% <0.02mm
C Dry
Fine-grained loam, clay:
more than 33%
<0.02mm
F Wet
Dispersible fine-grained
clays as per type F, more
than 10% of dispersible
material
D Wet