effective use of simulations in teaching probability and - paws
TRANSCRIPT

ProbabilitySampling and Sample Distributions of the Mean
References
Effective Use of Simulations in TeachingProbability and Statistics
38th Annual NCCTM ConferenceErin McNelis
October 31, 2008
38th Annual NCCTM Conference Erin McNelis Effective Use of Simulations in Teaching Probability and Statistics

ProbabilitySampling and Sample Distributions of the Mean
References
A Slightly More Complicated Example . . .A More Complicated Example . . .
What Our Students Are Familiar With . . .
Note, most probabilities associated with these examples rely on thenumber of equally likely outcomes.
38th Annual NCCTM Conference Erin McNelis Effective Use of Simulations in Teaching Probability and Statistics

ProbabilitySampling and Sample Distributions of the Mean
References
A Slightly More Complicated Example . . .A More Complicated Example . . .
Probability As Limiting Relative Frequency
Definition (Probability of an Event, E )
The probability of an event E (recall that an event is a subset ofthe sample space of all possible outcomes), denoted P(E ), is thevalue approached by the relative frequency of occurrence of E in avery long series of replications (repeats of experiments with thesame conditions) of a chance experiment, i.e.
P(E ) = limN→∞
number of times E occurs
number of replications,N.
Thus, if the number of replications, N, is quite large,
P(E ) ≈ number of times E occurs
number of replications, N
38th Annual NCCTM Conference Erin McNelis Effective Use of Simulations in Teaching Probability and Statistics

ProbabilitySampling and Sample Distributions of the Mean
References
A Slightly More Complicated Example . . .A More Complicated Example . . .
Random Cell Phones
Image from
http://ww1.prweb.com/prfiles/2006/07/27/0000417675/ExampleofCellPhones.jpg
Suppose four identical phonesare left on a table. One belongsto Heather, one to Craig, oneto David, and one to Sam.You distribute a phone to eachperson. What is the probabilitythat at least one person getsthe right phone?
38th Annual NCCTM Conference Erin McNelis Effective Use of Simulations in Teaching Probability and Statistics

ProbabilitySampling and Sample Distributions of the Mean
References
A Slightly More Complicated Example . . .A More Complicated Example . . .
PLINKO!
The slots are, from left to right;$100, $500, $1000, $0, $10000,$0, $1000, $500, $100.
Image from
http://en.wikipedia.org/wiki/Image:Plinkoseason37.jpg
The popular Price is Right gameshow has a lot of games thatare useful in teaching probability.Plinko! is one of those games. Acontestant drops a chip from a slotat the top of the Plinko! board andit slides down, bouncing off of thepegs on the way, until it reachesthe bottom. The contestant winsthe amount of money displayed inthe slot the chip lands in at thebottom.
38th Annual NCCTM Conference Erin McNelis Effective Use of Simulations in Teaching Probability and Statistics

ProbabilitySampling and Sample Distributions of the Mean
References
A Slightly More Complicated Example . . .A More Complicated Example . . .
Giving Credit Where Credit is Due . . .
The following simulation was taken from a talk by
Dr. Matt Carlton and Mary Mortlockof California Polytechnic State University, San Luis Obispo
entitled “Probability and Statistics Through Game Shows” given atthe 2003 TCM Conference at NCSSM. The handout from the talkcan be found at:http://courses.ncssm.edu/math/TCMConf/TCM2003/talks%202003/
GAMESHOW1 carltonmort.pdf
38th Annual NCCTM Conference Erin McNelis Effective Use of Simulations in Teaching Probability and Statistics
ProbabilitySampling and Sample Distributions of the Mean
References
A Slightly More Complicated Example . . .A More Complicated Example . . .
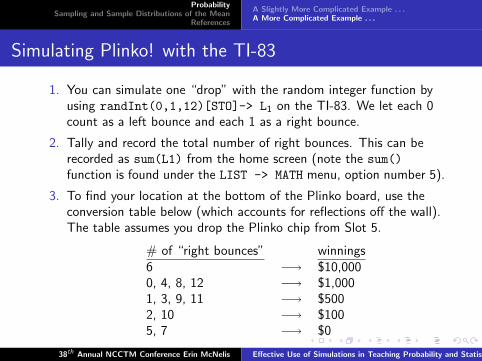
Simulating Plinko! with the TI-83
1. You can simulate one “drop” with the random integer function byusing randInt(0,1,12)[STO]-> L1 on the TI-83. We let each 0count as a left bounce and each 1 as a right bounce.
2. Tally and record the total number of right bounces. This can berecorded as sum(L1) from the home screen (note the sum()function is found under the LIST -> MATH menu, option number 5).
3. To find your location at the bottom of the Plinko board, use theconversion table below (which accounts for reflections off the wall).The table assumes you drop the Plinko chip from Slot 5.
# of “right bounces” winnings6 −→ $10,0000, 4, 8, 12 −→ $1,0001, 3, 9, 11 −→ $5002, 10 −→ $1005, 7 −→ $0
38th Annual NCCTM Conference Erin McNelis Effective Use of Simulations in Teaching Probability and Statistics

ProbabilitySampling and Sample Distributions of the Mean
References
A Slightly More Complicated Example . . .A More Complicated Example . . .
“So, what now?”
Besides having fun, what is the point of this simulation? There areseveral introductory probability topics that you can use thissimulation to motivate:
I Approximating probabilities with relative frequencies with alarge number of trials.
I Deriving the expected value formula.
I Tree diagrams.
I Binomial random variables (counting the number of “rights”in 12 bounces).
For additional useful teaching tools related to Plinko! check outthe “Plinko! Probability from a TV Game” website:
http://mathdemos.gcsu.edu/mathdemos/plinko/
38th Annual NCCTM Conference Erin McNelis Effective Use of Simulations in Teaching Probability and Statistics

ProbabilitySampling and Sample Distributions of the Mean
References
Sampling . . .
As it is rare to have access to an entire population, or to be able toget data on the entire population, we typically rely on extractinginformation about the population from information we gain fromsamples.For example, if our population is the set of 300 songs on your MP3player (in particular, the length of each song in seconds), we cantake various random samples, creating a population of samples asit is. For each random sample of size n that is drawn we canconcern ourselves with one or more of the following statistics:
I Average Song Length
I Maximum Song Length
I Difference between Max Song Length and Min Year SongLength
I etc.
38th Annual NCCTM Conference Erin McNelis Effective Use of Simulations in Teaching Probability and Statistics

ProbabilitySampling and Sample Distributions of the Mean
References
Let’s Sample . . .
Each person is to
1. Select three song lengths (chips) from the bucket,
2. Mark down the number of seconds associated with those threesongs,
3. Return your chips to the bucket,
4. Determine the average length of your three selected songs.
38th Annual NCCTM Conference Erin McNelis Effective Use of Simulations in Teaching Probability and Statistics

ProbabilitySampling and Sample Distributions of the Mean
References
Drawing Inferences . . .
What we know:
I Multiple samples of a fixed size, n = 3.
I For each sample of size 3, we have average length of thesongs in the sample, i.e. if x = length of a song selected, thenwe’ve got a sample mean, x̄ .
Are you able to make any logical conclusions about the mean,standard deviation, or distribution of the 300 songs in the originalpopulation? Why or why not?
38th Annual NCCTM Conference Erin McNelis Effective Use of Simulations in Teaching Probability and Statistics

ProbabilitySampling and Sample Distributions of the Mean
References
Using Fathom to Sample from a Population
Now suppose we did this for 500 samples with sample size n = 5.
38th Annual NCCTM Conference Erin McNelis Effective Use of Simulations in Teaching Probability and Statistics

ProbabilitySampling and Sample Distributions of the Mean
References
“So, what now?”
Besides the “Ooh” and “Aah” factor, what is the point of thissimulation? Using Fathom to simulate sampling allows students to:
I Better understand the complicated concepts in sampling, anddistributions of sample statistics.
I Derive the Central Limit Theorem.
38th Annual NCCTM Conference Erin McNelis Effective Use of Simulations in Teaching Probability and Statistics

ProbabilitySampling and Sample Distributions of the Mean
References
Central Limit Theorem
Case with Sample Size n = 2 Case with Sample Size n = 5
38th Annual NCCTM Conference Erin McNelis Effective Use of Simulations in Teaching Probability and Statistics

ProbabilitySampling and Sample Distributions of the Mean
References
Central Limit Theorem
Case with Sample Size n = 10 Case with Sample Size n = 15
38th Annual NCCTM Conference Erin McNelis Effective Use of Simulations in Teaching Probability and Statistics

ProbabilitySampling and Sample Distributions of the Mean
References
References
I Carlton, Matt; and Mortlock, Mary. “Probability andStatistics Through Game Shows”. Teaching ContemporaryMathematics Conference February 2003.http://courses.ncssm.edu/math/TCMConf/TCM2003/talks%202003/GAMESHOW1 carltonmort.pdf
I Lanier, Susie; and Barrs, Sharon. “Plinko! Probability from aTV Game.”http://mathdemos.gcsu.edu/mathdemos/plinko/
I Rossman, Allan J; Chance, Beth L.; and Lock, Robin.Workshop Statistics: Discovery with Data and Fathom. Wiley,John & Sons, Incorporated. May 2001.
38th Annual NCCTM Conference Erin McNelis Effective Use of Simulations in Teaching Probability and Statistics