effective schools and learners' achievement in botswana - unisa
TRANSCRIPT

EFFECTIVE SCHOOLS AND LEARNERS’
ACHIEVEMENT IN BOTSWANA
SECONDARY SCHOOLS: AN EDUCATION
MANAGEMENT PERSPECTIVE
by
IRENE LEMPHORWANA MOHIEMANG
submitted in accordance with the requirements
for the degree of
DOCTOR OF EDUCATION
in the subject
EDUCATION MANAGEMENT
at the
UNIVERSITY OF SOUTH AFRICA
PROMOTER: PROF SG PRETORIUS NOVEMBER 2008
i
DECLARATION
I declare that Effective schools and learners’ achievement in Botswana secondary
schools: an education management perspective is my own work and that all the
sources that I have used or quoted have been indicated and acknowledged
by means of complete references.
……………………………. November 2008
IRENE LEMPHORWANA MOHIEMANG
3567-960-3

ii
ACKNOWLEDGEMENTS
I am thankful to the Sovereign Almighty God who kept me in a healthy state
during my study. He provided me with the financial resources I needed to
complete this thesis. He in a miraculous way arranged such that I could attend
a course on multilevel modelling at the University of Bristol in England.
I would like to extend my gratitude and appreciation to my promoter, Prof S.G
Pretorius for his scholarly remarks and professional guidance of this thesis. This
work would not have been possible without his prompt and constructive
comments in every submission made.
I am thankful to the staff at Tshwaragano Junior Secondary school for their
kindness and understanding of my need.
I wish to thank the staff at the Botswana Examination Council especially Mr Jim
Jones and Mrs Makobole and Maipelo at Secondary Department, IT division.
I am forever indebted to my family members for their prayers, believing in my
abilities and supporting me every step of the way. I wish to mention Mr L.G.
Mosarwe and Dr M.I. Mosarwe, Jimmy Elliot and Mr and Mrs Themba Chinga.
Special thanks go to Kebuseditswe and his wife Masego for making my short
stay in the UK to be comfortable. May God repay your kindness.
Last but not least is Dr Reason Macheke at the London School of Economics
who took time out of his busy schedule and assisted me with matching student
data and calculating the BGCSE average.
iii
ABSTRACT
This thesis describes the background and findings of a study of effective schools
and learners achievement in Botswana senior secondary schools from an
education management perspective. The aim was to identify schools that
promote learners’ achievement when the students’ initial intakes were
considered. The study was guided by five research questions. The study
adopted an ex post facto design and a quantitative value added methodology to
answer the research questions. Simple random sampling was used to select a
sample of 5662 from the population of 58 032 students who wrote the BGCSE
examinations for 2005, 2006 and 2007. Two sets of data: prior and later
achievements at individual student level were collected from BEC and
Secondary Education. The statistical software, MLwiN 2.10 beta 4, which is
based on hierarchical linear modelling or multilevel modelling, was used to
analyse the data for the value added by schools. The findings indicated that a)
schools differ in their effectiveness. Some schools were more effective than
others; b) Ten characteristics of effective schools were identified from the
literature review c) schools differed in their consistency across the three core
curriculum areas of Setswana, English and Mathematics; d) schools differed in
their stability from year to year and e) schools were differentially effective.
They were effective for the mid ability students and boys more than the other
groups.
The study confirmed that the use of a single statistic measure even in value
added analysis could be misleading because of the internal variations between
departments in schools. Furthermore, the uses of raw results for measuring
school effectiveness were misleading. Some schools which were at the top in
raw results were not doing so well in terms of value added and vice versa. The
value added measures of school performance proved to be the most
appropriate measure of school’s contribution to students’ learning. The value
iv
added by schools is also a measure of schools’ productivity. The study made
recommendations to improve practice, such as the use of appropriate and fairer
methods to evaluate and compare schools. The areas that need further attention
were suggested based on the findings of the study.
Keywords: school effectiveness; value added; school performance; multilevel
modelling; school improvement; league tables; effective schools;
productivity; factors influencing achievement; school comparisons.
v
TABLE OF CONTENTS
CHAPTER ONE: INTRODUCTION AND BACKGROUND TO
THE STUDY
1.1 INTRODUCTION .......................................................................................... 1
1.2 BACKGROUND INFORMATION AND MOTIVATION OF
THE RESEARCH ........................................................................................... 3
1.3 THE RESEARCH PROBLEM ..................................................................... 10
1.4 THE AIMS OF THE RESEARCH .............................................................. 12
1.5 RESEARCH DESIGN AND METHODOLOGY ...................................... 12
1.6 THE SIGNIFICANCE OF THE STUDY .................................................... 14
1.7 DELIMITATIONS AND LIMITATIONS OF THE STUDY ................... 15
1.8 DEMARCATION OF THE RESEARCH ................................................... 15
1.9 DEFINITION OF TERMS .......................................................................... 16
1.10 THE STRUCTURE OF THE THESIS ......................................................... 18
1.11 CONCLUSION ............................................................................................ 19
CHAPTER TWO: A REVIEW OF THE LITERATURE ON
SCHOOL EFFECTIVENESS
2.1 INTRODUCTION ....................................................................................... 21
2.2 THE CONCEPT OF SCHOOL EFFECTIVENESS .................................. 21
2.3 THE CHARACTERISTICS OF EFFECTIVE SCHOOLS ........................ 22
2.3.1 Effective leadership ........................................................................ 24
2.3.1.1 Instructional leadership ..................................................... 24
2.3.1.2 Transformational leadership ............................................. 28
2.3.2 Effective teaching ............................................................................ 30
2.3.3 Pervasive focus on learning ......................................................... 32
vi
2.3.4 Developing staff skills at the school site ..................................... 34
2.3.5 Creating high and appropriate expectations for all ................... 37
2.3.6 Monitoring progress ....................................................................... 39
2.3.7 Emphasising students’ responsibilities and rights .................... 41
2.3.8 Involving parents in productive and appropriate ways .......... 45
2.3.9 Producing a positive school culture ............................................. 48
2.4 CONCLUSION ............................................................................................ 50
CHAPTER THREE: A REVIEW OF LITERATURE ON THE
CONCEPT OF VALUE ADDITION
3.1 INTRODUCTION ....................................................................................... 53
3.2 THE CONCEPT OF VALUE ADDITION ............................................... 54
3.3 THE DEVELOPMENT OF VALUE ADDED MEASURES IN
EDUCATION .............................................................................................. 55
3.4 THE CHARACTERISTICS OF SCHOOLS THAT ADD
VALUE TO LEARNERS’ ACHIEVEMENT ............................................ 58
3.5 THE CONCEPTUAL FRAMEWORK GUIDING THE STUDY ............ 65
3.6 SCHOOL EFFECTIVENESS AND SCHOOL
IMPROVEMENT ......................................................................................... 70
3.7 THE FUNDAMENTAL CONCEPTS OF SCHOOL
EFFECTIVENESS ......................................................................................... 75
3.7.1 Differential school effectiveness ................................................... 75
3.7.2 Consistency in effectiveness .......................................................... 79
3.7.3 Stability in effectiveness ................................................................ 79
3.7.4 The size of school effects ................................................................ 80
3.8 CONCLUSION ............................................................................................ 81
vii
CHAPTER FOUR: RESEARCH DESIGN AND METHODOLOGY
4.1 INTRODUCTION ....................................................................................... 84
4.2 THE RESEARCH DESIGN AND METHODOLOGY ............................ 84
4.3 DETERMINING THE SAMPLE SIZE ...................................................... 86
4.3.1 Target population ........................................................................... 86
4.3.2 Sample size ..................................................................................... 87
4.3.3 Sampling procedure ........................................................................ 89
4.4 DATA COLLECTION ............................................................................... 90
4.5 DATA ANALYSIS ...................................................................................... 91
4.6 RELIABILITY AND VALIDITY ................................................................ 92
4.7 CONCLUSION ............................................................................................ 93
CHAPTER FIVE: DATA ANALYSIS AND DISCUSSION
5.1 INTRODUCTION ....................................................................................... 94
5.2 THE DATASET AND THE REGRESSION MODEL ............................. 95
5.3 THE OVERALL EFFECTIVENESS OF SCHOOLS ................................ 98
5.3.1 School effectiveness in 2005 .......................................................... 99
5.3.2 School effectiveness in 2006 ........................................................ 104
5.3.3 School effectiveness in 2007 ........................................................ 107
5.4 DIFFERENTIAL EFFECTIVENESS ........................................................ 116
5.4.1 Differential effectiveness in 2005 ................................................ 117
5.4.2 Differential effectiveness in 2006 ................................................ 120
5.4.3 Differential effectiveness in 2007 ................................................ 123
5.4.3.1 Differential effectiveness by gender in 2007 .............. 123
5.4.3.2 Differential effectiveness by ability in 2007 ............... 124
5.5 CONSISTENCY ACROSS THE DEPARTMENTS ............................... 132
5.5.1 Consistency among departments in 2005 .................................. 133
5.5.2 Consistency across departments in 2006 ................................... 135
viii
5.5.3 Consistency across departments in 2007 ................................... 137
5.5.4 Overall consistency across the departments for 2005-
2007 ................................................................................................. 139
5.6 STABILITY ACROSS THE YEARS ......................................................... 146
5.6.1 Schools’ stability for 2005-2007 ................................................... 147
5.6.2 Departmental stability ................................................................. 149
5.7 CONCLUSION .......................................................................................... 155
CHAPTER SIX: SUMMARY, RECOMMENDATIONS AND
CONCLUSION
6.1 INTRODUCTION ..................................................................................... 157
6.2 SUMMARIES OF THE RESEARCH FINDINGS .................................. 160
6.2.1 The concept of school effectiveness and characteristics
of effective schools ........................................................................ 160
6.2.2 The effectiveness of secondary schools in Botswana ............. 161
6.2.3 Differential school effectiveness for the different
student groups ............................................................................. 163
6.2.4 Consistency across the core curriculum subjects. ..................... 164
6.2.5 Stability in effectiveness for the three years ............................. 165
6.3 RECOMMENDATIONS .......................................................................... 167
6.3.1 Recommendation to improve school effectiveness ................. 167
6.3.2 Recommendations for the practice of determining the
effectiveness of schools ................................................................ 168
6.3.3 Recommendations for further research ..................................... 168
6.4 CONCLUDING REMARKS .................................................................... 170
REFERENCES ....................................................................................................... 172
ix
APPENDICES
Appendix 1: Calculation of the value added by schools in 2005 ............ 188
Appendix 2: Calculation of the value added by schools in 2006 ............ 192
Appendix 3: Calculation of the value added by schools in 2007 ............ 196
Appendix 4: Differential effectiveness of schools by gender and
ability for 2005 ......................................................................... 200
Appendix 5 Differential effectiveness of schools by gender and
ability for 2006 ......................................................................... 209
Appendix 6 Differential effectiveness of schools by gender and
ability for 2007 ......................................................................... 219
Appendix 7 The value added by subjects in 2005 .................................... 228
Appendix 8 The value added by subjects in 2006 .................................... 232
Appendix 9 The value added by subjects in 2007 .................................... 236
Appendix 10 The schools’ credit passes and ranking for 2005 ................ 240
Appendix 11 The schools’ credit passes in 2006 and 2007 ....................... 241
x
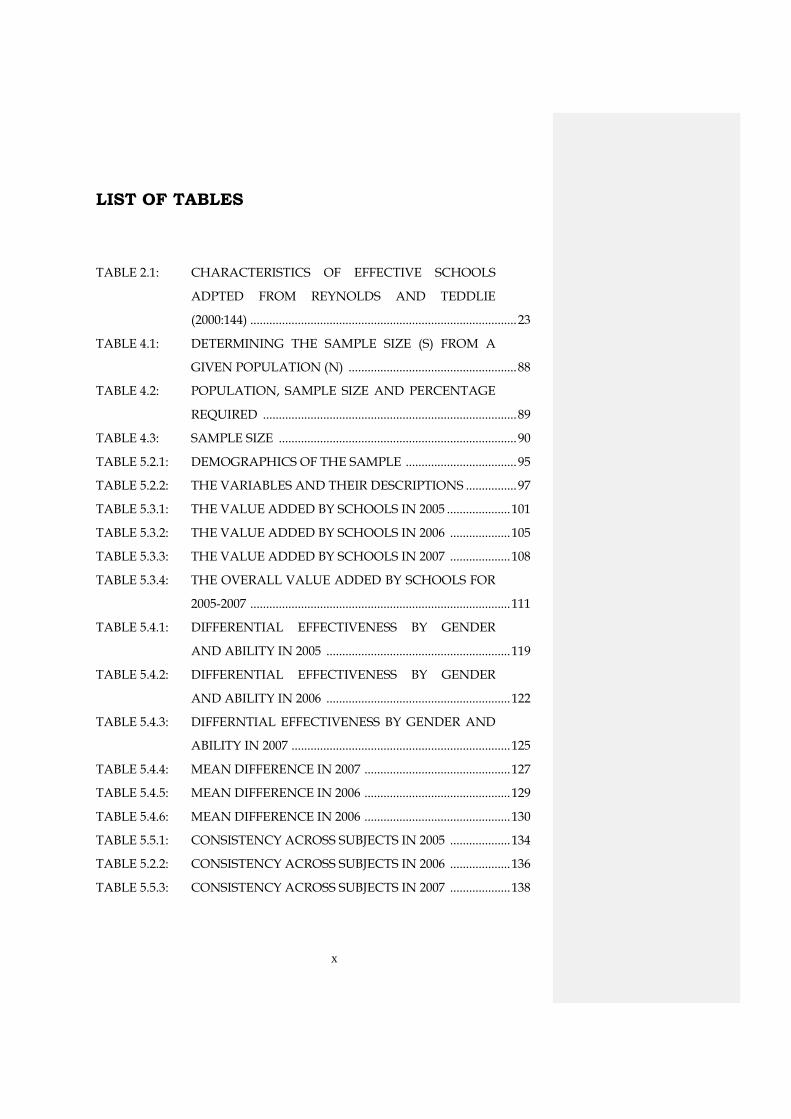
LIST OF TABLES
TABLE 2.1: CHARACTERISTICS OF EFFECTIVE SCHOOLS
ADPTED FROM REYNOLDS AND TEDDLIE
(2000:144) .................................................................................... 23
TABLE 4.1: DETERMINING THE SAMPLE SIZE (S) FROM A
GIVEN POPULATION (N) ..................................................... 88
TABLE 4.2: POPULATION, SAMPLE SIZE AND PERCENTAGE
REQUIRED ................................................................................ 89
TABLE 4.3: SAMPLE SIZE ........................................................................... 90
TABLE 5.2.1: DEMOGRAPHICS OF THE SAMPLE ................................... 95
TABLE 5.2.2: THE VARIABLES AND THEIR DESCRIPTIONS ................ 97
TABLE 5.3.1: THE VALUE ADDED BY SCHOOLS IN 2005 .................... 101
TABLE 5.3.2: THE VALUE ADDED BY SCHOOLS IN 2006 ................... 105
TABLE 5.3.3: THE VALUE ADDED BY SCHOOLS IN 2007 ................... 108
TABLE 5.3.4: THE OVERALL VALUE ADDED BY SCHOOLS FOR
2005-2007 .................................................................................. 111
TABLE 5.4.1: DIFFERENTIAL EFFECTIVENESS BY GENDER
AND ABILITY IN 2005 .......................................................... 119
TABLE 5.4.2: DIFFERENTIAL EFFECTIVENESS BY GENDER
AND ABILITY IN 2006 .......................................................... 122
TABLE 5.4.3: DIFFERNTIAL EFFECTIVENESS BY GENDER AND
ABILITY IN 2007 ..................................................................... 125
TABLE 5.4.4: MEAN DIFFERENCE IN 2007 .............................................. 127
TABLE 5.4.5: MEAN DIFFERENCE IN 2006 .............................................. 129
TABLE 5.4.6: MEAN DIFFERENCE IN 2006 .............................................. 130
TABLE 5.5.1: CONSISTENCY ACROSS SUBJECTS IN 2005 ................... 134
TABLE 5.2.2: CONSISTENCY ACROSS SUBJECTS IN 2006 ................... 136
TABLE 5.5.3: CONSISTENCY ACROSS SUBJECTS IN 2007 ................... 138
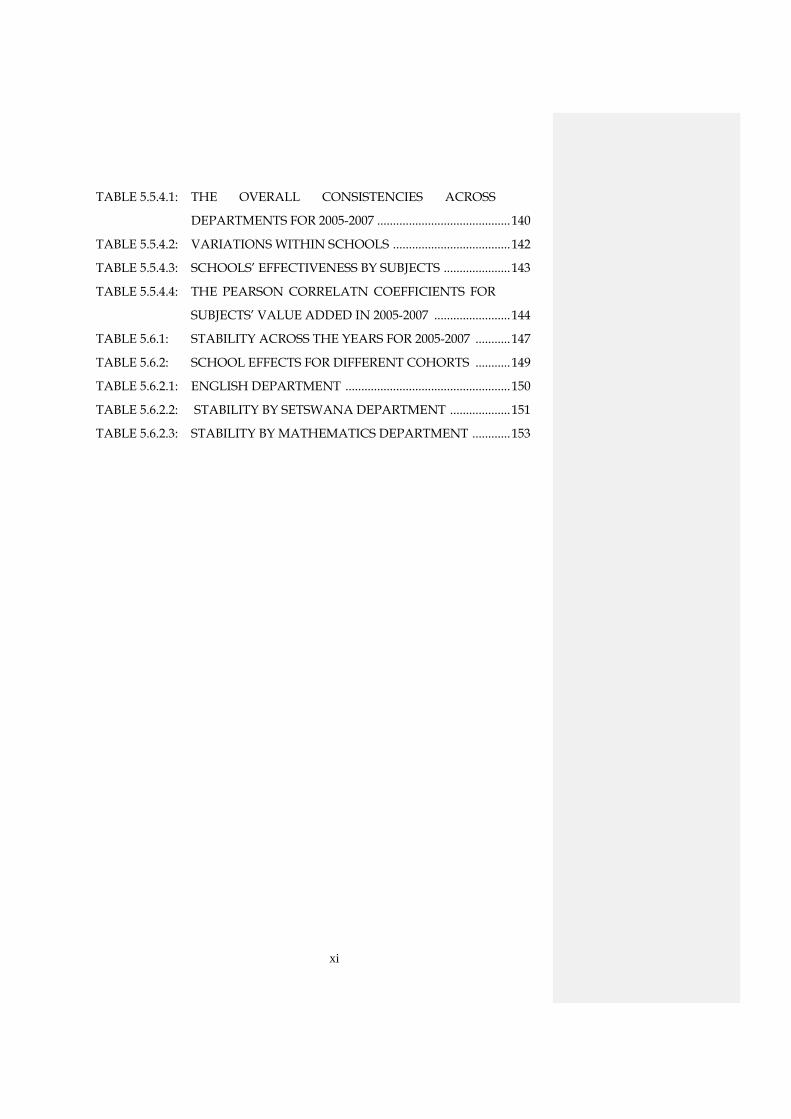
xi
TABLE 5.5.4.1: THE OVERALL CONSISTENCIES ACROSS
DEPARTMENTS FOR 2005-2007 .......................................... 140
TABLE 5.5.4.2: VARIATIONS WITHIN SCHOOLS ..................................... 142
TABLE 5.5.4.3: SCHOOLS’ EFFECTIVENESS BY SUBJECTS ..................... 143
TABLE 5.5.4.4: THE PEARSON CORRELATN COEFFICIENTS FOR
SUBJECTS’ VALUE ADDED IN 2005-2007 ........................ 144
TABLE 5.6.1: STABILITY ACROSS THE YEARS FOR 2005-2007 ........... 147
TABLE 5.6.2: SCHOOL EFFECTS FOR DIFFERENT COHORTS ........... 149
TABLE 5.6.2.1: ENGLISH DEPARTMENT .................................................... 150
TABLE 5.6.2.2: STABILITY BY SETSWANA DEPARTMENT ................... 151
TABLE 5.6.2.3: STABILITY BY MATHEMATICS DEPARTMENT ............ 153

xii
FIGURES
Figure 3.1: A model of secondary school effectiveness adapted
from sammons et al. (1997:170) ....................................................
Figure 5.3.1: The value added by schools and their rankings in
2005 ............................................................................................ 102
Figure 5.3.2: The value added by schools and their rankings in
2006 ........................................................................................... 106
Figure 5.3.3: The value added by schools and their rankings in
2007 ........................................................................................... 109
1
CHAPTER ONE
INTRODUCTION AND BACKGROUND TO THE
STUDY
1.1 INTRODUCTION
School effectiveness research emerged from virtual total obscurity to a now
central position in the educational discourse that is taking place within many
countries (Reynolds, Teddlie, Creemers, Scheerens & Townsend, 2000:3). The
last decade has seen a rapid growth in research and in policy and practitioners’
interest in school effectiveness and its potential as a catalyst for school
improvement. Government policies in the United Kingdom and elsewhere have
sought to draw on school effectiveness and school improvement research in an
attempt to raise educational standards (Sammons, 2006:4).
School effectiveness research has its roots in the quantitative input-output
studies and economic research on educational production functions by
Coleman (in Marzano, 2000:2). The study set out to determine the effect of
inputs such as school resources (financial and material) and student
background characteristics such as socioeconomic status on school outputs.
Coleman (in Marzano, 2000:2) reported that schools had very little influence on
children’s achievement. What mattered most was family background and
societal contexts. The study concluded that the educational process was scarcely
worth the relatively large resources poured into them. This ‘schools did not
matter’ study formed the first phase which was from the mid 1960s to the early
1970s and came to be known as school effects. School effectiveness research
then continued to evolve in distinct but overlapping phases which can be
identified by the type of methodology involved.
2
There was a swift reaction to the above pessimistic conclusions from the
education world. Numerous studies were carried out to refute the schools-
don’t-make- a -difference findings. The studies went beyond the input - output
to include processes. The purpose was to identify the within school factors that
affect students’ achievement. The case study methodology was used to identify
schools that produced favourable outputs when background characteristics
were considered. What emerged from these studies were titles such as ‘schools
matter’ by Mortimore, Sammons, Stoll, Lewis and Ecob (1988) and the ‘schools
make a difference’ by Brookover, Beady, Flood, Schweitzer and Wisenbaker
(1979) and that there are observable regularities in schools that ‘add value’. The
studies concluded that the task of educational policies was to improve all
schools in general and the more ineffective schools in particular (Reynolds et al.,
2000:3). This second phase came to be known as the effective schools research.
In the third phase from the late 1970s to the mid 1980s, the shift of school
effectiveness research was from identifying effective schools to the creation of
effective schools. ‘If individual schools had the authority to make their schools
effective, as suggested by the original effective school descriptions, then
individual schools ought to accept the responsibility for doing so’ (Lezotte,
1989:819). The reasoning was that when the effective school processes are
followed appropriately, school improvement is effected. This was the school
improvement research phase. These three phases: school effects, effective school
research and school improvement are the major strands of school effectiveness
research (Reynolds et al., 2000:4).
The fourth phase of the research, from the late 1980s to the present, has been the
introduction of context variables to the input-process-output model and the use
of advanced sophisticated methods which have an enhancing effect upon the
quality of all the three strands of school effectiveness research (Reynolds et al.,
2000:4). When the context variables and multilevel modelling were introduced
within the input-output (school effects) strand in the mid 1980s, there emerged
a distinctive school of value added or school effectiveness research (Jesson,
3
2000:9-10; Reynolds et al., 2000:12). Peng, Thomas, Yang and Li (2006:137) assert
that the latter school effectiveness research developments fed directly into new
approaches to evaluate school performance and subsequently to wide ranging
policy development into school evaluation in the United Kingdom and
elsewhere.
1.2 BACKGROUND INFORMATION AND MOTIVATION OF THE
RESEARCH
The value added measures of school effectiveness emerged as a result of the
debate surrounding the publication and interpretation of examination results.
There are several different strategies that can be used to interpret examination
results for comparing schools and for accountability. Heck (2000:516) traces
some of these strategies. The easiest way is to compare the schools’ raw scores
with each other or with the national average or local average to make
statements about the effectiveness of each school. This is the standard model. It
is the most commonly used approach, however, it provides a biased view of
what schools contribute to students’ learning because of its failure to consider
the students’ composition or the previous level of achievement. Heck (2000:516)
contends that this approach incorrectly assumes that all the observed
differences in raw scores are due to the differences between schools.
The second approach is to compare schools that have similar students’
backgrounds and contextual factors. Although this approach attempts a more
equitable comparison of schools by matching them in terms of key criteria, a
disadvantage is that it often relies on arbitrary cut points within the data to
form the comparison groups (Heck, 2000:516). This approach also ignores the
hierarchical structure of data (students nested in classrooms within schools).
A third approach is to present exam results contextually based on the kind of
students attending each school and hence allows for ‘like with like’
comparisons to be made. From a policy standpoint, this is an attractive means
4
of determining how much value a school adds to students’ learning given its
particular student challenges. The assumptions underlying a value added
approach is that students’ achievements are significantly affected by their
backgrounds and contextual conditions. Heck (2000:516) asserts that this
approach emphasises “net productivity”.
The school effectiveness research has criticised the first two approaches to
evaluating schools’ performances and to make comparisons between schools.
The major flaw in using raw results to make judgements about school
performance is that they fail to take into account the intake differences between
schools in terms of ability, motivation of students, family background and their
communities (Sammons, 2006:6). It therefore, runs the risk of rewarding
schools for producing ‘good’ results from the quality of their intakes whether
they have taught or not. Although they are good in showing the actual
performance in a subject, they however tell us more about the prior ability of
the students in a school than the performance of the school per se. A high level
of attainment could simply indicate a high quality intake (Gray & Wilcox,
1995:17; Schagen & Schagen, 2005:310). There is therefore no justification for
publishing them alone since they provide little, if any, information about a
school’s performance.
In his report, the late Sir Ron Dearing has warned of the dangers of ignoring
value added evaluations and the reliance on raw results. He argues in Strand
(1997:472) that:
Without a value added dimension, the obvious basis for judgement is
that higher scores represent better practice and lower scores worse. This
could lead to complacency on the part of some schools whose pupil
population comprise more able students, and conversely, to despair on
the part of others, who, however hard they try can never expect to raise
the level of their pupils’ scores to those obtained in schools with more
able pupils.
5
Based on this interim report, a value added approach has received official
recognition in England as a means of overcoming some deficiencies of raw
results. A value added approach is now regarded as the fairest method of
judging school performance and have been published annually for all
government maintained secondary schools since 2002 (Sammons, 2006:6).
Goldstein and Thomas (1996:154) and Sammons, Thomas and Mortimore
(1997:44) conclude that trying to make judgements about the effectiveness of
schools from raw exam results lead to misleading conclusions. In their studies
on the value added by schools and departments, they found that some schools
that were identified as having below average raw results were found to be
performing well in terms of the value they added, while the schools with very
good raw results were performing below expectation when the students’ intake
was considered.
The school effectiveness research argues that any comparison of schools’ results
should be conducted fairly to ensure that ‘like is compared with like’. Nuttall
(1990:25) argues that:
Natural justice demands that schools are held accountable only for those things
that they can influence (for good or ill) and not for all the pre-existing
differences between their intakes. The investigation of differential school
effectiveness, concentrating on the progress students make while at that school,
therefore has a major role to play in the future.
What a school can influence and therefore could be held accountable for is the
progress of learners. For nearly thirty years, research on school effectiveness has
used progress made by students from their level of performance on entry to
their level of performance at the time they leave, rather than their raw results
(Mortimore, Sammons & Thomas, 1994:318). By focussing on progress or value
added by the school, it is possible to investigate whether some schools are more

6
effective than others in promoting their students’ progress and thus their final
level of achievement (Sammons et al., 1997:7).
The Botswana government has set herself goals in every sector of the economy
that need to be achieved by 2016 when the country attains fifty years of
independence. These goals are known collectively known as Vision 2016. For
the education sector, the goal to be achieved is “an informed and educated
nation”. The Ministry of Education and Skills Development realised that for this
goal to be achieved, it will have to deliver its mandate effectively. To this end,
the Department of Secondary Education introduced the pastoral system in all
secondary schools in 2007 to improve the quality of education as a contribution
towards achieving “an educated, informed nation” (Department of Secondary
Education, 2007:1). Pastoral care is concerned with the psycho-social, academic
and co-curricular development of the learner. The academic aspect deals with
instructional delivery and reception of the curriculum. The pastoral policy
states that ‘central to the schools existence is the academic performance and
measures of good performance should include the concept of value addition’
(DSE, 2007:3). According to the policy, the key result areas are: improved school
discipline; improved effectiveness and efficiency in leadership and
management of schools; improved academic performance; and increase in
stakeholder involvement. In addition, the policy outlines the key components
that make the pastoral policy to be effective. Schools are to collect and report
on these components every term to the inspectoral regions which in turn report
to the Department of Secondary Education and to the Ministry of Education
and Skills Development ultimately. The components are: leadership and
management, school discipline; students’ academic performance; guidance and
counselling; stakeholder involvement in school governance; and co-curricular
activities (DSE, 2007:5-6). The department believes that when the pastoral
policy is implemented, it will lead to the best student academic performance
and discipline and hence “an informed and educated nation by 2016”.
7
A study of school effectiveness will help in identifying effective and ineffective
schools. The effectiveness of schools will determine how far the Ministry of
Education and Skills Development is from achieving the aforementioned goal
of Vision 2016. The study will also help in identifying areas where schools will
need to focus to improve students’ achievement if the goal of Vision 2016 is to
be attained.
There are twelve years of basic education in the Botswana education system.
There are seven (7) years of primary education and at the end of this level,
pupils write their Primary School Leaving Examinations. At the moment, there
is a one hundred percent progression rate from primary school to the three
years of junior secondary school (Form one to three). At the end of Form three,
pupils write the Junior Certificate Education examinations. The performance at
this level and the availability of spaces determine the progression into senior
secondary level (Form four -five). To proceed to senior secondary, a pupil
should have obtained grade C or better. The Ministry of Education and Skills
Development has increased access into the senior secondary level by
introducing the double shift programme in some schools. There are basically
two schools in one school in this programme. The ultimate goal is to achieve
one hundred percent progression into senior schools. This means that every
year the pass mark is lowered in order to increase access. Therefore, a lot of
pupils of lower ability level are being admitted into senior schools than before.
The schools have no say in the type of students they get at whatever level. At
the end of senior secondary school in Form Five, students write the Botswana
General Certificate of Secondary Education (BGCSE) examinations. The grades
that can be obtained in individual subjects are: A* to U. The point system ,
where A*=8, A=7, B=6, C=5, D=4, E=3, F=2, G=1 and U/X = 0 is used to
determine the overall performance of each student. The higher the points are,
the better the student’s performance. Progression into tertiary institutions is
largely determined by the performance at this level.
8
The Botswana Examination Council (BEC) publishes the BGCSE examination
results using the percentage of students who have obtained five grade Cs or
better. These are credit passes. The credit passes method is also known as raw
results since the results have not been adjusted to take into account the
students’ background variables. Based on these credit passes, schools are
ranked from highest to the lowest credit pass (cf. Appendix 10). This ranking
produces a league table. The raw results and the league tables are being
criticised by school effectiveness research. The use of the credit passes to make
judgements about the effectiveness of schools has resulted in a number of
issues. Firstly, it has led to unfair comparisons of schools with students from
different backgrounds and different intake abilities. It makes intuitive sense to
say that it is unfair to compare schools’ BGCSE examination results when the
initial intake cannot be compared. The playing ground is not levelled because
‘like is not being compared with like’.
Secondly, while no self respecting education researcher would consider these
raw scores to be indicative of the effectiveness status of a school, lay people,
uninformed government officials and the media often use them as a means of
judging the effectiveness of schools. What is worse is that, the very people who
should inform the rest of the public use these raw scores as measures of
effectiveness. Using the ranking in league tables, some schools were in 2004
identified by the Department of Secondary Education in the Ministry of
Education and Skills Development, as schools whose performances have been
below average for some years and were a concern. Some Education Officers
were then attached to these schools to help them to improve their ranking on
the league tables. In a recent pastoral policy meeting for Senior Management
Teams for secondary schools, some schools were praised by the same
department for consistently showing ‘good’ performance and once again this
‘good’ performance was equated with the position in the league table.
Although the credit passes were used to measure the performance of the 2007
BGCSE exams, BEC did not rank schools into position as in the previous years.
9
This left the media to rank schools and publish the results of the top ten schools
using league tables. One educationist from one senior school attempted a
“value added” analysis in which the value added was the difference between
the school’s final credit passes and the credit passes at intake. The schools were
then ranked into position (Sealetsa, 2008:9) and this was published in one of the
local newspapers. The ‘value added’ analysis produced inaccurate and
misleading conclusions about the effectiveness of schools. Without a proper and
accurate value added methodology, the effectiveness of senior secondary
schools will remain unknown to the teachers, students, school administrators,
the taxpayer, parents and indeed to the Ministry of Education and Skills
Development.
It has already been mentioned that schools are expected to add value to
students’ prior achievement and that ‘measures of good performance should
include the concept of value addition’ (emphasis supplied). A correspondence
from the Central Region to the schools (REF CREOS 1/19/IV (175)) dated 22
May 2008, on the national performance target stated that:
The national target set by the Department of Secondary Education was
80.1% for 2008. The region has adopted the set target and therefore all
schools were argued to put strategies in place to help to achieve this
target. A major component of this target is value addition. The
performance of all students should be tracked to determine if there is any
value addition.
The above statements lead the researcher to ask some questions. What do we
understand by the concept of value addition? How should schools carry out
value added analysis? Will the results by individual schools be a true indication
of a school’s effectiveness? At the moment, the schools which claim to be
carrying it out, use a simple comparison of how many grade As, for example,
have been raised into Merits? If a value added methodology has the potential of
determining the effectiveness or ineffectiveness of schools, why is it left to

10
individual schools? There is therefore, a lot of talk about value addition but no
whole hearted endorsement on helping schools to do it.
The use of credit passes to judge schools’ effectiveness and the inappropriate
‘value addition’ methodologies being used in Botswana by some individual
schools has motivated the researcher to explore the possibility of using
appropriate value added methodology to determine the effectiveness of
secondary schools in Botswana.
In a meeting held by the BEC (Examination Research and Testing Division by
then) in March 2007, it was explained that the method that is being used to
compare schools since 2000, was ‘borrowed’ from the UK but if any school had
a better method to compare schools, BEC would be glad to embrace it. The
credit passes have been supplemented by the value added methodology in
England since 2002 because of the deficiency and inappropriateness of the
credit passes. This crystallised the researcher’s motivation to carry out the
study.
The unadjusted or raw BGCSE exam results measure the students ’actual
performance in the BGCSE exam and not the effectiveness of the school
attended. Can we say with all the certainty that the schools at the top of the
league table are more effective than those at the bottom? Can schools be held
accountable on the basis of this information?
1.3 THE RESEARCH PROBLEM
From the afore-going background information on the school effectiveness
debate and the situation in the Botswana education system, the following
research problem has been identified:
1.3.1 What does the concept of school effectiveness mean and what are the
characteristics of effective schools?
11
1.3.2 In what way can a value added approach to determining school
effectiveness contribute to judging school performance?
1.3.3 How effective are secondary schools in Botswana? Are some schools
more effective than others in promoting students’ progress when the
differences in student intake are considered? Are schools equally
effective/ineffective for all the student groups? Are the schools
consistently effective/ineffective across the core subjects? And are the
schools stable in their effectiveness/ineffectiveness for 2005-2007?
1.3.4 What recommendations could improve the practice of determining
effective/ineffective schools and the performance of secondary schools
in Botswana?
The first question looks at the processes that make school X to be more effective
than school Y as identified by more than two decades of empirical research and
research reviews. The third question asks questions that are fundamental to any
study on school effectiveness. The second part of the question asks whether
schools make a difference. Is there any effect of attending school X than school
Y? The third part of the question is on differential effectiveness. The fourth part
of the question regards the issue of consistency across subjects. This is
important regarding the internal variations in schools. The fifth part of the
question on stability looks at outcomes across years. Are schools that produce
exceptionally good results in one year just as effective in other years? This is
important to determine if a school is improving or declining.
This investigation will answer three important questions that Sammons et al.
(1997:57) and Sammons (2001:14; 2006:11) argue that they should be considered
when making judgements about the effectiveness of schools: Effective in
promoting which outcomes? (the what of effectiveness); effective for which
student groups? (the who of effectiveness) and effective over what time period?
(the when of effectiveness). These questions when answered, provide a focus
for school self evaluation and review and development of improvement
12
initiatives (Sammons, 2007:12). These questions have implications for the
attainment of “an educated and informed nation by 2016”.
1.4 THE AIMS OF THE RESEARCH
From the above mentioned problem questions the following research aims for
this investigation have been adopted:
1.4.1 To explore the concept of school effectiveness and identify the
characteristics of effective schools.
1.4.2 To investigate the possibilities of a value added approach to school
effectiveness in judging school performance.
1.4.3 To determine, on the basis of the literature reviewed and the methods
adopted by a value added approach, the effectiveness/ineffectiveness of
secondary schools in Botswana.
1.4.4 To make recommendations for the improvement of the practice of
determining effective/ineffective schools and thereby the performance of
secondary schools in Botswana.
1.5 RESEARCH DESIGN AND METHODOLOGY
In order to achieve the research aims, the methodology used to achieve each
aim differed. In order to explore the concept of school effectiveness and the
characteristics of effective schools, an extensive literature review was adopted.
The review was based on the recent review of effective school characteristics by
Reynolds and Teddlie (2000:141-144). This is because the review by Reynolds
and Teddlie (2000:141-144) was based on the work by Levine and Lezotte (1990)
and Sammons, Hillman and Mortimore (1995). Each of these two reviews
referred to several hundred studies of effective school characteristics (Reynolds
& Teddlie, 2000:141). In Chapter 3, the review of literature focussed on the
characteristics of schools that add value to students’ prior achievement. An
extensive literature review was also carried out investigate the possibilities of a
13
value added approach to school effectiveness in judging school performance. In
addition, multilevel modelling using a statistical package, MLwiN 2.10 Beta (4)
was applied to the data set collected to investigate the possibility of a value
added approach to judge the effectiveness of schools (cf. 5.3).
Other conditions necessary for a value added approach were also established
(cf. 4.6). From the literature reviewed, a quantitative value added methodology
was adopted to determine the effectiveness/ineffectiveness of secondary
schools in Botswana (cf. 5.2).
To determine the effectiveness/ineffectiveness of secondary schools in
Botswana, data was collected after students had finished their secondary
schooling and therefore, this made the design to be ex post facto. Two sets of
data were collected to determine the relationship between them. This
specifically made the design to be correlational ex post facto. The two
quantitative sets of data were the students’ achievement in Junior Certificate
Education examinations (on transfer to senior school) and the BGCSE
examination results (two years later). These were obtained from the
Department of Secondary Education (admissions) and Botswana Examinations
Council respectively.
The data collected had a multilevel structure, that is, students in departments
and departments in schools, thus multilevel techniques were used. The
statistical package, MLwiN 2.10 Beta (4) based on multilevel modelling,
developed by Rasbash, Steele, Browne and Prosser (2008) from the Centre of
Multilevel Modelling, University of Bristol in the United Kingdom was used.
The research design for the quantitative investigation will be further discussed
in Chapter 4.
The target population was the final year students (Form five) for the 2005, 2006
and 2007 cohorts in all the twenty seven (27) government and government
aided senior secondary schools. A representative sample of five thousand six
14
hundred and sixty six (5662) students was taken from the population of fifty
eight thousand and thirty two (58 032) students using proportionate simple
random sampling.
1.6 THE SIGNIFICANCE OF THE STUDY
The study has some contributions to make both locally and internationally. At
the local level, it has already been mentioned in the introduction, the
contribution this study will make towards the achievement of the “informed
and educated nation” pillar of Vision 2016.
The findings of this study will make a contribution to the ongoing international
debate surrounding the use of schools’ raw exam results as a measure of the
effectiveness of schools. The debate is almost over in developed countries like
the UK where the value added performance by schools has been published
since 2002. The debate is not yet over in developing and third world countries.
The researcher is of the opinion that the study will inform policy development
towards more accurate and reliable measures of school performance, that is,
value added analysis.
Riddel (in Scheerens, 2004:23) observes that a third wave of school effectiveness
research in developing countries is in danger of being lost without ever having
been explored. By the third wave she was referring to the use of multilevel
modelling to measure school effectiveness. This study contributes to school
effectiveness research studies that use sophisticated technique of multilevel
modelling in developing countries.
Scheerens (2000:91) contends that school effectiveness has the potential for
“providing substance to school for the otherwise rather procedure oriented
discipline of school improvement”. The researcher hopes that the results will
stimulate schools’ self evaluation and practitioners’ reflective enquiry to explore
the possible explanations for the school’s results. Schools can focus on changing

15
conditions at the school, department or classroom level for school improvement
to be effective.
1.7 DELIMITATIONS AND LIMITATIONS OF THE STUDY
The study will be delimited to government and government aided senior
secondary schools. It will be delimited to three subjects and three cohorts for
2005-2007. In addition, the value added results from the core subjects will not be
generalised to optional subjects.
Multilevel modelling will give a quantitative measure of the value added by
schools. The schools could be further scrutinised by means of intensive case
studies in order to form a link between the quantitative measure and the
qualitative investigation of processes that make schools to be effective.
However, this study is limited to the quantitative analysis only.
Students’ academic achievement is not the only important goal of education
that can be used to judge school effectiveness. Multiple indicators of school
effectiveness are required such as, attitude to learning, continuation in
education (progression to tertiary level), employment, behaviour, social
functioning and attendance. While these are desirable, academic achievement
still remains the main indicator of school performance and selection into
tertiary placement. The study is narrowed to students’ academic achievement
only.
1.8 DEMARCATION OF THE RESEARCH
The study reported here is on the fourth phase of school effectiveness research
which employs sophisticated statistical methods of multilevel modelling to the
study of school effects or value added. School effects research is concerned with
the scientific properties of school effectiveness, namely; the existence of school
effects, consistency, stability, differential effects and the magnitude of school
16
effects. The quantitative analysis will give answers to these scientific properties
of school effectiveness.
1.9 DEFINITION OF TERMS
The following terms are defined in order to provide an understanding of how
they will be used in this study. The definitions of other key concepts are
presented in the relevant chapters.
School effectiveness
This study will use the most widely accepted operational definition in the
school effectiveness research by Mortimore (1991:9) to define an effective
school. In an effective school students progress further than might be expected
from the consideration of the schools’ intake. According to this definition, an
effective school adds value to students’ prior attainment (Stoll & Fink, 1996:26-
27).
Value added
Value added is a quantitative measure of the relative progress made by learners
in a school over a particular period of time in comparison to learners in other
schools. Since this definition refers to academic achievement, precisely, value
added refers to the relative boost that a school gives to students’ previous level
of attainment in comparison to similar students in other schools. When the
students progress further than might be expected, the value added score is
positive. When the progress is less than expected, the value added score is
negative.
The terms school effectiveness, school effects, effective school and value added
will be used interchangeably in the present research. Therefore, school
effectiveness will be described as the value added effectiveness.

17
School effect
School effects will be defined as the unique effect of schools on individual
students after adjusting for the intake characteristics of the school. There is an
effect associated with attendance at a particular school. This effect is also
technically known as a residual or value added.
Student
The term student will refer to a learner in a senior secondary school. It will be
used interchangeably with pupil. A learner’s achievement will be the Botswana
General Certificate of Secondary Education attainment in core curriculum
subjects and overall BGCSE attainment in all the subjects.
Raw results or credit passes
These are examination results that are aggregated at the school level, such as
the percentage of students getting five grade A*-C (credits). These do not take
into account students background characteristics and prior attainment. These
are the results that are published by the Botswana Examination Council.
League tables
The ranking of schools into position using the percentage of students who have
obtained five or more credit passes. The schools are then ranked from the top to
the bottom with the highest credit passes at the top of the table and the lowest
at the bottom. The league table and raw results will be used interchangeably.
Department of Secondary Education (DSE)
The Department of Secondary Education in the Ministry of Education and Skills
Development has been mandated to plan, formulate programmes, implement,
monitor and evaluate the National Secondary Education System. The major
areas of function are the provision of facilities and quality assurance. At the
moment, the department is challenged with increasing access into senior
secondary schools. To do this, double shift programme has been introduced in
some schools and this will roll unto more schools in due course. In this
18
programme, there is an evening and morning school in one school. To improve
student discipline and academic performance and stakeholder involvement in
secondary schools, the department introduced the pastoral policy in 2007.
Senior secondary school
A senior secondary school is a school that offers the last two years of the 12
years basic education in Botswana. Progression into the senior school depends
on the attainment at the Junior Certificate Education examination and the
availability of places. It offers the Botswana General Certificate of Secondary
Education curriculum. The BGCSE examination is a subject based examination
that was first introduced in 1999. The results from this exam are ‘high stakes’,
that is, they determine placement of students into tertiary institutions.
School Head
A School Head is an individual who is charged with the overall supervision of a
school and he/she is perceived as a leader with the responsibility of running
the day to day functions of the school. In other contexts he/she is the principal
or head teacher. The three titles will be used interchangeably.
1.10 THE STRUCTURE OF THE THESIS
The thesis is organised into six chapters. Chapter 1 provides an introduction to
the study, the problem statement, the research questions and the aims of the
study. The motivation, the significance of the study, research methods and the
limitations are also stated.
Chapter 2 presents a literature review relating to the first research aim, which
was to explore the concept of school effectiveness and identify characteristics of
effective schools.
Chapter 3 presents a literature review relating to the second research aim,
which was to investigate the possibilities of a value added approach to school
19
effectiveness in judging school performance. The chapter also identifies the
characteristics of schools that add value to students’ prior attainment. The
chapter covers the fundamental concepts of school effectiveness research
namely, consistency, differential effectiveness and stability of school effects. The
conceptual model for academic effectiveness in secondary schools is presented
based on Chapters two and three. The chapter links school effectiveness
research with school improvement research.
Chapter 4 discusses the research design and methodology where the
population, sampling procedure, data collection and data analysis methods are
elaborated on. The chapter discusses the reliability and validity of the value
added analysis used in the study.
Chapter 5 deals with the second and third research aims. The second research
aim is to explore the possibilities of adopting a value added approach to judge
schools’ performances. The third research aim is to determine the effectiveness
or ineffectiveness of secondary schools in Botswana, based on the literature
reviewed and a value added approach. The chapter presents the findings from
the quantitative analysis with their discussion.
Chapter 6 is the summary in which the main findings are discussed in the light
of the guiding research questions and the literature review. The chapter makes
recommendations for the improvement of the practice of determining
effective/ineffective schools and thereby the performance of secondary schools
in Botswana. The chapter also suggests areas for further research.
1.11 CONCLUSION
This chapter introduced the study and the background of the study. The study
was motivated by the current use of credit pass method that is used the BEC to
determine the effectiveness of schools. The debate against the use of this
method and the appropriate method to determine schools’ effectiveness were

20
discussed. Four problem questions and four research aims were stated. The
study will make contributions both locally and internationally. One
contribution at the local level will be towards achieving the Vision 2016 pillar of
an “informed and educated nation” Section 1.8 demarcated the study as school
effectiveness research. The next chapter reviews literature on the concept of
school effectiveness.
21
CHAPTER TWO
A REVIEW OF THE LITERATURE ON SCHOOL
EFFECTIVENESS
2.1 INTRODUCTION
Four research aims were stated in the preceding chapter. This chapter covers
the first research aim (1.4.1) on the concept of school effectiveness and
characteristics of effective schools. A review of literature serves different
purposes. A review is conducted to generate a picture of what is known about a
particular study and shares with the reader the results of other studies that are
closely related to the study being reported (Creswell, 1994:20). The chapter
reviews what effective school research has established about the characteristics
of effective schools. The chapter discusses the concept of school effectiveness;
nine characteristics of effective schools; and the conclusion from the literature
review. The literature review from Chapters two and three will provide the
conceptual framework that describes the different levels that are responsible for
creating effective schools. The framework will be discussed in Chapter three.
2.2 THE CONCEPT OF SCHOOL EFFECTIVENESS
There are various definitions of effectiveness from different perspectives.
Creemers and Scheerens (1989:696) assert that the way effectiveness is defined
in the main stream of school effectiveness research conforms to the notion of
organisational productivity and its theoretical background of economic
rationality. The productivity view of effectiveness sees output as the criterion to
judge goal attainment and emphasises the search for organisational
characteristics that maximise output.
22
Scheerens (2000:18) defines school effectiveness as the “performance of the
organizational unit called school”. He also defines school effectiveness as the
degree to which schools achieve their goals in comparison with other schools
that are ‘equalized’ in terms of student intake through manipulation of certain
conditions by the school itself or immediate school context. This definition
implies that a school is effective only when it is compared to other schools
serving similar students.
Stoll and Fink (1996:28) argue that a researcher’s definition of school
effectiveness affects his or her orientation to the study and may in turn have an
impact on the results of such a study. The definition adopted in this study
follows from the research design and orientation of the study, namely, value
addition. For the purpose of this study, a senior secondary school is effective if
it promotes the progress of its students beyond what is expected from them
given their initial achievement and background factors (Mortimore, 1991:9). An
effective school therefore, adds value to students’ initial intake achievement
(Stoll and Fink (1996:26-28). This definition follows from the economic
rationality definition of effectiveness because value added looks at the output of
an organisation and compares it to the input into the organisation. This
definition has an impact on the methodology adopted for this study.
2.3 THE CHARACTERISTICS OF EFFECTIVE SCHOOLS
Research on school effectiveness has yielded an impressive number of school
factors related to learners’ achievement. Creemers and Reezigt (1996:200) argue
that the consistency in the findings might be an indication of the robustness of
these factors. However, they also argue that the similarity might also be due to
researchers who continue to review the same literature, and that the similarity
of the findings may also “point at a research artefact: because these factors were
supposed to influence students’ achievement, they were studied over and over
again, and indeed were found to influence students’ achievement from time to
time”. The reviews by Levine and Lezotte (1990) and Sammons, Hillman and
23
Mortimore (1995) have been comprehensive in that each review referred to
several hundred studies of effective school characteristics (Reynolds & Teddlie,
2000:141). Reynolds and Teddlie (2000:144) distilled the correlates by Levine
and Lezotte (1990:10) and Sammons et al.’s (1995) factors into nine process areas
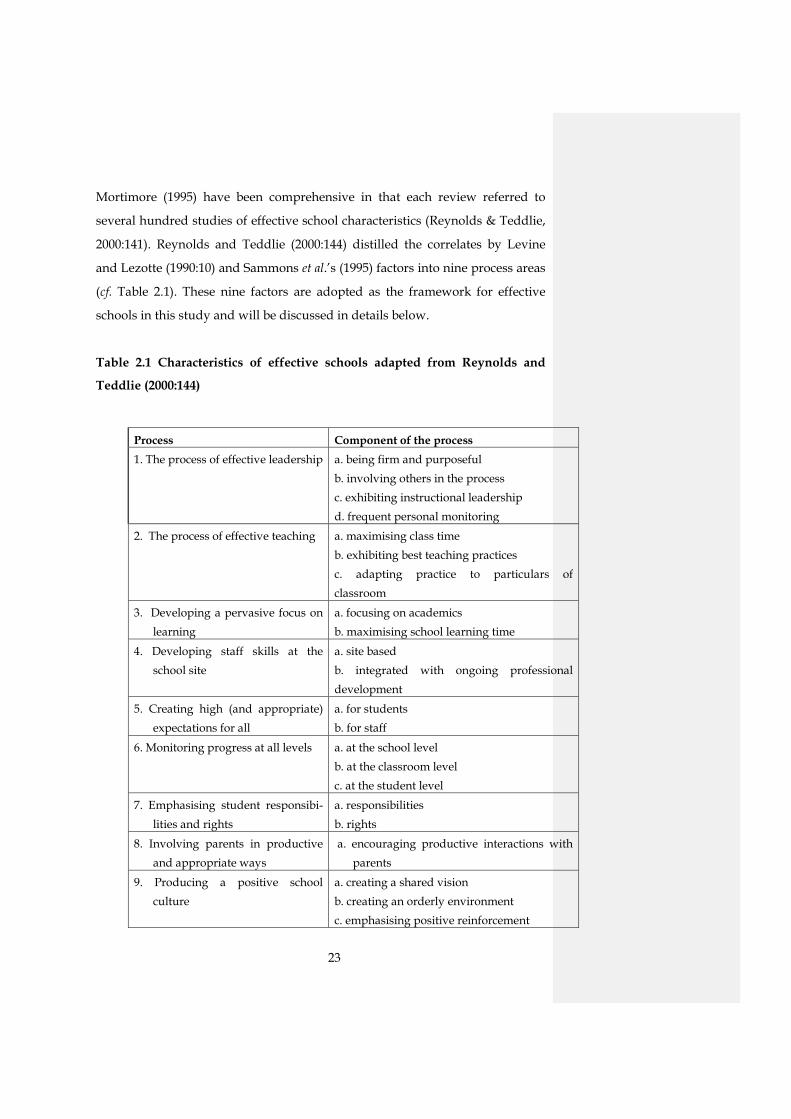
(cf. Table 2.1). These nine factors are adopted as the framework for effective
schools in this study and will be discussed in details below.
Table 2.1 Characteristics of effective schools adapted from Reynolds and
Teddlie (2000:144)
Process Component of the process 1. The process of effective leadership a. being firm and purposeful
b. involving others in the process c. exhibiting instructional leadership d. frequent personal monitoring
2. The process of effective teaching a. maximising class time b. exhibiting best teaching practices c. adapting practice to particulars of classroom
3. Developing a pervasive focus on learning
a. focusing on academics b. maximising school learning time
4. Developing staff skills at the school site
a. site based b. integrated with ongoing professional development
5. Creating high (and appropriate) expectations for all
a. for students b. for staff
6. Monitoring progress at all levels a. at the school level b. at the classroom level c. at the student level
7. Emphasising student responsibi-lities and rights
a. responsibilities b. rights
8. Involving parents in productive and appropriate ways
a. encouraging productive interactions with parents
9. Producing a positive school culture
a. creating a shared vision b. creating an orderly environment c. emphasising positive reinforcement

24
2.3.1 Effective leadership
Hallinger (2007:2) and Stewart (2006:1) state that the past twenty five years have
witnessed the emergence of new conceptual models which focus explicitly on
educational leadership as the manner in which leadership exercised by school
administrators and teachers impacts on students’ outcomes. Two of such
models are instructional and transformational leadership.
2.3.1.1 Instructional leadership
The leadership of the principal needs to focus on the organisational conditions
of the school and in particular, on the way teaching and learning is conducted
in schools. The responsibility of the principal to enhance the school’s teaching
and learning activities emerged in the 1980s as an area of emphasis from the
effective schools research and was termed instructional leadership. Leithwood,
Jantzi and Steinbach (1999:8) define it as an approach to leadership that
emphasises the behaviour of teachers as they engage in activities directly
affecting the growth of students.
Heck, Larsen and Marcoulides’ (1990:120-121) study on the validation of a
casual relationship between instructional leadership and students’ achievement
indicates that principals can directly influence the students’ achievement
through their leadership practices. They assert that their research confirm the
earlier correlational studies, suggesting that strong instructional leadership is
directly related to the school’s performance at a higher or lower academic level.
They conclude that the principal must be considered as one of the ‘school
effects’ variable that directly influences students’ achievement.
The National Staff Development Council (2000:3) asserts that principals who act
as instructional leaders add a focus on helping teachers improve their
classroom performance and make the academic instruction of the school a top

25
priority. Effective instructional leaders spend a lot of time in classrooms
observing teaching and encouraging higher performance. They track students’
test score results and other indicators of students’ learning to help teachers
focus attention where it is needed most. They also focus much of their time on
staff development and help provide opportunities for teachers to share
information and plan together for curriculum and instruction.
Hallinger and Murphy (in Leithwood, 2005:8-9) propose a model of
instructional leadership that consists of twenty specific functions within three
broad categories: defining the school mission; managing the instructional
programme; and promoting school climate. There is considerable empirical
support for this model particularly as it relates to students’ outcomes (Hallinger
& Heck, 1996:38; Hopkins, 2003:59). Leithwood (2005:8-9) describes this model
as:
Dimension 1: Defining the mission of the school includes framing the school
goals and communicating them to all members of the school community. The
principal’s role is to establish the vision, expectations and commitment to the
goals.
Dimension 2: Managing the instructional programme includes knowing and
coordinating the curriculum and instruction; supervising and evaluating
instruction; and monitoring students’ progress.
Dimension 3: At the heart of this model is promoting a positive school learning
climate which includes setting standards and expectations; protecting
instructional time from being disturbed; maintaining high visibility; providing
incentives for learning and promoting professional development.
Waters, Marzano and McNulty (2004:48-52) report on a large quantitative study
which involved 2,894 schools and approximately 1.1 million students and 14
000 teachers to analyse the effects of educational leadership on students’
26
achievement. The study identified 66 leadership practices that were embedded
in 21 leadership responsibilities that emerged from the above mentioned three
dimensions. They report that there were statistically significant relationship
between these leadership practices and students’ achievement. Some of the
responsibilities were: a) A culture which promotes cooperation among staff and
develops a shared vision of what the school could look like; b) Order. The
principal provides and enforces clear structures; c) Discipline. The instructional
time is protected from unnecessary interruptions; d) Resources. The teachers
are provided with the necessary resources to enable them to carry out their role
as educators; e) Focus. There is high expectation for students and teachers and
this is communicated in the school; f) Visibility. The principal maintains high
visibility in the school and visits classrooms; g) Input. The principal involves
teachers in decision making; h) Contingency rewards. The principal monitors
the effectiveness of school practices and their impact on students’ learning; and
i) Situational. The principal is aware of the details and undercurrent in the
running of the school and uses the information to address current and potential
problems. This makes the principal to be proactive.
The study also found that leadership can have different impact on students’
achievement which they termed ‘differential impact’ of leadership. This is to
say that leaders can have a positive and negative impact on students’
achievement. According to this study, there are two variables that determine
whether the leadership will have a positive or negative effect. The first is the
focus of change, whether the change is focused on those aspects most likely to
have an impact on students’ achievement. The second is whether the leader
understands the order of change he/she is leading and adjusts his/her
leadership strategies accordingly (Waters et al., 2004:6). Hallinger and Heck
(1996:38) assert that the principal’s leadership that makes a difference is aimed
towards influencing internal school processes that are directly linked to
students’ learning. These internal processes are concerned with school policies
and norms (for example, academic expectations; school mission; students’
opportunity to learn; monitoring; parental involvement, school climate; and

27
academic learning time); and the practice of teachers (instructional strategies,
classroom management and curriculum design).
Hallinger (2007:3) observes that the focus on the improvement of teaching and
learning has once again brought instructional leadership to the fore. After a
period of decline in popularity during the 1990s, there has been a new and
unprecedented global commitment among government agencies towards
training principals to be instructional leaders. However, the demands on their
time are unceasing and the majority of their work activities maybe unrelated to
instructional leadership. Principals may not be welcomed in teachers’
classrooms and the principals may not be experts in most subject areas. These
make instructional leadership to be a challenge in secondary schools and
principals distance themselves from it.
From what has been discussed above, it is not necessary for principals to be
subject experts or to do classroom observation for them to be effective
instructional leaders. The subject expertise can be left to the senior teachers.
Principals can promote a positive school climate; maintain visibility; etc. The
skills that matter in educational leadership are those that can lead to improved
learners’ achievement. Hopkins (2003:5-6) puts it succinctly by stating that “the
prime function of leadership for authentic schools is to enhance the quality of
teaching and learning”. Effective schools, therefore, have strong instructional
leaders who are sufficiently involved in, and are knowledgeable about what is
going on in the classrooms and the individual progress of all pupils. This means
that instructional leadership is not the domain of the principal only but for the
school management team, which consists of the senior management and the
subjects’ senior teachers. The instructional role of the principal might be
considered to be indirect. His or her role is to ensure that heads of departments
and senior teachers monitor the teaching and learning in their respective
departments (cf. 2.3.5; 2.3.6).
28
2.3.1.2 Transformational leadership
Traditionally, leadership in schools has been associated with positional
authority and was primarily seen as ‘top-down’, that is, the province and
responsibility of the principal. MacBeth (in Harris, 2003b:72) reports on a study
where principals were asked to depict themselves in their schools. They
depicted themselves as being at the top of an apex. This ‘heroic’ view of
leadership as resting on only one person has been challenged. While it cannot
be denied that leaders are inevitably in the midst of the action, effective
leadership is not always derived at the top. Leaders lead from the centre of a
complex myriad of complex relationships.
The second characteristic of effective leadership is the involvement of others in
the process of leadership. Their leadership is dependent upon others and the
relationship they have with others. The principal should make an effort to
develop and secure leadership at different levels of the organisation to impact
on students’ learning. Leithwood, Louis, Anderson and Wahlstrom (2004:7)
assert that successful leaders develop and count on the contributions of others
in the organisation. Barth (1999:17) argues that when teachers lead, principals
extend their own capacity and hence the teacher leadership will have a good
influence on the school as well as within the classroom. Teachers exercise their
leadership role in the classroom when they check on lesson attendance,
implement school and departmental policies, monitor students’ progress and
take the necessary action when there is a need. Teachers themselves need to see
and understand their role as leaders in their own classrooms and they need to
be empowered and assisted to exercise their leadership role.
Shared leadership has been given different names by different scholars. Page
and Wong (2000:2) refer to it as servant leadership, which they describe as
turning the hierarchical pyramid upside down, with the leader at the base of
the organizational roles. This is the opposite of how principals depicted
themselves in the study reported earlier. The relationship between shared
29
leadership and students’ achievement has been established by different studies.
In a study to examine the relationship between servant leadership, school
climate and students’ achievement in 42 Michigan high schools, Kelley and
Williamson (2006:6) found that the school climate became more open as the
leader practiced more of servant leadership. The more of servant leadership the
principal practiced the slight the increase in students’ achievement. Although
the relationship was weak, 1.4% of the variability of students’ achievement
could be explained solely by the servant leadership behaviour of the principal.
Another finding was that the impact on students’ learning was strongest when
the principals combined servant leadership behaviour with an open school
climate. What was most significant was that the actions of the principals had an
impact on both. They finally concluded that, by adopting a servant leadership
approach to their work and by creating a more open school climate, principals
can positively impact the learning of their students. The study found that both
could explain a 7.4% of the variability of students’ achievement.
Shared leadership is also known as transformational leadership. Harris
(2003a:17) argues that in transformational leadership, the leader uses power
with or through other people rather than exercising control over them.
Leithwood et al. (1999:39) and Leithwood and Jantzi (2000:114) define
transformational leadership in schools along six dimensions: building the
school vision and goals; providing intellectual stimulation; offering
individualized support; symbolizing professional practices and values;
demonstrating high performance expectations; and developing structures to
foster participation in decision making. These behaviours encourage teacher
collaboration, increase motivation and improve teacher self efficacy (Harris,
2003a:18). When these processes are integrated and aligned, school
communities will be able to enhance their capacity to improve the learners’
achievement.
Leithwood et al (2004:6) assert that transformational leadership draws attention
to a broader array of school and classroom conditions that may need to be
30
changed if learning is to improve. This makes transformational leaders to be
change agents. They specifically change the school culture to support students’
learning.
In today’s challenging and demanding educational climate of constant and
turbulent change, no single person alone is likely to have the combined
capacities necessary to engage in effective leadership. And it can be legitimately
argued, that in empowering a range of people within the school community:
teachers, students, parents and others as appropriate, a combined richness of
educational thought and activity, superior to that of any single leader can be
achieved. That is, leadership at its best is a shared venture engaged in by many.
The pastoral policy in Botswana advocates for transformational leadership in
schools that have become too big. The leadership should not be the jurisdiction
of one person alone but a shared venture between students and teachers.
Students’ involvement in leadership is through the prefect system, school
council, etc. (cf. 2.3.7). Principals are required to develop school cultures that
empower the whole school community.
In conclusion, the leadership that makes a difference is both position based
(principal) and distributive (administrative team and teachers). Schools need to
be aware and avoid the observation made by Harris and Muijs (2002:3-4) that:
One of the main barriers to teacher leadership is the top-down leadership
model that still dominates in many schools. The possibility of teacher
leadership in any school will be dependent upon whether the head and
the Senior Management Team within the school relinquishes power to
teachers and the extent to which teachers accept the influence of
colleagues… heads will therefore need to become ‘leader of leaders’.
2.3.2 Effective teaching
Creemers and Reezigt (1996:198) assert that in school effectiveness research,
attention for the school is diminishing while classroom level gets more attention
31
than before. Reporting key findings from their different studies and in different
countries, Rowe, Holmes, Smith and Hill (in Rowe, 2004:13); Wright, Horn and
Sanders (1997:63) and Muijs and Reynolds (2001: vii) conclude that effective
schools are only effective to the extent that they have effective teachers. Rowe
(2004:13) reports that further evidence for the importance of teaching on
students’ achievement derived from the VCE Data project showed that there
was more variation within schools than between schools, indicating that the
quality of teaching and learning was by far the most salient factor accounting
for variation in students’ achievement at year 12. Such findings emphasise that,
it is at the level of the classroom that learning takes place and that there can be
very substantial differences in the progress made by students in different
classes within the same school. This proves that teachers can make a difference
and therefore, they have the moral obligation to impact on students’ learning
and it is incumbent upon the principal and the subject leaders through
instructional leadership (cf. 2.3.1.1) to see to it that teachers do exactly that.
There are many variables associated with effective teaching. The school
effectiveness research has endorsed the importance of direct or structured
teaching. In structured teaching, the lesson is first introduced to give the
learners what to expect. The material to be learnt is presented in small steps
with clear and detailed explanations and active learners’ practice after each
step. Throughout the lesson, the teacher checks for understanding by asking
questions and practice exercises where possible and makes summaries and
concept maps to make explicit the connection between the various parts of the
lesson (Creemers, 1994:5; 1996:52). Students need to see this link in order for
learning to take place. The closing of the lesson is as important as the
introduction and the lesson itself. To conclude the lesson, the main points and
concepts will have to be brought together so that they will be organised and
integrated with what students already know. When the lesson is presented in
such steps, learning is maximised.
32
The effectiveness of teaching is also determined by the management of time:
starting and finishing lessons on time; the preparation of lessons in advance;
and the adaptation of the lesson to suit the level of the learners (Muijs &
Reynolds, 2001:37; Reynolds & Teddlie, 2000:146).
2.3.3 Pervasive focus on learning
Reynolds and Teddlie (2000:147) posit that focusing on learning includes the
academic emphasis and maximizing of available learning time which have been
shown to be the core correlates of effective schools. An academic emphasis is
seen through factors such as: use of homework by teachers, which are
frequently checked by the Senior Management Team to ensure that homework
is given and marked accordingly. Homework does not only check students’
understanding but also maximises learning time because some students when
they are not given some work just remain idle.
Effective schools and effective teachers take seriously the link between
classroom practices and students’ learning outcomes (Hopkins, 2001:113). The
school, therefore, promotes effective teaching strategies through staff
development as a sign of a pervasive focus on learning. Hopkins (2001:113)
maintains that schools that add value to the learning, progress and attainment
of their pupils are consistent in their teaching practice. Focussing on learning
also includes high expectations for students and their positive response to the
high demands placed upon them (cf. 2.3.5). The students’ focus on learning is
dependent upon their ability to respond effectively to the task set before them
and also on how well they are able to control their learning. Schools can
maintain a focus on learning by focusing on the positives rather than negatives,
by celebrating success rather than failure, to ensure that this permeates the
whole school rather than the classroom (Hopkins, 2001:172).
Blanchard (2002:29) argues that teachers with a high sense of instructional
efficacy operate on the belief that difficult students are teachable through extra
33
effort and appropriate techniques. Such teachers devote more time to academic
activities, provide students who encounter difficulties with the guidance they
need to succeed and praise their academic achievement. By so doing, the
teachers maintain a focus on learning. The researcher believes that if all teachers
can maintain instructional efficacy, learners’ achievement can be promoted.
Goddard (2000:686) describes academic emphasis as “the extent to which the
school is driven by a quest for academic excellence”. He asserts that in such
schools, teachers set high but achievable goals; belief that their students can
achieve; the school environment is orderly and serious; and students, teachers
and principals pursue and respect academic success. As discussed earlier, the
teachers’ beliefs about students’ capabilities and the importance of academic
performance constitute norms that influence the actions and achievement of
schools.
If a strong academic emphasis is positively associated with learners’
achievement, it is therefore, imperative that schools should be led in a direction
that will systematically develop more emphasis on academics that will lead to
increased students’ achievement. To lead schools in that direction, Goddard
(2000:688) argues that the four sources that build up collective teacher efficacy
can also be applied to academic emphasis: mastery experience; vicarious
experience; social persuasion; and affective states (cf. 2.3.4). These convey
information that influences the teacher’s perception about academic emphasis.
Academic emphasis which helps to shape the normative environment of the
school will have a strong influence on teacher behaviour and, consequently
students’ achievement. In such a climate, both teachers and students are more
likely to persist in their academic efforts. Thus a teacher joining the school with
a high academic emphasis will exert greater effort on his/her work.
Goddard (2000:690-699) concludes that “academic emphasis is a unified
construct that promotes students’ achievement.” In these studies, academic
emphasis is a climate in which teachers believe that students have the
34
capabilities to achieve, and the students work hard to succeed. The learning
atmosphere in such schools is orderly and serious. Academic emphasis is very
similar to collective teacher efficacy (cf. 2.3.4). The only difference is that in
academic emphasis, the students also believe that they can achieve. The
students are then motivated and hence use teachers’ expertise to their
advantage. They also respond positively to the high expectations from the
teachers (cf. 2.3.5).
2.3.4 Developing staff skills at the school site
Developing skills at the school is similar to staff development or a learning
organisation. Sillins, Zarins and Mulford (2002:615) assert that the concept of
schools as learning organisations evolved in response to the difficulties
experienced in bringing about school reform. For this study, the terms
organisational learning and learning organisation will be used interchangeably.
Schools that function as learning organisations are those that have systems and
structures in place that enable people at all levels to collaborate and
continuously learn and put new learning to use (Sillins et al., 2002:616). People
in a learning organisation work together in collaborative teams and engage in
collective enquiry based on best practices for accomplishing their aims and the
current reality of the conditions in their organisations. Any discrepancy
between best practice and the reality of their school causes them to take action
to reduce the discrepancies.
Leadership has emerged as a direct predictor of organisational learning. Sillins
et al. (2002:635) conclude that the level of leadership operating throughout any
one school and its community is a strong predictor of the level of organisational
learning generated in a school. They also found that the level of organisational
learning affected the work of the teachers in the classrooms. Organisational
learning and the instructional work of teachers mediated the school effects on
learners’ achievement in their study. They assert that there is plenty of evidence
to suggest that higher performing schools are functioning as learning
35
organisations. As such, schools that are serving students’ of low academic
ability should continuously learn methods that can be used to impact on
students’ achievement. A learning organisation learns from its mistakes
through school self evaluation.
However, though collaboration and collegiality are advocated for in schools,
both structural and normative factors promote isolation. The physical structures
and layout of school facilities and restrictive time schedules usually hinder such
interactions. The implications for this isolation have far reaching consequences
in schools. Teachers who work in isolation rely on learning through trial and
error approach. Even if they continue to learn by conducting inquiry alone, they
are limited by their ability to recognise problems and personal biases, and the
consequences of various choices of action.
Harris (1999:273) reports on the practices of ineffective departments in
secondary schools. The teachers in these departments taught in isolation from
each other and did not function as a teaching team. There was little opportunity
to build and extend upon good practice within the department. Consequently,
there were no opportunities for any type of pedagogic partnership amongst the
teachers. There was little discussion of teaching approaches, methodologies or
practice. There was also little evidence of sharing classroom practice through
observation, discussion or demonstration. The absence of collegiality or
collegiate working practices within the less effective departments contributed to
their poor performance.
Harris (1999:275) suggests that time has to be set aside for the departments to
engage in collaborative planning and sharing of ideas. To facilitate collaborative
planning and sharing of ideas, the schools’ Senior Management Teams will
have to support the departments through attendance at departmental meetings,
checking departmental documentation and policies to see whether collaboration
is included in departmental plans. The timetable should be restructured to
allow teachers to share, plan and observe one another’s work. However, the
36
discussions about practices of teaching should be separated from judgements
about competences of teachers or else teachers will resent it. Fullan (2001:126)
asserts that once a culture of collaboration is established, teachers are more
likely to trust, value, and legitimise sharing expertise, giving advice and getting
help both inside and outside school. By so doing, the teachers sharpen their
skills and are more likely to become better teachers on the job. This means that
as they become better teachers, learners’ achievement improves.
Mulford (2003:25) equates organisational learning with collective teacher
efficacy and posits that organisational learning or collective teacher efficacy is
the important intervening variable between leadership, teacher work and
students’ achievement. Bandura (1997:477) describes collective teacher efficacy
as a “groups’ shared belief in its cojoint capabilities to organise and execute
courses of action required to produce a given level of attainment”. Within an
organisation, perceived collective efficacy represents the shared perceptions of
group members concerning the performance capability of a social system as a
whole (Bandura, 1997:469). Goddard, Hoy and Hoy (2000:496) describe
collective teacher efficacy as a way of conceptualising the normative
environment of a school and its influence on both personal and organisational
behaviour. In other words, the teachers’ beliefs that they can educate the
learners, constitute a norm that will influence their actions and hence students’
achievement. Based on the self efficacy theory, Goddard et al (2000:498) suggest
that when collective teacher efficacy is high, teachers in a school believe they
can reach their students and they can overcome negative external influences
from the home or location.
According to Bandura (1997:478), collective teacher efficacy, as an important
school property, develops when teachers practice the following concepts: a)
Mastery experience. A resilient sense of collective teacher efficacy requires
experience in overcoming difficulties through persistent effort; b) Vicarious
experience. Teachers do not rely on direct experience as the only source of
information about their collective efficacy. They listen to stories about success
37
in other schools because organisations can learn from observing others; c) Social
persuasion. This is another venue of strengthening the faculty’s conviction that
they have the capabilities to achieve their goals. Talks, workshops, and
professional development opportunities and feedback about achievement can
influence teachers; and d) Affective states. Organisations learn how to adapt
and cope with disruptive forces. The affective state of an organisation has much
to do with how challenges are interpreted by the organisations.
Thus, when new teachers join a school with a strong collective teacher efficacy,
they will be influenced by the culture of the school to exert effort as discussed
earlier. Goddard et al.’s (2000:500-501) study found that collective teacher
efficacy is a significant predictor of students’ achievement and it is positively
associated with the differences in students’ achievement that occur between
schools. The study showed that a one unit increase in collective teacher efficacy
was equal to more than 40% of standard deviation in students’ achievement.
These results are consistent with Bandura’s (1994:89) study which indicated that
collective teacher efficacy was significantly and positively associated with
school level students’ achievement.
Collective teacher efficacy can be learnt through the concepts described above.
Effective schools have high collective teacher efficacy and this propels teachers
to act purposefully to enhance learners’ achievement. School administrators can
help improve students’ learning by working towards raising the collective
teacher efficacy so that it becomes the culture of the school. Ross and Gray
(2006:184) like others, suggest that the timetable in schools should be
restructured to provide opportunities to strengthen collective teacher efficacy.
2.3.5 Creating high and appropriate expectations for all
One of the most important factors in classroom climate and school effectiveness
is the extent to which students feel that they are expected to learn and how this
expectation is being reinforced. Mortimore (1993:295) and Moore (1998:247)
38
argue that students tend to perform at a level which is consistent with a
teacher’s expectation. Furthermore, they tend to perform better and feel more
competent when teachers set high expectations; communicate these
expectations and hold them responsible for achieving them through challenging
teaching. These findings are often referred to as the self-fulfilling prophecy or
Pygmalion effect which was first introduced by Merton in 1986 (Mortimore,
1993:295).
These expectations can either be positive or negative Teachers whether
deliberately or not, communicate the expectations and reinforce them
differently, for example, teachers tend to ask low achievers closed or
convergent questions while open, divergent questions are for the high ability
students. Moore (1998:245) lists ways in which teachers communicate
expectations to students.
Lows are called on less often to answer classroom questions and are
given less wait time to answer questions. This shows that they are not
expecting any answer from them.
Lows are criticized more frequently for incorrect classroom responses
and are praised less frequently for correct responses.
Harris (2001a:89) posits that negative expectations can be a particular problem
in schools in disadvantaged areas. In these schools, low expectation can become
endemic and contribute to consistent under performance. For a pupil who is
regularly taught by a teacher with low expectations, the experience can be
demoralising and too often leads to serious underachievement. This is because
students internalise teacher’s expectations over time and when that happens the
students’ self concept, motivation and achievement may decline gradually until
the student’s ability to achieve his or her potential is damaged. This is a
situation that all teachers must avoid.
Muijs and Reynolds (2001:65) suggest ways of overcoming this problem: a)
Teachers should remember that all students can learn and this should be
39
communicated to students (instructional efficacy, cf. 2.3.3); b) Teachers ensure
that all students get the opportunity to participate in classroom activities such
as questioning and discussion; c) Teachers should be aware of potential
differences in their response to students; and d) Teachers should monitor how
they distribute rewards and punishment to students.
Effective schools do not blame their student intakes but communicate high
expectations to students. High expectation corresponds with a more active role
for teachers in helping pupils to learn while low expectations lead to a passive
approach to teaching. High expectations are more effective when they are part
of a school culture that places demands on everyone in the school; for example,
the principal has high expectations from the teachers through the senior
teachers. Sammons (1999:207) contends that the implication for high expectation
is that, when schools have high expectations for their pupils, they attempt
wherever possible, to provide intellectually challenging lessons for all pupils in
all lessons. However, Sammons (1999:207) argues that high expectations alone
can do little to raise achievement. They are most likely to be effective when
combined with a strong academic emphasis; collective teacher efficacy; a
conducive learning environment; and monitoring of progress. When these are
prevalent in schools, school members are more likely to act purposefully to
enhance students’ achievement.
2.3.6 Monitoring progress
Well-established mechanisms for monitoring the performance and progress of
pupils, classes and the school as a whole are an important feature of effective
schools (Sammons, 1999:209). Harris (2001a:96) notes that effective teachers give
feedback on pupil performance. They diagnose learning needs and note the
progress being made. They also ask specific questions to monitor students’
progress and check their understanding during instructional time (cf. 2.3.2).

40
Monitoring progress can be done through target setting at all levels. Subjects’
targets can be set based on the students’ prior attainment. The targets should
then be communicated to students. For targets to be realistic, they should be
based on the students’ ability. Through high expectations, academic emphasis
and collective teacher efficacy discussed earlier, the students could be
encouraged to reach their targets. The targets also help students to become
more focussed on learning (cf. 2.3.3). Blanchard (2002:15) reports that more
pupils indicated that their targets provided a focus for their efforts and a sense
of progress and satisfaction. Individual students saw them as a great aid to
making progress. He cautions that with individual students setting their own
targets, the teachers must prevent the demotivation that can occur from failing
to reach the targets by helping students to set realistic and achievable targets
and helping them to adjust them where necessary.
Harris (2001b: 484) reports that monitoring students’ progress offered an
important means of self-review within the departments. In addition, it provided
the opportunity to set departmental targets closely related to teaching and
learning. Southworth (2004:60) asserts that monitoring progress includes
analysing and acting on pupil progress and outcome data, for example,
assessment and test scores; pupil attendance data; school performance trend;
and evaluation data. Leadership is stronger when it is informed by data and
such use of data applies to leadership at all levels: principal, deputy, subject
head, and head of department. All of these people should be able to interpret
data and take appropriate action. Action could be remedial teaching by teachers
or classroom observation by senior teachers if students are failing. Monitoring
involves visiting classrooms, observing teachers at work and providing them
with feedback (Southworth, 2004:60). The monitoring of progress should
compare students’ intake performance with their performance in BGCSE tests
and examinations as teaching progresses.
41
2.3.7 Emphasising students’ responsibilities and rights
Students as the number one customer in schools have the right to be involved in
the governance of schools. Effective schools emphasise students’ rights as
learners. The rights go hand in hand with responsibilities. In this study,
students’ right will mainly focus on students’ involvement in school.
Cunningham, Wang & Bishop (2005:2) observe that a number of studies have
highlighted the significant role that psychosocial factors, and particularly those
that are associated with students’ school involvement/engagement play in the
learning process. Willms (2003:9) defines engagement as the extent to which
students identify with and value schooling outcomes and participate in
academic and non-academic school activities. In a broader sense, Willms
(2003:9) also offered a broader definition of student engagement as the students’
attitudes towards schooling and their participation in school activities or simply
as the students’ disposition towards learning. He argued that most recent
studies of student engagement treat it as a predictor of academic achievement
inferring that being disengaged or disaffected from school causes poor
academic performance. These studies concluded that engagement and academic
achievement go hand in hand.
Fredicks, Blumenfield and Paris’ (2004:61) synthesis on research in school
engagement put this body of research into a theoretical framework consisting of
three types of engagement: behavioural engagement, cognitive engagement,
and emotional engagement. Finlay (2006:2) describes behavioural engagement
as doing schoolwork and following rules. The behavioural engagement consists
of positive conduct through behaviours that illustrate effort, persistence,
concentration, attention, asking questions, contributing to class discussion,
following rules, studying, and completing homework. Behavioural engagement
is very similar to focussing on academics discussed in section 2.3.3 above.
42
Cunningham et al. (2005:2) argue that elements of cognitive engagement include
perceptions of connectedness to school, teachers and peers, motivation to learn,
self-esteem and safety. Researchers have emphasised the link between students’
perceptions of school and their motivation, achievement and behaviour. Factors
that are associated with emotional engagement according to Rhodes (2007:9)
include excitement, interest in learning and a sense of belonging. Finlay (2006:2)
includes values and emotions, attitudes towards school and teachers,
identification with school and appreciation of success in school. When a student
achieves good grades the student engagement increases. It is very important for
teachers to have instructional efficacy; high expectations; and positive
reinforcement to increase students’ motivation and subsequently their
engagement.
Fredicks et al. (2004:61) maintain that these types of engagement are
“dynamically interrelated…they are not isolated processes”. The division is
merely to show that engagement is a multi-dimensional construct. Fredicks et
al. (2004:62) also discuss past research in terms of what associations have been
found between the types of engagement and achievement. They conclude that,
there is a body of evidence showing that the relationship between behavioural
engagement and achievement exists but that there may be mediating factors
that influence this relationship, while little convincing evidence has been found
concerning a link between emotional engagement and achievement. This,
however, may be due in part to inconsistent ways in which researchers have
measured what Fredicks et al. (2004:63) conceptualise as emotional engagement.
However, evidence of a relationship between cognitive engagement and
achievement is much stronger (Finlay, 2006:4).
Voke (2002:4) argues that schools that maximise students’ engagement should
have the following characteristics:
All students have opportunities to participate in decision-making
process in the school.
43
Schools should organise themselves as communities that foster caring
relationships between all members of the school community and treat all
students fairly.
Schools should provide a psychologically and physically safe
environment. A safe environment also means that the school should
maintain high discipline.
Voke (2002:4) goes on to say that research on school engagement suggests that
changes in the classroom should be coupled with school wide initiatives, one of
which is the establishment of small schools or schools- within-a school. Small
schools counter the anonymity, alienation, and student disengagement, which
can be associated with large schools. It is believed that when the student body is
reduced, schools are more likely to develop into caring, learning communities
in which teachers and students come to know and care about one another.
According to Akey (2006:5), schools that engage students promote a sense of
belonging by personalising instruction and creating a supportive, caring social
environment where adults are interested in students’ lives. Students who report
caring and supportive interpersonal relationships in schools have more positive
academic attitudes and values and are more satisfied with school. Such
students are more likely to attend school, learn more, and become more
engaged in academic work.
To create the caring and social environment in schools and to promote the
management of secondary schools that have become too large for one person to
manage, the pastoral system has divided schools into mini schools. Each mini
school has less than 500 students, head of house, deputy head of house, teachers
and parents. It is believed that through genuine relationships between students
and teachers, students can be supported and a positive climate will be
generated in the school (Cunningham et al., 2005:3).
The pastoral policy recognises that learners’ involvement in school governance
is an integral part of an effective pastoral programme since schools exist for
44
them (DSE, 2007:6). The policy envisages that since they are the key customers,
they should be involved in decision making in order to enhance ownership and
accountability. The policy advocates for involvement of students in 70% of all
school committees. This means that students have to be involved in almost
every aspect of the running of the school. This involvement in decision making
in schools is the students’ rights and responsibilities. Harris (2001a:114) asserts
that it is important that students are engaged and involved in highlighting
areas for change and development because they are best placed to suggest
improvement, particularly at the classroom level. Listening to students assists
schools in understanding the smaller picture by eliciting their views. It also
contributes to restoring the link between teachers, students and learning.
Students’ involvement in schools is through the prefect system, school pastoral
council, class monitors/monitress, house captains, etc. Students are likely to
develop negative attitudes when they are not involved in decisions that involve
their welfare, and will resist innovations that might be introduced.
In the improving departments study, Harris (2001b: 483-484) reports that:
Those departments that were improving recognised that without a
central focus on teaching and learning, their improvement efforts would
become marginalized…they also engaged in enquiry and had involved
students by consulting them about the quality of teaching and learning
process within the department.
A good practice to emulate from the above study will be for students to
evaluate the quality of teaching in the classrooms. At the moment, students are
doing it through the school council. When this is done formally and
constructively in a class setting, it will assist the teacher improve the quality of
their teaching. The pastoral policy envisages that every student must be
engaged in at least one core curricular activity so as to promote students’
identification with the school and have a sense of belonging. This will reduce
the destructive behaviour of students to schools properties that is costing
government a lot of money.
45
2.3.8 Involving parents in productive and appropriate ways
Reynolds and Teddlie (2000:151) contend that research generally supports the
idea that parental involvement is productive in effective schools while some
studies have failed to find such a relationship. Griffith (1996:39) found a
positive and significant relationship between parental involvement and
learners’ achievement. He argues that parent’s changes in attitude and
behaviour might also be related to student attitude toward school and student
readiness and motivation to learn. Fehrmann, Keith and Reimers (1987:334)
found that parental involvement had a direct effect on the time students spent
doing homework. This suggests that students can learn more when they spend
more time doing homework than watching television, a practice that parents
can monitor. The study also showed that parents can have an important
influence on learning.
Henderson and Mapp examined 31 studies that addressed the connection
between students’ achievement and various parents and community
involvement. The authors report four key findings from these studies which
have been reproduced by the Appalachia Educational Laboratory (2005:5). The
first key finding was that programs and interventions that engage families in
supporting their children’s learning at home are linked to higher students’
achievement. The second key finding was that the continuity of family
involvement at home appears to have a positive influence on children as they
progress through the complex education system. This suggests that the more
families support their children’s learning and educational progress, the more
their children tend to do well in school and continue their education. The third
key finding was that families of all cultural backgrounds, education, and
income levels encourage their children, talk with them about school, help them
plan for higher education, and keep them focused on learning and homework.
In other words, all types of families can and often do have a positive influence
46
on their children’s learning. This was supported by findings from thirteen
researches.
The fourth key finding was that parent and community involvement that is
linked to student learning has a stronger association with achievement than
more general forms of involvement. This suggests that involvement should be
focussed on improving achievement and be designed to engage families and
students in developing specific knowledge and skills. Parental involvement has
also been associated with other key outcomes such as attendance and behaviour
that are also related to achievement.
From the above findings, especially the fourth key finding, parental
involvement that can impact on student learning can be through: checking
homework, discussing progress with teachers during open days, or limiting
viewing of TV on school nights. It will be a good practice to have schools to
organise open days or report collection days whereby, parents and teachers
discuss the performance and progress of students and ways of assisting the
students to learn. Teachers have reported a change in students’ attitude and
behaviour and ultimately improved performance when there is a chance to talk
to both parents and students.
Desforges and Abouchaar (2003:14) carried a literature review on the impact of
parental involvement and learners’ achievement. They argued that early
research in the field showed a variety of inconsistencies and conflicting results
in the field. Some studies found that parental involvement had no effect
whatsoever on pupil achievement, others found striking positive effects whilst
others found negative relationship. Desforges and Abouchaar (2003:14) assert
that the inconsistencies are easy to explain. First, different researchers used
different definitions of parental involvement such as ‘good parenting’, talking
to teachers or through participation in school governance and functions.
Secondly, even for a given definition, different researchers used different
measures of parental involvement. They assert that measuring different things
47
under the same name and measuring the same thing with different metrics
leads to the different inconsistencies.
Desforges and Abouchaar (2003:25) identify four components of parental
involvement as a) parental aspirations for children’s education (parents’ hopes
and expectations for the child’s continuing education); b) parent-child
communication about school related matters; c) home structure( the degree of
discipline exerted by the parents to insist on homework completion and to limit
potentially distracting activities, for example, watching TV); and d) parental
participation in school related activities as referring to parent support for and
participation in school and class functions.
According to Desforges and Abouchaar (2003:29), there is some indication that
parental involvement decreases as children get older. This is because, as
children grow older, the curricula become more difficult and parents lose their
confidence in the ability to help. In such a case, parental involvement could be
in the form of buying extra materials or extra tuition for children if the parent
cannot cope. One other reason is that some schools are far away from the
children’s home and the students are admitted as boarders. The pastoral policy
recognises parental involvement as an attribute of effective schools and
advocates for involvement and active participation of parents in school
governance and the education of their children (DSE, 2007:6). This means that
schools should find ways of involving parents in productive ways even when
the curriculum is beyond the parents. One other measure of parental
involvement since the introduction of cost recovering in education, is the
willingness of parents to pay the subsidised school fees
Reynolds and Teddlie (2000:51) suggest that parental involvement can take
many different forms such as: synchronising school and home demands on
students; using parents as unpaid teacher assistants; raising resources for the
school; assisting with homework and checking homework to see that students
do it and teachers mark it and leasing with their children’s individual teachers.
48
Parents should be more involved with activities that impact more on students’
learning and not only on raising funds, which most PTAs do and neglect the
students’ learning.
Whilst parents may have a desire for more involvement, there are some
material and psychological barriers which operate differentially and
discriminately across the social classes. One of the barriers is parental education
which has been found to be positively related with parental involvement. The
more educated the parents are, the greater is their involvement in their
children’s education. Parental involvement is higher when schools welcome
parents and make it easy for them to be involved. The parents should not be
intimidated by the teachers; neither should they look at each other as rivals but
rather as partners whose main aim is to help in the education of the student.
2.3.9 Producing a positive school culture
Effective schools research has consistently shown that a positive school culture
is essential for learning to take place. When a school opens its door to the
students it begins to have its own culture. Schein (1985:6) defines the culture of
an organisation as the “basic assumptions and beliefs that are shared by
members of an organisation, that operate unconsciously, and that define in a
basic ‘taken for granted’ fashion of an organisation’s view of itself and its
environment”. Holly and Southworth (1989:100) define school culture as the
context and setting of the school, its internal processes and the meaning by
which staff members make sense of their working world. Both definitions imply
a process that is on going and evolutionary in nature, and it is fuelled by
“external pressures, internal potentials, responses to critical events, and
…chance factors” (Schein, 1985:83-84).
Culture is the life-force that pulses through an organisation, the essence that
enables people to work comfortably, to concentrate on their priorities, and to
behave predictably based on organisational assumptions and beliefs. This
49
culture then influences everything in a school such as what people focus on,
what they think, their motivation which in turn affects productivity. Since
culture shapes everything about a school, understanding and shaping the
school culture is pivotal to a school’s success in promoting staff and students’
learning.
The leader’s role in culture building is paramount among other leadership
functions, for it is the leader who drives and sustains the notion of a clear,
shared vision defined and developed by all members of the school. Bulach,
Boothe and Pickett’s (2006:8) study on analysing the behaviour of school
principals found a positive correlation between the overall culture and climate
of the school and the principal style of leadership. Leadership is closely linked
to culture. A study by Gruenert (2005:46) involving 81 schools in Indiana used a
culture survey to investigate the relationship between a school’s culture and
student achievement. The study reports that learners’ achievement in both
Mathematics and language was positively correlated with a collaborative school
culture. He concludes that a collaborative culture depends on the leadership of
the principal. According to Schein (1985:2), leadership and culture are the sides
of the same coin and neither can really be understood by itself. This means that
culture, like the leadership of the principal, is the pulse that directs and reflects
commitment made by the school community to teaching and learning.
The literature on school effectiveness includes reference to and overlaps with
that of school culture. To this effect, Purkey and Smith (1982:68) argue that an
academically effective school is recognised by its culture. Therefore, effective
leadership by the principal is needed in building a positive school culture
through the following: a) collaborative and collegial relationships between
teachers; b) a focus on professional development, staff reflection and sharing of
professional practice; c) traditions to celebrate success or positive
reinforcement; d) shared sense of purpose and values that are consistent across
staff members; e) collective teacher and instructional efficacy and a sense of
responsibility towards students’ learning; f) classroom learning environments
50
where students feel valued and accepted. This improves lesson attendance by
students; g) a high level of discipline in the school; h) student and parental
involvement; and i) a learning organisation. These are the school effectiveness
characteristics that were discussed in this chapter.
Although the literature emphasises the importance of effective principal
leadership in culture building, the researcher believes that building and
maintaining a positive school culture is the responsibility of every member of
the school community because it is through the culture of the school that the
work of the school, which is effective teaching and learning, is accomplished.
2.4 CONCLUSION
Through the review of literature, this chapter defined the concept of school
effectiveness, identified and discussed nine characteristics of effective schools
that set them apart from the less effective schools. This was done with a view to
answer the first problem question. The core factors that have been discussed in
this chapter seem to be robust in that they have endured across various studies
(Lezotte, 1989:819). However, the school effectiveness literature is not
prescriptive but instructive in that it can help in guiding school practice because
schools differ in the way they operate depending on the context they are in.
Stoll and Fink (1996:41) observe that the characteristics of effective schools had
an impact when combined into an overall concept of ethos than the impact of
any individual characteristics.
From the review of literature, the researcher believes that the process in
effective schools can be summed into two factors: effective leadership and a
positive school culture. Reynolds and Teddlie (2000:141) observe that
leadership is centrally synonymous with school effectiveness. The leadership at
the school level by the principal should set the tone for the leadership by the
other members of the school management team, teachers and students.
Effective leadership is judged by what the leader does through articulating the
51
school’s values and reinforcing them at every opportunity. These values need to
be embedded within the institution and shared by staff, parents and students if
they have to promote learners’ achievement. An effective leader produces
leadership in others. The principal is a leader of leaders. This transformational
leadership style encourages teacher collaboration, increase motivation and
improves teacher self efficacy. These constitute a positive school culture which
is a prerequisite for learners’ achievement.
When the leadership at the school management level is right, then all the other
process variables such as student involvement, effective teaching, etc. will fall
in place. The subject leaders will ensure that effective teaching takes place,
students’ progress is monitored through testing and homework, etc. the
students will be involved in decisions that affect them and also voice their
concerns in areas where teaching is not taking place as expected.
The literature on effective schools has had an impact on the development of
educational policies for many countries including Botswana. The Department of
Secondary Education has introduced a pastoral system in secondary schools in
2007 as a way of combating students’ indiscipline and addressing the
leadership of schools that have become too large. When these are improved, it is
believed that learners’ achievement will be improved as well. The pastoral
system emphasised some concepts that were identified as characteristics of
effective schools such as shared leadership, a school culture that should
empower its community, parental involvement, student involvement, safe
environment and a school as a learning organisation. The monitoring of
students’ progress is done monthly and sent to the inspectoral regions. This
monthly monitoring of progress should enable the Department of Secondary
Education to determine whether it is carrying its mandate effectively so as to
achieve the Vision 2016 pillar of “an informed educated nation” (cf. 1.2).
52
This study defined an effective school as a school that adds value to students’
prior attainment. The next chapter will review literature on the concept of value
addition.
53
CHAPTER THREE
A REVIEW OF LITERATURE ON THE CONCEPT OF
VALUE ADDITION
3.1 INTRODUCTION
The preceding chapter discussed the concept of school effectiveness and
characteristics of effective schools, which is an aspect of the first problem aim as
stated in Chapter one. This chapter is a continuation of Chapter two as it
presents literature review on the concept of value addition and characteristics
of schools that add value to learners’ achievement. The fourth phase of the
school effectiveness research, from the late 1980s to the present, has been the
introduction of context variables to the input-process-output model and the use
of advanced sophisticated methods (Reynolds et al., 2000:4). When the context
variables and multilevel modelling were introduced within the input-output
(school effects) strand in the mid 1980s, there emerged a distinctive school of
value added or school effectiveness research (Jesson, 2000:9-10; Reynolds et al.,
2000:12). This study defined school effectiveness as value added effectiveness.
A review of literature on the concept of value addition is appropriate because of
its origins in the economic tradition and therefore has to be defined in
education terms. As stated in Chapter two (cf. 2.1), this review of literature will
guide the study on the design and methodology used in the previous studies on
value addition. The review of literature will partly address the second research
aim which is to investigate the possibilities of a value added approach to school
effectiveness.
The literature review may take different forms and one such form is integrative
(Creswell, 1994:22), where the review is just a summary of past research. The
review in 3.4 will be mainly integrative since the concepts were discussed in
54
Chapter two. The chapter deals with the following aspects: the concept of value
addition; the development of value addition in education; characteristics of
schools that add value; the conceptual model of secondary school effectiveness;
school effectiveness and school improvement; the fundamental concepts of
school effectiveness (stability, consistency and differential effects); size of school
effects; and conclusion.
3.2 THE CONCEPT OF VALUE ADDITION
Mayston (2007:7) asserts that value addition in economic terms refers to the
extent to which the value of the inputs into the production process is increased
when these inputs are transformed into the output of the production process. In
terms of education, inputs into the production process include not only
resources but also pupils with different individual characteristics (cf. 3.7).
Sammons et al. (1997:24) define value added as the “extent to which any given
school has fostered the progress of all students in a range of subjects during a
particular time period”. This definition specifically refers to academic
achievement and can be stated as the “relative boost a school gives to a
student’s previous level of attainment in comparison with similar students in
other schools’’ (Sammons et al., 1997:24).
Strand (1997:472) defines value added as “measures of the educational progress
made by pupils in a school, relative to that made by similar pupils in other
schools”. McPherson (1997:185) uses the term ‘value added’ to refer to the
extent to which schools performed above expectation after allowance has been
made for both the prior achievement of the students and their background
characteristics. He defines value added and added value interchangeably as the
boost a school gives to a child’s previous level of attainment.
Peng et al. (2006:137) define value added “as a quantitative measure of the
relative progress made by pupils in a school over a particular period of time in
comparison to similar pupils in other schools”. They assert that it provides a
55
more valid and appropriate measure of a school’s effectiveness rather than raw
results or assessment results.
The above definitions of value addition have the common aim of assessing the
quality and extent to which schools promote students’ progress from the time
of entry into schools to the time of exit at a particular point. In the above
definitions, the concept of ‘like compared with like’ is used. Students are
compared with similar students by gender, ability, ethnicity, socio economic
status, etc. For the purpose of this study, value addition will be defined as a
quantitative measure of the progress made by pupils in a school when
compared to similar pupils in other schools, taking into consideration prior
attainment and background factors.
3.3 THE DEVELOPMENT OF VALUE ADDED MEASURES IN
EDUCATION
Sammons et al. (1997:25) assert that value added measures rose from a variety of
sources rooted in both academic and policy related issues. One such source is
the availability of sophisticated statistical techniques that were not available
prior to the mid 1980s such as multilevel modelling. From the 1980s, an
international trend towards accountability measures required schools to
publish their results on standardised tests or examination results as an
international trend towards holding schools accountable for the performance of
their students and as a measure of school effectiveness. In the United Kingdom,
the 1980 Education Act and the 1991 Schools Bill required schools to publish
their ‘raw’ public examination results (Sammons et al., 1997:25). Subsequently,
schools’ performance tables were introduced in 1992 to inform parents on their
choice of schools and to urge schools to raise their standards.
There was a reaction to the publication of unadjusted school league tables (raw
results) from the school effectiveness research. The raw results were criticised
for failing to recognise the impact that the initial intake of students can have on
56
later achievement. They were thought to reflect more on the initial intake of
students than what schools contribute to students’ achievement. This led to the
search for fairer and more accurate measures of schools’ performances. Value
added measures were then developed to take into account schools’ initial
intakes when comparing schools’ performances.
Value added measures do not only allow fairer comparisons of institutions to
be made, they also have more benefits which have been identified by different
scholars. Drury and Doran (2003:1) argue that value added measures when
combined with other measures of performance, permit policy makers to hold
teachers and administrators accountable for the value they add to students’
educational experience without penalising or rewarding them for pre-existing
differences in their students’ background and ability. Downs and
Vindurampulle (2007:4) outline the possible uses of value added measurement
such as:
1. A tool for school improvement.
As a tool for school improvement, it can indicate in which areas and with which
students schools are performing well or below expectation. This can assist in
directing efforts and resources to improve learners’ achievement. Value added
information is therefore a tool for analysing a school’s performance.
2. Informing policy making
Value added measures can be used to provide information on the effectiveness
of policy initiatives. Since value added information yield indicators of school
effectiveness, this can be most useful for education authorities in identifying
schools which are performing significantly below or above expectation.
Remedial action could be directed to the schools performing below expectation.
Drury and Doran (2003:2) believe that value added performance data can play
an important role in aligning district level policies, resources and instructional
strategies with the needs of individual schools.

57
Drury and Doran (2003:2) note that some observers argue that the most
effective teachers identified through value added should be given incentives to
teach low achieving students while others advocate using value added indices
of teacher effectiveness, along with supplementary measures of teacher quality
as the basis for performance based compensation systems. When such time
comes for the Botswana Government to implement performance based related
pay, then value added measures can be very useful for rewarding effective
teachers.
3. Reporting to parents and the community
A value added measure can inform parents and the wider public on the relative
performance of each school. This will help parents to make informed choices
when selecting schools for their children whenever there is that possibility.
However, parents in Botswana do not have much choice to select schools
because students are assigned to schools based on the catchment area. They can
only transfer students from one school to another if there is space for such a
transfer. Value added measures inform parents about the effectiveness of
teachers in raising the achievement level of students.
4. Individualised professional development
Professional development in schools needs to move away from one size fits all,
in which all teachers, regardless of experience and competence receive the same
kind of training (Drury & Doran, 2003:2). Staff development in schools should
reflect the differences in strengths and weaknesses of teachers. Value added
analysis can play a potentially important role in this regard. Based on this, the
Dallas Independent School District uses value added measures to structure in-
service training for struggling teachers (Drury & Doran, 2003:2).
5. For accountability
Mayston (2007:10) argues that one of the potential roles of value added
measures is to provide information to the wider public to promote
accountability. When value added by schools is measured, schools could be

58
held accountable for their performances based on the ability of students at
intake. Sammons et al. (1997:185) argue:
We believe strongly that the proper criterion for measuring school effectiveness
is their impact on students’ educational outcomes, and that measures of
academic progress are important indicators. Schools are thus held accountable
for what they are designed to influence- student progress- which can be seen as
the fundamental pre-existing inequalities in education. They should not be held
responsible for all the pre-existing inequalities in society.
However, the use of value added measures for accountability is still a
controversial debate. Goldstein and Thomas (in Downs & Vindurampulle,
2007:4) argue that research into school effectiveness is a very useful activity in
our attempts to obtain knowledge about a process of education, but a very poor
tool for holding schools accountable. The more recent report by Organisation
for Education Cooperation and Development (OECD) also came to the same
conclusion, that a value added model ‘could best be introduced as a tool to
enhance school improvement efforts rather than as a basis for regulatory
oversight’ (Downs & Vindurampulle, 2007:4).
The researcher believes that value added measures could be used to hold
schools’ accountable for the students they get from the junior schools.
Measuring schools’ contribution to students’ achievement is a central part of
school accountability system. Regardless of the students’ abilities at intake, it is
possible through collective teacher efficacy; high expectations; and effective
teaching to promote learners’ achievement (cf. 2.3).
3.4 THE CHARACTERISTICS OF SCHOOLS THAT ADD VALUE TO
LEARNERS’ ACHIEVEMENT
For nearly thirty years, research on school effectiveness has used progress made
by students from their level of performance on entry to their level of
59
performance at the time they leave, rather than just their raw results at the time
of leaving to judge the effectiveness of schools (Mortimore et al., 1994:318). This
is basically the value added approach although the term value addition was not
used at that time. Although the study by Rutter, Maughan, Mortimore and
Ouston (in Scheerens, 1992:124-126) was limited by the statistical techniques
that were not available at that time, it is considered to be one of the first studies
to determine the value added by schools (Mortimore et al., 1994:319).
The two main research questions of the study by Rutter et al (in Scheerens,
1992:124-126) were to find out the extent to which schools differed in their
effects upon students and what processes could be attributed to the differences.
The study being longitudinal was carried over four years in twelve secondary
schools. The variables for the study were intake measurements; process
characteristics of the functioning of schools; outcome measurement (lesson
attendance, behaviour, delinquency, and examination results); and background
factors of schools which included mean socio economic status, the balance of
school intake regarding intelligence, and ethnicity. The research concluded that
school characteristics strengthen and complement one another and that schools
have either a positive or a negative climate or atmosphere. Their study also
concluded that schools have a significant effect even when the socio economic
status was taken into account. The following were characteristics that made
schools to be more effective than others:
1. The use of rewards and punishment with ample use of rewards, praise
and appreciation.
2. The school environment with good working conditions and good care
and decorations of buildings.
3. High levels of pupils in positions of responsibility.
4. Academic press which involved use of homework, setting clear academic
goals, and high expectations.
5. Effective classroom management, involving preparation of lessons, and
rewarding of good behaviour
6. A combination of firm leadership and teacher involvement
60
7. Good models of behaviour provided by the teacher
The study also revealed the following results that are still relevant today.
1. The secondary schools studied differed in pupils’ behaviour and
educational achievement.
2. Schools which had good achievement also had fewer behavioural
problems
3. The differences between schools in achievement in outcome criteria were
related to the process characteristics in schools that can be manipulated
by the school.
4. The differences in achievement in schools were also determined by the
intake of schools.
5. The difference between schools could not be attributed to difference in
physical and administrative characteristics of schools.
6. Even when intake differences were considered, net differences in schools
remained. This implies that schools differ in their effectiveness.
7. The schools were stable in their differences.
The study’s main conclusion was that schools differed in their effectiveness
even when intake differences were accounted for.
One other value added study was by Mortimore et al. (1988) in fifty London
primary schools. They identified a number of schools which were effective in
both academic and social areas. The study culminated in the title ‘schools
matter’. The school that a pupil attends makes a difference and that some
schools were more effective than others. The effective schools were effective for
all student groups. The study identified twelve effective school characteristics
as listed below. The researchers grouped them into characteristics that concern
school policy (1 to 4), those that relate to classroom policy (5 to 9) and aspects
relevant to school and classroom policy (10 to 12).
1. Purposeful leadership. This was revealed through active involvement of
the head teacher in the school’s work and understanding of the needs of
61
the school. The head teacher was not autocratic but involved others. The
leadership was also demonstrated by an emphasis on the monitoring of
pupils’ progress. Teachers were allowed to attend relevant in-service
courses.
2. Involvement of the deputy head. In schools where the deputy heads
played a clear role, pupils progressed more.
3. Involvement of teachers. In successful schools, teachers were involved in
curriculum planning and decision-making.
4. Consistency among teachers. In schools where all teachers followed
guidelines in the same way, the impact on progress was positive. A
negative impact resulted when there was variation between teachers.
5. Structured sessions. In effective schools, classes were characterised by
work that was clearly arranged and organised by teachers.
6. Work centred environment. A quite work directed atmosphere
prevailed.
7. Pupils progressed more where teachers spend more time discussing the
content and less time on routine matters. The quality of teaching was
very important in promoting pupils’ progress and development. The
progress was greater where students were stimulated and challenged.
Enthusiasm and challenging teaching demonstrated high expectations by
the teacher.
8. Sharp focus within sessions. It was beneficial to centre learning material
on core theme rather than allow pupils to work in groups on different
themes.
9. Maximum communication between teachers and pupils. Students
progressed more when there was more communication and interaction
with the teacher.
10. Record keeping for competent educational administration. Where
teachers reported that they kept written records of work progress, there
was a positive effect.
11. Parental involvement. Schools with open door policy which encouraged
parents to be involved in reading at home; helping in the classroom;
62
school visits; and attendance at meetings to discuss progress tended to be
more effective. However, formal Parents Teachers Associations (PTAs)
were found not to be related to effective schooling. The researchers
speculated that some parents found meetings to be intimidating and thus
were deterred from involvement. They also found that some parents felt
that the PTAs tend to be run by small cliques of parents.
12. A positive climate. An effective school had a positive ethos. The
atmosphere was more pleasant in the effective school. There was less
emphasis on punishment and criticism but more emphasis on rewarding
pupils. Classroom management was seen to be firm but fair.
The other value added study which is germane to this study, was the Forging
Links study by Sammons et al. (1997:1), conducted in ninety four secondary
schools and thirty departments in London. The study was longitudinal and
analysed examination data for three years. Multilevel modelling was used to
determine the value added by different subjects at General Certificate in
Secondary Education (GCSE). Sammons et al. (1997:125) found the following to
be associated with a positive value added outcome.
1. High expectations. In Mathematics, the teachers’ perceptions about the
students’ ability at intake were negative and this led to negative value
added in the subject. The head teacher’s expectation for both students’
behaviour and performance were significantly correlated with the value
added measures of departmental and school effectiveness. When the
expectation was low, the value added results were negative. The Heads
of Departments’ perceptions about the ability of students at intake
significantly correlated with the academic effectiveness measure. When
the students were perceived to be of low ability at intake, the result was a
negative achievement. The results indicate that teachers ought to always
guard against negative perceptions of learners’ ability because they these
perceptions may depress the overall academic effectiveness of the
schools (cf. 2.3.5).

63
2. Strong academic emphasis. There was emphasis placed on goals,
homework and assessment.
3. Shared vision/goals throughout the school and with individual
departments.
4. Clear leadership at the school and departmental levels.
5. An effective Senior Management Team which was evident through team
work and better staff morale
6. Consistency in approach regarding school and departmental polices and
practices.
7. Quality of teaching for all ability groups which was characterised by
work focus; effective control; enthusiasm by the teacher; feedback to
students; effective student groupings; and minimum staff absence. The
staff absences also included dodging of lessons by teachers. In the
effective schools, the dodging of lessons by teachers was not prevalent.
8. Student focused approach which was characterised by a good pastoral
environment and effective staff/student relations.
9. Parental support and involvement was high.
A recent value added study by Heck (2000:538-539) examined the specific
conditions that had an impact on school outcomes and improvement. Schools
that were adding value to students’ achievement were characterised by the
following:
1. Strong instructional leadership by the principal. This was evident
through making students’ achievement a top goal; monitoring teachers’
work; solving problems effectively; and involving others in decision
making to improve the curriculum.
2. Strong emphasis on academics was manifested by the way in which
teachers presented work in class; how students participated in class; and
use of class time.
3. A high expectation for students’ achievement was operational through
teachers’ belief about students; curricular emphasis on developing a
wide range of skills and challenging academic work.

64
4. Frequent monitoring of students’ progress through teacher grading
practices and homework.
5. Positive school climate. The environment was safe and clean. The
buildings were comfortable, and teacher demonstrated caring attitudes.
6. Positive home relations through regular communication. Parents felt
welcomed at school and the school sought parental involvement in
decision-making and school activities.
At the department level, Harris’ (1999:22) research came up with the following
as characteristics of departments that were adding value to the students’
achievement: a) Having a collegiate management style; b) Sharing a strong
vision for the subject; c) Being well organised in terms of assessment, record
keeping, homework and good resource management; d) Having efficient
systems for monitoring and evaluating pupils’ progress which enables the
provision of regular feedback to pupils; e) Operating clear routines and
practices within lessons; and f) Having a strong pupil centred ethos that
systematically rewards pupils and provides them with many opportunities for
learning.
A more recent study by Rumberger and Palardy (2005:2016) on the impact of
compositional effects and students’ achievement in high school found that four
process variables were significant in promoting students’ progress: a) Teachers
expectations about students’ ability to learn. Teachers’ expectations about
students’ ability to learn underscore the importance of teacher efficacy,
instructional efficacy, and a sense of responsibility for student’s learning; b) The
average hours of homework that students completed per week; c) The average
number of advanced courses taken by students in the school. This underscores
the importance of a school’s academic climate; and d) The percentage of
students who reported feeling unsafe at school indicates the importance of
creating a safe learning environment in schools.

65
Feistein and Symons’ (1999:316) study of a value added approach to factors that
have a positive effect on learners’ achievement in secondary schools in Britain
mentioned the influence by parental interest through motivation, discipline and
support. The peer group also had significant effect on attainment.
From the literature reviews in Chapters two and three, it can be concluded that
the following are characteristics of effective schools:
1. Effective leadership by the principal and the Senior Management Team
2. Effective teaching
3. Academic emphasis
4. A positive school culture
5. High expectations
6. Student involvement
7. Monitoring progress
8. A learning organisation
9. Parental involvement
10. Consistency in approach
The above correlates constitute a set of characteristics which must be addressed
collectively if a school is to be effective in promoting learners’ achievement. For
example, effective leadership on its own will not impact on students’
achievement if effective teaching does not take place. Schools need to focus on
the areas that make the biggest impact on learners’ achievement. This is at the
classroom level through instructional efficacy and changing students’ attitude
towards learning. The above factors can be mapped into a conceptual
framework which shows factors at the different levels as shown in 3.5 below.
3.5 THE CONCEPTUAL FRAMEWORK GUIDING THE STUDY
This study has used the operational definition of school effectiveness as value
added effectiveness. This definition depicts schools as production systems in
which inputs are transformed into outputs. This is an economic rationality
66
definition of school effectiveness. Integrated models of school effectiveness
adopt this economic rationality as a framework and the concept of net
productivity as the key element to evaluate their fulfilment (Scheerens, 2000:23).
Moreover, the integrated models incorporate elements of the organisational
theory by studying how inputs and processes produce certain educational
outcomes or output. From the integrated models, the conceptual framework
adopts the Context-Input-Process-Output model. The framework is multilevel
and includes the students, classroom, departmental and school levels. The
underlying assumption in the model is that higher levels, for example,
department and school, should provide facilitating conditions for learning and
teaching at the classroom level (the lower levels). The framework is shown
below as Figure 3.1.
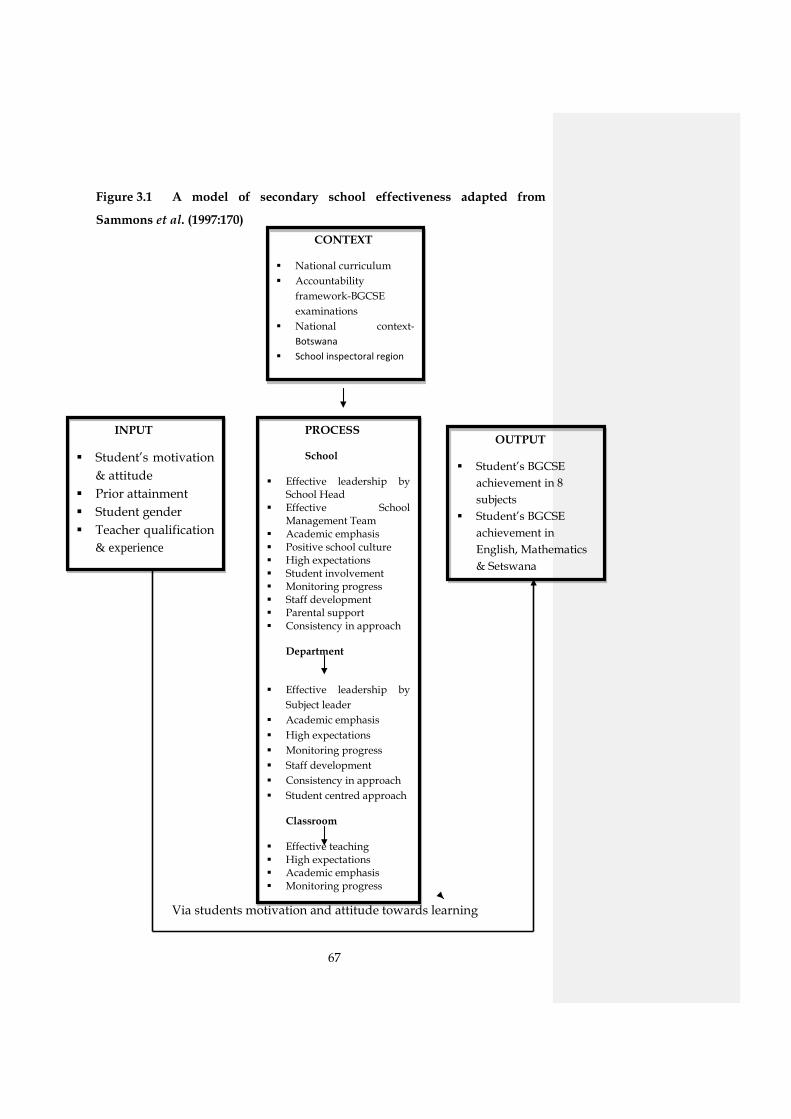
67
Figure 3.1 A model of secondary school effectiveness adapted from
Sammons et al. (1997:170)
Via students motivation and attitude towards learning
INPUT
Student’s motivation & attitude
Prior attainment Student gender Teacher qualification
& experience
OUTPUT
Student’s BGCSE achievement in 8 subjects
Student’s BGCSE achievement in English, Mathematics & Setswana
CONTEXT
National curriculum Accountability
framework-BGCSE examinations
National context- Botswana
School inspectoral region
PROCESS
School
Effective leadership by School Head
Effective School Management Team
Academic emphasis Positive school culture High expectations Student involvement Monitoring progress Staff development Parental support Consistency in approach
Department
Effective leadership by Subject leader
Academic emphasis High expectations Monitoring progress Staff development Consistency in approach Student centred approach
Classroom
Effective teaching High expectations Academic emphasis Monitoring progress
68
The model assumes congruency between the different levels of school,
department and classroom. Sammons et al. (1997:169) found this congruency to
be an important feature of effective schools. The different components of the
model are described below.
Context
The context at the national level is the national curriculum at BGCSE and the
accountability framework is the BGCSE examinations. In this study, the context
also includes the inspectoral region to which the school belongs and the country
in which the study takes place.
Input
Inputs into the education system or school include students with certain
background characteristics they bring to school. These include prior attainment,
gender, age and ethnicity. Students’ attitudes, motivation, behaviour and
attendance can be regarded as inputs which can facilitate or hamper learning.
Nash (2003:446) found that when ability was controlled, students who made
relative progress at secondary school were distinguished by high aspirations,
positive academic self concepts, and a willingness to accept the regime of
schooling.
Creemers (1996:50) asserts that the students’ backgrounds, motivation and
aptitudes strongly determine their learning. Intrinsic motivation is internal and
is what learners bring to the learning environment in terms of attitude, needs
and personality factors. Extrinsic motivation is external and concerns the
environmental factors that help shape students’ behaviour. Teachers can have a
very big effect on the external motivation through their teaching strategies (cf.
2.3.2). Every teacher should strive towards motivating and making students to
be interested in the subject if learning has to take place.
The teachers’ experience and qualification are inputs which can affect the
quality of teaching at the classroom level. In senior secondary schools the

69
playing ground is levelled when it comes to teachers’ qualifications. All
teachers have first degrees. The experience of teachers is not the same; some
schools have more inexperienced teachers than others. This aspect needs to be
addressed by the supervisory and employing bodies since it can affect the
output at the end of schooling. However, when a school has a good mentoring
system in place, inexperienced teachers can be mentored by the more
experienced and good teachers so that they can become good teachers as well.
Process
The processes are the characteristics that affect learners’ achievement at the
school, departmental and classroom levels discussed in Chapters two (cf. 2.3)
and three (cf. 3.4). Classroom processes, especially the quality of teaching, can
directly impact on students’ learning and motivation, which in turn affect
students’ outcome. The behaviour and attendance by students and hence their
learning can be influenced by what teachers do at the classroom level. The
teacher’s attitude, morale and motivation can affect their lesson attendance. As
a Deputy School Head, the researcher has come across instances where teachers
absented themselves from lessons and this led to students’ negative attitude
towards the teacher and consequently on the subject as well. This resulted in
poor performance of the subject affected. This calls for effective supervision
from the subject leaders at the department levels.
Whether or not the value of the output increases will be determined by the
input and processes that are in place at the three levels as well as the learners’
attitudes, motivation and abilities.
Output
The output is the students’ achievement in English, Setswana and Mathematics.
The output which is short term, affects the longer term effects known as
outcomes. Outcomes include placement in tertiary education or job placement.
70
3.6 SCHOOL EFFECTIVENESS AND SCHOOL IMPROVEMENT
The researcher believes that the purpose of conducting a school effectiveness
study is to impart on school improvement. Scheerens (2000:91) supports this
view by stating that the most straightforward applications of the school
effectiveness knowledge base would be the proactive use of the results in school
improvement programmes. This section briefly discusses the relationship
between school effectiveness and school improvement. These two
complementary research traditions have been of interest to policy makers,
practitioners and academics. The impetus to improve schools’ performance and
to raise standards has contributed to the prominence of both fields within the
international research community. Both educators and researchers have
attempted to answer two fundamental questions: What do effective schools
look like? And how do schools improve and become more effective?
The effective school research has been concerned with answering the first
question by identifying factors that make schools effective while school
improvement has been concerned with the processes which enable schools to
achieve their goals in an attempt to answer the second question. Although both
paradigms have the same goal of aiding schools to better teach their students,
there is a significant difference between them. They have different and parallel
orientations intellectually, methodologically and theoretically. As an example,
school effectiveness researchers considered themselves to be mainly
quantitative while qualitative case studies were mainly used by school
improvement researchers. As mentioned earlier, school effectiveness celebrated
the end results of describing what an effective school looks like, while school
improvement concern is to discover what it is that has been done to bring
schools to that state, that is, the journey to effectiveness. These differences and
others, made the traditions to develop separately for long periods of time.
However, in recent years there have been calls from both fields to synthesise the
two bodies of knowledge for mutual benefit.
71
Mortimore (1991:14) has argued for the transferring of ‘the energy, knowledge
and skills of school effectiveness research to the study of school improvement’.
Both traditions have brought essential insights although each has some
weaknesses and limitations. Reynolds and Stoll (1996:94) among others, aim at
encouraging synergy and integration between the two perspectives for the
benefit of the “integrated educational enterprise that we wish for”. Scheerens
(in Sammons et al., 1997:160) argue that “there is nothing more relevant for
school improvement than a well designed programme... built upon the
knowledge of school effectiveness”.
In addition, Huber (1999:23) advocates for ‘dovetailing’ which brings the two
disciplines together without making them lose their identities and that the need
for converging or dovetailing has become urgent in order to proceed forward
(Huber,1999:19). Creemers (2002:344) believes that as school effectiveness
research provides insight and knowledge used in school improvement, school
improvement then becomes a very powerful tool for the testing of theories. The
school improvement can also provide new insights and new possibilities for
effective school factors, which can be analysed further in effective school
research. In recent years, there have been examples of productive operations
between school effectiveness and school improvement in which new ways of
merging the two traditions have been attempted by different researchers in
different countries. Scheerens (2000:91) mentions the Slavin’s Success for All
Programme as a successful programme that integrated the two traditions.
Any new movement from this synergy should lead to effective improvement
and improved effectiveness to provide high quality education for the benefit of
the students. The Effective School Improvement (ESI) project which was funded
by the European Commission, in which eight European Union countries
participated, is another example of attempts to link school effectiveness and
school improvement. The result was the concept of Effective School
Improvement which is defined as “a planned educational change that enhances
student learning outcomes as well as the school’s capacity for managing

72
change” (Creemers, 2002:347). The aim of the project was to develop a strategy
for school improvement that results in effective schools. In this project, the
school effectiveness knowledge base makes clear which factors are important
for effectiveness and it is used to evaluate the school improvement efforts.
Creemers (2002:347) notes that the issue of school culture should not be
neglected if school improvement has to be successful. He notes that when the
school structure, which is often a sign of school improvement is changing while
the school culture does not, the school improvement will be short lived. School
improvement therefore, occurs when the school culture is favourable. The other
requirements are collegiality, risk taking, mutual respect and support,
openness, and an attitude for life long learning. School effectiveness and school
improvement may be linked through school development planning process in
which the focus is on effectiveness issues; readiness for change; ownership
mentality; and a favourable school culture (Creemers, 2002:347).
The definition of ESI highlights the importance of school improvement as a
process of changing school culture. Within the school improvement literature,
the school is viewed as an organic and dynamic culture. The key assumption is
that improvement strategies can result in changing the school culture and that
leadership has an important part to play in defining and shaping culture. The
type of culture that tends to support improvement are those that are
collaborative, have collegial working relationships and have a climate of
change. Therefore, establishing a climate for change is an important
prerequisite for school improvement. The climate should support learning
within the organisation. These factors were discussed in Chapter two as school
effectiveness factors.
For effective school improvement, the change and development should be
owned by the school rather than imposed from outside. This is why the
involvement of all stakeholders is important in order to change the school
culture. There should be commitment from all stakeholders. Without this
commitment, school improvement efforts are likely to fail. This is because
73
school improvement involves a transformation of the attitudes, beliefs and
values that operate within a school. Change should be multilevel, that is, it
should occur at the school (leadership), teachers and students levels. The
students must view the school as a place of learning as teachers improve their
classroom teaching strategies. The focus should also be upon student outcomes
in academic performance as the key success criteria (Harris, 2001a:32). This
implies that the focus should be on the effective school characteristics and
especially those that directly impact on students’ learning such as effective
teaching and learning. Effective school improvement involves some form of
change and therefore requires the schools to manage and implement the change
process. The introduction of the pastoral system in schools in Botswana is a
form of change that schools need to implement carefully if it has to bring
improvement in schools and hence improved learners’ achievement and hence
improved schools’ effectiveness.
The literature on school improvement is emphatic on the following factors
which were also evident from the school effectiveness literature, and were
discussed in Chapter two (cf. 2.3). The following are from the works of Harris
(2001a:116) and Joyce, Calhoun and Hopkins (1999:83).
Effective leadership which is distributed among the teachers in the
school. The leadership is also transformational because it imparts on the
culture to change it or bring school improvement. Harris (2001a:116)
notes that within improving schools, leadership is not a single
responsibility of an individual but a collective responsibility. The
leadership of the school enables the school to become a learning
organisation.

74
Instructional leadership
Effective teaching and learning which involve teacher collaboration,
reflection, action enquiry and classroom observation. These constitute
teacher development which imparts on their classroom practice.
Student involvement
Positive school culture. It is assumed that school improvement strategies
will lead to cultural changes through the modifications to their internal
conditions. It is this cultural change that supports innovation in the
teaching and learning processes that lead to enhanced students’
outcomes.
The above factors indeed show that school improvement and school
effectiveness can learn from each other. Knowledge of what makes schools to be
effective alone will not help schools if schools do not embark on the
improvement journey. Similarly, improvement on its own without knowing
what to improve will be of no good to schools. School effectiveness focuses on
what to change while school improvement focuses on how to change it. Huber
(1999:23) depicts these two paradigms as two individual hands which are
folded in order to balance each other’s.
Effective schools use effective school characteristics in order to pursue their
improvement efforts with a focus on the learning needs of students. School
improvement is about raising student achievement through focussing on the
teaching and learning process and all those conditions which determine and
support it within the school and its system (Huber, 1999:13). School
improvement strategies should focus on how to accelerate students’ progress as
well as establishing effective management practices within the school for
authentic or lasting improvements to occur. School effectiveness and school
improvement therefore, have the same focus of raising students’ achievement.
75
3.7 THE FUNDAMENTAL CONCEPTS OF SCHOOL EFFECTIVENESS
Reynolds et al. (2000:15) assert that the study of school effectiveness research in
the UK remains partially situated within the same intellectual cutting edge
notably in the areas of stability of school effects over time; consistency of school
effects on different outcomes; and differential effects of schools for different
groups of students. Scheerens and Bosker (1997:97-123) consider these as
foundations of school effectiveness (cf. 1.3.3).
3.7.1 Differential school effectiveness
A lot of studies have looked at the question of whether schools promote the
progress of all the students’ groups and whether all subjects foster the progress
of all pupils. The interest has been stimulated by a number of factors. The most
important was the recognition that schools not only differ in their overall
effectiveness but also for different groups of pupils. Nuttall, Goldstein, Prosser
& Rasbash (1989:771) found that some schools were more effective with
particular sub-groups of students than other schools. In some schools, the
effects on reading progress were positive for boys, but negative for girls.
Sammons, Nuttall, & Cuttance’s (1993:402) reanalysis of the Inner London
Education Authority Junior School Project found some evidence of differential
school effectiveness for pupils of differing prior attainment levels. Effective
schools boost the attainment of students from all ability levels, while in the less
effective schools the attainment was lower than predicted for all groups of
students. The same conclusions were later reached by Thomas, Sammons,
Mortimore and Smees (1997:193) and Sammons et al. (1997:52). The differential
effectiveness was prominent for pupils of different abilities at intake.
Differential effects were also found for socio-economic status and gender.
Sammons’ (1995:48) multilevel analysis of longitudinal data on educational
performance of pupils over a nine year period from their year 3 performance in
76
primary school to GCSE performance in year 11, found that gender was an
important predictor of value added in Mathematics. The overall disparities
between boys’ and girls’ performances increased in secondary schooling up to
GCSE.
A study by Office for Standards and Education (Ofsted, 2003: 7) observes that
the gender gap between boys and girls has been apparent in GCSE in England.
When boys enter secondary schools, they are already behind girls in English
although they achieve marginally better than girls in Mathematics. Except in a
number of schools, boys continue to achieve less well than girls in GCSE
examinations. The report states that recent GCSE results show girls doing better
than boys in nearly all the subjects. Even in traditionally male area like resistant
materials, girls have overtaken boys at GCSE. Now it is only in Mathematics
and Science that boys achieve as broadly as girls. Added value for girls is
greater than for boys.
The opposite is true in Botswana schools. The 2006 BGCSE examination
performance showed that the performance of boys (as measured by the % of
students with five grade Cs or better) was slightly better than that of girls. The
report states that this has been the pattern for sometime now. The gap between
male and female candidates has increased between 2005 and 2006. Although
credit passes were used, the results indicate that schools were differentially
effective.
Differential effectiveness by schools can reveal the internal functioning in
schools and classrooms. When schools promote the achievement of higher
ability students only, the cause could be the low expectations for low ability
students and the communication of those expectations to students. As
discussed earlier (cf. 2.3.5), students tend to perform as expected. The progress
of some students and not others has far reaching consequences. This gap in
performance will lead to an imbalance in further education and employment
opportunities. These findings on differential effectiveness point to a need for
77
any study of school effectiveness to examine in detail the value added
performance of different groups of students especially by level of prior
attainment and gender (cf. 5.4).
When considering whether schools promote the progress of all its pupils, there
is a need to distinguish between contextual, situational or compositional effects
from differential effects. Contextual effects relate to the overall composition of
the student body, for example, the percentage of high socio economic status,
percentage of high ability students in a given year or group. The research on
contextual effects has suggested that contextual effects related to ethnicity,
concentration of low ability and low socio economic status can be very
important. Nuttall et al. (1989:774) report that the compositional effect was
evident in their study.
Nuttall et al. (1989:774) and DeFraine, Van Damme and Onghena (2002:403-407)
argue that the composition of the students has an effect over and above
individual students’ characteristics. This effect has greater impact than the
individual students’ impact. Schools with high social class or high ability
intakes have some advantages associated with their contexts (Willms, 1992:4).
This is because schools with high social class or high ability intakes are more
likely to have greater support from parents; cooperation from teachers; fewer
disciplinary problems; and an atmosphere conducive to learning; whereas
greater concentrations of under performing groups will further depress
performance. Low ability students usually give up easily in academics and
mostly cause discipline problems in schools.
One explanation has been offered to explain why social composition matters in
relation to students’ achievement. The effects of composition are directly related
to the influence by peers. Rumberger and Palardy (2005:2007) assert that
students with high achievement and motivation levels can help create a
“culture of success” in schools, while students with low achievement and
motivation levels can create a sense of deprivation and despair. This school
78
wide culture can have a negative effect on otherwise high achieving students in
low achieving schools because it means that the schools are organized around
low expectations and less challenging curriculum. These high ability students
lack competition from others. Even if they don’t get very high marks, they
know they will still be top students. On the other hand, such a school wide
culture can have a positive affect on otherwise low achieving students in high
achieving schools. The composition of schools directly affects students’
achievement through three peer mechanisms: the influence of peers on learning
through in-class and out-of class interactions (e.g., cooperative work groups,
study groups), motivation and aspirations of fellow students. Hecker and
Tymms (2004:179) posit that the general interaction between peers, in
particular, their level of conversation, shared hobbies, books and out of class
activities raises the overall academic performance.
Hecker and Tymms (2004:180) note that other researchers argue that the
interaction between the types of students and the teaching staff results in
changes to teaching techniques; school organization; disciplinary procedures;
school climate or ethos; level of parental involvement; and teacher morale and
commitment. This perspective suggests that the schools’ provision of education
is moulded by the nature of the student body in ways that influence the
achievement of individual pupils within it. In other words, there is a reciprocal
relationship, students ‘react’ to school structures or the process in schools as
well as to their peers, and schools in turn ‘react’ to the composition of the
student body. The nature of the relationship and expectations can lead to
schools becoming differentially effective. Effective schools react positively to
any students’ composition. However, the assigning of learners to schools
should be considered by admissions section in the secondary department.
Schools should share learners of different ability levels to avoid having more
students from the lower ability level in some schools than in others because
these can depress the performance of schools due to the schools’ reactions to
them.
79
3.7.2 Consistency in effectiveness
The concept of consistency of school effects deals with the question of whether
schools are consistent in promoting the progress of students across subjects in a
school. Thomas et al.’s (1997:188-189) study on value added by different subjects
in GCSE found that in some schools, some departments were less effective than
others in promoting the progress of students. They attribute this difference to
factors such as whole school policies, exam entry policies, school development
planning or factors related to what teachers do in departments. Departmental
policies such as remedial teaching, teamwork and effective leadership from the
subject leader account for the differences between subjects within the same
school.
3.7.3 Stability in effectiveness
Stability looks at whether schools or departments promote the progress of the
different cohorts of students. Sammons et al. (1997:48) assert that the question of
stability over time in school effects is of considerable practical as well as
theoretical significance. It is of practical importance because it shows whether a
school is improving or declining in performance which may lead to taking
appropriate remedial action by the school or supervisory departments.
Theoretically, it builds up on the evidence concerning the stability of school
effectiveness. The evidence concerning stability of school effects has showed
that schools results on total GCSE performance are more stable than subject
measures. Subjects fluctuated over the three years and this pointed to the value
and necessity of looking at results in more than just one year. From their study
on differential school effectiveness, Nuttall et al. (1989:775-776) caution “any
study of school effectiveness research that relies on measures of outcome in just
a single year, or just a single cohort of students”.
In terms of stability and consistency, Thomas et al. (1997:193) conclude that only
a minority of schools perform consistently (across subjects) and with stability
80
(overtime). They assert that a reliance on only a single measure of GCSE
performance may mask the differences between departments. This supported
the conclusions reached by Smith and Tomlinson (1989:276); Luyten (1994:213)
and Peng et al. (2006:146-147; 149).
3.7.4 The size of school effects
The school effectiveness research has established that schools differ in their
effectiveness. The literature reviewed in the preceding sections has shown
qualitative differences between effective and ineffective schools in terms of
processes or characteristics. The difference between effective and ineffective
schools can also be quantified, that is, by how much do schools differ? This
study has adopted a quantitative definition of value addition. It is therefore
appropriate to review what other studies have found to be the quantitative
differences between schools.
Teddlie et al. (2000:90) observe that the estimation of the magnitude of school
effects has been a controversial issue since the 1966 Coleman’s report. Specific
methodological decisions can influence the estimation of school effects. The
magnitude of school effects varies across several different ‘contexts’; by
socioeconomic status of students; by phase of schooling; and the country in
which the study was conducted (Teddlie et al., 2000:75). Teddlie et al.’s (2000:77-
90) review of several studies has quantified the size of school effects as 5-18%.
Some studies have reported effect sizes of around 2%. This has led a number of
critics to argue that the effect sizes are trivial and thus conclude that schools
have little impact compared to background characteristics. However, these
effects determine the difference between success and failure and show that
schools matter. There remains a significant impact of schools even when intake
differences are controlled for.
Rutter et al. (1979:19) conclude from their study that after adjusting for intake
characteristics, children at the most effective schools got four times as many

81
exam passes on average as children at the least effective schools. Scheerens
(1992:71) concludes that the effects of schools equates to an entire year’s
difference in the experience of a student in the most effective school as
compared with students who are unfortunate enough to attend one of the least
effective schools.
When using the (B)GCSE point scale where A*=8, A=7, B=6, C=5, D=4, E=3,
F=2, G=1, and U=0, Gray, Jesson and Sime (1995:145-147) report that the
advantage of a student attending a more effective school was 4 points. In other
words, pupils attending more effective schools could be expected to obtain
grade enhancement from D to B in two subjects or one grade D to C in four
subjects compared to pupils in less effective schools. Sammons et al. (1997:44)
found that the difference in attainment between the most and least effective
schools was 10 or more (B)GCSE points (difference between six grade Bs rather
than six grade Ds) for a student of average ability. Hopkins’ (2001:46) later
research suggests that the difference in performance by the most and least
effective schools is equivalent to 7 (B)GCSE grade Cs as compared to 7 grade Es.
This is a difference of 14 points.
These differences are significant both statistically and educationally, especially
in high stakes examinations like BGCSE which are used to classify, select or sort
students for further tertiary placement. They can enhance or depress such
placement and consequently employment prospects. Schools therefore, have a
moral and professional obligation to enhance the quality of education offered to
their students.
3.8 CONCLUSION
The chapter reviewed literature on the characteristics of schools that add value
to students’ achievement. The factors were similar to the nine factors identified
and discussed in Chapter two. Consistency in approach was found to be an
important characteristic of schools that add value to students’ achievement.
82
Barker, Wendel and Richmond (1999:52) content that if schools want to move in
the direction of providing value added outcomes, the ten characteristics of
effective schools need to be addressed. From these two chapters, the study
adopted a multilevel context- input-process-output model to explain the factors
that promote learners’ achievement in secondary education. The basic
assumption is that the higher levels will support teaching and learning at the
classroom level.
The chapter also reviewed the link between school effectiveness and school
improvement and the review showed that the two traditions need each other
for mutual benefit. The school effectiveness has identified factors that school
improvement process needs to tackle in order to achieve positive learners’
achievement and lasting school improvement. School improvement also
emphasises a cultural change through transformational leadership for
improvement to be effective and long lasting. School improvement emphasises
on conditions that impact more on the classroom teaching and learning.
This chapter traced the development of the use of value added measures in
education. They came as a reaction to the misleading nature and deficiencies of
league tables. From the literature, it is apparent that value added measures
have more benefits than the traditional method of using the proportion of
students who obtained five or more credit passes to judge schools’
effectiveness. They show the contribution schools make to learners’ intake
achievement.
It is evident that schools differ in their effectiveness for different groups of
students. This is an important issue for those dealing with equity and equal
opportunities. A challenge facing education sector in Botswana as we move
towards Vision 2016 is equity. It is therefore very important that any study of
school effectiveness should investigate whether the schools are effective for all
student groups with the potential of schools’ self review.
83
As indicated in 3.1, one purpose of a literature review is to guide a study on the
appropriate research design and methodology that were adopted by previous
studies. The review of literature indicated the appropriate design and
methodology of a value added study. The next chapter will describe the
research design and methodology of this study.
84
CHAPTER FOUR
RESEARCH DESIGN AND METHODOLOGY
4.1 INTRODUCTION
The previous chapter reviewed literature on the developments of value added
measures in education and studies that have adopted value added
methodology to measure schools’ effectiveness. This chapter discusses the
research design and methodology of the present study. Brink and Wood
(1994:100) assert that the purpose of a research design is to provide a plan for
answering the research questions. It is therefore a framework or blue print with
a set of instructions to the researcher which details what data is needed and
how to collect and measure it to ensure its accuracy and reliability. The research
design is usually based on previous research findings (Brink & Wood, 1994:102)
and hence can guide the procedure for data analysis. The research design and
methodology outlined in this chapter are based on the value added studies
reviewed in Chapter three. Before the quantitative can be carried out, it is
necessary to describe the data and how it was obtained. Specifically, the chapter
will describe the research design and methodology; the population; sample and
sampling procedure; data collection procedure; data analysis technique;
reliability and validity of the statistical technique used to analyse the data; and
conclusion.
4.2 THE RESEARCH DESIGN AND METHODOLOGY
Brink and Wood (1994:105) argue that all data can be described according to
whether it is collected via qualitative (qualities) or quantitative (numerical)
methods. Therefore, all studies can be classified as either qualitative or
85
quantitative depending on the type of data collected. This research used
numerical measures of students’ prior and later attainments. This is
quantitative data and therefore it makes the research to be mainly quantitative.
A quantitative research enables the researcher to make generalisations from the
sample to the target population (Gunter, 2002:227).
Sammons et al. (1997:14; 25) and Teddlie, Reynolds and Sammons(2000:123)
argue that the most appropriate studies of school effectiveness adopt a
longitudinal approach and look at the full period of time students are in
secondary schools. In a similar vein, Goldstein (1997:376) reiterates that studies
of school effectiveness should be longitudinal so that pre - existing students’
differences and subsequent contingent events among institutions can be taken
into account. Longitudinal studies follow subjects for a period of time to obtain
repeated measures (Brink & Wood, 1994:104). The changes in the variables or
achievement are established. However, a longitudinal study was not possible
for this study because the time students spend in senior secondary schools is
short and only one national examination is administered at the end of the two
years in Form five and hence it was not possible to obtain repeated measures of
standardised national examinations.
According to Brink and Wood (1994:103), the research design can be named
based on the timing of the data collection. The studies that focus on the events
that have occurred in the past are retrospective or ex post facto. Cohen and
Manion (1994:146) assert that ex post facto indicates that data are collected after
a presumed cause has occurred. The researcher takes the effect or dependent
variable and examines the data retrospectively to find out what factors seem to
be associated with certain occurrences, conditions or aspects of behaviour. In ex
post facto design, the researcher cannot manipulate the possible antecedents of
events that have already happened. The research design of this study is ex post
facto in that the data collected focussed on the students’ outcomes at the end of
their secondary schooling and so the results relate to a previous period of each
school’s history (Sammons et al., 1997:30). The design is specifically, casual or
86
co-relational ex post facto. Casual ex post facto involves the collection of two
sets of data, one of which will be retrospective, with a view of determining the
relationship between them (Cohen & Manion, 1994:147). The two sets of data
collected for this study were retrospective in that they referred to past
performances in JCE exams and BGCSE exams (cf. 1.5). To determine the
relationship between the two sets of data, namely the JCE and BGCSE exam
results, a quantitative value added methodology was adopted (cf. 1.5). The
research design was therefore quantitative ex post facto.
4.3 DETERMINING THE SAMPLE SIZE
4.3.1 Target population
The target population for this study was the Form Five students in all twenty-
seven government and government aided senior secondary schools located in
five inspectoral regions in Botswana who wrote the BGCSE examinations in
2005, 2006 and 2007. Three years is the minimum required to identify a linear
trend in effectiveness (Sammons et al., 1997:49). The number of students for the
three years was 17,855; 18,101 and 22,067 respectively. The population
therefore, consisted of fifty eight thousand and twenty three (58,023) students.
Mertens (1998:255) makes a distinction between the target population and the
experimentally accessible population. The latter is the list of people or elements
(sampling frame) that fit the conceptual definition of the target population and
the researcher has access to. When the accessible population represents the
target population, population validity is established Mertens (1998:255). In this
study, the validity was established since the researcher had access to all the
names of students in the accessible population which was also similar to the
target population.
87
4.3.2 Sample size
Researchers are often faced with the question of how large a sample must be.
Cohen and Manion (1994:89) assert that there is no clear cut answer to this
question, for the correct sample size depends on the purpose of the study and
the nature of the population under scrutiny. The size of the sample depends on
a number of factors which can include cost, time, energy and statistical power
(Hill, 1998:3). However, different scholars have given different guidelines
which researchers can follow when deciding the sample size. Leong and Austin
(1996:102) posit that a pragmatic rule of thumb is to adopt the sample sizes
observed during the review of literature while Hill (1998:3) asserts that the
number of respondents accepted for a study depends on the type of research
involved.
Hill (1998:3) maintains that when a researcher is faced with making a choice
between different factors such as between the economy and convenience of
small samples, replicability and representativeness of large samples, the best
choice will be to balance practical considerations against statistical power and
generalisability. He goes further to say that increasing sample size will increase
the statistical power. A few others believe that the larger the population, the
larger the sample should be (Cohen & Manion, 1994:90; Bryman & Cramer,
1997:103). Choosing a big enough sample is critical when a researcher wants to
use inferential statistics. My Environmental Education Evaluation Resource
Assistant (MEERA, 2007:5) points out that inferential statistics allows the
researcher to test whether there are significant differences between groups, for
example, girls versus boys. On the other hand, Krejcie and Morgan (in Hill,
1998:3) produced a table that researchers can use to select samples that will be
representative of the population.
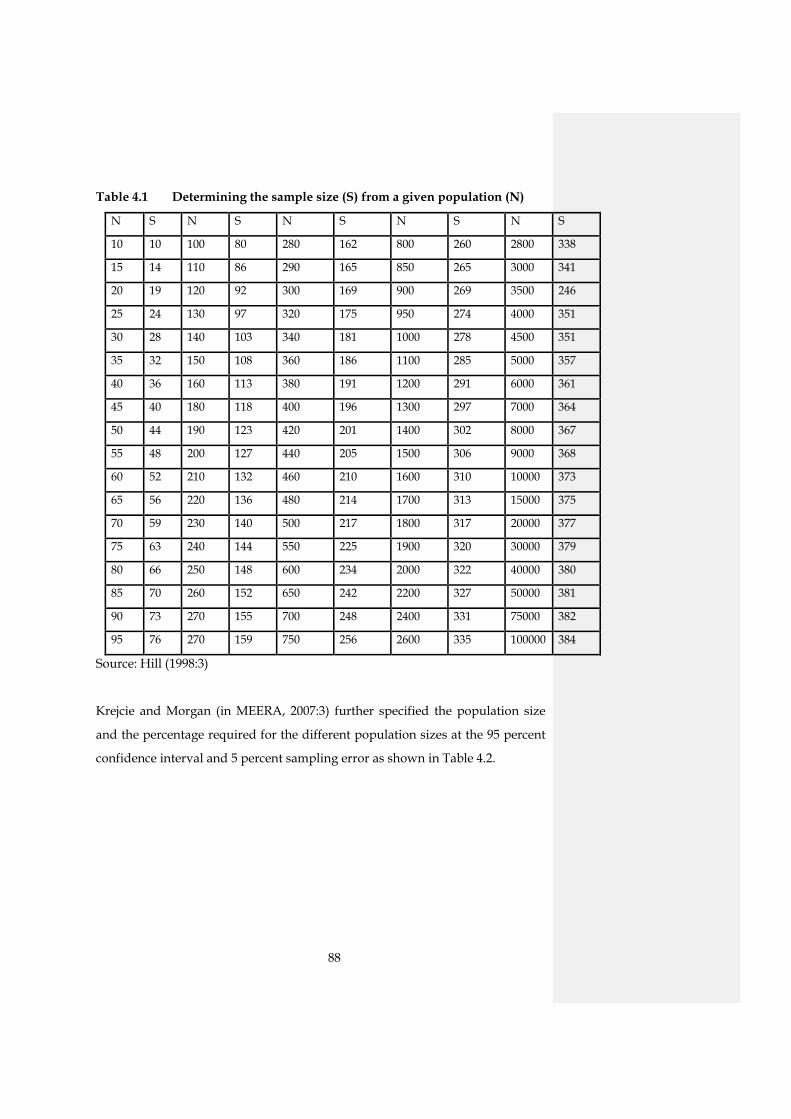
88
Table 4.1 Determining the sample size (S) from a given population (N)
N S N S N S N S N S
10 10 100 80 280 162 800 260 2800 338
15 14 110 86 290 165 850 265 3000 341
20 19 120 92 300 169 900 269 3500 246
25 24 130 97 320 175 950 274 4000 351
30 28 140 103 340 181 1000 278 4500 351
35 32 150 108 360 186 1100 285 5000 357
40 36 160 113 380 191 1200 291 6000 361
45 40 180 118 400 196 1300 297 7000 364
50 44 190 123 420 201 1400 302 8000 367
55 48 200 127 440 205 1500 306 9000 368
60 52 210 132 460 210 1600 310 10000 373
65 56 220 136 480 214 1700 313 15000 375
70 59 230 140 500 217 1800 317 20000 377
75 63 240 144 550 225 1900 320 30000 379
80 66 250 148 600 234 2000 322 40000 380
85 70 260 152 650 242 2200 327 50000 381
90 73 270 155 700 248 2400 331 75000 382
95 76 270 159 750 256 2600 335 100000 384
Source: Hill (1998:3)
Krejcie and Morgan (in MEERA, 2007:3) further specified the population size
and the percentage required for the different population sizes at the 95 percent
confidence interval and 5 percent sampling error as shown in Table 4.2.
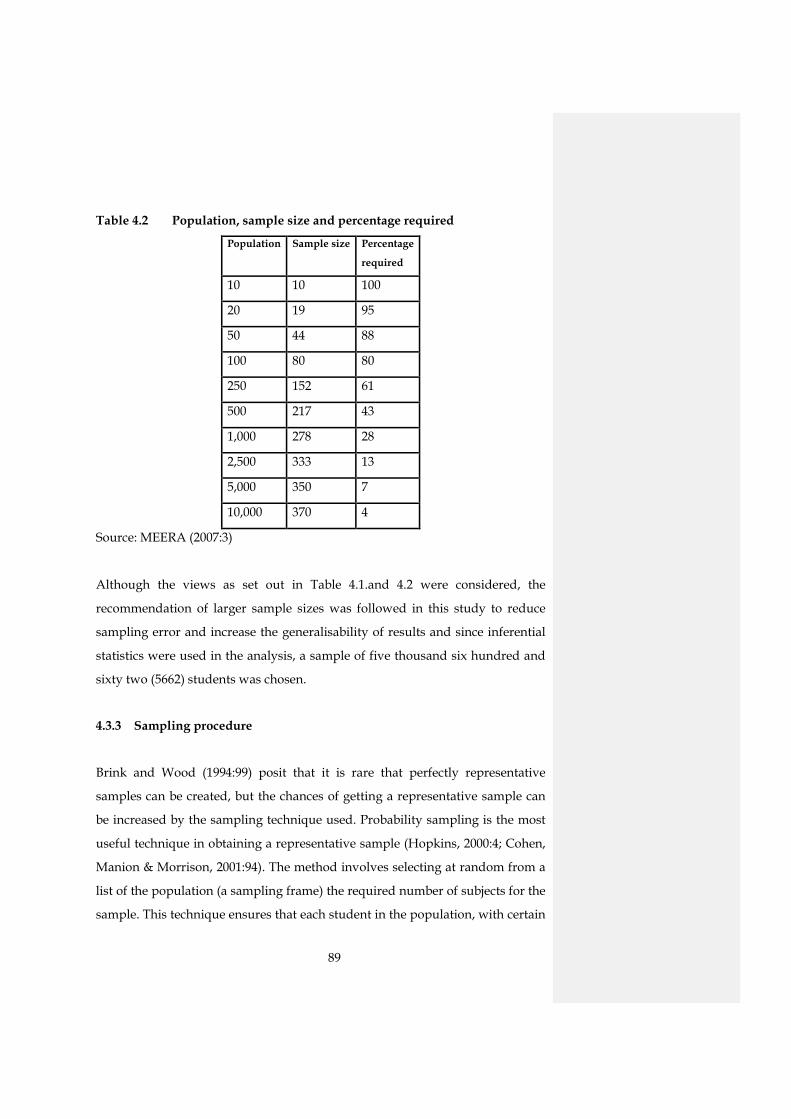
89
Table 4.2 Population, sample size and percentage required
Population Sample size Percentage
required
10 10 100
20 19 95
50 44 88
100 80 80
250 152 61
500 217 43
1,000 278 28
2,500 333 13
5,000 350 7
10,000 370 4
Source: MEERA (2007:3)
Although the views as set out in Table 4.1.and 4.2 were considered, the
recommendation of larger sample sizes was followed in this study to reduce
sampling error and increase the generalisability of results and since inferential
statistics were used in the analysis, a sample of five thousand six hundred and
sixty two (5662) students was chosen.
4.3.3 Sampling procedure
Brink and Wood (1994:99) posit that it is rare that perfectly representative
samples can be created, but the chances of getting a representative sample can
be increased by the sampling technique used. Probability sampling is the most
useful technique in obtaining a representative sample (Hopkins, 2000:4; Cohen,
Manion & Morrison, 2001:94). The method involves selecting at random from a
list of the population (a sampling frame) the required number of subjects for the
sample. This technique ensures that each student in the population, with certain
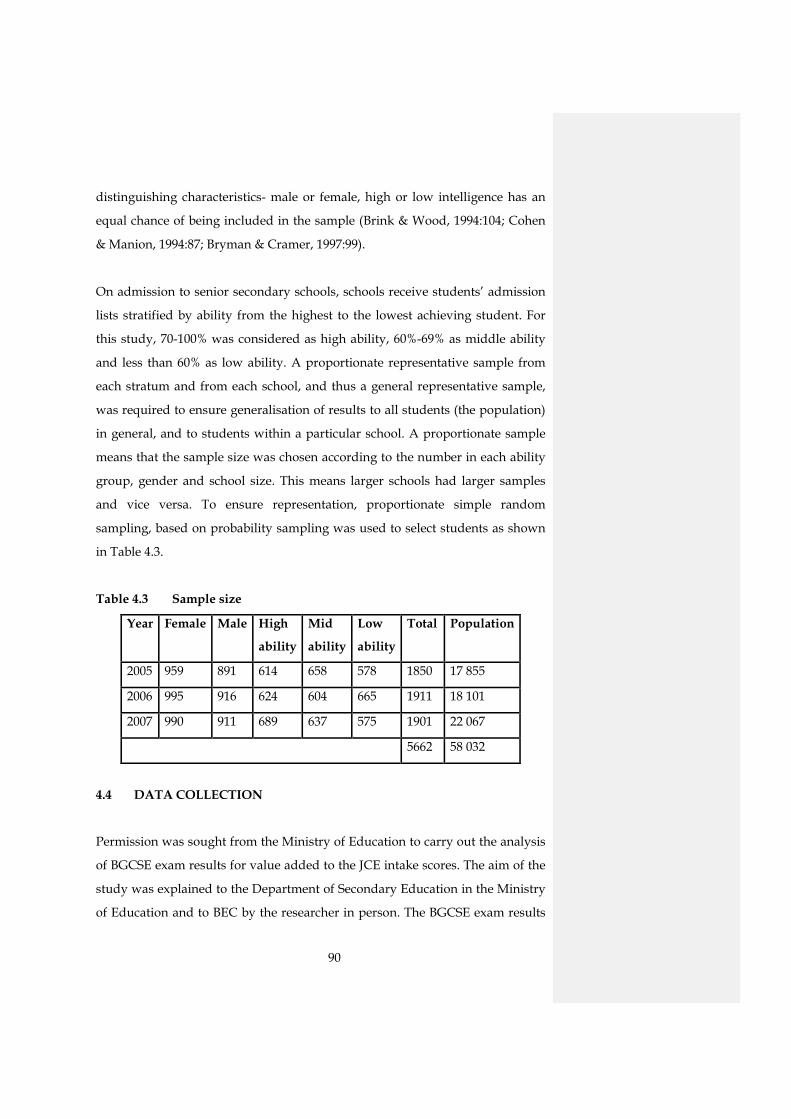
90
distinguishing characteristics- male or female, high or low intelligence has an
equal chance of being included in the sample (Brink & Wood, 1994:104; Cohen
& Manion, 1994:87; Bryman & Cramer, 1997:99).
On admission to senior secondary schools, schools receive students’ admission
lists stratified by ability from the highest to the lowest achieving student. For
this study, 70-100% was considered as high ability, 60%-69% as middle ability
and less than 60% as low ability. A proportionate representative sample from
each stratum and from each school, and thus a general representative sample,
was required to ensure generalisation of results to all students (the population)
in general, and to students within a particular school. A proportionate sample
means that the sample size was chosen according to the number in each ability
group, gender and school size. This means larger schools had larger samples
and vice versa. To ensure representation, proportionate simple random
sampling, based on probability sampling was used to select students as shown
in Table 4.3.
Table 4.3 Sample size
Year Female Male High
ability
Mid
ability
Low
ability
Total Population
2005 959 891 614 658 578 1850 17 855
2006 995 916 624 604 665 1911 18 101
2007 990 911 689 637 575 1901 22 067
5662 58 032
4.4 DATA COLLECTION
Permission was sought from the Ministry of Education to carry out the analysis
of BGCSE exam results for value added to the JCE intake scores. The aim of the
study was explained to the Department of Secondary Education in the Ministry
of Education and to BEC by the researcher in person. The BGCSE exam results

91
were obtained from BEC while the JCE exam results were obtained from the
Department of Secondary Education- student admissions between March and
April 2008. Both datasets were collected as text data files on the Microsoft Excel
platform. The biographical data at entry to senior school namely, average JCE
score, grades for English Language, Setswana Language and Mathematics and
gender represent the explanatory or independent variables at the individual
student level.
The dependant or response variables were the individual student’s average
score for BGCSE best eight subjects, grades for English Language, Setswana
Language and Mathematics.
4.5 DATA ANALYSIS
The data collected had a hierarchical structure: students in departments,
departments in schools and schools located in inspectoral regions. From a
statistical perspective, such data requires the use of the statistical techniques of
multilevel modelling (Goldstein, 1999:2) which should incorporate the
hierarchical structure of data. The data was analysed via the statistical software
package MLwiN 2.10 Beta (4), which is based on multilevel modelling (Rasbash
et al., 2008). Within the hierarchical data, multilevel modelling allowed the
researcher to examine the differential effectiveness of schools and departments
for different students’ groups in detail.
The analysis approaches that a researcher could follow include descriptive and
inferential analysis (Brink & Wood, 1994:212). Descriptive analysis describes the
sample data and any conclusions reached refer only to the sample. On the other
hand, inferential statistics provides statistical validation of research hypothesis,
which allows the researcher to draw inferences about the larger population
from the sample data (Brink & Wood, 1994:212). As such, descriptive statistics
were used to compare the exam means of gender at intake and at school
departure and to describe the sample. Multiple regression analysis, which is a
92
form of inferential statistics, was used to make inferences or generalisations
from sample analysis to the population in order to generalise the research
findings to the target population. Hills (1998:2) and Terns (2008:1) maintain that
inferential statistics works well when a random and representative sample is
obtained as was the case in this study.
4.6 RELIABILITY AND VALIDITY
Reliability and validity refer specifically to the measurement of data as used to
answer the research question (Brink & Wood, 1994:170). The concept of
reliability is concerned with the consistency of results when the same variable is
measured in the same person. The reliability and validity in value added
measures depend on the value added methodology employed to give consistent
results. For the results to be reliable and valid, certain conditions have to be
fulfilled as laid down by school effectiveness researchers such as, Gray and
Wilcox(1995:92); Sammons et al.(1997:30); Jesson (2000:10); Schagen and
Schagen (2005:312). The conditions are:
The data should be collected at the individual student level as a measure
of what each student got in each subject expressed for example in point
scores where A*=8, A=7, B=6, C=5, D=4, E=3, F=2, G=1 and U/X =0. The
data should not be aggregated or summarised at the school level using
for example, the percentage of students getting five grade Cs or better
Secondly, appropriate ‘contextualisation’ is required. This should reflect
the student background characteristics such as student abilities, socio-
economic status and gender. However, strong preference should be
given to data that indicates prior attainment, as prior attainment is the
most important co-variate to adjust or compensate for differences in
intake which then allows value added to be measured reliably (Sammons
et al., 1997:43).
In the absence of pupil’s prior attainment, several additional
biographical variables on pupils’ background should be included such as
measures of social advantage.
93
The data analysis technique should use the statistical technique known
as multi level modelling.
Three years is the minimum to establish any trend in effectiveness (cf.
4.3.1)
Sammons et al. (1997:25) argue that it is essential that, wherever possible, value
added systems should measure progress where both baseline and the outcome
are measured in terms of what is taught in schools: the national curriculum. In
this study, the baseline (prior attainment) and outcome measures were collected
at the individual student level from the national examination data. This is very
reliable data. The prior attainment intake was also known for each individual
student from the JCE results. The statistical software used was based on
multilevel modelling. The researcher believes that the results of this study are
reliable and valid because the data analysis technique employed is applicable
and appropriate for the data structure and satisfies the conditions for value
added analysis. The above conditions indicate that when the necessary
conditions are met, it is possible to adopt a value added methodology to
determine schools’ effectiveness. This partly covered the second research aim.
4.7 CONCLUSION
The chapter discussed the research design and methodology for the study and
the justification for using multi level modelling. The sampling procedure and
the sample size were outlined. Proportionate simple random sampling was
used to reduce sampling error and increase the representativeness of the
population which enabled generalisability of the results from the sample to the
population. Since the study adopted a value added methodology, the necessary
conditions for any school effectiveness study using a value added methodology
were described and the study met the set criteria. This set criteria established
the reliability and the validity of the results of the study. Chapter five presents
the results of the data analysis and the discussion of the results.
94
CHAPTER FIVE
DATA ANALYSIS AND DISCUSSION
5.2 INTRODUCTION
Chapter four discussed the research design and value added methodology for
this study. The statistical analysis was discussed. In Chapter one, four research
aims (cf. 1.4) were stated. The first research aim on the concept of school
effectiveness and characteristics of effective schools was answered by the
literature review in Chapters two and three. The aim of this chapter is to
address the second and third research aims. The second research aim was to
investigate the possibilities of a value added approach to school effectiveness in
judging school performance (cf. 1.4.2). The third research aim was to determine,
on the basis of the literature reviewed and the methods adopted by a value
added approach, the effectiveness/ineffectiveness of secondary schools in
Botswana (cf. 1.4.3).
The chapter addresses the following problem questions (cf. 1.3.3)
In what way can a value added approach to determining school
effectiveness contribute to judging school effectiveness?
How effective are secondary schools in Botswana? Are some schools
more effective than others in promoting students’ progress when the
differences in student intake are considered?
Are schools equally effective/ineffective for all the student groups?
Are the schools consistently effective/ineffective across the core subjects?
And are the schools stable in their effectiveness/ineffectiveness for 2005-
2007?
The results of the quantitative data analysis are presented according to the
research questions. In answering the research questions, the chapter will cover
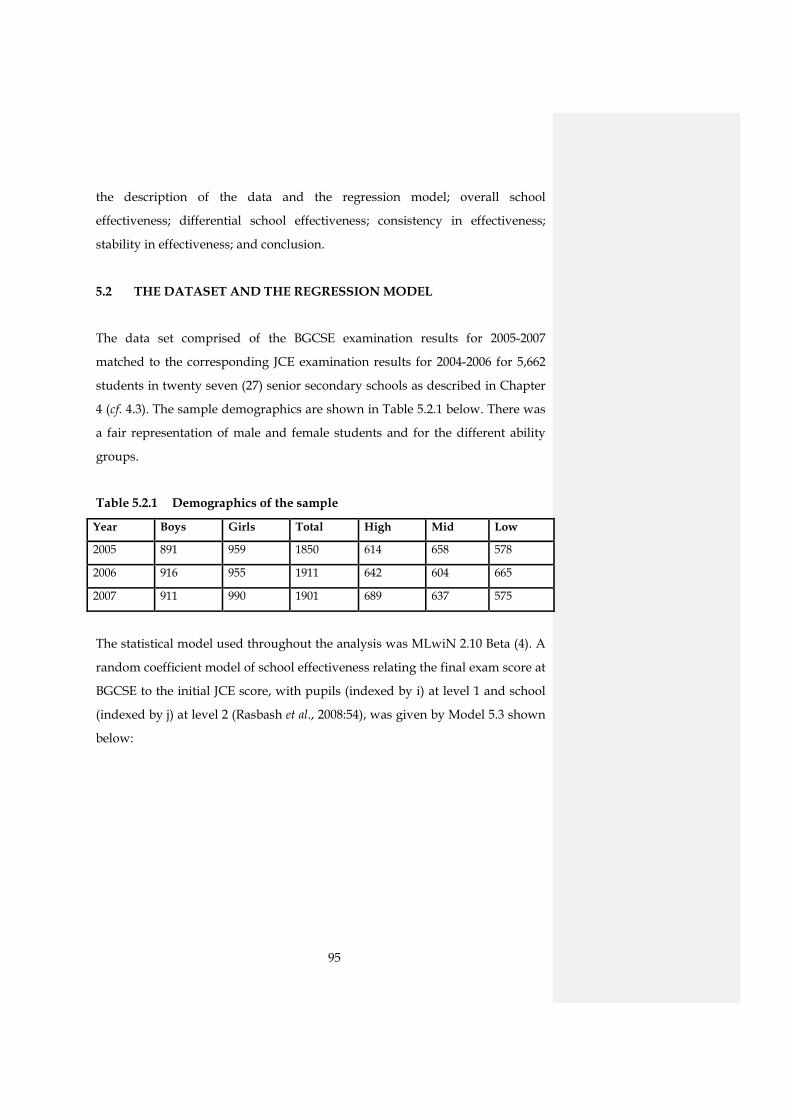
95
the description of the data and the regression model; overall school
effectiveness; differential school effectiveness; consistency in effectiveness;
stability in effectiveness; and conclusion.
5.2 THE DATASET AND THE REGRESSION MODEL
The data set comprised of the BGCSE examination results for 2005-2007
matched to the corresponding JCE examination results for 2004-2006 for 5,662
students in twenty seven (27) senior secondary schools as described in Chapter
4 (cf. 4.3). The sample demographics are shown in Table 5.2.1 below. There was
a fair representation of male and female students and for the different ability
groups.
Table 5.2.1 Demographics of the sample
Year Boys Girls Total High Mid Low
2005 891 959 1850 614 658 578
2006 916 955 1911 642 604 665
2007 911 990 1901 689 637 575
The statistical model used throughout the analysis was MLwiN 2.10 Beta (4). A
random coefficient model of school effectiveness relating the final exam score at
BGCSE to the initial JCE score, with pupils (indexed by i) at level 1 and school
(indexed by j) at level 2 (Rasbash et al., 2008:54), was given by Model 5.3 shown
below:
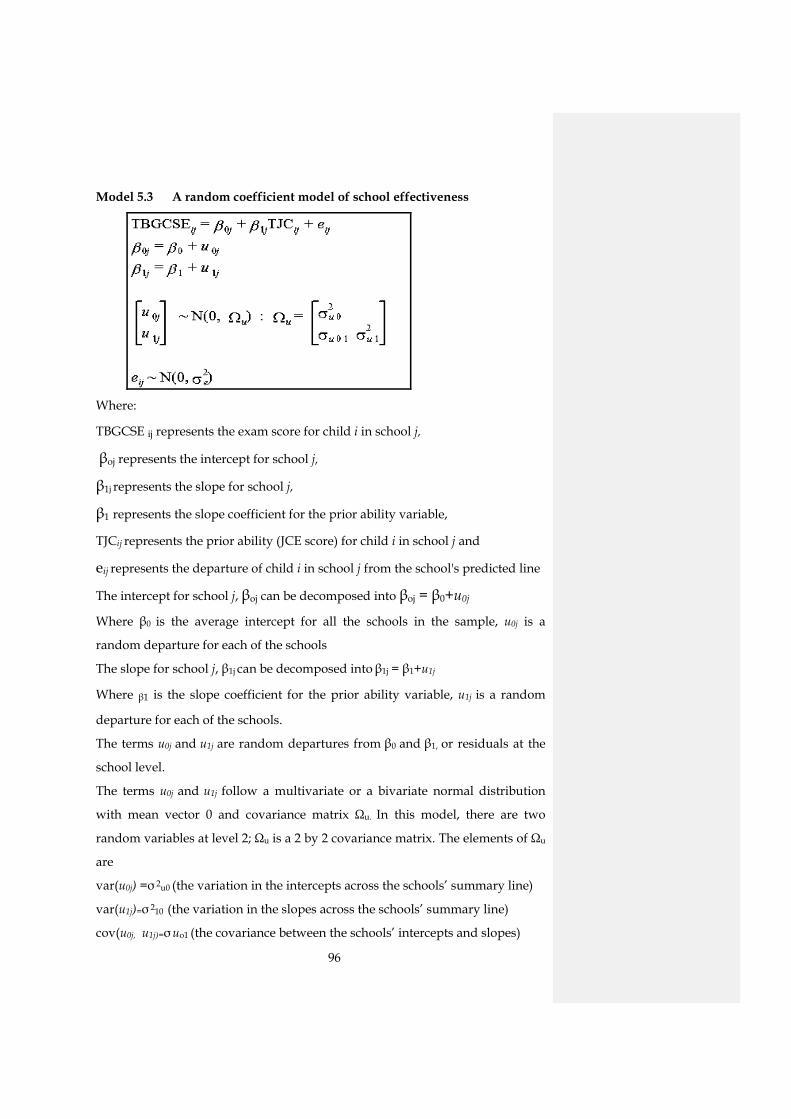
96
Model 5.3 A random coefficient model of school effectiveness
Where:
TBGCSE ij represents the exam score for child i in school j,
βoj represents the intercept for school j,
β1j represents the slope for school j,
β1 represents the slope coefficient for the prior ability variable,
TJCij represents the prior ability (JCE score) for child i in school j and
eij represents the departure of child i in school j from the school's predicted line
The intercept for school j, βoj can be decomposed into βoj = β0+u0j
Where β0 is the average intercept for all the schools in the sample, u0j is a
random departure for each of the schools
The slope for school j, β1j can be decomposed into β1j = β1+u1j
Where β1 is the slope coefficient for the prior ability variable, u1j is a random
departure for each of the schools.
The terms u0j and u1j are random departures from β0 and β1, or residuals at the
school level.
The terms u0j and u1j follow a multivariate or a bivariate normal distribution
with mean vector 0 and covariance matrix Ωu. In this model, there are two
random variables at level 2; Ωu is a 2 by 2 covariance matrix. The elements of Ωu
are
var(u0j) =σ 2u0 (the variation in the intercepts across the schools’ summary line)
var(u1j)=σ 210 (the variation in the slopes across the schools’ summary line)
cov(u0j, u1j)=σ uo1 (the covariance between the schools’ intercepts and slopes)
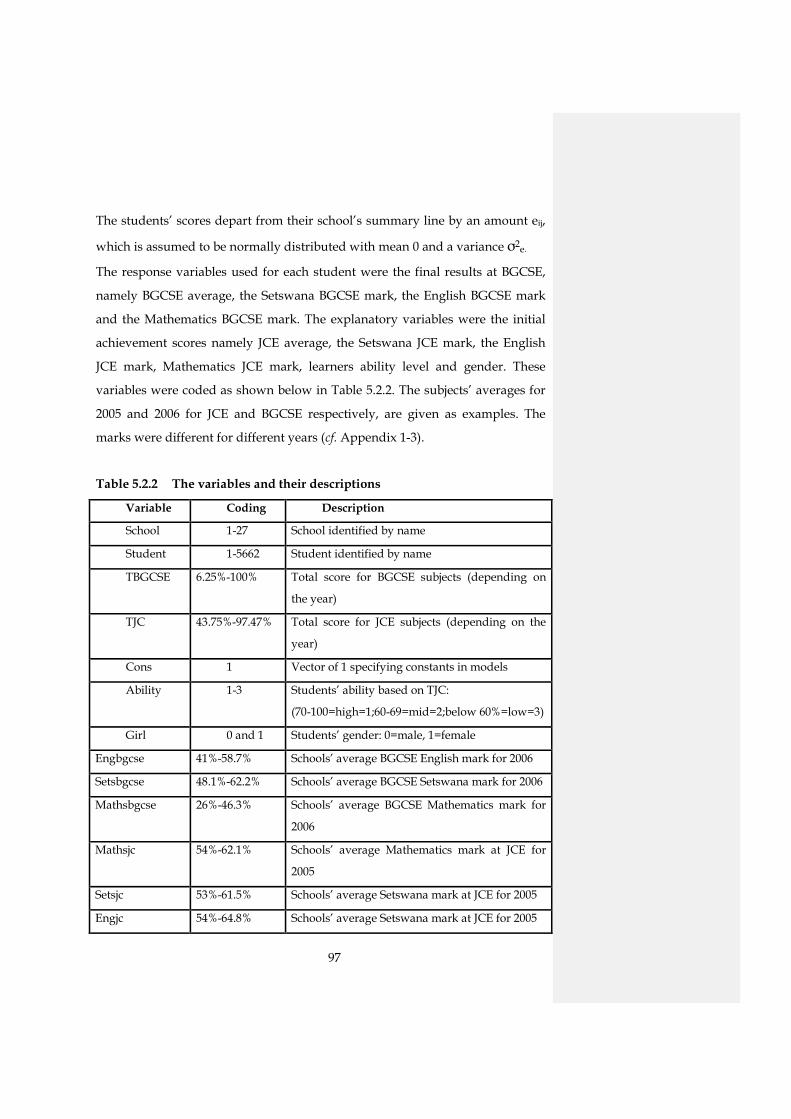
97
The students’ scores depart from their school’s summary line by an amount eij,
which is assumed to be normally distributed with mean 0 and a variance σ2e.
The response variables used for each student were the final results at BGCSE,
namely BGCSE average, the Setswana BGCSE mark, the English BGCSE mark
and the Mathematics BGCSE mark. The explanatory variables were the initial
achievement scores namely JCE average, the Setswana JCE mark, the English
JCE mark, Mathematics JCE mark, learners ability level and gender. These
variables were coded as shown below in Table 5.2.2. The subjects’ averages for
2005 and 2006 for JCE and BGCSE respectively, are given as examples. The
marks were different for different years (cf. Appendix 1-3).
Table 5.2.2 The variables and their descriptions
Variable Coding Description
School 1-27 School identified by name
Student 1-5662 Student identified by name
TBGCSE 6.25%-100% Total score for BGCSE subjects (depending on
the year)
TJC 43.75%-97.47% Total score for JCE subjects (depending on the
year)
Cons 1 Vector of 1 specifying constants in models
Ability 1-3 Students’ ability based on TJC:
(70-100=high=1;60-69=mid=2;below 60%=low=3)
Girl 0 and 1 Students’ gender: 0=male, 1=female
Engbgcse 41%-58.7% Schools’ average BGCSE English mark for 2006
Setsbgcse 48.1%-62.2% Schools’ average BGCSE Setswana mark for 2006
Mathsbgcse 26%-46.3% Schools’ average BGCSE Mathematics mark for
2006
Mathsjc 54%-62.1% Schools’ average Mathematics mark at JCE for
2005
Setsjc 53%-61.5% Schools’ average Setswana mark at JCE for 2005
Engjc 54%-64.8% Schools’ average Setswana mark at JCE for 2005
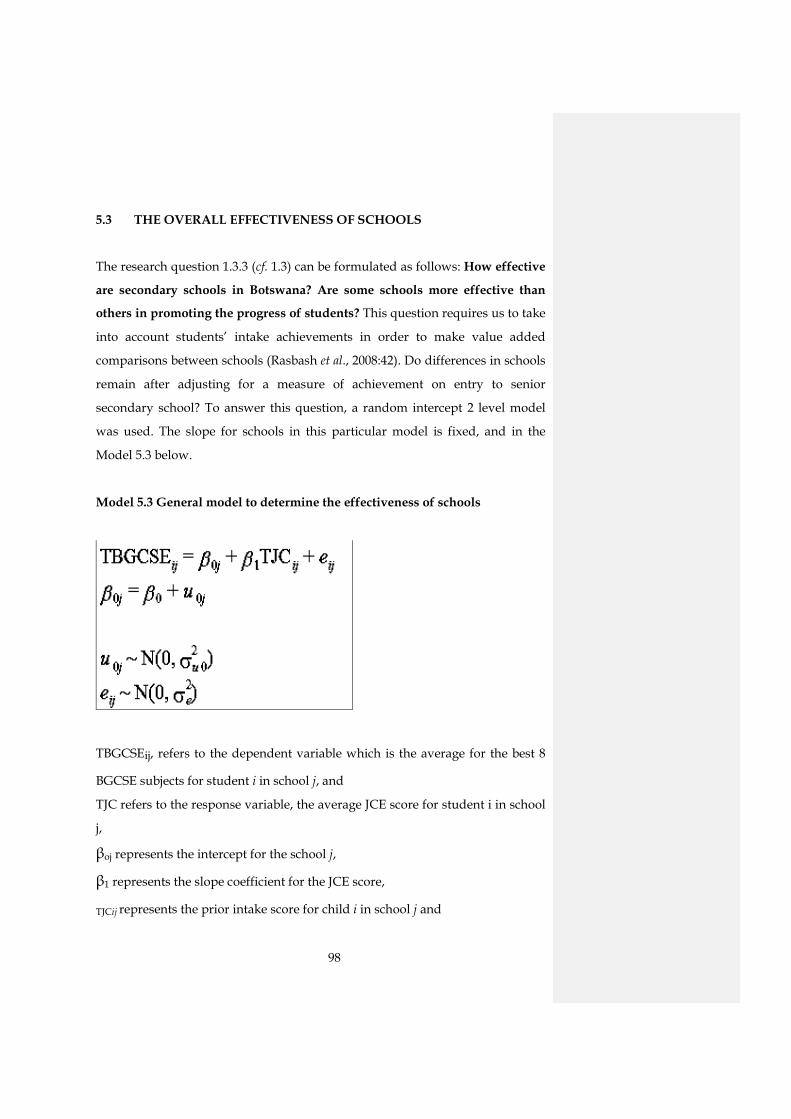
98
5.3 THE OVERALL EFFECTIVENESS OF SCHOOLS
The research question 1.3.3 (cf. 1.3) can be formulated as follows: How effective
are secondary schools in Botswana? Are some schools more effective than
others in promoting the progress of students? This question requires us to take
into account students’ intake achievements in order to make value added
comparisons between schools (Rasbash et al., 2008:42). Do differences in schools
remain after adjusting for a measure of achievement on entry to senior
secondary school? To answer this question, a random intercept 2 level model
was used. The slope for schools in this particular model is fixed, and in the
Model 5.3 below.
Model 5.3 General model to determine the effectiveness of schools
TBGCSEij, refers to the dependent variable which is the average for the best 8
BGCSE subjects for student i in school j, and
TJC refers to the response variable, the average JCE score for student i in school
j,
βoj represents the intercept for the school j,
β1 represents the slope coefficient for the JCE score,
TJCij represents the prior intake score for child i in school j and
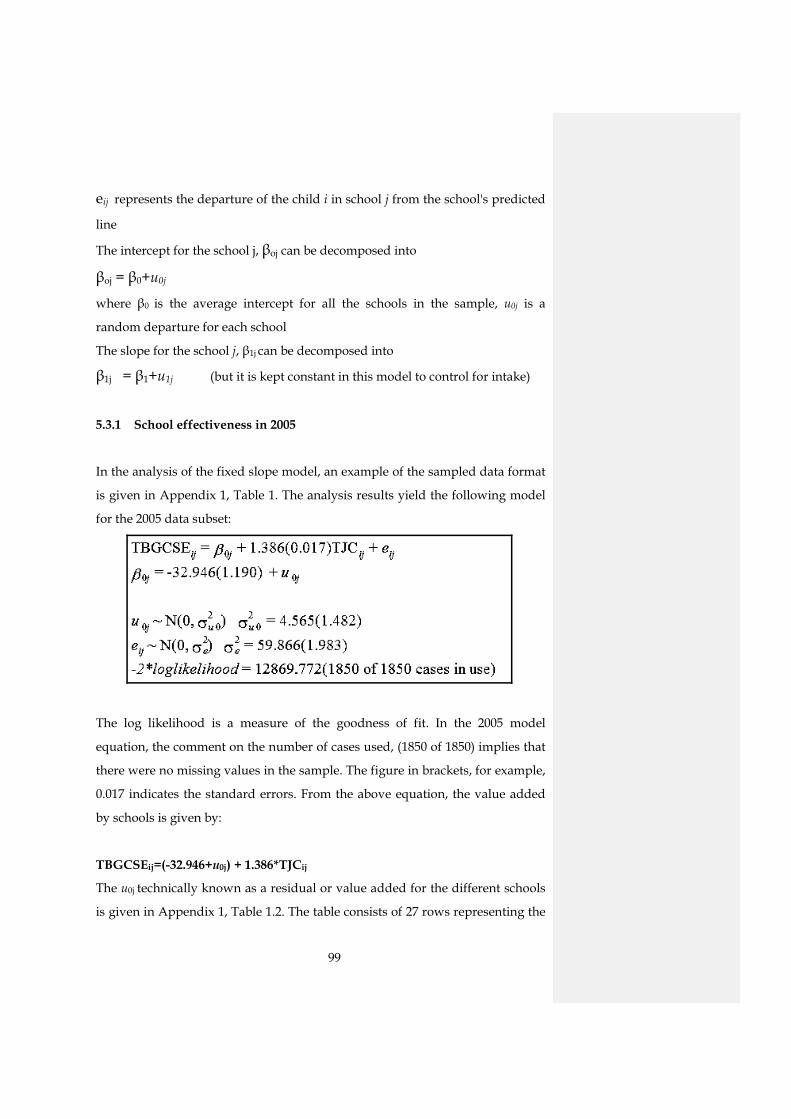
99
eij represents the departure of the child i in school j from the school's predicted
line
The intercept for the school j, βoj can be decomposed into
βoj = β0+u0j
where β0 is the average intercept for all the schools in the sample, u0j is a
random departure for each school
The slope for the school j, β1j can be decomposed into
β1j = β1+u1j (but it is kept constant in this model to control for intake)
5.3.1 School effectiveness in 2005
In the analysis of the fixed slope model, an example of the sampled data format
is given in Appendix 1, Table 1. The analysis results yield the following model
for the 2005 data subset:
The log likelihood is a measure of the goodness of fit. In the 2005 model
equation, the comment on the number of cases used, (1850 of 1850) implies that
there were no missing values in the sample. The figure in brackets, for example,
0.017 indicates the standard errors. From the above equation, the value added
by schools is given by:
TBGCSEij=(-32.946+u0j) + 1.386*TJCij
The u0j technically known as a residual or value added for the different schools
is given in Appendix 1, Table 1.2. The table consists of 27 rows representing the

100
27 schools. From the table, school 1 has a residual value of 1.201 and was
ranked position 23 as shown in column 6. The values reported in Table 5.3.1
below are the different schools’ value added scores and their inverted ranks
obtained from Appendix 1, Table 1.2. For example, when the rank is inverted
(28-23), school 1 is ranked position 5 in Table 5.3.1. School 23 which is ranked
position 27 in Appendix 1, Table 1.2 is now ranked position 1, that is, (28-27).
The percentage credit pass and their ranking were obtained from Appendix 10.
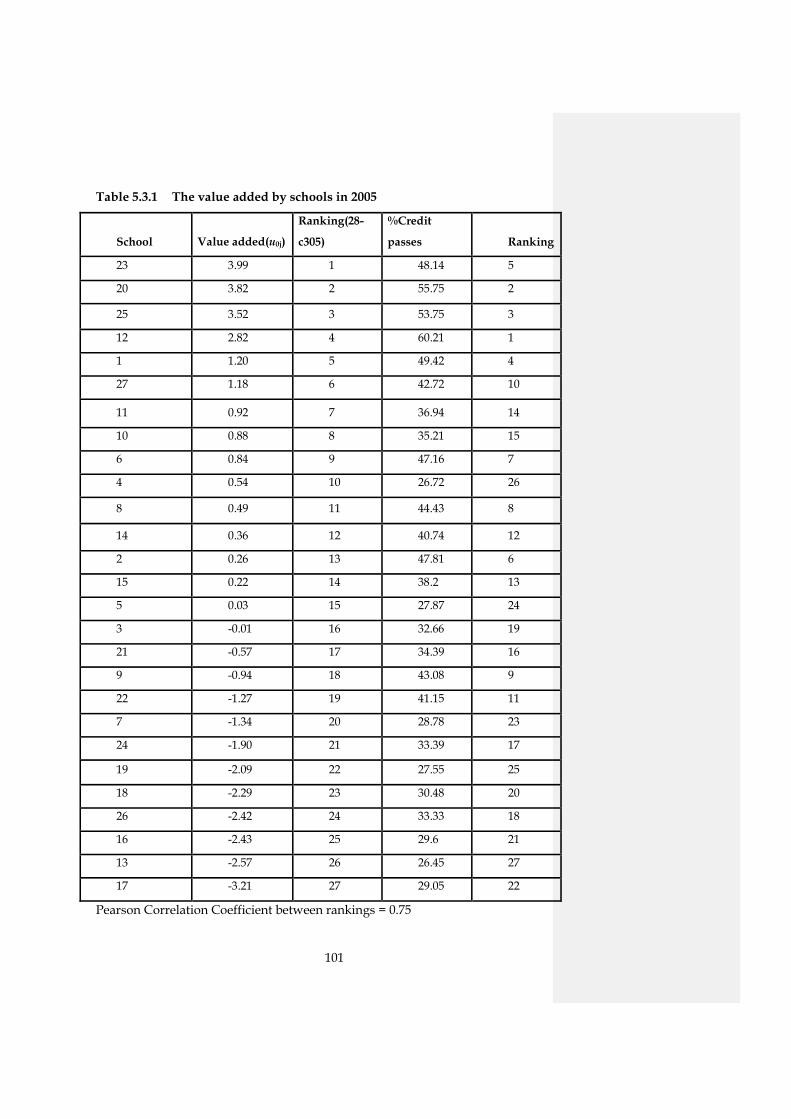
101
Table 5.3.1 The value added by schools in 2005
School Value added(u0j)
Ranking(28-
c305)
%Credit
passes Ranking
23 3.99 1 48.14 5
20 3.82 2 55.75 2
25 3.52 3 53.75 3
12 2.82 4 60.21 1
1 1.20 5 49.42 4
27 1.18 6 42.72 10
11 0.92 7 36.94 14
10 0.88 8 35.21 15
6 0.84 9 47.16 7
4 0.54 10 26.72 26
8 0.49 11 44.43 8
14 0.36 12 40.74 12
2 0.26 13 47.81 6
15 0.22 14 38.2 13
5 0.03 15 27.87 24
3 -0.01 16 32.66 19
21 -0.57 17 34.39 16
9 -0.94 18 43.08 9
22 -1.27 19 41.15 11
7 -1.34 20 28.78 23
24 -1.90 21 33.39 17
19 -2.09 22 27.55 25
18 -2.29 23 30.48 20
26 -2.42 24 33.33 18
16 -2.43 25 29.6 21
13 -2.57 26 26.45 27
17 -3.21 27 29.05 22
Pearson Correlation Coefficient between rankings = 0.75
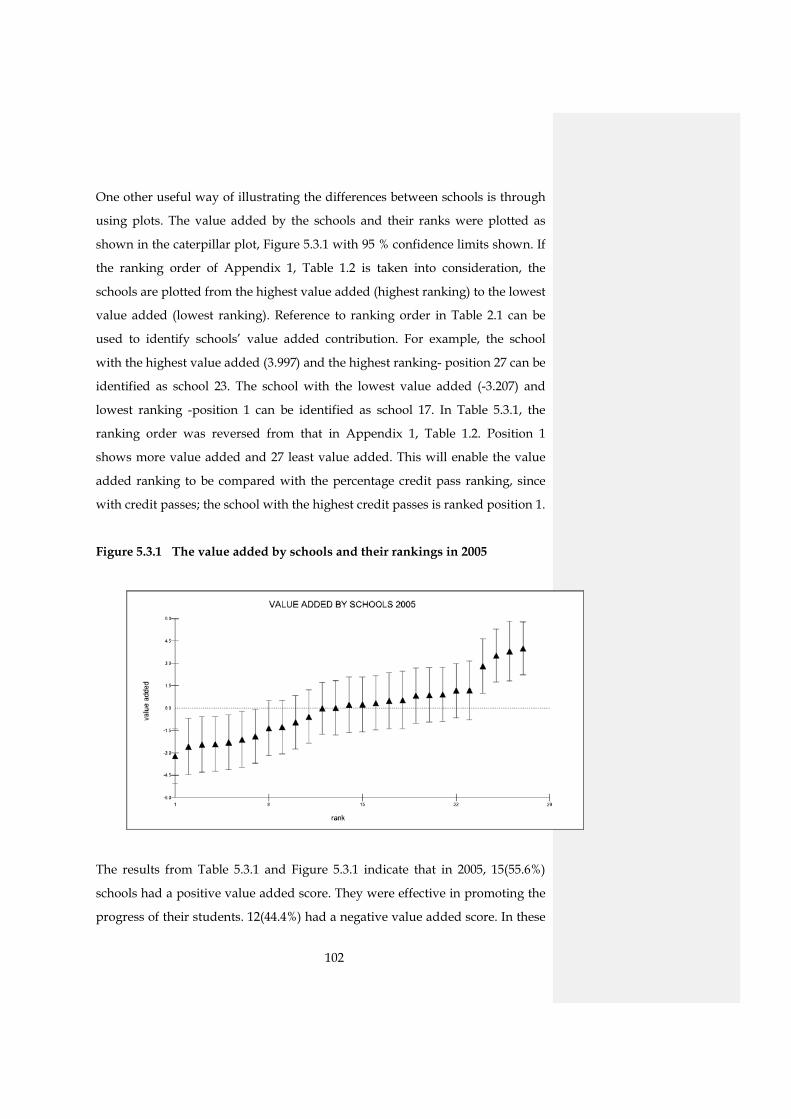
102
One other useful way of illustrating the differences between schools is through
using plots. The value added by the schools and their ranks were plotted as
shown in the caterpillar plot, Figure 5.3.1 with 95 % confidence limits shown. If
the ranking order of Appendix 1, Table 1.2 is taken into consideration, the
schools are plotted from the highest value added (highest ranking) to the lowest
value added (lowest ranking). Reference to ranking order in Table 2.1 can be
used to identify schools’ value added contribution. For example, the school
with the highest value added (3.997) and the highest ranking- position 27 can be
identified as school 23. The school with the lowest value added (-3.207) and
lowest ranking -position 1 can be identified as school 17. In Table 5.3.1, the
ranking order was reversed from that in Appendix 1, Table 1.2. Position 1
shows more value added and 27 least value added. This will enable the value
added ranking to be compared with the percentage credit pass ranking, since
with credit passes; the school with the highest credit passes is ranked position 1.
Figure 5.3.1 The value added by schools and their rankings in 2005
The results from Table 5.3.1 and Figure 5.3.1 indicate that in 2005, 15(55.6%)
schools had a positive value added score. They were effective in promoting the
progress of their students. 12(44.4%) had a negative value added score. In these
103
schools the students did worse than expected when their intake scores were
considered.
The credit passes for 2005 are also shown in Table 5.3.1 to compare school’s
performance on credit passes (raw results) against their value added results.
The correlation between the two rankings is high (0.75), but not perfect. This
shows that a lot of schools changed their rankings in raw results and value
added results. Only 3 schools did not change their rankings. Some schools
which were considered good in terms of raw results were not doing so well in
value addition. School 9 in the top ten in raw results at position 9, added
negative value to its students and moved down to position 19 in the value
added ranking. This is a big difference. Similarly, school 22 with a negative
value added score moved from 11 down to 19 in value added. The other schools
which ranked high in raw results but were lower in positive value added were
school 12 from top 1 to 4, school 6 from 7 to 9, school 2 from 6 to 13, and school
9 from 9 to 18.
Similarly, some schools which were doing not so well in raw results did well in
terms of adding positive value to students. School 4 at position 26 moved up to
position 10; school 5 at 24 moved up to 15; school 11 from 14 to 7; school 10
moved from 15 to 8; school 27 moved from 10 to 6 and school 23 moved from 5
to 1. A similar comparison can be made with the remaining schools and it can
be concluded that raw results on their own have a potential of misleading. The
schools at the top may be ‘flattered’ by their positions which may lead to
complacency while the schools at the bottom can be taken to be poor schools
and this might lead them to despair. Raw results therefore, do not tell us
enough about how good the schools are in promoting the progress of their
students.
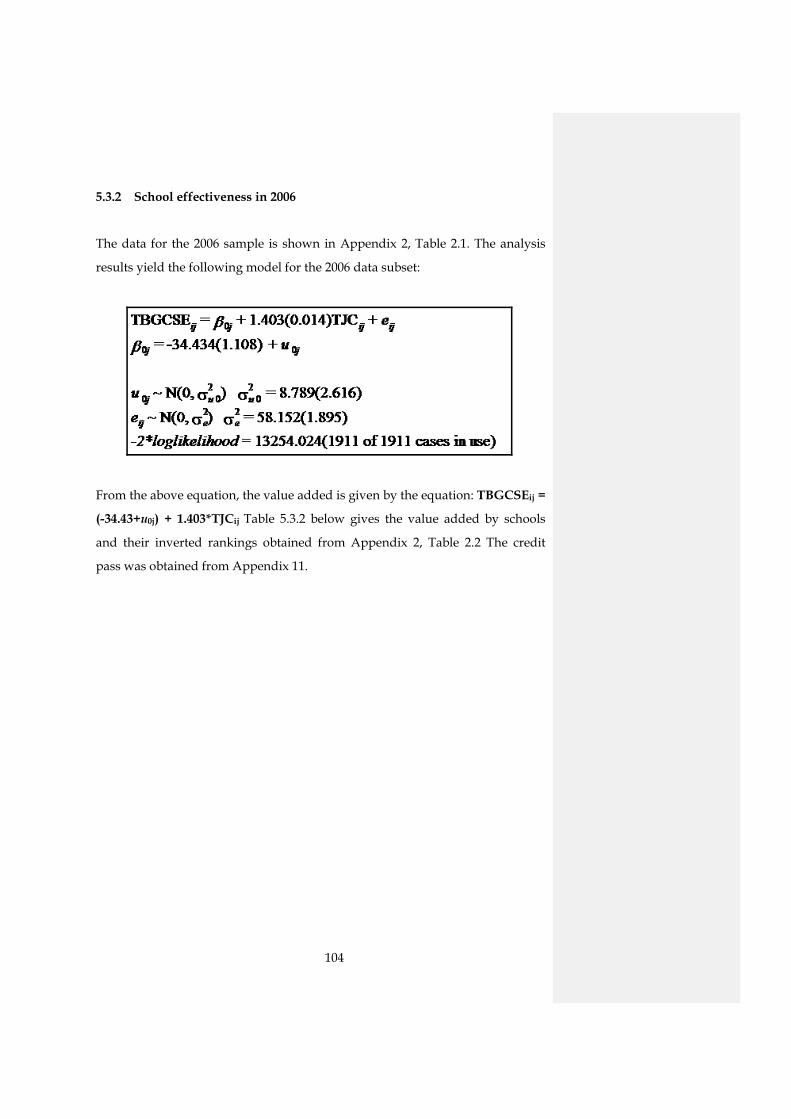
104
5.3.2 School effectiveness in 2006
The data for the 2006 sample is shown in Appendix 2, Table 2.1. The analysis
results yield the following model for the 2006 data subset:
From the above equation, the value added is given by the equation: TBGCSEij =
(-34.43+u0j) + 1.403*TJCij Table 5.3.2 below gives the value added by schools
and their inverted rankings obtained from Appendix 2, Table 2.2 The credit
pass was obtained from Appendix 11.
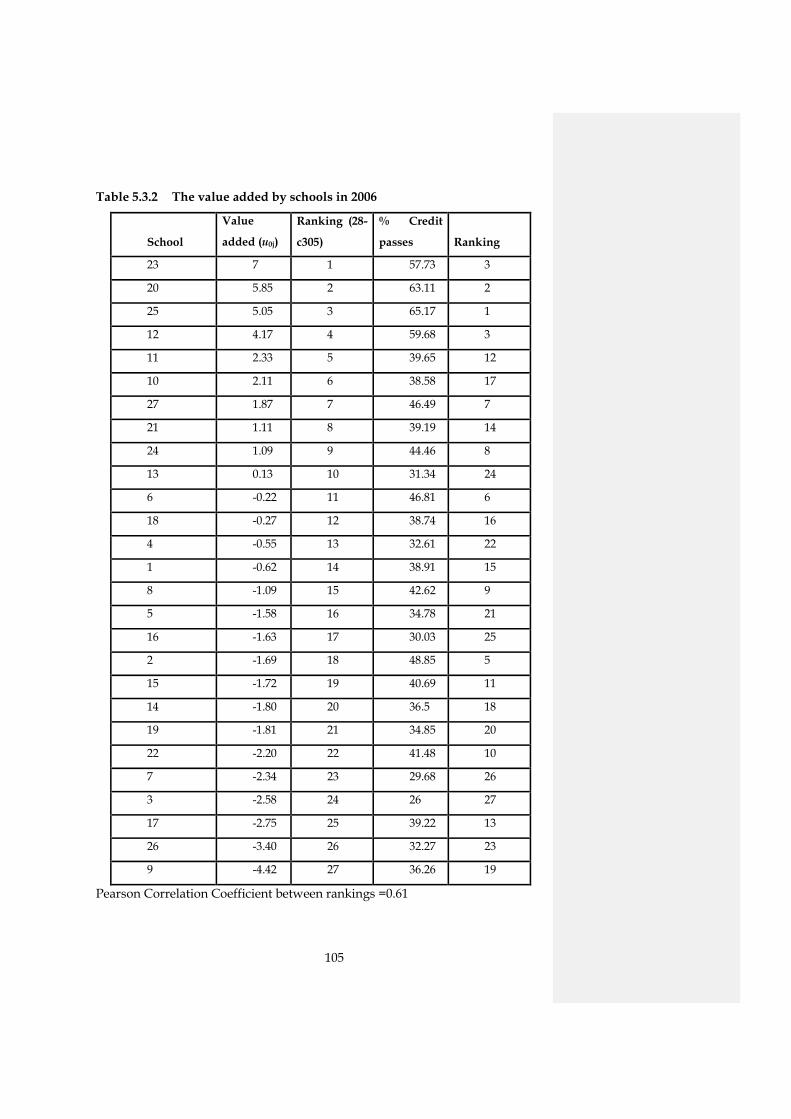
105
Table 5.3.2 The value added by schools in 2006
School
Value
added (u0j)
Ranking (28-
c305)
% Credit
passes Ranking
23 7 1 57.73 3
20 5.85 2 63.11 2
25 5.05 3 65.17 1
12 4.17 4 59.68 3
11 2.33 5 39.65 12
10 2.11 6 38.58 17
27 1.87 7 46.49 7
21 1.11 8 39.19 14
24 1.09 9 44.46 8
13 0.13 10 31.34 24
6 -0.22 11 46.81 6
18 -0.27 12 38.74 16
4 -0.55 13 32.61 22
1 -0.62 14 38.91 15
8 -1.09 15 42.62 9
5 -1.58 16 34.78 21
16 -1.63 17 30.03 25
2 -1.69 18 48.85 5
15 -1.72 19 40.69 11
14 -1.80 20 36.5 18
19 -1.81 21 34.85 20
22 -2.20 22 41.48 10
7 -2.34 23 29.68 26
3 -2.58 24 26 27
17 -2.75 25 39.22 13
26 -3.40 26 32.27 23
9 -4.42 27 36.26 19
Pearson Correlation Coefficient between rankings =0.61
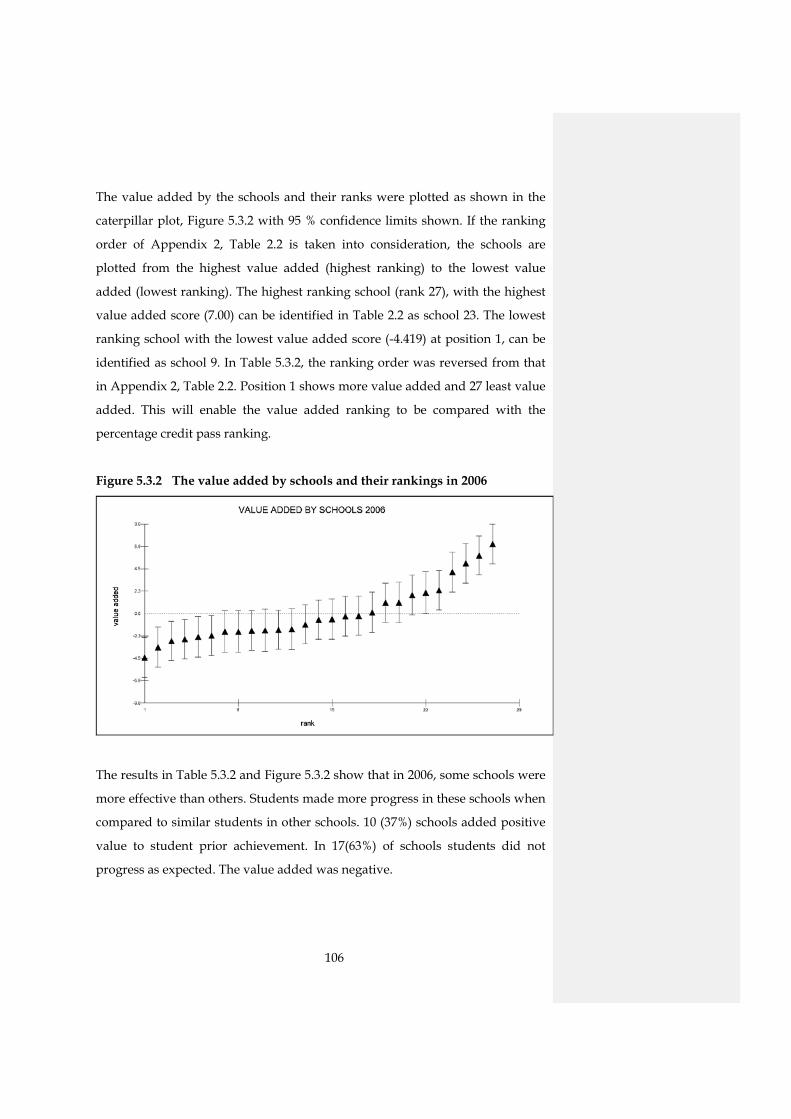
106
The value added by the schools and their ranks were plotted as shown in the
caterpillar plot, Figure 5.3.2 with 95 % confidence limits shown. If the ranking
order of Appendix 2, Table 2.2 is taken into consideration, the schools are
plotted from the highest value added (highest ranking) to the lowest value
added (lowest ranking). The highest ranking school (rank 27), with the highest
value added score (7.00) can be identified in Table 2.2 as school 23. The lowest
ranking school with the lowest value added score (-4.419) at position 1, can be
identified as school 9. In Table 5.3.2, the ranking order was reversed from that
in Appendix 2, Table 2.2. Position 1 shows more value added and 27 least value
added. This will enable the value added ranking to be compared with the
percentage credit pass ranking.
Figure 5.3.2 The value added by schools and their rankings in 2006
The results in Table 5.3.2 and Figure 5.3.2 show that in 2006, some schools were
more effective than others. Students made more progress in these schools when
compared to similar students in other schools. 10 (37%) schools added positive
value to student prior achievement. In 17(63%) of schools students did not
progress as expected. The value added was negative.

107
The 2006 credit pass ranking order recorded in Table 5.3.2 and value added
schools’ ranking order were compared and correlated. The correlation between
the rankings was significantly positive and moderate (0.61). This means that
some schools changed ranking positions when value added was considered.
Some schools which in terms of raw results were thought to be doing well were
actually performing badly in terms of the progress made by their students. If
we consider the schools in the top ten in credit pass, we find that four of the
schools namely, 2, 6, 8 and 22 did badly in terms of added value. On the other
hand, school 13 doing badly in credit passes at position 24, added value and
moved to the top ten at position 10. Schools 11, 21 and 10 also moved to the top
ten in value added. School 3 at position 27, moved to position 24 although the
value added was negative. In addition, school 23 at position 3 in raw results,
was doing well in terms of value added and moved to position 1 while school
25 at position 1 in raw results was at position 3 in value added.
5.3.3 School effectiveness in 2007
The data for the 2007 sample is shown in Appendix 3, Table 3.1.The analysis
results yield the following model for the 2007 data subset:
The value added equation for 2007 schools in the fixed school slope model was
determined as TBGCSEij = (-30.39+u0j) + 1.37*TJCij. Table 5.3.3 below shows the
value added scores and their inverted rankings as calculated in Table 3.2 from
Appendix 3. The credit passes reported were obtained from Appendix 11.
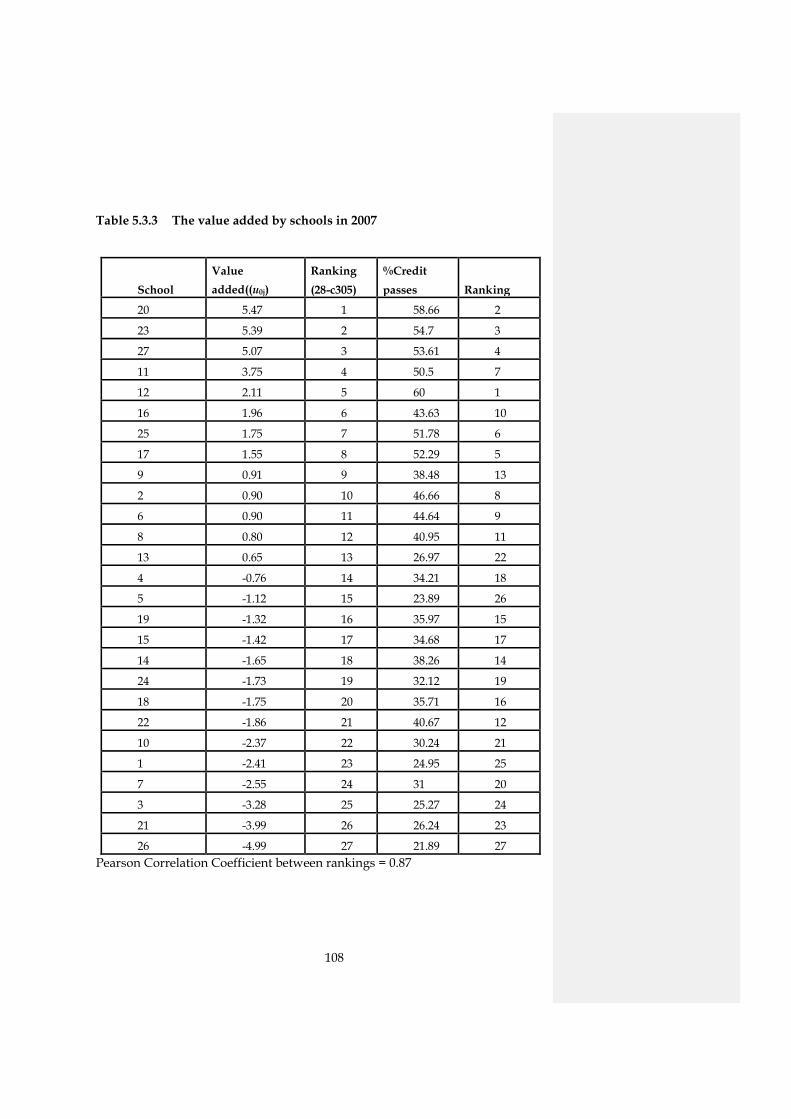
108
Table 5.3.3 The value added by schools in 2007
School Value added((u0j)
Ranking (28-c305)
%Credit passes Ranking
20 5.47 1 58.66 2
23 5.39 2 54.7 3
27 5.07 3 53.61 4
11 3.75 4 50.5 7
12 2.11 5 60 1
16 1.96 6 43.63 10
25 1.75 7 51.78 6
17 1.55 8 52.29 5
9 0.91 9 38.48 13
2 0.90 10 46.66 8
6 0.90 11 44.64 9
8 0.80 12 40.95 11
13 0.65 13 26.97 22
4 -0.76 14 34.21 18
5 -1.12 15 23.89 26
19 -1.32 16 35.97 15
15 -1.42 17 34.68 17
14 -1.65 18 38.26 14
24 -1.73 19 32.12 19
18 -1.75 20 35.71 16
22 -1.86 21 40.67 12
10 -2.37 22 30.24 21
1 -2.41 23 24.95 25
7 -2.55 24 31 20
3 -3.28 25 25.27 24
21 -3.99 26 26.24 23
26 -4.99 27 21.89 27 Pearson Correlation Coefficient between rankings = 0.87
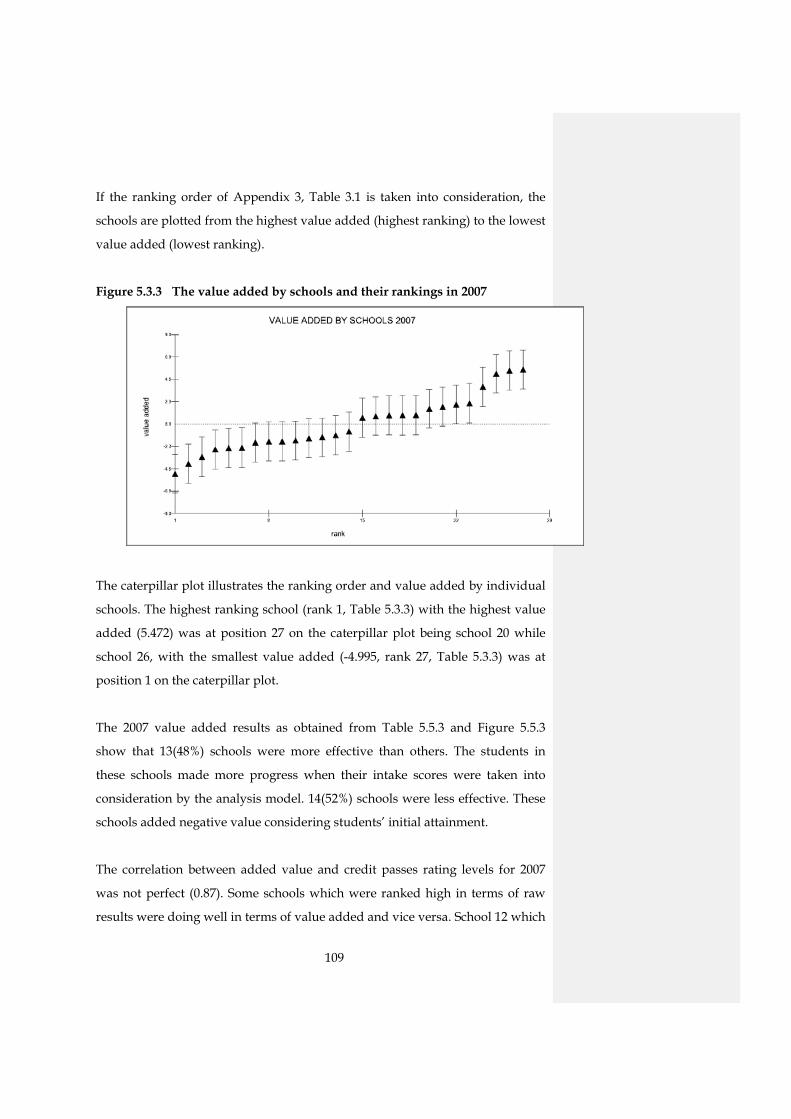
109
If the ranking order of Appendix 3, Table 3.1 is taken into consideration, the
schools are plotted from the highest value added (highest ranking) to the lowest
value added (lowest ranking).
Figure 5.3.3 The value added by schools and their rankings in 2007
The caterpillar plot illustrates the ranking order and value added by individual
schools. The highest ranking school (rank 1, Table 5.3.3) with the highest value
added (5.472) was at position 27 on the caterpillar plot being school 20 while
school 26, with the smallest value added (-4.995, rank 27, Table 5.3.3) was at
position 1 on the caterpillar plot.
The 2007 value added results as obtained from Table 5.5.3 and Figure 5.5.3
show that 13(48%) schools were more effective than others. The students in
these schools made more progress when their intake scores were taken into
consideration by the analysis model. 14(52%) schools were less effective. These
schools added negative value considering students’ initial attainment.
The correlation between added value and credit passes rating levels for 2007
was not perfect (0.87). Some schools which were ranked high in terms of raw
results were doing well in terms of value added and vice versa. School 12 which
110
was at position 1 in raw results was lower at position 5 in value added. School
17 moved down from 5 on raw results to 8 in value added while School 22 at
position 12 in credit pass ranking, was in fact adding negative value and moved
further down to position 21. School 11 moved from position 7 up to 4 in value
added ranking and school 9 from 13 up to 9. School 13 which was one of the
schools at the bottom in raw results at position 22, was doing well in terms of
progress made by students and moved further up to position 13. School 5 at
position 26 moved up to 15 in value added ranking.
When the effect of the years is considered, 2006 had the least effective schools
(10%), followed by 2007(13%) and 2005 had more effective schools (15%). The
fluctuations due to years were next removed by taking the average value added
by the schools for the three year period combined as shown in Table 5.3.4. The
average values yielded a single measure of schools’ effectiveness. The schools
inspectoral regions are also taken into consideration in order for comparisons to
be made between regions since the inspectoral region is contextual as
mentioned in Chapter 3 (cf. 3.5).
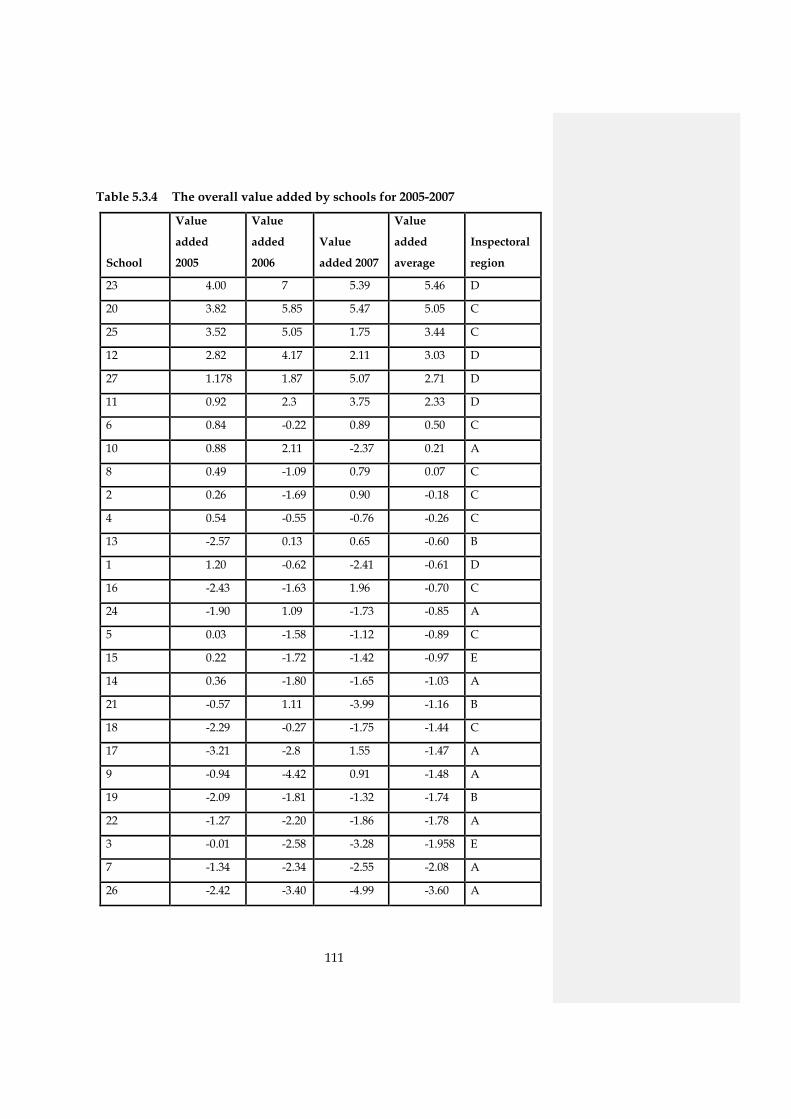
111
Table 5.3.4 The overall value added by schools for 2005-2007
School
Value
added
2005
Value
added
2006
Value
added 2007
Value
added
average
Inspectoral
region
23 4.00 7 5.39 5.46 D
20 3.82 5.85 5.47 5.05 C
25 3.52 5.05 1.75 3.44 C
12 2.82 4.17 2.11 3.03 D
27 1.178 1.87 5.07 2.71 D
11 0.92 2.3 3.75 2.33 D
6 0.84 -0.22 0.89 0.50 C
10 0.88 2.11 -2.37 0.21 A
8 0.49 -1.09 0.79 0.07 C
2 0.26 -1.69 0.90 -0.18 C
4 0.54 -0.55 -0.76 -0.26 C
13 -2.57 0.13 0.65 -0.60 B
1 1.20 -0.62 -2.41 -0.61 D
16 -2.43 -1.63 1.96 -0.70 C
24 -1.90 1.09 -1.73 -0.85 A
5 0.03 -1.58 -1.12 -0.89 C
15 0.22 -1.72 -1.42 -0.97 E
14 0.36 -1.80 -1.65 -1.03 A
21 -0.57 1.11 -3.99 -1.16 B
18 -2.29 -0.27 -1.75 -1.44 C
17 -3.21 -2.8 1.55 -1.47 A
9 -0.94 -4.42 0.91 -1.48 A
19 -2.09 -1.81 -1.32 -1.74 B
22 -1.27 -2.20 -1.86 -1.78 A
3 -0.01 -2.58 -3.28 -1.958 E
7 -1.34 -2.34 -2.55 -2.08 A
26 -2.42 -3.40 -4.99 -3.60 A
112
The value added means indicate that some schools were more effective than
others when initial intake was taken into consideration by the fixed slope
analysis model. 9(33%) schools were more effective than others. Pupils in these
schools progressed further than expected from their initial intake grading.
However, a lot of schools 18(67%) were ineffective. Students in these schools
made less progress than similar students (ability and gender) in other schools.
This finding demonstrates that schools do indeed make a difference. Some
schools exhibit a significant effect on students’ performance even after adjusting
for intake grading (Sammons et al., 1997:44). Two students with similar initial
intake levels can make different progress depending on which school she/he is
sent to. In the most effective school, the school actually added 5.46 points to
learners’ achievement, considering learners’ prior attainment. In the least
effective school, the school actually contributed to students performing 3.6
points below what they could have obtained, taking into account their prior
attainment. This indicates that effective schools have a competitive advantage.
The analysis also shows that some schools in which students appear to make
good progress in terms of raw results were in fact doing poorly in terms of
promoting learners’ progress while the reverse was true for other institutions
once allowance was made for the nature of their students’ intake grades. The
findings support the ongoing debate against the use of schools’ raw results as
indicators of school effectiveness and as a valid method for comparing schools.
On their own, raw results can be misleading (Sammons et al., 1993: 401;
Mortimore, Sammons & Thomas, 1994:321; Goldstein, 1996: 199; Goldstein &
Spiegelhalter, 1996:388; McPherson, 1997:190; Sammons et al., 1997:44;
Saunders, 1997:197; Wilson, 2003:17). Ranking schools on raw results only may
‘flatter’ the schools with high raw averages and depress those with low
averages. The results point to the value of utilising the value added approach of
multilevel models to compare schools. Dearing (in Strand, 1997:472) has warned
of the dangers of ignoring value added evaluations and the reliance on raw
results. He argues that:
113
…without a value added dimension, the obvious basis for judgement is
that higher scores represent better practice and lower scores worse and
this could lead to complacency on the part of some schools whose pupil
population comprise more able students, and conversely, to despair on
the part of others, who, however hard they try can never expect to raise
the level of their pupils’ scores to those obtained in schools with more
able pupils.
It is hypothesized that value added by schools is a function of the student’s
motivation, aptitude, behaviour and attitude towards learning (cf. Figure 3.1).
Tables 5.4.1 and 5.4.2 indicate that school 3 was effective only for girls in 2005
and 2006. The boys’ behaviour in school 3, where the researcher was Deputy
School Head in 2006-2007, was of such a nature that in 2007 the Form Four boys
were admitted as day scholars only. It is not surprising that the school was
effective for girls only. This is in line with the findings by Sammons et al.
(1997:154) who noted that teachers in their study on school and departmental
effectiveness reported that the students’ behaviour had to change for the better
before the schools could add value. They concluded that “the positive effects on
student learning are likely to operate through patterns of better attendance,
behaviour and motivation” (Sammons et al., 1997:172). The findings in the
present study seem to confirm the fact that the differences in the value added
by schools are systematically related to variations in schools’ climate, culture
and ethos. It will be worthwhile to investigate why school 16 was effective in
2007 while school 13 was becoming more effective
Schools also seem to become effective through a combination of factors which
were mentioned in the literature reviews and will be recapped briefly These are
effective leadership by the school management team (cf. 2.3.1); effective
teaching (cf. 2.3.2); academic emphasis (cf. 2.3.3); a positive school culture (cf.
2.3.9); high expectations (cf. 2.3.5); student involvement (cf. 2.3.7); monitoring
the progress of all students (cf. 2.3.6); a learning organisation (cf. 2.3.4): the
school continuously seeks ways of improving; parental involvement (cf. 2.3.8);
114
and consistency in approach to teaching discipline and enforcing rules and
regulations (cf. 3.4). Consistency in the school implies that the school function as
a team and not as fragmented units. It seems most likely that effective schools
in this study possess more of the processes found in the literature than the less
effective schools. Teachers and schools have the ability to change into becoming
effective when they adopt these effective school processes.
During the pastoral workshop for school management teams in 2007 when the
pastoral policy was introduced to schools (cf. 1.9), an example was given of a
school that used to be poor performer. The teachers in the school believed that
the students were ‘unteachable’. The school then got a new principal who
shared her vision for the school with the staff (a necessary component of
effective leadership). Through high expectations and collective teacher efficacy,
the leader and the teachers turned the school around to be one of the best in the
country. Indeed school 23, was top on the list of effective schools (cf. 5.3.2 and
5.3.3).
In the present study, another example of influential factor combinations
mentioned in the literature (cf. 2.3.5) reflect the expectations by teachers, across
subjects in one of the least effective schools, which revealed that teachers’
expectations and students’ behaviour can hinder achievement. Going through
teachers’ comments on the performance in their subjects in 2006, the following
combinations of the factors were revealed, namely:
Setswana: They were academically weak, didn’t care much about school
work. Their result is a true reflection.
Setswana: both classes were academically weak
Chemistry: Single and double science students have a negative attitude
towards the subjects.
Chemistry: Generally the students did not do well especially the single
science. This is because of their negative attitude towards the subject.
5C was a single science class who are not gifted in academics. Most of
them were not gifted but a few could do better if they worked very hard.
115
They did not care much about their school work and there was a
problem of indiscipline.
5B was a dull lot and they were too silent in class. These results are their
true reflection
Mathematics: 5K was a double science that consistent of notorious
students who did not have learning time. Very rude and disruptive
students; law breakers of the school. They couldn’t even have time for
Mathematics clinics.
Biology: 5R students performed to my expectation, they were generally
clever students.
Biology: 5H was the worst, they were low ability students as compared
to others.
English: …and I associate this with the student attitude towards
learning.
Literature in English: The students’ immutable attitudes not only excel
in the above noted course to pursue other texts extensively paid
dividends at the end.
Schools in Botswana are located within five inspectoral regions (A-E). Table
5.3.4 shows that region E has two schools which are both ineffective regarding
average value added. Region A has one effective school out of eight schools
while region C with eight schools has three effective schools and region B has
one effective school out of the four schools. Region D has more effective
schools: four out of five. It might be difficult to reach conclusions based on the
inspectoral area. However, influential factors might be operational in the areas
such as: parental involvement and students’ motivation. The effective schools
might have had greater parental interest and involvement in their children’s
education not enjoyed by the less effective schools. However, it will be more
appropriate to investigate which factors were operating at the regional level
such as those listed above and other factors such as assistance to schools by the
Education Officers and Teacher Training and Development in the regions. What
is however apparent in this regard is that, some Education Officers at whatever
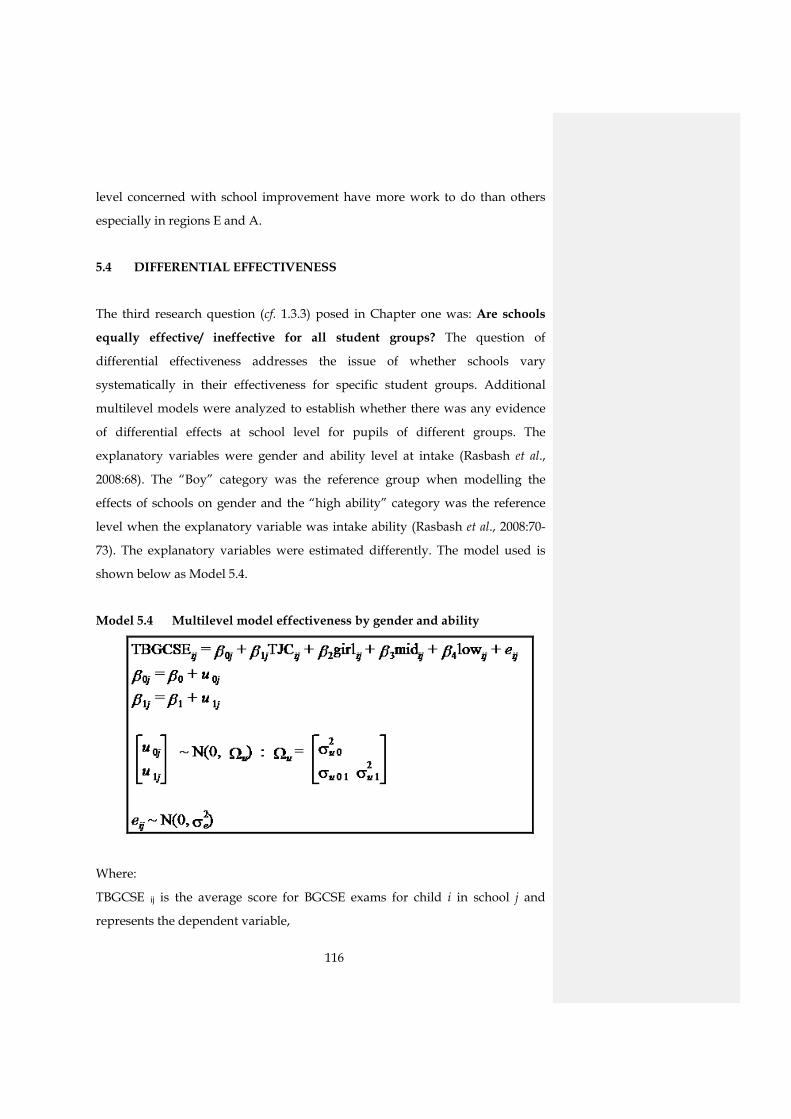
116
level concerned with school improvement have more work to do than others
especially in regions E and A.
5.4 DIFFERENTIAL EFFECTIVENESS
The third research question (cf. 1.3.3) posed in Chapter one was: Are schools
equally effective/ ineffective for all student groups? The question of
differential effectiveness addresses the issue of whether schools vary
systematically in their effectiveness for specific student groups. Additional
multilevel models were analyzed to establish whether there was any evidence
of differential effects at school level for pupils of different groups. The
explanatory variables were gender and ability level at intake (Rasbash et al.,
2008:68). The “Boy” category was the reference group when modelling the
effects of schools on gender and the “high ability” category was the reference
level when the explanatory variable was intake ability (Rasbash et al., 2008:70-
73). The explanatory variables were estimated differently. The model used is
shown below as Model 5.4.
Model 5.4 Multilevel model effectiveness by gender and ability
Where:
TBGCSE ij is the average score for BGCSE exams for child i in school j and
represents the dependent variable,
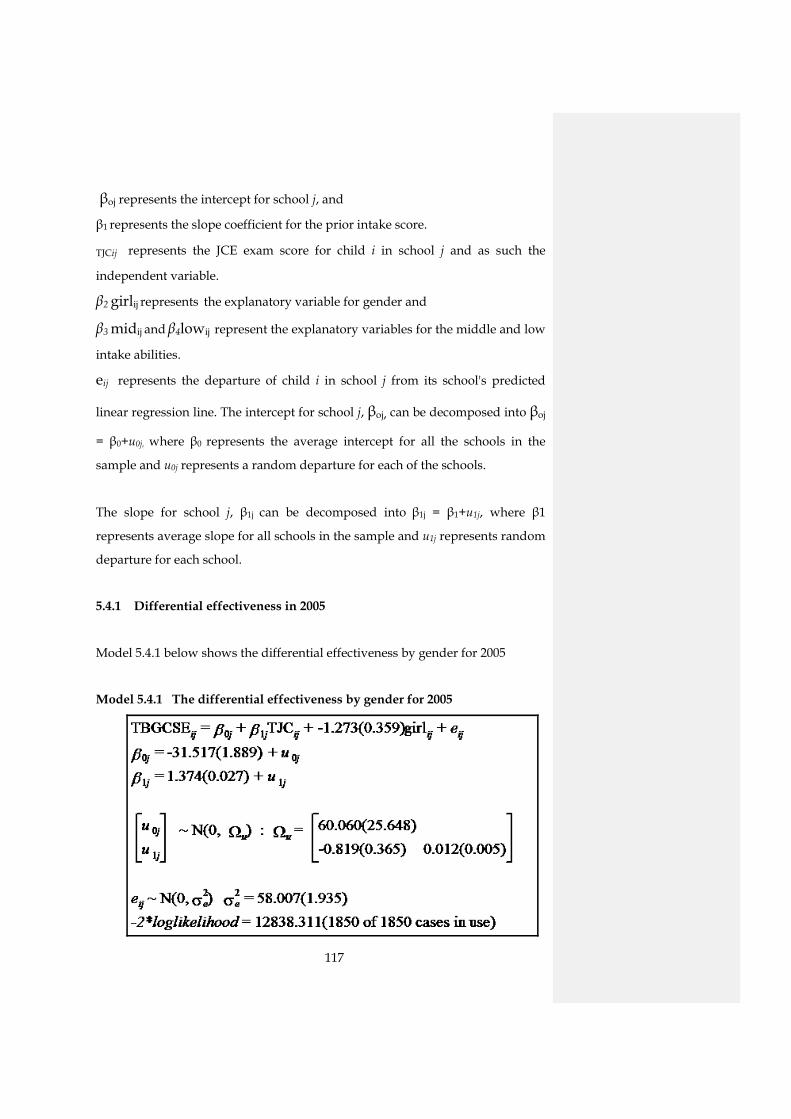
117
βoj represents the intercept for school j, and
β1 represents the slope coefficient for the prior intake score.
TJCij represents the JCE exam score for child i in school j and as such the
independent variable.
β2 girlij represents the explanatory variable for gender and
β3 midij and β4lowij represent the explanatory variables for the middle and low
intake abilities.
eij represents the departure of child i in school j from its school's predicted
linear regression line. The intercept for school j, βoj, can be decomposed into βoj
= β0+u0j, where β0 represents the average intercept for all the schools in the
sample and u0j represents a random departure for each of the schools.
The slope for school j, β1j can be decomposed into β1j = β1+u1j, where β1
represents average slope for all schools in the sample and u1j represents random
departure for each school.
5.4.1 Differential effectiveness in 2005
Model 5.4.1 below shows the differential effectiveness by gender for 2005
Model 5.4.1 The differential effectiveness by gender for 2005
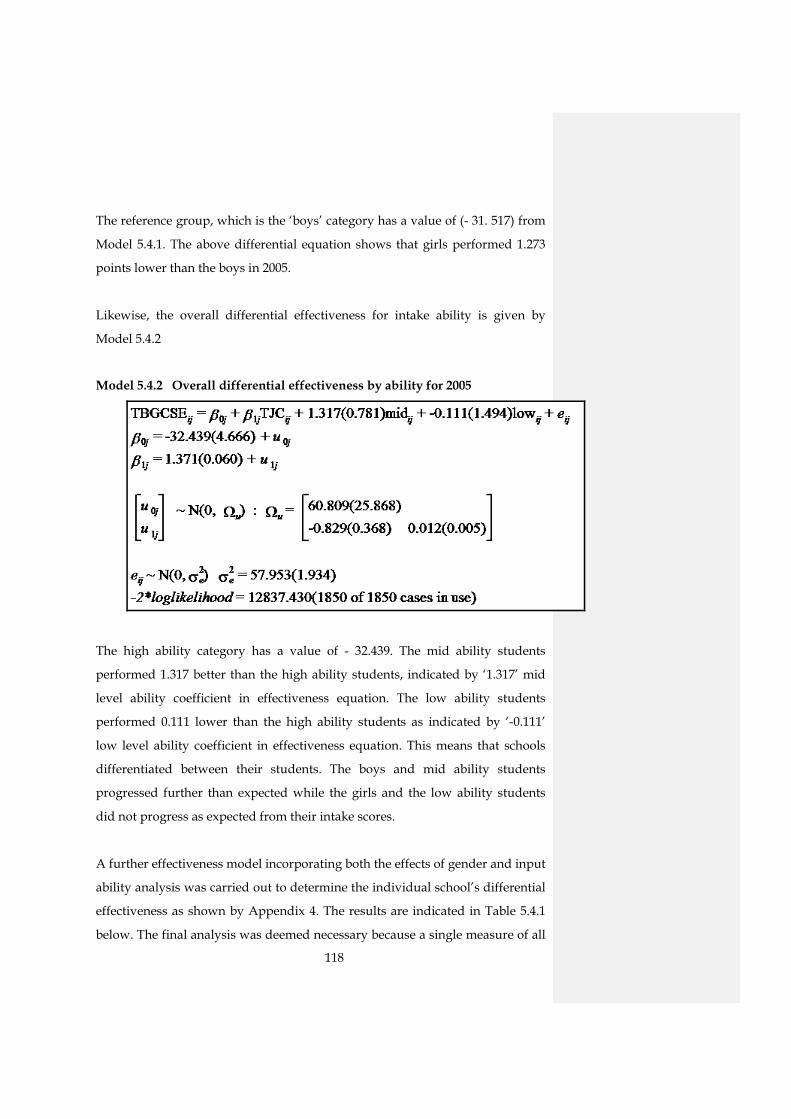
118
The reference group, which is the ‘boys’ category has a value of (- 31. 517) from
Model 5.4.1. The above differential equation shows that girls performed 1.273
points lower than the boys in 2005.
Likewise, the overall differential effectiveness for intake ability is given by
Model 5.4.2
Model 5.4.2 Overall differential effectiveness by ability for 2005
The high ability category has a value of - 32.439. The mid ability students
performed 1.317 better than the high ability students, indicated by ‘1.317’ mid
level ability coefficient in effectiveness equation. The low ability students
performed 0.111 lower than the high ability students as indicated by ‘-0.111’
low level ability coefficient in effectiveness equation. This means that schools
differentiated between their students. The boys and mid ability students
progressed further than expected while the girls and the low ability students
did not progress as expected from their intake scores.
A further effectiveness model incorporating both the effects of gender and input
ability analysis was carried out to determine the individual school’s differential
effectiveness as shown by Appendix 4. The results are indicated in Table 5.4.1
below. The final analysis was deemed necessary because a single measure of all
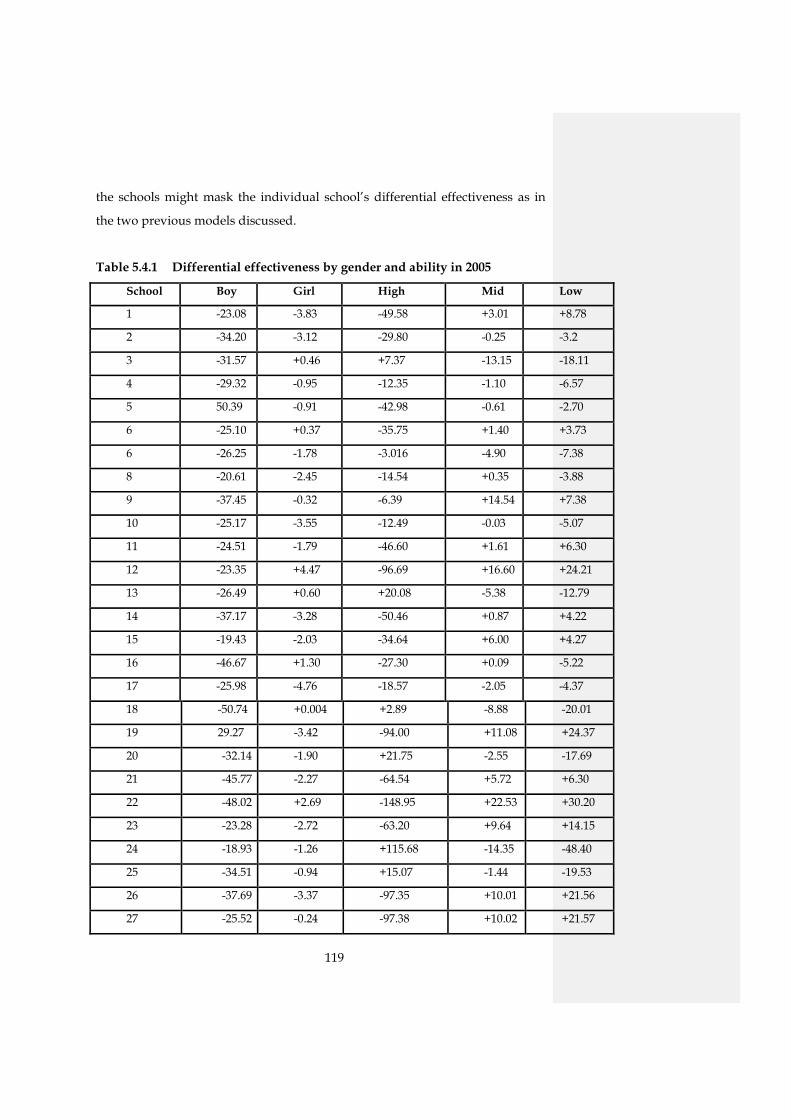
119
the schools might mask the individual school’s differential effectiveness as in
the two previous models discussed.
Table 5.4.1 Differential effectiveness by gender and ability in 2005
School Boy Girl High Mid Low
1 -23.08 -3.83 -49.58 +3.01 +8.78
2 -34.20 -3.12 -29.80 -0.25 -3.2
3 -31.57 +0.46 +7.37 -13.15 -18.11
4 -29.32 -0.95 -12.35 -1.10 -6.57
5 50.39 -0.91 -42.98 -0.61 -2.70
6 -25.10 +0.37 -35.75 +1.40 +3.73
6 -26.25 -1.78 -3.016 -4.90 -7.38
8 -20.61 -2.45 -14.54 +0.35 -3.88
9 -37.45 -0.32 -6.39 +14.54 +7.38
10 -25.17 -3.55 -12.49 -0.03 -5.07
11 -24.51 -1.79 -46.60 +1.61 +6.30
12 -23.35 +4.47 -96.69 +16.60 +24.21
13 -26.49 +0.60 +20.08 -5.38 -12.79
14 -37.17 -3.28 -50.46 +0.87 +4.22
15 -19.43 -2.03 -34.64 +6.00 +4.27
16 -46.67 +1.30 -27.30 +0.09 -5.22
17 -25.98 -4.76 -18.57 -2.05 -4.37
18 -50.74 +0.004 +2.89 -8.88 -20.01
19 29.27 -3.42 -94.00 +11.08 +24.37
20 -32.14 -1.90 +21.75 -2.55 -17.69
21 -45.77 -2.27 -64.54 +5.72 +6.30
22 -48.02 +2.69 -148.95 +22.53 +30.20
23 -23.28 -2.72 -63.20 +9.64 +14.15
24 -18.93 -1.26 +115.68 -14.35 -48.40
25 -34.51 -0.94 +15.07 -1.44 -19.53
26 -37.69 -3.37 -97.35 +10.01 +21.56
27 -25.52 -0.24 -97.38 +10.02 +21.57
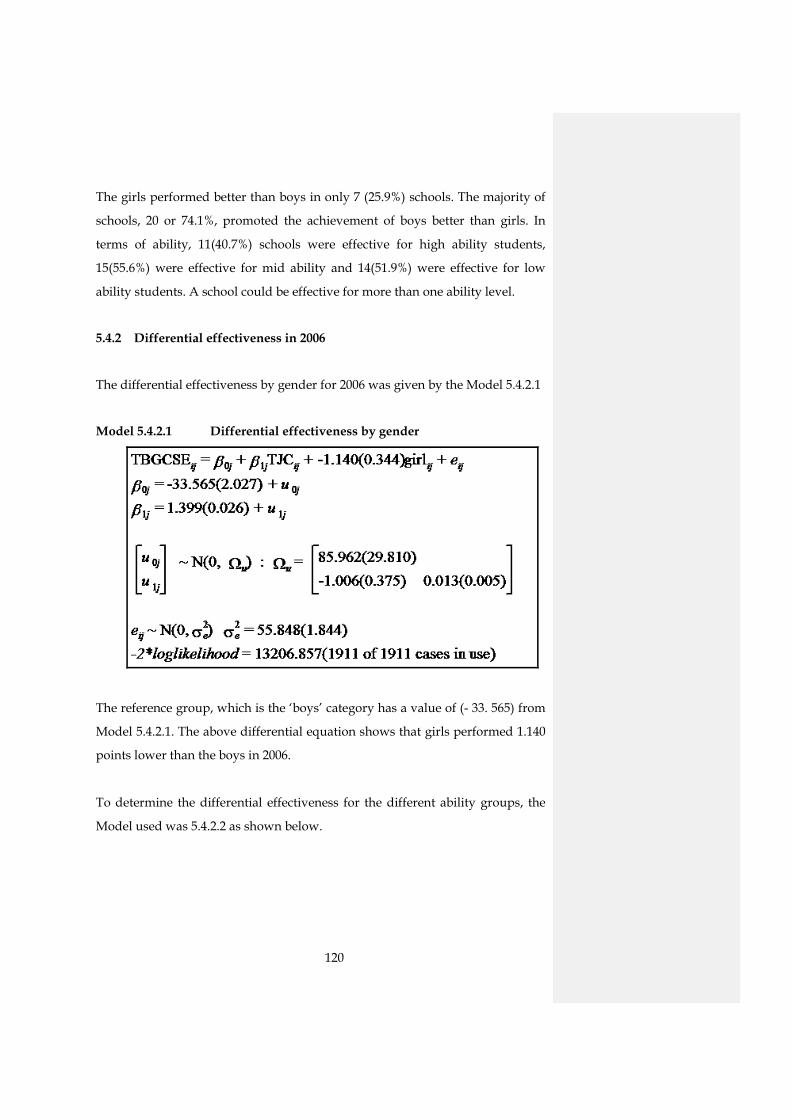
120
The girls performed better than boys in only 7 (25.9%) schools. The majority of
schools, 20 or 74.1%, promoted the achievement of boys better than girls. In
terms of ability, 11(40.7%) schools were effective for high ability students,
15(55.6%) were effective for mid ability and 14(51.9%) were effective for low
ability students. A school could be effective for more than one ability level.
5.4.2 Differential effectiveness in 2006
The differential effectiveness by gender for 2006 was given by the Model 5.4.2.1
Model 5.4.2.1 Differential effectiveness by gender
The reference group, which is the ‘boys’ category has a value of (- 33. 565) from
Model 5.4.2.1. The above differential equation shows that girls performed 1.140
points lower than the boys in 2006.
To determine the differential effectiveness for the different ability groups, the
Model used was 5.4.2.2 as shown below.
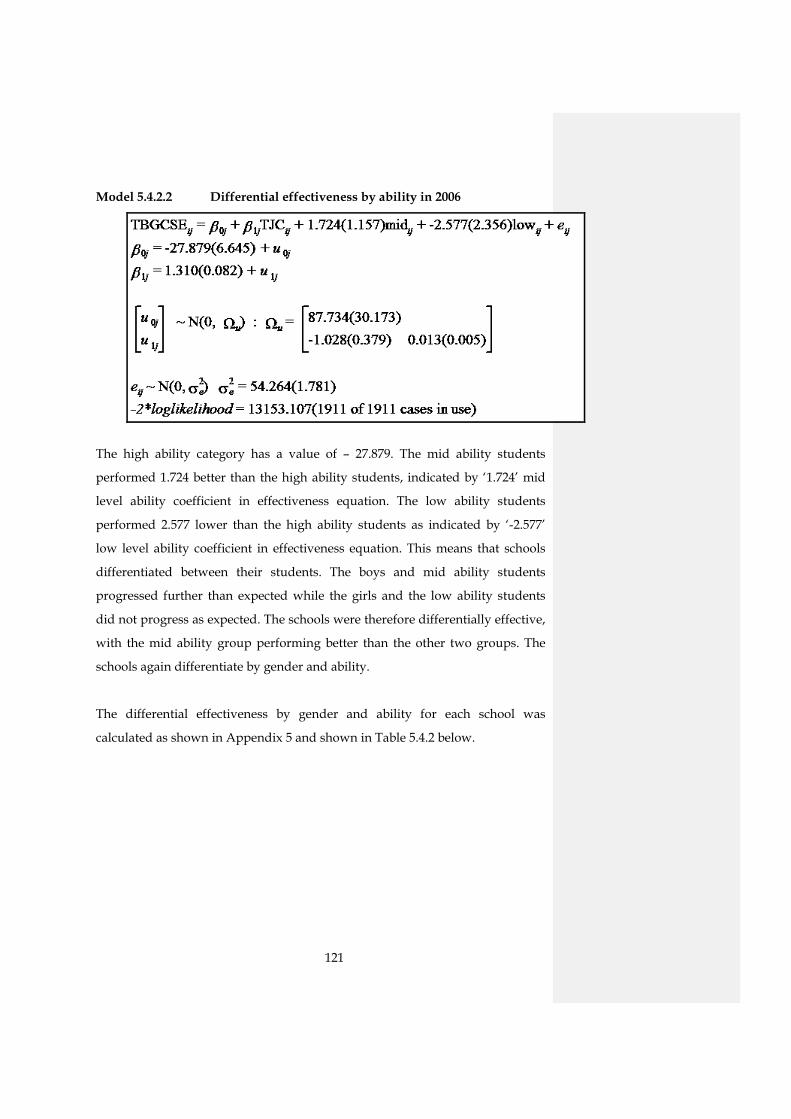
121
Model 5.4.2.2 Differential effectiveness by ability in 2006
The high ability category has a value of – 27.879. The mid ability students
performed 1.724 better than the high ability students, indicated by ‘1.724’ mid
level ability coefficient in effectiveness equation. The low ability students
performed 2.577 lower than the high ability students as indicated by ‘-2.577’
low level ability coefficient in effectiveness equation. This means that schools
differentiated between their students. The boys and mid ability students
progressed further than expected while the girls and the low ability students
did not progress as expected. The schools were therefore differentially effective,
with the mid ability group performing better than the other two groups. The
schools again differentiate by gender and ability.
The differential effectiveness by gender and ability for each school was
calculated as shown in Appendix 5 and shown in Table 5.4.2 below.
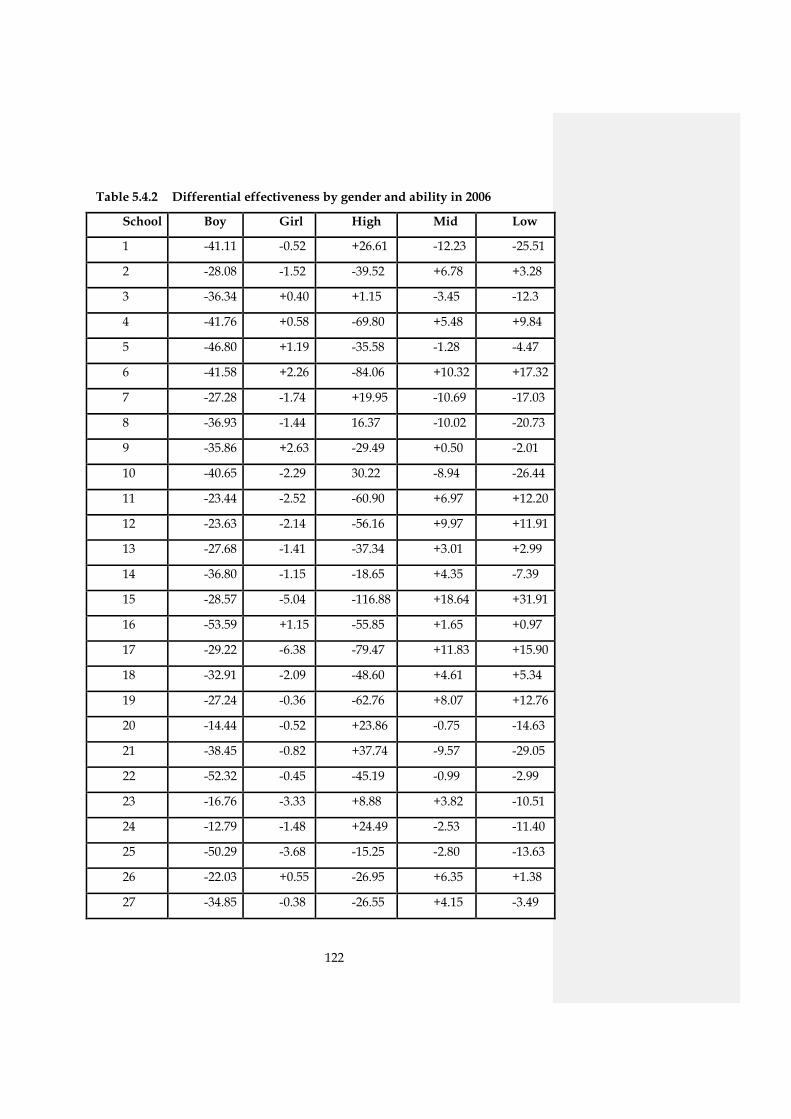
122
Table 5.4.2 Differential effectiveness by gender and ability in 2006
School Boy Girl High Mid Low
1 -41.11 -0.52 +26.61 -12.23 -25.51
2 -28.08 -1.52 -39.52 +6.78 +3.28
3 -36.34 +0.40 +1.15 -3.45 -12.3
4 -41.76 +0.58 -69.80 +5.48 +9.84
5 -46.80 +1.19 -35.58 -1.28 -4.47
6 -41.58 +2.26 -84.06 +10.32 +17.32
7 -27.28 -1.74 +19.95 -10.69 -17.03
8 -36.93 -1.44 16.37 -10.02 -20.73
9 -35.86 +2.63 -29.49 +0.50 -2.01
10 -40.65 -2.29 30.22 -8.94 -26.44
11 -23.44 -2.52 -60.90 +6.97 +12.20
12 -23.63 -2.14 -56.16 +9.97 +11.91
13 -27.68 -1.41 -37.34 +3.01 +2.99
14 -36.80 -1.15 -18.65 +4.35 -7.39
15 -28.57 -5.04 -116.88 +18.64 +31.91
16 -53.59 +1.15 -55.85 +1.65 +0.97
17 -29.22 -6.38 -79.47 +11.83 +15.90
18 -32.91 -2.09 -48.60 +4.61 +5.34
19 -27.24 -0.36 -62.76 +8.07 +12.76
20 -14.44 -0.52 +23.86 -0.75 -14.63
21 -38.45 -0.82 +37.74 -9.57 -29.05
22 -52.32 -0.45 -45.19 -0.99 -2.99
23 -16.76 -3.33 +8.88 +3.82 -10.51
24 -12.79 -1.48 +24.49 -2.53 -11.40
25 -50.29 -3.68 -15.25 -2.80 -13.63
26 -22.03 +0.55 -26.95 +6.35 +1.38
27 -34.85 -0.38 -26.55 +4.15 -3.49

123
In 2006, 7 (25.9%) schools promoted the progress of girls more than boys while
in the majority of schools, 20 or 74.1% the opposite was true. In terms of ability,
11 (40.7%) schools promoted the progress of high ability students, 12 (44.4%)
promoted achievement for the low ability students and the majority, 16 (59.3%)
promoted the progress for mid ability students. Once again a school could be
effective for more than one group, for example, school 2 was effective for the
mid and low ability students.
5.4.3 Differential effectiveness in 2007
The differential effectiveness by gender in 2007 for all the schools is given by
Model 5.4.3.1.
5.4.3.1 Differential effectiveness by gender in 2007
The reference group, which is the ‘boys’ category has a value of - 29.285 from
Model 5.4.3.1. The above differential equation shows that girls performed 1.814
points lower than the boys in 2007.
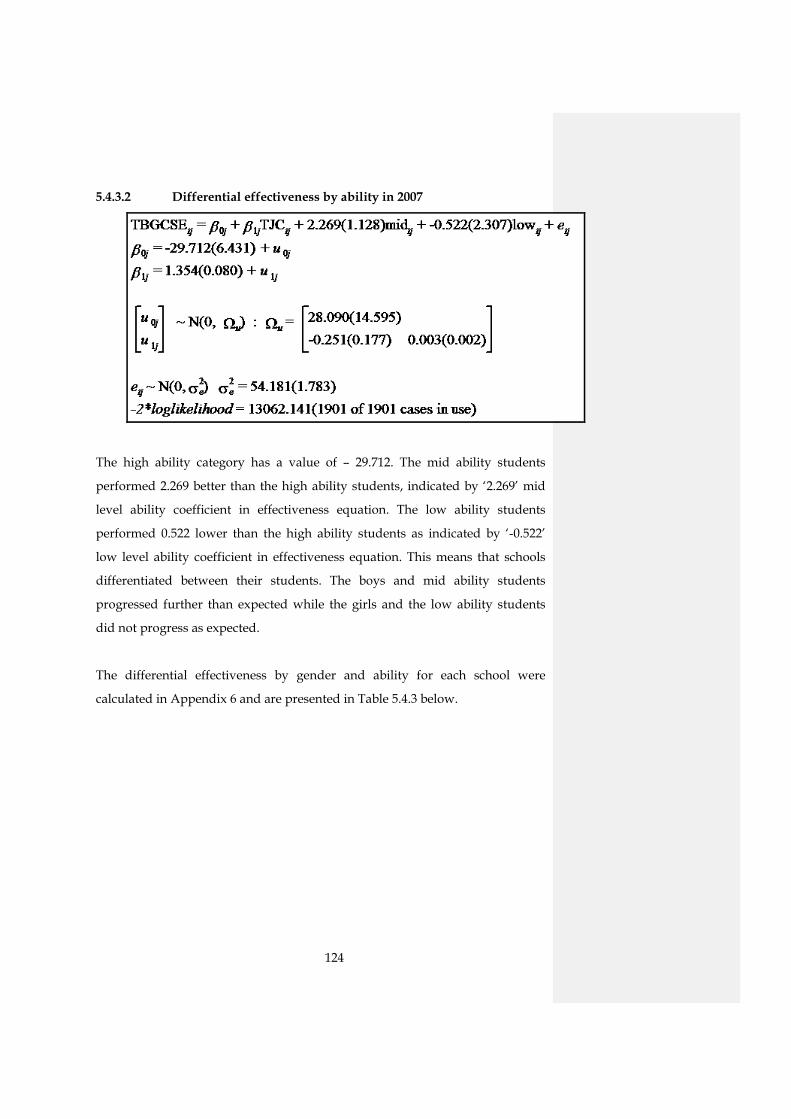
124
5.4.3.2 Differential effectiveness by ability in 2007
The high ability category has a value of – 29.712. The mid ability students
performed 2.269 better than the high ability students, indicated by ‘2.269’ mid
level ability coefficient in effectiveness equation. The low ability students
performed 0.522 lower than the high ability students as indicated by ‘-0.522’
low level ability coefficient in effectiveness equation. This means that schools
differentiated between their students. The boys and mid ability students
progressed further than expected while the girls and the low ability students
did not progress as expected.
The differential effectiveness by gender and ability for each school were
calculated in Appendix 6 and are presented in Table 5.4.3 below.
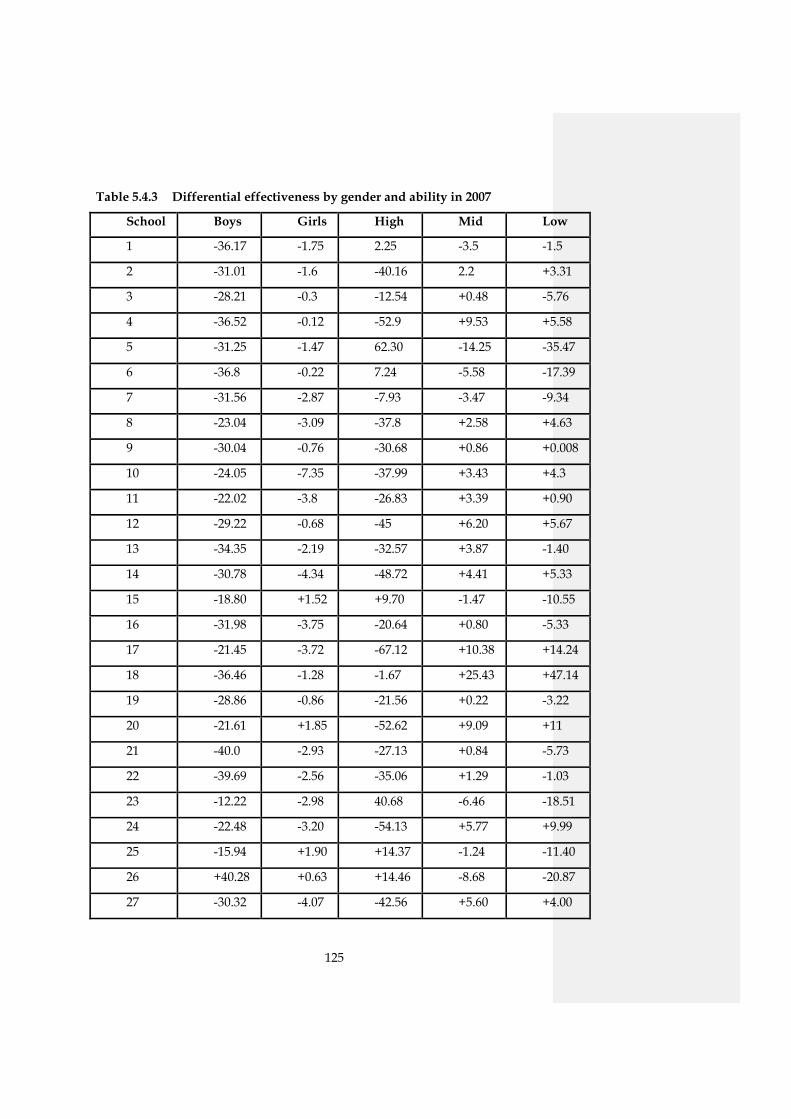
125
Table 5.4.3 Differential effectiveness by gender and ability in 2007
School Boys Girls High Mid Low
1 -36.17 -1.75 2.25 -3.5 -1.5
2 -31.01 -1.6 -40.16 2.2 +3.31
3 -28.21 -0.3 -12.54 +0.48 -5.76
4 -36.52 -0.12 -52.9 +9.53 +5.58
5 -31.25 -1.47 62.30 -14.25 -35.47
6 -36.8 -0.22 7.24 -5.58 -17.39
7 -31.56 -2.87 -7.93 -3.47 -9.34
8 -23.04 -3.09 -37.8 +2.58 +4.63
9 -30.04 -0.76 -30.68 +0.86 +0.008
10 -24.05 -7.35 -37.99 +3.43 +4.3
11 -22.02 -3.8 -26.83 +3.39 +0.90
12 -29.22 -0.68 -45 +6.20 +5.67
13 -34.35 -2.19 -32.57 +3.87 -1.40
14 -30.78 -4.34 -48.72 +4.41 +5.33
15 -18.80 +1.52 +9.70 -1.47 -10.55
16 -31.98 -3.75 -20.64 +0.80 -5.33
17 -21.45 -3.72 -67.12 +10.38 +14.24
18 -36.46 -1.28 -1.67 +25.43 +47.14
19 -28.86 -0.86 -21.56 +0.22 -3.22
20 -21.61 +1.85 -52.62 +9.09 +11
21 -40.0 -2.93 -27.13 +0.84 -5.73
22 -39.69 -2.56 -35.06 +1.29 -1.03
23 -12.22 -2.98 40.68 -6.46 -18.51
24 -22.48 -3.20 -54.13 +5.77 +9.99
25 -15.94 +1.90 +14.37 -1.24 -11.40
26 +40.28 +0.63 +14.46 -8.68 -20.87
27 -30.32 -4.07 -42.56 +5.60 +4.00
126
The differential effectiveness by individual schools shows that only 4 (14.8%)
schools were effective for girls. The majority, 23 or 85.2% of schools promoted
the achievement of boys. In terms of ability, 6 (22%) promoted the achievement
of high ability students, the middle ability progressed more than others in 19
(70.3%) schools whereas 13 (48.1%) schools promoted the achievement of low
ability students. More schools therefore, promoted the achievement of the
middle ability students and that is why the overall result shows that the schools
were more effective for mid ability students than any other group. The progress
made by middle and low students was greatest in school 18.
These results show that for some institutions, there were substantial differences
in the average progress of the most able and the least able students and that a
single measure of effectiveness may mask the important differences within an
institution. These findings are in line with the findings of some earlier work on
differential effectiveness. Nuttall et al. (1989:775-776) and Goldstein (1996:200)
found that schools were differentially effective for different student groups and
therefore, it would be misleading to try to summarise the differences in a single
quantity.
Smith and Tomlinson (in Sammons et al., 1993:382-383) also found some
evidence for the existence of differential effectiveness for pupils of different
levels of prior attainment. Jesson and Gray (1991:246) conclude from their work
that it was of no doubt that “pupils of whatever prior attainment level did
better in some schools than in others”. Later studies supported these earlier
conclusions, for example, Goldstein and Thomas (1996:157-158) note that there
were some substantial differences between the most and least able students in
some institutions. Since there is a substantial evidence for differential
effectiveness in schools, Sammons et al. (1997:51-52) conclude that “there is a
need for schools to examine in detail the value added performance of different
groups of students in terms of gender, prior attainment, low income and
ethnicity”.
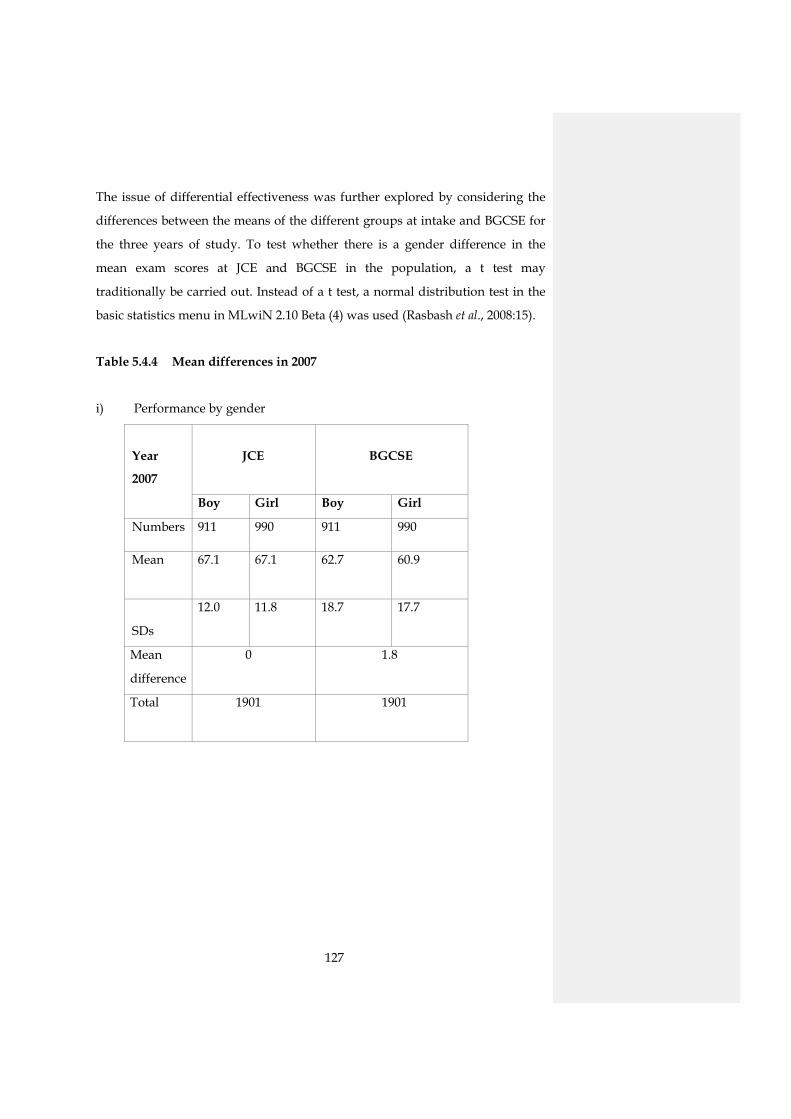
127
The issue of differential effectiveness was further explored by considering the
differences between the means of the different groups at intake and BGCSE for
the three years of study. To test whether there is a gender difference in the
mean exam scores at JCE and BGCSE in the population, a t test may
traditionally be carried out. Instead of a t test, a normal distribution test in the
basic statistics menu in MLwiN 2.10 Beta (4) was used (Rasbash et al., 2008:15).
Table 5.4.4 Mean differences in 2007
i) Performance by gender
Year
2007
JCE
BGCSE
Boy Girl Boy Girl
Numbers 911 990 911 990
Mean 67.1
67.1
62.7
60.9
SDs
12.0
11.8
18.7
17.7
Mean
difference
0 1.8
Total
1901 1901
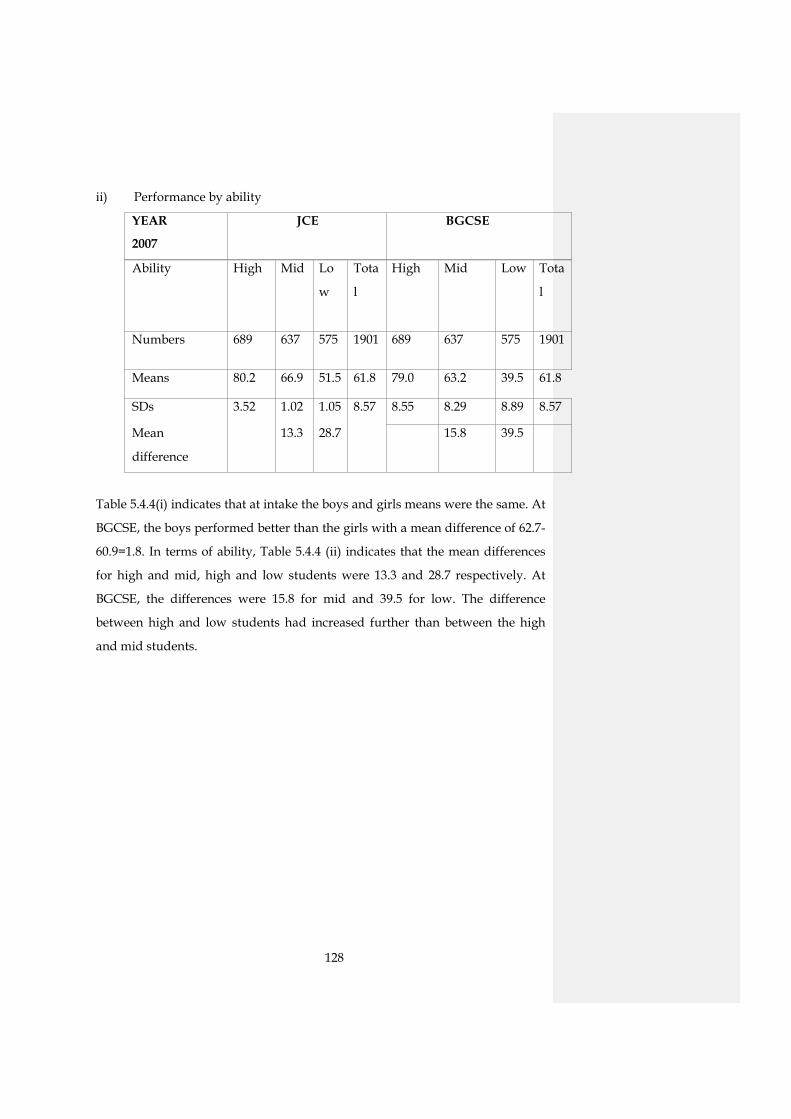
128
ii) Performance by ability
YEAR
2007
JCE BGCSE
Ability High
Mid
Lo
w
Tota
l
High
Mid
Low
Tota
l
Numbers 689 637 575 1901 689 637 575 1901
Means 80.2 66.9 51.5 61.8 79.0 63.2 39.5 61.8
SDs 3.52 1.02 1.05 8.57 8.55 8.29 8.89 8.57
Mean
difference
13.3 28.7
15.8 39.5
Table 5.4.4(i) indicates that at intake the boys and girls means were the same. At
BGCSE, the boys performed better than the girls with a mean difference of 62.7-
60.9=1.8. In terms of ability, Table 5.4.4 (ii) indicates that the mean differences
for high and mid, high and low students were 13.3 and 28.7 respectively. At
BGCSE, the differences were 15.8 for mid and 39.5 for low. The difference
between high and low students had increased further than between the high
and mid students.
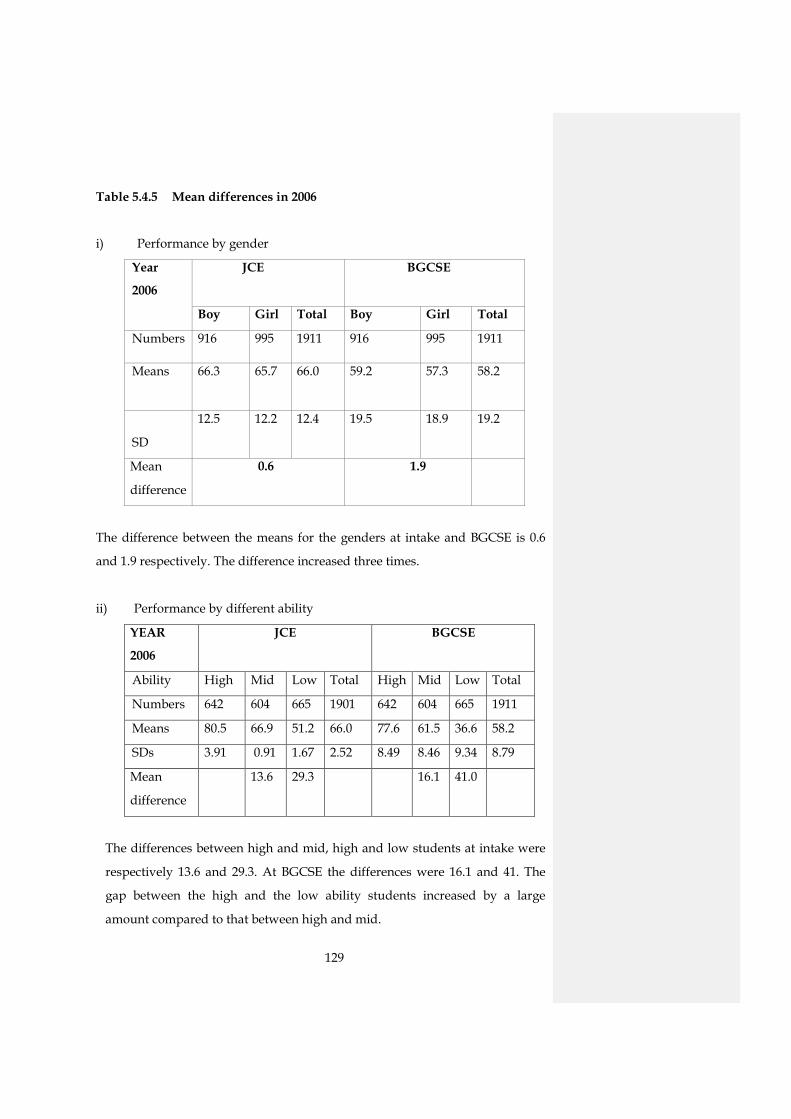
129
Table 5.4.5 Mean differences in 2006
i) Performance by gender
Year
2006
JCE
BGCSE
Boy Girl Total Boy Girl Total
Numbers 916 995 1911 916 995 1911
Means 66.3
65.7
66.0
59.2
57.3
58.2
SD
12.5
12.2
12.4
19.5
18.9
19.2
Mean
difference
0.6 1.9
The difference between the means for the genders at intake and BGCSE is 0.6
and 1.9 respectively. The difference increased three times.
ii) Performance by different ability
YEAR
2006
JCE BGCSE
Ability High Mid Low Total High Mid Low Total
Numbers 642 604 665 1901 642 604 665 1911
Means 80.5 66.9 51.2 66.0 77.6 61.5 36.6 58.2
SDs 3.91 0.91 1.67 2.52 8.49 8.46 9.34 8.79
Mean
difference
13.6 29.3
16.1 41.0
The differences between high and mid, high and low students at intake were
respectively 13.6 and 29.3. At BGCSE the differences were 16.1 and 41. The
gap between the high and the low ability students increased by a large
amount compared to that between high and mid.
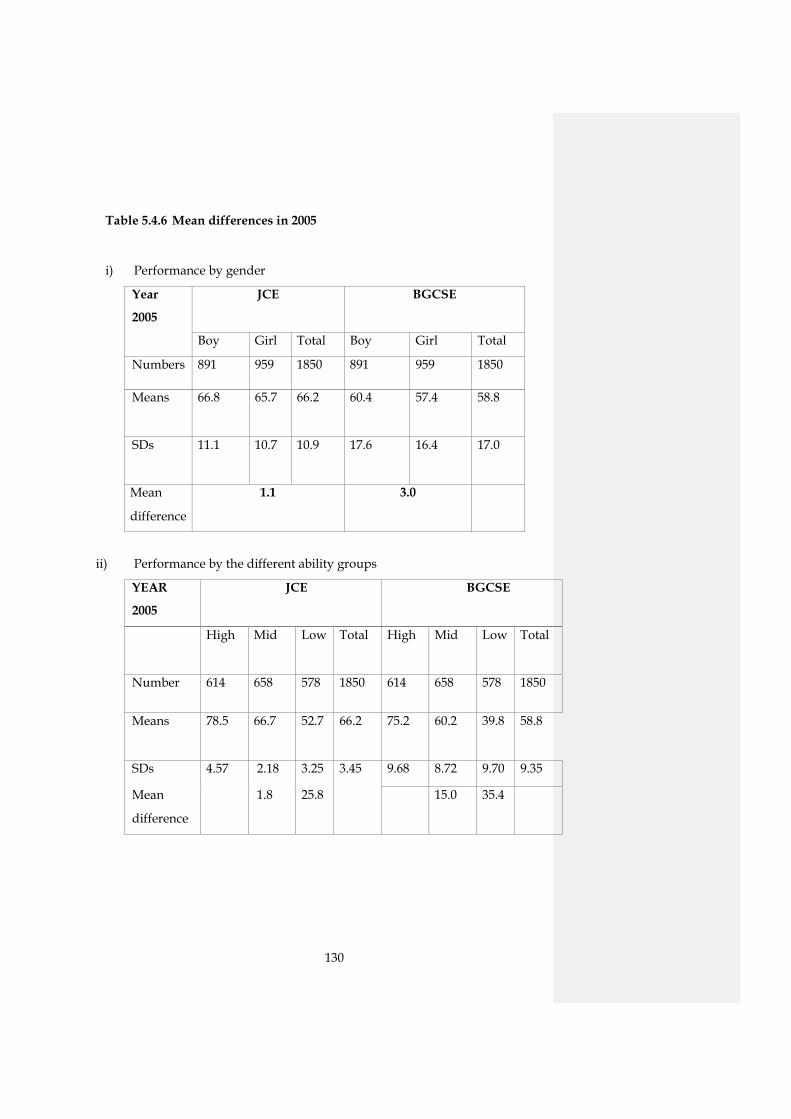
130
Table 5.4.6 Mean differences in 2005
i) Performance by gender
Year
2005
JCE
BGCSE
Boy Girl Total Boy Girl Total
Numbers 891 959 1850 891 959 1850
Means 66.8
65.7
66.2
60.4
57.4
58.8
SDs 11.1
10.7
10.9
17.6
16.4
17.0
Mean
difference
1.1 3.0
ii) Performance by the different ability groups
YEAR
2005
JCE BGCSE
High
Mid
Low
Total
High
Mid
Low
Total
Number 614 658 578 1850 614 658 578 1850
Means 78.5
66.7 52.7 66.2 75.2
60.2 39.8 58.8
SDs 4.57 2.18 3.25 3.45 9.68 8.72 9.70 9.35
Mean
difference
1.8
25.8
15.0 35.4
131
From Table 5.4.5 (i), the mean difference between boys and girls at intake was
1.1 and at BGCSE it was 3 having almost tripled. Table 5.4.5 (ii) indicates that
the mean difference between high and mid and high and low were 11.8 and 25.8
respectively at intake. At BGCSE the differences are 15 and 35.4 between high
and mid, high and low respectively. The gap between the high and low ability
groups had widened substantially.
What emerges from the study is that at intake the girls’ means are lower than
the boys’. At BGCSE, the performance gap widened up to three times. This
could only happen if it were expected of girls not to perform as good as boys
do. These findings contribute to similar findings on gender equity. It has been
observed that in the Botswana education sector, more girls enter primary
education than boys but the number gets depleted at the senior secondary,
tertiary and technical education levels. This causes women to be disadvantaged
in their employment opportunities and to be under represented in key decision
making positions (Vision 2016, 1997:19). The findings have implications
concerning the differential learning experiences of girls which schools might
not be taking into consideration, as well as the expectations that teachers might
have for girls. To this end, Vision 2016 (1997:31) notes that teachers need to
change attitudes that discriminate against female students. The gender equity is
a major challenge that might hinder the attainment of the goal of educational
equity.
The use of raw results in a competitive quasi marketplace like education where
having high ranks is seen as good practice, may put pressure on schools to
concentrate efforts only on those students on the grade C/grade D borderline in
order to increase the credit passes and neglect the high or low performing
students (Goldstein, 1996:202). This might explain why the schools in this study
were more effective for the mid ability group more than any other group.
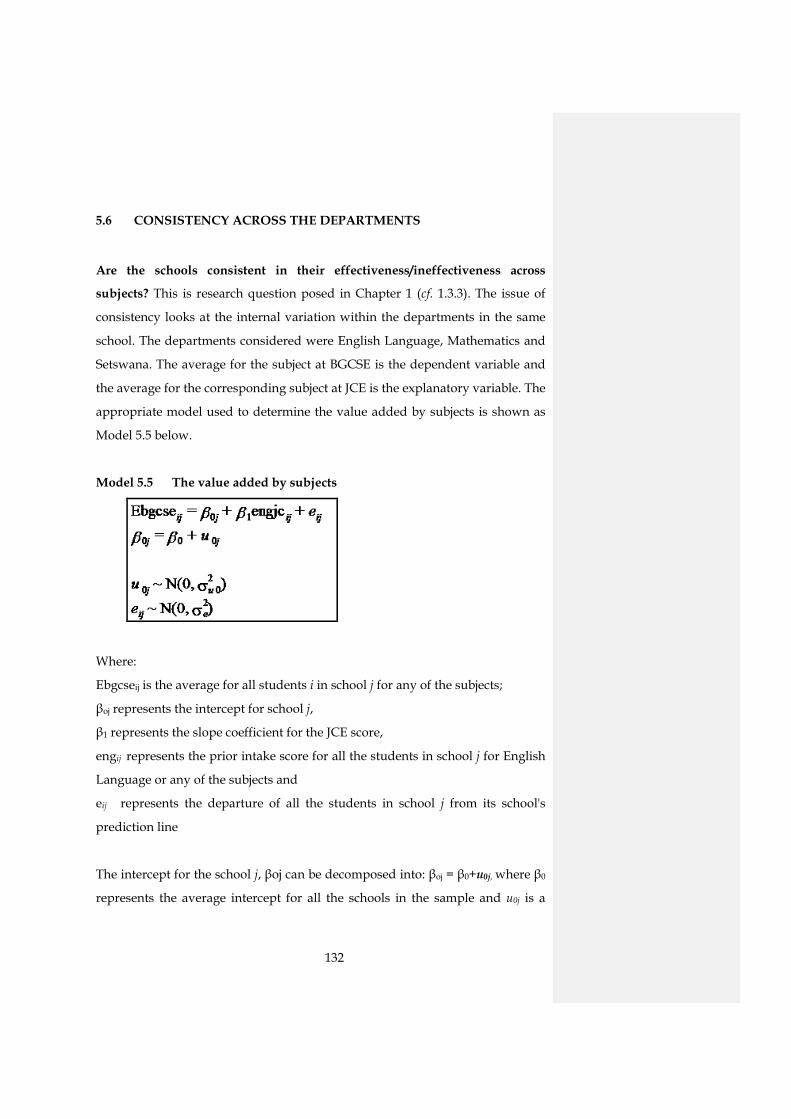
132
5.6 CONSISTENCY ACROSS THE DEPARTMENTS
Are the schools consistent in their effectiveness/ineffectiveness across
subjects? This is research question posed in Chapter 1 (cf. 1.3.3). The issue of
consistency looks at the internal variation within the departments in the same
school. The departments considered were English Language, Mathematics and
Setswana. The average for the subject at BGCSE is the dependent variable and
the average for the corresponding subject at JCE is the explanatory variable. The
appropriate model used to determine the value added by subjects is shown as
Model 5.5 below.
Model 5.5 The value added by subjects
Where:
Ebgcseij is the average for all students i in school j for any of the subjects;
βoj represents the intercept for school j,
β1 represents the slope coefficient for the JCE score,
engij represents the prior intake score for all the students in school j for English
Language or any of the subjects and
eij represents the departure of all the students in school j from its school's
prediction line
The intercept for the school j, βoj can be decomposed into: βoj = β0+u0j, where β0
represents the average intercept for all the schools in the sample and u0j is a
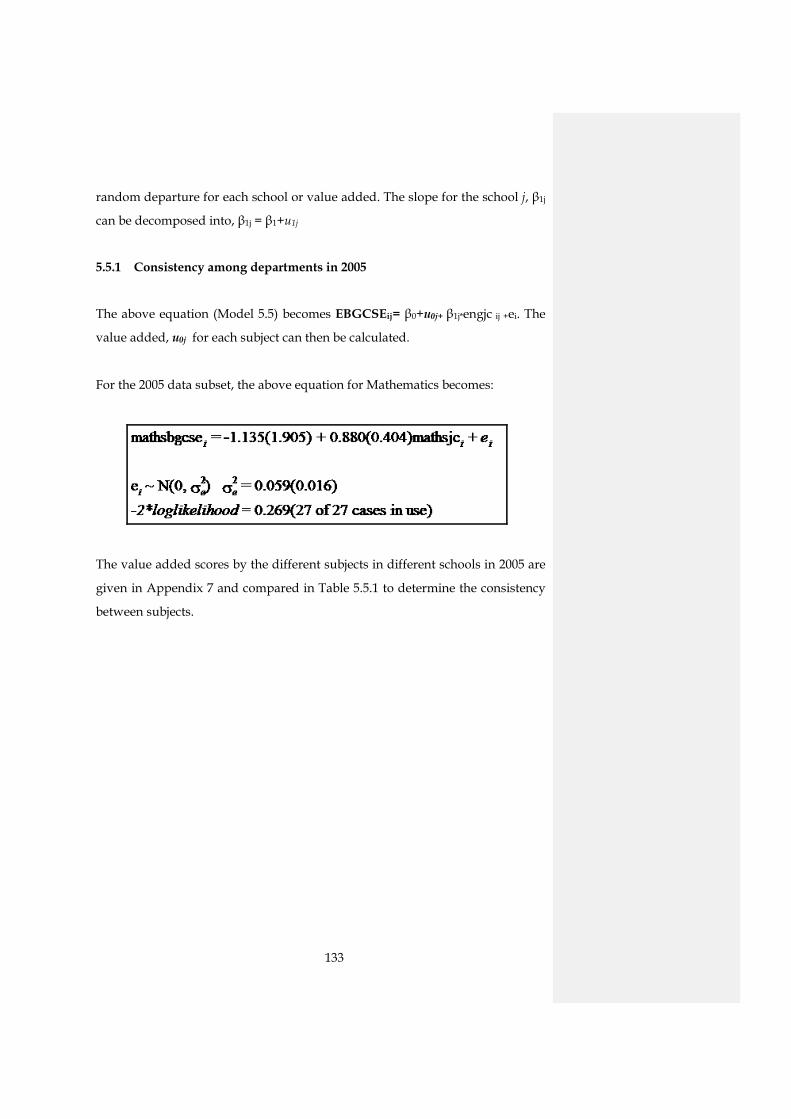
133
random departure for each school or value added. The slope for the school j, β1j
can be decomposed into, β1j = β1+u1j
5.5.1 Consistency among departments in 2005
The above equation (Model 5.5) becomes EBGCSEij= β0+u0j+ β1j*engjc ij +ei. The
value added, u0j for each subject can then be calculated.
For the 2005 data subset, the above equation for Mathematics becomes:
The value added scores by the different subjects in different schools in 2005 are
given in Appendix 7 and compared in Table 5.5.1 to determine the consistency
between subjects.
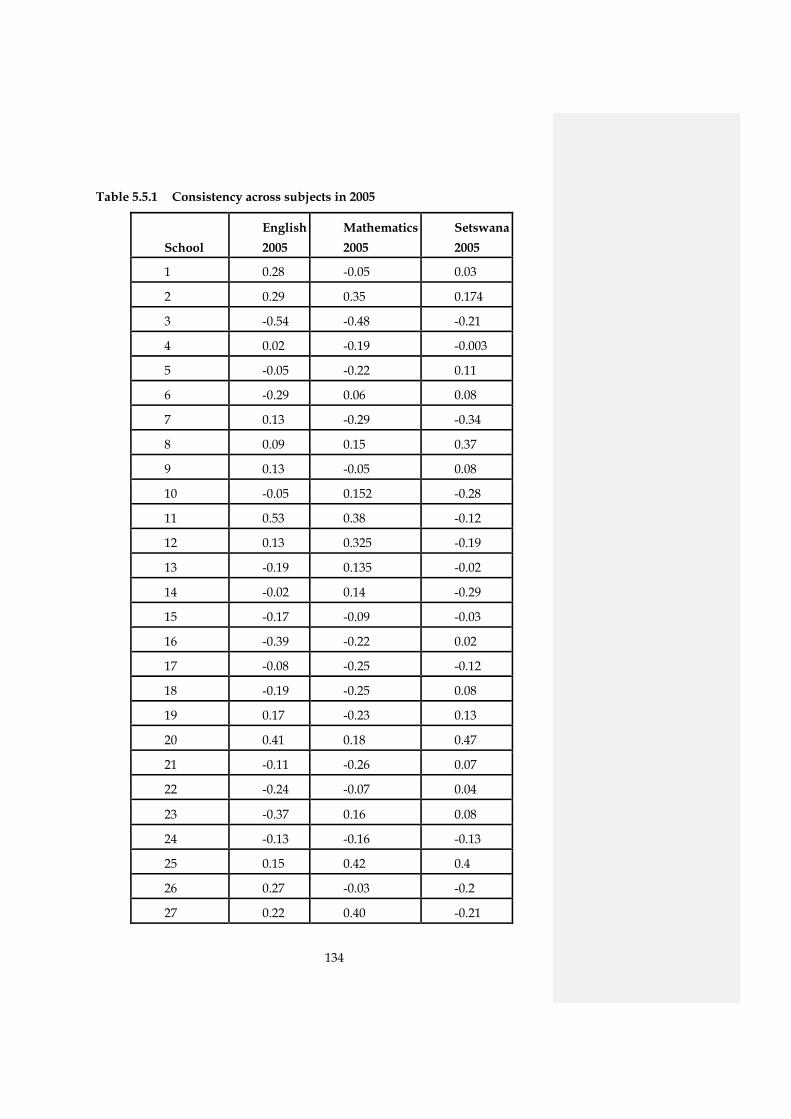
134
Table 5.5.1 Consistency across subjects in 2005
School English 2005
Mathematics 2005
Setswana 2005
1 0.28 -0.05 0.03
2 0.29 0.35 0.174
3 -0.54 -0.48 -0.21
4 0.02 -0.19 -0.003
5 -0.05 -0.22 0.11
6 -0.29 0.06 0.08
7 0.13 -0.29 -0.34
8 0.09 0.15 0.37
9 0.13 -0.05 0.08
10 -0.05 0.152 -0.28
11 0.53 0.38 -0.12
12 0.13 0.325 -0.19
13 -0.19 0.135 -0.02
14 -0.02 0.14 -0.29
15 -0.17 -0.09 -0.03
16 -0.39 -0.22 0.02
17 -0.08 -0.25 -0.12
18 -0.19 -0.25 0.08
19 0.17 -0.23 0.13
20 0.41 0.18 0.47
21 -0.11 -0.26 0.07
22 -0.24 -0.07 0.04
23 -0.37 0.16 0.08
24 -0.13 -0.16 -0.13
25 0.15 0.42 0.4
26 0.27 -0.03 -0.2
27 0.22 0.40 -0.21
135
8 (30%) schools showed consistency across the departments. From these 8, four
schools were consistent in their ineffectiveness which means in all the
departments, students did not progress as expected. These included schools 3,
15, 17 and 24. Four schools were consistently effective, namely schools 2, 8, 20
and 25. The majority of schools 19 (70%) were inconsistent across the outcomes.
In these schools, there were ineffective and effective departments coexisting.
These included schools 1, 4, 5, 6, 7, 9, 10, 11, 12, 13, 14, 16, 18, 19, 21, 22, 23, 24
and 26.
5.5.2 Consistency across departments in 2006
The different equations used to determine the value added by the different
subjects appear in Appendix 8 and the results reported in Table 5.5.2 below
were taken from Appendix 8 as well.
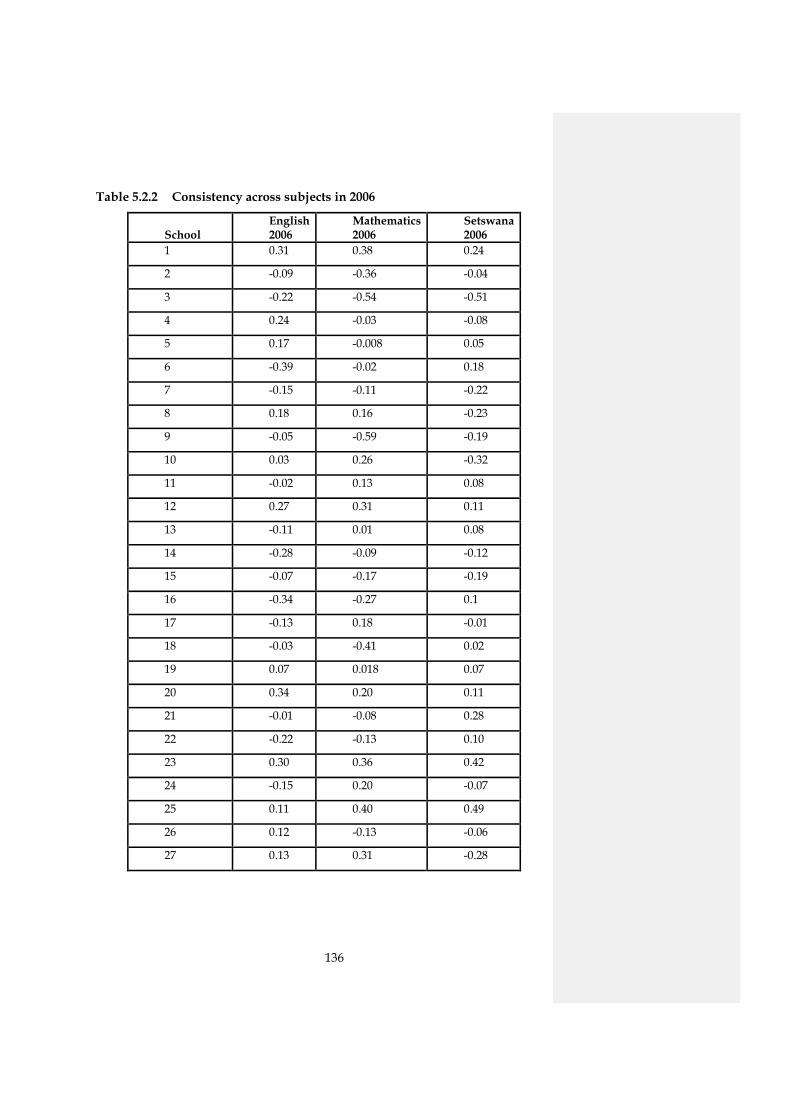
136
Table 5.2.2 Consistency across subjects in 2006
School English 2006
Mathematics 2006
Setswana 2006
1 0.31 0.38 0.24
2 -0.09 -0.36 -0.04
3 -0.22 -0.54 -0.51
4 0.24 -0.03 -0.08
5 0.17 -0.008 0.05
6 -0.39 -0.02 0.18
7 -0.15 -0.11 -0.22
8 0.18 0.16 -0.23
9 -0.05 -0.59 -0.19
10 0.03 0.26 -0.32
11 -0.02 0.13 0.08
12 0.27 0.31 0.11
13 -0.11 0.01 0.08
14 -0.28 -0.09 -0.12
15 -0.07 -0.17 -0.19
16 -0.34 -0.27 0.1
17 -0.13 0.18 -0.01
18 -0.03 -0.41 0.02
19 0.07 0.018 0.07
20 0.34 0.20 0.11
21 -0.01 -0.08 0.28
22 -0.22 -0.13 0.10
23 0.30 0.36 0.42
24 -0.15 0.20 -0.07
25 0.11 0.40 0.49
26 0.12 -0.13 -0.06
27 0.13 0.31 -0.28
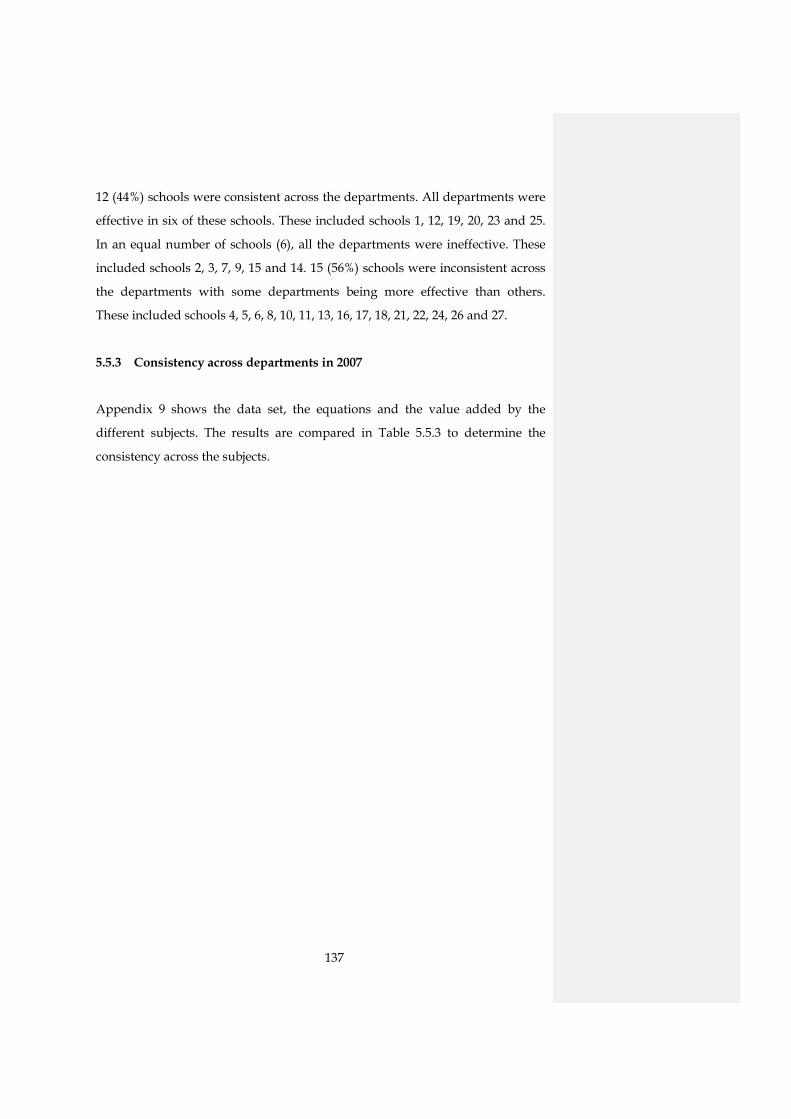
137
12 (44%) schools were consistent across the departments. All departments were
effective in six of these schools. These included schools 1, 12, 19, 20, 23 and 25.
In an equal number of schools (6), all the departments were ineffective. These
included schools 2, 3, 7, 9, 15 and 14. 15 (56%) schools were inconsistent across
the departments with some departments being more effective than others.
These included schools 4, 5, 6, 8, 10, 11, 13, 16, 17, 18, 21, 22, 24, 26 and 27.
5.5.3 Consistency across departments in 2007
Appendix 9 shows the data set, the equations and the value added by the
different subjects. The results are compared in Table 5.5.3 to determine the
consistency across the subjects.
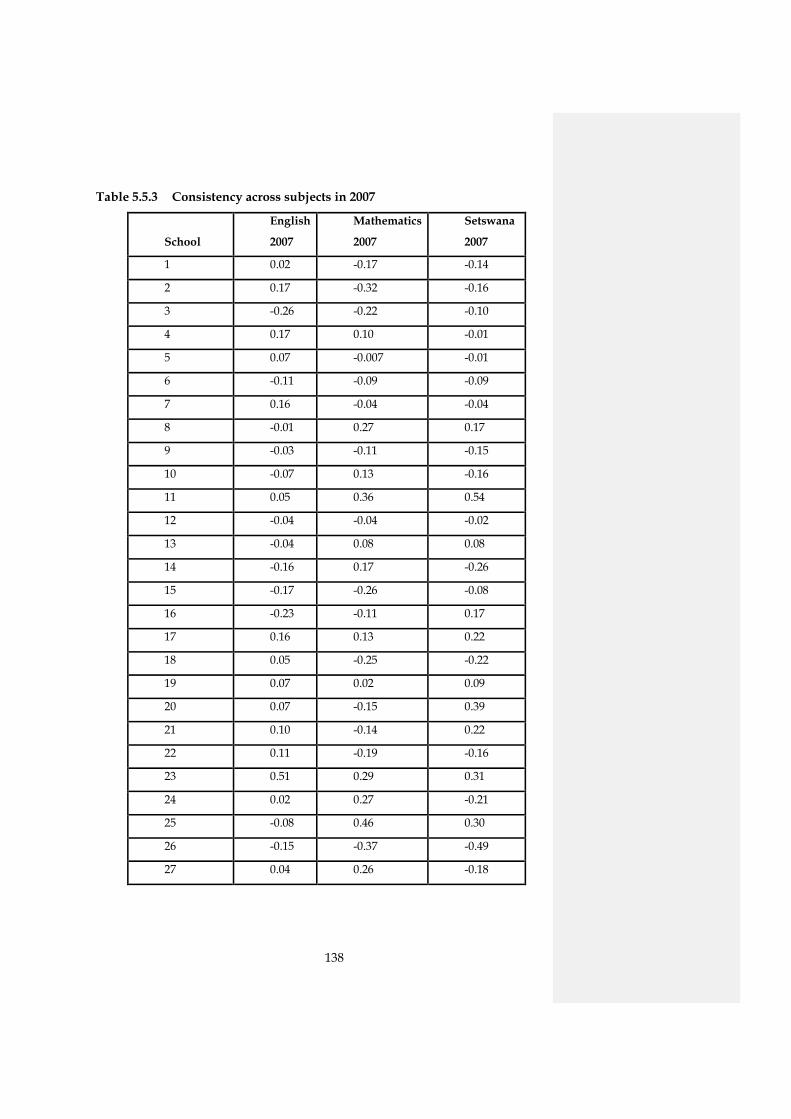
138
Table 5.5.3 Consistency across subjects in 2007
School
English
2007
Mathematics
2007
Setswana
2007
1 0.02 -0.17 -0.14
2 0.17 -0.32 -0.16
3 -0.26 -0.22 -0.10
4 0.17 0.10 -0.01
5 0.07 -0.007 -0.01
6 -0.11 -0.09 -0.09
7 0.16 -0.04 -0.04
8 -0.01 0.27 0.17
9 -0.03 -0.11 -0.15
10 -0.07 0.13 -0.16
11 0.05 0.36 0.54
12 -0.04 -0.04 -0.02
13 -0.04 0.08 0.08
14 -0.16 0.17 -0.26
15 -0.17 -0.26 -0.08
16 -0.23 -0.11 0.17
17 0.16 0.13 0.22
18 0.05 -0.25 -0.22
19 0.07 0.02 0.09
20 0.07 -0.15 0.39
21 0.10 -0.14 0.22
22 0.11 -0.19 -0.16
23 0.51 0.29 0.31
24 0.02 0.27 -0.21
25 -0.08 0.46 0.30
26 -0.15 -0.37 -0.49
27 0.04 0.26 -0.18
139
10 (37%) schools were consistent in their outcomes. Of these, four schools were
consistently effective and these included schools 11, 17, 19 and 23. Six schools
were consistently ineffective. These included schools 3, 6, 9, 12, 15, and 26. In
the majority of schools, 17 (63%) it was a combination of effective and
ineffective departments. Schools 1, 2, 4, 5, 7, 8, 10, 13, 14, 16, 18, 20, 21, 24, 25, 27
and 7 fell within this group.
5.5.4 Overall consistency across the departments for 2005-2007
To determine the overall consistency by schools over the three years, the
average value added by each department over the years was calculated to
resulting in a single figure of departmental effectiveness in Table 5.5.4.1.
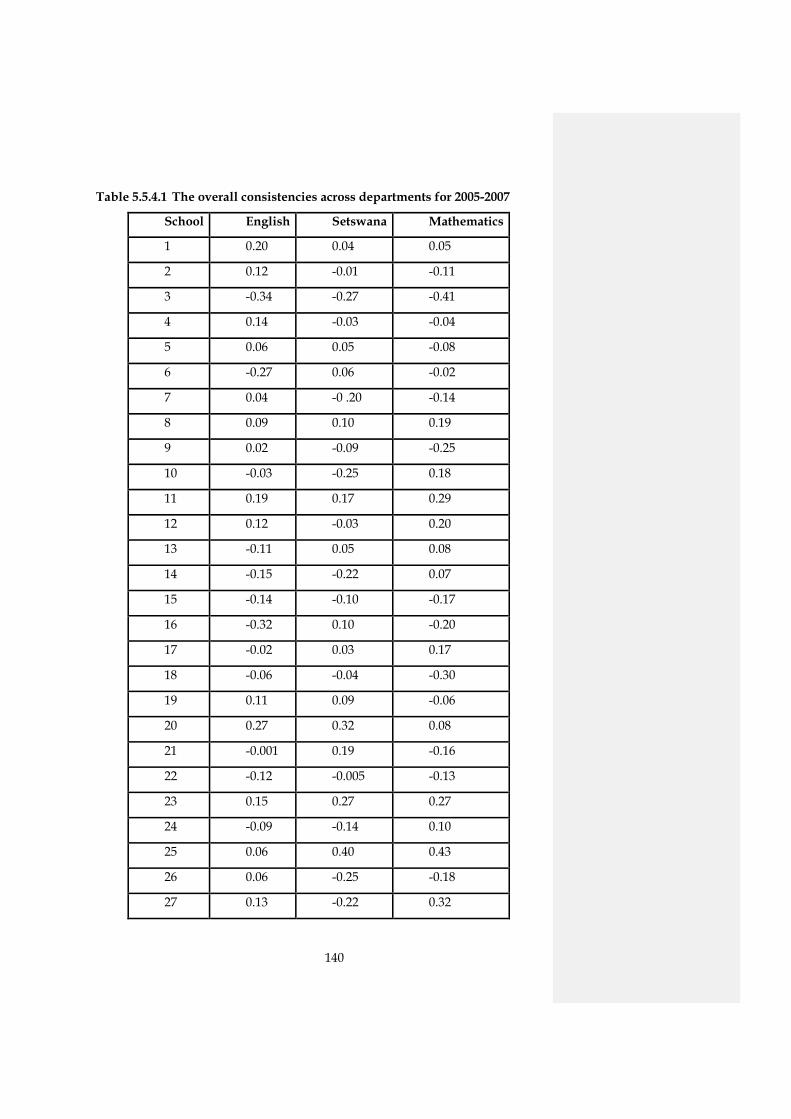
140
Table 5.5.4.1 The overall consistencies across departments for 2005-2007
School English Setswana Mathematics
1 0.20 0.04 0.05
2 0.12 -0.01 -0.11
3 -0.34 -0.27 -0.41
4 0.14 -0.03 -0.04
5 0.06 0.05 -0.08
6 -0.27 0.06 -0.02
7 0.04 -0 .20 -0.14
8 0.09 0.10 0.19
9 0.02 -0.09 -0.25
10 -0.03 -0.25 0.18
11 0.19 0.17 0.29
12 0.12 -0.03 0.20
13 -0.11 0.05 0.08
14 -0.15 -0.22 0.07
15 -0.14 -0.10 -0.17
16 -0.32 0.10 -0.20
17 -0.02 0.03 0.17
18 -0.06 -0.04 -0.30
19 0.11 0.09 -0.06
20 0.27 0.32 0.08
21 -0.001 0.19 -0.16
22 -0.12 -0.005 -0.13
23 0.15 0.27 0.27
24 -0.09 -0.14 0.10
25 0.06 0.40 0.43
26 0.06 -0.25 -0.18
27 0.13 -0.22 0.32
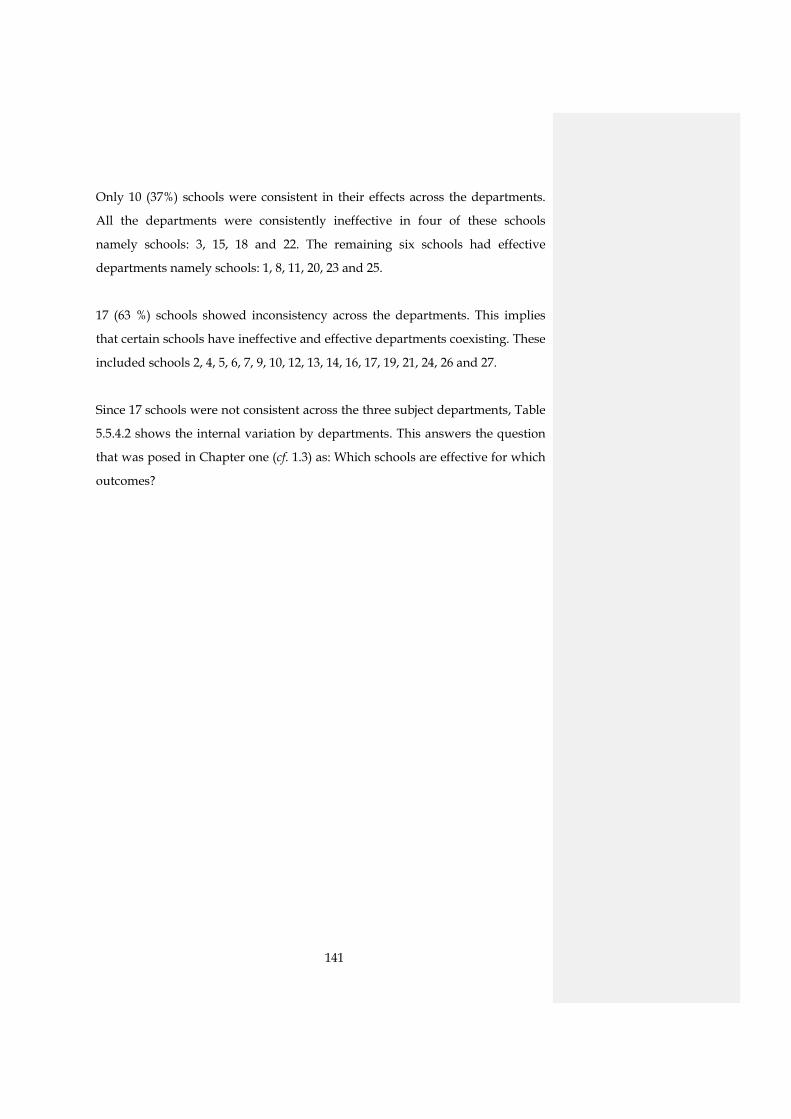
141
Only 10 (37%) schools were consistent in their effects across the departments.
All the departments were consistently ineffective in four of these schools
namely schools: 3, 15, 18 and 22. The remaining six schools had effective
departments namely schools: 1, 8, 11, 20, 23 and 25.
17 (63 %) schools showed inconsistency across the departments. This implies
that certain schools have ineffective and effective departments coexisting. These
included schools 2, 4, 5, 6, 7, 9, 10, 12, 13, 14, 16, 17, 19, 21, 24, 26 and 27.
Since 17 schools were not consistent across the three subject departments, Table
5.5.4.2 shows the internal variation by departments. This answers the question
that was posed in Chapter one (cf. 1.3) as: Which schools are effective for which
outcomes?
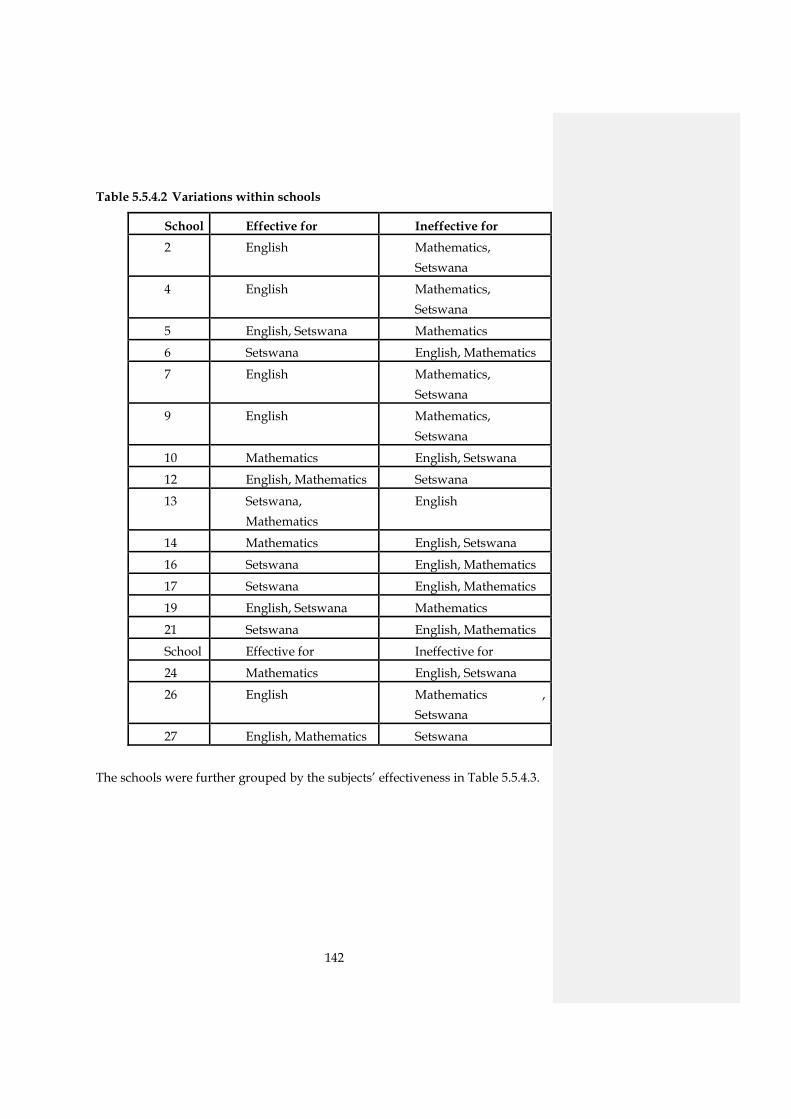
142
Table 5.5.4.2 Variations within schools
School Effective for Ineffective for 2 English Mathematics,
Setswana
4 English Mathematics, Setswana
5 English, Setswana Mathematics
6 Setswana English, Mathematics
7 English Mathematics, Setswana
9 English Mathematics, Setswana
10 Mathematics English, Setswana
12 English, Mathematics Setswana
13 Setswana, Mathematics
English
14 Mathematics English, Setswana
16 Setswana English, Mathematics
17 Setswana English, Mathematics
19 English, Setswana Mathematics
21 Setswana English, Mathematics
School Effective for Ineffective for
24 Mathematics English, Setswana
26 English Mathematics , Setswana
27 English, Mathematics Setswana
The schools were further grouped by the subjects’ effectiveness in Table 5.5.4.3.
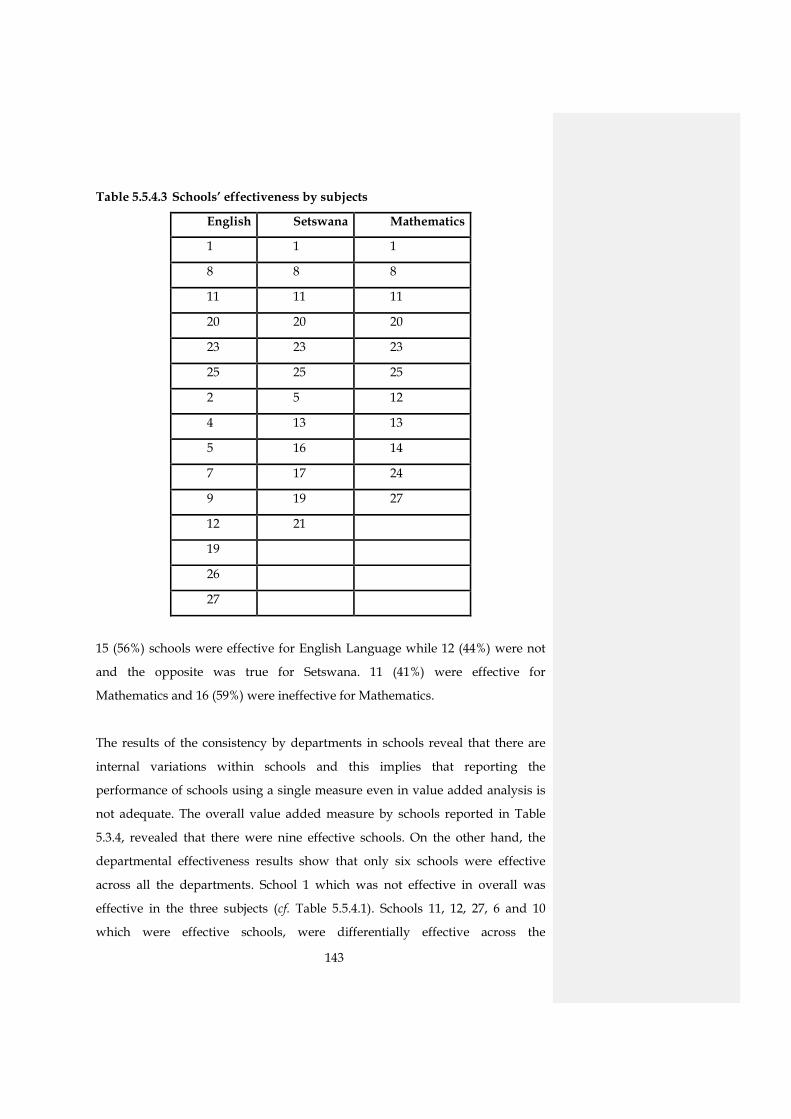
143
Table 5.5.4.3 Schools’ effectiveness by subjects
English Setswana Mathematics
1 1 1
8 8 8
11 11 11
20 20 20
23 23 23
25 25 25
2 5 12
4 13 13
5 16 14
7 17 24
9 19 27
12 21
19
26
27
15 (56%) schools were effective for English Language while 12 (44%) were not
and the opposite was true for Setswana. 11 (41%) were effective for
Mathematics and 16 (59%) were ineffective for Mathematics.
The results of the consistency by departments in schools reveal that there are
internal variations within schools and this implies that reporting the
performance of schools using a single measure even in value added analysis is
not adequate. The overall value added measure by schools reported in Table
5.3.4, revealed that there were nine effective schools. On the other hand, the
departmental effectiveness results show that only six schools were effective
across all the departments. School 1 which was not effective in overall was
effective in the three subjects (cf. Table 5.5.4.1). Schools 11, 12, 27, 6 and 10
which were effective schools, were differentially effective across the
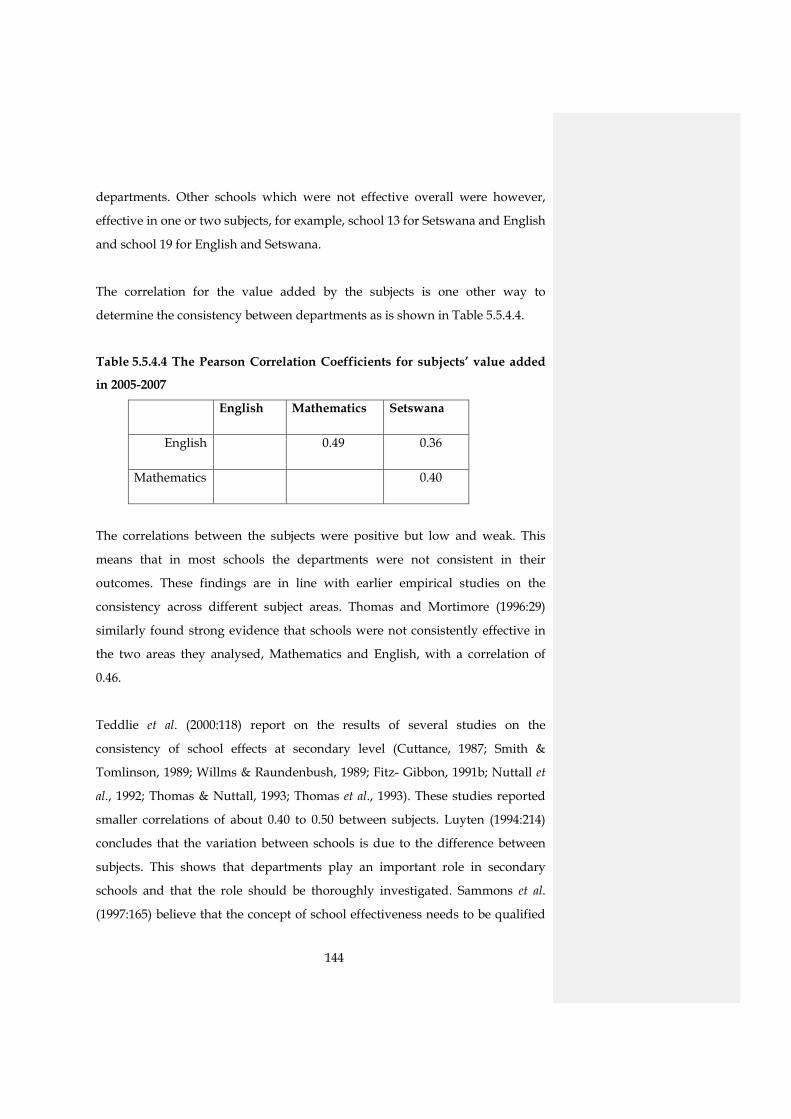
144
departments. Other schools which were not effective overall were however,
effective in one or two subjects, for example, school 13 for Setswana and English
and school 19 for English and Setswana.
The correlation for the value added by the subjects is one other way to
determine the consistency between departments as is shown in Table 5.5.4.4.
Table 5.5.4.4 The Pearson Correlation Coefficients for subjects’ value added
in 2005-2007
English Mathematics Setswana
English 0.49 0.36
Mathematics 0.40
The correlations between the subjects were positive but low and weak. This
means that in most schools the departments were not consistent in their
outcomes. These findings are in line with earlier empirical studies on the
consistency across different subject areas. Thomas and Mortimore (1996:29)
similarly found strong evidence that schools were not consistently effective in
the two areas they analysed, Mathematics and English, with a correlation of
0.46.
Teddlie et al. (2000:118) report on the results of several studies on the
consistency of school effects at secondary level (Cuttance, 1987; Smith &
Tomlinson, 1989; Willms & Raundenbush, 1989; Fitz- Gibbon, 1991b; Nuttall et
al., 1992; Thomas & Nuttall, 1993; Thomas et al., 1993). These studies reported
smaller correlations of about 0.40 to 0.50 between subjects. Luyten (1994:214)
concludes that the variation between schools is due to the difference between
subjects. This shows that departments play an important role in secondary
schools and that the role should be thoroughly investigated. Sammons et al.
(1997:165) believe that the concept of school effectiveness needs to be qualified

145
at the school level to the term school and departmental effectiveness. The use of
only a single overall measure of value added may hide these differences that
have important messages for departmental self evaluation. Trower and Vincent
(in Mayston, 2007:40) came to the same conclusion from their empirical study of
pupil value added by GCSE results when matched to KS3 prior attainment that
“a value added indicator based on an outcome measure which combined all
subjects would hide the substantial differences in success between different
departments within the school”. The difference between departments in the
same school may be due to a variety of departmental factors such as
departmental policies (homework, team teaching, remedial teaching, targets
etc), consistency in approach, the leadership by the subject leader and the
quality of teaching.
Effective departments promote effective teaching strategies through staff
development as a sign of a pervasive focus on learning. Hopkins (2001:113)
asserts that schools that add value to learning, progress and attainment of their
pupils are consistent in their teaching practice which Blanchard (2002:29) calls
instructional efficacy (cf. 2.3.3). This operates on the belief that difficult students
are teachable through extra effort and appropriate techniques, and that they can
enlist family support and overcome negating community influences through
effective teaching. Such teachers devote more time to academic activities,
provide students who encounter difficulties with the guidance they need to
succeed and praise their academic achievement. By so doing, the teachers
maintain a focus on learning. This can only happen through effective leadership
by the department leader and team work. Harris (1999:22) notes that effective
departments possess the following: a) Having a collegiate management style; b)
Sharing of a strong vision for the subject; c) Being well organized in terms of
assessment, record keeping, homework and good resource management; d)
Having efficient systems for monitoring and evaluating pupil progress which
enables the provision of regular feedback to pupils; e) Operating clear routines
and practices within lessons; and f) Having a strong pupil centred ethos that

146
systematically rewards pupils and provides them with many opportunities for
learning.
The results on the internal variation within a school should lead to
departmental self evaluation against the above mentioned factors in order to
improve practice. Less effective departments should become learning
organisations by soliciting help from the more effective departments within the
same school or from other schools.
5.6 STABILITY ACROSS THE YEARS
Are the schools stable in their effectiveness/ineffectiveness for 2005-2007?
This is research question posed in Chapter 1 (cf. 1.3.3).The issue on stability
compares schools and departments’ performances for the different cohorts of
students. To compare the stability across the different years, the results from
Table 5.3.4 on the value added by schools were reproduced in Table 5.6.1 below.
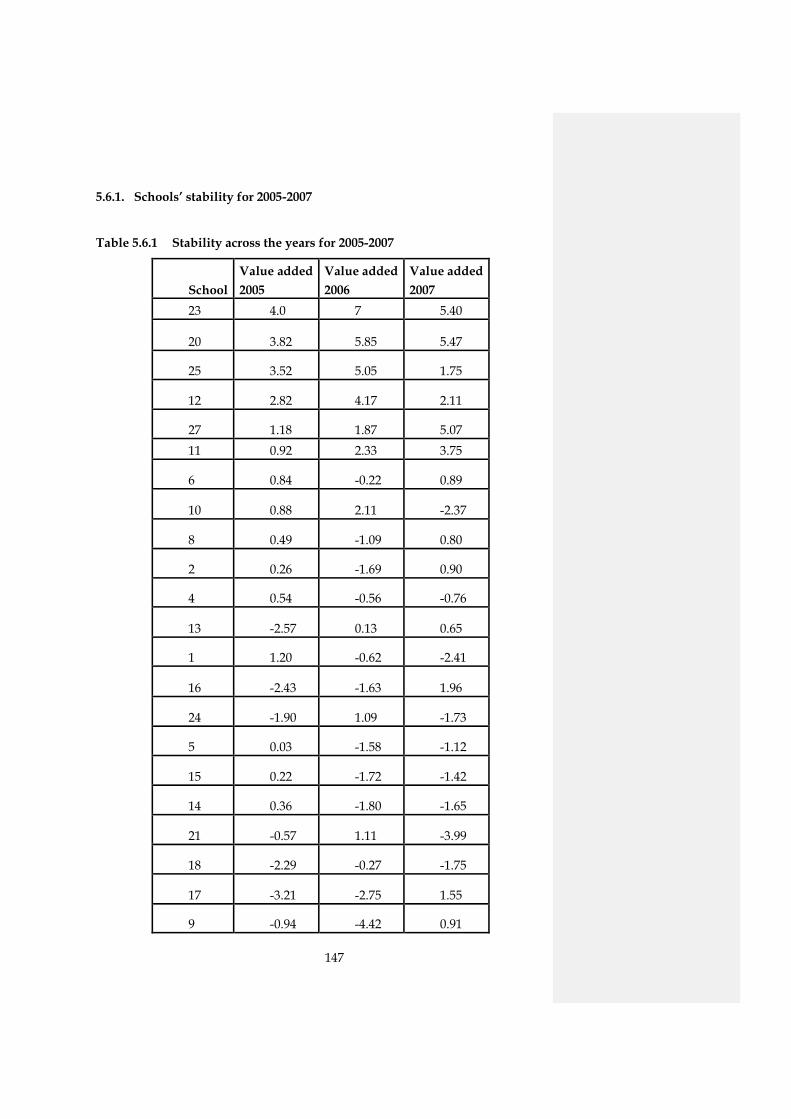
147
5.6.1. Schools’ stability for 2005-2007
Table 5.6.1 Stability across the years for 2005-2007
School Value added 2005
Value added 2006
Value added 2007
23 4.0 7 5.40
20 3.82 5.85 5.47
25 3.52 5.05 1.75
12 2.82 4.17 2.11
27 1.18 1.87 5.07 11 0.92 2.33 3.75
6 0.84 -0.22 0.89
10 0.88 2.11 -2.37
8 0.49 -1.09 0.80
2 0.26 -1.69 0.90
4 0.54 -0.56 -0.76
13 -2.57 0.13 0.65
1 1.20 -0.62 -2.41
16 -2.43 -1.63 1.96
24 -1.90 1.09 -1.73
5 0.03 -1.58 -1.12
15 0.22 -1.72 -1.42
14 0.36 -1.80 -1.65
21 -0.57 1.11 -3.99
18 -2.29 -0.27 -1.75
17 -3.21 -2.75 1.55
9 -0.94 -4.42 0.91
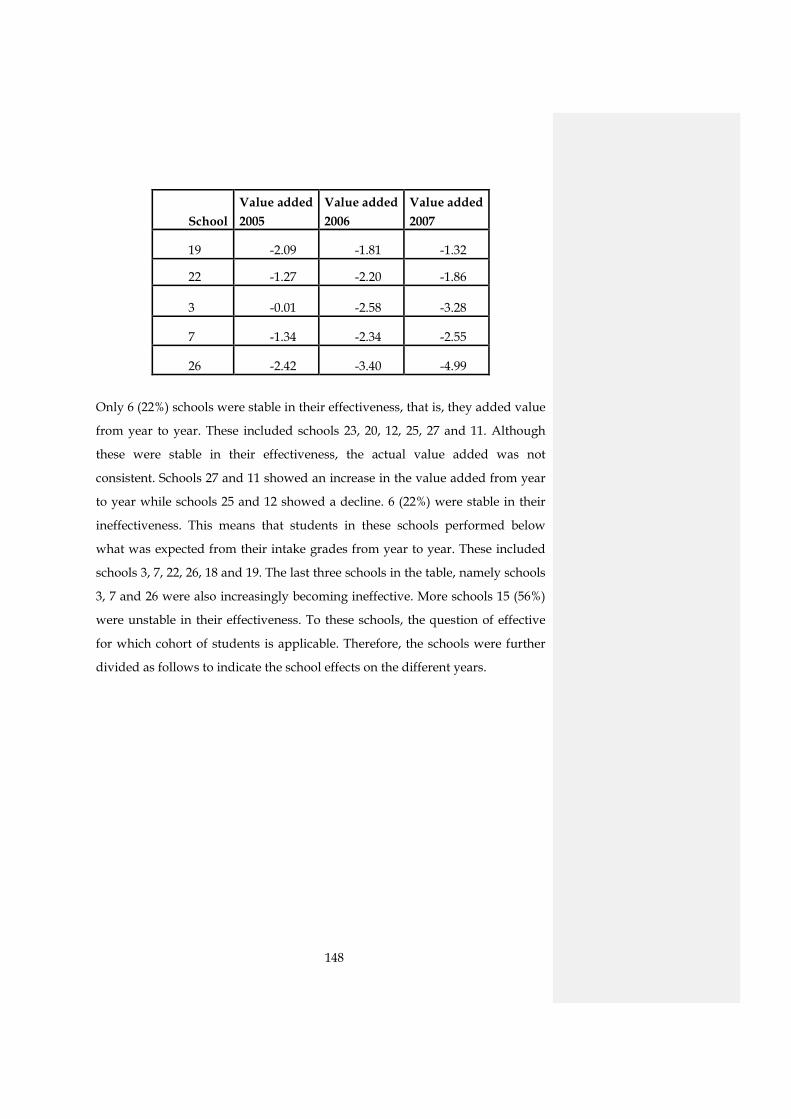
148
School Value added 2005
Value added 2006
Value added 2007
19 -2.09 -1.81 -1.32
22 -1.27 -2.20 -1.86
3 -0.01 -2.58 -3.28
7 -1.34 -2.34 -2.55
26 -2.42 -3.40 -4.99
Only 6 (22%) schools were stable in their effectiveness, that is, they added value
from year to year. These included schools 23, 20, 12, 25, 27 and 11. Although
these were stable in their effectiveness, the actual value added was not
consistent. Schools 27 and 11 showed an increase in the value added from year
to year while schools 25 and 12 showed a decline. 6 (22%) were stable in their
ineffectiveness. This means that students in these schools performed below
what was expected from their intake grades from year to year. These included
schools 3, 7, 22, 26, 18 and 19. The last three schools in the table, namely schools
3, 7 and 26 were also increasingly becoming ineffective. More schools 15 (56%)
were unstable in their effectiveness. To these schools, the question of effective
for which cohort of students is applicable. Therefore, the schools were further
divided as follows to indicate the school effects on the different years.
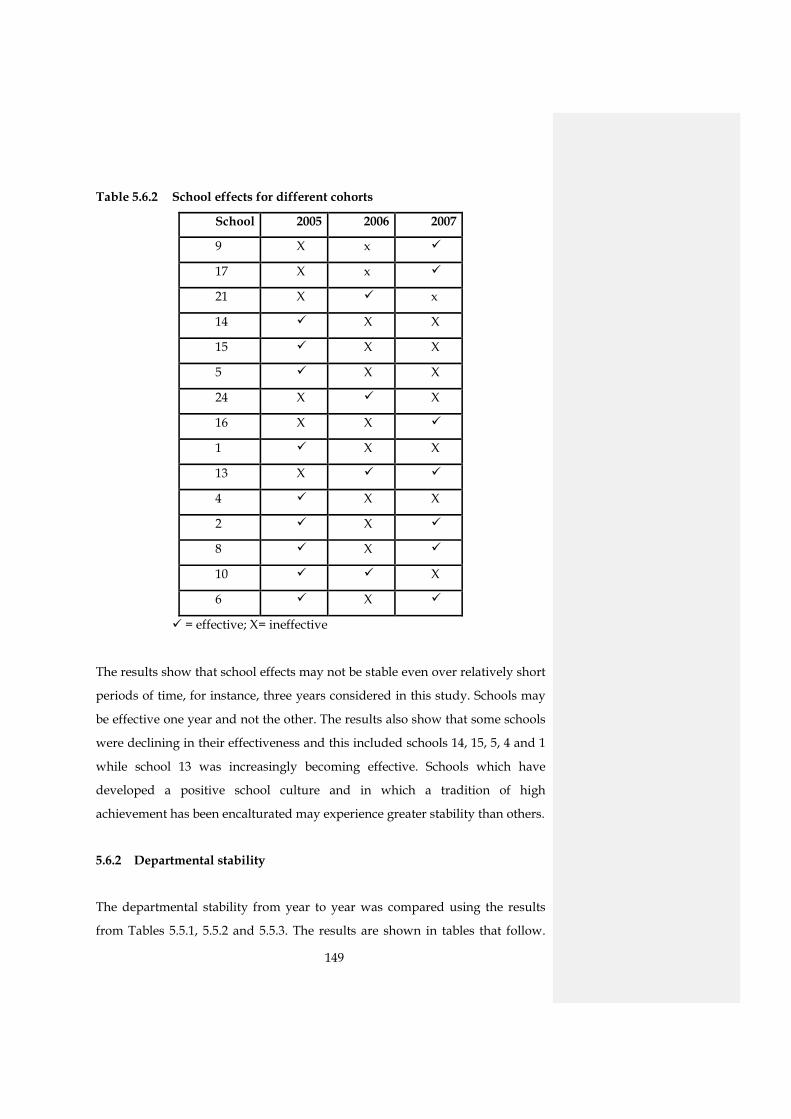
149
Table 5.6.2 School effects for different cohorts
School 2005 2006 2007
9 X x
17 X x
21 X x
14 X X
15 X X
5 X X
24 X X
16 X X
1 X X
13 X
4 X X
2 X
8 X
10 X
6 X
= effective; X= ineffective
The results show that school effects may not be stable even over relatively short
periods of time, for instance, three years considered in this study. Schools may
be effective one year and not the other. The results also show that some schools
were declining in their effectiveness and this included schools 14, 15, 5, 4 and 1
while school 13 was increasingly becoming effective. Schools which have
developed a positive school culture and in which a tradition of high
achievement has been encalturated may experience greater stability than others.
5.6.2 Departmental stability
The departmental stability from year to year was compared using the results
from Tables 5.5.1, 5.5.2 and 5.5.3. The results are shown in tables that follow.
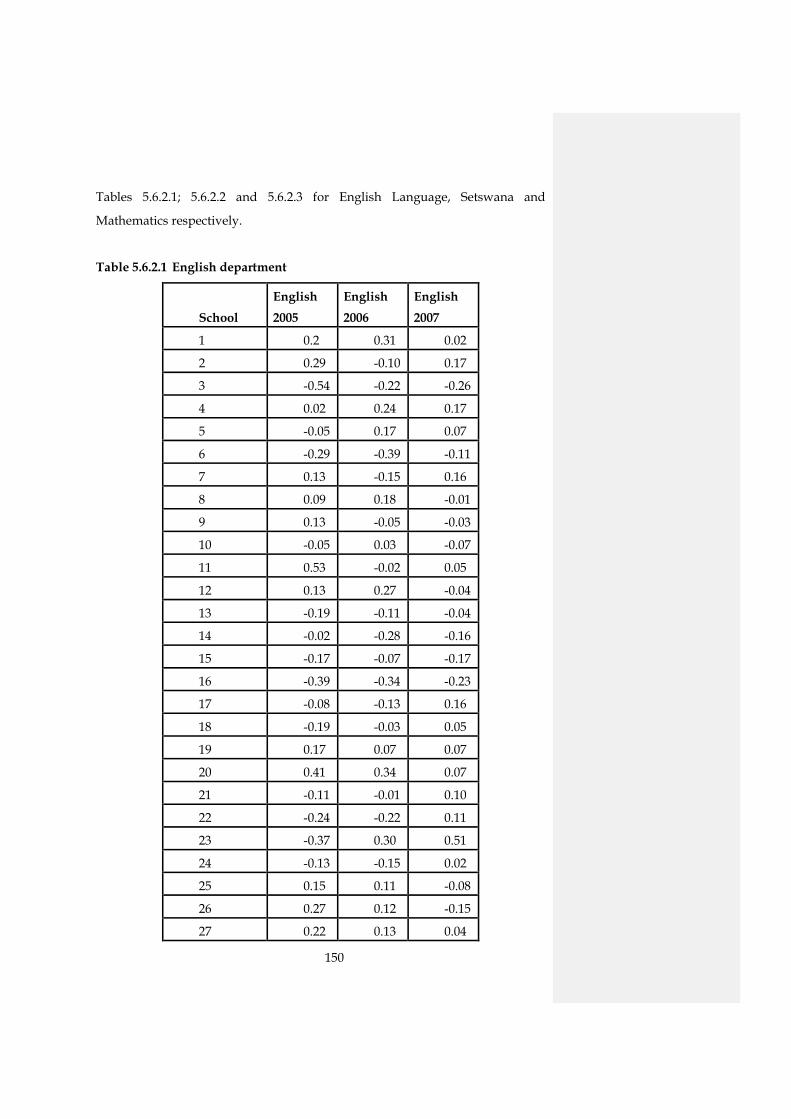
150
Tables 5.6.2.1; 5.6.2.2 and 5.6.2.3 for English Language, Setswana and
Mathematics respectively.
Table 5.6.2.1 English department
School English 2005
English 2006
English 2007
1 0.2 0.31 0.02
2 0.29 -0.10 0.17
3 -0.54 -0.22 -0.26
4 0.02 0.24 0.17
5 -0.05 0.17 0.07
6 -0.29 -0.39 -0.11
7 0.13 -0.15 0.16
8 0.09 0.18 -0.01
9 0.13 -0.05 -0.03
10 -0.05 0.03 -0.07
11 0.53 -0.02 0.05
12 0.13 0.27 -0.04
13 -0.19 -0.11 -0.04
14 -0.02 -0.28 -0.16
15 -0.17 -0.07 -0.17
16 -0.39 -0.34 -0.23
17 -0.08 -0.13 0.16
18 -0.19 -0.03 0.05
19 0.17 0.07 0.07
20 0.41 0.34 0.07
21 -0.11 -0.01 0.10
22 -0.24 -0.22 0.11
23 -0.37 0.30 0.51
24 -0.13 -0.15 0.02
25 0.15 0.11 -0.08
26 0.27 0.12 -0.15
27 0.22 0.13 0.04
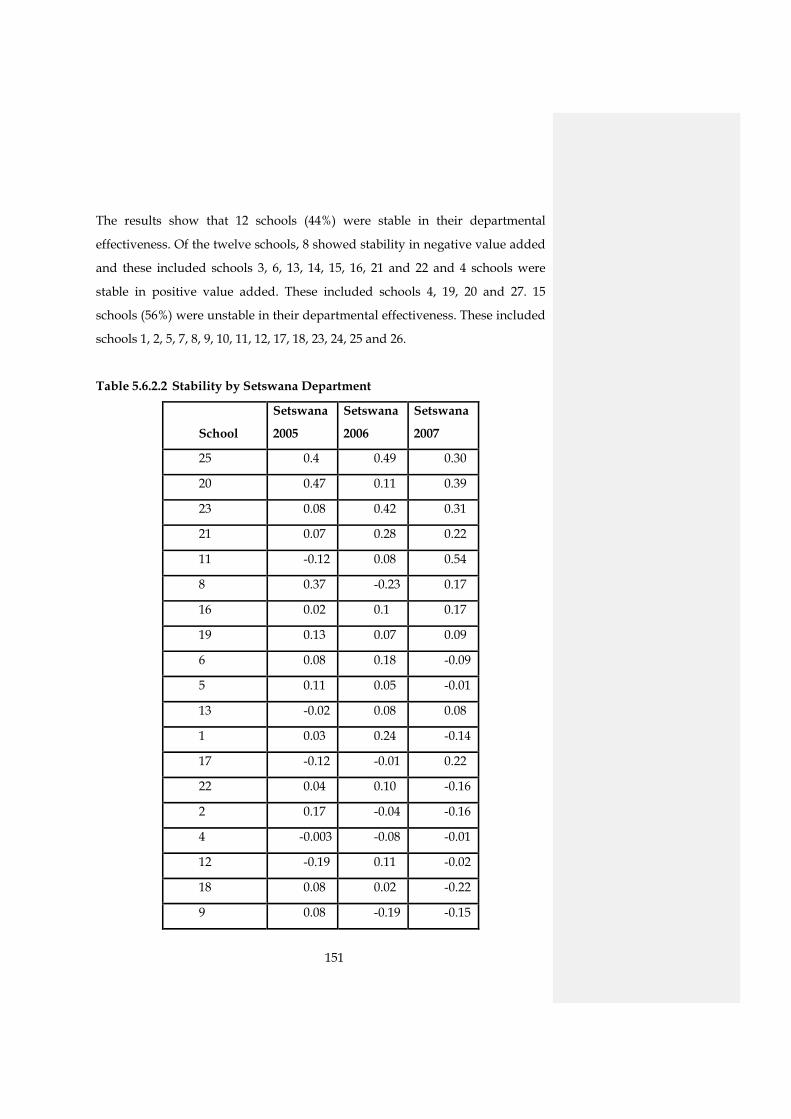
151
The results show that 12 schools (44%) were stable in their departmental
effectiveness. Of the twelve schools, 8 showed stability in negative value added
and these included schools 3, 6, 13, 14, 15, 16, 21 and 22 and 4 schools were
stable in positive value added. These included schools 4, 19, 20 and 27. 15
schools (56%) were unstable in their departmental effectiveness. These included
schools 1, 2, 5, 7, 8, 9, 10, 11, 12, 17, 18, 23, 24, 25 and 26.
Table 5.6.2.2 Stability by Setswana Department
School
Setswana
2005
Setswana
2006
Setswana
2007
25 0.4 0.49 0.30
20 0.47 0.11 0.39
23 0.08 0.42 0.31
21 0.07 0.28 0.22
11 -0.12 0.08 0.54
8 0.37 -0.23 0.17
16 0.02 0.1 0.17
19 0.13 0.07 0.09
6 0.08 0.18 -0.09
5 0.11 0.05 -0.01
13 -0.02 0.08 0.08
1 0.03 0.24 -0.14
17 -0.12 -0.01 0.22
22 0.04 0.10 -0.16
2 0.17 -0.04 -0.16
4 -0.003 -0.08 -0.01
12 -0.19 0.11 -0.02
18 0.08 0.02 -0.22
9 0.08 -0.19 -0.15
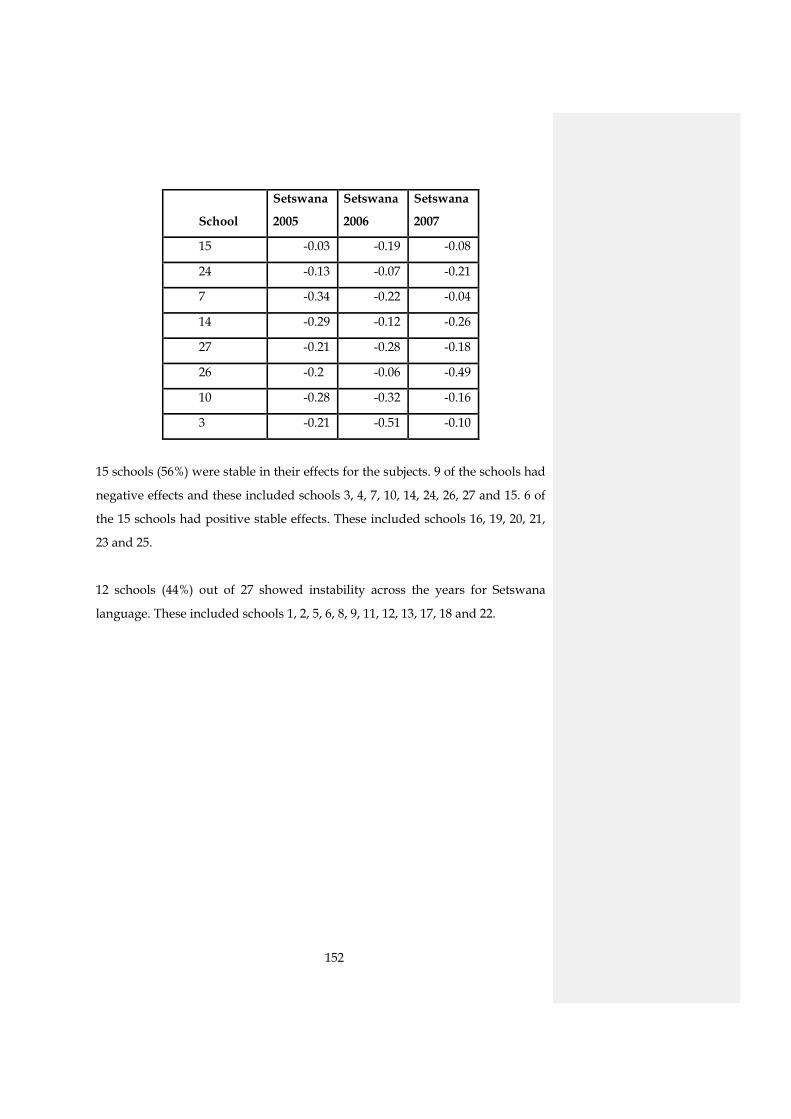
152
School
Setswana
2005
Setswana
2006
Setswana
2007
15 -0.03 -0.19 -0.08
24 -0.13 -0.07 -0.21
7 -0.34 -0.22 -0.04
14 -0.29 -0.12 -0.26
27 -0.21 -0.28 -0.18
26 -0.2 -0.06 -0.49
10 -0.28 -0.32 -0.16
3 -0.21 -0.51 -0.10
15 schools (56%) were stable in their effects for the subjects. 9 of the schools had
negative effects and these included schools 3, 4, 7, 10, 14, 24, 26, 27 and 15. 6 of
the 15 schools had positive stable effects. These included schools 16, 19, 20, 21,
23 and 25.
12 schools (44%) out of 27 showed instability across the years for Setswana
language. These included schools 1, 2, 5, 6, 8, 9, 11, 12, 13, 17, 18 and 22.
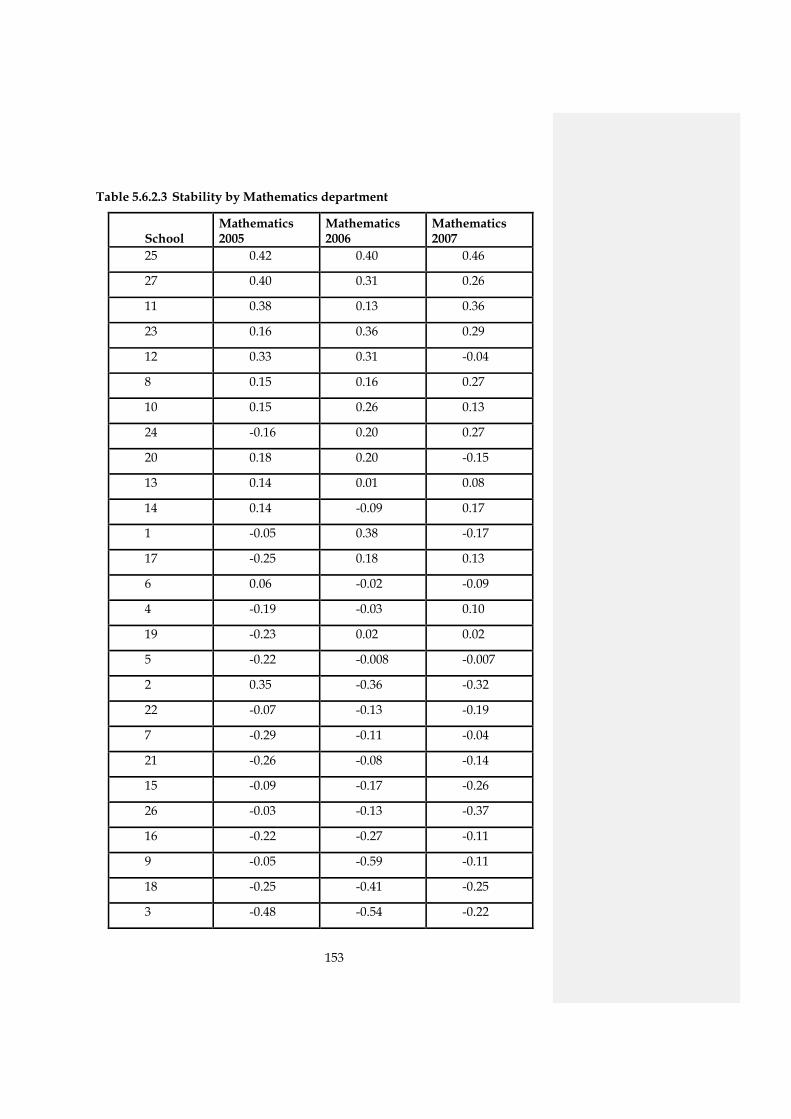
153
Table 5.6.2.3 Stability by Mathematics department
School Mathematics 2005
Mathematics 2006
Mathematics 2007
25 0.42 0.40 0.46
27 0.40 0.31 0.26
11 0.38 0.13 0.36
23 0.16 0.36 0.29
12 0.33 0.31 -0.04
8 0.15 0.16 0.27
10 0.15 0.26 0.13
24 -0.16 0.20 0.27
20 0.18 0.20 -0.15
13 0.14 0.01 0.08
14 0.14 -0.09 0.17
1 -0.05 0.38 -0.17
17 -0.25 0.18 0.13
6 0.06 -0.02 -0.09
4 -0.19 -0.03 0.10
19 -0.23 0.02 0.02
5 -0.22 -0.008 -0.007
2 0.35 -0.36 -0.32
22 -0.07 -0.13 -0.19
7 -0.29 -0.11 -0.04
21 -0.26 -0.08 -0.14
15 -0.09 -0.17 -0.26
26 -0.03 -0.13 -0.37
16 -0.22 -0.27 -0.11
9 -0.05 -0.59 -0.11
18 -0.25 -0.41 -0.25
3 -0.48 -0.54 -0.22
154
The results of the stability in Mathematics indicate that 17 schools (63%) were
stable from year to year. Out of these, 10 schools showed negative stability and
these included schools 3, 5, 7, 9, 15, 16, 18, 21, 22 and 26 while 7 schools showed
stable positive value added. The schools included schools 8, 10, 11, 13, 23, 25
and 27
10 schools (37%) showed instability across the years. These included schools 2,
4, 6, 12, 14, 17, 19, 20, 24 and 1.
The correlations within the subject across the years were 0.35, 0.49 and 0.53 for
English, Mathematics and Setswana respectively. The correlations were from
weak to moderate. This indicates that subjects were not stable from year to year
and this shows that the departmental effects can vary for relatively short
periods of time. The results demonstrate that it is helpful to look at subjects and
overall value added scores for more than one year, with three years being the
minimum as mentioned earlier (cf. 4.3.1).
The results on differential effectiveness by gender and ability in Table 5.4.3
showed that schools 11 and 12 were stable in promoting the progress of low
ability students and 7 schools were constantly effective for mid ability students.
These included schools 16, 19, 27, 9, 11, 12 and 14. Schools 7 and 24 showed
stability in promoting the progress of high ability students at the expense of the
other groups.
The results of the study showed that it is possible with the right data and
appropriate statistical methods to use a value added methodology to determine
the effectiveness/ineffectiveness of secondary schools in Botswana. Therefore,
the two research aims stated in 5.1 were achieved.
155
5.8 CONCLUSION
This chapter answered the five problem questions that were stated at the
beginning of the chapter (cf. 5.1). The chapter answered questions on the
effectiveness of secondary schools in Botswana and the fundamental issues of
school effectiveness: differential effectiveness, consistency across different
subjects and stability across the years. The size of school effects by the more and
less effective schools was determined.
The results of the study add weight to the argument supporting the use of value
added as a more accurate method for evaluating school performances. The raw
results on their own were misleading because some schools which were ranking
high in raw results were not doing well in terms of the value added and vice
versa. Value added gave an indication of a school’s effectiveness in promoting
students’ achievement. Value added measures are an indication of how well a
school is doing in promoting students’ achievement. It compares outcomes after
adjusting for the differences in intake and reflects the relative boost a school
gives to pupils’ prior level of achievement in comparison to similar students in
other schools.
Schools differed in their effectiveness. Only a few schools (9) were effective in
promoting the achievement of learners while the majority (18) were not. 12
schools were stable in their effects. From these, 6 schools were stable in their
effectiveness across the years and 6 were stable in their ineffectiveness. The
results of consistency showed that 10 schools were consistent in their effects.
From these ten, 6 schools were consistently ineffective across the subject while 4
were consistently effective across the different subjects. Schools were also
differentially effective for the different students’ groups. The schools were
generally more effective for boys than girls and for the mid ability rather than
the low and high ability students. The study indicated that prior attainment and

156
student background characteristics such as gender are important predictors of
attainment at BGCSE.
The chapter revealed that the concept of school effectiveness needs to include
departmental effectiveness at the secondary school because in one school there
might be effective and ineffective departments coexisting as shown by the
results of the study on the consistency across subjects (cf. 5.5). The chapter
answered some of the most important questions that any study of school
effectiveness should address: Effective for which student groups, effective for
what outcomes and for which cohort. It is important that these questions be
tackled by any study on school effectiveness because a single outcome measure
even in value added analysis can mask the important internal differences
within a school.
Chapter six will present the summary of the findings of thesis, make
recommendations on the appropriate and accurate method of evaluating school
effectiveness and suggest areas for further research on the effectiveness of
schools in Botswana.
157
CHAPTER SIX
SUMMARY, RECOMMENDATIONS AND
CONCLUSION
6.1 INTRODUCTION
Chapter one presented four research aims. The aim of this final chapter is to
address the fourth research aim, which is to make some recommendations for
the improvement of the practice of determining effective/ineffective schools
and thereby the performance of secondary schools in Botswana (cf. 1.4). Before
the recommendations are made, the chapter will look at the research problem;
the research questions; and summaries of the findings from Chapters two to
five. The chapter ends with the concluding remarks.
The current situation in the judgement of school effectiveness has led the
researcher to undertake this study. The Botswana Examination Council
publishes the BGCSE exam results using the percentage of candidates who have
obtained five or more credit passes. The credit passes are also known as raw
results because they have not been adjusted to take into consideration the
differences in the students’ intake. Schools are then ranked from the highest to
the lowest credit passes and this ranking produces a league table. The
effectiveness of schools and hence their performances are judged based on the
position in the league table. The schools at the top of the league are taken to be
effective, while the ineffective schools are those at the bottom. The use of raw
results and league tables has been criticised by the school effectiveness research
for a number of reasons. Firstly, the intake of schools is different and to
compare their BGCSE exam results while the initial intakes cannot be compared
is flawed. ‘Like’ is not being compared with ‘like’. Secondly, the raw results do
not show the contribution that a school has made to the students’ initial

158
achievement. Some schools that are favoured by their intakes may not be
making any contribution to students’ learning, but whether they have taught or
not, they will still be at the top of the league table. On the other hand, some
schools which may be making a contribution to students’ learning or adding
value, but unable to increase their credit passes, may still be ranked low in
league tables. The above situation may result in complacency in the former
schools and demoralisation in the latter schools. The use of raw results leads to
misleading conclusions about the effectiveness of schools when used on their
own.
Schools are required to add value to students’ prior attainment and that
measures of good performance should include the concept of value addition (cf.
1.2). However, the value added is not measured by the Botswana Examination
Council. This has resulted in different schools using different methods of value
added analysis, which may also lead to wrong conclusions about the
effectiveness and performance of schools because the appropriate statistical
packages are not used.
The above situation in the judgement of school effectiveness, led to the
following research problems (cf. 1.3):
1. What does the concept of school effectiveness mean and what are the
characteristics of effective schools?
2. In what way can a value added approach to determining school
effectiveness contribute to judging school performance?
3. How effective are secondary schools in Botswana? Are some schools
more effective than others in promoting students’ progress when the
differences in students’ intake are considered? Are schools equally
effective/ineffective for all the student groups? Are the schools
consistently effective/ineffective across the core subjects? And are the
schools stable in their effectiveness/ineffectiveness for 2005-2007?
159
4. What recommendations could improve the practice of determining
effective/ineffective schools and the performance of secondary schools
in Botswana?
From the above problem questions, the following research aims were adopted
by the study.
1. To explore the concept of school effectiveness and identify the
characteristics of effective schools.
2. To investigate the possibilities of a value added approach to school
effectiveness in judging school performance.
3. To determine, on the basis of the literature reviewed and the methods
adopted by a value added approach, the effectiveness/ineffectiveness of
secondary schools in Botswana.
4. To make recommendations for the improvement of the practice of
determining effective/ineffective schools and thereby the performance of
secondary schools in Botswana.
To achieve the abovementioned goals, different methods were employed. To
explore the concept of school effectiveness and identify the characteristics of
effective schools, a literature review was carried out in Chapters two and three
(cf. 2.3 & 3.4).
The literature was also reviewed to investigate the possibilities of a value added
approach to school effectiveness in judging the performance of schools. The
literature reviewed spelled out the necessary data and the appropriate
statistical procedures to carry out a value added analysis (cf. 4.6). Through the
use of the statistical package of MLwiN 2.10 Beta (4) and the data set collected,
the possibility of a value added approach to judge the effectiveness of schools
was investigated (cf. 5.3).
To determine the effectiveness or ineffectiveness of secondary schools, two sets
of data: JCE scores (at entry) and BGCSE scores (at exit) were collected (cf. 4.4).

160
Different multilevel models were employed through the use of MLwiN 2.10
Beta (4) to determine the value added by the schools and the different core
subjects (cf. 5.3-5.6).
6.2 SUMMARIES OF THE RESEARCH FINDINGS
6.2.3 The concept of school effectiveness and characteristics of effective
schools
The question posed was: What does the concept of school effectiveness mean
and what are the characteristics of effective schools? (cf. 1.3.1).
This study adopted the most widely accepted definition in the school
effectiveness research to define an effective school. A school is effective when
students progress further than might be expected when the school’s intake and
students’ background factors are considered. This definition implies that an
effective school adds value to students’ prior attainment. Therefore, school
effectiveness in this study was synonymous with value added effectiveness.
This definition had an impact on the methodology adopted by this study (cf..
2.2).
Ten characteristics were identified as making a contribution towards the
effectiveness of schools. The consistency in the findings is an indication of the
robustness of these factors. The characteristics as identified in Chapters two and
three (cf. 2.3 & 3.4) were:
1. Effective leadership by the School Head and the School Management
Team
2. Effective teaching
3. Academic emphasis
4. A positive school culture
5. High expectations
6. Student involvement

161
7. Monitoring progress
8. A learning organisation
9. Parental involvement
10. Consistency in approach
These factors do not work in isolation, but collectively. The higher levels, for
example, the school level, must provide facilitating conditions for the lower
levels, for example, the classroom level. Thus the leadership by the principal
must produce a positive school culture that will enable effective teaching and
learning to take place. These factors were presented in a model of secondary
school effectiveness (cf. 3.5) which adopted the context - input - process - output
chain. The input into the education system includes students with different
abilities and attitudes. Thus for a school to add value, it is important that the
schools should work on producing a positive attitude towards learning by
students. This can be achieved through the contribution made by parents.
The leadership by the principal is a critical factor in producing an effective
school. The leadership should involve other stakeholders in the school: parents,
teachers and students. The principal should also be an instructional leader (cf.
2.3.1.1). At the heart of school effectiveness is teaching and learning (cf. 2.3.3).
The teachers through instructional efficacy believe that difficult students can be
taught and so they exert more effort in their teaching through various ways.
The students themselves view a school as a place of learning and exert effort on
their school work.
6.2.2 The effectiveness of secondary schools in Botswana
How effective are secondary schools of Botswana? Are some schools more
effective than others in promoting student progress when the difference in
student intake is considered? (cf. 1.3.3) By focussing on the relative progress of
students with similar characteristics (ability and gender), in different schools,
the study was able to make a comparison of ‘like with like’. The findings of this
162
research indicated that there was a marked difference in the effectiveness of
schools in Botswana in promoting the student progress after controlling for
students’ intakes. 9 or 33% of schools were more effective than others while the
majority, 18 or 67% were less effective. The learners in the more effective
schools progressed further than expected when compared with the students
from the least effective schools. The results indicated that indeed, schools make
a difference to students’ final achievement, which may impact on the students’
tertiary education. There is an advantage of attending a more effective school
than a less effective school. In the most effective school, a student had an
enhancement of +5.46 points while in the least effective school, the school
contributed to students performing 3.6 points below what they could have
attained (cf. Table 5.3.4).
When the inspectoral regions were considered, region D had more effective
schools than other regions (with four schools out of five). The two schools in
region E were both ineffective. Region C had three effective schools out of the
eight while region B with four schools had only one effective school and region
A with eight schools had only one effective school.
The other major finding by the study was the misleading nature of unadjusted
raw results. Some schools that were considered to be doing well in terms of raw
results were not doing so well in terms of value added to students and vice
versa (cf. 5.3.1 -5.3.3). The results of this study contribute to the ongoing debate
about the use of unadjusted raw results. What was also evident is the fact that
the correlations between schools’ ranking in raw results and value added
results were not perfect. Schools changed ranking positions depending on
which indicator was used. This proved that the ranking of schools into position
is sensitive to the performance indicator used. This shows that a school’s
performance is to be judged not only on the raw results but also on the
contribution the school made to those results. Without a value added
component, the effectiveness of schools will remain unknown to all
stakeholders.
163
The results of this study make a contribution to the practice of evaluating a
school’s effectiveness. The results indicate that it is possible to adopt a value
added approach to determine the effectiveness or ineffectiveness of schools and
make judgements about their performances (cf. 1.4.2). It is therefore possible
through a value added approach, to hold schools accountable for what they are
supposed to influence, that is, students’ progress.
6.2.3 Differential school effectiveness for the different student groups
Are the schools equally effective/ineffective for all the student groups? (cf.
1.3.3) This question seeks to answer the question: Effective for which student
groups? (cf. 1.3.)
There was a significant evidence of differential effectiveness for students with
different ability levels and gender. The overall results indicated that schools
promoted the progress of boys more than girls and mid ability students better
than the high and low ability students (cf. 5.4). The question on differential
effectiveness shows that it is very important to investigate differential school
effectiveness whenever answering questions on school effectiveness. This is
important because the use of a single measure of school effectiveness can result
in misleading conclusions about the effectiveness of schools. This shows that
the issue of differential effectiveness is very important when making
judgements about the effectiveness of schools. It looks at how equitable the
provision of quality education is to all the student groups.
The performance gap between boys and girls widened further at BGCSE than at
intake. This adds to similar findings in Botswana where it was realised that
although more girls than boys enter primary education, few go up to tertiary
education level. This leads to under representation of women in key decision
making roles because few women make it into tertiary education. This equity
issue is a challenge facing Vision 2016 (cf. 5.4) and it needs to be addressed.
164
6.2.4 Consistency across the core curriculum subjects.
Are the schools consistently effective/ineffective across the core subjects? (cf.
1.3.3). This question seeks to answer the question: Effective in promoting which
outcomes? (cf. 1.3).
Consistency was determined among the three core subjects of English language,
Setswana language and Mathematics. Ten schools showed some consistency
across the subjects. Four schools out of these ten were effective across all the
three departments while six schools were ineffective. The consistency in
ineffectiveness across all the departments may reflect on the whole school
processes that need to be looked into. In seventeen (17) schools, there was some
evidence of internal variations among the departments. These schools had
effective and ineffective departments coexisting. (cf. Table 5.5.3.1 & 5.5.3.2).
The findings on consistency across the departments contribute to the practice of
determining school effectiveness. The results demonstrate that it is helpful to
look at both the overall and subject value added scores when evaluating
secondary schools academic performance. The use of an overall single measure
to determine the effectiveness of schools could be misleading because a school
can have effective and ineffective departments in a given year. It is therefore
important that the internal variations should be investigated to show the
individual department’s effectiveness rather than to label all the departments as
either effective or ineffective. This underscores the importance of departmental
effectiveness in models of academic effectiveness in secondary schools (cf. 3.5).
Departmental effectiveness/ ineffectiveness can lead to the overall effectiveness
or ineffectiveness of a school.
165
6.2.5 Stability in effectiveness for the three years
Are the schools stable in effective/ineffective for 2005-2007? (cf. 1.3.3) This
answers the third important question on school effectiveness: Effective over
what time period? (cf. 1.3.3).
Schools are not static institutions. They are subject to internal and external
changes that affect their functioning. Good performance in one year, may not
necessarily guarantee good performance for years that follow. The value added
by individual schools was compared from year to year. Twelve schools were
stable in their effects. Out of the twelve schools, six schools were stable from
year to year in adding positive value to students’ achievements although the
value added scores were not stable. In one year, a school could add more value
than in the other years. Some schools showed an increase in the value added
scores from year to year while others showed a decline. Six schools were stable
in adding negative value to students’ prior attainment. Three of these schools
were increasingly becoming ineffective from year to year. Fifteen schools were
unstable in their value added scores. They added both negative and positive
value in the three years. Two schools were improving in their effectiveness
while one school was becoming ineffective though it was effective for the 2005
cohort (cf. 5.6.1). The findings show that school effectiveness can be unstable
even in a relatively short period of time and that an ineffective school can be
made effective.
The study answered three important questions that were posed in Chapter one
that any study of school effectiveness should address. This is because
effectiveness is a retrospective, relative concept that is time and outcome
specific (Sammons, 2007:12). The questions answered were: Effective in
promoting which outcomes? Effective for which student groups? And for what
time period? (cf. 1.3). These questions provide a focus for schools’ self
evaluation and review which can aid schools in identifying areas to tackle for
improvement. It is also worth mentioning that by means of the afore mentioned
166
strategies (cf. 6.1), the research aims stated in Chapter one, were achieved and
the problem questions were answered.
Peng et al. (2006:198) note that researchers indicate that there is an observable
trend of school effectiveness research towards internationalisation that cannot
be ignored and that it has been argued convincingly that the findings of school
effectiveness research in developing countries can make significant
contributions to the international debate. This study employed the state of art
school effectiveness research methods used in industrialised countries to make
a contribution to studies from third world countries that have explored the
scientific properties of school effectiveness, such as the size of school effects,
stability and consistency of school effects and differential effects of schools (cf.
1.8). These are fundamental issues underlying school effectiveness (cf. 3.7).
Differential school effectiveness is a topic of increasing interest in school
effectiveness research, especially for equity. The result on the differential
effectiveness of schools has contributed some important evidence to the
ongoing debate about gender equity. It is evident even in Botswana that schools
promote the progress of boys more than girls. Vision 2016 has acknowledged
this as a major challenge as it states that: “the other challenge facing the
education sector as we move towards Vision 2016 is the equity dimension”
(Vision 2016:18-19). Although more girls enter primary school, the number
decreases sharply at the upper levels including tertiary and technical.
The results of the study made a contribution to the development of theoretical
models of secondary school effectiveness. The evidence for the existence of
internal variations by different departments within the same school supports
the recommendations for the incorporation of departmental level in models of
school effectiveness (Sammons et al., 1997:179). Sammons et al. and Thomas et al.
(in Sammons et al., 1997:165) assert that the term school effectiveness needs to
be qualified at the secondary level to the term school and departmental
effectiveness.

167
6.3 RECOMMENDATIONS
The research findings have important implications for those working in schools
and with schools. Some recommendations to improve practice and for further
research are made based on the results of the study.
6.3.1 Recommendation to improve school effectiveness
It is of major concern that only 9 out of the 27 schools were effective. There are
interventions that could be put in place to raise the effectiveness of schools and
those for the ineffective ones in particular. The measures that could be put in
place include the reduction of class sizes so that teachers have few students to
concentrate on. The other intervention would be to have assistant teachers or
remedial teachers who could assist the academically challenged students. This
is very important as the Ministry of Education is increasing access every year
with the aim of achieving a twelve year basic education.
The results of the study can inform schools’ self reviews. Since they take into
account students’ prior attainment, value added results can be used as a regular
process of schools’ self evaluation and review. This is what is expected by the
Department of Secondary Education from schools as the pastoral policy states:
“The school should consciously promote active monitoring and supervision of
its academic programme and institutionalise continuous self evaluation by both
staff and its students. The ultimate expectation of its customers is academic
excellence” (DSE, 2007:3). The individual teachers should have students’ prior
achievement. When monitoring the progress of students, each student’s prior
attainment in a particular subject must be taken into account. By focussing on
the subject results as well as the overall effectiveness, the school management
team can identify strengths and weaknesses and appropriate measures be
employed.
168
Schools can use the results on the characteristics of effective schools to check
whether they are moving towards effectiveness or not.
The role of the School Head is very pivotal in school effectiveness; therefore,
School Heads need to be educated on the characteristics of effective schools
during their induction into headship.
The inspection process should be informed by the students’ intakes.
Information about the attainment of students at entry should be used to
contextualise the inspection process. During the inspection, schools should be
evaluated on the progress made by the different student groups.
6.3.2 Recommendations for the practice of determining the effectiveness of
schools
The results of the study have shown that it is possible to adopt a value added
approach to investigate the effectiveness of schools and hence their
performance. It has been argued in this thesis that the use of the credit passes as
an indicator of performance is flawed. The research recommends that
appropriate value added measures be developed nation-wide which will
provide schools with good quality comparative information about their
effectiveness and performance on yearly basis. Once the effectiveness of schools
is known, the Department of Secondary Education will know how far it is from
achieving the goal of “an informed and educated nation by 2016”. Appropriate
interventions could be put in place to assist schools lagging behind.
6.3.3 Recommendations for further research
Further research is needed to determine the link between school effectiveness
factors and the quantitative value added scores by the schools. In other words,
what factors were prevalent in schools and departments that made them to be
169
more or less effective which ultimately led to the differences in the overall
effectiveness of schools and the internal variations within a school?
The research needs to be extended to other subjects like Social Studies and
Agriculture which are core curricular subjects at JCE and are taken by many
students as optional subjects at BGCSE.
Differential effectiveness has important implications for the achievement of
Vision 2016. The study has indicated that schools are differentially effective for
the different students’ groups, namely gender and ability. There are other
students’ groups that should be researched on. Further research is needed to
determine how effective schools are with students from different ethnic
backgrounds and socio economic status. This will also enable the Department of
Secondary Education to know how far it is from providing quality education to
all the various student groups. Further research is also needed to determine the
differential effectiveness of the subjects for the different students’ groups in
terms of ability, gender and socio economic status. The differential effectiveness
by ability and gender challenges the objective of the Revised National Policy on
Education (1994:5) which states that the goal of the national education is “to
provide life long education to all sectors of the population”.
There are limitations to any study of school effectiveness that adopts a value
added methodology and these need to be mentioned here.
The validity of background factors. The study could not control for the
factors outside the school, for example, private tuition. The study
assumed that the value added was entirely due to the school and
departments.
The study recognises that progress is not the only criteria that should be
employed in judging school effectiveness. Other qualitative measures are
needed and could be more fruitful than just using one method.
170
The retrospective nature of the data which focuses on students’ outcome
at the end of BGCSE means that the results indicate the schools’ past
performance.
6.4 CONCLUDING REMARKS
Saunders (2000:241-242) observes that value added performance is now a major
feature in the educational landscape and it is here to stay. The academic debate
on school effectiveness and how to measure it is now integrally linked with the
national political agenda for educational quality in many countries. This means
that the range of parties interested in value added extends from politicians to
school managers and from academic researchers to lay governors, thus making
it one of the biggest growth areas in educational research over the past thirty
years. The flourishing knowledge base resulting from this expansion reflects a
trend towards internationalisation and globalisation, and Botswana is not an
exception. It is now regarded as a normal practice in Botswana for schools to
report on their performances every month and that their measures should
indicate the value added by the school.
The study has proved that with the advancement of modern statistical methods
that are available, it is possible to adopt the state of art school effectiveness that
is guided by the input- process- output-context categorisation of variables that
is oriented towards ‘value added’ (Scheerens, 2001:368). It is upon the Ministry
of Education to adopt the value added methodology fully, as an appropriate
measure of schools’ effectiveness and performances in order to improve the
quality of education. This will inform all the stakeholders about the
productivity of senior secondary schools in Botswana. This will also protect the
schools from inappropriate comparisons that are usually injected into public
debates by the media and others.
The performance of all the different groups needs to be enhanced in order to
achieve the Vision 2016 pillar of an “informed and educated nation.”
171
The conceptual framework on the academic effectiveness of secondary schools
(cf. 3.5), has teachers as inputs into the education system in the form of teachers’
qualifications and experience which can directly influence the quality of
teaching at the classroom level. The Teaching Service Management (TSM) as the
employing body for teachers must ensure that teachers do not overstay in one
area. This might result in teachers’ demotivation which might lead to lower
performance by such teachers.
The flourishing knowledge base of the school effectiveness research discussed
in Chapters two and three, has informed the pastoral policy system in
Botswana. The pastoral policy has six components that schools should report on
every month or every term. The components are: academic performance;
student discipline which implies the creation of a safe and orderly
environment; stakeholder involvement (parents, students and community);
leadership and management which is measured by factors such as the degree
of delegation in the school; core curricular activities whereby each student
should be involved in at least one school activity; and guidance and
counselling. This means that if schools were to implement this pastoral policy
which includes some characteristics of effective schools, then the schools will be
moving in the direction of becoming effective. School effectiveness does not
come by chance and once a school becomes effective, it has to keep on working
to maintain the effectiveness status. This requires the strong leadership of the
principal, effective School Management Teams that really function as teams and
the contribution of both staff and students. It is incumbent upon the
Department of Secondary Education to see to it that schools report as needed on
the above issues. This will be used as a yard stick by the Department to see how
far it is from achieving its mandate and thereby its contribution to the Vision
2016 pillar of “an informed and educated nation”.
172
REFERENCES
Akey, T.M. 2006. School context, student attitudes, behavior, and academic
achievement: An exploratory analysis. Available from
http://www.mrdc.org/publications/419/full.pdf [23/08/07].
Appalachia Educational Laboratory. 2005. Linking student achievement to school,
family, and community involvement research brief.
Bandura, A. 1994. Self-efficacy. In V. S. Ramachaudran (Ed.), Encyclopedia of
human behavior, 4: 71-81. New York: Academic Press. Available from
http://www.des.emory.edu/mfp/BanEncy.html [5 October 2007].
Bandura, A. 1997. Self efficacy: The exercise of control. New York: W.H. Freeman.
Barker, K., Wendel, T. & Richmond, M. 1999. Linking school effectiveness and
virtual schools. Available from http://www. FuturEd.com [27 June 2005].
Barth, R. 1999. The Principal Learner: A work in progress. The International
Network of Principals’ Centers, Harvard Graduate School of Education,
Cambridge, MA.
Blanchard, J. 2002. Teaching and targets: Self-evaluation and school improvement.
London: Routledge Falmer.
Brink, P.J. & Wood, M.J. 1994. Basic steps in planning nursing research from
question to proposal, 4th ed. London: Jones & Bartlett.
Brookover, W.B., Beady, C., Flood, P., Schweitzer, J. & Wisenbaker, J. 1979.
Schools, social systems and student achievement: Schools can make a difference. New
York: Praeger.
173
Bryman, A. & Cramer, D. 1997. Quantitative data analysis with spss for windows.
London: Routledge.
Bulach, C., Boothe, D. & Pickett, P. 2006. Analysing the leadership behavior of school
principals. Available from http://cnx.org/content/m13813/latest [23 September 2007].
Cohen, L. & Manion, L. 1994. Research methods in education, 4th ed. London:
Routledge.
Cohen, L., Manion, L. & Morrison, K. 2001. Research methods in education, 5th ed.
London: Routledge.
Creemers, B. 1994. The effective classroom. London: Cassell.
Creemers, B. 1996. The school effectiveness knowledge base. In D. Reynolds, R.
Bollen, D. Hopkins, L. Stoll & N. Lagerweij (Eds.), Making good schools: Linking
school effectiveness and school improvement (pp.36-58). London: Routledge.
Creemers, B.P.M. 2002. From school effectiveness and school improvement to
effective school improvement: Background, theoretical analysis, an outline of an
empirical study. Educational Research and Evaluation, 8(4): 343-363.
Creemers, B.P.M & Reezigt, G.J. 1996. School level conditions affecting the
effectiveness of instruction. School Effectiveness and School Improvement, 7(3): 197-
223.
Creemers, B.P.M & Scheerens, J. 1989. Developments in school effectiveness
research. International Journal of Educational Research, 13(7): 685-825.
Creswell, J.W. 1994. Research design: Qualitative and quantitative approaches.
London: Sage.
174
Cunningham, E.G., Wang, W.C. & Bishop, N. 2005. Challenges to student
engagement and school effectiveness indicators. Available from http//
www.aare.edu.au/05pap/cun05478.pdf [23 September 2007]
De Fraine, B., Van Damme, J. & Onghena, P. 2002. Accountability of schools and
teachers: What should be taken into account? European Educational Research
Journal, 1(3): 403-427
Department of Secondary Education. 2007. Pastoral policy for secondary schools.
Gaborone: Ministry of Education and Skills Development.
Desforges, C. & Boucher, A. 2003. The impact of parental involvement, parental
support and family education on pupil achievement and adjustment: A literature
review. Available from
http//www.dfes.gov.uk/research/daa/uploadfiles/RR433.pdf2
[October 2007].
Downs, D. & Vindurampulle, O. 2007. Value added measures for school
improvement. Melbourne Education Policy and Research Division, Department
of Education and Early Childhood Development.
Drury, D. & Doran, H. 2003. The value of value added analysis. Policy Research
Brief, 3(1):1-4.
Fehrmann, P.G., Keith, T.Z. & Reimers, T.M. 1987. Home influences on student
learning: Direct and indirect effects of parental involvement on high school
grades. Journal of Educational Research, 80:330-337.
Feinstein, L. & Symons, J. 1999. Attainment in secondary schools. Oxford
Economic Papers, 51(2):300-321.
175
Finlay, K.A. 2006. Quantifying school engagement: Research report. National Center
for school engagement. Available from http://www.schoolengagement.org [6
October 2007].
Fredricks, J., Blumenfield, P. & Paris, A. 2004. School engagement: Potential of
the concept, state of the evidence. Review of Educational Research, 74(1):59-109.
Fullan, M. 2001. The new meaning of educational change, 2nd ed. London: Cassell.
Goddard, R.D. 2000. Academic emphasis of urban elementary schools and
student achievement in reading and Mathematics: A multilevel analysis.
Educational Administration Quarterly, 36(5): 683-702.
Goddard, R.D., Hoy, W.K. & Hoy, A.W. 2000. Collective teacher efficacy: Its
meanings, measure and impact on student achievement. American Educational
Research Journal, 37(2):479-507.
Goldstein, H. 1996. Relegate the league tables. New Economy, 199-203.
Goldstein, H. 1997. Methods in school effectiveness research. School Effectiveness
and School Improvement, 8:369-395.
Goldstein, H. 1999. Multilevel statistical models. Available from
http://www.arnoldpublishers.com/support/goldstein.htm[23 October 2007].
Goldstein, H. & Spiegelhalter, D.J. 1996. League tables and their limitations:
Statistical issues in comparisons of institutional performance. Journal of the Royal
Statistical Society, 159 (3):385-443.
Goldstein, H. & Thomas, S. 1996. Using examination results as indicators of
college and school performance. Journal of the Royal Statistical Society, 159(1):
149-163.
176
Gray, J., Jesson, D. & Sime, N. 1995. Estimating differences in the examination
performance of secondary schools in six LEAs: A multi level approach to school
effectiveness. Oxford Review of Education, 16(2):137-158.
Gray, J. & Wilcox, B. 1995. Good school, bad school: Evaluating performance and
encouraging improvement. Buckingham: Open University Press.
Griffith, J. 1996. Relation to parental involvement, empowerment, and school
traits to student academic performance. Journal of Educational Research, 90(1):33-
41.
Gruenert, S. 2005. Correlations of collaborative school cultures with student
achievement. NASSP Bulletin, 88(645):43-53.
Gunter, B. 2002. The quantitative research process. In K.B. Jensen (Eds), A
handbook of media and communication research: Qualitative and quantitative
methodologies, (pp.209-234). London: Routledge.
Hallinger, P. 2007. Research on the practice of instructional and transformational
leadership; retrospect and prospect. A paper written for research conference.
Hallinger, P. & Heck, R.H. 1996. Reassessing the principal’s role in school
effectiveness: A review of empirical research, 1980-1995. Educational
Administration Quarterly, 32(1):5-44.
Hallinger, P. & Heck, R. 1999. Can leadership enhance school effectiveness? In
T. Bush, R. Glatter, R. Bolam, P. Ribbins & L. Bell (Eds.), Redefining educational
management (pp.34-45). London: Sage.
Harker, R. & Tymms, P. 2004. The effects of student composition on school
outcomes. School Effectiveness and School Improvement, 15(2):177-199.
177
Harris, A. 1999. Improving ineffective departments in secondary schools:
Strategies for change and development. Educational Management &
Administration, 26(3):269-278.
Harris, A. 2001a. School improvement: What’s in it for schools? London: Routledge.
Harris, A. 2001b. Department improvement and school improvement; A
missing link? British Educational Research Journal, 27(4):477-487.
Harris, A. 2003. Introduction. In A. Harris, C. Day, M. Hadfield, D. Hopkins, A.
Hargreaves, & C. Chapman (Eds.), Effective leadership for school improvement (pp.
1-5). London: Routledge
Harris, A. 2003a. The changing context of leadership: research theory and
practice. In A. Harris, C. Day, M. Hadfield, D. Hopkins, A. Hargreaves, & C.
Chapman (Eds.), Effective leadership for school improvement (pp. 9-25). London:
Routledge.
Harris, A. 2003b. Teacher leadership and school improvement. In A. Harris, C.
Day, M. Hadfield, D. Hopkins, A. Hargreaves, & C. Chapman (Eds.), Effective
leadership for school improvement (pp. 72-83). London: Routledge.
Harris, A. & Muijs, D. 2002. Teacher leadership: Principles and practice. A paper for
the National College for School Leadership, Nottingham, England.
Heck, R.H. 2000. Examining the impact of school quality on outcomes and
improvement: A value added approach. Educational Administration Quarterly,
36(4):513-552.
Heck, R.H., Larsen, T.J. & Marcoulides, T. 1990. Instructional leadership and
school achievement: Validation of a casual model. Educational Administration
Quarterly, 26(2):94-125.
178
Hill, R. 1998. What sample size is big enough in internet survey research?
Interpersonal Computing and Technology: An electronic journal for the 21st century,
6:3-4.
Hills, D. 1998. Descriptive and inferential statistics: A summary. California State
University. Available from http://www.habermas.org/stat2f98.html [28 June
2008].
Holly, P. & Southworth, G. 1989. The developing school. London: Routledge
Falmer.
Hopkins, W.G.2000. Research design. Available from:
http://www.sportsci.org/jour/001/wghdesign.html.[27 November 2007].
Hopkins, D. 2001. School improvement for real. London: Routledge Falmer.
Hopkins, D. 2003. Instructional leadership and school improvement. In A.
Harris, C. Day, M. Hadfield, D. Hopkins, A. Hargreaves, & C. Chapman (Eds.),
Effective leadership for school improvement (pp.55-71). London: Routledge Falmer.
Huber, S.G. 1999. Dovetailing school effectiveness and school improvement.
International Congress on School Effectiveness and School Improvement:
Jesson, D. 2000. The comparative evaluation of GCSE value added performance by type
of school and LEA. Discussion Papers in Economics, No 2000/52. University of
York. Available from:
http://www.york.ac.uk/depts. /econ/documents/dp/0052.pdf. [3 August
2007].
179
Jesson, D. & Gray, J. 1991. Slants on slopes: Using multilevel models to
investigate differential school effectiveness and its impact on pupils’
examination results. School Effectiveness and School Improvement, 2(3):230-247.
Joyce, B., Calhoun, E. & Hopkins, D. 1999. The new structure of school
improvement: Inquiring schools and achieving schools. Philadelphia: Open
University Press.
Keakile, K.M. 22.5.2008. National performance target correspondence from
Chief Education Officer, CREOS 1/1/9 IV (175).
Kelley, R. & Williamson, R. 2006. The relationship between servant leadership
behaviour of high school principals, school climate and student engagement. Available
from http://www.principalpartnership.com/feture906.html[23 September
2007].
Leithwood, K. 2005. Understanding successful school leadership: Progress on a
broken front. Journal of Educational Administration, 43(6): 619-629.
Leithwood, K. & Jantzi, D. 2000. The effects of transformational leadership on
organisational conditions and student engagement with school. Journal of
Educational Administration, 38(2):112-119.
Leithwood, K., Jantzi, D. & Steinback, R. 1999. Changing leadership for changing
times. Buckingham: Open University Press.
Leithwood, K., Louis, K.S., Anderson, S. & Wahlstrom, K. 2004. How leadership
influences student learning: A review of research. Available from
http://www.wallacefoundation.org/.../KnowledgeTopics/Education
Leadership/HowLeadershipInfluencesStudentLearning.html [23 September
2007].

180
Leong, F.T.L. & Austin, J.T. 1996. The psychology research handbook: A guide for
graduate students and research assistants. London: Sage.
Lezotte, L.W. 1989. School improvement based on the effective schools research.
International Journal of Educational Research, 13(7):815-825.
Luyten, H. 1994. Stability of school effects in Dutch secondary education: The
impact of variance across subjects and years. International Journal of Educational
Research, 21(2):197-216.
Marzano, R.J. 2000. A new era of school reform: Going where research takes us.
Available from: http//www.mcrel.org [18 January 2006].
Mayston, D. 2007. Educational value added and programme evaluation. University of
York. Available from
http:// www.dfes.gov.uk/research/data/uploadfiles/RW87.pdf[20 June 2007]
McPherson, A. 1997. Measuring value added in schools. In A. Harris, N.Bennet
& M. Preddy (Eds), Organizational effectiveness and improvement in education,
(pp.185-190). Buckingham: Open University Press.
MEERA. 2007. Plan an evaluation Available from
http://www.meera.snre.umich.edu/plan-an-evaluation/
ploneartidemultipage.2007-10-30.4643560864/step-5-collect-data[28 June 2008].
Mertens, D.M. 1998. Research methods in education and psychology. London: Sage.
Moore, K.D. 1998. Classroom teaching skills, 4th ed. Boston: McGraw Hill.
Mortimore, P. 1991. The nature and findings of research on school effectiveness
in the primary sector. In S. Riddell & S. Brown (Eds.), School effectiveness research,
its messages for school improvement, 9-20, Edinburgh: HMSO.
181
Mortimore, P. 1993. School effectiveness and the management of effective
learning and teaching. School Effectiveness and School Improvement, 4(4): 290-310.
Mortimore, P., Sammons, P., Stoll, L., Lewis, D. & Ecob, R. 1988. School matters:
The junior years. London: Paul Chapman.
Mortimore, P., Sammons, P. & Thomas, S. 1994. School effectiveness and value
added measures. Assessment in Education: Principles, Policy & Practice, 1(3):315-
332.
Muijs, D. & Reynolds, D. 2001. Effective teaching: Evidence and practice. London:
Paul Chapman.
Mulford, B. 2003. School leaders: Challenging roles and impact on teacher and school
effectiveness. Paris commissioned Paper by the Education and Training Policy
Division. OECD for the activity “Attracting, Developing and Retaining effective
teachers”. Available from http//www.oecd.org/dataoecd/61/61/2635399pdf
[23 September 2007].
Nash, R. 2003. Is the school composition effect real? A discussion with evidence
from the UK PISA data. School Effectiveness and School Improvement, 14(4):441-
457.
National Staff Development Council. 2000. Learning to lead, leading to learn.
Available from http://www.nsdc.org/bookstore.htm[23 January 2002].
Nuttall, D. 1990. Differences in examination performances, RS 1277/90 (London
Research and Statistics branch, ILES).
182
Nuttall, D., Goldstein, H., Prosser, R. & Rasbash, J. 1989. Differential school
effectiveness. International Journal of Educational Research, 13(7):769-776.
Ofsted. 2003. Boys’ achievement in secondary school. Available from
http://www.ofsted.gov.uk [22 October 2007]
Page, D. & Wong, T.P. 2000. The human factor in shaping the course of history and
development. Lanham, MD: United Press of America.
Peng, W.U., Thomas, S., Yang, X. & Li, J. 2006. Developing school evaluation
methods to improve the quality of schooling in China: A pilot ‘value added’
study. Assessment in Education: Principles, Policy & Practice, 13(2): 135-154.
Purkey, S.C. & Smith, M.S. 1982. Effective schools: A review. Madison, WI:
Wisconsin Center for Educational Research, School of Education.
Rasbash, J., Steele, F., Browne, W. & Prosser, B. 2008. A user’s guide to MLwiN
version 2.0.2 Centre for multilevel modelling, University of Bristol.
Republic of Botswana .1994. Revised national policy on education. Gaborone:
Government Printer
Republic of Botswana .1997. Vision 2016: Towards prosperity for all. Gaborone:
Government Printer.
Reynolds, D. & Teddlie, C. 2000. The processes of school effectiveness. In D.
Reynolds, & C. Teddlie (Eds.), The international handbook of school effectiveness
research (pp.134-159). London: Falmer Press.
183
Reynolds, D., Teddlie, C., Creemers, B., Scheerens, J. & Townsend, T. 2000. An
introduction to school effectiveness research. In D. Reynolds & C. Teddlie
(Eds.), The international handbook of school effectiveness research. (pp.5-25). London:
Falmer Press.
Rhodes, H.J. 2007. Confronting the challenges of student engagement: A case study of
a school based intervention. Available from http://www. rand.org/pubs/rgs
dissertations/2007/RAND_RGSD218.pdf[5 October 2007].
Ross, J.A. & Gray, P. 2006. Transformational leadership and teacher
commitment to organizational values: The mediating effects of teacher
collective efficacy. School Effectiveness and School Improvement, 17 (2): 179-199.
Rowe, K.J. 2004. The importance of learning. A paper presented at the making
schools better conference. Australia: University of Melbourne. Available from
http://acer.edu/research/programs/learningprocess.htm. [22 April 2006 ].
Rumberger, R.W. & Palardy, G.J. 2005. Does segregation still matter? The
impact of student composition on academic achievement at high school.
Teachers College Record, 107(9): 1999-2045.
Sammons, P. 1999. School effectiveness: Coming of age in the twenty-first century.
Lisse, The Netherlands: Swets & Zeitlinger.
Sammons, P. 2001. Fairer comparisons of schools: The role of school effectiveness
research in promoting improvement. Paper presented at the Meaning of Quality in
Education Conference: Karlstad, London. Available from
http://www.eu2001.se/education/eng/docs/karlstad-sammons.pdf.
[14 March 2004].
184
Sammons, P. 2006. School Effectiveness and Equity: Making connections. Paper
presented at the International Congress on School Effectiveness and School
Improvement: Fort Lauderdale, Florida. Available from:
http://www.leadership.fau.edu/ICSEI2006/papers/sammoms-keynote.pdf.[8
August 2006].
Sammons, P. 2007. School Effectiveness and Equity: Making connections. Review
prepared for CfBT. Available from: http://www.cfbt.com/
evidenceforeducation/docs/pam%20sammons%2010%dec%202007 ppt[8
August 2008].
Sammons, P., Nuttall, D. & Cuttance, P. 1993. Differential school effectiveness:
Results from a reanalysis of inner London Education Authority Junior School
Project Data. British Educational Research Journal, 19: 381-405.
Sammons, P., Thomas, S. & Mortimore, P. 1997. Forging links: Effective schools
and effective departments. London: Paul Chapman.
Saunders, L. 1997. Value added principles, practice and ethical considerations.
In A. Harris, N.Bennet & M. Preddy (Eds), Organizational effectiveness and
improvement in education, (pp.190-2002). Buckingham: Open University Press.
Saunders, L. 2000. Understanding schools’ use of ‘value added’ data: The
psychology and sociology of numbers. Research Papers in Education, 15(3):241-
258.
Schagen, I. & Schagen, S. 2005. Combining multilevel analysis with national
value added data sets: A case study to explore the effects of school diversity.
British Educational Research Journal, 31(3):309-325.
Scheerens, J. 2000. Improving school effectiveness. Paris: UNESCO.
Field Code Changed
185
Scheerens, J. 2004. Review of school and instructional effectiveness research. Paper
commissioned for the EFA global monitoring report, 2005, the quality
imperative.
Scheerens, J. & Bosker, R.J. 1997. The foundations of educational effectiveness.
Oxford: Pergamon Press.
Schein, E.H. 1985. Organizational culture and leadership. San Francisco, CA: Jossey
Bass.
Sealetsa, N.D. 2008. ‘Criticism of double shift schools unjustified’, The Monitor,
10 March, p.9.
Sillins, H., Zarins, S. & Mulford, B. 2002. Organisational learning and school
change. Educational Administration Quarterly, 38(5): 613-642.
Smith, G.J. 1995. Research: Guidelines for planning and documentation. Durban:
Southern Book.
Smith, D.J. & Tomlinson, S. 1989. The school effect: A study of multi racial
comprehensives. London: Policy Studies Institute.
Southworth, G. 2004. Leadership for school learning. Managing Schools Today.
May/June: 60-63.
Stewart, J. 2006. Transformational leadership: The evolving concept examined
through the works of Burns, Bass, Avolio & Leithwood. Canadian Journal of
Educational Administration and Policy, 56:1-29.
Stoll, L. & Fink, D. 1996. Changing our schools: Linking school effectiveness and
school improvement. Buckingham: Open University Press.
186
Strand, S. 1997. Pupil progress during key stage 1: A value added analysis of
school effects. British Educational Research Journal, 23(4): 471-487.
Teddlie, C., Reynolds, D. & Sammons, P. 2000. The methodology and scientific
properties of school effectiveness research. In D. Reynolds & C. Teddlie (Eds.),
The international handbook of school effectiveness research. (pp.53-133). London:
Falmer Press.
Terns, R. 2008. Inferential statistics. Available from
http://owl.english.purdue.edu/owl/resource/672/06 [ 01 July 2008].
Thomas, S. & Mortimore, P. 1996. Comparison of value added models for
secondary school effectiveness. Research Papers in Education, 11(1):5-33.
Thomas, S., Sammons, P., Mortimore, P. & Smees, R. 1997. Stability and
consistency in secondary schools’ effects on students’ GCSE outcomes over
three years. School Effectiveness and School Improvement, 8(2): 169-197.
Voke, H. 2002. Motivating students to learn. ASCD Infobrief, 2(28). Available
from http://www.ascd.org/readingroom/infobrief/200202-issue28.html
[October 2007].
Waters, T., Marzano, R. & McNulty, B. 2004. Leadership that sparks learning.
Educational Leadership, 61(7):48-52.
Willms, J.D. 1992 Monitoring school performance: A guide for educators.
London: Falmer Press.
Willms, J. 2003. Student engagement at school: A sense of belonging and participation.
Results from PISA 2000, OECD. Available from http://www.artssmarts.ca/
media/fr/student_engagement.pdf [7 October 2007].
Field Code Changed
Field Code Changed
187
Wilson, D. 2003. Which ranking? The use of alternative performance indicators in the
English secondary education market. Available from
http://www.bris.ac.uk/Depts/CMPO/workingpapers/wp58.pdf
[23 May 2007].
Wright, S.P., Horn, S.P. & Sanders, W.L. 1997. Teacher and classroom context
effects on student achievement: Implications for teacher evaluation. Journal of
Personnel Evaluation in Education, 11:57-67.
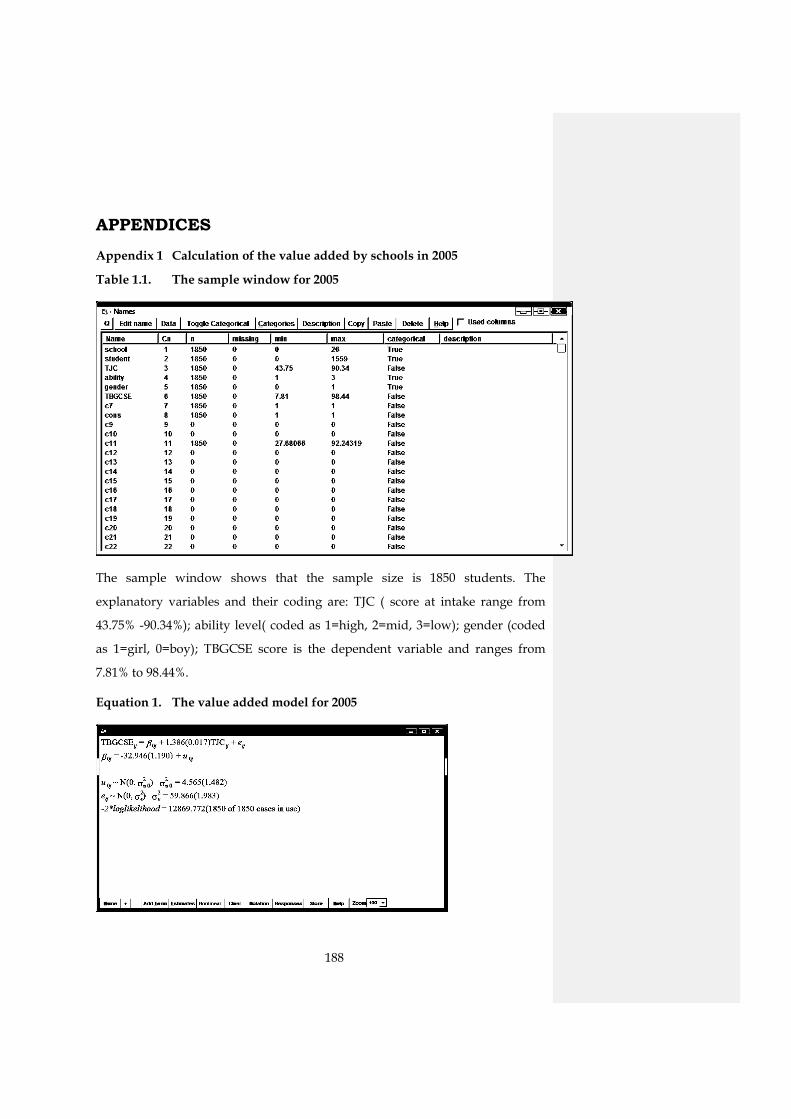
188
APPENDICES
Appendix 1 Calculation of the value added by schools in 2005
Table 1.1. The sample window for 2005
The sample window shows that the sample size is 1850 students. The
explanatory variables and their coding are: TJC ( score at intake range from
43.75% -90.34%); ability level( coded as 1=high, 2=mid, 3=low); gender (coded
as 1=girl, 0=boy); TBGCSE score is the dependent variable and ranges from
7.81% to 98.44%.
Equation 1. The value added model for 2005
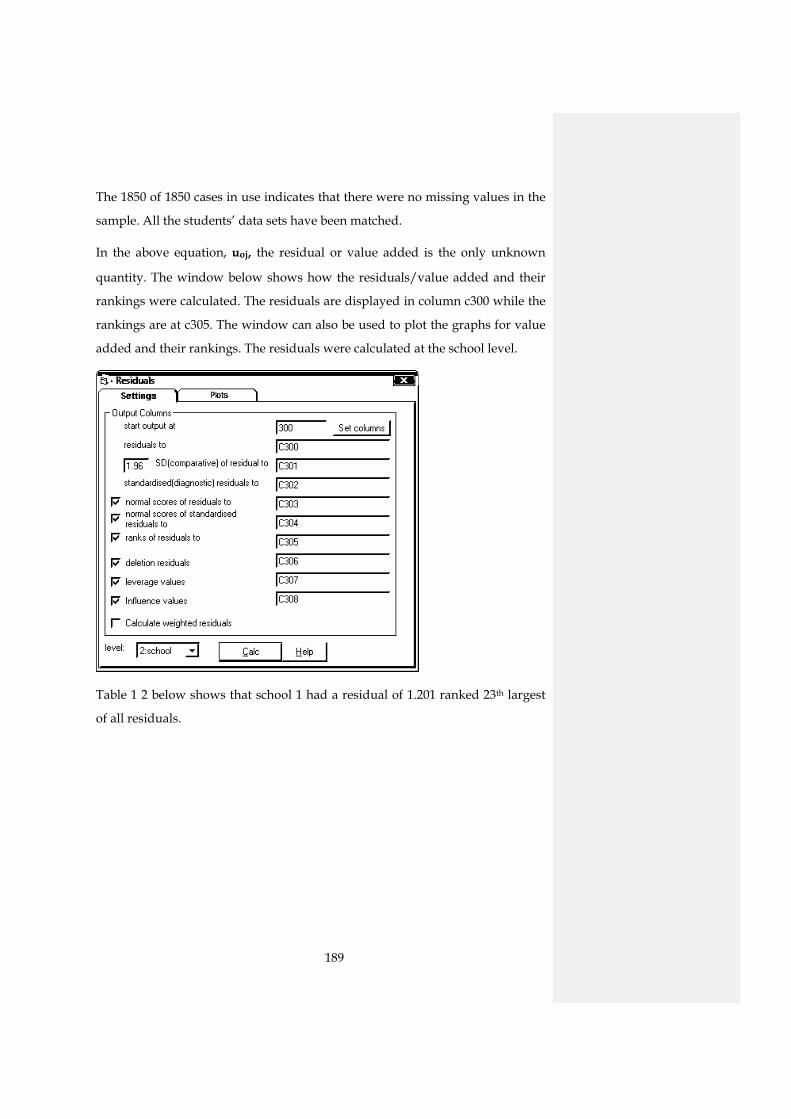
189
The 1850 of 1850 cases in use indicates that there were no missing values in the
sample. All the students’ data sets have been matched.
In the above equation, uoj, the residual or value added is the only unknown
quantity. The window below shows how the residuals/value added and their
rankings were calculated. The residuals are displayed in column c300 while the
rankings are at c305. The window can also be used to plot the graphs for value
added and their rankings. The residuals were calculated at the school level.
Table 1 2 below shows that school 1 had a residual of 1.201 ranked 23th largest
of all residuals.
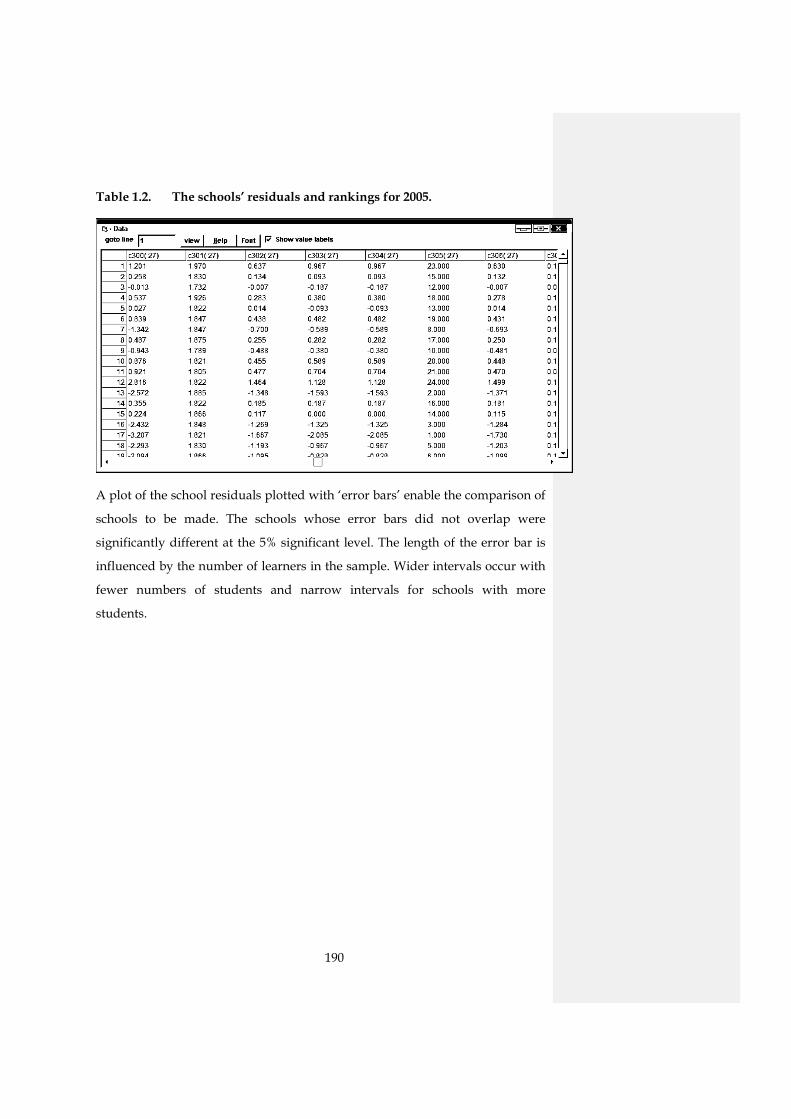
190
Table 1.2. The schools’ residuals and rankings for 2005.
A plot of the school residuals plotted with ‘error bars’ enable the comparison of
schools to be made. The schools whose error bars did not overlap were
significantly different at the 5% significant level. The length of the error bar is
influenced by the number of learners in the sample. Wider intervals occur with
fewer numbers of students and narrow intervals for schools with more
students.
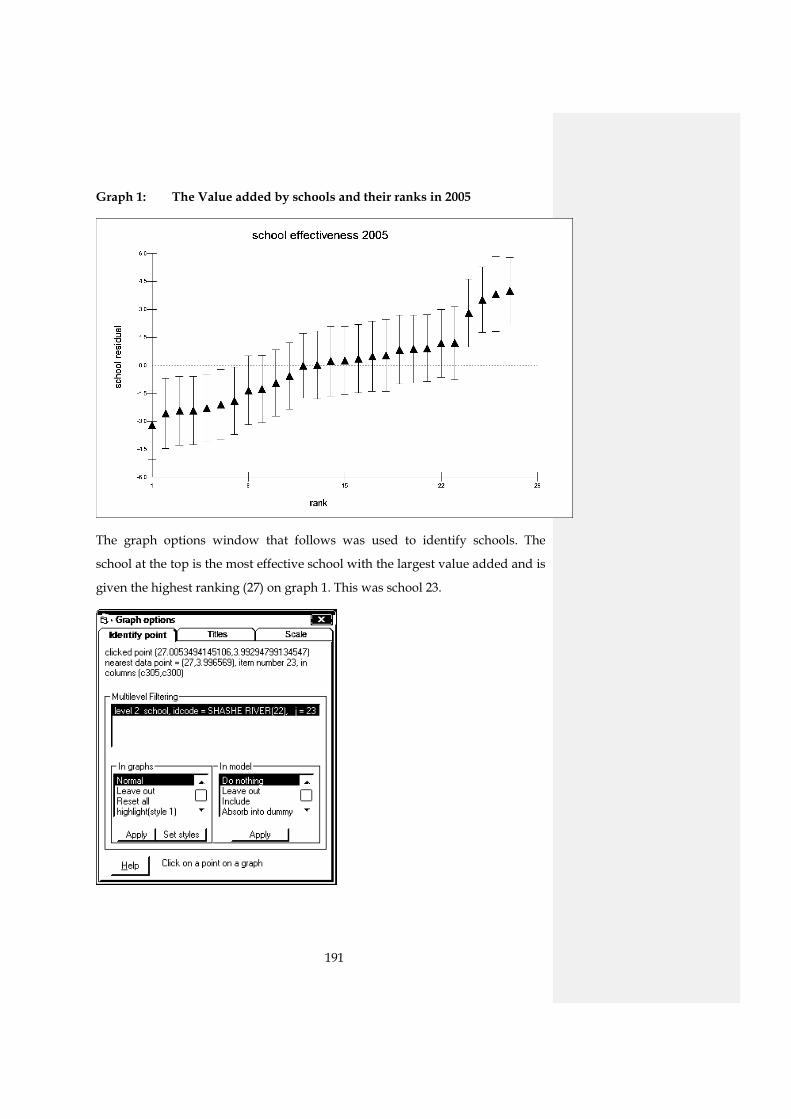
191
Graph 1: The Value added by schools and their ranks in 2005
The graph options window that follows was used to identify schools. The
school at the top is the most effective school with the largest value added and is
given the highest ranking (27) on graph 1. This was school 23.
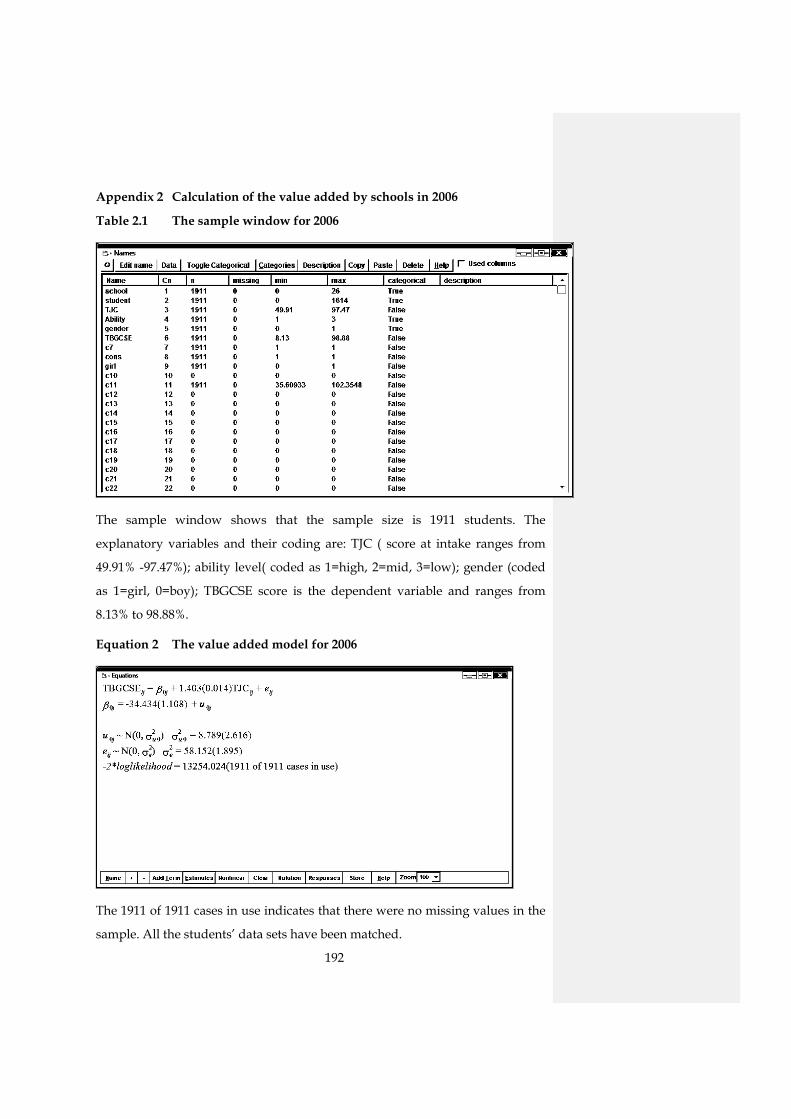
192
Appendix 2 Calculation of the value added by schools in 2006
Table 2.1 The sample window for 2006
The sample window shows that the sample size is 1911 students. The
explanatory variables and their coding are: TJC ( score at intake ranges from
49.91% -97.47%); ability level( coded as 1=high, 2=mid, 3=low); gender (coded
as 1=girl, 0=boy); TBGCSE score is the dependent variable and ranges from
8.13% to 98.88%.
Equation 2 The value added model for 2006
The 1911 of 1911 cases in use indicates that there were no missing values in the
sample. All the students’ data sets have been matched.
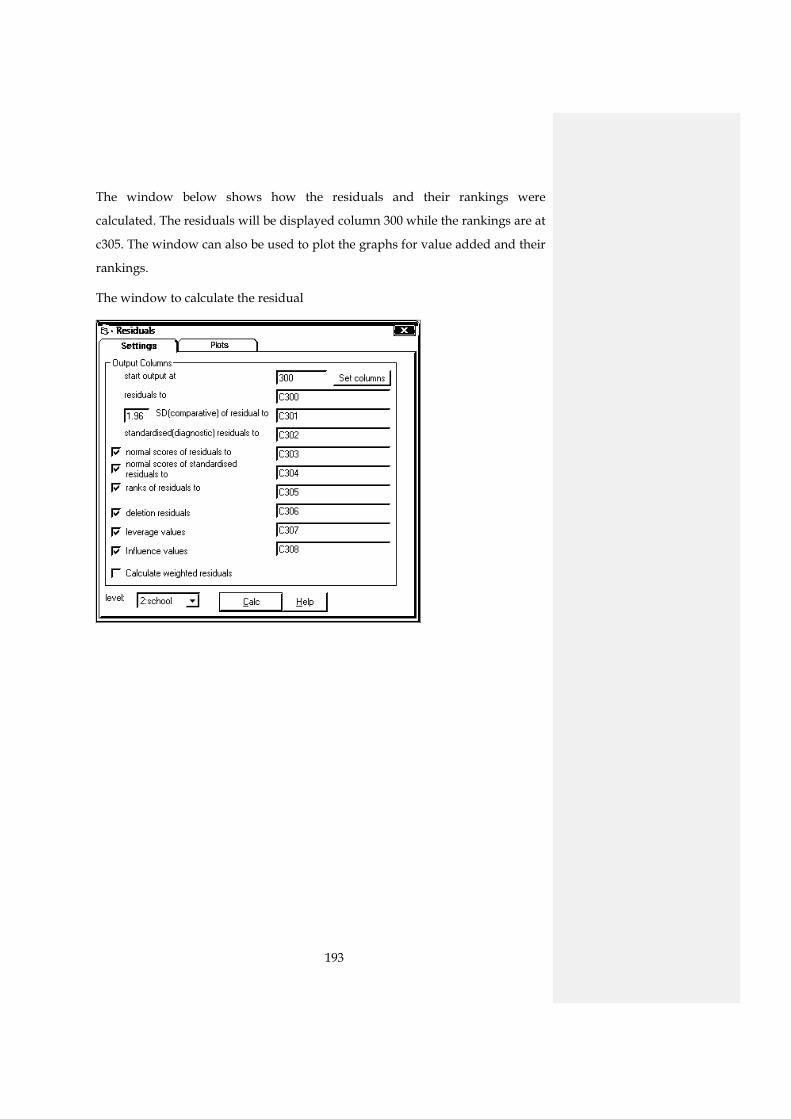
193
The window below shows how the residuals and their rankings were
calculated. The residuals will be displayed column 300 while the rankings are at
c305. The window can also be used to plot the graphs for value added and their
rankings.
The window to calculate the residual
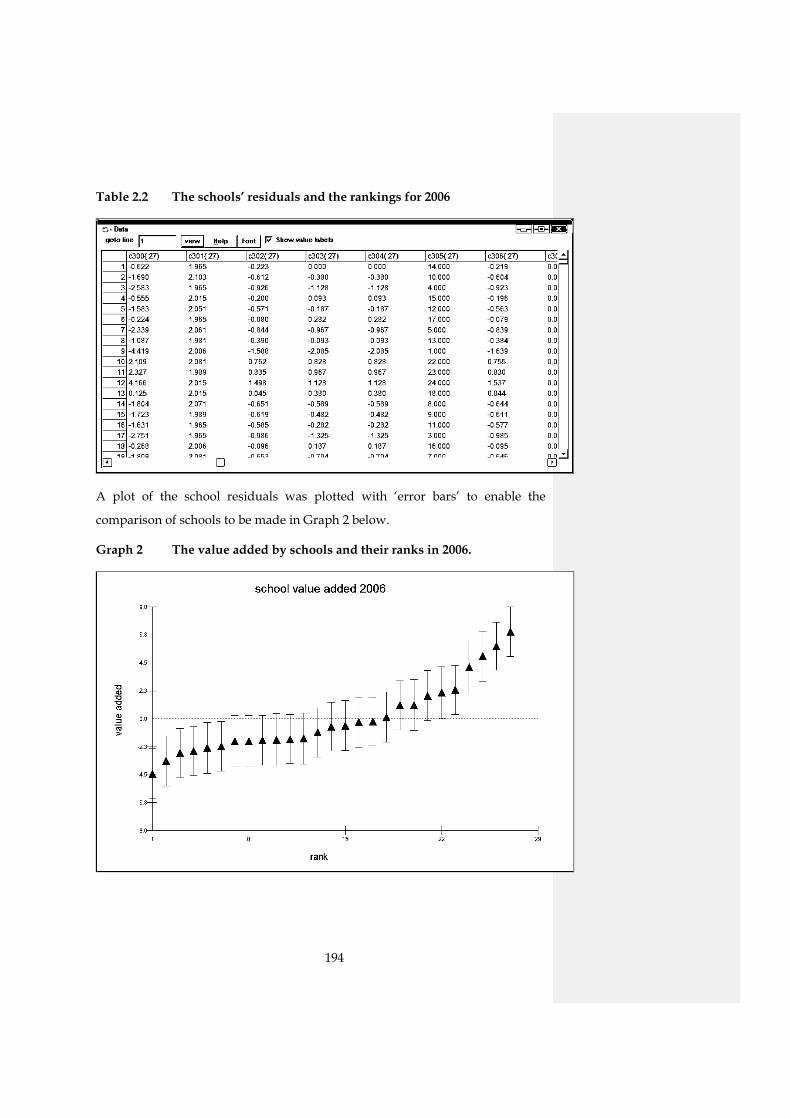
194
Table 2.2 The schools’ residuals and the rankings for 2006
A plot of the school residuals was plotted with ‘error bars’ to enable the
comparison of schools to be made in Graph 2 below.
Graph 2 The value added by schools and their ranks in 2006.
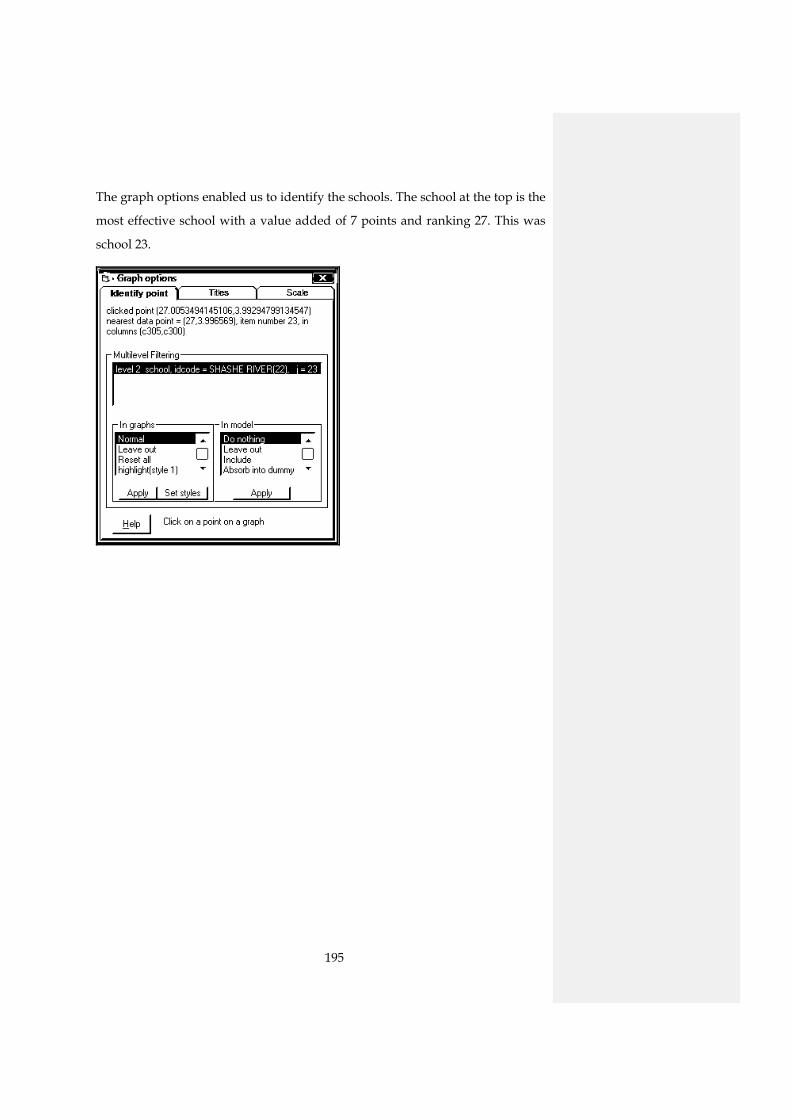
195
The graph options enabled us to identify the schools. The school at the top is the
most effective school with a value added of 7 points and ranking 27. This was
school 23.
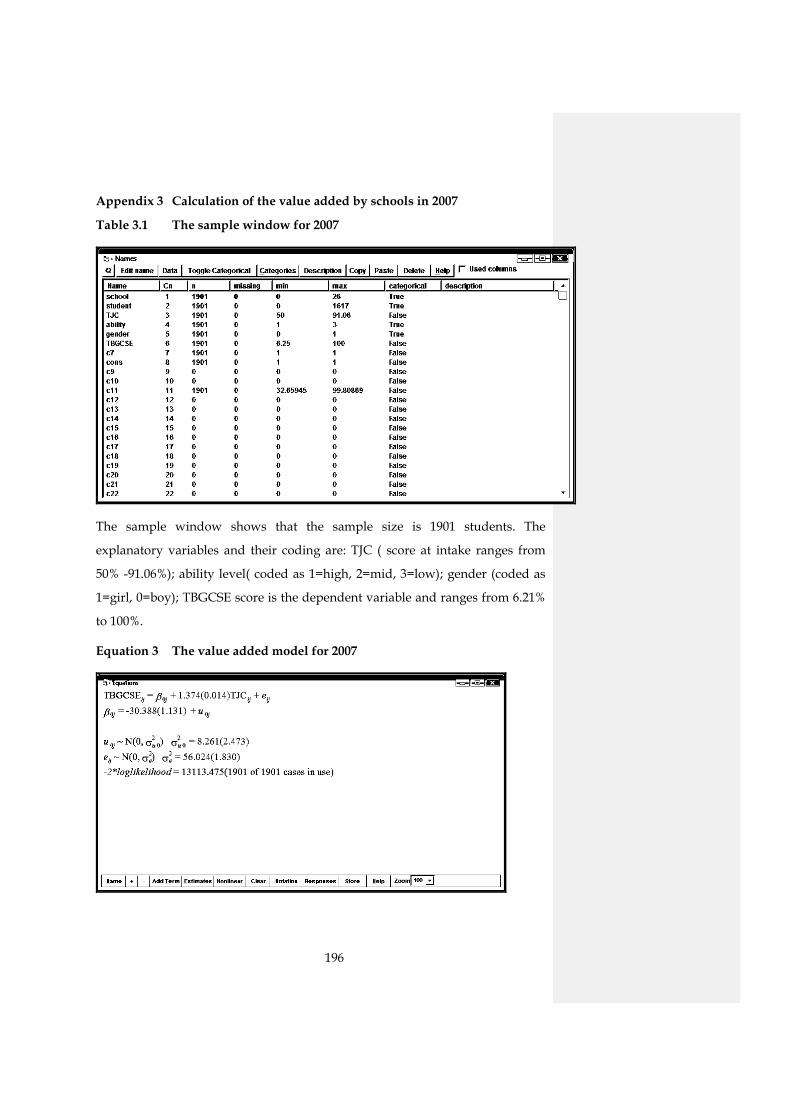
196
Appendix 3 Calculation of the value added by schools in 2007
Table 3.1 The sample window for 2007
The sample window shows that the sample size is 1901 students. The
explanatory variables and their coding are: TJC ( score at intake ranges from
50% -91.06%); ability level( coded as 1=high, 2=mid, 3=low); gender (coded as
1=girl, 0=boy); TBGCSE score is the dependent variable and ranges from 6.21%
to 100%.
Equation 3 The value added model for 2007
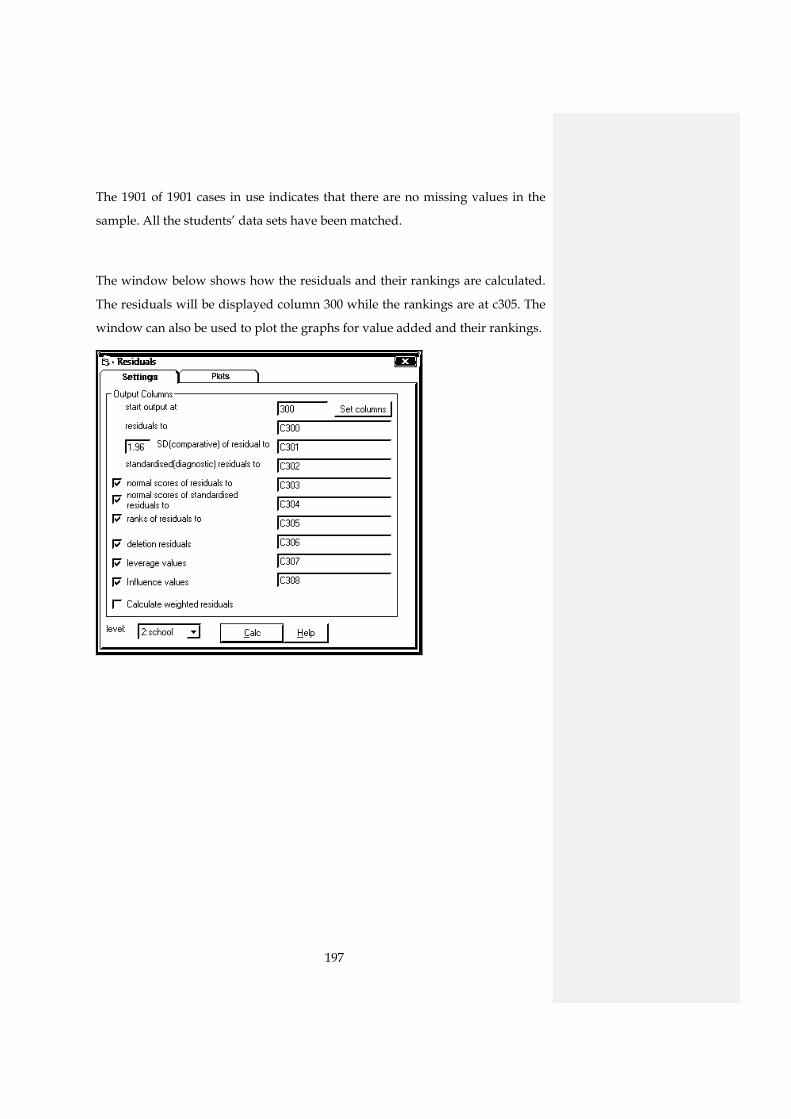
197
The 1901 of 1901 cases in use indicates that there are no missing values in the
sample. All the students’ data sets have been matched.
The window below shows how the residuals and their rankings are calculated.
The residuals will be displayed column 300 while the rankings are at c305. The
window can also be used to plot the graphs for value added and their rankings.
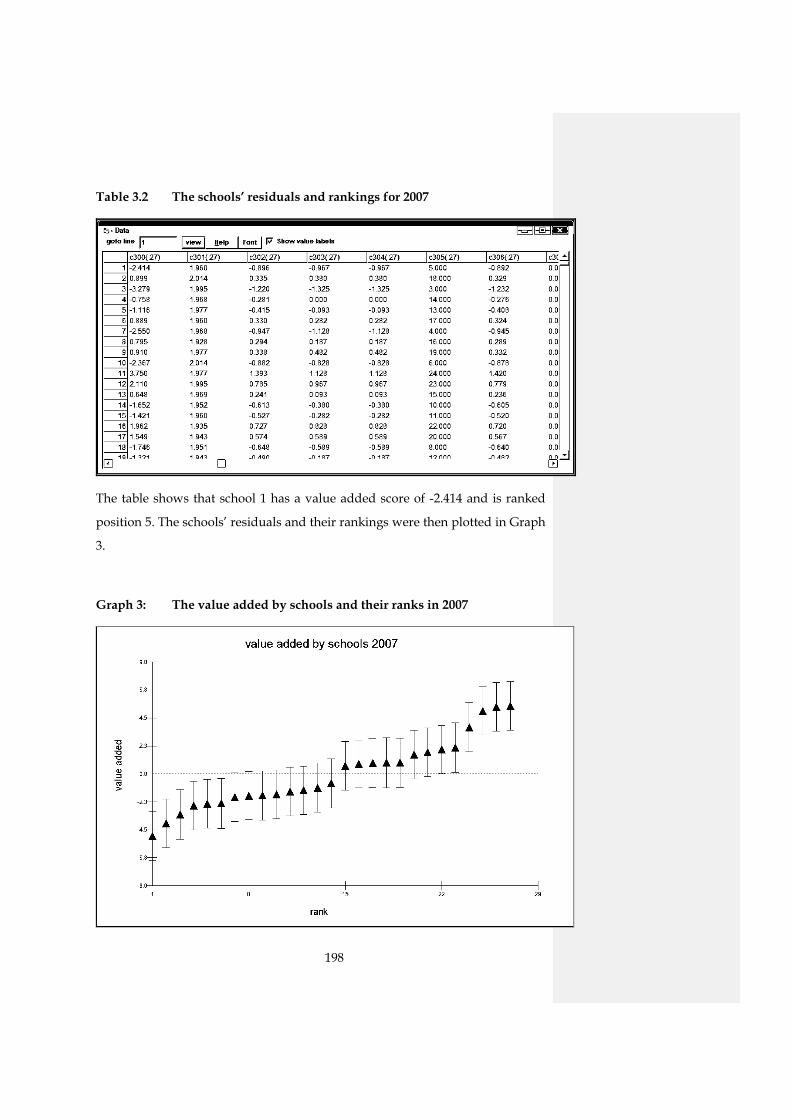
198
Table 3.2 The schools’ residuals and rankings for 2007
The table shows that school 1 has a value added score of -2.414 and is ranked
position 5. The schools’ residuals and their rankings were then plotted in Graph
3.
Graph 3: The value added by schools and their ranks in 2007
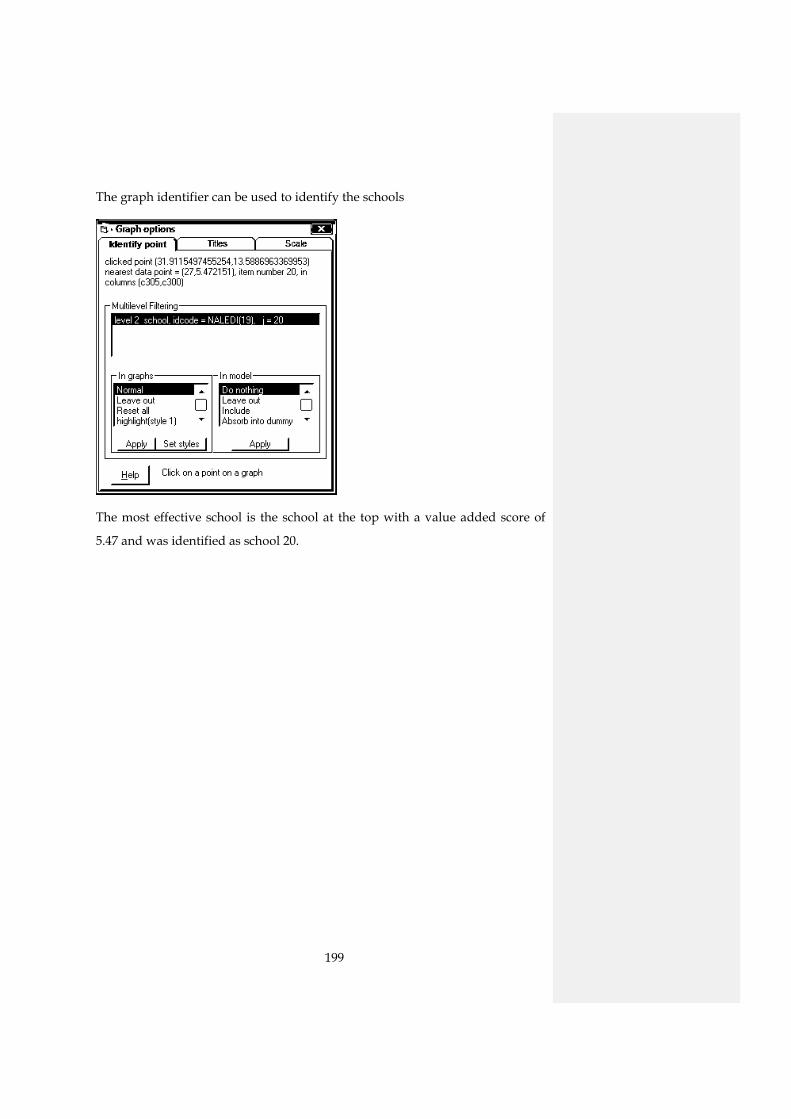
199
The graph identifier can be used to identify the schools
The most effective school is the school at the top with a value added score of
5.47 and was identified as school 20.
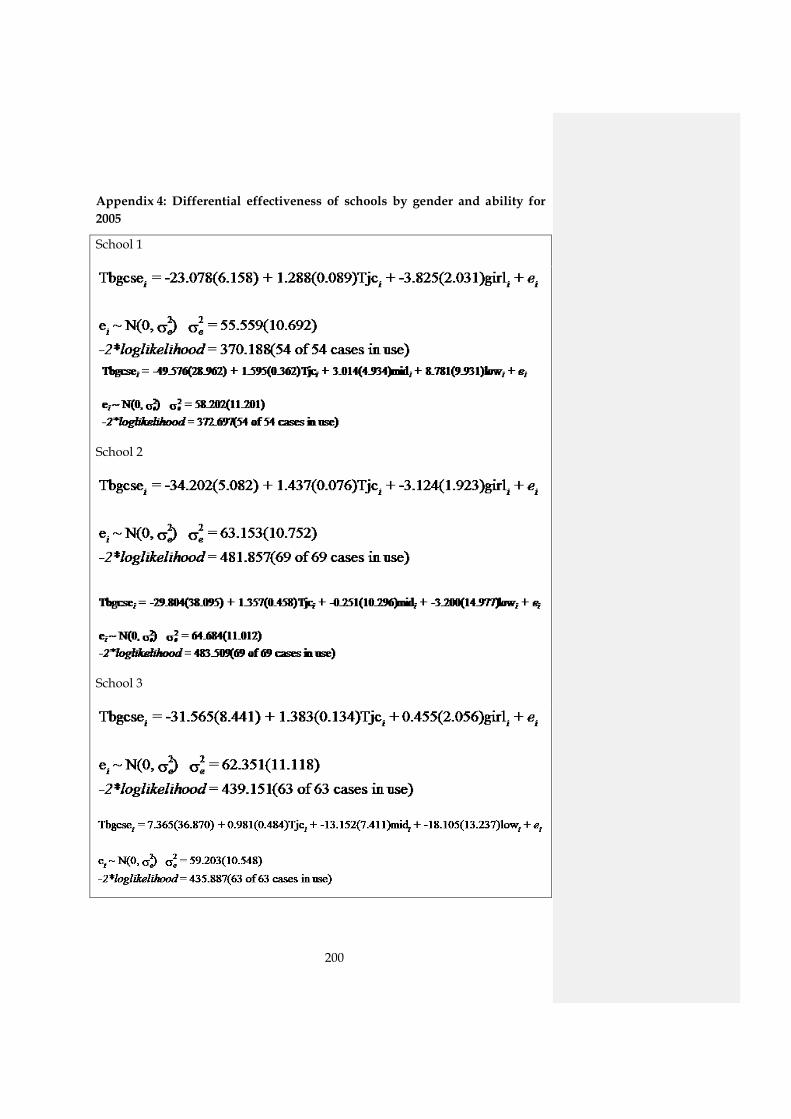
200
Appendix 4: Differential effectiveness of schools by gender and ability for 2005
School 1
School 2
School 3
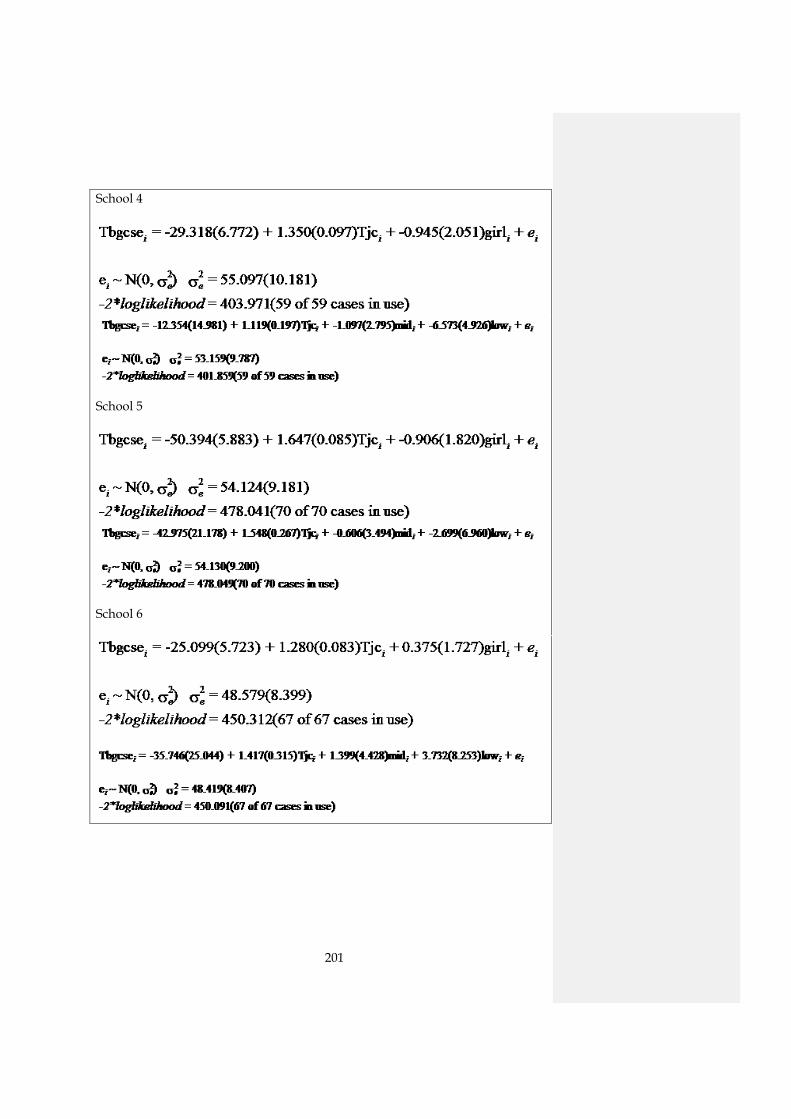
201
School 4
School 5
School 6
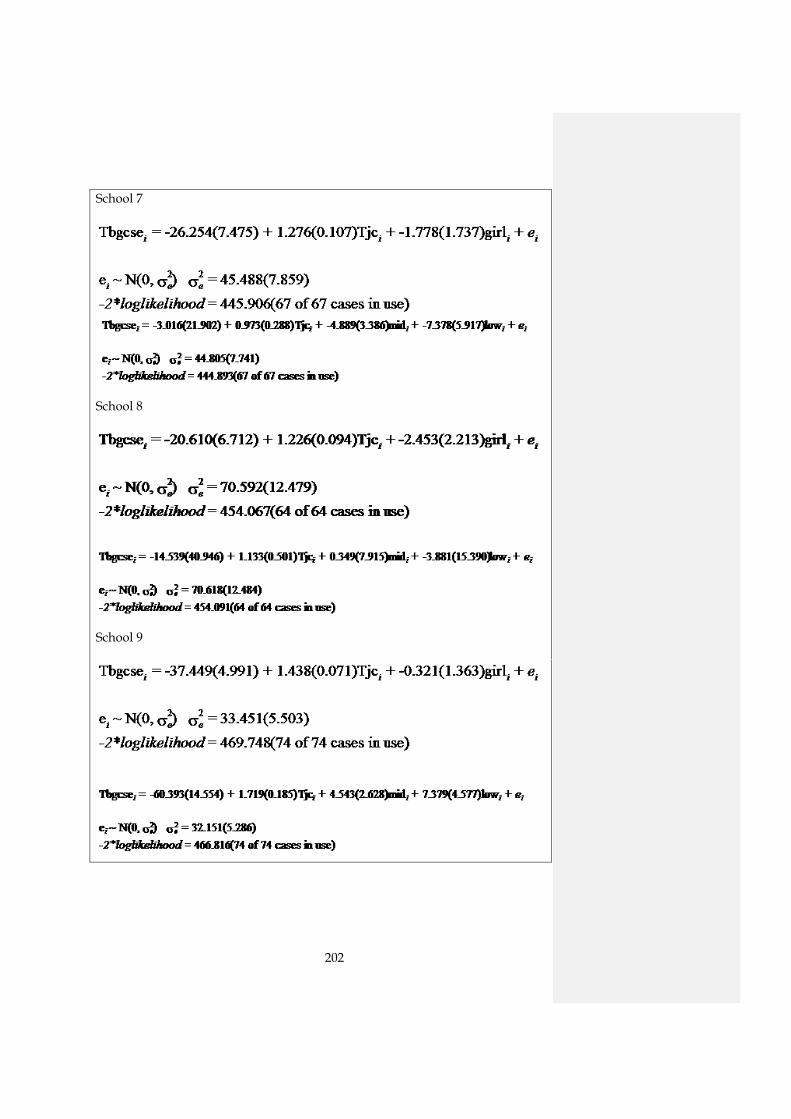
202
School 7
School 8
School 9
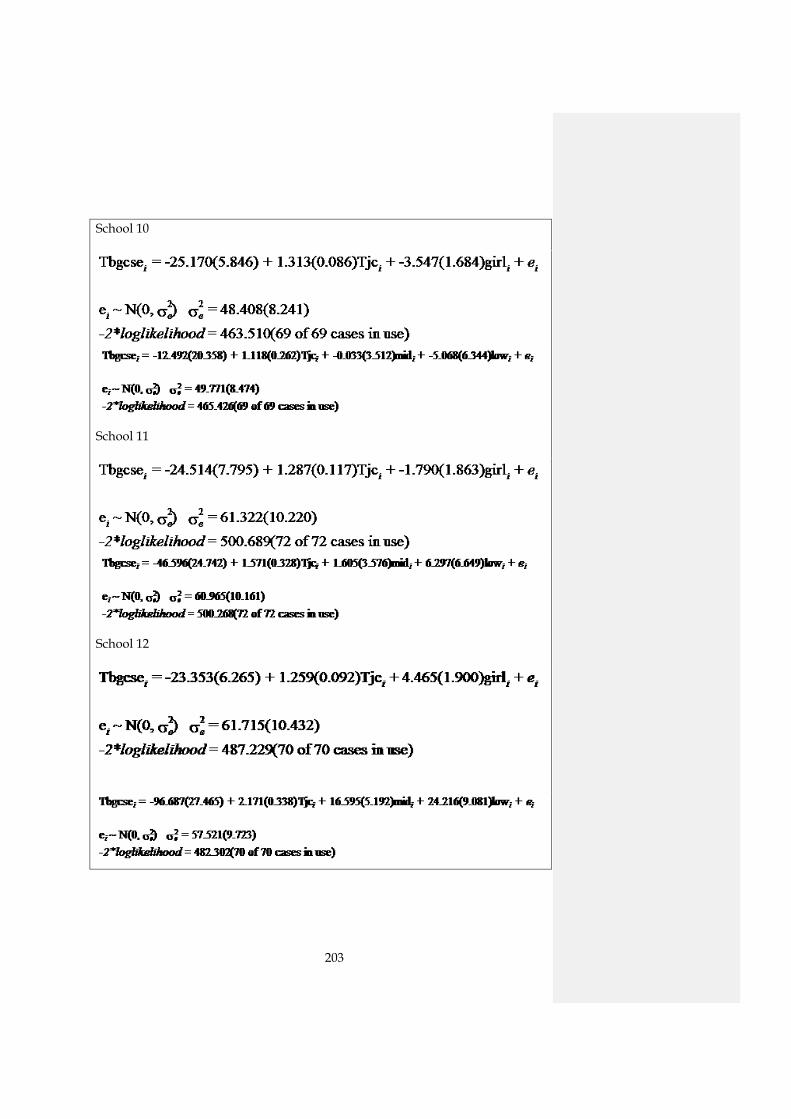
203
School 10
School 11
School 12
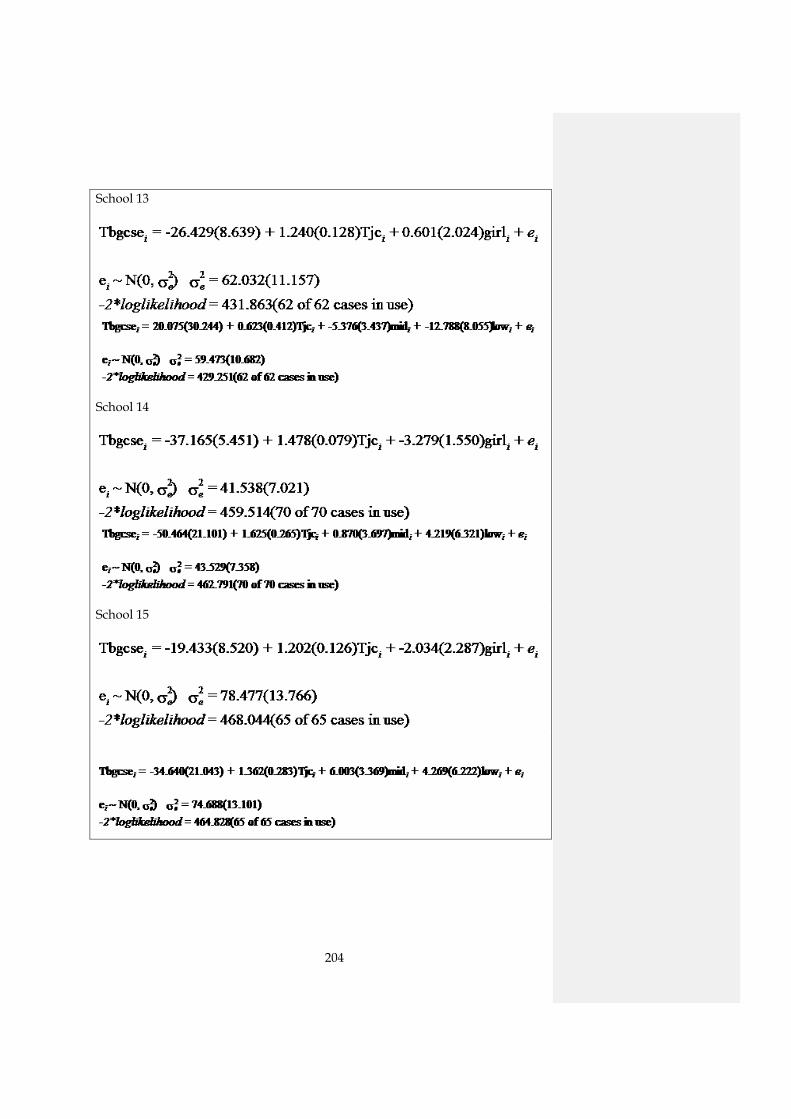
204
School 13
School 14
School 15
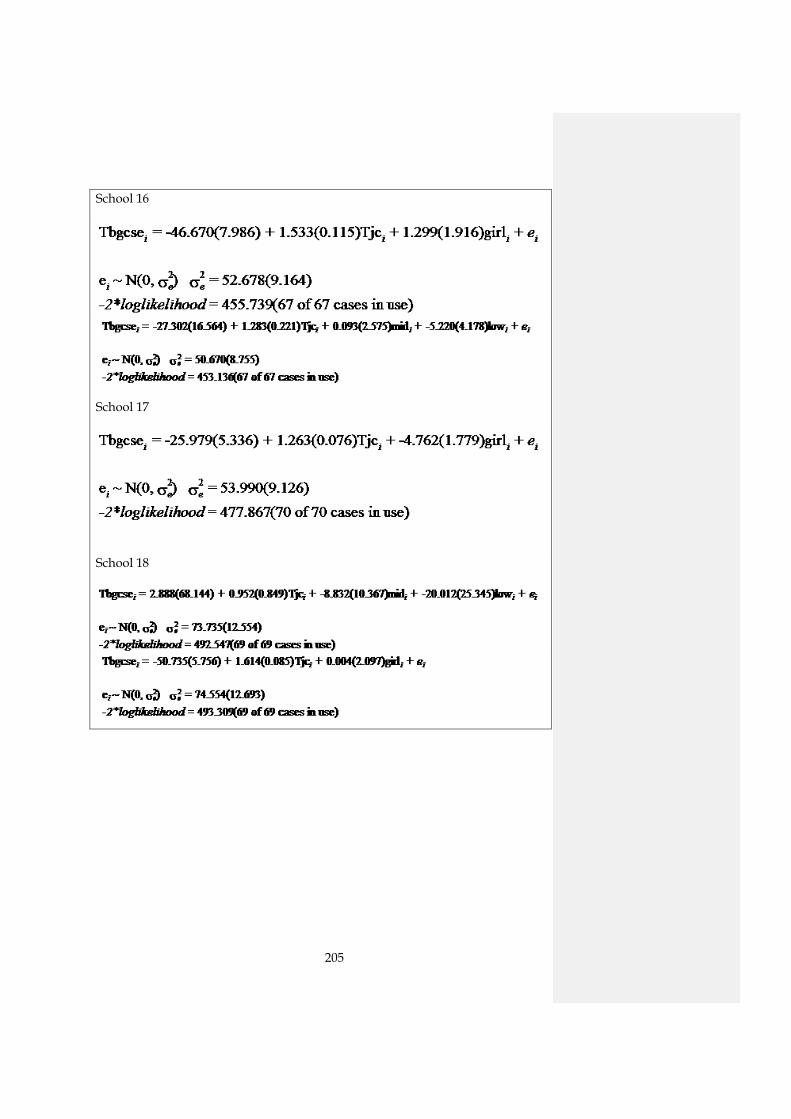
205
School 16
School 17
School 18
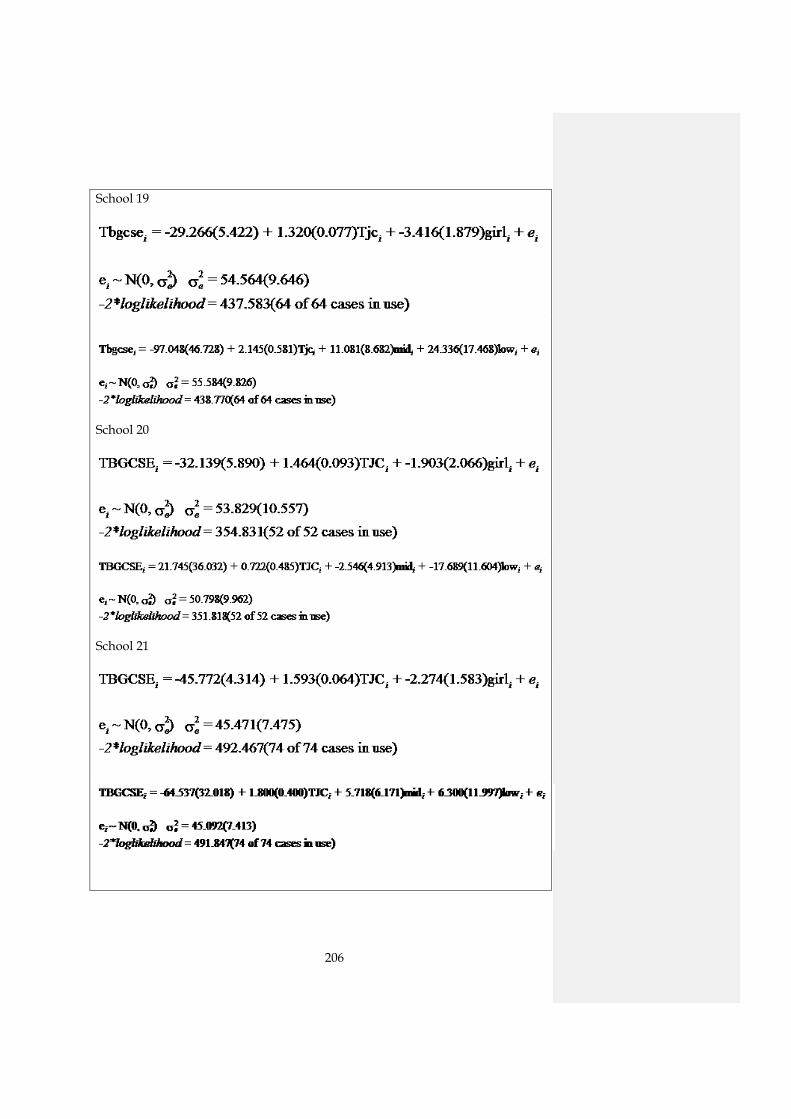
206
School 19
School 20
School 21
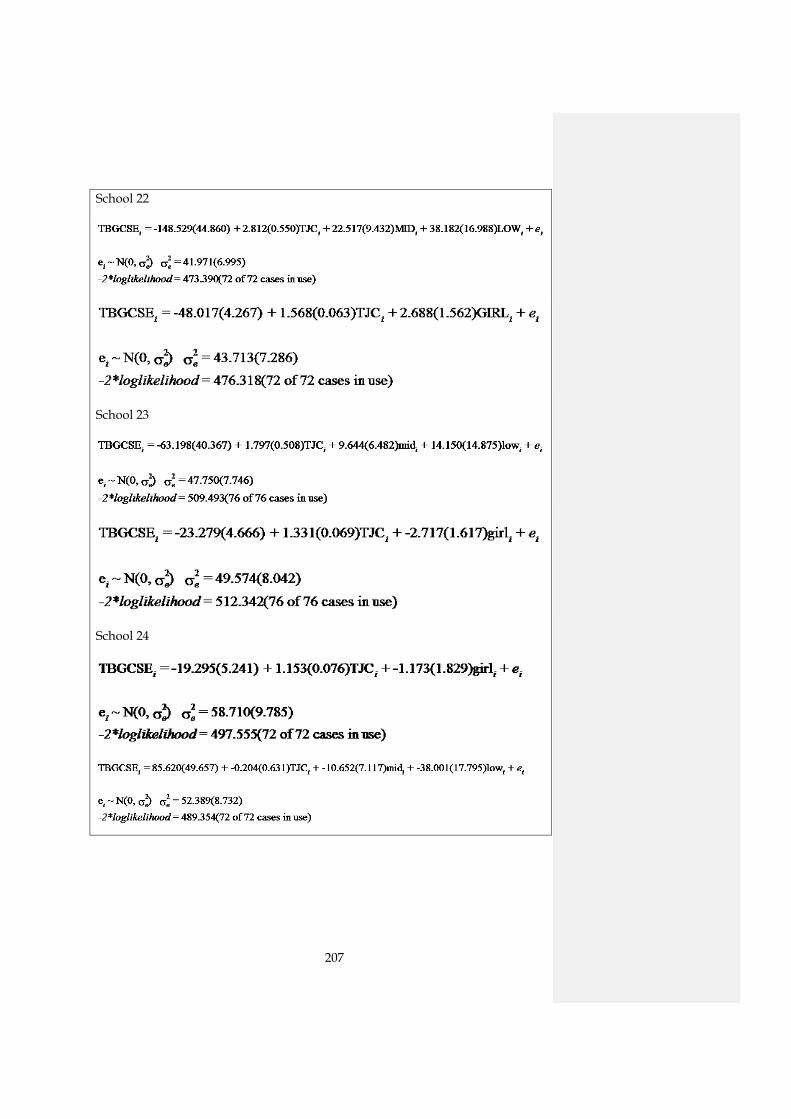
207
School 22
School 23
School 24
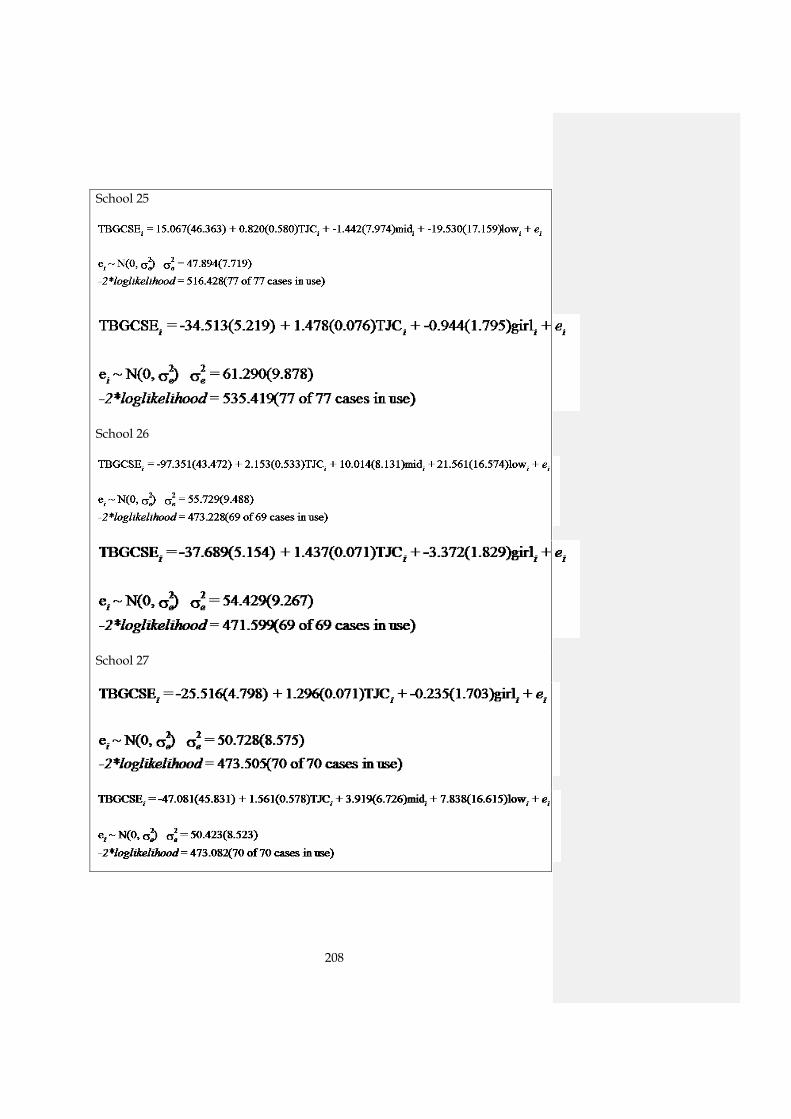
208
School 25
School 26
School 27
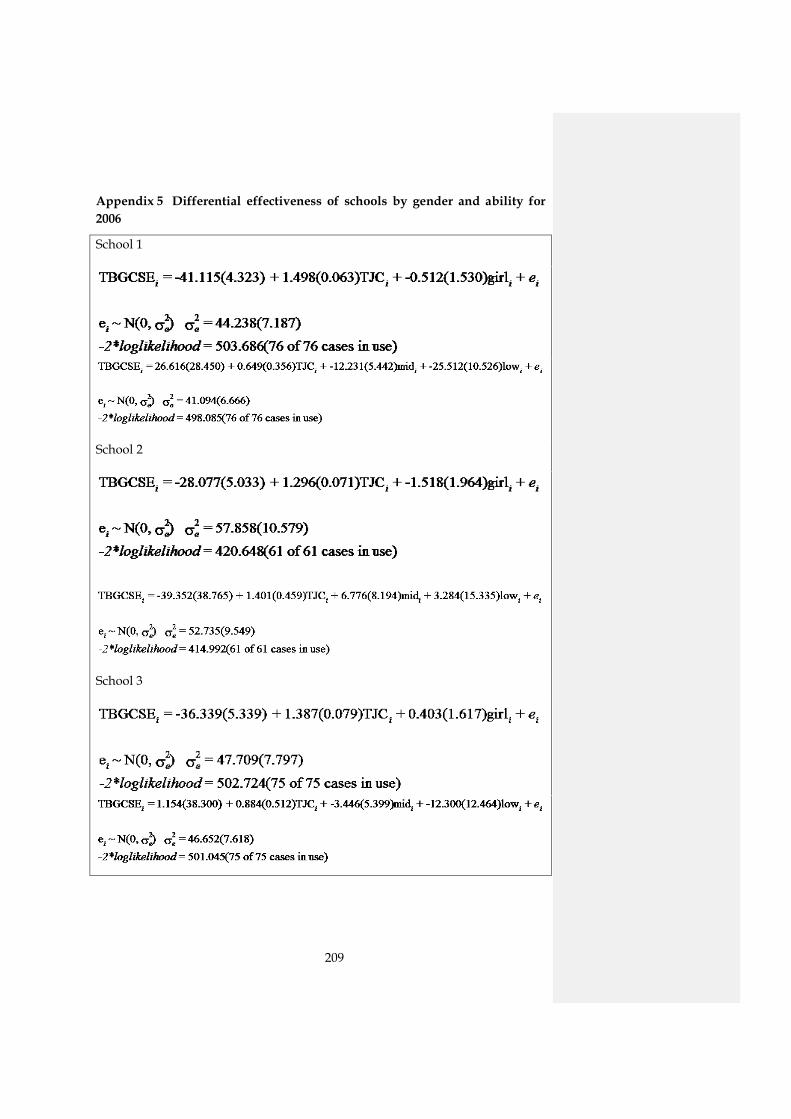
209
Appendix 5 Differential effectiveness of schools by gender and ability for 2006
School 1
School 2
School 3
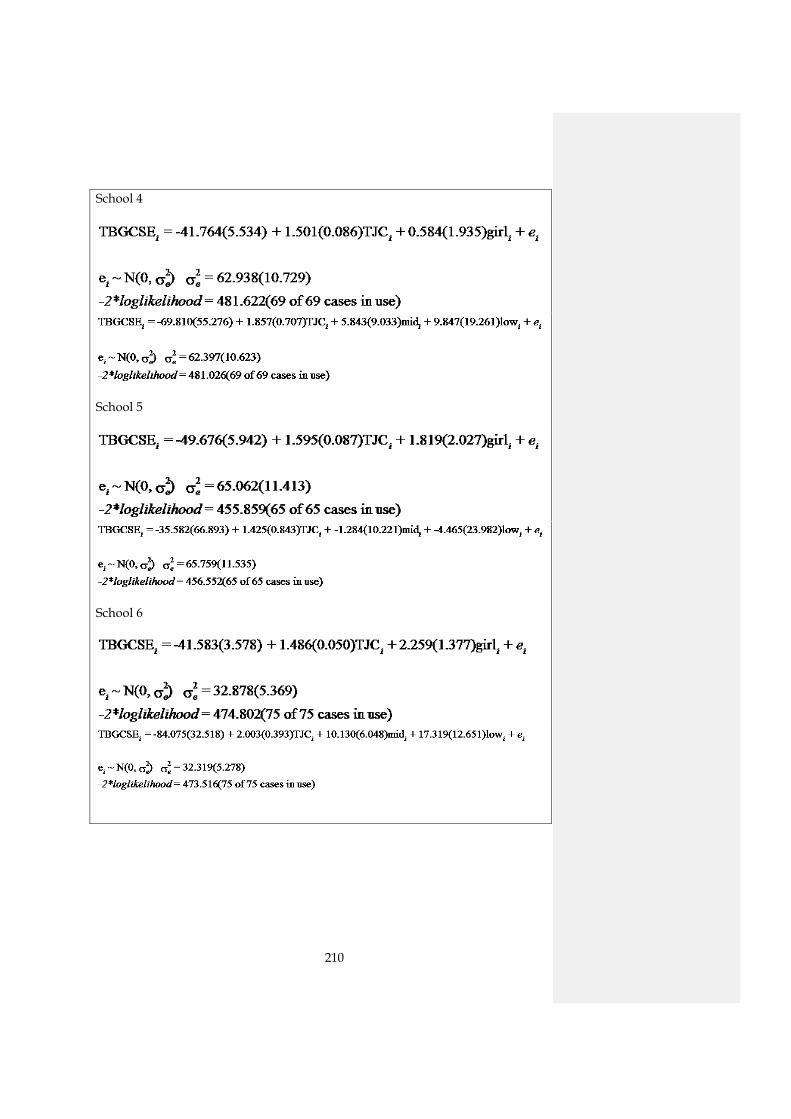
210
School 4
School 5
School 6

211
School 7
School 8
School 9

212
School 10
School 11
School 12

213
School 13
School 14
School 15
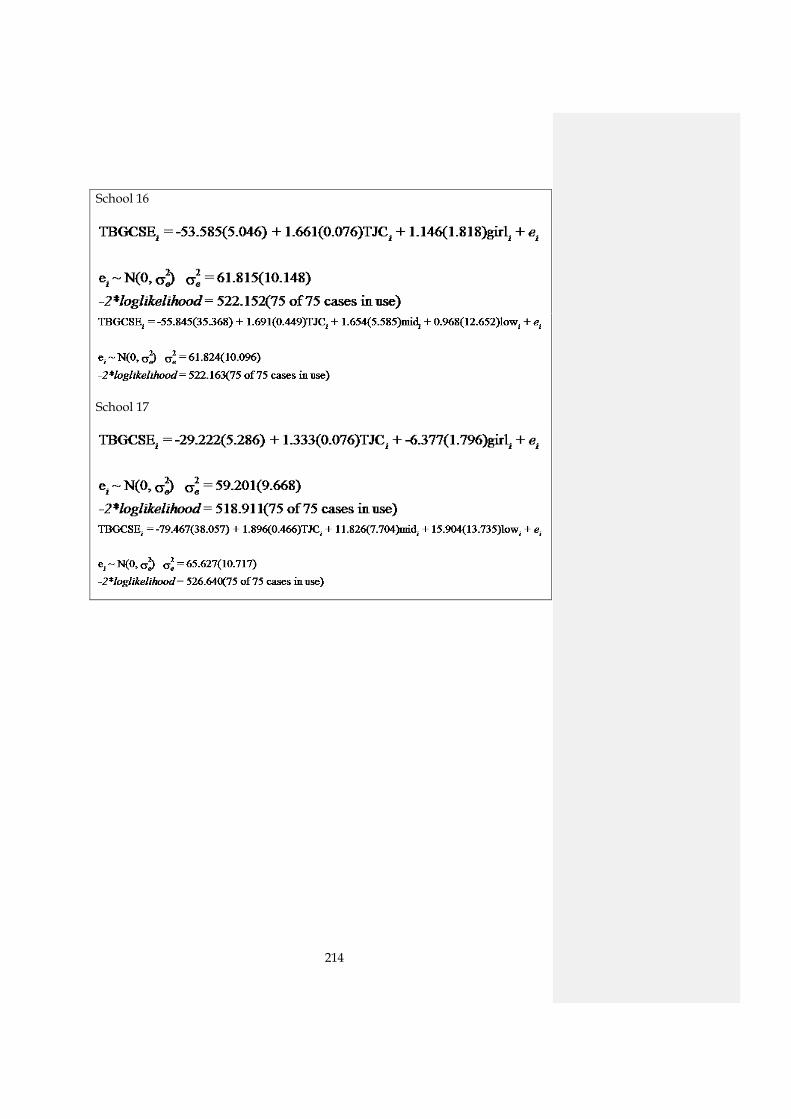
214
School 16
School 17
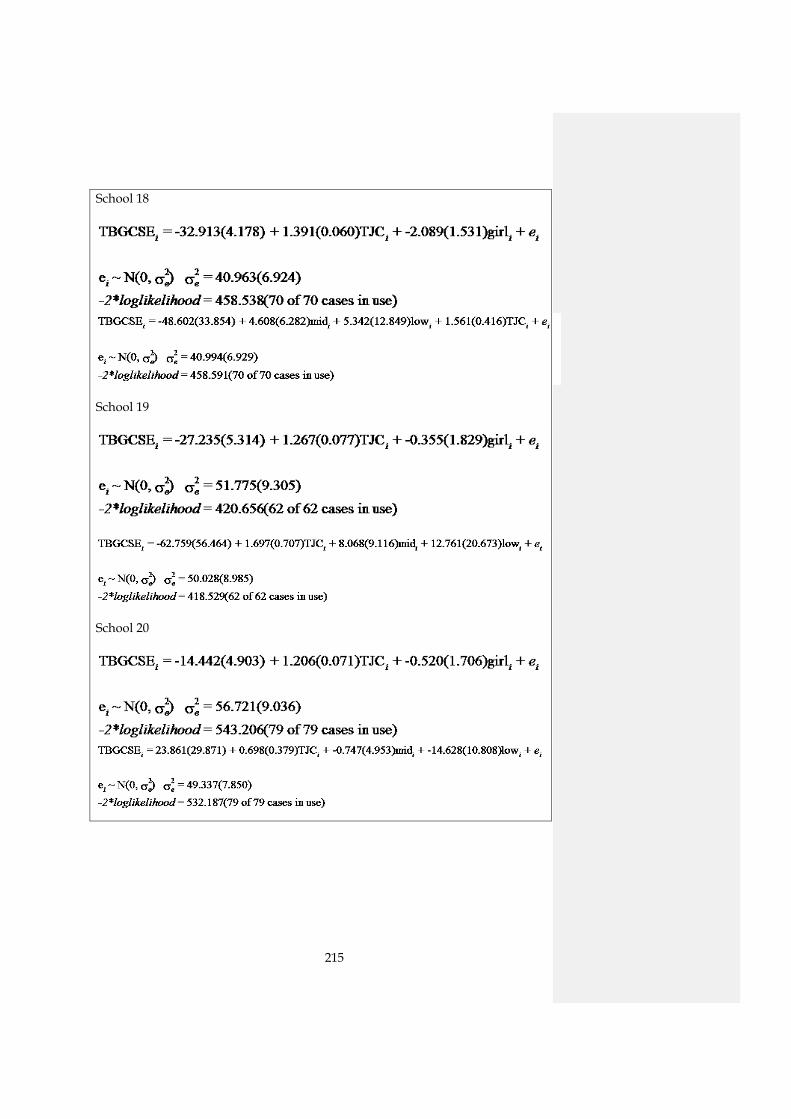
215
School 18
School 19
School 20
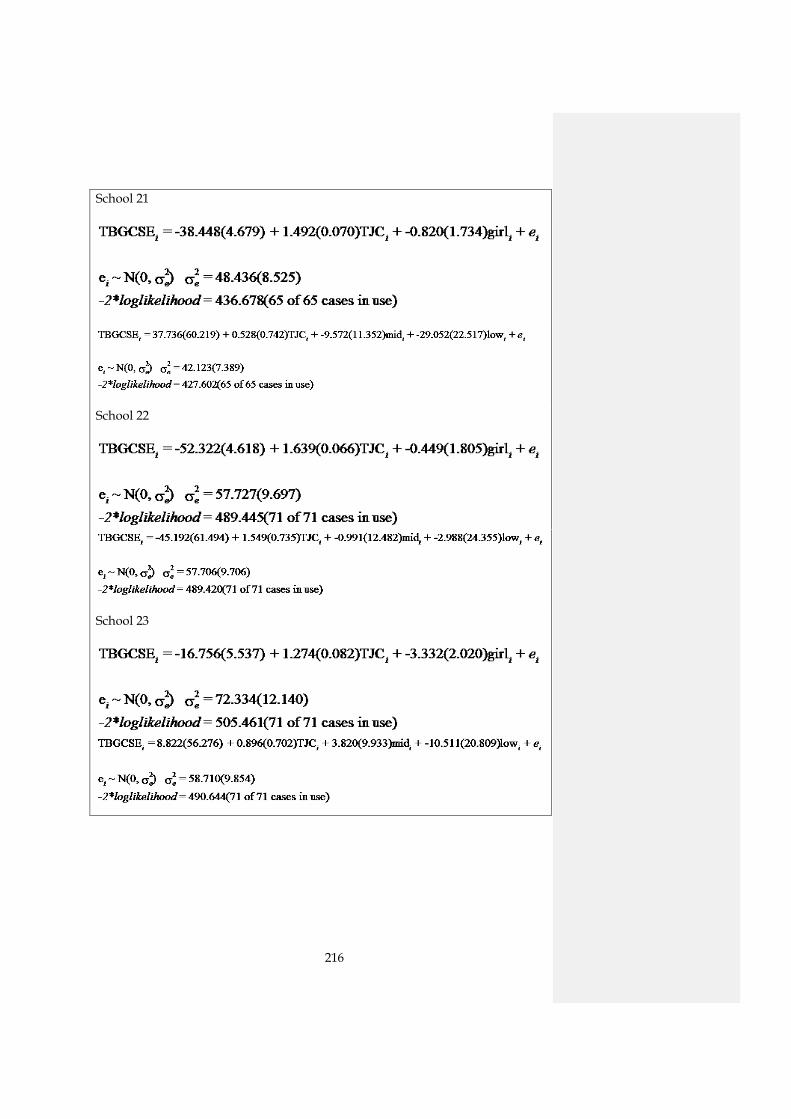
216
School 21
School 22
School 23
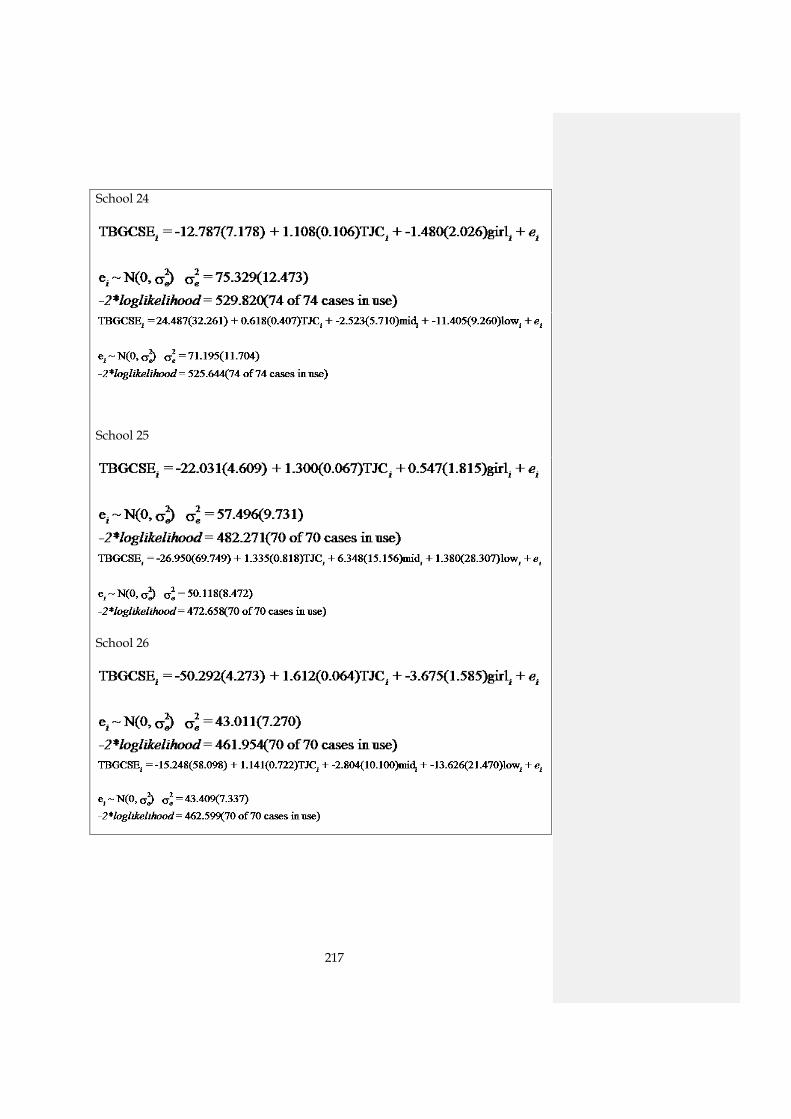
217
School 24
School 25
School 26
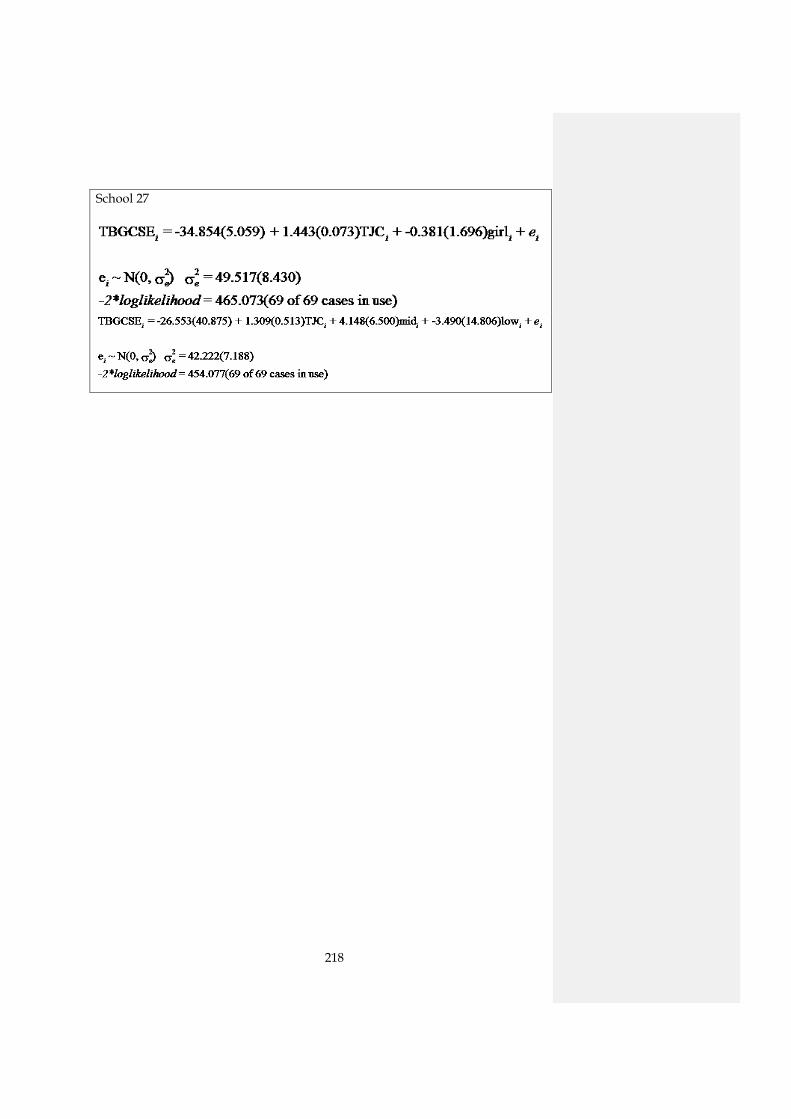
218
School 27
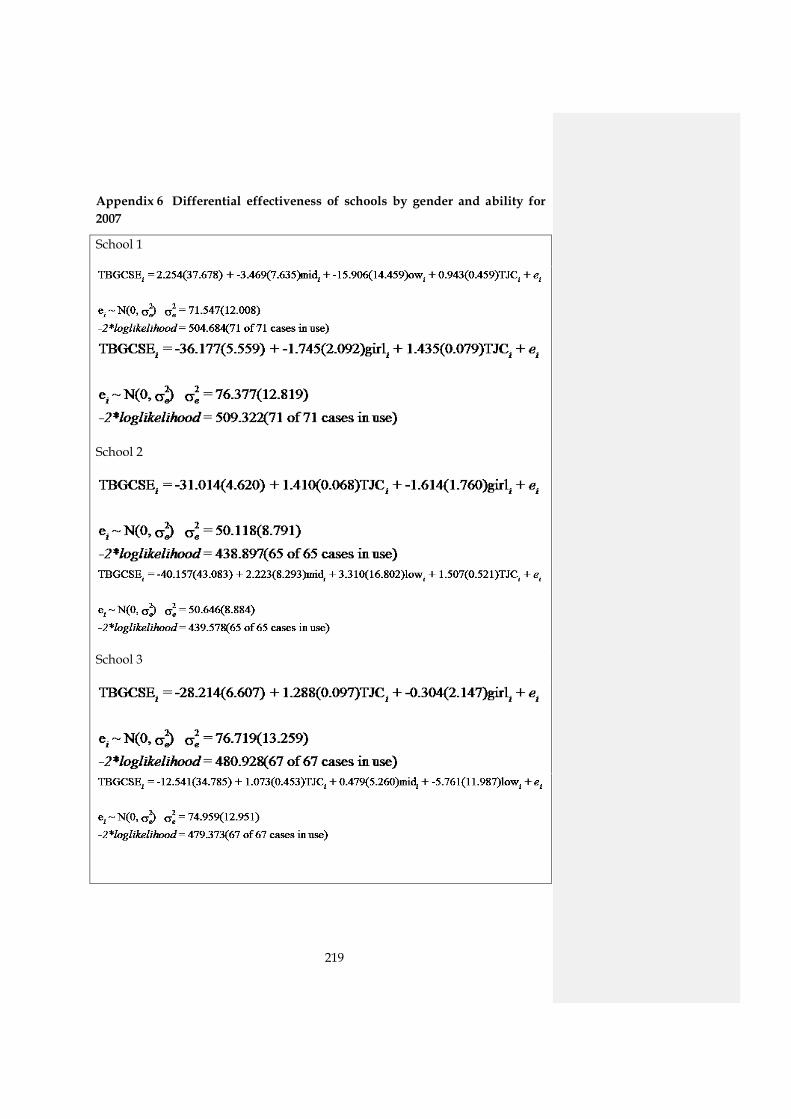
219
Appendix 6 Differential effectiveness of schools by gender and ability for 2007
School 1
School 2
School 3
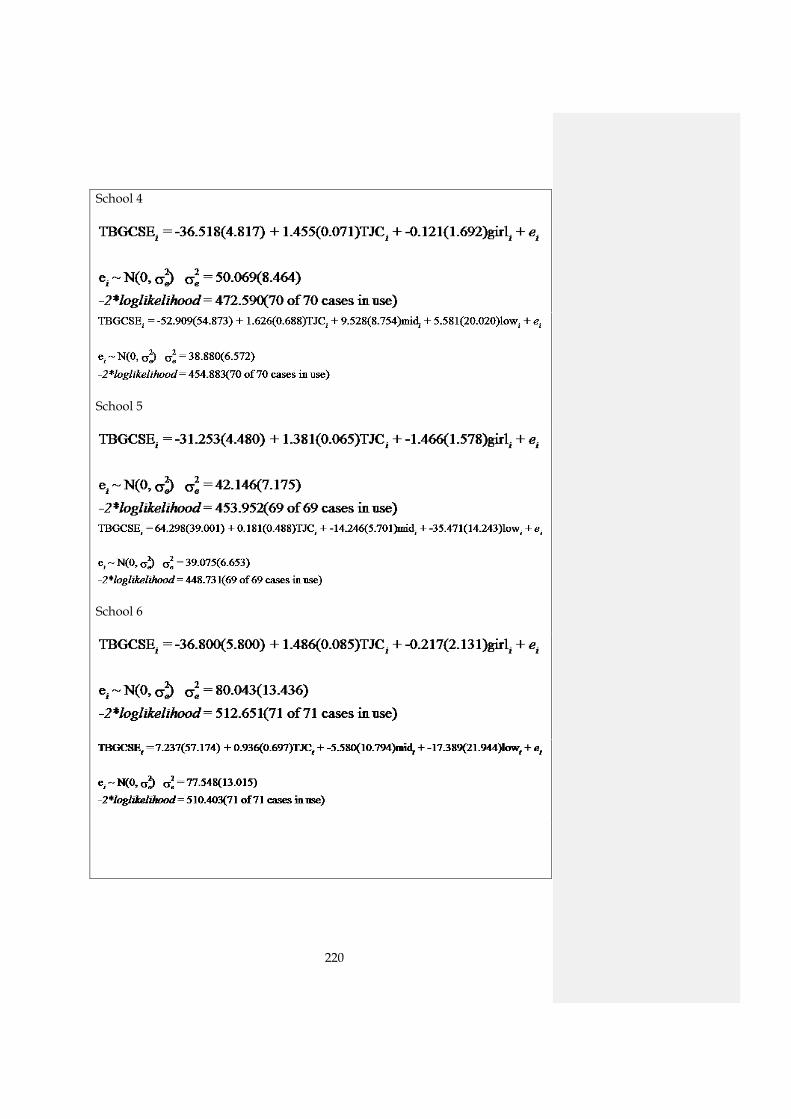
220
School 4
School 5
School 6
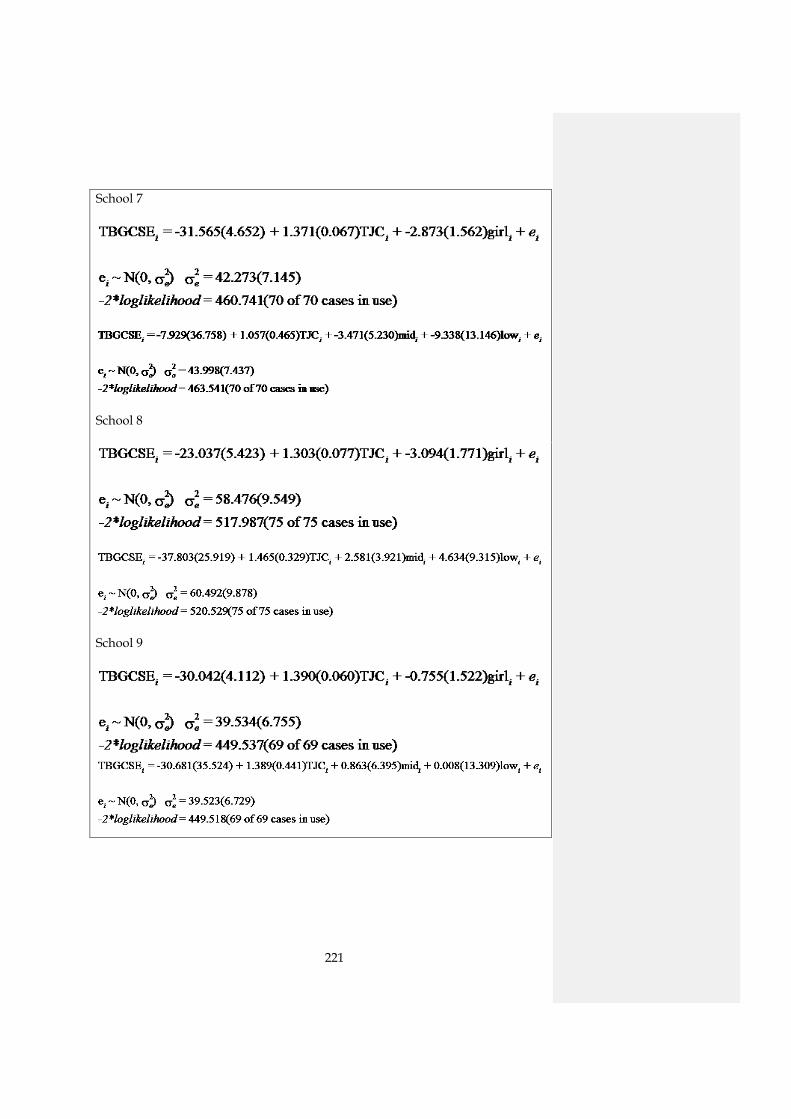
221
School 7
School 8
School 9

222
School 10
School 11
School 12

223
School 13
School 14
School 15
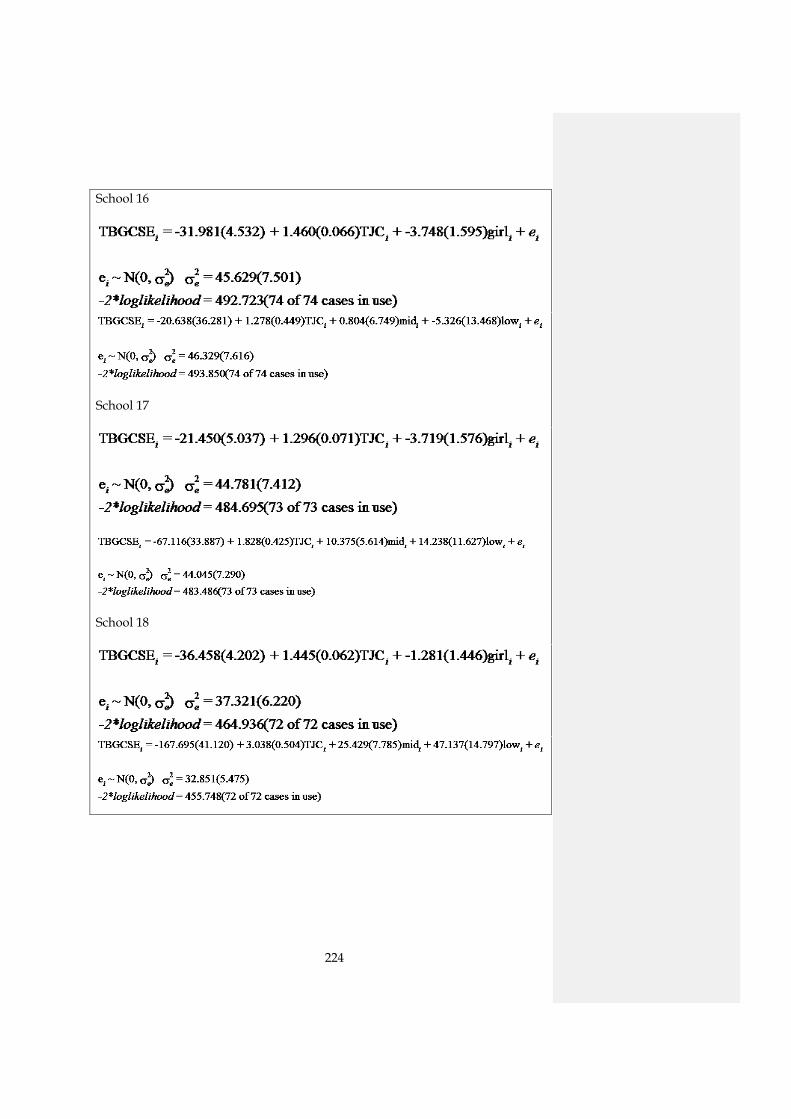
224
School 16
School 17
School 18

225
School 19
School 20
School 21

226
School 22
School 23
School 24
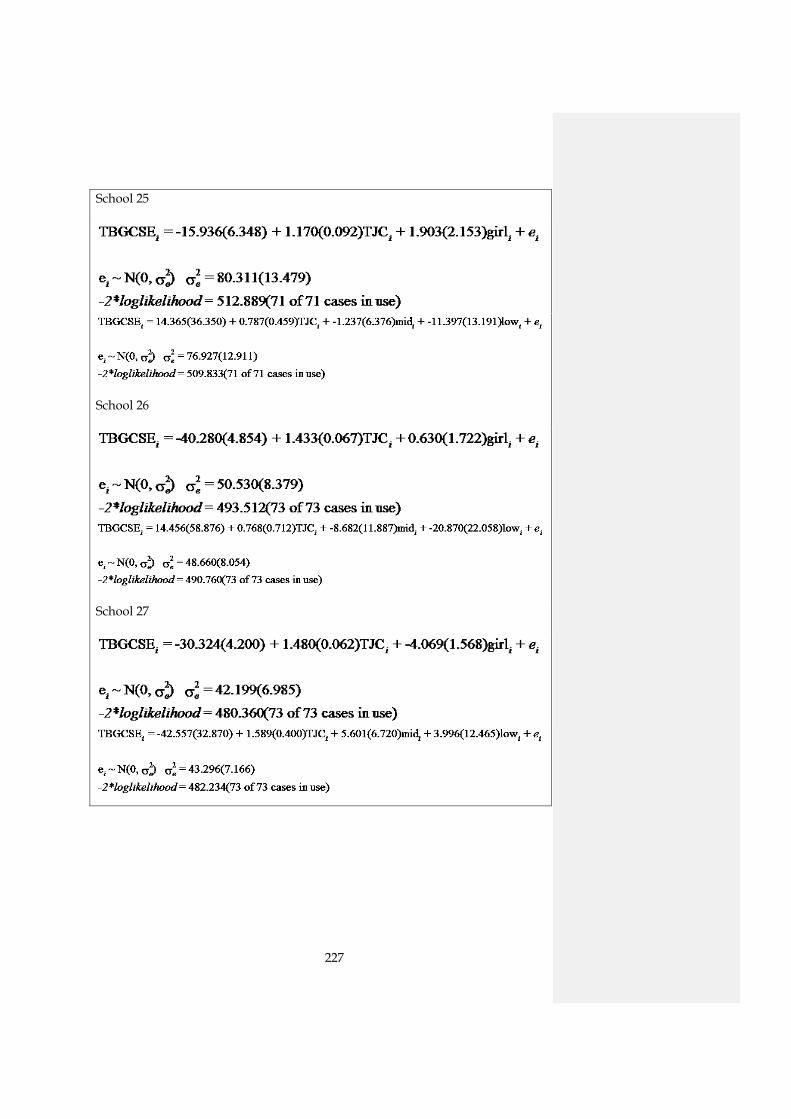
227
School 25
School 26
School 27
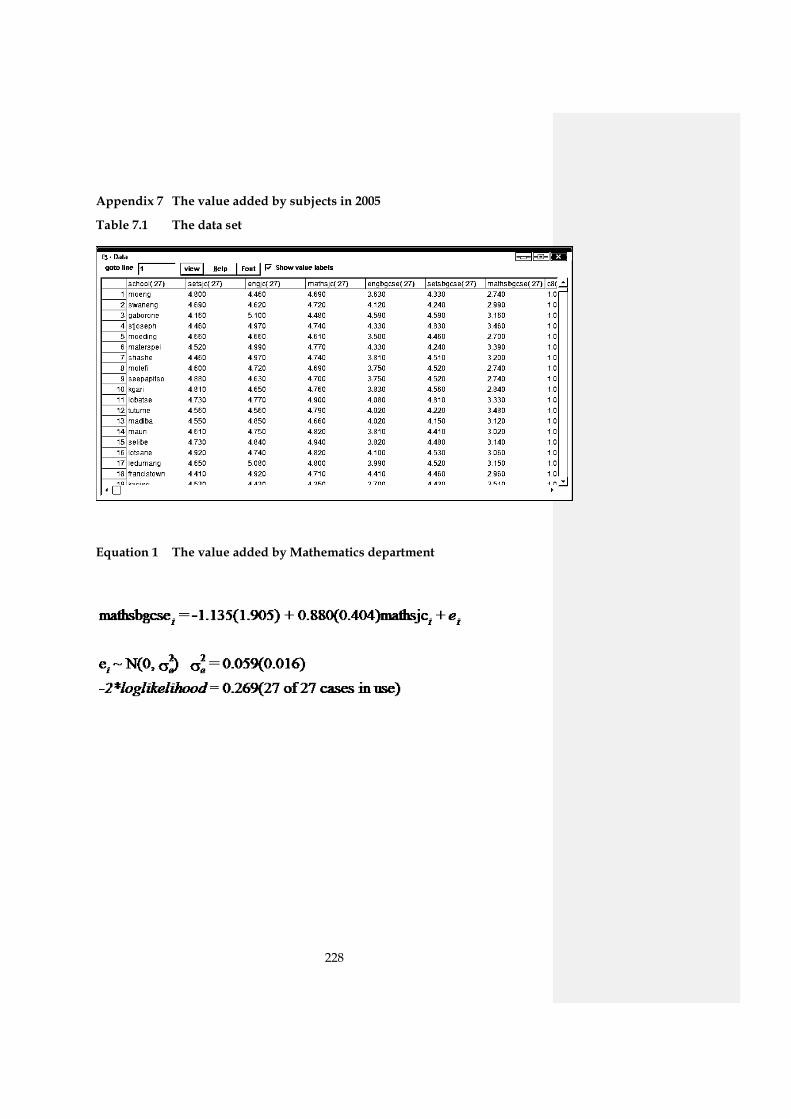
228
Appendix 7 The value added by subjects in 2005
Table 7.1 The data set
Equation 1 The value added by Mathematics department
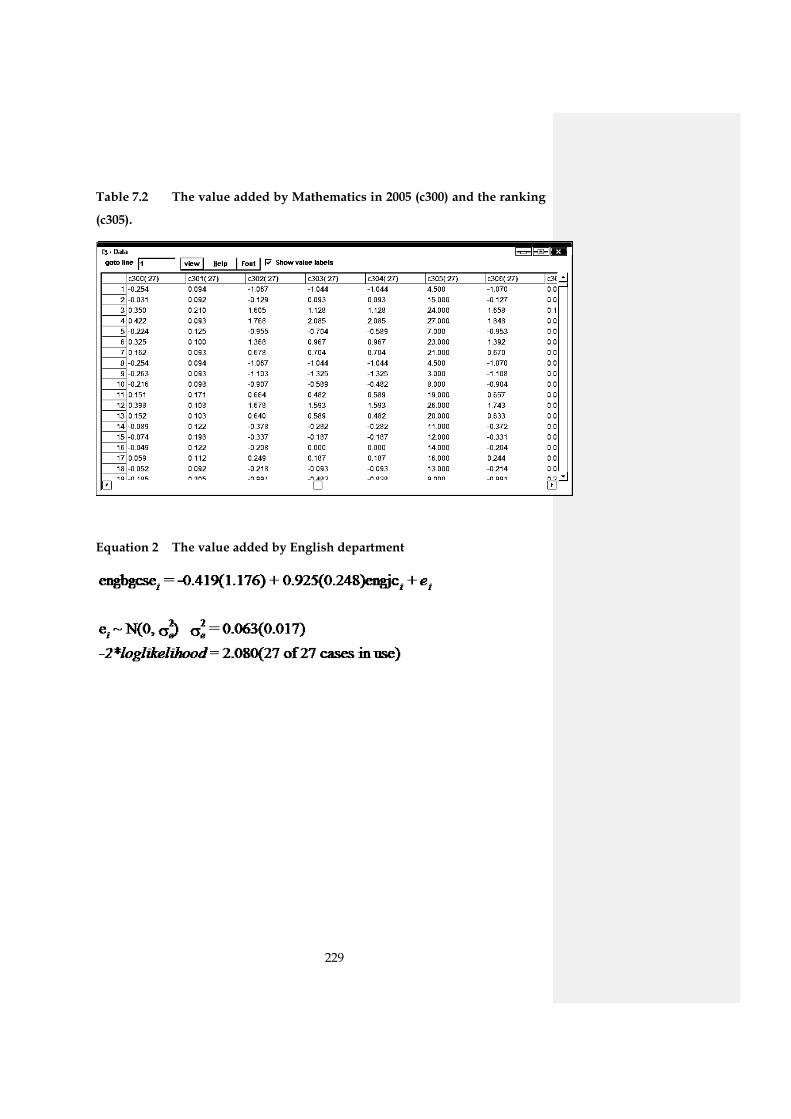
229
Table 7.2 The value added by Mathematics in 2005 (c300) and the ranking
(c305).
Equation 2 The value added by English department
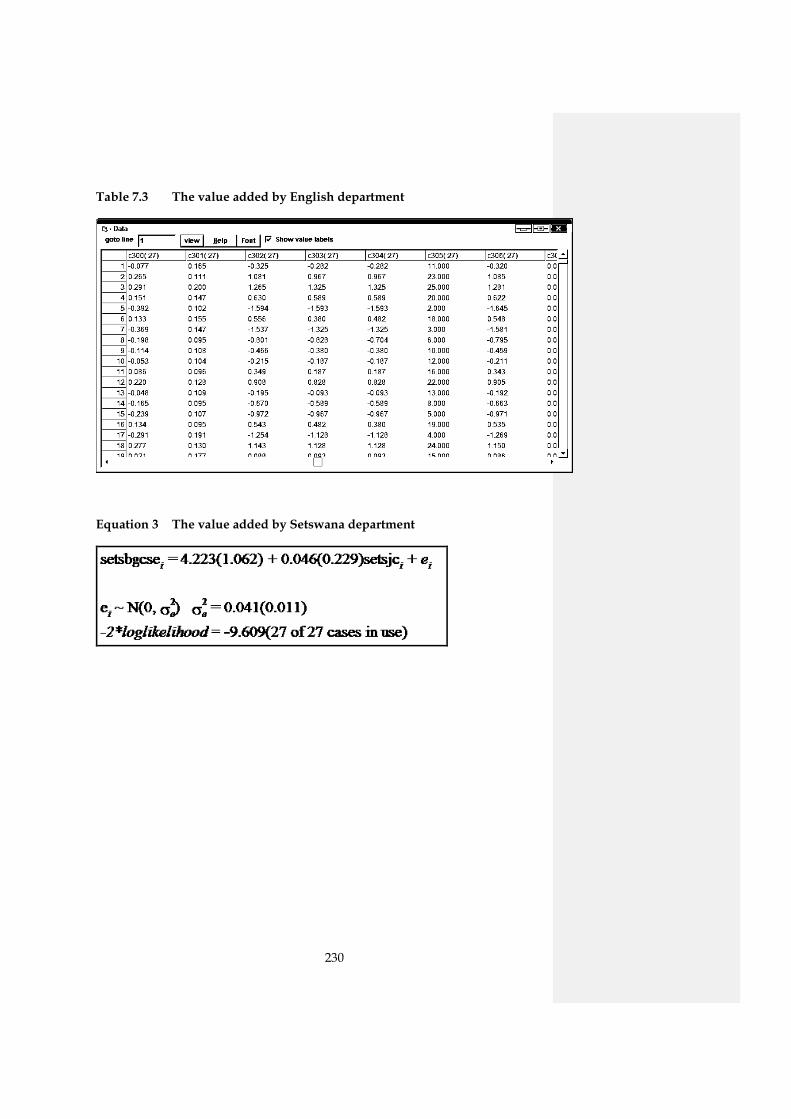
230
Table 7.3 The value added by English department
Equation 3 The value added by Setswana department
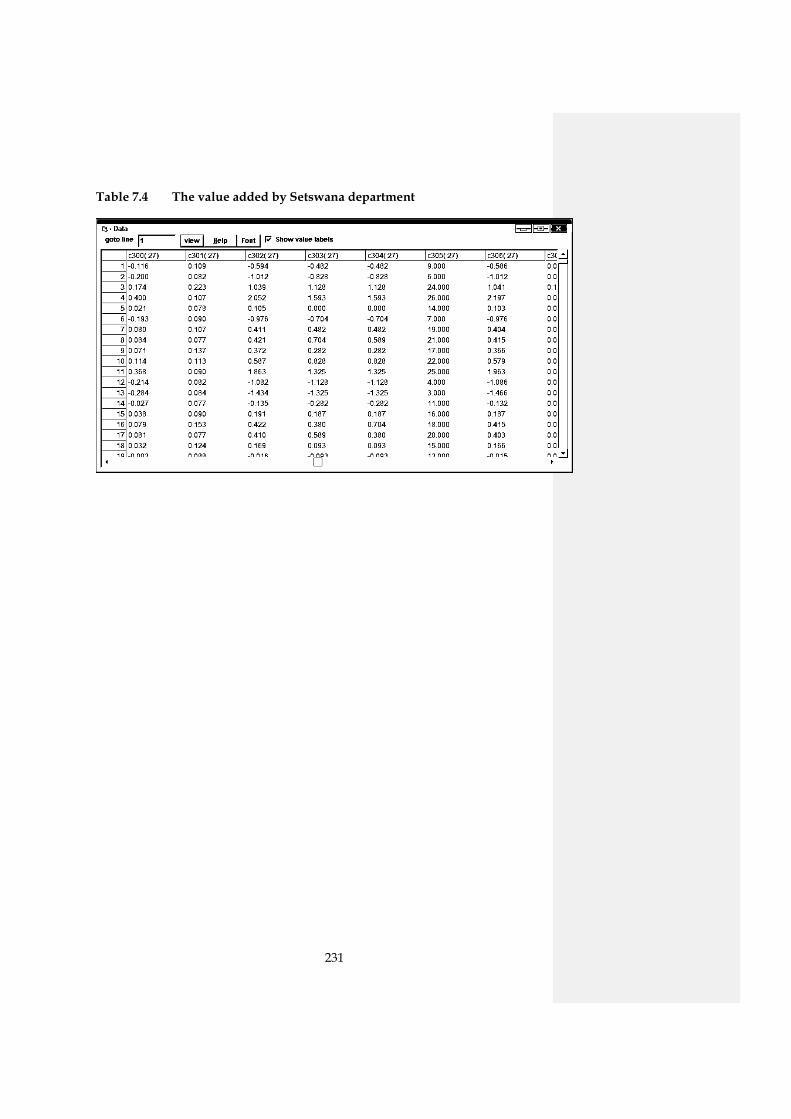
231
Table 7.4 The value added by Setswana department
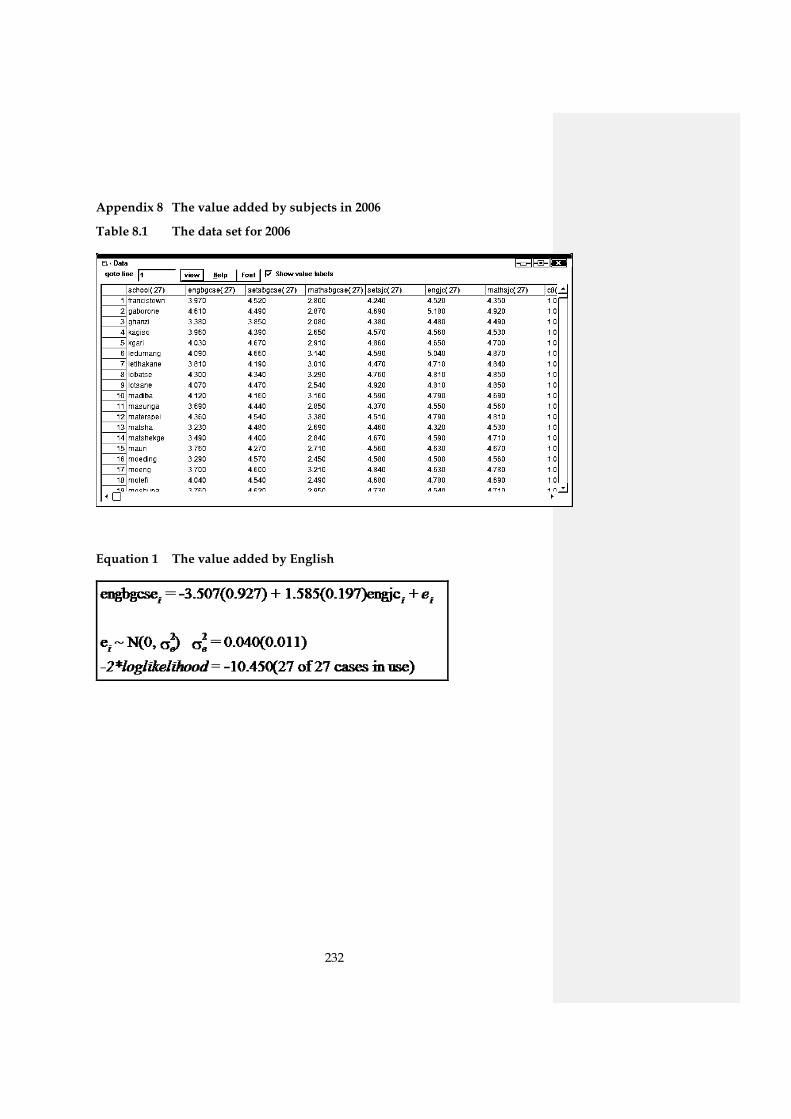
232
Appendix 8 The value added by subjects in 2006
Table 8.1 The data set for 2006
Equation 1 The value added by English
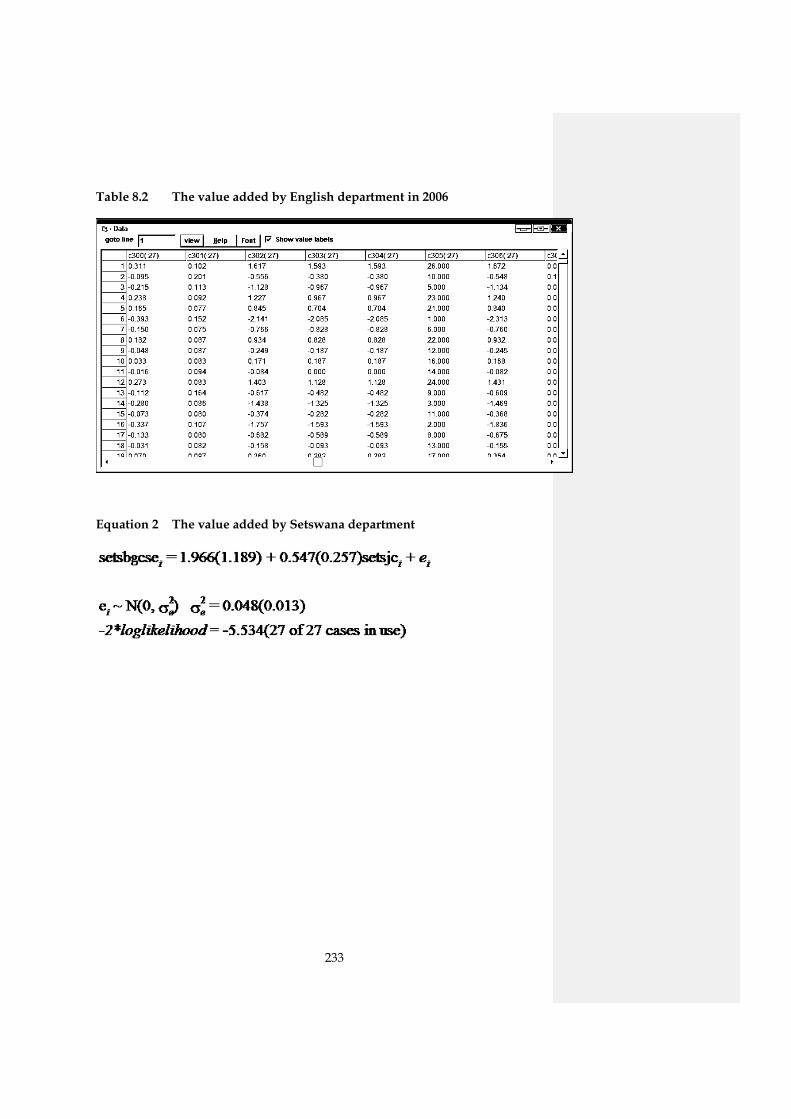
233
Table 8.2 The value added by English department in 2006
Equation 2 The value added by Setswana department

234
Table 8.3 The value added by Setswana department
Equation 3: The value added by Mathematics

235
Table 8.4 The value added by Mathematics c300 and ranking c305
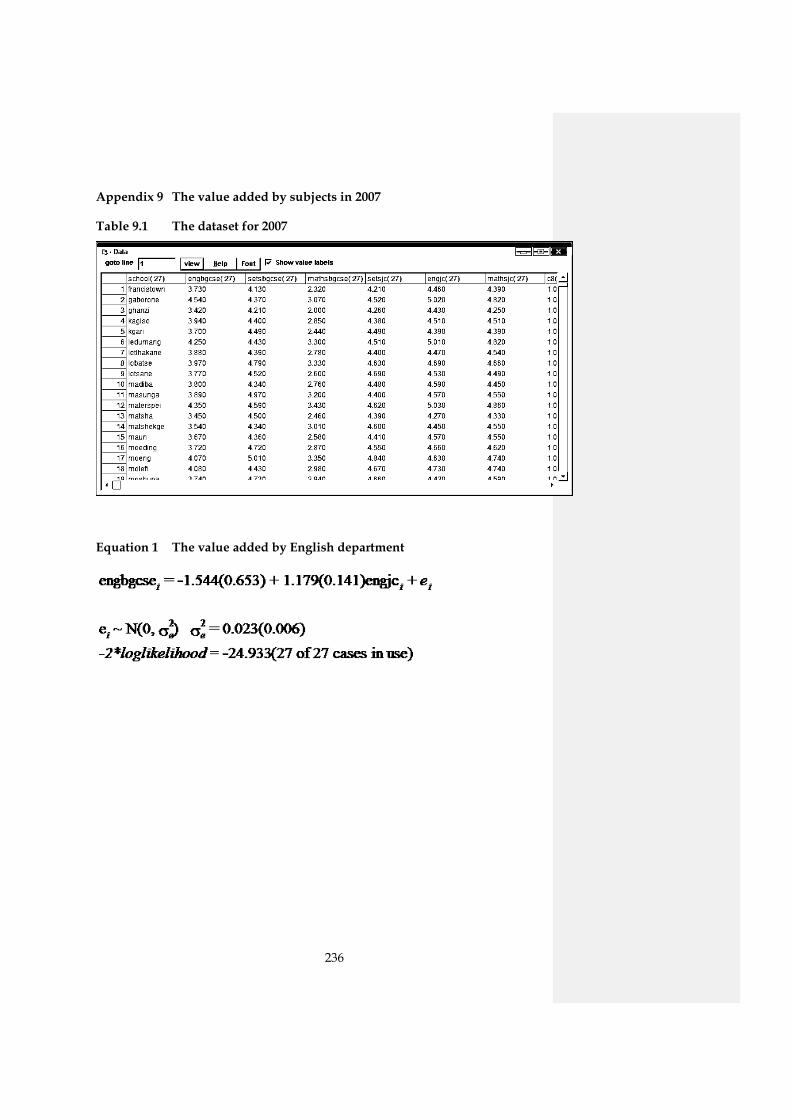
236
Appendix 9 The value added by subjects in 2007
Table 9.1 The dataset for 2007
Equation 1 The value added by English department
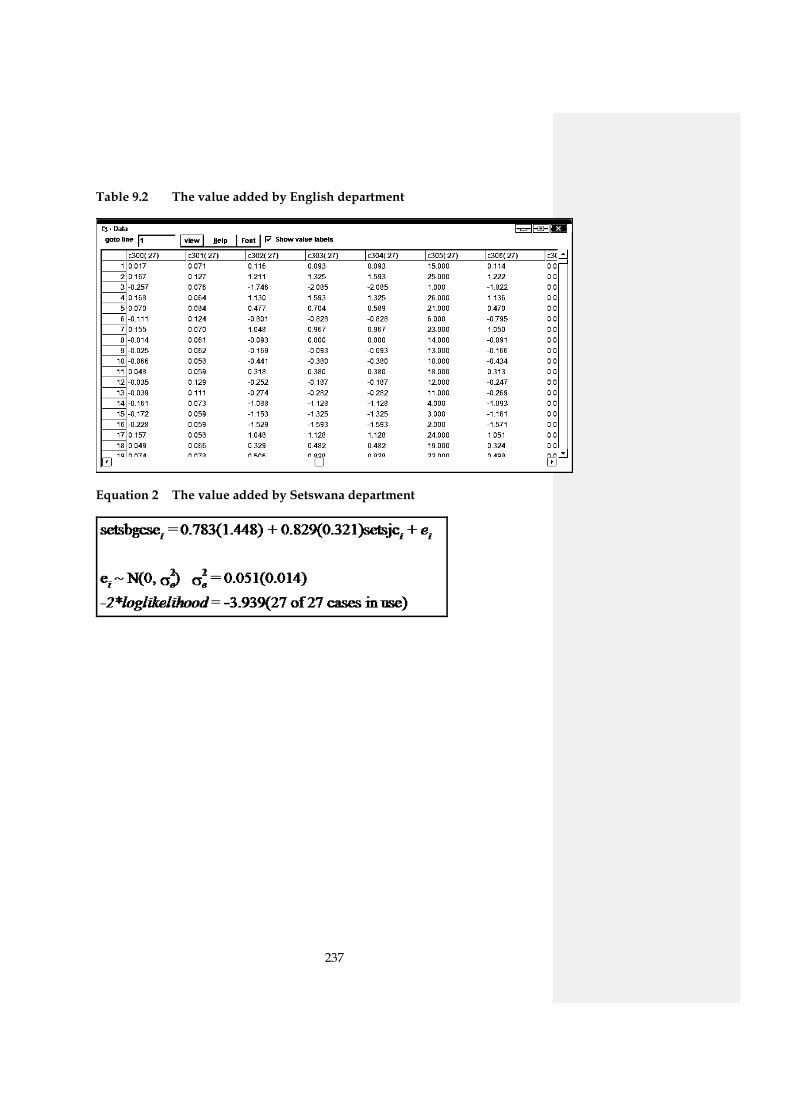
237
Table 9.2 The value added by English department
Equation 2 The value added by Setswana department
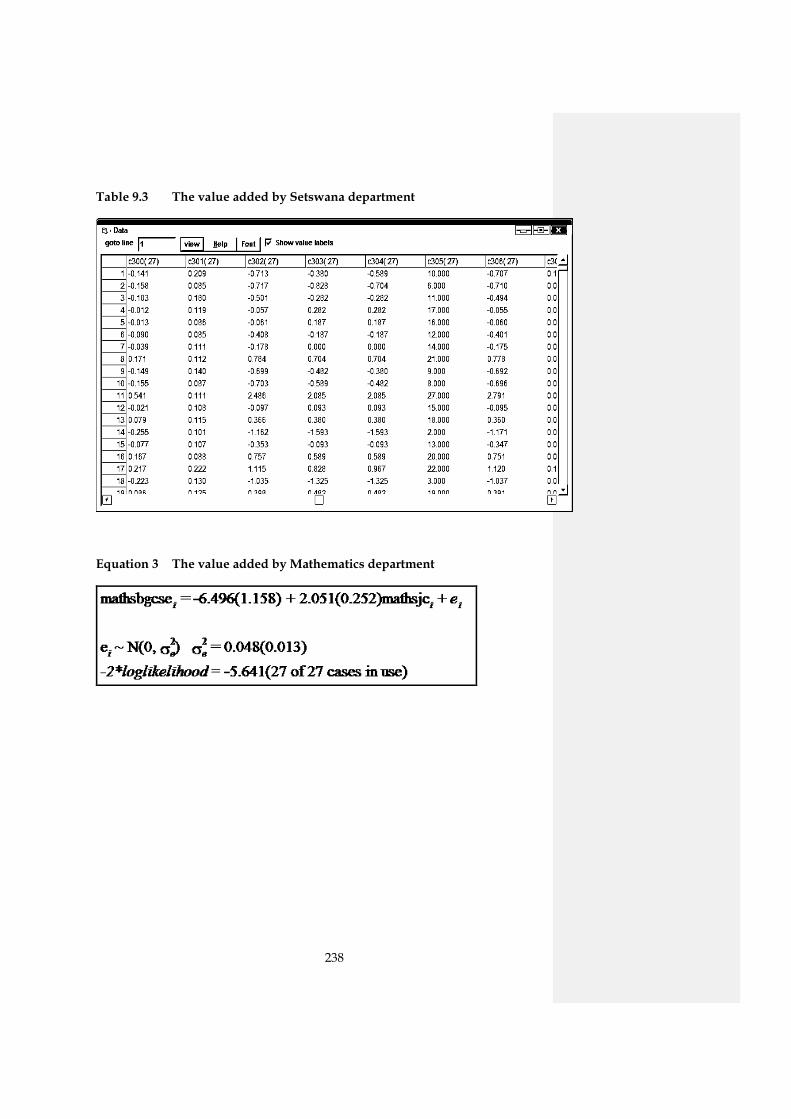
238
Table 9.3 The value added by Setswana department
Equation 3 The value added by Mathematics department
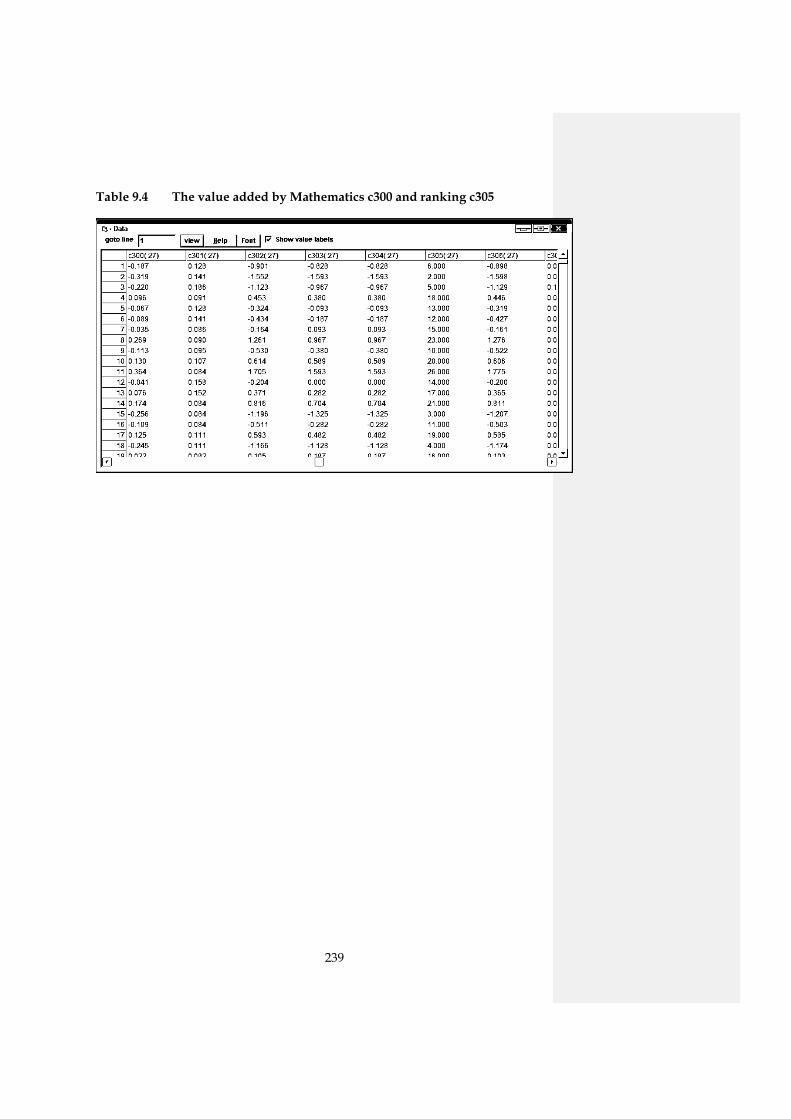
239
Table 9.4 The value added by Mathematics c300 and ranking c305
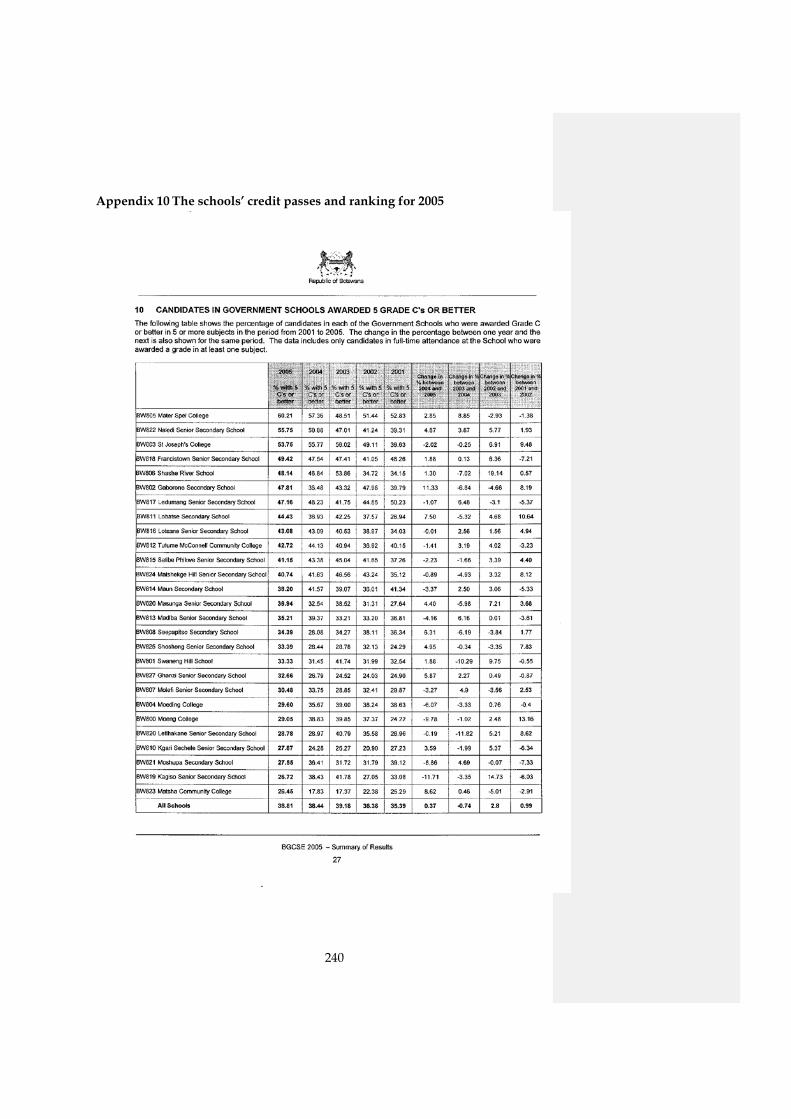
240
Appendix 10 The schools’ credit passes and ranking for 2005
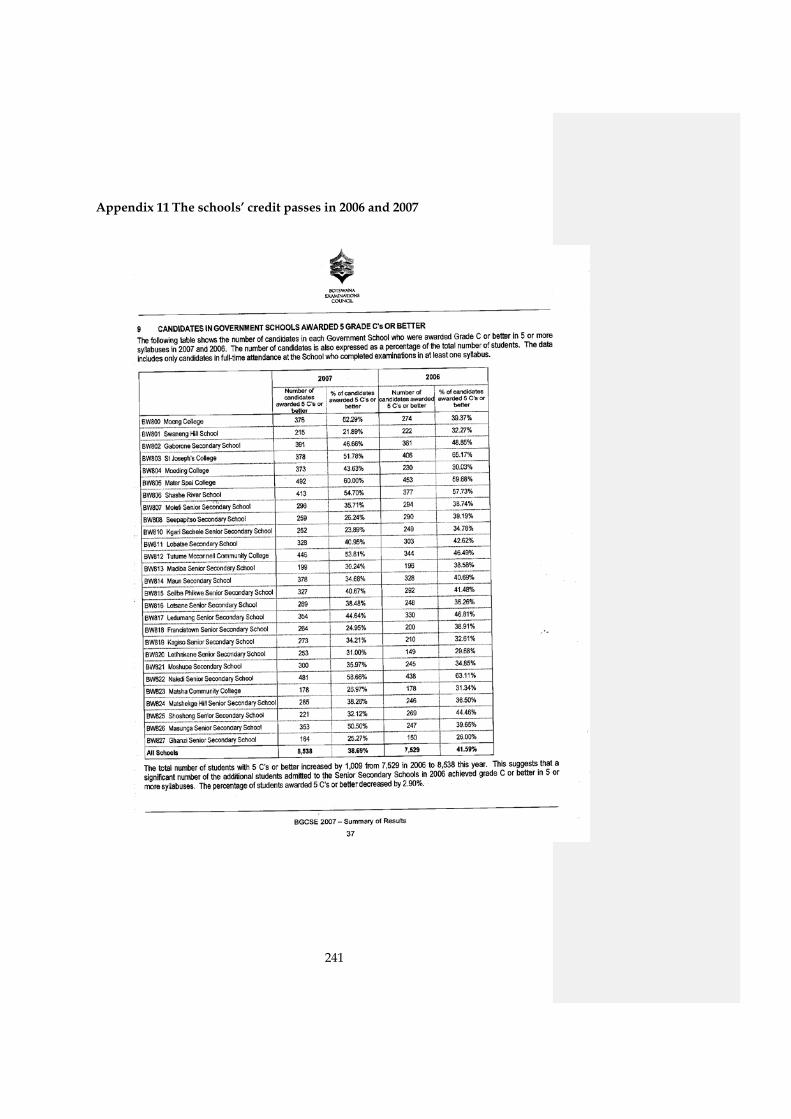
241
Appendix 11 The schools’ credit passes in 2006 and 2007

242
Curriculum vitae
Name: Ms Irene Lemphorwana Mohiemang
Education qualifications
Diploma in Secondary Education (Science) -University of Botswana- 1986-1989
Bachelor of Education (Science Education) -University of Botswana- 1994-1996
Master in Education (Education Management) -University of Botswana- 1999-
2001
Doctor of Education (Education Management) –UNISA- 2005-2008
Work experience
General science teacher (Tshwaragano Community Junior School)
1994-1996 Senior Teacher Science Makalamabedi/Gantsi Senior
Secondary School
1997-2005 Assistant School Head (Gantsi Senior Secondary School)
2006-2007 Deputy School Head (Gantsi Senior Secondary School)
2008- Deputy School Head (Letlhakane Senior Secondary School)