effect of tissue optics on wavelength optimization for ... · pdf fileeffect of tissue optics...
TRANSCRIPT
Effect of tissue optics on wavelengthoptimization for quantum dot-basedsurface and subsurface fluorescenceimaging
Mathieu RoyFarhan DadaniCarolyn J. NiuAnthony KimBrian C. Wilson
Downloaded From: https://www.spiedigitallibrary.org/journals/Journal-of-Biomedical-Optics on 5/20/2018 Terms of Use: https://www.spiedigitallibrary.org/terms-of-use
Effect of tissue optics on wavelength optimizationfor quantum dot-based surface and subsurfacefluorescence imaging
Mathieu Roy,a,b Farhan Dadani,b Carolyn J. Niu,b Anthony Kim,a,b and Brian C. Wilsona,b
aUniversity of Toronto, Ontario Cancer Institute, Department of Medical Biophysics, 610 University Avenue, Toronto, Ontario, M5G 2M9 CanadabUniversity Health Network, Ontario Cancer Institute, 610 University Avenue, Toronto, Ontario, M5G 2M9 Canada
Abstract. Optimization is an important but relatively unexplored aspect of contrast-enhanced fluorescenceimaging, since minimizing contrast agent usage reduces the associated cost and potential toxicity. In a previousstudy, the authors developed a quantitative experimental approach to optimize quantum dot (QD)-based imagingusing homogenized liver as a model tissue. In this follow-up study, the authors further extend and validate theapproach using eight different tissues and five QDs emission wavelengths, and introduce quantitative imaging per-formance metrics, namely the threshold QD concentration and wavelength optimization gain. These metrics allowquantification of the improvements through spectral optimization in terms of reduced QD dose and identify theconditions that make the optimization process worthwhile. The authors show that, for most tissues, the most impor-tant parameter to optimize is the emission wavelength, yielding improvements of up to four orders of magnitude,followed by the excitation wavelength (up to 20-fold improvement) and the excitation filter bandwidth (up to 50%improvement). The authors also observe, by means of the optimization gain metric, that tissues exhibiting both highautofluorescence and strong pigmentation are generally better candidates for excitation wavelength optimization.This work contributes to the development of robust and quantitative dosimetry for QD-based fluorescence imagingnear to the tissue surface. © 2012 Society of Photo-Optical Instrumentation Engineers (SPIE). [DOI: 10.1117/1.JBO.17.2.026002]
Keywords: fluorescence; image analysis; imaging; multispectral imaging; optical properties; quantum dots.
Paper 11339 received Jul. 1, 2011; revised manuscript received Dec. 4, 2011; accepted for publication Dec. 5, 2011; published onlineMar. 5, 2012.
1 IntroductionQuantum dots (QDs) are luminescent semiconductor nanopar-ticles with potential as contrast agents for medical imaging.1
Their unique optical photophysical properties (broad excitation,narrow emission bandwidth, low photobleaching, and size-tun-able emission wavelength) make them potential candidates formultiplexed reporting of biomarkers in vivo,2 leading to appli-cations in early cancer detection,3 particularly endoscopically,and fluorescence-guided surgery.4 Unfortunately, compared toexisting fluorescent labels, they are relatively expensive, andthere are significant toxicity concerns due to their elementalcomposition.5
To minimize cost and toxicity, it is imperative to optimize theuse of QDs and obtain as much fluorescence contrast with thesmallest possible dose.6 Given their broad excitation spectrumand size-tunable emission, the excitation and emission wave-lengths are two main parameters that require optimization. How-ever, as previously discussed,7,8 selecting the optimal excitationand emission wavelengths is complex, since the ability to detectQDs at depth in tissue and the tissue autofluorescence back-ground both depend strongly on the tissue optical absorptionand scattering properties,9 which are themselves functions ofwavelength.
To address this challenge, we have developed an experimen-tal method, consisting of imaging a QD-loaded capillary tube
embedded in homogenized tissue, together with a numericalmodel of light propagation in tissue to quantify the QD contrastversus relevant imaging parameters, such as the excitation andemission wavelengths and target depth.10 In a previous study, wedemonstrated the validity of this approach using artificial liquidphantoms of known optical properties and homogenized liveras a proof-of-principle model tissue. This led to the followingprovisional conclusions regarding contrast optimization: 1. it isadvantageous for surface imaging to use an excitation wave-length corresponding to a tissue absorption peak, since thisreduces the tissue autofluorescence background and 2. the con-trast falls rapidly with depth of the QDs, at a rate that increasespredominantly with tissue absorption, leading to spectral shiftsand overall flattening of the spectral contrast.
However, since that study used only one tissue type, the gen-eralizability of these conclusions for optimizing QD-based bio-imaging remains to be established. Here, the same approach isexpanded to four different homogenized tissues and four repre-sentative hollow organs, using QDs emitting at five differentemission wavelengths and, for comparison, matched fluorescentdyes.
In addition to providing further insight into QD image opti-mization, these studies allow more complete validation of thephantom and modeling methods. Thorough validation requiresvariation of numerous parameters, including the target fluores-cence spectra and depth z, the excitation λex and emission wave-length λem-dependent tissue absorption μa, reduced scattering μ 0
sand autofluorescence (AF), and the dilution of the tissueAddress all correspondence to: Brian C. Wilson, University of Toronto, Ontario
Cancer Institute, Department of Medical Biophysics, 610 University Avenue,Toronto, Ontario, Canada M5G 2M9. Tel: 416-946-2952; Fax: 416-946-6529;E-mail: [email protected] 0091-3286/2012/$25.00 © 2012 SPIE
Journal of Biomedical Optics 17(2), 026002 (February 2012)
Journal of Biomedical Optics 026002-1 February 2012 • Vol. 17(2)
Downloaded From: https://www.spiedigitallibrary.org/journals/Journal-of-Biomedical-Optics on 5/20/2018 Terms of Use: https://www.spiedigitallibrary.org/terms-of-use
homogenate. However, attempting to cover each in detail isbeyond the scope of this article. For example, the effects of tar-get depth and tissue dilution were well documented in our firststudy, and so will not be presented in detail here. Hence, for thesake of brevity, we only briefly present the final results of thevalidation study, and focus instead on the challenge of optimiz-ing the image contrast. For this, we introduce novel performancemetrics, namely the threshold QD concentration cth and wave-length optimization gain G, as measures of the potential impactof optimization on minimizing the dose of QDs required toachieve adequate target contrast.
2 Methods
2.1 QD and Fluorophore Preparation
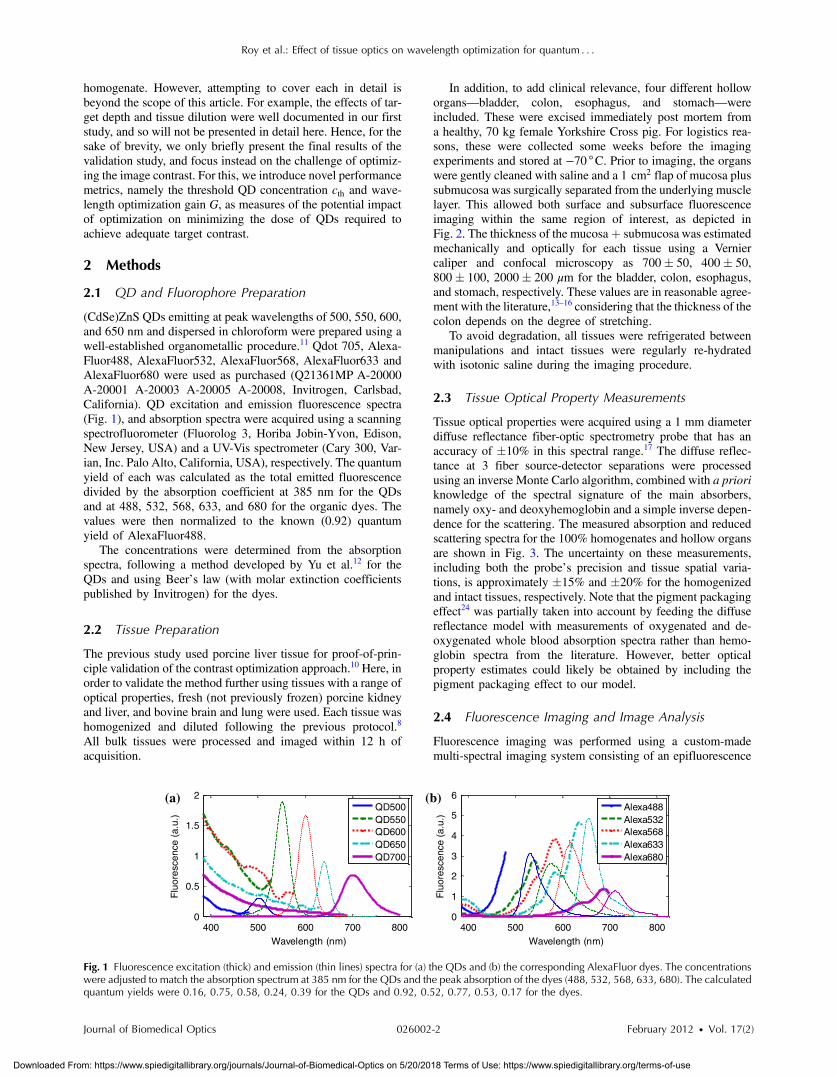
(CdSe)ZnS QDs emitting at peak wavelengths of 500, 550, 600,and 650 nm and dispersed in chloroform were prepared using awell-established organometallic procedure.11 Qdot 705, Alexa-Fluor488, AlexaFluor532, AlexaFluor568, AlexaFluor633 andAlexaFluor680 were used as purchased (Q21361MP A-20000A-20001 A-20003 A-20005 A-20008, Invitrogen, Carlsbad,California). QD excitation and emission fluorescence spectra(Fig. 1), and absorption spectra were acquired using a scanningspectrofluorometer (Fluorolog 3, Horiba Jobin-Yvon, Edison,New Jersey, USA) and a UV-Vis spectrometer (Cary 300, Var-ian, Inc. Palo Alto, California, USA), respectively. The quantumyield of each was calculated as the total emitted fluorescencedivided by the absorption coefficient at 385 nm for the QDsand at 488, 532, 568, 633, and 680 for the organic dyes. Thevalues were then normalized to the known (0.92) quantumyield of AlexaFluor488.
The concentrations were determined from the absorptionspectra, following a method developed by Yu et al.12 for theQDs and using Beer’s law (with molar extinction coefficientspublished by Invitrogen) for the dyes.
2.2 Tissue Preparation
The previous study used porcine liver tissue for proof-of-prin-ciple validation of the contrast optimization approach.10 Here, inorder to validate the method further using tissues with a range ofoptical properties, fresh (not previously frozen) porcine kidneyand liver, and bovine brain and lung were used. Each tissue washomogenized and diluted following the previous protocol.8
All bulk tissues were processed and imaged within 12 h ofacquisition.
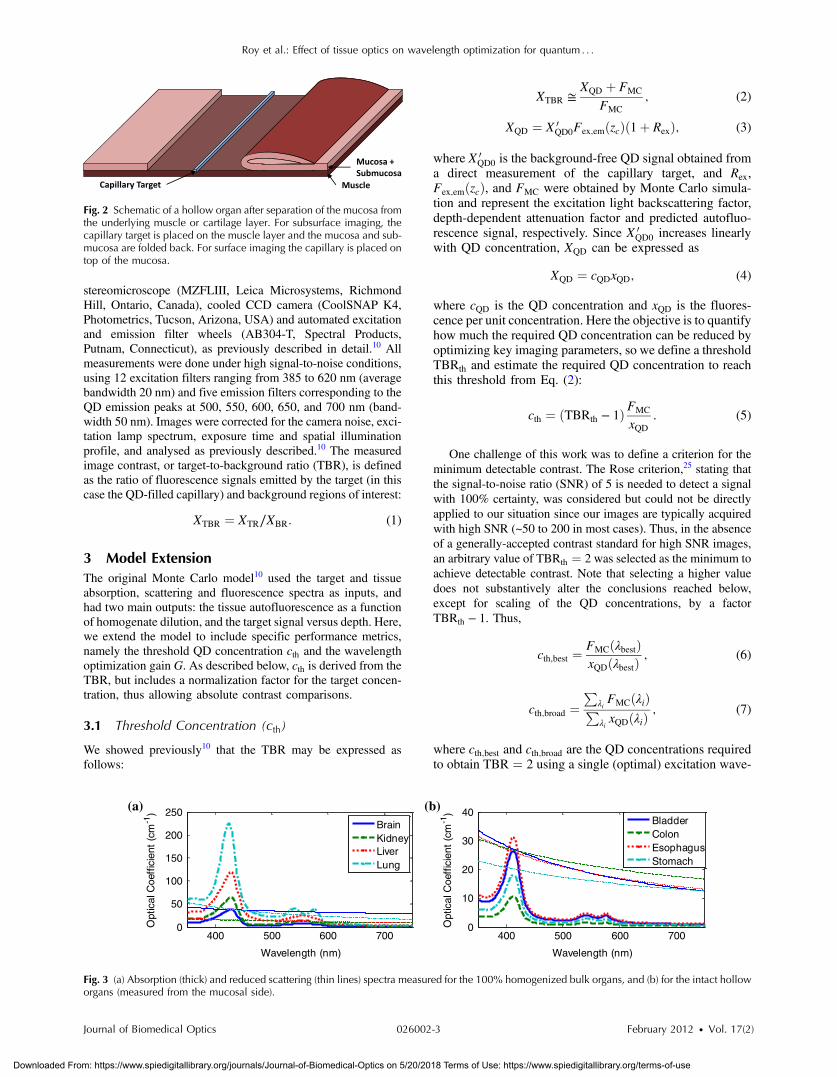
In addition, to add clinical relevance, four different holloworgans—bladder, colon, esophagus, and stomach—wereincluded. These were excised immediately post mortem froma healthy, 70 kg female Yorkshire Cross pig. For logistics rea-sons, these were collected some weeks before the imagingexperiments and stored at −70 °C. Prior to imaging, the organswere gently cleaned with saline and a 1 cm2 flap of mucosa plussubmucosa was surgically separated from the underlying musclelayer. This allowed both surface and subsurface fluorescenceimaging within the same region of interest, as depicted inFig. 2. The thickness of themucosaþ submucosawas estimatedmechanically and optically for each tissue using a Verniercaliper and confocal microscopy as 700� 50, 400� 50,800� 100, 2000� 200 μm for the bladder, colon, esophagus,and stomach, respectively. These values are in reasonable agree-ment with the literature,13–16 considering that the thickness of thecolon depends on the degree of stretching.
To avoid degradation, all tissues were refrigerated betweenmanipulations and intact tissues were regularly re-hydratedwith isotonic saline during the imaging procedure.
2.3 Tissue Optical Property Measurements
Tissue optical properties were acquired using a 1 mm diameterdiffuse reflectance fiber-optic spectrometry probe that has anaccuracy of �10% in this spectral range.17 The diffuse reflec-tance at 3 fiber source-detector separations were processedusing an inverse Monte Carlo algorithm, combined with a prioriknowledge of the spectral signature of the main absorbers,namely oxy- and deoxyhemoglobin and a simple inverse depen-dence for the scattering. The measured absorption and reducedscattering spectra for the 100% homogenates and hollow organsare shown in Fig. 3. The uncertainty on these measurements,including both the probe’s precision and tissue spatial varia-tions, is approximately �15% and �20% for the homogenizedand intact tissues, respectively. Note that the pigment packagingeffect24 was partially taken into account by feeding the diffusereflectance model with measurements of oxygenated and de-oxygenated whole blood absorption spectra rather than hemo-globin spectra from the literature. However, better opticalproperty estimates could likely be obtained by including thepigment packaging effect to our model.
2.4 Fluorescence Imaging and Image Analysis
Fluorescence imaging was performed using a custom-mademulti-spectral imaging system consisting of an epifluorescence
400 500 600 700 8000
0.5
1
1.5
2
Wavelength (nm)
Flu
ores
cenc
e (a
.u.)
QD500QD550QD600QD650QD700
400 500 600 700 8000
1
2
3
4
5
6
Wavelength (nm)
Flu
ores
cenc
e (a
.u.)
Alexa488Alexa532Alexa568Alexa633Alexa680
(a) (b)
Fig. 1 Fluorescence excitation (thick) and emission (thin lines) spectra for (a) the QDs and (b) the corresponding AlexaFluor dyes. The concentrationswere adjusted to match the absorption spectrum at 385 nm for the QDs and the peak absorption of the dyes (488, 532, 568, 633, 680). The calculatedquantum yields were 0.16, 0.75, 0.58, 0.24, 0.39 for the QDs and 0.92, 0.52, 0.77, 0.53, 0.17 for the dyes.
Roy et al.: Effect of tissue optics on wavelength optimization for quantum : : :
Journal of Biomedical Optics 026002-2 February 2012 • Vol. 17(2)
Downloaded From: https://www.spiedigitallibrary.org/journals/Journal-of-Biomedical-Optics on 5/20/2018 Terms of Use: https://www.spiedigitallibrary.org/terms-of-use
stereomicroscope (MZFLIII, Leica Microsystems, RichmondHill, Ontario, Canada), cooled CCD camera (CoolSNAP K4,Photometrics, Tucson, Arizona, USA) and automated excitationand emission filter wheels (AB304-T, Spectral Products,Putnam, Connecticut), as previously described in detail.10 Allmeasurements were done under high signal-to-noise conditions,using 12 excitation filters ranging from 385 to 620 nm (averagebandwidth 20 nm) and five emission filters corresponding to theQD emission peaks at 500, 550, 600, 650, and 700 nm (band-width 50 nm). Images were corrected for the camera noise, exci-tation lamp spectrum, exposure time and spatial illuminationprofile, and analysed as previously described.10 The measuredimage contrast, or target-to-background ratio (TBR), is definedas the ratio of fluorescence signals emitted by the target (in thiscase the QD-filled capillary) and background regions of interest:
XTBR ¼ XTR∕XBR: (1)
3 Model ExtensionThe original Monte Carlo model10 used the target and tissueabsorption, scattering and fluorescence spectra as inputs, andhad two main outputs: the tissue autofluorescence as a functionof homogenate dilution, and the target signal versus depth. Here,we extend the model to include specific performance metrics,namely the threshold QD concentration cth and the wavelengthoptimization gain G. As described below, cth is derived from theTBR, but includes a normalization factor for the target concen-tration, thus allowing absolute contrast comparisons.
3.1 Threshold Concentration (cth)
We showed previously10 that the TBR may be expressed asfollows:
XTBR ≅XQD þ FMC
FMC
; (2)
XQD ¼ X 0QD0Fex;emðzcÞð1þ RexÞ; (3)
where X 0QD0 is the background-free QD signal obtained from
a direct measurement of the capillary target, and Rex,Fex;emðzcÞ, and FMC were obtained by Monte Carlo simula-tion and represent the excitation light backscattering factor,depth-dependent attenuation factor and predicted autofluo-rescence signal, respectively. Since X 0
QD0 increases linearlywith QD concentration, XQD can be expressed as
XQD ¼ cQDxQD; (4)
where cQD is the QD concentration and xQD is the fluores-cence per unit concentration. Here the objective is to quantifyhow much the required QD concentration can be reduced byoptimizing key imaging parameters, so we define a thresholdTBRth and estimate the required QD concentration to reachthis threshold from Eq. (2):
cth ¼ ðTBRth − 1ÞFMC
xQD: (5)
One challenge of this work was to define a criterion for theminimum detectable contrast. The Rose criterion,25 stating thatthe signal-to-noise ratio (SNR) of 5 is needed to detect a signalwith 100% certainty, was considered but could not be directlyapplied to our situation since our images are typically acquiredwith high SNR (~50 to 200 in most cases). Thus, in the absenceof a generally-accepted contrast standard for high SNR images,an arbitrary value of TBRth ¼ 2 was selected as the minimum toachieve detectable contrast. Note that selecting a higher valuedoes not substantively alter the conclusions reached below,except for scaling of the QD concentrations, by a factorTBRth − 1. Thus,
cth;best ¼FMCðλbestÞxQDðλbestÞ
; (6)
cth;broad ¼P
λiFMCðλiÞ
PλixQDðλiÞ
; (7)
where cth;best and cth;broad are the QD concentrations requiredto obtain TBR ¼ 2 using a single (optimal) excitation wave-
Fig. 2 Schematic of a hollow organ after separation of the mucosa fromthe underlying muscle or cartilage layer. For subsurface imaging, thecapillary target is placed on the muscle layer and the mucosa and sub-mucosa are folded back. For surface imaging the capillary is placed ontop of the mucosa.
400 500 600 7000
50
100
150
200
250
Wavelength (nm)
Opt
ical
Coe
ffic
ient
(cm
-1)
BrainKidneyLiverLung
400 500 600 7000
10
20
30
40
Wavelength (nm)
Opt
ical
Coe
ffic
ient
(cm
-1)
BladderColonEsophagusStomach
(a) (b)
Fig. 3 (a) Absorption (thick) and reduced scattering (thin lines) spectra measured for the 100% homogenized bulk organs, and (b) for the intact holloworgans (measured from the mucosal side).
Roy et al.: Effect of tissue optics on wavelength optimization for quantum : : :
Journal of Biomedical Optics 026002-3 February 2012 • Vol. 17(2)
Downloaded From: https://www.spiedigitallibrary.org/journals/Journal-of-Biomedical-Optics on 5/20/2018 Terms of Use: https://www.spiedigitallibrary.org/terms-of-use
length and broadband illumination, respectively. The broad-band illumination scenario was included to benchmark thewavelength optimization approach. Note that the thresholdconcentration for broadband excitation was not directlymeasured, but rather was estimated by summing the contri-butions from all excitation filters shorter than the emissionwavelength minus 50 nm (to avoid leakage of excitationlight to the detector). Since the 385 nm filter was used asthe shortest wavelength in all cases, the effective bandwidthsfor the simulated broadband conditions were 85, 145, 185,235, and 255 nm for detection at 500, 550, 600, 650, and700 nm, respectively.
3.2 Wavelength Optimization Gain (G)
As a performance metric, the gain due to optimizing the wave-length is defined as the ratio between the threshold concentra-tions for the suboptimal and optimal illumination cases:
Gbroadband ¼cth;broadcth;best
: (8)
Similarly, the maximum gain between the worst wavelengthchoice and the optimized case is:
Gmax ¼cth;worstcth;best
: (9)
For the purpose of validating the model, the cth and G pre-dictions were compared to values extrapolated from the mea-surements, obtained by substituting xQD by ðXTR − XBR∕cQDÞand FMC by XBR in Eqs. (5)–(7). Also, since the autofluores-cence predictions were poor in some cases (see Sec. 4.1), a sim-plified model in which the autofluorescence was measureddirectly instead of being calculated, was used for all data pre-sented here, except for Sec. 4.1. Thus, FMC is simply replacedby XBR, with xQD unchanged.
4 ValidationAs mentioned previously, the Monte Carlo contrast optimizationmodel predicts the behavior of the tissue autofluorescence andthe target signal (or contrast). In our previous study, the modelwas partially validated using artificial liquid phantoms, a singlehomogenized tissue (liver) and a single QD emission wave-length (600 nm). To test the model across a wider parameterspace, we used eight different ex vivo tissues and five QD emis-sion wavelengths. Here, we briefly present the conclusions interms of autofluorescence and contrast predictions.
4.1 Autofluorescence Versus Tissue Dilution
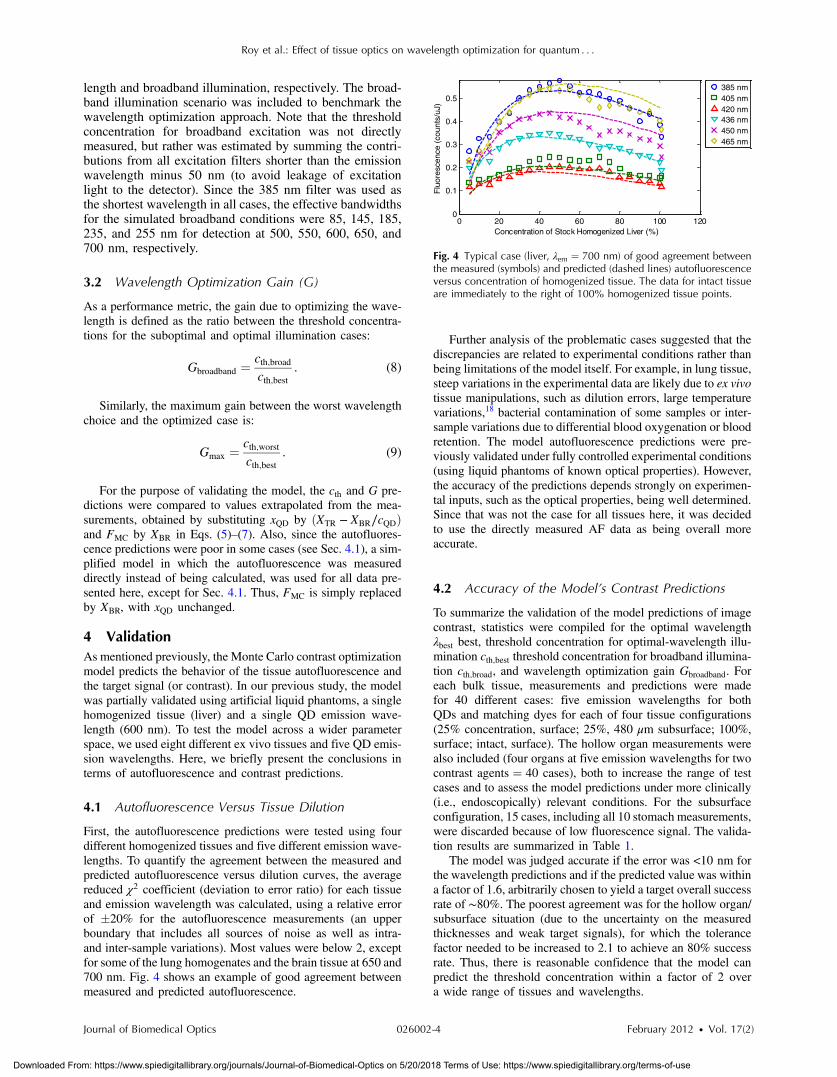
First, the autofluorescence predictions were tested using fourdifferent homogenized tissues and five different emission wave-lengths. To quantify the agreement between the measured andpredicted autofluorescence versus dilution curves, the averagereduced χ2 coefficient (deviation to error ratio) for each tissueand emission wavelength was calculated, using a relative errorof �20% for the autofluorescence measurements (an upperboundary that includes all sources of noise as well as intra-and inter-sample variations). Most values were below 2, exceptfor some of the lung homogenates and the brain tissue at 650 and700 nm. Fig. 4 shows an example of good agreement betweenmeasured and predicted autofluorescence.
Further analysis of the problematic cases suggested that thediscrepancies are related to experimental conditions rather thanbeing limitations of the model itself. For example, in lung tissue,steep variations in the experimental data are likely due to ex vivotissue manipulations, such as dilution errors, large temperaturevariations,18 bacterial contamination of some samples or inter-sample variations due to differential blood oxygenation or bloodretention. The model autofluorescence predictions were pre-viously validated under fully controlled experimental conditions(using liquid phantoms of known optical properties). However,the accuracy of the predictions depends strongly on experimen-tal inputs, such as the optical properties, being well determined.Since that was not the case for all tissues here, it was decidedto use the directly measured AF data as being overall moreaccurate.
4.2 Accuracy of the Model’s Contrast Predictions
To summarize the validation of the model predictions of imagecontrast, statistics were compiled for the optimal wavelengthλbest best, threshold concentration for optimal-wavelength illu-mination cth;best threshold concentration for broadband illumina-tion cth;broad, and wavelength optimization gain Gbroadband. Foreach bulk tissue, measurements and predictions were madefor 40 different cases: five emission wavelengths for bothQDs and matching dyes for each of four tissue configurations(25% concentration, surface; 25%, 480 μm subsurface; 100%,surface; intact, surface). The hollow organ measurements werealso included (four organs at five emission wavelengths for twocontrast agents ¼ 40 cases), both to increase the range of testcases and to assess the model predictions under more clinically(i.e., endoscopically) relevant conditions. For the subsurfaceconfiguration, 15 cases, including all 10 stomach measurements,were discarded because of low fluorescence signal. The valida-tion results are summarized in Table 1.
The model was judged accurate if the error was <10 nm forthe wavelength predictions and if the predicted value was withina factor of 1.6, arbitrarily chosen to yield a target overall successrate of ∼80%. The poorest agreement was for the hollow organ/subsurface situation (due to the uncertainty on the measuredthicknesses and weak target signals), for which the tolerancefactor needed to be increased to 2.1 to achieve an 80% successrate. Thus, there is reasonable confidence that the model canpredict the threshold concentration within a factor of 2 overa wide range of tissues and wavelengths.
0 20 40 60 80 100 1200
0.1
0.2
0.3
0.4
0.5
Concentration of Stock Homogenized Liver (%)
Flu
ores
cenc
e (c
ount
s/uJ
)
385 nm405 nm420 nm436 nm450 nm465 nm
Fig. 4 Typical case (liver, λem ¼ 700 nm) of good agreement betweenthe measured (symbols) and predicted (dashed lines) autofluorescenceversus concentration of homogenized tissue. The data for intact tissueare immediately to the right of 100% homogenized tissue points.
Roy et al.: Effect of tissue optics on wavelength optimization for quantum : : :
Journal of Biomedical Optics 026002-4 February 2012 • Vol. 17(2)
Downloaded From: https://www.spiedigitallibrary.org/journals/Journal-of-Biomedical-Optics on 5/20/2018 Terms of Use: https://www.spiedigitallibrary.org/terms-of-use
5 Optimization ResultsNow that the model’s validity has been demonstrated, we pre-sent the optimization results, primarily focusing on the effect oftissue optical properties on the threshold concentration. First, atypical example of the threshold concentration calculation ispresented, followed by an analysis of the effects of the excitationand emission wavelengths.
5.1 Calculation of Threshold Concentrations
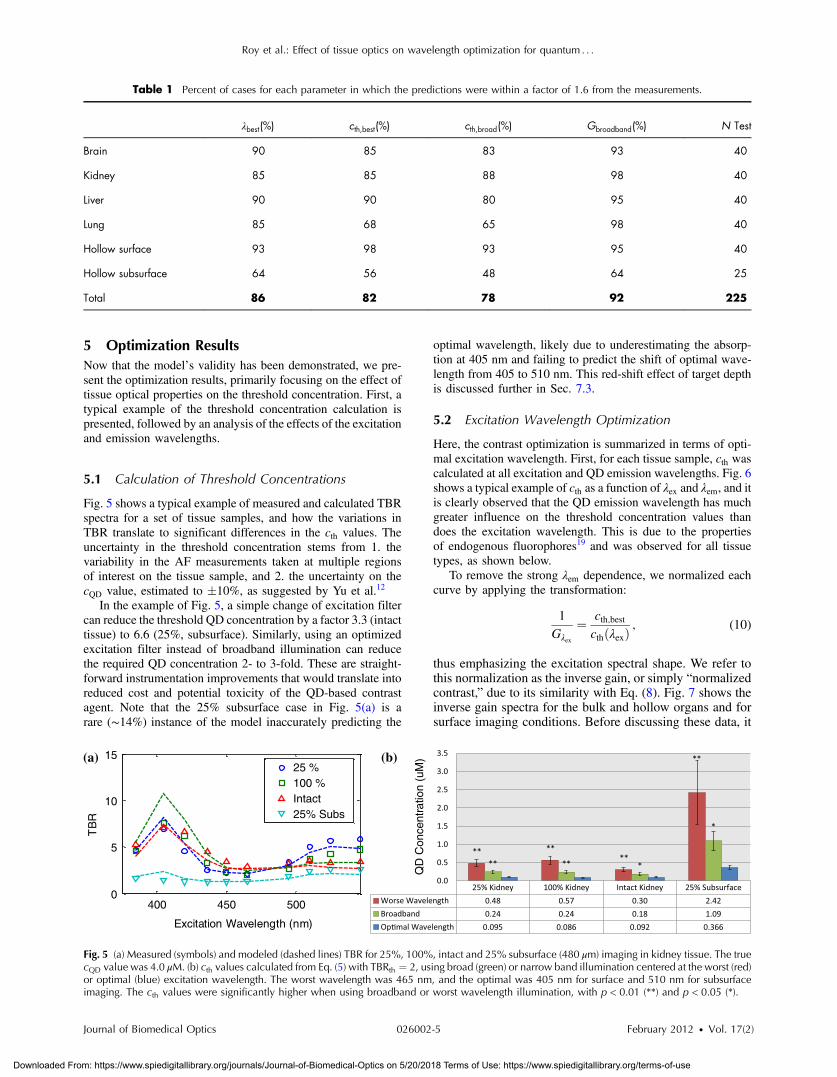
Fig. 5 shows a typical example of measured and calculated TBRspectra for a set of tissue samples, and how the variations inTBR translate to significant differences in the cth values. Theuncertainty in the threshold concentration stems from 1. thevariability in the AF measurements taken at multiple regionsof interest on the tissue sample, and 2. the uncertainty on thecQD value, estimated to �10%, as suggested by Yu et al.12
In the example of Fig. 5, a simple change of excitation filtercan reduce the threshold QD concentration by a factor 3.3 (intacttissue) to 6.6 (25%, subsurface). Similarly, using an optimizedexcitation filter instead of broadband illumination can reducethe required QD concentration 2- to 3-fold. These are straight-forward instrumentation improvements that would translate intoreduced cost and potential toxicity of the QD-based contrastagent. Note that the 25% subsurface case in Fig. 5(a) is arare (∼14%) instance of the model inaccurately predicting the
optimal wavelength, likely due to underestimating the absorp-tion at 405 nm and failing to predict the shift of optimal wave-length from 405 to 510 nm. This red-shift effect of target depthis discussed further in Sec. 7.3.
5.2 Excitation Wavelength Optimization
Here, the contrast optimization is summarized in terms of opti-mal excitation wavelength. First, for each tissue sample, cth wascalculated at all excitation and QD emission wavelengths. Fig. 6shows a typical example of cth as a function of λex and λem, and itis clearly observed that the QD emission wavelength has muchgreater influence on the threshold concentration values thandoes the excitation wavelength. This is due to the propertiesof endogenous fluorophores19 and was observed for all tissuetypes, as shown below.
To remove the strong λem dependence, we normalized eachcurve by applying the transformation:
1
Gλex
¼ cth;bestcthðλexÞ
; (10)
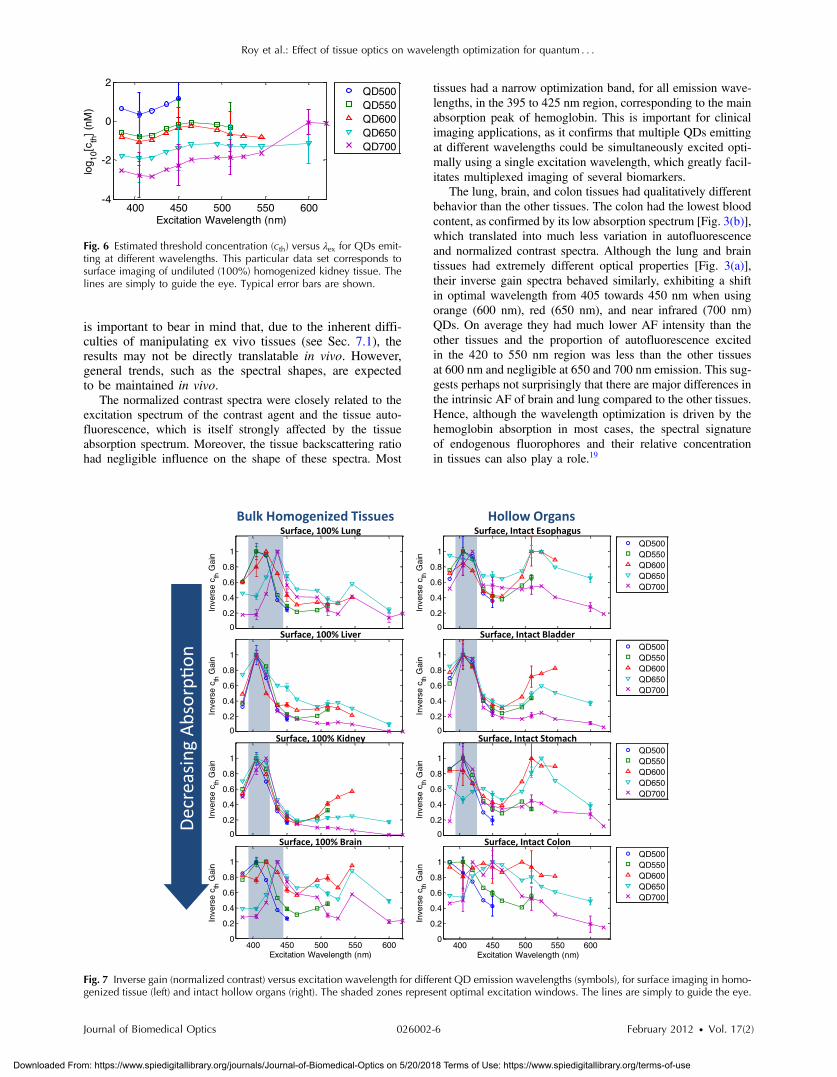
thus emphasizing the excitation spectral shape. We refer tothis normalization as the inverse gain, or simply “normalizedcontrast,” due to its similarity with Eq. (8). Fig. 7 shows theinverse gain spectra for the bulk and hollow organs and forsurface imaging conditions. Before discussing these data, it
Table 1 Percent of cases for each parameter in which the predictions were within a factor of 1.6 from the measurements.
λbest(%) cth;best(%) cth;broad(%) Gbroadband(%) N Test
Brain 90 85 83 93 40
Kidney 85 85 88 98 40
Liver 90 90 80 95 40
Lung 85 68 65 98 40
Hollow surface 93 98 93 95 40
Hollow subsurface 64 56 48 64 25
Total 86 82 78 92 225
QD
Con
cent
ratio
n (u
M)
400 450 5000
5
10
15
Excitation Wavelength (nm)
TB
R
25 %100 %Intact25% Subs
(a) (b)
Fig. 5 (a) Measured (symbols) and modeled (dashed lines) TBR for 25%, 100%, intact and 25% subsurface (480 μm) imaging in kidney tissue. The truecQD value was 4.0 μM. (b) cth values calculated from Eq. (5) with TBRth ¼ 2, using broad (green) or narrow band illumination centered at the worst (red)or optimal (blue) excitation wavelength. The worst wavelength was 465 nm, and the optimal was 405 nm for surface and 510 nm for subsurfaceimaging. The cth values were significantly higher when using broadband or worst wavelength illumination, with p < 0.01 (**) and p < 0.05 (*).
Roy et al.: Effect of tissue optics on wavelength optimization for quantum : : :
Journal of Biomedical Optics 026002-5 February 2012 • Vol. 17(2)
Downloaded From: https://www.spiedigitallibrary.org/journals/Journal-of-Biomedical-Optics on 5/20/2018 Terms of Use: https://www.spiedigitallibrary.org/terms-of-use
is important to bear in mind that, due to the inherent diffi-culties of manipulating ex vivo tissues (see Sec. 7.1), theresults may not be directly translatable in vivo. However,general trends, such as the spectral shapes, are expectedto be maintained in vivo.
The normalized contrast spectra were closely related to theexcitation spectrum of the contrast agent and the tissue auto-fluorescence, which is itself strongly affected by the tissueabsorption spectrum. Moreover, the tissue backscattering ratiohad negligible influence on the shape of these spectra. Most
tissues had a narrow optimization band, for all emission wave-lengths, in the 395 to 425 nm region, corresponding to the mainabsorption peak of hemoglobin. This is important for clinicalimaging applications, as it confirms that multiple QDs emittingat different wavelengths could be simultaneously excited opti-mally using a single excitation wavelength, which greatly facil-itates multiplexed imaging of several biomarkers.
The lung, brain, and colon tissues had qualitatively differentbehavior than the other tissues. The colon had the lowest bloodcontent, as confirmed by its low absorption spectrum [Fig. 3(b)],which translated into much less variation in autofluorescenceand normalized contrast spectra. Although the lung and braintissues had extremely different optical properties [Fig. 3(a)],their inverse gain spectra behaved similarly, exhibiting a shiftin optimal wavelength from 405 towards 450 nm when usingorange (600 nm), red (650 nm), and near infrared (700 nm)QDs. On average they had much lower AF intensity than theother tissues and the proportion of autofluorescence excitedin the 420 to 550 nm region was less than the other tissuesat 600 nm and negligible at 650 and 700 nm emission. This sug-gests perhaps not surprisingly that there are major differences inthe intrinsic AF of brain and lung compared to the other tissues.Hence, although the wavelength optimization is driven by thehemoglobin absorption in most cases, the spectral signatureof endogenous fluorophores and their relative concentrationin tissues can also play a role.19
400 450 500 550 600-4
-2
0
2
Excitation Wavelength (nm)
log 10
[cth
] (n
M)
QD500QD550QD600QD650QD700
Fig. 6 Estimated threshold concentration (cth) versus λex for QDs emit-ting at different wavelengths. This particular data set corresponds tosurface imaging of undiluted (100%) homogenized kidney tissue. Thelines are simply to guide the eye. Typical error bars are shown.
400 450 500 550 6000
0.2
0.4
0.6
0.8
1
Excitation Wavelength (nm)
Inve
rse
c th G
ain
QD500QD550QD600QD650QD700
400 450 500 550 6000
0.2
0.4
0.6
0.8
1
Excitation Wavelength (nm)
Inve
rse
c th G
ain
QD500QD550QD600QD650QD700
400 450 500 550 6000
0.2
0.4
0.6
0.8
1
Excitation Wavelength (nm)
Inve
rse
c th G
ain
QD500QD550QD600QD650QD700
400 450 500 550 6000
0.2
0.4
0.6
0.8
1
Excitation Wavelength (nm)
Inve
rse
c th G
ain
QD500QD550QD600QD650QD700
400 450 500 550 6000
0.2
0.4
0.6
0.8
1
Excitation Wavelength (nm)
Inve
rse
c th G
ain
QD500QD550QD600QD650QD700
400 450 500 550 6000
0.2
0.4
0.6
0.8
1
Excitation Wavelength (nm)
Inve
rse
c th G
ain
QD500QD550QD600QD650QD700
400 450 500 550 6000
0.2
0.4
0.6
0.8
1
Excitation Wavelength (nm)
Inve
rse
c th G
ain
QD500QD550QD600QD650QD700
400 450 500 550 6000
0.2
0.4
0.6
0.8
1
Excitation Wavelength (nm)
Inve
rse
c th G
ain
QD500QD550QD600QD650QD700
Fig. 7 Inverse gain (normalized contrast) versus excitation wavelength for different QD emission wavelengths (symbols), for surface imaging in homo-genized tissue (left) and intact hollow organs (right). The shaded zones represent optimal excitation windows. The lines are simply to guide the eye.
Roy et al.: Effect of tissue optics on wavelength optimization for quantum : : :
Journal of Biomedical Optics 026002-6 February 2012 • Vol. 17(2)
Downloaded From: https://www.spiedigitallibrary.org/journals/Journal-of-Biomedical-Optics on 5/20/2018 Terms of Use: https://www.spiedigitallibrary.org/terms-of-use
5.3 Threshold QD Concentration Versus EmissionWavelength
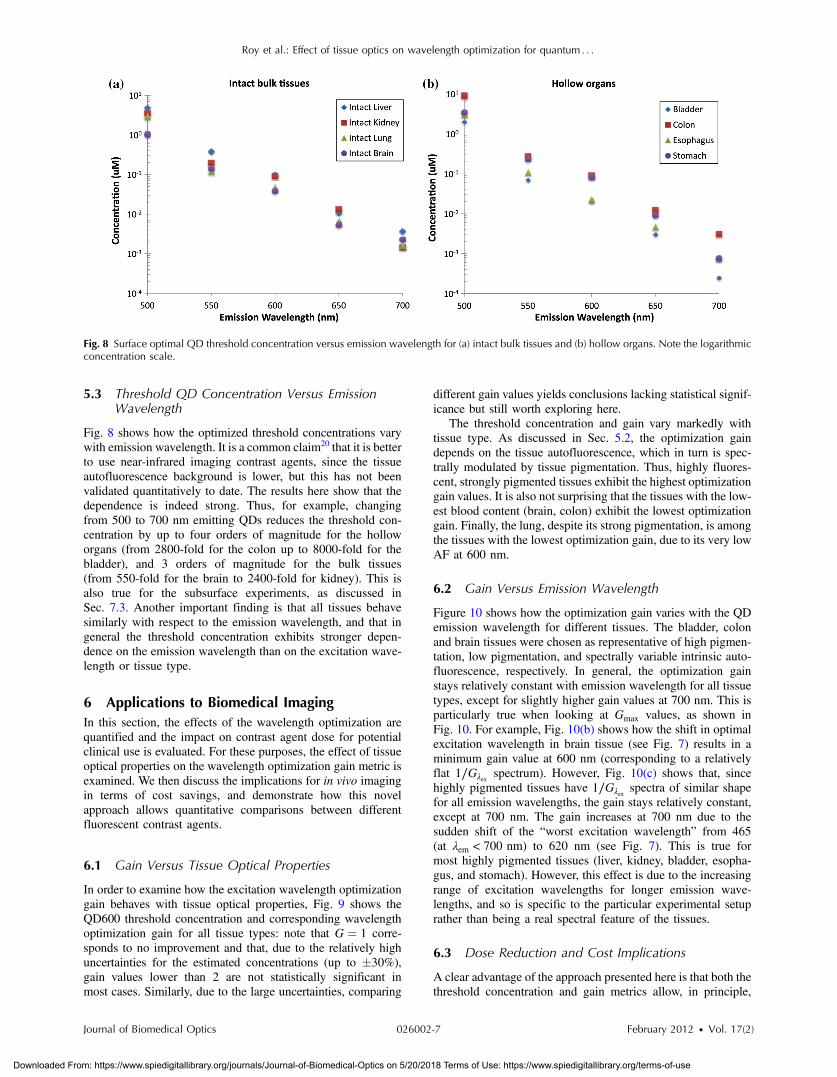
Fig. 8 shows how the optimized threshold concentrations varywith emission wavelength. It is a common claim20 that it is betterto use near-infrared imaging contrast agents, since the tissueautofluorescence background is lower, but this has not beenvalidated quantitatively to date. The results here show that thedependence is indeed strong. Thus, for example, changingfrom 500 to 700 nm emitting QDs reduces the threshold con-centration by up to four orders of magnitude for the holloworgans (from 2800-fold for the colon up to 8000-fold for thebladder), and 3 orders of magnitude for the bulk tissues(from 550-fold for the brain to 2400-fold for kidney). This isalso true for the subsurface experiments, as discussed inSec. 7.3. Another important finding is that all tissues behavesimilarly with respect to the emission wavelength, and that ingeneral the threshold concentration exhibits stronger depen-dence on the emission wavelength than on the excitation wave-length or tissue type.
6 Applications to Biomedical ImagingIn this section, the effects of the wavelength optimization arequantified and the impact on contrast agent dose for potentialclinical use is evaluated. For these purposes, the effect of tissueoptical properties on the wavelength optimization gain metric isexamined. We then discuss the implications for in vivo imagingin terms of cost savings, and demonstrate how this novelapproach allows quantitative comparisons between differentfluorescent contrast agents.
6.1 Gain Versus Tissue Optical Properties
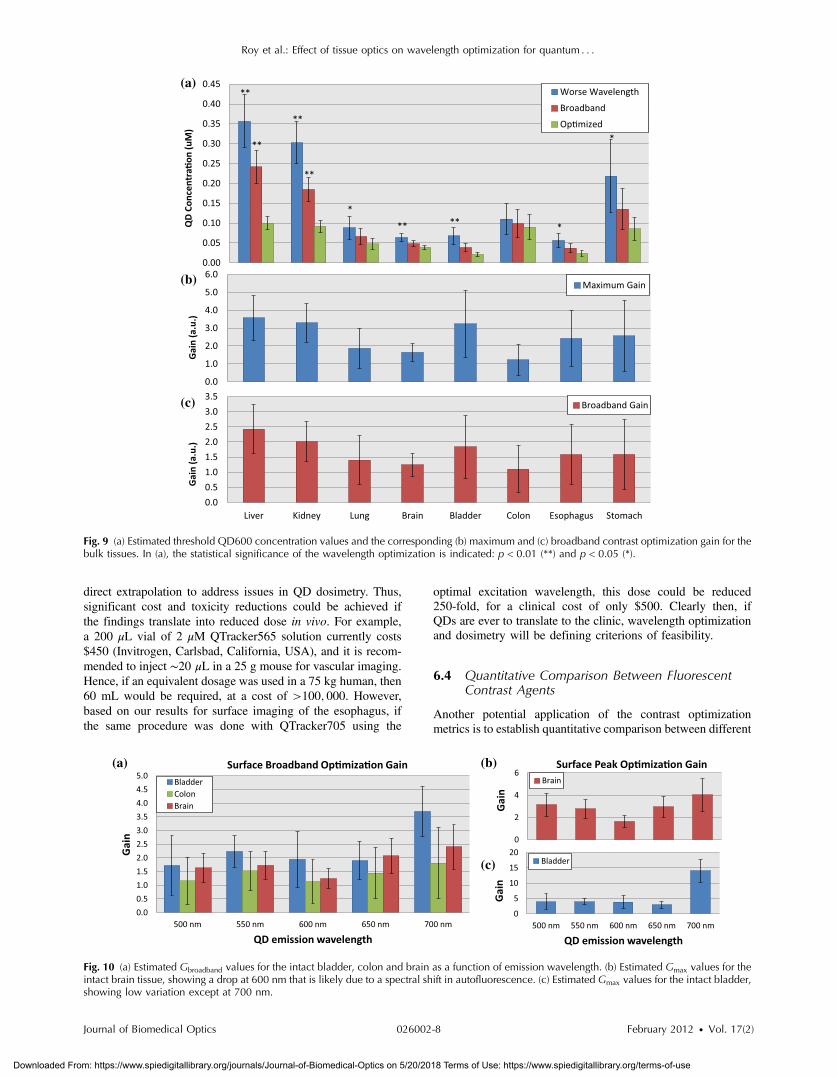
In order to examine how the excitation wavelength optimizationgain behaves with tissue optical properties, Fig. 9 shows theQD600 threshold concentration and corresponding wavelengthoptimization gain for all tissue types: note that G ¼ 1 corre-sponds to no improvement and that, due to the relatively highuncertainties for the estimated concentrations (up to �30%),gain values lower than 2 are not statistically significant inmost cases. Similarly, due to the large uncertainties, comparing
different gain values yields conclusions lacking statistical signif-icance but still worth exploring here.
The threshold concentration and gain vary markedly withtissue type. As discussed in Sec. 5.2, the optimization gaindepends on the tissue autofluorescence, which in turn is spec-trally modulated by tissue pigmentation. Thus, highly fluores-cent, strongly pigmented tissues exhibit the highest optimizationgain values. It is also not surprising that the tissues with the low-est blood content (brain, colon) exhibit the lowest optimizationgain. Finally, the lung, despite its strong pigmentation, is amongthe tissues with the lowest optimization gain, due to its very lowAF at 600 nm.
6.2 Gain Versus Emission Wavelength
Figure 10 shows how the optimization gain varies with the QDemission wavelength for different tissues. The bladder, colonand brain tissues were chosen as representative of high pigmen-tation, low pigmentation, and spectrally variable intrinsic auto-fluorescence, respectively. In general, the optimization gainstays relatively constant with emission wavelength for all tissuetypes, except for slightly higher gain values at 700 nm. This isparticularly true when looking at Gmax values, as shown inFig. 10. For example, Fig. 10(b) shows how the shift in optimalexcitation wavelength in brain tissue (see Fig. 7) results in aminimum gain value at 600 nm (corresponding to a relativelyflat 1∕Gλex spectrum). However, Fig. 10(c) shows that, sincehighly pigmented tissues have 1∕Gλex spectra of similar shapefor all emission wavelengths, the gain stays relatively constant,except at 700 nm. The gain increases at 700 nm due to thesudden shift of the “worst excitation wavelength” from 465(at λem < 700 nm) to 620 nm (see Fig. 7). This is true formost highly pigmented tissues (liver, kidney, bladder, esopha-gus, and stomach). However, this effect is due to the increasingrange of excitation wavelengths for longer emission wave-lengths, and so is specific to the particular experimental setuprather than being a real spectral feature of the tissues.
6.3 Dose Reduction and Cost Implications
A clear advantage of the approach presented here is that both thethreshold concentration and gain metrics allow, in principle,
Fig. 8 Surface optimal QD threshold concentration versus emission wavelength for (a) intact bulk tissues and (b) hollow organs. Note the logarithmicconcentration scale.
Roy et al.: Effect of tissue optics on wavelength optimization for quantum : : :
Journal of Biomedical Optics 026002-7 February 2012 • Vol. 17(2)
Downloaded From: https://www.spiedigitallibrary.org/journals/Journal-of-Biomedical-Optics on 5/20/2018 Terms of Use: https://www.spiedigitallibrary.org/terms-of-use
direct extrapolation to address issues in QD dosimetry. Thus,significant cost and toxicity reductions could be achieved ifthe findings translate into reduced dose in vivo. For example,a 200 μL vial of 2 μM QTracker565 solution currently costs$450 (Invitrogen, Carlsbad, California, USA), and it is recom-mended to inject ∼20 μL in a 25 g mouse for vascular imaging.Hence, if an equivalent dosage was used in a 75 kg human, then60 mL would be required, at a cost of >100; 000. However,based on our results for surface imaging of the esophagus, ifthe same procedure was done with QTracker705 using the
optimal excitation wavelength, this dose could be reduced250-fold, for a clinical cost of only $500. Clearly then, ifQDs are ever to translate to the clinic, wavelength optimizationand dosimetry will be defining criterions of feasibility.
6.4 Quantitative Comparison Between FluorescentContrast Agents
Another potential application of the contrast optimizationmetrics is to establish quantitative comparison between different
(b)
(c)
(a)
Fig. 10 (a) Estimated Gbroadband values for the intact bladder, colon and brain as a function of emission wavelength. (b) Estimated Gmax values for theintact brain tissue, showing a drop at 600 nm that is likely due to a spectral shift in autofluorescence. (c) Estimated Gmax values for the intact bladder,showing low variation except at 700 nm.
(a)
(b)
(c)
Fig. 9 (a) Estimated threshold QD600 concentration values and the corresponding (b) maximum and (c) broadband contrast optimization gain for thebulk tissues. In (a), the statistical significance of the wavelength optimization is indicated: p < 0.01 (**) and p < 0.05 (*).
Roy et al.: Effect of tissue optics on wavelength optimization for quantum : : :
Journal of Biomedical Optics 026002-8 February 2012 • Vol. 17(2)
Downloaded From: https://www.spiedigitallibrary.org/journals/Journal-of-Biomedical-Optics on 5/20/2018 Terms of Use: https://www.spiedigitallibrary.org/terms-of-use
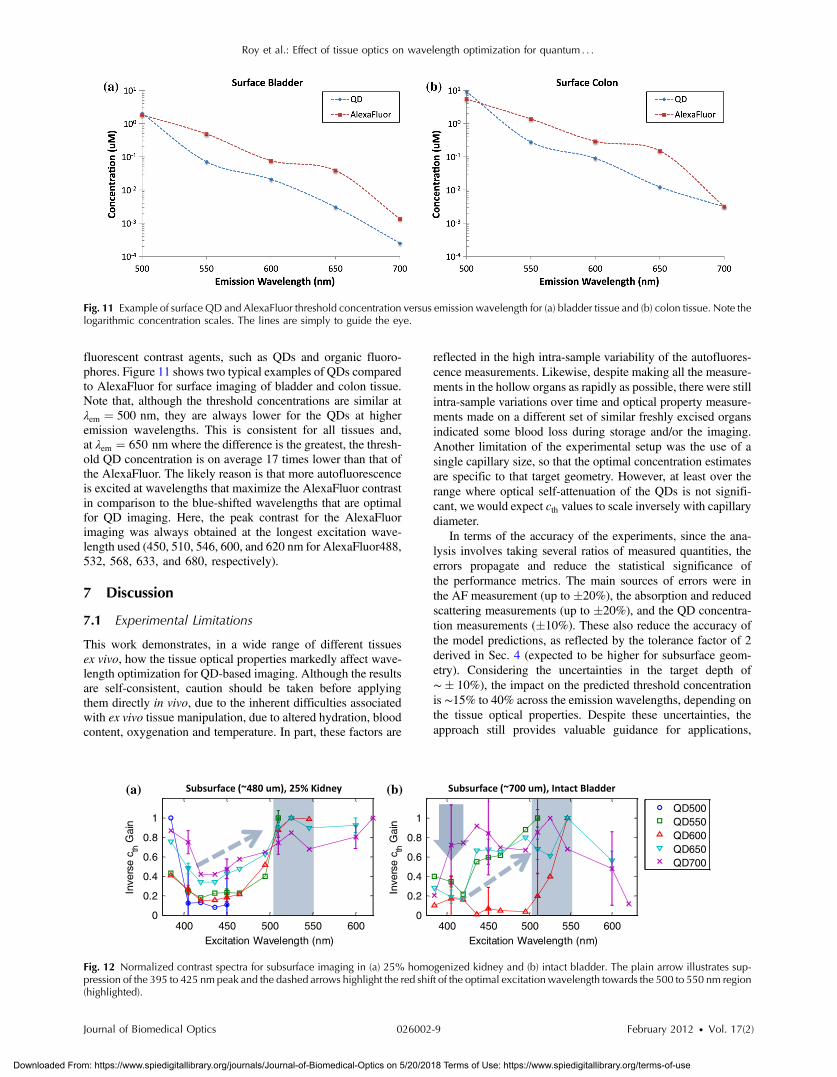
fluorescent contrast agents, such as QDs and organic fluoro-phores. Figure 11 shows two typical examples of QDs comparedto AlexaFluor for surface imaging of bladder and colon tissue.Note that, although the threshold concentrations are similar atλem ¼ 500 nm, they are always lower for the QDs at higheremission wavelengths. This is consistent for all tissues and,at λem ¼ 650 nm where the difference is the greatest, the thresh-old QD concentration is on average 17 times lower than that ofthe AlexaFluor. The likely reason is that more autofluorescenceis excited at wavelengths that maximize the AlexaFluor contrastin comparison to the blue-shifted wavelengths that are optimalfor QD imaging. Here, the peak contrast for the AlexaFluorimaging was always obtained at the longest excitation wave-length used (450, 510, 546, 600, and 620 nm for AlexaFluor488,532, 568, 633, and 680, respectively).
7 Discussion
7.1 Experimental Limitations
This work demonstrates, in a wide range of different tissuesex vivo, how the tissue optical properties markedly affect wave-length optimization for QD-based imaging. Although the resultsare self-consistent, caution should be taken before applyingthem directly in vivo, due to the inherent difficulties associatedwith ex vivo tissue manipulation, due to altered hydration, bloodcontent, oxygenation and temperature. In part, these factors are
reflected in the high intra-sample variability of the autofluores-cence measurements. Likewise, despite making all the measure-ments in the hollow organs as rapidly as possible, there were stillintra-sample variations over time and optical property measure-ments made on a different set of similar freshly excised organsindicated some blood loss during storage and/or the imaging.Another limitation of the experimental setup was the use of asingle capillary size, so that the optimal concentration estimatesare specific to that target geometry. However, at least over therange where optical self-attenuation of the QDs is not signifi-cant, we would expect cth values to scale inversely with capillarydiameter.
In terms of the accuracy of the experiments, since the ana-lysis involves taking several ratios of measured quantities, theerrors propagate and reduce the statistical significance ofthe performance metrics. The main sources of errors were inthe AF measurement (up to �20%), the absorption and reducedscattering measurements (up to �20%), and the QD concentra-tion measurements (�10%). These also reduce the accuracy ofthe model predictions, as reflected by the tolerance factor of 2derived in Sec. 4 (expected to be higher for subsurface geom-etry). Considering the uncertainties in the target depth of∼� 10%), the impact on the predicted threshold concentrationis ∼15% to 40% across the emission wavelengths, depending onthe tissue optical properties. Despite these uncertainties, theapproach still provides valuable guidance for applications,
Fig. 11 Example of surface QD and AlexaFluor threshold concentration versus emission wavelength for (a) bladder tissue and (b) colon tissue. Note thelogarithmic concentration scales. The lines are simply to guide the eye.
400 450 500 550 6000
0.2
0.4
0.6
0.8
1
Excitation Wavelength (nm)
Inve
rse
c th G
ain
400 450 500 550 6000
0.2
0.4
0.6
0.8
1
Excitation Wavelength (nm)
Inve
rse
c th G
ain
QD500QD550QD600QD650QD700
(a) (b)
Fig. 12 Normalized contrast spectra for subsurface imaging in (a) 25% homogenized kidney and (b) intact bladder. The plain arrow illustrates sup-pression of the 395 to 425 nm peak and the dashed arrows highlight the red shift of the optimal excitation wavelength towards the 500 to 550 nm region(highlighted).
Roy et al.: Effect of tissue optics on wavelength optimization for quantum : : :
Journal of Biomedical Optics 026002-9 February 2012 • Vol. 17(2)
Downloaded From: https://www.spiedigitallibrary.org/journals/Journal-of-Biomedical-Optics on 5/20/2018 Terms of Use: https://www.spiedigitallibrary.org/terms-of-use
considering the significant excitation wavelength optimizationgain values (up to 20-fold) and the even larger benefits ofusing optimum emission wavelengths.
7.2 Modeling
Although the Monte Carlo model predictions were accurateacross a wide parameter space, there were some problematiccases. As discussed, it is likely that the discrepancies are dueto experimental factors, rather than the model breaking down.However, one clear limitation is that the tissue is modeled asa single homogenous layer. Nevertheless, reasonable agreementwas still obtained even for the hollow organs, given the tolerancefactor used and considering the multiple sources of experimentalerror, but greater precision could likely be achieved using amulti-layered Monte Carlo simulation21,22.
As a simpler alternative to using the threshold concentrationgain as the performance metric of choice, the contrast gain (i.e.,a ratio of TBR values) could be used. These are equivalent aslong as the signal is much higher than the autofluorescence, butwhen the signal is low and comparable to the AF background,the TBR values tend towards 1. This is problematic, since it thenbecomes impossible to differentiate between truly unstructuredTBR spectra, and spectra that simply appear flat due to low sig-nal: e.g., spectra such as those of Fig. 5 would show minimalstructure if the QD concentration was significantly lower. Thechosen optimization metrics do not suffer from this limitation:no matter what QD concentration cQD is used for the measure-ments, cth;best,cth;broad, Gbroadband, Gmax are the same. It is, how-ever, still necessary to know cQD to properly scale the results, asindicated by Eq. (4). Note that all the surface imaging data pre-sented above were acquired under the high signal conditions,and thus the TBR spectra would be equivalent to the presentednormalized contrast. However, this is not the case for the sub-surface data, mostly acquired in low signal conditions.
7.3 Impact of Target Depth
As mentioned in Secs. 2.2 and 4.2, subsurface imaging was per-formed for all tissue samples, but, for the sake of brevity, theresults are not reported above, since this was examined in detailin phantoms and homogenized tissues previously10 and, asnoted, most subsurface measurements suffered from lack ofQD signal due to strong tissue attenuation, as considered
elsewhere.23 Despite this suboptimal data quality, it was stillpossible to identify and confirm general trends on the effectof depth on wavelength optimization. Thus, in our previouswork, we reported a local maximum at 500 to 550 nm (corre-sponding to a second hemoglobin absorption peak) in additionto the main 395 to 425 nm optimization window. It was sug-gested that the latter would not be sustained at depth due tothe high QD signal attenuation, resulting in red shift of the opti-mal excitation wavelength in favor of the secondary peak. Thistrend was confirmed here: the 500 to 550 nm local maximumwas observed in almost all cases for surface imaging (Fig. 7),and the red shift towards 500 to 550 nm was also seen in mostsubsurface cases, as shown in Fig. 12.
The subsurface measurements performed on hollow organsalso allowed the effect of depth on the estimated threshold QDconcentrations to be quantified. In general, the subsurface cth;bestversus λem curves were parallel to the surface imaging data,suggesting little influence of the emission wavelength on signalattenuation, especially at longer wavelengths (data not shown).The attenuation factor was mostly driven by the tissue thicknessand absorption coefficient at the optimal excitation wavelength.The increase in threshold concentration from surface to subsur-face (for both QDs and AlexaFluor) ranged from ∼10 for thecolon (the thinnest and least pigmented tissue) to ∼100 forthe stomach (thickest).
7.4 Other Factors
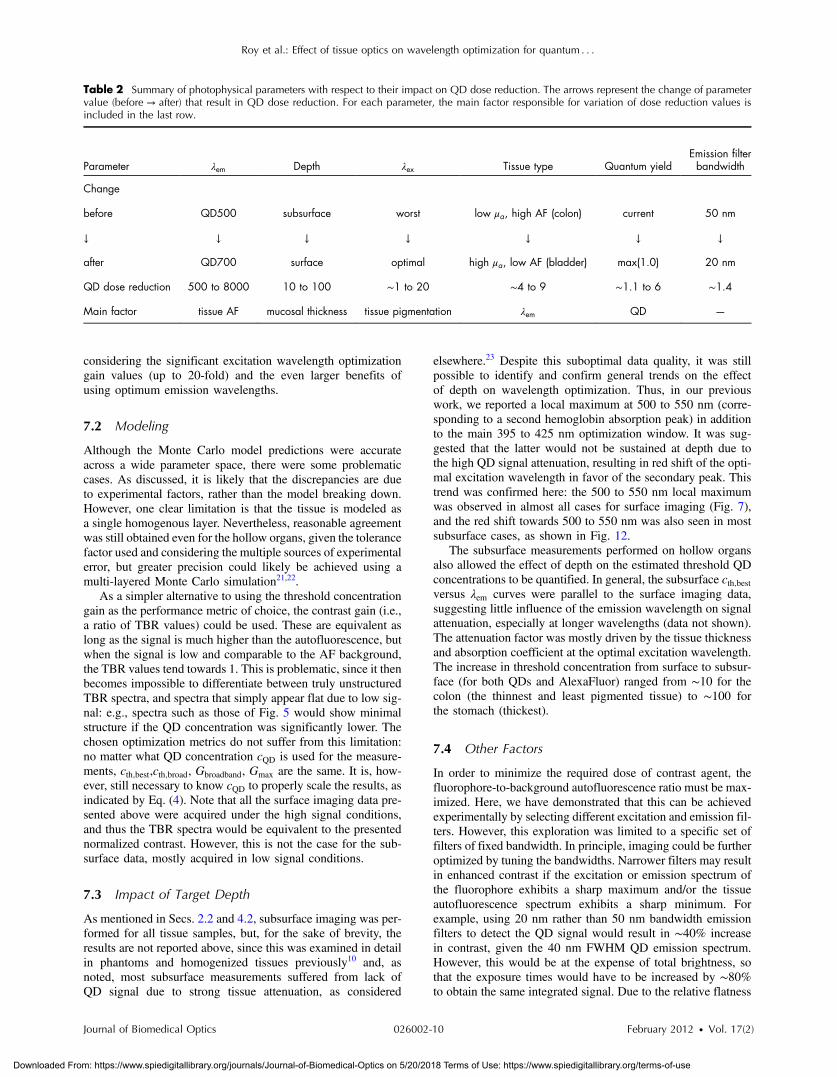
In order to minimize the required dose of contrast agent, thefluorophore-to-background autofluorescence ratio must be max-imized. Here, we have demonstrated that this can be achievedexperimentally by selecting different excitation and emission fil-ters. However, this exploration was limited to a specific set offilters of fixed bandwidth. In principle, imaging could be furtheroptimized by tuning the bandwidths. Narrower filters may resultin enhanced contrast if the excitation or emission spectrum ofthe fluorophore exhibits a sharp maximum and/or the tissueautofluorescence spectrum exhibits a sharp minimum. Forexample, using 20 nm rather than 50 nm bandwidth emissionfilters to detect the QD signal would result in ∼40% increasein contrast, given the 40 nm FWHM QD emission spectrum.However, this would be at the expense of total brightness, sothat the exposure times would have to be increased by ∼80%to obtain the same integrated signal. Due to the relative flatness
Table 2 Summary of photophysical parameters with respect to their impact on QD dose reduction. The arrows represent the change of parametervalue (before → after) that result in QD dose reduction. For each parameter, the main factor responsible for variation of dose reduction values isincluded in the last row.
Parameter λem Depth λex Tissue type Quantum yieldEmission filterbandwidth
Change
before QD500 subsurface worst low μa, high AF (colon) current 50 nm
↓ ↓ ↓ ↓ ↓ ↓ ↓
after QD700 surface optimal high μa, low AF (bladder) max(1.0) 20 nm
QD dose reduction 500 to 8000 10 to 100 ∼1 to 20 ∼4 to 9 ∼1.1 to 6 ∼1.4
Main factor tissue AF mucosal thickness tissue pigmentation λem QD —
Roy et al.: Effect of tissue optics on wavelength optimization for quantum : : :
Journal of Biomedical Optics 026002-10 February 2012 • Vol. 17(2)
Downloaded From: https://www.spiedigitallibrary.org/journals/Journal-of-Biomedical-Optics on 5/20/2018 Terms of Use: https://www.spiedigitallibrary.org/terms-of-use
of the QD excitation spectra, there would not be significantgains in narrowing the excitation filters, unless the autofluores-cence spectrum exhibits a sharp minimum for some specific tis-sue. In contrast, due to their narrower excitation spectra andsmaller Stokes shift, fine-tuning the filter bandwidths and cen-tral wavelengths would improve the image contrast by up to250% for the AlexaFluor dyes.
Finally, another way to further reduce the threshold concen-tration would be to increase the quantum yield of the fluoro-phores. Since the quantum efficiency of the QDs used hereranged from 0.16 to 0.92, the potential improvement wouldnot exceed a factor 6. A summary of the different parametersand their estimated impact on dose reduction is shown in Table 2.
8 ConclusionsThe contrast optimization approach developed previously10 hasbeen extended and validated here against a range of bulk tissuesof different optical properties and samples from hollow organsthat are more directly relevant to endoscopic imaging. The over-all approach appears to be valid over a broad range of tissueoptical properties, the discrepancies being most likely due toexperimental limitations. Using direct measurements of thetissue autofluorescence, the model accurately predicts the opti-mal excitation wavelength within 10 nm and the thresholdconcentrations within a factor 2 in over 80% of the cases.This should provide meaningful guidance for optimizing clinicalapplications.
Although no single optimum excitation wavelength appliesto all tissues, major trends have been identified. Since theexcitation spectrum of QDs is relatively flat, the optimal excita-tion wavelength always corresponds to a minimum in the tissueautofluorescence spectrum. Most of the tissues share commonminima around 400 to 420 nm and 510 to 550 nm in AF thatcorrespond to hemoglobin absorption peaks. Multiplexed QDimaging should be straightforward for these tissues, sincethere is no significant shift in optimal excitation regardless ofthe emission wavelength used, i.e., of the QDs. However,other tissues (e.g., lung and brain) exhibit AF spectral featuresthat do not correlate well with blood absorption. This results inred-shifted optimal excitation for longer emission wavelengths,thus making multiplexed QD imaging harder to achieve.
With regard to contrast-optimization, the following conclu-sions can be drawn. Firstly, the most important parameter toconsider is the emission wavelength, i.e., the QD used, sincea shift of 200 nm (e.g., from 500 to 700 nm) reduces the requiredthreshold QD concentration by orders of magnitude. Secondly,depending on the tissue and QD emission wavelength, optimiz-ing the excitation wavelength also yields reductions in QDthreshold concentration by up to 20-fold: for all tissues on aver-age the excitation wavelength optimization gain values wereGmax ¼ 5.0 and Gbroadband ¼ 1.9. Finally, fine-tuning the filterbandwidth may yield an extra 50% contrast. In a clinical con-text, these results could have a significant impact, since theycould potentially reduce the required dose of a promisingcontrast agent below toxic levels. Furthermore, a reduction ofcontrast agent dose directly translates into cost savings,which are substantial considering the cost of commercial QDs,even without the added cost of molecular targeting.
A broad caveat is that the actual values of the wavelength opti-mization gain found here may not directly translate into equiva-lent dose reductions in vivo. For example, in vascular imaging, the
contrast agent is colocalized with blood, so that light absorptionby blood may have an enhanced effect on both the signal andbackground. This needs to be tested and included in a full opti-mization model, and a follow-up study using an in vivo murinedorsal skin fold window chamber model is in progress to establishquantitative relationships between the injected QD dose, the intra-vascular QD concentration and the vessel-to-background imagecontrast. More importantly, these experiments will investigatehow wavelength optimization affects the injected dose in compar-ison with the results presented here. In addition, this in vivoworkwill serve as a platform to further validate the contrast optimiza-tion model in a complex, dynamic environment that is relativelyimmune to the unavoidable tissue artifacts ex vivo (blood loss anddeoxygenation, tissue degradation). Finally, it will also be impor-tant to follow up with more detailed studies in the endoscopicallyrelevant subsurface geometry.
AcknowledgmentsThis work was supported by the Canadian Institutes of HealthResearch (CIHR #RMF-72551). M. Roy and A. Kim alsoreceived financial support from the Natural Sciences and Engi-neering Research Council of Canada. Infrastructure support wasprovided by the Ontario Ministry of Health and Long TermCare: the opinions expressed do not necessarily represent thoseof OMHLTC. The authors would like to acknowledge Dawei Liand Dr. Wen Jiang and Dr. Warren Chan for providing QDs andQD-related information.
References1. I. L. Medintz et al., “Quantum dot bioconjugates for imaging, labelling
and sensing,” Nat. Mater. 4(6), 435–446 (2005).2. W. C. Chan et al., “Luminescent quantum dots for multiplexed biolo-
gical detection and imaging,” Curr. Opin. Biotechnol. 13(1), 40–46(2002).
3. P. Diagaradjane et al., “Imaging epidermal growth factor receptorexpression in vivo: pharmacokinetic and biodistribution characterizationof a bioconjugated quantum dot nanoprobe,” Clin. Cancer Res. 14(3),731–741 (2008).
4. S. Kim et al., “Near-infrared fluorescent type II quantum dots for sen-tinel lymph node mapping,” Nat. Biotechnol. 22(1), 93–97 (2004).
5. N. Lewinski, V. Colvin, and R. Drezek, “Cytotoxicity of nanoparticles,”Small 4(1), 26–49 (2008).
6. M. Roy and B. C. Wilson, “Molecular imaging with targeted quantumdot bioconjugates: the need for contrast optimisation studies,” Int. J.Nanotechnol. 6(5–6), 442–455 (2009).
7. Y. T. Lim et al., “Selection of quantum dot wavelengths for biomedicalassays and imaging,” Mol. Imaging 2(1), 50–64 (2003).
8. M. Roy and B. C. Wilson, “An accurate homogenized tissue phantomfor broad spectrum autofluorescence studies: a tool for optimizing quan-tum dot-based contrast agents,” Proc. SPIE 6870, 68700E (2008).
9. M. G. Muller et al., “Intrinsic fluorescence spectroscopy in turbidmedia: disentangling effects of scattering and absorption,” Appl. Opt.40(25), 4633–4646 (2001).
10. M. Roy et al., “Homogenized tissue phantoms for quantitative evalua-tion of subsurface fluorescence contrast,” J. Biomed. Opt. 16(1), 016013(2011).
11. B. O. Dabbousi et al., “(CdSe)ZnS core-shell quantum dots: synthesisand characterization of a size series of highly luminescent nanocrystal-lites,” J. Phys. Chem. B 101(46), 9463–9475 (1997).
12. W. W. Yu et al., “Experimental determination of the extinction coeffi-cient of CdTe, CdSe, and CdS nanocrystals,” Chemistry of Materials 15(14), 2854–2860 (2003).
13. G. L. Rapaccini et al., “Gastric wall thickness in normal and neoplasticsubjects: a prospective study performed by abdominal ultrasound,”Gastrointest. Radiol. 13(3), 197–199 (1988).
Roy et al.: Effect of tissue optics on wavelength optimization for quantum : : :
Journal of Biomedical Optics 026002-11 February 2012 • Vol. 17(2)
Downloaded From: https://www.spiedigitallibrary.org/journals/Journal-of-Biomedical-Optics on 5/20/2018 Terms of Use: https://www.spiedigitallibrary.org/terms-of-use
14. A. H. Blatt, J. Titus, and L. Chan, “Ultrasound measurement of bladderwall thickness in the assessment of voiding dysfunction,” J. Urol.179(6), 2275–2278 discussion 2278–2279 (2008).
15. E. J. Mac Sweeney et al., “Relation of thickening of colon wall topancreatic-enzyme treatment in cystic fibrosis,” Lancet 345(8952),752–756 (1995).
16. F. Xia et al., “Observation of normal appearance and wall thickness ofesophagus on CT images,” Eur. J. Radiol. 72(3), 406–411 (2009).
17. A. Kim et al., “A fiberoptic reflectance probe with multiple source-col-lector separations to increase the dynamic range of derived tissue opticalabsorption and scattering coefficients,” Opt. Express 18(6), 5580–5594(2010).
18. R. T. Zaman et al., “Variation of fluorescence in tissue with tempera-ture,” Lasers Surg. Med. 43(1), 36–42 (2011).
19. R. S. DaCosta, H. Andersson, and B. C. Wilson, “Molecular fluores-cence excitation-emission matrices relevant to tissue spectroscopy,”Photochem. Photobiol. 78(4), 384–392 (2003).
20. X. Gao et al., “In vivo molecular and cellular imaging with quantumdots,” Curr. Opin. Biotechnol. 16(1), 63–72 (2005).
21. E. Pery et al., “Monte Carlo modeling of multilayer phantoms with mul-tiple fluorophores: simulation algorithm and experimental validation,”J. Biomed. Opt. 14(2), 024048 (2009).
22. J. Swartling et al., “Accelerated Monte Carlo models to simulate fluo-rescence spectra from layered tissues,” J. Opt. Soc. Am. A. Opt. ImageSci. Vis. 20(4), 714–727 (2003).
23. M. Roy, “Quantitative evaluation of semiconductor nanocrystals as con-trast agents for fluorescence molecular imaging,” inMedical Biophysics,63–72, University of Toronto, Toronto (2011).
24. J. C. Finlay and T. H. Foster, “Effect of pigment packaging on diffusereflectance spectroscopy of samples containing red blood cells,”Opt. Lett. 29(9), 965–967 (2004).5
25. A. E. Burgess, “The Rose model, revisited,” J. Opt. Soc. Am. A Opt.Image Sci. Vis. 16(3), 633–646 (1999).
Roy et al.: Effect of tissue optics on wavelength optimization for quantum : : :
Journal of Biomedical Optics 026002-12 February 2012 • Vol. 17(2)
Downloaded From: https://www.spiedigitallibrary.org/journals/Journal-of-Biomedical-Optics on 5/20/2018 Terms of Use: https://www.spiedigitallibrary.org/terms-of-use