effect of shear wall area on seismic behavior of multi storied buildings with soft story at ground...
TRANSCRIPT

15
International Journal of Research and Innovation (IJRI)
International Journal of Research and Innovation (IJRI)
EFFECT OF SHEAR WALL AREA ON SEISMIC BEHAVIOR OF MULTI STORIED BUILDINGS WITH SOFT STORY AT GROUND
FLOOR
Mohammed Asra Jabeen 1, Mrs. K. Mythili2, Mr. Hashim Mohiuddin3
1 Research Scholar, Department Of Civil Engineering, Aurora's Scientific Technological & Research Academy, Hyderabad, India2 Associate professor , Department Of Civil Engineering, Aurora's Scientific Technological & Research Academy, Hyderabad, India3 professor , Department Of Civil Engineering, Aurora's Scientific Technological & Research Academy, Hyderabad, India
*Corresponding Author:
Mohammed Asra Jabeen, Research Scholar, Department Of Civil Engineering, Aurora's Scientific Technological & Research Academy, Hyderabad, India
Published: October 25, 2014Review Type: peer reviewedVolume: I, Issue : IICitation: Mohammed Asra Jabeen, Research Scholar (2014) EFFECT OF SHEAR WALL AREA ON SEISMIC BEHAVIOR OF MULTI STORIED BUILDINGS WITH SOFT STORY AT GROUND FLOOR
INTRODUCTION
General
In the last few decades, structural walls have been used extensively in countries especially where high
seismic risk is observed. The major factors for in-clusion of structural walls are ability to minimize lateral drifts, simplicity of design and excellent per-formance in past earthquakes. Recent earthquakes were beneficial in better understanding the behavior and observing the seismic performance of structur-al walls. As a matter of fact, the term “Shear wall” is incomplete to define the structural attributes of the walls since they resist not only the Shear force dur-ing a Seismic action. Therefore, the term “Structural wall” is used interchangeably with the term “Shear wall” throughout the study.
Structural walls are designed to resist gravity loads and overturning moments as well as shear forces. They have very large in-plane stiffness that limit the amount of lateral drift of the building under lateral loadings. Structural walls are intended to behave elastically during wind loading and low to moder-
Abstract
The advances in three-dimensional structural analysis and computing resources have allowed the efficient and safe design of increasingly taller structures. These structures are the consequence of increasing urban densification and economic viability. The trend towards progressively taller structures has demanded a shift from the traditional strength based design approach of buildings to a focus on constraining the overall mo-tion of the structure. Structural engineers have responded to this challenge of lateral control with a myriad of systems that achieve motion control while adhering to the overall architectural vision.Reinforced Concrete (RC) wall-frame buildings are widely recommended for urban construction in areas with high seismic hazard. Presence of structural walls imparts a large stiffness to the lateral-force resisting system of the building. Proper detailing of walls can also lead to ductile behavior of such structures during strong earthquake shaking. One of the major parameters influencing the seismic behavior of wall-frame buildings is the wall-area ratio. Thus shear wall area ratio is set as a key parameter which needs to be in-vestigated in this analytical study.An analytical study is performed to evaluate the effect of shear wall area ratio to floor area ratio on the seismic behavior of multistoried RC structures with soft story at ground floor. For this purpose, 12 build-ing models that have Five, Eight and Twelve stories and shear wall area ratios ranging between 0.70 and 1.31% in both directions are generated. Then, the behavior of these building models under earthquake load-ing is examined by carrying out Response Spectrum Analysis and Linear Time History Analysis, by using structural analysis software called E-TABS. Response Spectrum Analysis is done according to seismic code IS 1893:2002.Time History Analysis is carried out by considering the three ground motion records namely Bhuj, Chamba and Uttarkasi. The Main parameters considered in this study is the relationship between SW area and Base shear , Relationship between SW Area and. Roof drift , Story drift and Inter story drift. The analytical result indicates that at least 0.91% shear wall ratio should be provided in the design of mul-tistoried buildings to control the drift. In addition, when the shear wall ratio increases beyond 1.11%, it is observed that the improvement of the seismic performance is not as significant.
Key words: Reinforced concrete; Earthquake-resistant structures; Shear walls; Response Spectrum Analy-sis; linear Time History analysis;
1401-1402

16
International Journal of Research and Innovation (IJRI)
ate seismic loading to prevent non-structural dam-age in the building. However, it is expected that the walls will be exposed to inelastic deformation during less frequent, severe earthquakes. Therefore, struc-tural walls must be designed to withstand forces that cause inelastic deformations while maintain-ing their ability to carry load and dissipate energy. Structural and non-structural damage is expected during severe earthquakes however, collapse pre-vention and life safety is the main concern in the design.
Need For The Present Investigation:
Since stilt type framed structures are widely adopted in India, there is a need to study the seis-mic behavior of such structures with shear wall frame systems. Alternative measures need to be adopted for this specific situation. The under-lying principle to this problem is (a) increasing the stiff-ness of the first storey such that the first storey is at least 50% stiff as that second storey, and (b) provid-ing adequate strength in the first storey. The possi-ble schemes to achieve the above are (i) provision of stiffer columns in the first storey, and (ii) provision of a concrete core wall (shear wall) in the building. Thus the present study attempts for the pos-sible way to resist the earthquake loads by provid-ing the shear wall area to floor area ratio on the seismic behavior of multistoried buildings with soft story at the ground floor.
Objectives Of The Study:
The main objective of this study is to inves-tigate the structural behavior of multistoried RC buildings with soft storey at ground floor level hav-ing different shear wall area to floor area ratios un-der earthquake loading and to study the improve-ment in overall behavior with increasing shear wall ratios. The results are obtained by considering Re-sponse Spectrum Analysis and Linear Time History Analysis, to obtain the effect of shear wall area to floor area ratio on the seismic performance of mul-tistoried RC buildings. Basically the Objectives are:
• To study the relationship between Shear wall area (%) and Base shear.• To determine the relationship between Shear wall area (%) and Roof drift.• To find the out storey drifts and inter story drift.
Scope Of The Study:
Three dimensional space frame analysis will be car-ried out for different building models ranging from 5, 8 and 12 stories resting on plain ground under the action of seismic load. Earthquake behavior of these buildings is evaluated by using Response Spec-trum Analysis and Linear Time History Analysis.Response Spectrum Analysis is done according to seismic code IS 1893: 2002 and Time History Analy-sis is carried out by using three ground motion re-cords namely BhujChamba and Uttarkasi ,with the
help of the ETABS Nonlinear version software(CSI Ltd),with increasing shear wall area ratios by con-sidering the ground floor as soft storey.
Methodology
Introduction
Earthquake and its occurrence and meas-urements, its vibration effect and structural re-sponse have been continuously studied for many years in earthquake history and thoroughly docu-mented in literature. Since then the structural en-gineers have tried hard to examine the procedure, with an aim to counter the complex dynamic effect of seismically induced forces in structures, for de-signing of earthquake resistant structures in a re-fined and easy manner. This re-examination and continuous effort has resulted in several revisions of Indian Standard: 1893: (1962, 1966, 1970, 1975, 1984, and 2002) code of practice on the “Criteria for Earthquake Resistant Design of Structures” by the Bureau of Indian Standards (BIS), New Delhi. In order to properly interpret the codes and their revisions, it has become necessary; that the struc-tural engineers must understand the basic design criteria and procedures for determining the later-al forces. Various approaches to seismic analysis have been developed to determine the lateral forces, ranging from purely linear elastic to non-linear in-elastic analysis. Many of the analysis techniques are being used in design and incorporated in codes of practices of many countries. However, this chap-ter is restricted to the method of analysis described or employed in IS 1893 (Part I): 2002 of “Criteria for Earthquake Resistant Design of Structures” essen-tially to buildings although in some cases that may be applied to other types of structures as well.
General Terms
Natural Period (T): Natural period of a structure is its time period of undamped free vibration.Fundamental Natural Period (T1): It is the first ( longest ) modal time period of vibration.Diaphragm: It is a horizontal or nearly horizontal system, which transmits lateral forces to the verti-cal resisting elements, for example, reinforced con-crete floors and horizontal bracing systems.Seismic Mass: It is the seismic weight divided by ac-celeration due to gravity.Seismic Weight (W): It is the total dead load plus ap-propriate amounts of specified imposed load.Centre of Mass: The point through which the result-ant of the masses of a system acts. This point corre-sponds to the centre of gravity of masses of system.Storey Shear: It is the sum of design lateral forces at all levels above the storey under consideration.Zone Factor (Z): It is a factor to obtain the design spectrum depending on the perceived maximum seismic risk characterized by Maximum Considered Earthquake ( MCE ) in the zone in which the struc-ture is located. The basic zone factors included in this standard are reasonable estimate of effective
17
International Journal of Research and Innovation (IJRI)
peak ground acceleration.
Response Spectrum Analysis: It is the representa-tion of the maximum response of idealized single degree freedom system shaving certain period and damping, during earthquake ground motion. The maximum response is plotted against the undamped natural period and for various damping values, and can be expressed in terms of maximum absolute ac-celeration, maximum relative velocity, or maximum relative displacement.
Time History Analysis: It is an analysis of the dy-namic response of the structure at each increment of time, when its base is subjected to a specific ground motion time history.
Soft storey
The essential distinction between a soft story and a weak story is that while a soft story is classi-fied based on stiffness or simply the relative resist-ance to lateral deformation or story drift, the weak story qualifies on the basics of strength in terms of force resistance (statics) or energy capacity (dynam-ics).
It is one in which the lateral stiffness is less than 70 percent of that in the storey above or less than 80 percent of the average lateral stiffness of the three storeys above.
Soft story failure
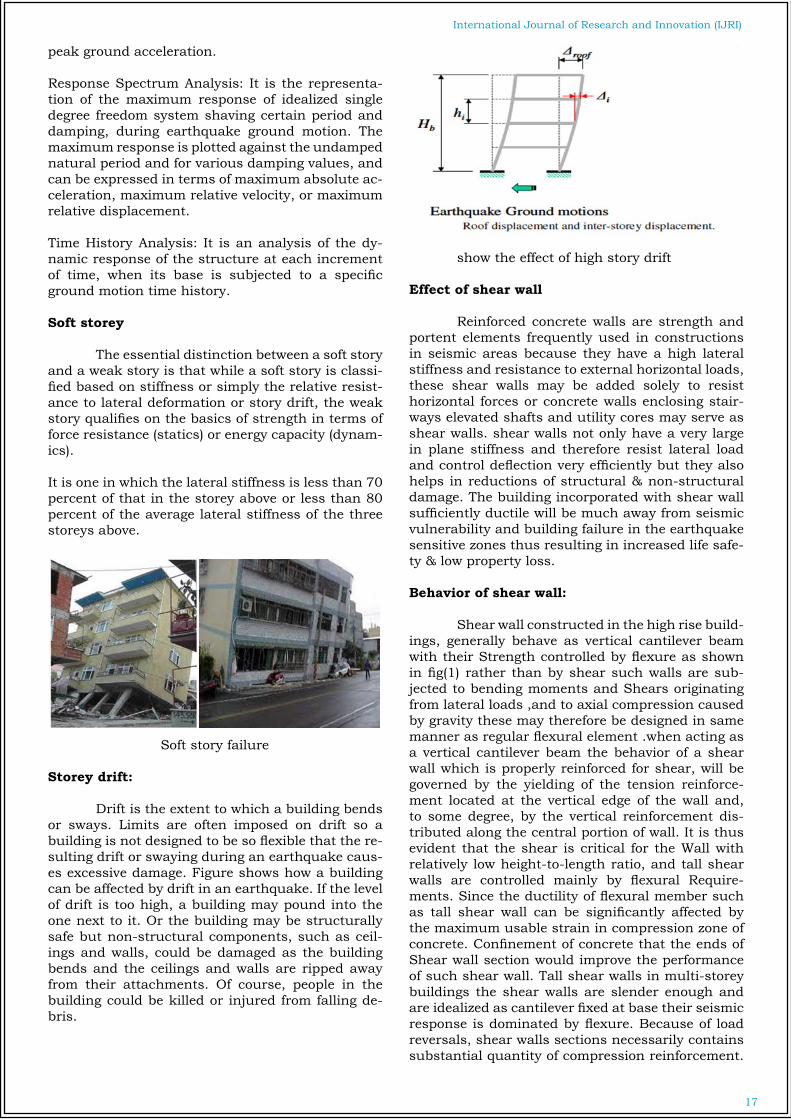
Storey drift:
Drift is the extent to which a building bends or sways. Limits are often imposed on drift so a building is not designed to be so flexible that the re-sulting drift or swaying during an earthquake caus-es excessive damage. Figure shows how a building can be affected by drift in an earthquake. If the level of drift is too high, a building may pound into the one next to it. Or the building may be structurally safe but non-structural components, such as ceil-ings and walls, could be damaged as the building bends and the ceilings and walls are ripped away from their attachments. Of course, people in the building could be killed or injured from falling de-bris.
show the effect of high story drift
Effect of shear wall
Reinforced concrete walls are strength and portent elements frequently used in constructions in seismic areas because they have a high lateral stiffness and resistance to external horizontal loads, these shear walls may be added solely to resist horizontal forces or concrete walls enclosing stair-ways elevated shafts and utility cores may serve as shear walls. shear walls not only have a very large in plane stiffness and therefore resist lateral load and control deflection very efficiently but they also helps in reductions of structural & non-structural damage. The building incorporated with shear wall sufficiently ductile will be much away from seismic vulnerability and building failure in the earthquake sensitive zones thus resulting in increased life safe-ty & low property loss.
Behavior of shear wall:
Shear wall constructed in the high rise build-ings, generally behave as vertical cantilever beam with their Strength controlled by flexure as shown in fig(1) rather than by shear such walls are sub-jected to bending moments and Shears originating from lateral loads ,and to axial compression caused by gravity these may therefore be designed in same manner as regular flexural element .when acting as a vertical cantilever beam the behavior of a shear wall which is properly reinforced for shear, will be governed by the yielding of the tension reinforce-ment located at the vertical edge of the wall and, to some degree, by the vertical reinforcement dis-tributed along the central portion of wall. It is thus evident that the shear is critical for the Wall with relatively low height-to-length ratio, and tall shear walls are controlled mainly by flexural Require-ments. Since the ductility of flexural member such as tall shear wall can be significantly affected by the maximum usable strain in compression zone of concrete. Confinement of concrete that the ends of Shear wall section would improve the performance of such shear wall. Tall shear walls in multi-storey buildings the shear walls are slender enough and are idealized as cantilever fixed at base their seismic response is dominated by flexure. Because of load reversals, shear walls sections necessarily contains substantial quantity of compression reinforcement.

18
International Journal of Research and Innovation (IJRI)
The fig below shows the diagonal tension cracks in tall shear wall and the formation of plastic hinges in the axial compression.
Behavior of shear wall under flexure & formation of plastic hinges
Shear walls are the main vertical structural ele-ments with a dual role of resisting both the gravity and lateral loads. Wall thickness varies from 150 mm to 500 mm, depending on the number of stories, building age, and thermal insulation requirements. In general, these walls are continuous throughout the building height a shear wall may be tall shear wall or low shear wall also known as squat walls characterized by relatively small height-to-length ratio.Methods of Seismic Analysis
Once the structural model has been selected, it is possible to perform analysis to determine the seis-mically induced forces in the structures. There are different methods of analysis which provide dif-ferent degrees of accuracy. The analysis process can be categorized on the basis of three factors: the type of the externally applied loads, the behavior of structure/or structural materials and the type of structural model selected. Based on the type of ex-ternal action and behavior of structure, the analysis can be further classified as linear static analysis, linear dynamic analysis, non linear static analysis, or non-linear dynamic analysis (Beskos and Anag-nostoulos, 1997).
Method of Analysis Process (Syrmakezis, 1996)
Analytical Modeling
Introduction
Most building codes prescribe the method of analysis based on whether the building is regular or irregular. Almost all the codes suggest the use of static analysis for symmetric and selected class of regular buildings. For buildings with irregular configurations, the codes suggest the use of dynam-ic analysis procedures such as response spectrum method or time history analysis.
Seismic codes give different methods to carry out lateral load analysis, while carrying out this analy-sis infill walls present in the structure are normally considered as non structural elements and their presence is usually ignored while analysis and de-sign. However even though they are considered as non-structural elements, they tend to interact with the frame when the structures are subjected to lat-eral loads.
In the present study lateral load analysis is performed on twelve buildings models that have five eight and twelve stories with the same plans but different shear wall area ratios are generated for the application of Response Spectrum and Linear Time history analysis. Response Spectrum Analysis is carried out by using seismic code IS 1893:2002 and Time History Analysis is done by using three ground motion records such as Bhuj, Chamba and Uttaraksi.The Shear wall area ratio is determined by dividing the total shear wall area in one principal direction to the plan area of the ground floor (∑Aw/Ap).In this analytical study, shear wall area ratio of about 0.70, 0.91, 1.11 and 1.31% are selected to investigate the seismic behavior of multistoried RC buildings with ground floor as soft story.
Model IdNumber of
StoriesShear wall ratio %
x-direction Y-direction
1 5 0.70 0.70
2 5 0.91 0.91
3 5 1.11 1.11
4 5 1.31 1.31
5 8 0.70 0.70
6 8 0.91 0.91
7 8 1.11 1.11
8 8 1.31 1.31
9 12 0.70 0.70
10 12 0.91 0.91
11 12 1.11 1.11
12 12 1.31 1.31
Description of Building Models
19
International Journal of Research and Innovation (IJRI)
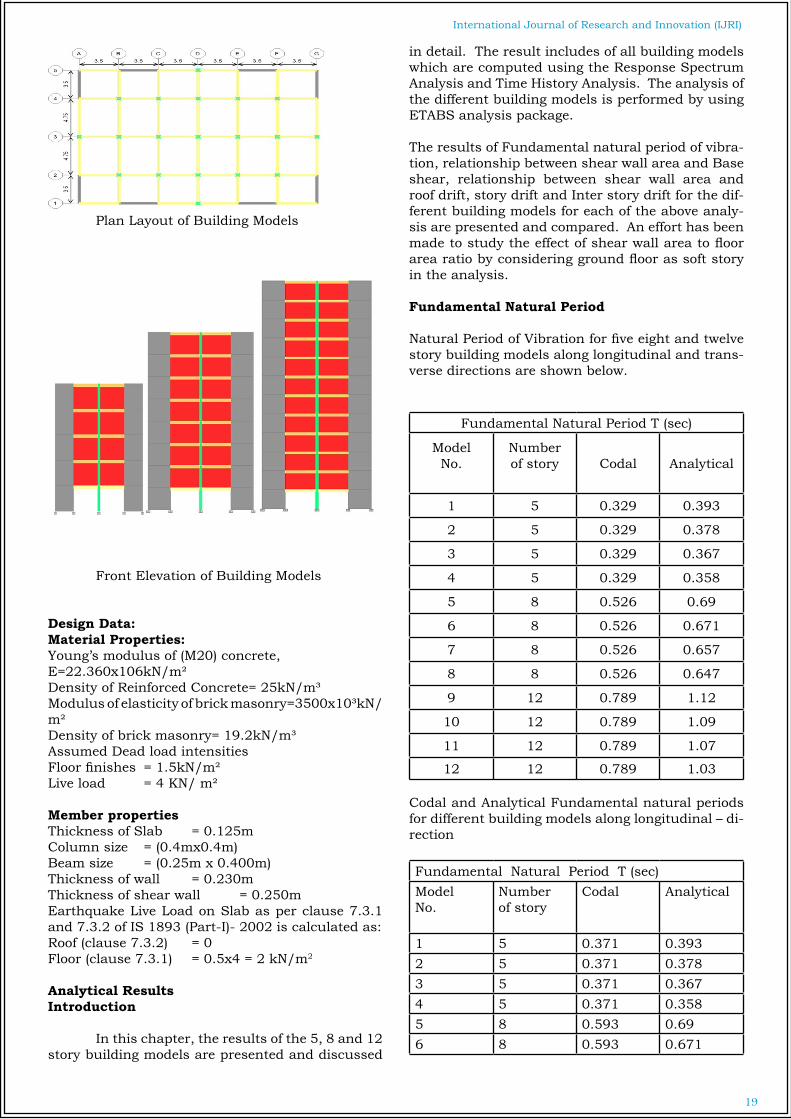
Plan Layout of Building Models
Front Elevation of Building Models
Design Data:Material Properties:Young’s modulus of (M20) concrete, E=22.360x10⁶kN/m²Density of Reinforced Concrete= 25kN/m³Modulus of elasticity of brick masonry=3500x10³kN/m²Density of brick masonry= 19.2kN/m³Assumed Dead load intensitiesFloor finishes = 1.5kN/m²Live load = 4 KN/ m²
Member propertiesThickness of Slab = 0.125mColumn size = (0.4mx0.4m)Beam size = (0.25m x 0.400m)Thickness of wall = 0.230mThickness of shear wall = 0.250mEarthquake Live Load on Slab as per clause 7.3.1 and 7.3.2 of IS 1893 (Part-I)- 2002 is calculated as:Roof (clause 7.3.2) = 0Floor (clause 7.3.1) = 0.5x4 = 2 kN/m2
Analytical ResultsIntroduction
In this chapter, the results of the 5, 8 and 12 story building models are presented and discussed
in detail. The result includes of all building models which are computed using the Response Spectrum Analysis and Time History Analysis. The analysis of the different building models is performed by using ETABS analysis package.
The results of Fundamental natural period of vibra-tion, relationship between shear wall area and Base shear, relationship between shear wall area and roof drift, story drift and Inter story drift for the dif-ferent building models for each of the above analy-sis are presented and compared. An effort has been made to study the effect of shear wall area to floor area ratio by considering ground floor as soft story in the analysis.
Fundamental Natural Period
Natural Period of Vibration for five eight and twelve story building models along longitudinal and trans-verse directions are shown below.
Fundamental Natural Period T (sec)
ModelNo.
Numberof story Codal Analytical
1 5 0.329 0.393
2 5 0.329 0.378
3 5 0.329 0.367
4 5 0.329 0.358
5 8 0.526 0.69
6 8 0.526 0.671
7 8 0.526 0.657
8 8 0.526 0.647
9 12 0.789 1.12
10 12 0.789 1.09
11 12 0.789 1.07
12 12 0.789 1.03
Codal and Analytical Fundamental natural periods for different building models along longitudinal – di-rection
Fundamental Natural Period T (sec)ModelNo.
Numberof story
Codal Analytical
1 5 0.371 0.3932 5 0.371 0.3783 5 0.371 0.3674 5 0.371 0.3585 8 0.593 0.696 8 0.593 0.671

20
International Journal of Research and Innovation (IJRI)
7 8 0.593 0.6578 8 0.593 0.6479 12 0.89 1.1210 12 0.89 1.0911 12 0.89 1.0712 12 0.89 1.03
Codal and Analytical Fundamental natural periods for different building models along transverse direc-tion.
It can be observed from the above tables that natu-ral period of five story building for model 1 is more than the codal provision when comparing it with analytical results. Were as in model 2 by increasing the shear wall area ratio, natural period is almost similar to codal provision. Thus by increasing the shear wall area ratio there is a considerable reduc-tion in time period.
It can be clearly understood from the above tables that by increasing shear wall area ratio in both x and y direction reduction in the time period takes place.
SHEAR WALL AREA (%) VERSUS BASE SHEAR (kN)
Base Shear:It is the sum of design lateral forces at all levels above the storey under consideration.
Response Spectrum Analysis
The below graphs and the Tabular Columns rep-resents the relationship between SW area vs. Base shear for different types of building Models (0.70%, 0.91%, 1.11% and 1.31%), performed by using Re-sponse Spectrum Analysis.
ModelNo.
Numberof Story
SW Area(%)
BaseShear(kN)
1 5 0.70 2148.262 5 0.91 2181.183 5 1.11 2219.084 5 1.31 2260.145 8 0.70 3378.316 8 0.91 3515.897 8 1.11 3634.668 8 1.31 3710.49 12 0.70 4226.5910 12 0.91 4435.2911 12 1.11 4615.0912 12 1.31 4789.73
shear wall area (%) and Base Shear (kN) along lon-gitudinal direction(Response Spectrum Analysis)
ModelNo.
Numberof
Story
SW Area(%)
BaseShear(kN)
1 5 0.70 2092.092 5 0.91 2128.223 5 1.11 2166.254 5 1.31 2207.65 8 0.70 2822.266 8 0.91 2959.687 8 1.11 3080.218 8 1.31 3190.79 12 0.70 3926.5210 12 0.91 4178.1211 12 1.11 4498.112 12 1.31 4565.45
shear wall area (%) and Base Shear (kN) along Transverse direction(Response Spectrum Analysis)
Shear wall area (%) versus Base shear of five, eight and twelve story along longitudinal direction(Response Spectrum Analysis)
Shear wall area (%) versus Base shear of five, eight and twelve story along Transverse direction(Response Spectrum Analysis)
21
International Journal of Research and Innovation (IJRI)
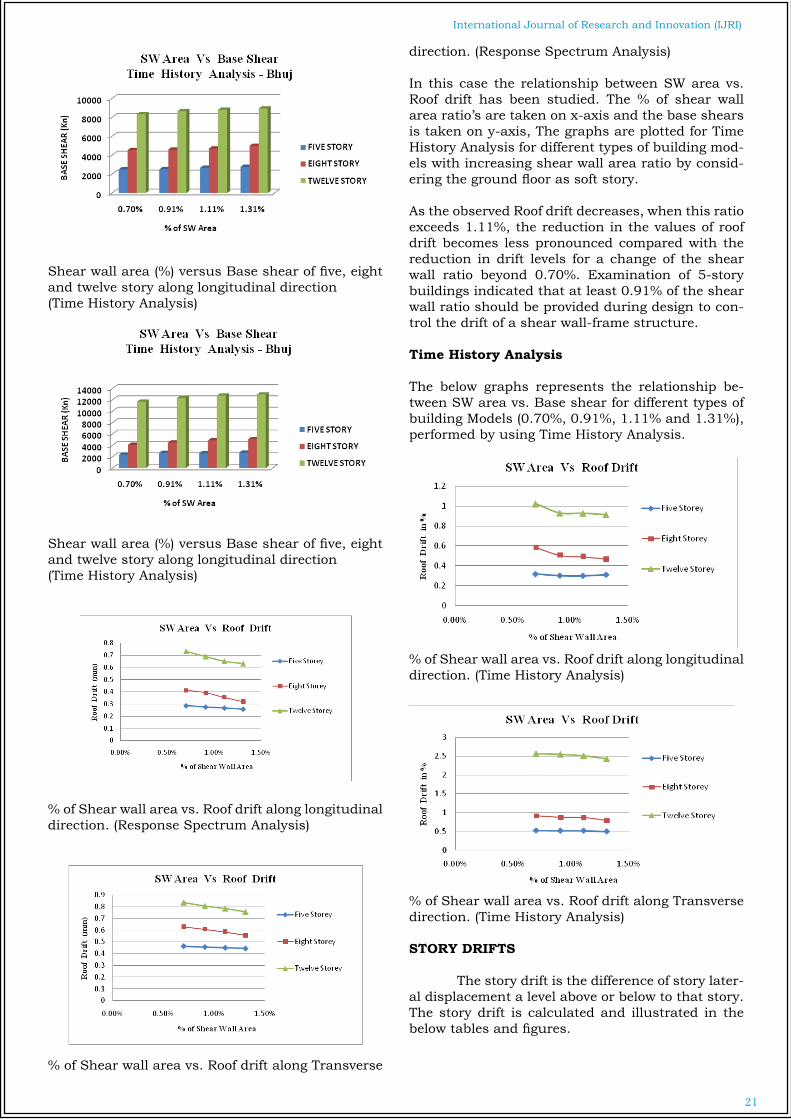
Shear wall area (%) versus Base shear of five, eight and twelve story along longitudinal direction(Time History Analysis)
Shear wall area (%) versus Base shear of five, eight and twelve story along longitudinal direction(Time History Analysis)
% of Shear wall area vs. Roof drift along longitudinal direction. (Response Spectrum Analysis)
% of Shear wall area vs. Roof drift along Transverse
direction. (Response Spectrum Analysis)
In this case the relationship between SW area vs. Roof drift has been studied. The % of shear wall area ratio’s are taken on x-axis and the base shears is taken on y-axis, The graphs are plotted for Time History Analysis for different types of building mod-els with increasing shear wall area ratio by consid-ering the ground floor as soft story.
As the observed Roof drift decreases, when this ratio exceeds 1.11%, the reduction in the values of roof drift becomes less pronounced compared with the reduction in drift levels for a change of the shear wall ratio beyond 0.70%. Examination of 5-story buildings indicated that at least 0.91% of the shear wall ratio should be provided during design to con-trol the drift of a shear wall-frame structure.
Time History Analysis
The below graphs represents the relationship be-tween SW area vs. Base shear for different types of building Models (0.70%, 0.91%, 1.11% and 1.31%), performed by using Time History Analysis.
% of Shear wall area vs. Roof drift along longitudinal direction. (Time History Analysis)
% of Shear wall area vs. Roof drift along Transverse direction. (Time History Analysis)
STORY DRIFTS
The story drift is the difference of story later-al displacement a level above or below to that story. The story drift is calculated and illustrated in the below tables and figures.

22
International Journal of Research and Innovation (IJRI)
Response Spectrum Analysis
The below graphs and the Tabular Columns represents the story Drift for different types of build-ing Models (0.70%, 0.91%, 1.11% and 1.31%), per-formed by using Response spectrum Analysis.
FIVE STORY
Story NoResponse Spectrum Analysis
Ux Uy5 0.286 0.464
4 0.355 0.533
3 0.413 0.576
2 0.406 0.525
1 0.242 0.248
Story drift (mm) along Longitudinal and transverse direction for five Story building Model (0.70% SW Area)
Story No. Response SpectrumUx Uy
5 0.286 0.4574 0.343 0.511
3 0.387 0.5352 0.367 0.4731 0.208 0.244
Story drift (mm) along Longitudinal and transverse direction for five Story building Model (0.91% SW Area)
Story-wise drift for five story building models along X-direction (Response Spectrum Method)
Story-wise drift for five story building models along Y-direction (Response Spectrum Method)
EIGHT STORY
Story No.Response SpectrumUx Uy
8 0.378 0.5587 0.476 0.6596 0.594 0.7845 0.701 0.8934 0.775 0.9563 0.793 0.9422 0.714 0.81 0.359 0.41
Story drifts (mm) along Longitudinal and transverse direction for eight Story building Model (0.70% SW Area)
Story No.Response Spectrum
Ux Uy8 0.391 0.5857 0.481 0.6766 0.592 0.7895 0.691 0.8854 0.756 0.9333 0.761 0.9032 0.666 0.7471 0.326 0.338
Story drifts (mm) along Longitudinal and transverse direction for Five Story building Model (0.91% SW Area)
Story Drift for eight story building models along X-direction (Response Spectrum Method)

23
International Journal of Research and Innovation (IJRI)
Story Drift for eight story building models along Y-direction (Response Spectrum Method)
TWELVE STORY
Story No.
Response SpectrumMethod
Ux Uy
12 0.361 0.507
11 0.432 0.583
10 0.521 0.683
9 0.609 0.78
8 0.687 0.869
7 0.753 0.944
6 0.806 1.01
5 0.841 1.03
4 0.8536 1.03
3 0.822 0.965
2 0.713 0.719
1 0.395 0.398
Story drifts (mm) along Longitudinal and transverse direction for Twelve Story building Model (0.70% SW Area)Story No. Response Spec
Ux Uy12 0.361 0.51511 0.427 0.58610 0.513 0.6799 0.599 0.7748 0.678 0.8617 0.745 0.9346 0.798 0.9895 0.831 1.014 0.837 1.043 0.797 0.9262 0.673 0.7431 0.316 0.3
Story drifts (mm) along Longitudinal and transverse direction for Twelve Story building Model (0.91% SW Area)
Story Drift for Twelve story building models along X-direction (Response Spectrum Method)
Story Drift for Twelve story building models along Y-direction (Response Spectrum Method)
In this case the variation of story drift is examined by Response Spectrum Analysis with in-creasing shear wall area ratios, by taking drift on x-axis and No. of story’s on y-axis.
In this graph, it is observed that there is a decrease in drift in the x-direction of 5-story buildings when the shear wall ratio is increased from 0.70 to 0.91%. When this ratio is increased further to 1.11 and 1.31%, the roof drifts are 0.25 and 0.29 respec-tively. When the y-direction of the 5-story buildings is considered, the decrease in drift starts to decay significantly after 0.91% shear wall area ratio. The roof drift values of this case for 1.11 and 1.31% of the shear wall ratio are 0.47 and 0.45. In addition, the roof drift value for a 0.70% shear wall ratio in the y-direction is 0.464, respectively.
The trend in the variation of drifts for 8-story and 12 story buildings differs from that of 5-story build-ings. At first glance, the normalized values of roof drifts are relatively close. A decrease in roof drifts is observed to be more significant for shear wall ratios up to 0.91% compared with higher wall ratios. How-ever, after 0.91% wall ratio, the reduction in drift is nearly constant in the y-direction, which is almost a 5% decrease for each increase in the shear wall

24
International Journal of Research and Innovation (IJRI)
area ratio.
This indicates that shear wall ratio up to 0.91% could significantly improve seismic performance. However, a shear wall ratio less than 0.91% is not sufficient to limit the observed drift.
Time History Analysis
The below graphs and the tabular columns represents the story drift for different types of build-ing Models performed by using Bhuj , Chamba and Uttarkasi as Ground Motion records for Time His-tory Analysis.
FIVE STORY
Story drift for five story building models along X-direction (Time History Analysis)
Story drift for five story building models along Y-direction (Time History Analysis)
EIGHT STORY
Story drift for eight story building models along Y-direction (Time History Analysis)
TWELVE STORY
Story drift for twelve story building models along X-direction (Time History Analysis)
Story drift for twelve story building models along Y-direction (Time History Analysis)
In this case the variation of story drift is ex-amined by Time History Analysis with increasing shear wall area ratios, by taking drift on x-axis and No. of story’s on y-axis.
In this graph, it is observed that there is an abrupt change in drift in the x-direction of 5-story build-ings in case of Uttarkasi when compare with that of Bhuj and Chamba. When the shear wall area ra-tio is increased further to 1.11 and 1.31%, the roof drifts are 0.301, 0.791 and 0.9, respectively. When the y-direction of the 5-story buildings is consid-ered, similar effect can be seen. The roof drift values of this case for 1.11 and 1.31% of the shear wall ratio are 0.37, 0.936 and 2.35 respectively.
The trend in the variation of drifts for 8-story and 12 story buildings is also similar to that of 5-story buildings.
INTER STORY DRIFT
It is the relative horizontal displacement between two adjacent floors bounding the story.

25
International Journal of Research and Innovation (IJRI)
Response Spectrum Method
The below graphs and the Tabular Columns represents the story Drift for different types of build-ing Models (0.70%, 0.91%, 1.11% and 1.31%), per-formed by using Response spectrum Analysis.
FIVE STORY
Inter Story drift for five story building models along X-direction (Response Spectrum Analysis)
Inter Story drift for five story building models along Y-direction (Response Spectrum Analysis)
Time History Analysis The below graphs and the tabular columns represents the story drift for different types of build-ing Models performed by using Bhuj , Chamba and Uttarkasi as Ground Motion records for Time His-tory Analysis.
FIVE STORY
Inter Story drift for five story building models along X-direction (Time History Analysis)
Inter Story drift for five story building models along Y-direction (Time History Analysis)
Summary
In this chapter, the results obtained from Response Spectrum Analysis and Time History Analysis per-formed by using E-tabs includes relationship be-tween shear wall area and Base shear, relationship between shear wall area and Roof drift, Story Drift and Inter Story Drift has been discussed for differ-ent building model with increasing Shear wall area ratio by considering the ground floor as soft story.
CONCLUSION
On the basis of the results of the analytical inves-tigation of 5, 8 and 12 story building models with increasing shear wall area ratio by considering the ground floor as soft story, the following conclusions are drawn:
• The Fundamental Period of Vibration for five, eight and twelve story building model with 0.70% shear wall area ratio is high when compared to that of other models. This is because as the shear wall area increases the fundamental time period decreases.
• The percentage of the base shear carried by the ground floor shear walls increases significantly un-til the shear wall ratio has reached 0.91%. However, the rate of increase is considerably higher between 1.11 and 1.31% shear wall ratios than between 0.70 and 0.91%. In buildings having a shear wall ratio of 1.11%, ground floor shear walls carry about 80% of the base shear. The base shear carried by the walls is observed to be more than 90% for shear wall ra-tios of 1.31% however; the reflection of this increase on the drift performance is significant.
• As the shear wall ratio increases, the roof drift de-creases; however, when this ratio exceeds 0.91%, the reduction in the values of roof drift values be-comes less pronounced compared with the reduc-tion in drift levels for a change of the shear wall ra-tio beyond 0.91%. Examination of 5-story buildings indicated that at least 1.0% of the shear wall ratio should be provided during design to control the drift of a shear wall-frame structure.
• In general, when the shear wall area to floor area ratio increases, the story drift decreases. For 8 and 12 -story buildings, the story drift values for two orthogonal directions have similar magnitudes; however, for 5-story buildings, the difference is not much significant, especially for 0.91% and higher shear wall ratios. This is believed to be because of the fact that fundamental periods of the 5-story buildings are close to the dominant period of the selected earthquake records.
• It is examined that the Inter story drift are generally smaller in magnitude compared with max-imum story drifts; however, their general trend is
26
International Journal of Research and Innovation (IJRI)
quite similar except for the ground floors. For both 5- and 8-story buildings, the minimum inter story drifts are observed between the top two stories when the shear wall ratio is greater than 0.91%.
Scope For Future Study
Further it would be desirable to study more cases before reaching definite conclusion about the behavior of RC frames buildings. Studies can be conducted on high rise buildings (Multistoried) by providing more thickness of shear walls, provid-ing shear wall at various other locations and also by providing dual system, which consists of shear wall (or braced frame) and moment resisting frame. Study for better ductility beam-column junction can also be made.And further study can be made on an existing building for seismic evaluation. Where, a preliminary investigation using FEMA-273 can be done before evaluation of the existing building us-ing mathematical modeling with the help of finite element analysis package. The study can also be done on Sloping grounds, various damping mechanisms and its applications on structures, and also by conducting the struc-tures having base isolation system.
REFERENCES
1.Canbolat, B. B., Soydas, O., and Yakut, A. (2009). “Influence of shear wall index on the seismic performance of reinforced con-crete buildings.” Proc., World Council of Civil Engineers - Eu-ropean Council of Civil Engineers - Turkish Chamber of Civil Engineers (WCCE-ECCE-TCCE) Joint Conf. (CD-ROM), Tubitak, Ankara, Turkey.
2.Comlekoglu, H. G. (2009).“Effect of shear walls on the behavior of reinforced concrete buildings under earthquake loading.” M.S. thesis, Middle East Technical Univ., Ankara, Turkey.
3.Hassan, A. F., and Sozen, M. A. (1997). “Seismic vulnerabil-ity assessment of low-rise buildings in regions with infrequent earthquakes.” ACI Struct. J., 94(1), 31–39.
4.Soydas, O. (2009). “Evaluation of shear wall indexes for rein-forced con- crete buildings.” M.S. thesis, Middle East Technical Univ., Ankara, Turkey.
5.Tekel, H. (2006). “Evaluation of usage of 1% shear wall in re-inforced concrete structures.” Turkish Eng. News, 444–445 (2006/4–5), 57–63.
6.Wallace,J.W.(1994).“Anewmethodologyforseismicdesignofreinforced concrete shear walls.” J. Struct. Eng., 120(3), 863–884.
7.European Committee for Standardization. (2003). “Design of structures for earthquake resistance—Part 1: General rules, seismic actions and rules for buildings.” Eurocode 8, Brussels, Belgium.
8.Comlekoglu, H. G. (2009). “Effect of shear walls on the behavior of reinforced concrete buildings under earthquake loading.” M.S. thesis, Middle East Technical Univ., Ankara, Turkey.
9.Riddell, R., Wood, S. L., and De La Llera, J. C. (1987). “The 1985 Chile earthquake, structural characteristics and damage statistics for the build- ing inventory in Vina del Mar.” Structural Research Series No. 534, Univ. of Illinois, Urbana, IL
10.Gulkan, P. L., and Utkutug, D. (2003). “Minimum design
criteria for earthquake safety of school buildings.” TurkiyeM-uhendislikHaberleri, Sayi, 425(3), 13–22
11.Pacific Earthquake Engineering Research Center (PEER). (2009).“Strong motion database.”http://peer.berkeley.edu/peer_ground_motion_databaseæ (Jan. 30, 2009).
12.IS -1893, “Criteria for Earthquake Resistant Design of Struc-tures – Part I, General provisions and buildings (Fifth Revision)”. Bureau of Indian Standards, New Delhi, 2002.
13PankajAgarwal and Manish Shrikhande, “Earthquake Resist-ant Design of Structures” PHI Learning Private Limited, New Delhi, 2010.
14.Taranath B.S., “Structural Analysis and Design of Tall Build-ings” McGraw-Hill Book Company, 1988.ETABS 9.5, “Documen-tation and Training Manuals
AUTHOR
Mohammed Asra Jabeen, Research Scholar, Department Of Civil Engineering, Aurora's Scientific Technological & Research Academy, Hyderabad, India
K. Mythili, Associate professor , Department Of Civil Engineering, Aurora's Scientific Technological & Research Academy, Hyderabad, India
Hashim Mohiuddin,Professor , Department Of Civil Engineering, Aurora's Scientific Technological & Research Academy,Hyderabad, India