effect of selected factors affecting revenue …
TRANSCRIPT

EFFECT OF SELECTED FACTORS AFFECTING REVENUE COLLECTION IN
NAIROBI CITY COUNTY GOVERNMENT
PATRICK N. NGICURU
A Research Project Submitted to the Graduate School in Partial Fulfillment
of the Requirements Award of Master’s Degree in Business Administration of
Egerton University.
NOVEMBER, 2016
ii
DECLARATION
This Research project is my original work and has not been presented for a degree in any other
University
Signature……………………………... Date: …………………………..
Name: Patrick N. Ngicuru
CM16/0004/11
This research project has been submitted for examination with our approval as the University
Supervisors;
Signature: ……………………………… Date: ………………………….
Mrs. Monicah Muiru
Lecturer
Faculty of Commerce
Egerton University

iii
COPYRIGHT
© 2016 Patrick Ngai Ngicuru
All rights reserved. No part of this project may be reproduced, stored in any retrieval system or
transmitted in any form or means electronic, mechanical, photocopying or otherwise without
prior written permission of the author or Egerton University.

iv
DEDICATION
I wish to dedicate this work to my wife, Tabitha, Children, Joy, Eric, Laureen and Tony for their
support and the encouragement they gave me during the study.

v
ACKNOWLEDGEMENT
I wish to express my true appreciation to each one of the individuals who in somehow added to
the achievement of preparation of this research project. . Above all, special thanks to the
Almighty God for the gift of life and good health, which enabled me to undertake this project.
Special thanks also go to my supervisors Mrs Monica Muiru and Ms Irene Riungu who guided
me in the research project and the former Ministry of Local Government Now Ministry of
Devolution and Planning, for sponsoring me to undertake this course.
I also thank all the teaching, administrative and support staff of the Egerton University Nairobi
Campus for their support and encouragements throughout the programme period
vi
ABSTRACT
The introduction of county governments with the adoption of the new constitution has brought
with it challenges in administration of these new institutions. This is particularly the case with
revenue collection in the county governments whereby the revenue collected has in many times
been below the projected figures. This has resulted in financial challenges in the delivery of
services to the public. The purpose of this study was to establish the factors affecting revenue
collection in Nairobi City County Government. The specific objectives of the study were to:
establish effect of revenue diversification on revenue collection, establish the effects of
administration on revenue collection, assess the effects of tax structure on revenue collection and
find out how different forms of revenues affects revenue collection. The study adopted a
descriptive research design. The study population comprised of a total of 340 members of staff
working as chief officers, technical staff and members of Nairobi City County assembly. The
sample size was determined using the Fischer‟s formula. The sample size for the study was 180
which were distributed proportionately among the strata. The study used a survey questionnaire
as a research instrument. Data collected was analyzed with the help of SPSS by both descriptive
and inferential statistics. The results were presented in form of tables and graphs. The study
adopted a multivariate regression. The study found that revenue diversification affect revenue
collected through number of sources of revenue and new policies to a great extent. Tax
administration affects revenue in Nairobi City County through competent staff, availability of
computers, availability of postal communication system and tax education. Tax structure affects
revenue collection through flexibility, equitability, neutrality and simplicity while different forms
of revenue (property, business license) affect amount of revenue collected. Revenue
diversification had a positive and significant relationship with amount of revenue collected
whereas different forms of revenue collected had positive and significant effect on amount of
revenue collected in Nairobi City County. The study concluded that revenue diversification
strategies increases the amount of revenue collected, with a good tax administration practices
like competent staff and adoption of latest technology, the amount of revenue collected
increases. A good tax structure that is flexible, simple and economical, the amount of revenue
collected will be high. The study recommends on the use of latest technology and competent
staff in tax administration, also there should be more innovations to have diversified sources of
revenues in Nairobi City County in order to collect more revenue. The financial managers and
policy makers in Nairobi City County assembly should come up with new sources of revenues
and taxes that obey the canon law of taxation that is economical, simple, flexible and easy to
administer.

vii
TABLE OF CONTENTS
DECLARATION........................................................................................................................... ii
DEDICATION.............................................................................................................................. iv
ACKNOWLEDGEMENT ........................................................................................................... iv
ABSTRACT .................................................................................................................................. vi
LIST OF TABLES ....................................................................................................................... ix
LIST OF FIGURES ...................................................................................................................... x
LIST OF ABBREVIATION AND ACRONYMS ..................................................................... xi
CHAPTER ONE ........................................................................................................................... 1
INTRODUCTION......................................................................................................................... 1
1.1 Background of the Study ....................................................................................................... 1
1.2 Problem Statement ................................................................................................................ 3
1.3 Research Objectives .............................................................................................................. 4
1.4 Research Hypotheses............................................................................................................. 5
1.5 Justification of the study ....................................................................................................... 5
1.6 Significance of the study ....................................................................................................... 6
1.8 Limitations of the study......................................................................................................... 6
1.9 Operation of Terms ............................................................................................................... 7
CHAPTER TWO .......................................................................................................................... 8
LITERATURE REVIEW ............................................................................................................ 8
2.1 Introduction ........................................................................................................................... 8
2.2 Theoretical Review ............................................................................................................... 8
2.3 Empirical review ................................................................................................................. 10
2.3.1 Revenue Diversification ............................................................................................... 10
2.3.2 Effects of Administration on Revenue Collection ........................................................ 11
2.3.3 Tax structure on Revenue Collection ........................................................................... 15
2.3.4 Forms of Revenues ....................................................................................................... 18
2.3.5 Revenue Collection....................................................................................................... 24
2.4 Conceptual Framework ....................................................................................................... 26
2.5 Summary and gaps .............................................................................................................. 28
CHAPTER THREE .................................................................................................................... 30

viii
RESEARCH METHODOLOGY .............................................................................................. 30
3.1 Introduction ......................................................................................................................... 30
3.2 Research Design .................................................................................................................. 30
3.3 Study Population ................................................................................................................. 30
3.4 Sampling Technique ............................................................................................................ 31
3.5 Data Collection Instruments ................................................................................................ 33
3.6 Data Analysis and Presentation ........................................................................................... 34
3.7 Diagnostic Tests .................................................................................................................. 36
CHAPTER FOUR ....................................................................................................................... 37
FINDINGS AND DISCUSSIONS .............................................................................................. 37
4.1 Introduction ......................................................................................................................... 37
4.2 General Information ............................................................................................................ 38
4.3 Revenue Diversification ...................................................................................................... 40
4.4 Tax Administration ............................................................................................................. 41
4.5 Tax Structure ....................................................................................................................... 43
4.6 Forms of Revenues .............................................................................................................. 44
4.7 Revenue Collection ............................................................................................................. 45
4.8 Hypothesis Testing .............................................................................................................. 46
4.9 Regression Analysis ............................................................................................................ 48
4.10 Diagnostic Tests ................................................................................................................ 50
CHAPTER FIVE ........................................................................................................................ 52
SUMMARY OF FINDINGS, CONCLUSIONS AND RECOMMENDATIONS ................. 52
5.1 Introduction ......................................................................................................................... 52
5.2 Summary of the Findings .................................................................................................... 52
5.3 Conclusions ......................................................................................................................... 53
5.4 Recommendations ............................................................................................................... 53
REFERENCES ............................................................................................................................ 55
APPENDICES ............................................................................................................................. 64
Appendix 1: Questionnaire........................................................................................................ 64
ix
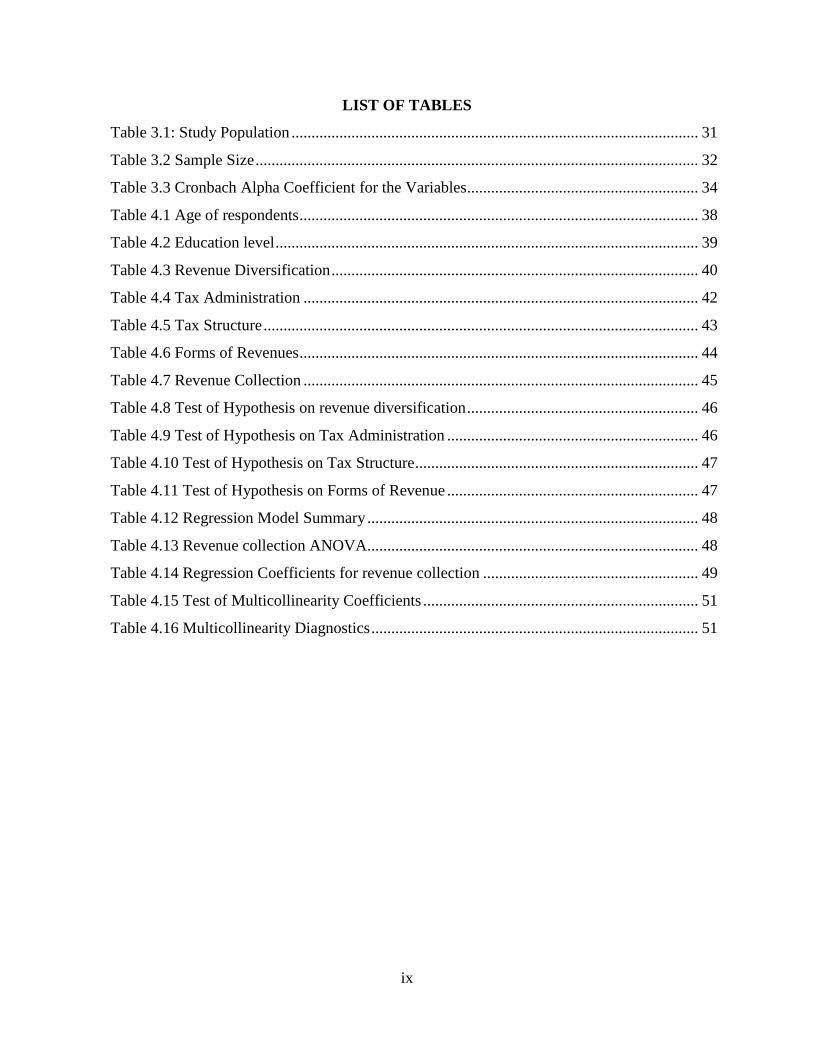
LIST OF TABLES
Table 3.1: Study Population ...................................................................................................... 31
Table 3.2 Sample Size ............................................................................................................... 32
Table 3.3 Cronbach Alpha Coefficient for the Variables .......................................................... 34
Table 4.1 Age of respondents .................................................................................................... 38
Table 4.2 Education level .......................................................................................................... 39
Table 4.3 Revenue Diversification ............................................................................................ 40
Table 4.4 Tax Administration ................................................................................................... 42
Table 4.5 Tax Structure ............................................................................................................. 43
Table 4.6 Forms of Revenues .................................................................................................... 44
Table 4.7 Revenue Collection ................................................................................................... 45
Table 4.8 Test of Hypothesis on revenue diversification .......................................................... 46
Table 4.9 Test of Hypothesis on Tax Administration ............................................................... 46
Table 4.10 Test of Hypothesis on Tax Structure ....................................................................... 47
Table 4.11 Test of Hypothesis on Forms of Revenue ............................................................... 47
Table 4.12 Regression Model Summary ................................................................................... 48
Table 4.13 Revenue collection ANOVA................................................................................... 48
Table 4.14 Regression Coefficients for revenue collection ...................................................... 49
Table 4.15 Test of Multicollinearity Coefficients ..................................................................... 51
Table 4.16 Multicollinearity Diagnostics .................................................................................. 51

x
LIST OF FIGURES
Figure 2.1 Conceptual Framework ............................................................................................ 37
Figure 4.1 Response rate ........................................................................................................... 37
Figure 4.2 Working experience ................................................................................................. 39

xi
LIST OF ABBREVIATION AND ACRONYMS
CRA Commission on Revenue Allocation
DACF District Assemblies Common Fund
FIRS Federal Inland Revenue Service
GDP Gross domestic product
GDP Gross Domestic Product
IGFs Internal Generated Funds
KRA Kenya Revenue Authority
MMDAs Municipal and District Assemblies
PMF Public Finance Management
SPSS Statistical package for social sciences
TMA Techiman Municipal Assembly
VAT Value Added Tax

1
CHAPTER ONE
INTRODUCTION
1.1 Background of the Study
The fundamental sources of own revenue for urban areas are normally property taxes, business
licenses, market fees and different user charges. They can possibly give dependable revenue if all
around managed, yet practically speaking all have genuine limitations. For property tax, the
primary drawbacks incorporate powerless ability to actualize exact valuation practices; poor
methods of collection; absence of clear possession titles; and absence of political backing for
enforcement. Business licenses make high consistence costs because of complex techniques; may
not reflect capacity to pay; give chances to rent seeking; and are regularly ineffectively
controlled, so they produce little revenue. User fees may empower productive utilization of
public sector resources; additionally experience the ill effects of defects such as inequitable
burdens on low income users, insufficient accumulation and billing plans, low quality
administrations and persistent imperviousness to payment. Nonetheless, experience additionally
indicates open doors for change, including streamlining strategies for property valuation and
upgrading aptitudes; making business permit frameworks easier, more transparent and
successful, for instance by presenting single business license frameworks; and enhancing
consistence in paying user fees for instance through shared private water taps in informal
settlements (Fjeldstad, and Heggstad, 2013).
Key issues influencing voluntary compliance and social collaboration incorporate trust of
citizens in others, and the apparent reliability of government. Local governments have tried
different things with an assortment of alternatives to enhance collection of tax including
outsourcing accumulation to central government, private specialists and semi-private partners,
for example, market cooperatives. For instance, in Tanzania accumulation of property taxes,
market fees and different duties have been outsourced to a scope of different specialists. The
confirmation is uncertain in the matter of whether outsourcing has prompted better revenue
organization; notwithstanding, it can build up a stage from which future change can be
encouraged. Achievement relies on upon the nature of local government administration, the
degree of political backing for change, and the procedure transparency. Evaluating revenue
2
potential can be an issue: in the event that this is thought little of, it can bring about a specialist
catching a disproportionate amount of revenue gathered (Fjeldstad, 2006).
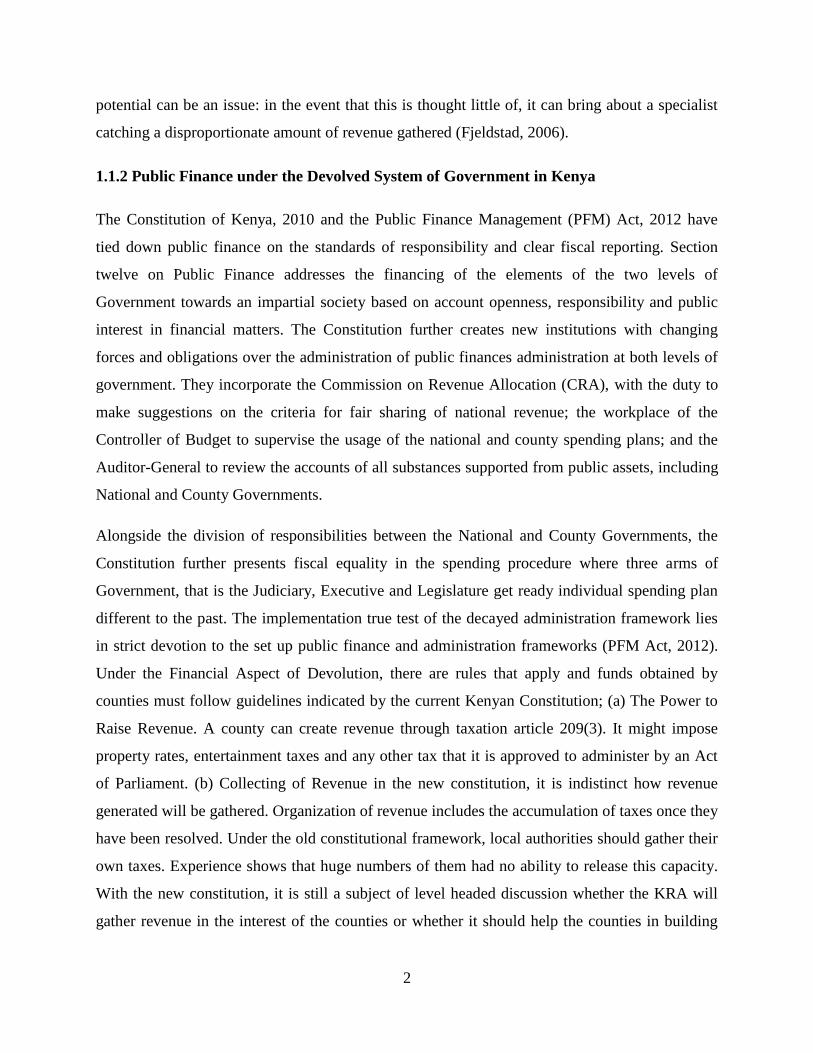
1.1.2 Public Finance under the Devolved System of Government in Kenya
The Constitution of Kenya, 2010 and the Public Finance Management (PFM) Act, 2012 have
tied down public finance on the standards of responsibility and clear fiscal reporting. Section
twelve on Public Finance addresses the financing of the elements of the two levels of
Government towards an impartial society based on account openness, responsibility and public
interest in financial matters. The Constitution further creates new institutions with changing
forces and obligations over the administration of public finances administration at both levels of
government. They incorporate the Commission on Revenue Allocation (CRA), with the duty to
make suggestions on the criteria for fair sharing of national revenue; the workplace of the
Controller of Budget to supervise the usage of the national and county spending plans; and the
Auditor-General to review the accounts of all substances supported from public assets, including
National and County Governments.
Alongside the division of responsibilities between the National and County Governments, the
Constitution further presents fiscal equality in the spending procedure where three arms of
Government, that is the Judiciary, Executive and Legislature get ready individual spending plan
different to the past. The implementation true test of the decayed administration framework lies
in strict devotion to the set up public finance and administration frameworks (PFM Act, 2012).
Under the Financial Aspect of Devolution, there are rules that apply and funds obtained by
counties must follow guidelines indicated by the current Kenyan Constitution; (a) The Power to
Raise Revenue. A county can create revenue through taxation article 209(3). It might impose
property rates, entertainment taxes and any other tax that it is approved to administer by an Act
of Parliament. (b) Collecting of Revenue in the new constitution, it is indistinct how revenue
generated will be gathered. Organization of revenue includes the accumulation of taxes once they
have been resolved. Under the old constitutional framework, local authorities should gather their
own taxes. Experience shows that huge numbers of them had no ability to release this capacity.
With the new constitution, it is still a subject of level headed discussion whether the KRA will
gather revenue in the interest of the counties or whether it should help the counties in building

3
their own abilities to gather their own particular revenue. (c) The ability to spend revenue. The
county governments can raise and spend what they raise. Be that as it may, what the national
government collects is to be shared among the two levels of government.
Article 202 accommodates the idea of evenhanded shares. The article requires that revenue
raised by the national government be shared evenhandedly between the national and county
governments. The county governments may likewise be given extra portions from the national
government's offer of revenue. These extra revenues might be given restrictively or
unequivocally (Kramon and Posner, 2011).
Article 203 gives a detailed standard to be followed in vertically deciding the fair shares of both
the national and county governments from one perspective; and evenly among the 47counties.
This standard joins the standards of financial balance which must be followed while deciding the
shares. Collection of revenue in Nairobi City County has been challenging due to the perception
in the public that there is decreased revenue alongside increased service demands (Lagomarsino,
Garabrant, Adyas, Muga & Otoo, 2012). Many services go undelivered allegedly due to
insufficient funds to cater for the said services just like other Local Governments therefore
failing to meet their legal obligations. Many studies have been carried out in the country to
improve local participation in developmental matters and governance to the people as well as
financial management in order to put available revenues into better use. However, there is lack of
enough studies to assess issues affection revenue collection in local Governments and this
scenario therefore informs this study to investigate factors affecting revenue collection in the
Nairobi City County with a view to identify the causes and gaps and take corrective measures to
avert the same. This in turn offered additional contribution to already complete studies in
revenue mobilization and its uses in Local Governments.
1.2 Problem Statement
More than 50 percent of tax revenue goes uncollected as a result of fiscal debasement and tax
avoidance (Ajaz and Ahmad, 2010). The misfortunes in revenues and along these lines in this
manner in public spending are high when contrasted with the extent of the sums paid as bribes.
Another undesirable outcome of corruption is that it decreases the distributive capacity of tax
collection and subsequently adds to build income imbalance, industrial sluggishness and hence
loss of jobs and hence high rates of unemployment (Eghigian, & Nitti, 2006).

4
The county governments in Kenya have the mandate of collecting funds on behalf of the national
government and utilizing the funds in establishing infrastructural programs and other
development of their counties through the devolved governments (Simiyu, Mweru & Omete,
2014). Though the functions of the county governments as regards to public finance management
has well been documented, not enough has been done by the county governments in Kenya in
collecting all the revenues within their limits as constitution of Kenya requires of them to act as
independent governments. The county governments have faced financial constrains in financing
their budgets which can be attributed to poor mechanisms adopted by the county government in
maintaining conduce environment for the collection of public revenues in their administrative
locations (United Nations Division for Public Economics, & Public Administration, 2010). Heim
(2012) noted that the problem associated with low level collection in Municipal County has to do
with at least one of the following: poor tax structure, limited tax base, poor tax administration
and corrupt revenue officials.
Various scholars have come forth to investigate the determinants factors affecting revenue
collection. Boyce and Ndikumana (2001) determined that share of agriculture in gross domestic
products (GDP), real per capita income, inflation, trade openness and corruption are the most
fundamental determinants of a tax collection in Kenya revenue system. Kaplinsky (2008)
reported that a number of structural factors like share of agriculture in GDP, per capita GDP,
trade openness foreign aid, some new institutional variables like political stability and corruption
and foreign debt are statistically strong and significant determinants of revenue performance in
Kenya. Despite all these local studies none have been done on the County governments and
specifically in Nairobi City County to estabilsh the factors that affect revenue collection in
Nairobi City County.
1.3 Research Objectives
The main objective of this research was to examine effect of selected factors affecting revenue
collection in Nairobi city county government
5
1.3.1 Specific Objectives
i. To analyze the effect of revenue diversification on revenue collection in Nairobi City
County government
ii. To analyze the effects of tax administration on revenue collection in Nairobi City County
government
iii. To analyze the effects of tax structure on revenue collection in Nairobi City County
government
iv. To analyze how the different forms of revenues affects revenue collection in Nairobi City
County government
v. To determine the combined effect of selected factors on revenue collection in Nairobi
City County government
1.4 Research Hypotheses
H1. Revenue diversification has no significant effect on revenue collection in Nairobi City
County government
H2. Tax administration has no significant effect on revenue collection in Nairobi City County
government
H3. Tax structure has no significant effect revenue collection in Nairobi City County government
H4. Different forms of revenue have no significant affect revenue collection in Nairobi City
County government
1.5 Justification of the study
County governments have the primary role of providing services to the citizens as agents of
national governments through decentralization, grassroots democracy, and as engines for
development. The revenue raised by county governments is central to their financial ability and
sustainability to serve their people and to promote their well-being. Therefore, it is important to
carry out a study on the factors affecting revenues collections in Nairobi City County, which will
help in raising amounts of revenues in Nairobi city county government for better services to its
people.

6
1.6 Significance of the study
The study was significant to the policy makers in county government to learn the causes for the
low revenue collection and help solve the problems using the recommendations from the study,
the employees of the county Government to get regular salaries and other emoluments and their
statutory deductions be remitted on time and future researchers use the study findings for their
empirical literature.
1.7 Scope
The study covered the four variables (revenue diversification, tax administration, tax structures
and forms of revenue) in the research objectives that the researcher believes to be having effect
on revenue collection in Nairobi City County Government in the 2014 to 2015 financial year.
1.8 Limitations of the study
The study was limited by uncooperative respondents who failed reprisal in case their responses
were divulged to their superiors. The study was further limited in the dearth in literature on tax
collection and revenue among devolved units owing to their nascent age in Kenya having been
started in 2013. The study also experienced biasness in the data collected as some respondents
sought to paint a good image of tax administration and revenue generation within the county
government.
1.8.1 Delimitations of the Study
The study delimited the study by selecting a representative sample size that will enable the
adoption and relevance of the research findings among other devolved units. The researcher
further reviewed previous research work in line with the research variables in order to single out
the shortcomings of previous research work and identify ways of enhancing the reliability of the
current research findings.
1.9 Assumptions
The study assumed that the county government gave the correct data for the study as requested
by the researcher.
7
1.9 Operation of Terms
Taxation- The term was used in the study to mean the amount collected by Nairobi City County
Government in financing its operations.
Tax administration- The term was used to mean the activities involved in the ensuring that tax
is collected and put into right use by the county government.
Public revenue- The term was used in the study to mean the amount Nairobi City County
Government receives from collection of its revenue from the public.

8
CHAPTER TWO
LITERATURE REVIEW
2.1 Introduction
This chapter reviewed literature on revenue collection in public sector. The chapter explained the
theoretical orientation, empirical review, and conceptualization of the research variables.
2.2 Theoretical Review
2.2.1 Portfolio Theory
As indicated by portfolio theory, diversification lessens risk or variability, given that different
stocks in an investment portfolio don't move in the very same direction or the price changes of
different stocks are not exactly flawlessly related (Zigrand, 2010). There are two sorts of risks
we have to recognize: unique (unsystematic risk) and market risk (systematic risk). The unique
risk comes from the antagonistic conditions that encompass a specific organization or industry.
This risk can be wiped out by diversification. In any case, the market risk can't be disposed of
through diversification and it originates from the vast hazards which influence all organizations.
For a very much broadened portfolio, the main thing that matters is the risk that financial
specialists can't dispose of – the no diversifiable ones. Since a solitary security's commitment to
the (market) risk of the entire portfolio relies on upon how touchy the security is to the market
developments (measured by beta), the risk of an all-around expanded portfolio equals the
average beta of the securities included in the portfolio” (Fustey, 2011).
In the event that the portfolio risk is driven by the betas of each different security, it suggests that
diversification can't just wipe out the stand-alone risk, additionally adjust the market risk of the
portfolio by changing the mix of different securities. With regards to government finance, the
possibility of revenue diversification is like investment diversification. We may consider the
different revenue sources or tax bases as an administration's investment portfolio and every tax
as one of the securities in the Portfolio.
9
2.2.2 Resource Based View Theory
Resource Based-View (RBV) was brought about by Penrose (1959) who recommended that an
association ought to be considered as a collection of physical and HR bound together in an
authoritative structure. Hafeez, Malak, and Zhang (2007), viewed resources as physical resources
and intellectual resources; Physical resources, for example, plant and hardware are effectively
recognizable because of their substantial presence (Hafeez et al., 2007).
Administration Control, or simply "Control", is characterized as, formal, data based schedules;
frameworks and structures that administration uses to keep or change designs in the different
exercises of the of the association, fundamentally those exercises that bolster administration
choice procedures and activities while actualizing business strategy (Wade & Hulland, 2004). As
per Hoopes, Madsen and Walker (2003), also calls for further empirical support for resource
construct view in light of association strategy; suggestions from a resource (and ability) point of
view on associations value creation and aggressiveness through value processing, innovations,
control systems, organizing resources and compensation policies. Dominant part of SMEs in
developing economy can't contend in a successful route because of their inner resource gap
(UNIDO, 2003). In this case resource based view theory could be used in this study in that
government institutions require adequate resources in tax administration.
2.2.3 Optimal Taxation Theory
The standard theory of optimal taxation argues that a tax framework ought to be chosen based on
a social welfare capacity subject to an arrangement of requirements. The literature on optimal
taxation commonly regards the social planner as utilitarian: that is, the social welfare capacity
depends on the utilities of people in the general public. In its most broad investigation, this
literature utilizes a social welfare work that is a nonlinear capacity of individual utilities.
Nonlinearity takes into consideration a social planner who inclines toward, for instance, more
equivalent circulations of utility. The social planner thinks exclusively about normal utility,
suggesting a social welfare work that is straight in individual utilities (Mankiw, Weinzierl, and
Yagan, 2009).
10
If the social planner is permitted to be unconstrained in picking a tax framework, then the issue
of optimal taxation turns out to be too simple: the optimal tax is just a singular amount tax. All
things considered, if the economy is portrayed by a representative purchaser, that buyer is going
to pay the whole tax bill of the administration in some structure. Missing any market defect, for
example, a prior externality, it is best not to misshape the decisions of that purchaser by any
stretch of the imagination. A singular amount tax achieves precisely what the social planner
needs (Lederman & Sichelman, 2013).
As indicated by Hebert (2014) the social planner needs to grasp heterogeneity in taxpayers'
capacity to pay. In the event that the planner could watch contrasts among taxpayers in inherent
capacity, the planner could again depend on single amount taxes, however now those singular
amount taxes would be dependent upon capacity. These taxes would not rely on upon any
decision an individual makes, so it would not misshape motivating forces, and the planner could
accomplish balance with no proficiency costs.
Chittenden, Foster and Sloan (2010) noted that Adam smith wealth of nation discusses what
taxation should be all about. He discussed four principle of optimal taxation which are: Equity
aspect- which means that the time manner and quantity of tax payment should be clearly defined;
tax should be paid in the proportion of the tax payers ability; that tax should be collected in a
time and manner that is most convenient to both the tax payer and the collector and that
administrative cost should be kept as low as possible.
2.3 Empirical review
2.3.1 Revenue Diversification
The application of different sources of revenues ensures the predictability and stability of sources
of revenue in public finance. It as well gives the implication that no one source of finance has
control or is relied upon at the expense of other sources of finance. This ensures that there is
continuity in the service delivery in the public sector as income flow is consistent (Oates, 2005).
Expanding the revenue sources has the advantage of accommodating new growing spending
requirement of a local government in terms of new judicial regulations, political actions and ever

11
changing economic cycle in a government. To cope with these emerging challenges therefore a
diversified and broad base of revenue source should be established (Hendrick, 2002).
However other scholars such as Carroll (2009) argue that having a diversified revenue structure
has the effects of huge costs associated with their administration and therefore costly to the
government. This negatively impacts on the fiscal performance of county government where
money is rather taken to administration of the tax system itself and not bringing more funds to
the county government to meet their budgetary requirements.
Ebrill, Stotsky and Gropp (2001) established the positive impact of revenue diversification on
fiscal performance. In this study the researchers uses quantitative data in revealing the results
that revenue diversification through ensuring that there is no source of public revenue that is
relied on primarily on the expense of the other forms of revenue has positive impact which they
measured using revenue adequacy, efficiency and equity in delivering of services at the county
government and level of spending. Other study by Yan (2008) on effect of revenue
diversification in fiscal performance established that revenue diversification has the effect of
ensuring efficiency in the county government. The result of the study indicated that revenue
diversification ensures a stronger financial stand and therefore better financial performance.
2.3.2 Effects of Administration on Revenue Collection
Mwachiro (2013) carried out a study on the internal controls in operation at Kenya Revenue
Authority with a view to establish whether such internal controls have produced any meaningful
results in increased collected revenue. The research was conducted using both quantitative and
qualitative approaches. The data collected was analyzed and findings revealed that the five
components of control environment, risk assessment, control activities, information and
communication and monitoring must be available for internal controls to work. The study
established that weak internal controls encourage collusion to fraud, loss of revenue and
embezzlement of collected revenue. The study therefore concluded that internal controls do
function although with hiccups and that there is a significant effect between internal controls and
revenue collection in KRA.

12
Abiola and Asiweh (2012) did a study on the effect of Tax Administration on Government
Revenue in a Developing Economy, a Case Study of Nigeria. The reason for the study was to
build up Nigeria Tax organization and its ability to lessen tax avoidance and produce revenue for
advancement longing of the people. The study made utilization of 121 online survey
questionnaires containing 25 pertinent questions. Distinct insights were utilized to examine 93
usable reactions. The study found in addition to other things that expanding tax revenue is an
element of viable enforcement strategy which is the immaculate duty of tax organization. Nigeria
needed enforcement hardware which would incorporate in addition to other things, satisfactory
labour, PCs and successful postal and communication frameworks. The study has clear
commonsense ramifications for tax experts and governments strategy developers in developing
nations specifically.
Aruwa and Suleiman (2008) also carried out a study on the Administration and Problems of
Value Added Tax in Nigeria. The study broke down the importance and the issues of Value
Added Tax (VAT) in Nigeria. Three research questions were detailed for the study. A survey of
VAT capable Nigerian associations, FIRS staff and the public was led to pick up bits of
knowledge into the way VAT is directed, its pertinence in revenue era, investment funds and
utilization of customers and the issues upsetting its effectiveness. Both primary and secondary
data were used and descriptive statistics as tool for analysis. The survey demonstrated that a
greater part of the Federal Inland Revenue Service (FIRS) staff viewed that they are not
sufficiently prepared officially to handle VAT operations; VAT capable organizations have
improper learning of VAT operations, the administration at the three levels in Nigeria have
raised generous revenue from VAT. However it has been underutilized because of high rate of
tax avoidance, absence of record keeping by business endeavors, utilization of inadequate FIRS
staff and low VAT training is found among the VAT capable associations and the public. It was
found that these associations regard VAT as cost in opposition to desires.
Proof from the way VAT revenue is being shared among the three levels of government in
Nigeria proposes that this revenue is being re-infused into the economy through public
consumption. Governments ought to consider procedures for securing proper treatment of VAT
by the VAT capable associations while finding a way to guarantee that the VAT revenue is

13
focused at sectors well on the way to improve the coincidental unfriendly impacts of VAT on
purchaser welfare, generation, livelihood and income.
Local government authorities generally encounter challenges in collecting taxes, fees and
charges. Therefore, there are numerous studies being done to discover answers for make tax
collection more revenue profitable. Practices for local taxes collection range from situations
where local government authorities gather the taxes themselves to situations where tax collection
is outsourced to private specialists, semi-private accomplices and the central government. Market
cooperatives and privately owned businesses also collect tax for the benefit of the local
government (Fjeldstad, Chambas, & Brun, 2014).
Some taxes and fees are gathered by the administration and directed back to the local
government. In Malawi the non-tax revenue is planned to be gathered by the central government,
before the resources are redistributed to District Assemblies utilizing a formula affirmed by the
Cabinet. A less common illustration is from Tanzania where the collection of property tax in Dar
es Salaam is left to the Tanzania Revenue Authority (Fjeldstadet al, 2014). In Tanzania,
accumulation of an extensive number of local government revenue sources has been outsourced
as of late. They incorporate private collection of property taxes in some urban committee; market
fees in both provincial and urban committees; ranger service demands (until 2005)
fundamentally in country boards; cess on certain agricultural items in rural councils; transport
stand; and parking fees. In Mwanza City Council, for example, more than 33% of the
collection‟s own revenues in 2006 were gathered by private operators.
A noteworthy challenge confronting privatized revenue collection in local government
authorities is to survey the revenue potential for different tax bases. Generally, revenue
evaluation is directed on a specially appointed premise, regularly in view of the earlier years
accounted for collection. Considerable underestimation of the revenue potential may suggest that
genuine collection by the operator is significantly higher than what is reflected in the agreement.
Subsequently, there is a risk of winding up in a circumstance where the specialist keeps the
generous segment of the revenues collected, which as of now is by all accounts the case in a few
collections.

14
In a study from Uganda, Boex, and Martinez-Vazquez (2007), discovered considerable gaps
between the local government appraisals of the revenue yields from local markets with the
genuine revenue yield gathered by private operators. In six markets contemplated, the gaps (lost
revenues) added up to somewhere around 25% and 74% of aggregate revenue collected in every
market. In addition, the actual margins acknowledged by private specialists brought about by this
undervaluation of market yields fluctuated around 71% and 97%. In this manner, it appears to be
clear that instead of improving local revenue, the private tax collection framework in Uganda
exchanges cash from standard and regularly poor provincial taxpayers and into the pockets of
private tax specialists and their different partners. All things considered, 53% of all revenue
gathered from sellers in the markets could be translated as immaculate redistributive transfer to
individuals from the local elite.
Agyapong (2012) conducted a study to assess the viability of revenue activation systems of
Metropolitan, Municipal and District Assemblies (MMDAs) in Ghana, Kumasi Metropolitan
Assembly (KMA) as a contextual analysis. The goal of the study was to turn out with
methodologies that can help KMA to create enough Internal Generated Funds (IGFs) to meet its
formative needs. Ranges considered under the difficulties that KMA faced included; lacking
IGFs, over dependence on District Assemblies Common Fund (DACF), defilement,
powerlessness to give public needs, and so forth. The survey directed utilizing the staff and
administration of KMA, tax payers and different partners in Kumasi uncovered that the
infrastructural projects given by KMA are not satisfactory and do neither match revenue
gathered nor their requests for improvement. KMA is legitimately and politically doing nothing
to rouse the occupants to satisfy their financial commitments. There are such a variety of revenue
spillages including KMA revenue collectors, senior officers of the Assembly and Assemblymen
and ladies of the different Sub-metros. The conclusion drawn from the survey demonstrated that
KMA is not adequately utilizing fiscal decentralization to enable itself under Local Government
Act, Act 462 (1993) so far as that is concerned it has not grown new and practical methodologies
to enhance its execution in revenue preparation.
The Assembly like numerous local authorities in Ghana had offered to over-dependence on the
District Assembly Common Fund to meet its capital use. Another reality is that larger piece of
KMA‟s IGFs goes into organization use. KMA certainly can‟t meet its socio–financial and
15
political commitments to shoppers of public products and administrations in the city. It will keep
on failing to fulfill its purchasers so far as it doesn't grow new systems and strategies to enhance
its revenue activation. KMA likewise needs dependable information base on brokers that
influence its spending detailing and implementation. Various proposals were made to KMA and
these 4 suggestions recommended techniques be taken to enhance the revenue base of KMA. It is
prescribed that KMA ought to attempt to take out debasement, set up dependable information
base on properties and organizations, make use of utilization of relationship marketing to connect
with partners through collections, courses, meetings, discussions, tax instruction and refinement
to know the issues of payment of taxes, rates, and so forth and the difficulties in revenue
accumulation. KMA ought to likewise put resources into shuttle transport, funeral services
mortuary services and other beneficial endeavors.
2.3.3 Tax structure on Revenue Collection
Muriithi, and Moyi, (2003) in their study contended that the key goal of tax changes in Kenya
was to guarantee that the tax framework could be saddled to relieve the never-ending fiscal
imbalances. This will be accomplished through tax approaches expected to make the yield of
individual taxes receptive to changes in national income. This study connected the ideas of
buoyancy and elasticity to figure out if tax changes in Kenya accomplished these targets.
Evidence suggests that changes positively affected the general tax structure and on the individual
tax.
James and Nobes (2008) and Nightingale (2002), while citing (Adam Smith 1776), argued that a
decent tax ought to have the characteristics of Efficiency, Equitability, Neutrality, Adaptability,
and Simplicity. These standards still hold today and even go about as an aide for strategy
definition. Notwithstanding, the capacity to accomplish all in a solitary tax approach is
practically impossible; thus, Nightingale (2002) expressed that there is no good tax. This is on
account that a productive tax may be not equal. As per Kvaal and Nobes (2013), a productive tax
may not as a matter of course be viewed as reasonable and one that is viewed as impartial may
not be effective.

16
Commonly, individuals abhor tax payment because of its impact on their income. Just a couple
people are enthusiastic about paying tax. Tax strategy must be for the most part acknowledged
by the general population on the fact that it must pick up consistence (Nightingale, 2002). This
thus implies that a decent tax framework must be in consonance with (Adam Smith, 1776) gun of
taxation cited in Nightingale (2002): Neutrality, Equitability, Productivity, Adaptability and
Simplicity.
A nearer examination of a portion of the elements or explanations behind the uncooperative
mentality of individuals towards taxation uncovers that the onus is on the inconveniences and
multifaceted nature of tax approaches and organizations in the country. Most times, the
imperviousness to taxation is fierce to the point that it could prompt social unrest. In Nigeria, the
"Aba Women uproar of 1929" – the notable first British test amid the pilgrim period was
provoked by the presentation of taxation by Lord Lugard, who was then the representative
(Evans 2009). The women who felt persecuted by the acquaintance of tax brought with arms
constraining the colonial administration to pull back the arrangement. In any case, aside from the
south-eastern Nigeria, where this happened, the presentation of taxation in other parts of the
nation denote the start of a formal tax framework in Nigeria. In the UK, the laborer‟s rebellion in
the fourteenth century, the 1990 turmoil cause by the presentation of group charge are different
case of incitements brought about by the presentation of taxation (Nightingale, 2002).
The probability of detection and penalties, complexity of tax systems and tax rates influence the
viability of a tax framework. The more tax laws get to be complex, the lower the consistence
levels. Transparency, reasonable and clear tax rules upgrade tax consistence (Chau & Leung,
2009). The complexity of tax laws makes it troublesome for common taxpayers to get it. In spite
of the fact that taxes are not some portion of regular discussions, individuals will typically
attempt to comprehend the commitments that they make to the legislature through the payment
of taxes. At the point when attempting to bode well, they will assess the fiscal arrangement, the
tax rates, the arrangement of public merchandise and benefits, and the collaboration between
themselves as taxpayers and the tax authorities. Toward the end of everything, the inspiration to
go along or not go along creates and shapes their ensuing tax conduct (Muehlbacher, Kirchler, &
Schwarzenberger, 2011).

17
Complex tax laws are a worry around the world. Tax laws have turned out to be complex to the
point that even specialists, for example, bookkeepers, lawyers and tax officers experience issues
in translating large portions of the administrative arrangements. Research led on the
etymological investigation of tax laws observed that abnormal state reflection in the composed
dialect consolidated with long and complex sentences brought about superfluous complexities
making it troublesome for taxpayers to comprehend the laws. A few nations have endeavored to
improve their tax laws yet without any result, for instance, New Zealand‟s tax laws were
composed in disentangled English but they still confronted the same authoritative and
consistence issues as before the rearrangements (Kirchler, 2007).
Doyle, Hughes and Glaister (2009) recommended that a complete transformation of the law and
mix of particular guidelines into standards be connected as a measure to improve complex tax
laws. Particular tax rules lead to innovative tax consistence as they permit taxpayers to make
utilization of the accessible escape clauses inside those tenets through the development of
complex business structures that are to a great degree hard to comprehend and assess by tax
authorities. Frequently it is likewise difficult to distinguish whether such structures are legal or
not in connection to the tax laws. At last, this prompts a feline and mouse legal drafting society
of escape clause shutting and reviving as it is unimaginable for tax laws to cover every
conceivable situation in an advancing domain. It is contended that principled trustworthiness of
guidelines will take into consideration legal enforcement of the standards in connection to
abnormal exchanges (Chau & Leung, 2009).
Throughout the years, researches have thought of different models with respect to taxes. The
most famous ones are the monetary model and the normal model. The monetary models of tax
rebelliousness accept that taxpayers settle on key choices. The balanced model underscores that
taxpayers‟ nature is to carry on insincerely and consequently, control and discipline are measures
to battle such practices (Kirchler, 2007).
For the most part, punishments are the overwhelming administrative measures in all tax laws. It
was found that some methodologies inspecting tax frameworks for identifying techniques to
enhance consistence are exclusively result situated without considering the human and social
factors. It was likewise found that taking into account an expansive number of observational
studies a lion's share of taxpayers are inherently legitimate and willing to pay their offer of taxes.
18
In spite of the fact that taxpayers discover the tax laws intricate and despite the fact that they are
not generally ready to pay for expert advice, it doesn‟t mean they will discover forceful
procedures to lessen their taxes inside the legal degree; rather, they will endeavor to get ready
and document their tax returns effectively (Kirchler, 2007).
2.3.4 Forms of Revenues
2.3.4.1 Property Tax
Few fiscally noteworthy taxes are more fitting to local organizations than property tax. This is
because of the way that genuine property is unmistakable, stationary, and a reasonable pointer of
one type of wealth. Consequently, on a fundamental level, property tax is hard to maintain a
strategic distance from and, if all around directed, it can speak to a non-distortional and very
proficient fiscal device. Property tax is a local government tax, demanded predominantly in
urban ranges. Just in Liberia the property tax is a national tax. Rural properties are regularly not
taxed, despite the fact that property taxation is being reached out to country properties in South
Africa under the terms of the Local Government; Municipal Property Rates Act 6 of 2004.
Namibia presented an area tax on business agriculturists in 2004 as a measure to finance an area
change program (Boadway, Chamberlain and Emmerson, 2010).
Property tax revenue accounts for under 0.5% of GDP in numerous African nations. In the
1990s, property taxes represented 40% of all sub-national taxes in developing nations (Bird and
Slack 2002: 6), yet less in most African nations. For example, property tax represented 10–30%
of "own" revenues in urban boards in Tanzania (Stewart, Brown and Cobham, 2009), and around
20% in metropolitan committees in South Africa (Bahl& Smoke, 2003). In Ghana property tax
accounts for around 14% of the aggregate revenues of local collections, a normal of 6.1% in
local chambers in Sierra Leone, and under 10% in The Gambia (normal for the period 2006 -
2008). In Liberia, where local collections are not permitted to gather revenue, property tax
accounts for around 1% of aggregate revenues of the central government (Alm, 2013).
There are various requirements that can clarify why property tax is modest collected in African
nations: (a) With the special cases of Botswana, Namibia and South Africa, property markets are
not all around created; (b) property registers and valuation rolls are regularly obsolete or not set
up; (c) regulatory limit and hardware are frequently constrained; (d) the tax base is for the most
19
part contracted by broad legal exclusions; and (e ) absence of political backing to implement the
property tax and political obstruction in revenue collection (Van Sittert, and Swart, 2008).
Mikesell (2002) contends that the reasons are extensively more political than monetary. In the
first place, the trouble and cost of directing an evenhanded property tax is misrepresented by
those more acquainted with income and utilization taxes than with property taxation. Second, in
numerous nations, the property tax has effective political adversaries. The tax hits individuals
with wealth collections specifically, the genuine properties to be taxed are clear to all, and the
duty itself is obvious. Individuals with significant property riches more do not have impressive
political influence that influence to frustrate taxes that point specifically at their possessions.
Low use of property and area taxation mirrors the achievement of the resistance of the rich and
effective to measures which hurt their interests. The outcome is that taxes are paid on a base that
frequently looks to some extent like the genuine level of property estimations (Moran, 2008).
At the point when local governments oversee the tax, they are in charge of keeping up property
and possession records, deciding taxable property estimations, ascertaining and disseminating
property tax bills, overseeing receipt payment, and applying tax enforcement against non-payers
(Bird, (2007). In different cases, local governments have a say in the decision of the tax rate,
while the organization of the tax are performed by the national revenue power. In a few nations,
for case in Malawi, property valuation is done by the central government, while local authorities
set rates and handle collection. West African French-talking nations all in all depend on the
customary French model, in which the property tax is planned and regulated by the central
government, though Anglophone African nations, except for Liberia, depend on local
organization. This is normally suggested that burdens that taxes ought to be regulated by the
administration that is qualified for their revenue (Mikesell, 2007).
Property estimation is the most well-known type of property tax in all Anglophone nations,
despite the fact that their ability to execute exact valuation practices regularly is unobtrusive.
Accessibility of pertinent property registers and information is for the most part constrained,
aside from in South Africa. Valuation rolls, on the off chance that they exist, are ordinarily
obsolete. Absence of qualified value‟s to get ready or keep up valuation rolls is likewise a test,
again with South Africa as an exemption (Kloeden, 2011). Endeavors to address these setbacks
are reflected in a discernible move far from depending on the central government valuation

20
workplaces to plan valuation rolls (e.g. in Lesotho, Malawi, Mauritius, Swaziland, South Africa,
Uganda, and Zambia). A few nations, for example South Africa and Uganda, have presented
'mass valuation' as another option to discrete valuations of individual properties or are thinking
about this (e.g. Kenya). In any case, outside quality control as to valuation rolls is for all intents
and purposes non-existent. Just the new South African enactment accommodates clerical
oversight with respect to the adequacy, consistency and use of city valuations (Kälin, 2005).
There is generally a distinction between imposing tax on buildings or land. Since land in
numerous African nations is claimed by the state, regularly just structures are incorporated into
the property tax base. This applies to Tanzania, Ghana, Mozambique and Sierra Leone. Kenya is
the main African nation with land esteem tax, while South Africa has a uniform, capital worth
tax. Nigeria is unique by having formally appointed the power for property tax enactment to the
36 state governments, leaving the different ranges in Nigeria with different ways to deal with
evaluating property tax (McCluskey, 2008).
2.3.4.2 Business Licenses
The standard systems for preparing revenues from organizations have been through authorizing.
Despite the fact that the first aim was administrative, local business authorizing has progressively
turned out to be essentially a revenue source in many spots. Regularly, business licenses produce
somewhere around 5% and 30% of local government own revenues in urban councils. In
numerous nations, notwithstanding, the framework has been entirely inadmissible, regularly very
unjust, and has forced gigantic costs on business, while creating generally minimal expenditure.
In Uganda, for example, a typical grumbling from little and medium-sized undertakings has been
that they don't comprehend what to pay, where and to whom. The administrative parts of the
permit framework have been to a great extent relinquished. What's more, poor strategy plan and
frail organization imply that permit scope; appraisal, collection, and enforcement rates are low,
prompting poor revenue era (Chesbrough, 2003).
Local business taxes are for the most part demanded in one of two ways: (an) either as a settled
sum, which more often than not differs by size, or area of the business, or (b) as a rate of
turnover or benefits. Surveying turnover or productivity, be that as it may, is troublesome both in
connection to little organizations, which regularly don't keep up legitimate records and to huge
21
organizations with different premises crosswise over different purviews. In this manner, local
business taxes regularly utilize intermediaries for turnover or productivity, for example, the
measure of premises, kind of business, and number of representatives and introduced power
(Bird, 2006).
Acquiring a permit regularly includes different visits to different workplaces, now and then more
than a few days, with related travel costs. Inability to give the right permit receipts may bring
about conclusion of the premises. Subsequently, the framework is regularly filled with rent
looking for and defilement. In addition, poor organization frequently implies that numerous
organizations are excluded in the permit framework because of absence of appropriate business
registers (Price, and Forrest, 2012). Besides, powerless financial administration will frequently
infer that collection and enforcement arrangements are infrequently implemented. This
disintegrates the tax base and brings imbalances into the framework. Subsequently, numerous
current business permit frameworks crosswise over Africa contain genuine imperfections. These
include: high consistence costs to organizations, because of different permitting and complex
strategies; tax structures that are muddled and don't reflect capacity to pay; a procedure stacked
with ineffectual administrative prerequisites, which give chances to rent looking for; poor
organization and avoidance, which lessen the tax base and produce imbalances; and a revenue
source that creates moderately little income for local governments (Margolis, 2014).
2.2.4.3 User Fees – Linking Payment and Service Delivery
Taxes are not the best instrument for coordinating interest and supply of public administrations.
Better connections can be accomplished through cost-recuperation charging frameworks, which
tie the sum paid transparently to the sum expended. By giving a more straightforward connection
between citizens‟ commitments and administration conveyance, such instruments may get to be
viable intends to recuperate the costs of administration arrangement, and to advance productivity
in the utilization of the administration. Subsequently, most observers contend that user fees
ought to assume a noticeable part in local government finance (Fjeldstad, 2006).
As per Wachs (2006) the principle financial method of reasoning for user charges is not to create
revenue, but rather to energize the productive utilization of resources inside the public sector. At
the point when appropriately composed, user charges give data to public sector suppliers on how

22
much customers will pay for specific administrations and by guaranteeing that the public sector
supplies are esteemed by subjects. Free or financed administrations may bring about
overconsumption of such administrations. In addition, it might demonstrate hard to focus on the
recipients of free administrations.
User charges for exchanging administrations, including water, power, sewage, and strong waste
evacuation, are significant sources of revenue in urban regions in Southern Africa, particularly in
Namibia and South Africa (Fjeldstad and Geisler, 2005). They include that administration
charges water and power supplies are critical. This revenue is created by an extra charge added
to the expense of the utilities that the local authorities normally purchase from the utility
organizations, or, if the power itself delivers the utility, added to the expense of creating it. As
per Fjeldstad, Chambas and Brun (2014), around a fourth of the power circulating authorities in
South Africa raise generous revenues from the surpluses earned from their deals.
An extensive offer of these revenues is utilized to take care of the expense of giving the
administration. Be that as it may, in a few regions a significant surplus is left for general local
government purposes. Consequently, the tax part of the user expense is covered up for
ratepayers, and the genuine level of local government taxation is not transparent for nationals.
The responsibility ability of the local revenue framework is in this way undermined. In addition,
since the customer price of the administration (for instance, power) is exaggerated by the
measure of the verifiable tax, this may affect monetary proficiency.
In Namibia, the larger part of town committees are not deciding their levies as per an affirmed
duty approach of cost recuperation (Fjeldstad Chambas and Brun, 2014). Henceforth, a few
exchanging administrations, including water dispersion, are worked with huge misfortunes in
various local authorities. The circumstance is declined by an expanding number of exceptional
indebted individuals in numerous local authorities, that is, buyers who don't pay for fundamental
administrations because of different reasons, including reasonableness. Encounters from South
Africa and Namibia demonstrate that there are various evident requirements on user charges and
different method for cost recuperation. These emerge from value contemplations (i.e. capacity to
pay), collection and charging strategies, the nature of the administrations given, and diligent
imperviousness to pay. These lessons point to the way that managing the approach issue of

23
revenue upgrade requires some comprehension of the variables fundamental the individual's
choice whether to pay or sidestep paying administration charges (and taxes) (Al-Fuqaha, 2013).
An expanding measure of confirmation recommends that the rate of commitment to a public
decent is influenced by elements, for example, subjects' trust in others and the dependability of
the administration (Welch, Hinnant and Moon, 2005). They recommend that without trust there
is little premise for social co-operation and intentional consistence with laws and directions that
could possibly profit everybody. Specifically, three measurements of trust appear to influence
residents‟ consistence: (1) trust in the local government to utilize revenues to give expected
administrations, (2) trust in local governments to set up reasonable methodology for revenue
collection, and (3) trust in different natives to pay their offer. The bigger the part of the local
population that is not paying, the lower is the apparent risk of being arraigned. This affects the
individual ratepayer's view of the believability and dependability of the revenue organization. In
addition, the disposition of local political leaders concerning payment is by all accounts
imperative, for instance, by legitimizing non-payment through their own particular conduct. This
proposes there are reasons and extension for advancement.
As indicated by Egidario (2011) the issues of non-payment ought to consequently be assaulted
on a few fronts, including administration delivery, better organization and payment plans, and
group association. To accomplish this, inside and out learning and information are required on
payment levels for every ward, the extent of city accounts conveyed, the number and sort of
objections got, living conditions for the poorest sections of the population, including the elderly
and unemployed. Natives ought to be urged to report defaults, for example, spilling taps or
streetlights not working. The brief change of such grievances may persuade individuals that the
region implies business. Besides, natives' inclusion in recognizing issues and setting needs may
persuade a more prominent feeling of group contribution. At first, it may be fitting to connection
payment specifically to obvious changes in administrations. At last, the co-operation between
local government authorities and group leaders in setting shared objectives may be a vital trust-
upgrading gadget.

24
2.2.4.4 Excise Taxes
As indicated by Kippra, (2005) exercise taxes are collected on (imported) oil products and
additionally utilization of spirits and beer, cigarettes, matches, and tobacco. Prior to the Tax
Modernization Program (TMP), extract taxes had been collected at particular rates, however
direct to high expansion actuated a change to a promotion valorum premise.
2.3.5 Revenue Collection
Developing effective ways in revenue collection has been an important matter in tax and revenue
collection. Awitta, (2010) argues that the advent of new instruments to help businesses work
more efficiently affects the way taxes and revenues are collected. KRA embarked on extensive
implementation of various revenue collection strategies in its operations. This was to
significantly enhance revenue collection in all Departments.
Implementation of innovative revenue collection strategies was supposed to improve its
organization structures, training, manpower planning, developing teamwork among management
and staff, new approaches to reward management and adaptation of total quality management.
The influences of various revenue collection strategies on revenue collection have not been
investigated. The purpose of this study was to examine the effectiveness of revenue collection
strategies at KRA in Nairobi.
Heller (2005) argues that resource availability is an important issue in revenue mobilization.
According to him, three interrelated issues are involved. The first issue deals with the
distribution of taxation and expenditure under centralization or decentralization alternatives. That
is, who collects what and get what is a matter of concern. Another issue identifies with the level
of financial self-governance of local government versus reliance on central exchanges. The last
one raises an issue of effectiveness of whether decentralization builds the aggregate sum of
resources activated for public consumptions. Ultimately, the circulation of revenue sources and
consumption duties between levels of government is with the end goal that local public uses have
a tendency to surpass own-source revenues.
The overwhelming dependence of local government upon central exchanges implies that their
level of financial self-governance has a tendency to be entirely restricted. Heller (2005) further

25
contends that while the effect of decentralization on revenue rising is dubious; the most
significant proof proposes that administration structure and public resource activation have little
to do with each other.
As per a site report United Nations Development Program (UNDP) (2008), there are two
potential sources of revenue for local government, taxation and user charges. As per the study,
consideration is paid to the structure of local frameworks of taxation and the bases which have a
tendency to be depended upon; the utilization and propriety of local cost recuperation; and the
handy requirement confronted in revenue collection. The study takes note of that there are
minimal successful and wide base tax handles accessible to governments in developing nations
and that regardless of the level of government to which these taxes are doled out; frequently their
bases are constrained and their collection wasteful. The study further talks about that for
different reasons, hypothetical and political, local tax bases have a tendency to be more
constrained and divided than those abused by the inside. Moreover, regulatory shortcomings
seem to undermine the local tax push to a degree more noteworthy than that endured by the
middle. The study finds that practically speaking user charges imposed on a utilization bases,
have not been generally used at the local level.
Heller (2005), in his contention on the fundamental basic theory of taxation as referred to in the
site report UNDP (2008) says that tax bases which are unevenly appropriated between localities,
for example, those on common resource and exchange are unseemly contender for
decentralization as a result of their repercussions for value. In the perspective of Heller (2005),
income redistribution and adjustment are inside the best possible area of the national government
and that localities ought not to try to advance these goals through such means as corporate and
individual income taxes.
The site likewise refered to Francis and James (2003) who says that institutional, political,
authoritative, auxiliary and social imperatives describe the tax frameworks of developing nations
at both national and local level. Francis and James further expresses that, handy hindrances
which hinder productive revenue collection and cause significant revenue deficiencies are in no
way, shape or form unconventional to local government additionally an issue at the national
level. According to Francis and James, staff competence, well- defined tax legislation, and
effective means of enforcement constitute the best way to mitigate these challenges. Whether

26
central or local governments‟ ability to carry out their responsibilities to the citizenry or not is
dependent on the availability of financial resources to management.
2.4 Conceptual Framework
A conceptual framework is a diagrammatical research device proposed to help the researcher to
create mindfulness and comprehension of the circumstance under investigation and to convey
this. It is utilized as a part of research to layout conceivable strategies or to introduce a favored
way to deal with a thought or idea. It can be characterized as an arrangement of expansive
thoughts and standards taken from important fields of enquiry and used to structure a resulting
presentation (Douglas, 2004). The interconnection of these pieces finishes the framework for
certain normal results. The interconnection of these blocks completes the framework for certain
expected outcomes.
A dependent variable is what is measured in the experiment and what is influenced during the
experiment, it responds to the independent variable. The dependent variable in the study was
revenue collection. An independent variable is one that is attempted to influence or decide a
dependent variable. It can be changed as required, and its qualities don‟t speak to an issue
requiring clarification in an investigation, however are taken just as given. The independent
variables in the study were: revenue diversification of the revenue collection officers, revenue
administration, tax structure and forms of revenue.

27
CONCEPTUAL FRAME WORK
Independent Variables Dependent variable
Source: Author (2016)
Figure 2.1 Conceptual Framework
REVENUE COLLECTION
Timeliness in payments
Amount collected
Revenue Diversification
Number of sources of revenue
Restrictions
Policies
ADMINISTRATION
Staff competence
Computers
Communication system
Tax education
FORMS OF REVENUES
Property tax
Business license
Service charge
TAX STRUCTURE
Equitability
Neutrality
Flexibility
Simplicity
EXTRANEOUS VARIABLE
Inflation
Political uncertainty
28
2.5 Summary and gaps
It is clear from the above literature review that Local governments have a greater role of
providing services to the citizens and that the important role played by Local Authorities as
agents of decentralization; grassroots democracy; and engines for development is fully
recognized. The revenue raised by local governments is clearly central to their financial
sustainability and ability to serve their local communities. The capacity of local governments to
raise revenue is important to their financial sustainability and their ability to promote the well-
being of their local communities.
In Kenya, a lot of emphasis has been made on how Local Governments can be used to improve
governance and public participation in order to enlighten the communities that they serve on how
they can take part in projects development and programmes in their areas utilizing mainly the
revenues allocated to them by the National Government and their own revenues collected in their
areas of jurisdiction. On the other hand, several studies have also been done in regards to
reforming the financial performance of Local governments so that they can comply with the law
and regulations concerning central government transfers.
However, there is lack of studies done on the practical constraints faced in revenue collection. Of
concern to the Local Governments mainly has been the amounts collected to discharge its
statutory functions effectively. Little regards is given to who collects and how much could be
lost in such circumstances while considering that the revenue bases could be limited and
collection of revenue could be inefficient. What should be considered should be the amount of
revenue that a local government can actually raise which should depend on the willingness of its
community to pay depending on what the community expects from it. A balance should be struck
so that communities with larger populations who would tend to raise less own-source revenue
per person because they are able to achieve economies of scale in the delivery of some services
can be equalized with that of lower population so that they can all enjoy what they have paid for.
Without the availability of revenue, local governments will not only be incapable of serving the
people but will undoubtedly come to a halt. Therefore, for the local governments to discharge
their statutory functions effectively they should not only have adequate funds but such funds
should be harnessed and efficiently collected.

29
While the County Governments of Kenya have the mandate to collect revenue on behalf of the
National government and utilizing the same for establishing infrastructural programs and other
developments of their counties, there is a general perception that they are not able to raise
enough funds to finance such. This therefore informed this study about investigating factors
affecting revenue collection in Nairobi City County and how such identified gaps could be
bridged.

30
CHAPTER THREE
RESEARCH METHODOLOGY
3.1 Introduction
This chapter explained the methodology followed in order to establish factors affecting revenue
collection in Nairobi city county government. The chapter explained the study population,
sampling design and sample size, data collection methods, techniques, instruments, and
procedures.
3.2 Research Design
The study used a descriptive research design since the study intended to accumulate quantitative
information on factors affecting revenue collection in county governments in Kenya. According
to Sekaran (2006), descriptive research design is non-exploratory in that it manages the
connections between non-controlled variables in a characteristic as opposed to lab setting. Since
the occasions or conditions have already happened, the researcher chose the significant variables
for an analysis of their connections. The study considered this design appropriate since it
supports application of stratified random sampling technique to obtain information from few
respondents in order to have a general view of revenue collection in county governments in
Kenya.
3.3 Study Population
According to Kothari (2004), population is a well-defined set of people, elements, services and
events, a group of things or households which are being studied. The study population comprised
of 340 staff working as; 12 chief officers, 144 technical staff (finance), 56 technical staff
accountant) and 128 members of County assembly. The list containing the number of employees
in the various levels was obtained from the Nairobi county Human Resource department whereas
the list for members of county assembly was obtained from Nairobi City county government.
The study population is as shown in Table 3.1.
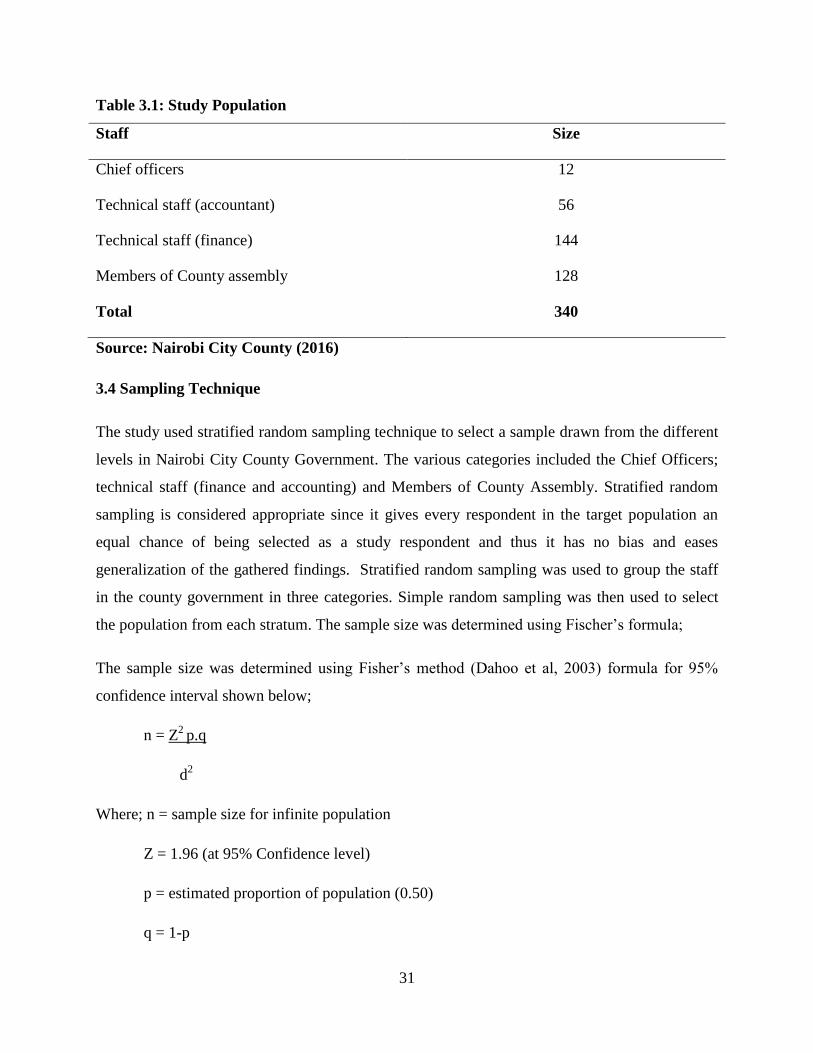
31
Table 3.1: Study Population
Staff Size
Chief officers 12
Technical staff (accountant) 56
Technical staff (finance) 144
Members of County assembly 128
Total 340
Source: Nairobi City County (2016)
3.4 Sampling Technique
The study used stratified random sampling technique to select a sample drawn from the different
levels in Nairobi City County Government. The various categories included the Chief Officers;
technical staff (finance and accounting) and Members of County Assembly. Stratified random
sampling is considered appropriate since it gives every respondent in the target population an
equal chance of being selected as a study respondent and thus it has no bias and eases
generalization of the gathered findings. Stratified random sampling was used to group the staff
in the county government in three categories. Simple random sampling was then used to select
the population from each stratum. The sample size was determined using Fischer‟s formula;
The sample size was determined using Fisher‟s method (Dahoo et al, 2003) formula for 95%
confidence interval shown below;
n = Z2
p.q
d2
Where; n = sample size for infinite population
Z = 1.96 (at 95% Confidence level)
p = estimated proportion of population (0.50)
q = 1-p

32
d = precision of the estimate at 5% (0.05)
The sample size was;
n = (1.96)2 x 0.50x 0.5
(0.05)
2
n = 0.4609 = 384
0.0025
The adjusted sample size for the finite population of 340 respondents will be;
n1 = 1
1/n + 1/N
Where; n1 = adjusted sample size
n = estimated sample size for infinite population
N = Finite population size
n1 = 1 = 180 respondents
1/384 + 1/340
Table 3.2 Sample Size
Staff Strata Size Sample Size/Strata
Chief officers 12 6
Technical staff (accountant) 56 30
Technical staff (finance) 144 76
Members of County assembly 128 68
Total 340 180
Source: Author (2016)
33
3.5 Data Collection Instruments
The researcher used primary data sources. Primary data source was gathered using a semi-
organized questionnaire. The questionnaires ordinarily have composed inquiries that the
respondents answer directly to the questions being investigated. The questionnaires were utilized
as a part of this study since they offer a viable strategy for gathering data from an enormous
extent of reactions before they are quantitatively investigated. Moreover, questionnaires as data
collection technique are the most broadly perceived system in various social studies (Brace,
2008). Further, the use of questionnaires enhances the expository system, as the data that is
amassed utilizing the instruments will be changed over into quantitative data easily (Backlund
and Suikki, 2005). The questionnaire contained both open and close-ended inquiries.
3.5.1 Reliability and Validity of Data
According to Mora (2011) instrument reliability demonstrates the internal consistency of things
representing a latent construct. It alludes to the degree to which instruments are reliably
measuring what they should quantify. The reliability of the data and findings is one of the main
prerequisites of any research procedure. According to Field (2009), validity is pertinent to
determine the precision of the estimation scales with a specific objective to evaluate the degree
to which proposed constructs have been captured, that is, to examine the validity of the
instrument. Validity of research instruments guarantees a logical help of the findings arising
from data collection instruments.
A pilot study was embraced to pretest data collection instruments for validity and reliability.
According to Sekaran (2006), a pilot study is important for testing the validity and reliability of
data collection instruments. Dempsey (2006) explained reliability of research as determining
whether the research really measures what it was intended to gauge or how honest the research
results are. Pilot study is consequently directed to recognize shortcoming in design and
instrumentation and to give exact data to determination of a sample (Cooper and Schindler,
2003). Validity alludes to the degree to which an instrument measures what should gauge. Data
need to be solid as well as genuine and precise (Dempsey, 2003). Pilot study was done using
staff in various levels of the institutions where the staff were relied upon to tick if the item in the
questionnaire addresses to the factors affecting revenue collection.
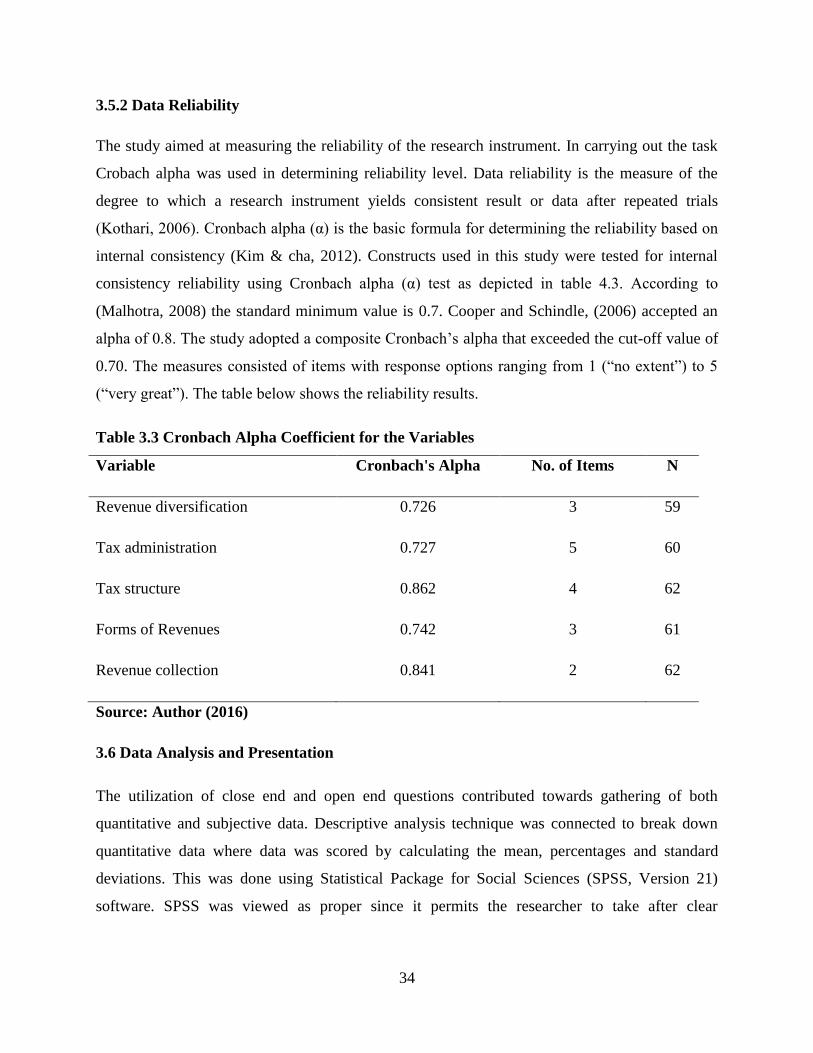
34
3.5.2 Data Reliability
The study aimed at measuring the reliability of the research instrument. In carrying out the task
Crobach alpha was used in determining reliability level. Data reliability is the measure of the
degree to which a research instrument yields consistent result or data after repeated trials
(Kothari, 2006). Cronbach alpha (α) is the basic formula for determining the reliability based on
internal consistency (Kim & cha, 2012). Constructs used in this study were tested for internal
consistency reliability using Cronbach alpha (α) test as depicted in table 4.3. According to
(Malhotra, 2008) the standard minimum value is 0.7. Cooper and Schindle, (2006) accepted an
alpha of 0.8. The study adopted a composite Cronbach‟s alpha that exceeded the cut-off value of
0.70. The measures consisted of items with response options ranging from 1 (“no extent”) to 5
(“very great”). The table below shows the reliability results.
Table 3.3 Cronbach Alpha Coefficient for the Variables
Variable Cronbach's Alpha No. of Items N
Revenue diversification 0.726 3 59
Tax administration 0.727 5 60
Tax structure 0.862 4 62
Forms of Revenues 0.742 3 61
Revenue collection 0.841 2 62
Source: Author (2016)
3.6 Data Analysis and Presentation
The utilization of close end and open end questions contributed towards gathering of both
quantitative and subjective data. Descriptive analysis technique was connected to break down
quantitative data where data was scored by calculating the mean, percentages and standard
deviations. This was done using Statistical Package for Social Sciences (SPSS, Version 21)
software. SPSS was viewed as proper since it permits the researcher to take after clear

35
arrangement of quantitative data analysis systems that lead to increased data validity and
reliability and exhibited the relationship between the research variables.
Qualitative data was drawn from open-ended questions in the questionnaire. This was analyzed
through summarizing the set of observations drawn from the respondents using content analysis.
Common set of observation was assigned numerical value and entered into the SPSS computer
system. The analyzed findings were then presented inform of tables. Qualitative data was drawn
from open-ended question in the questionnaire. This was analyzed through summarizing the set
of observations drawn from the respondents using content analysis. Regression analysis and
covariance analysis was applied to show the relationship between the research variables.
The study used the following regression model:
Y = β0 + β1X1 + β2X2 + β3X3 + β4X4+ ε
Where:
Y= Revenue collection
β0=Constant
β1……... β4= Coefficient of the variables
X1=Revenue diversification
X2= Administration
X3=Tax structure
X4= forms of revenue
ε= Error term
3.6.1 Revenue diversification: Revenue diversification was measured using three items on a
Likert scale. An example of an item for the scale was “Number of sources of revenue influence
the level of revenue collection”. Revenue diversification had Cronbach alpha (α) of 0.726. This
therefore satisfies the minimum threshold of reliability test.

36
3.6.2 Tax administration: Tax administration was measured using five items anchored on a
five-point Likert scale. For all measurement scales, standardized Cronbach‟s alpha was
examined. Tax administration had Cronbach alpha (α) of 0.727. This therefore satisfies the
minimum threshold of reliability test.
Summary of all item measures for variables and reliability statistics are presented in (Table 4.5).
3.6.3 Tax structure: Tax structure was measured using seven items anchored on a five-point
Likert scale. Tax structure had Cronbach alpha (α) of 0.862. This therefore satisfies the minimum
threshold of reliability test.
3.6.4 Forms of Revenues: was measured using three items anchored on a five-point Likert scale.
For all measurement scales, standardized Cronbach‟s alpha was examined. Forms of Revenues
had Cronbach alpha (α) of 0.742. This therefore satisfies the minimum threshold of reliability
test.
3.6.5 Revenue collection: Had two (2) questionnaire items. Respondent opinions were captured
on 5-point Likert type scale with (1) representing (no extent) to (5) representing (very great
extent). The scale had Cronbach‟s alpha coefficient of 0.841. Summary of all item measures for
variables and reliability statistics are presented in (table 4.3).
3.7 Diagnostic Tests
The researcher further conducted a multicollinearity test. Multicollinearity is a frequently
encountered statistical procedure in which two or more independent variables in a numerous
regression model are exceedingly corresponded (Cameron & Trivedi, 2013). In this study, the
researcher conducted a multicollinearity test as one of the assumptions of regression to determine
the internal relationship of the variables.
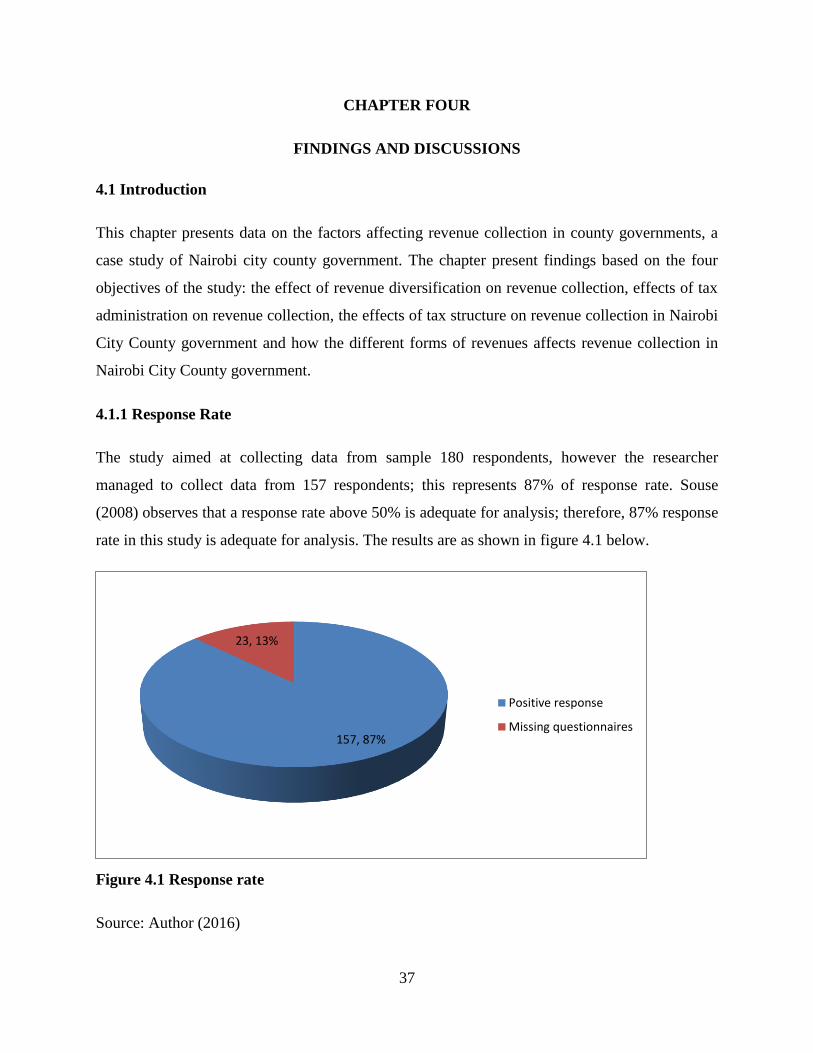
37
CHAPTER FOUR
FINDINGS AND DISCUSSIONS
4.1 Introduction
This chapter presents data on the factors affecting revenue collection in county governments, a
case study of Nairobi city county government. The chapter present findings based on the four
objectives of the study: the effect of revenue diversification on revenue collection, effects of tax
administration on revenue collection, the effects of tax structure on revenue collection in Nairobi
City County government and how the different forms of revenues affects revenue collection in
Nairobi City County government.
4.1.1 Response Rate
The study aimed at collecting data from sample 180 respondents, however the researcher
managed to collect data from 157 respondents; this represents 87% of response rate. Souse
(2008) observes that a response rate above 50% is adequate for analysis; therefore, 87% response
rate in this study is adequate for analysis. The results are as shown in figure 4.1 below.
Figure 4.1 Response rate
Source: Author (2016)
157, 87%
23, 13%
Positive response
Missing questionnaires
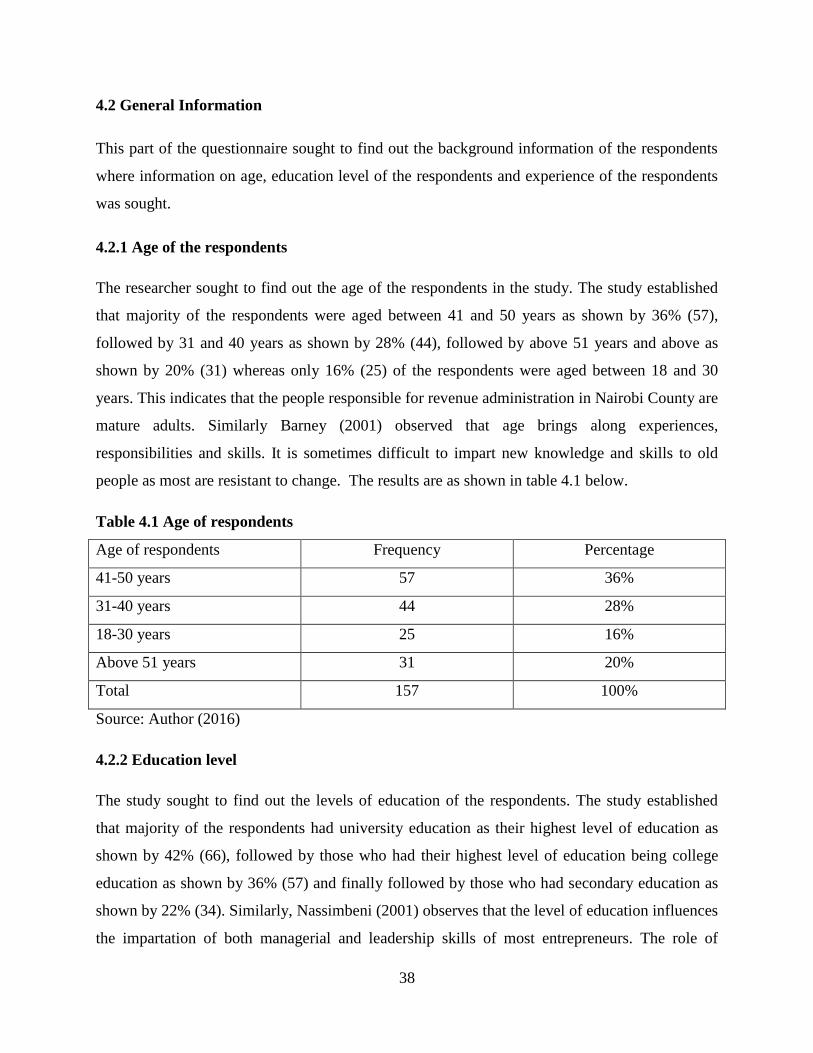
38
4.2 General Information
This part of the questionnaire sought to find out the background information of the respondents
where information on age, education level of the respondents and experience of the respondents
was sought.
4.2.1 Age of the respondents
The researcher sought to find out the age of the respondents in the study. The study established
that majority of the respondents were aged between 41 and 50 years as shown by 36% (57),
followed by 31 and 40 years as shown by 28% (44), followed by above 51 years and above as
shown by 20% (31) whereas only 16% (25) of the respondents were aged between 18 and 30
years. This indicates that the people responsible for revenue administration in Nairobi County are
mature adults. Similarly Barney (2001) observed that age brings along experiences,
responsibilities and skills. It is sometimes difficult to impart new knowledge and skills to old
people as most are resistant to change. The results are as shown in table 4.1 below.
Table 4.1 Age of respondents
Age of respondents Frequency Percentage
41-50 years 57 36%
31-40 years 44 28%
18-30 years 25 16%
Above 51 years 31 20%
Total 157 100%
Source: Author (2016)
4.2.2 Education level
The study sought to find out the levels of education of the respondents. The study established
that majority of the respondents had university education as their highest level of education as
shown by 42% (66), followed by those who had their highest level of education being college
education as shown by 36% (57) and finally followed by those who had secondary education as
shown by 22% (34). Similarly, Nassimbeni (2001) observes that the level of education influences
the impartation of both managerial and leadership skills of most entrepreneurs. The role of

39
education as a change agent is indisputable and has always been a central mechanism for
transmission of skills and values for the sustenance of societies and promotion of social change.
The results are as shown in the table 4.2 below
Table 4.2 Education level
Education level Frequency Percentage
Primary level 0 -
Secondary level 34 22%
College level 57 36%
University level 66 42%
Total 157 100%
Source: Author (2016)
4.2.3 Working Experience
The researcher also sought to find out the experience of the respondents in their occupation. The
study found that majority of the respondents had their work experience between 11 and 15 years
as shown by 44% (69), followed by 15 years of experience and above as shown by 23% (36),
followed by 6 and 10 years as shown by 21% (33) whereas 11% (17) of the respondents had their
experience of less than 5 years. The results are as shown in the figure 4.2 below.
Figure 4.2 Working experience
Source: Author (2016)
44%
23% 21%
11%
0%
5%
10%
15%
20%
25%
30%
35%
40%
45%
50%
11 and 15 years 15 years and above 6 and 10 years Less than 5 years
Per
cen
tage
Years of Experience

40
4.3 Revenue Diversification
The study sought to establish the effect of revenue diversification on revenue collection in
Nairobi County government. In carrying out this task the study used a Likert scale of 1 to 5
where1= not at all, 2 = little extent, 3 = moderate extent, 4 = great extent and 5 = very great
extent to rate the extent to rate the extent to which the respondents agreed with statements on
revenue diversification provided. The study findings on the number of revenue sources of
income indicate that the majority of the respondents agreed that the number of revenue sources
had great effect on revenue allocation forming 38.2% (60) followed by those who said it had a
moderate extent at 32.5% (51), very great extent at 29.3% (46) while there were no respondents
on low extent and no extent at all. On policies, the majority identified great extent at 56.7% (89)
followed by those who identified a very great extent at 26.8% (42) while 16.6% (26) said the
extent was moderate. Results on restrictions indicate that the majority identified a great extent
forming 52.2% (82) followed by a very great extent at 31.8% (50) while moderate extent formed
15.9% (25) of the total responses. The results are shown in table 4.3 below.
Table 4.3 Revenue Diversification
Cases
Not at all Low extent
Moderate
extent
Great
extent
Very
great
extent
f % f % f % f % f %
Number of revenue sources of
income 0 0 0 0 51 32.5 60
38.2
46
29.3
Policies 0 0 0 0 26 16.6 89
56.7 42
26.8
Restrictions 0 0 0 0 25 15.9 82
52.2
50
31.8
Source: Author (2016)

41
The study findings are as similar to the one posited by Oates (2005) that the utilization of various
sources of revenues guarantees the consistency and stability of sources of revenue in public
finance. It also gives the suggestion that nobody has control upon to the detriment of different
sources of finance. This guarantees the coherence in the administration in the public sector as
salary stream is predictable. Hendrick (2002) includes that extending the revenue sources obliges
new developing spending prerequisite of a local government as far as new legal controls,
political activities and constantly changing financial cycle in an administration. To adapt to these
rising difficulties in this way an expanded and wide base of revenue source ought to be built up.
4.4 Tax Administration
The study sought to establish the effect of tax administration on revenue collection in Nairobi
County government. In carrying out this task the study used a Likert scale of 1 to 5 where 1= not
at all, 2 = little extent, 3 = moderate extent, 4 = great extent and 5 = very great extent to rate the
extent to rate the extent to which the respondents agreed with statements on tax administration
provided. The study findings indicate that the majority identified a great extent in competence of
staff forming 42.7% (67) of the responses, followed by very great extent at 29.3% (46) while
moderate extent formed 28.0% (44) of the responses. On the availability of computers, the
majority identified great extent forming 55.4% (48) of the responses, followed by very great
extent at 30.6% (48) while moderate extent formed 14.0% (22) of the responses. On the use of a
third party to collect revenue, the majority identified its effect to be very great forming 59.2%
(93) followed by great extent at 25.5% (40) while 15.3% (24) formed moderate extent. Finally,
on the availability of postal and communication system, the majority identified moderate extent
forming 43.9% (69) followed by very great extent at 29.3% (46) while great extent formed
26.8% (42) of the responses. Table 4.4 below gives a summary of the study findings on tax
administration.
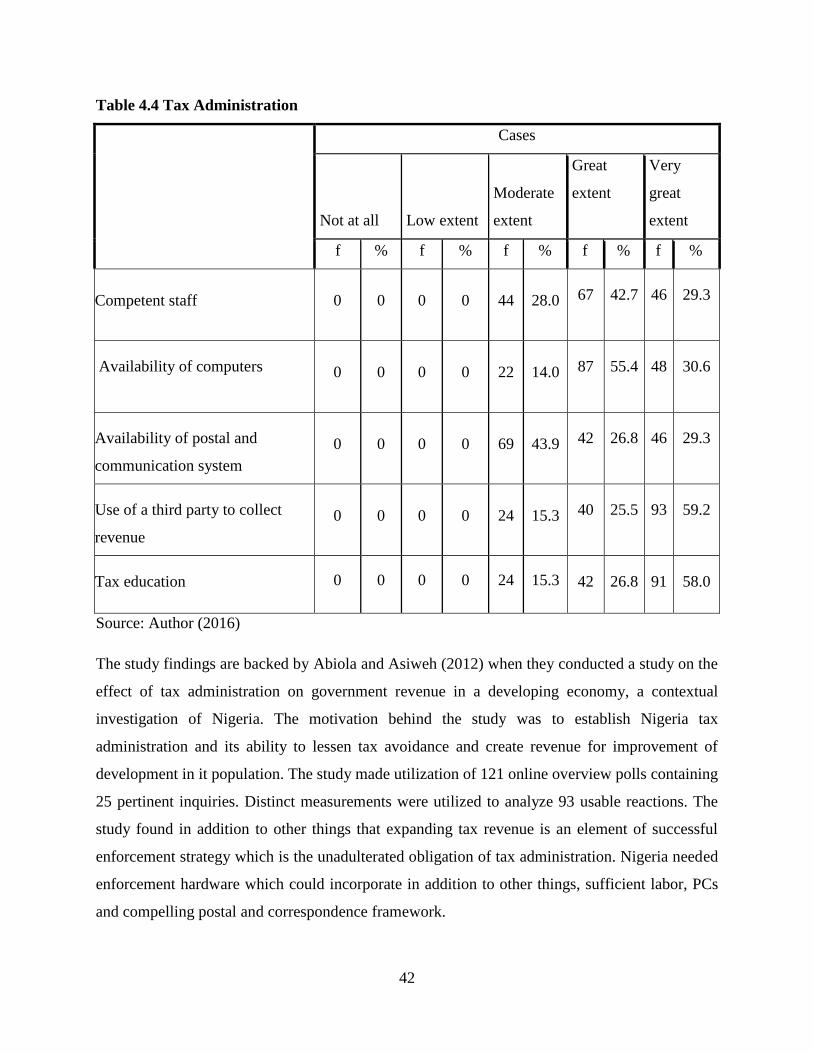
42
Table 4.4 Tax Administration
Cases
Not at all Low extent
Moderate
extent
Great
extent
Very
great
extent
f % f % f % f % f %
Competent staff 0 0 0 0 44 28.0 67 42.7
46
29.3
Availability of computers 0 0 0 0 22 14.0 87 55.4
48 30.6
Availability of postal and
communication system
0 0 0 0 69 43.9 42 26.8 46 29.3
Use of a third party to collect
revenue
0 0 0 0 24 15.3 40 25.5 93 59.2
Tax education 0 0 0 0 24 15.3 42 26.8 91 58.0
Source: Author (2016)
The study findings are backed by Abiola and Asiweh (2012) when they conducted a study on the
effect of tax administration on government revenue in a developing economy, a contextual
investigation of Nigeria. The motivation behind the study was to establish Nigeria tax
administration and its ability to lessen tax avoidance and create revenue for improvement of
development in it population. The study made utilization of 121 online overview polls containing
25 pertinent inquiries. Distinct measurements were utilized to analyze 93 usable reactions. The
study found in addition to other things that expanding tax revenue is an element of successful
enforcement strategy which is the unadulterated obligation of tax administration. Nigeria needed
enforcement hardware which could incorporate in addition to other things, sufficient labor, PCs
and compelling postal and correspondence framework.
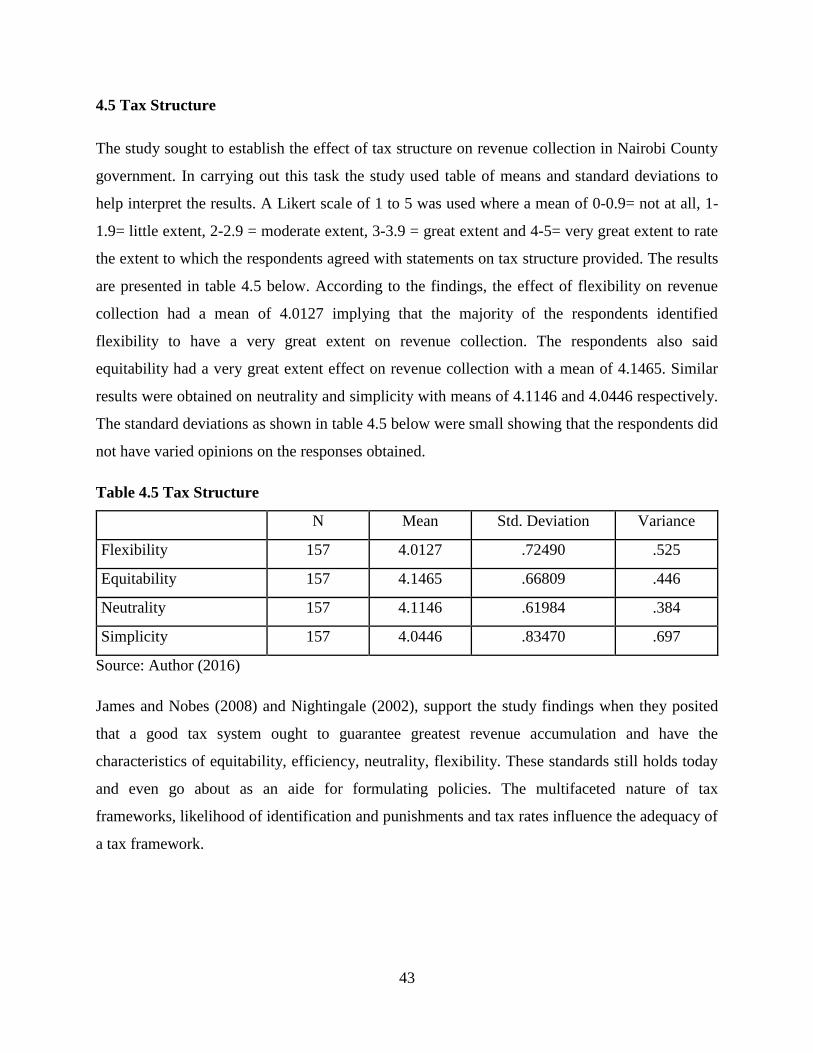
43
4.5 Tax Structure
The study sought to establish the effect of tax structure on revenue collection in Nairobi County
government. In carrying out this task the study used table of means and standard deviations to
help interpret the results. A Likert scale of 1 to 5 was used where a mean of 0-0.9= not at all, 1-
1.9= little extent, 2-2.9 = moderate extent, 3-3.9 = great extent and 4-5= very great extent to rate
the extent to which the respondents agreed with statements on tax structure provided. The results
are presented in table 4.5 below. According to the findings, the effect of flexibility on revenue
collection had a mean of 4.0127 implying that the majority of the respondents identified
flexibility to have a very great extent on revenue collection. The respondents also said
equitability had a very great extent effect on revenue collection with a mean of 4.1465. Similar
results were obtained on neutrality and simplicity with means of 4.1146 and 4.0446 respectively.
The standard deviations as shown in table 4.5 below were small showing that the respondents did
not have varied opinions on the responses obtained.
Table 4.5 Tax Structure
N Mean Std. Deviation Variance
Flexibility 157 4.0127 .72490 .525
Equitability 157 4.1465 .66809 .446
Neutrality 157 4.1146 .61984 .384
Simplicity 157 4.0446 .83470 .697
Source: Author (2016)
James and Nobes (2008) and Nightingale (2002), support the study findings when they posited
that a good tax system ought to guarantee greatest revenue accumulation and have the
characteristics of equitability, efficiency, neutrality, flexibility. These standards still holds today
and even go about as an aide for formulating policies. The multifaceted nature of tax
frameworks, likelihood of identification and punishments and tax rates influence the adequacy of
a tax framework.
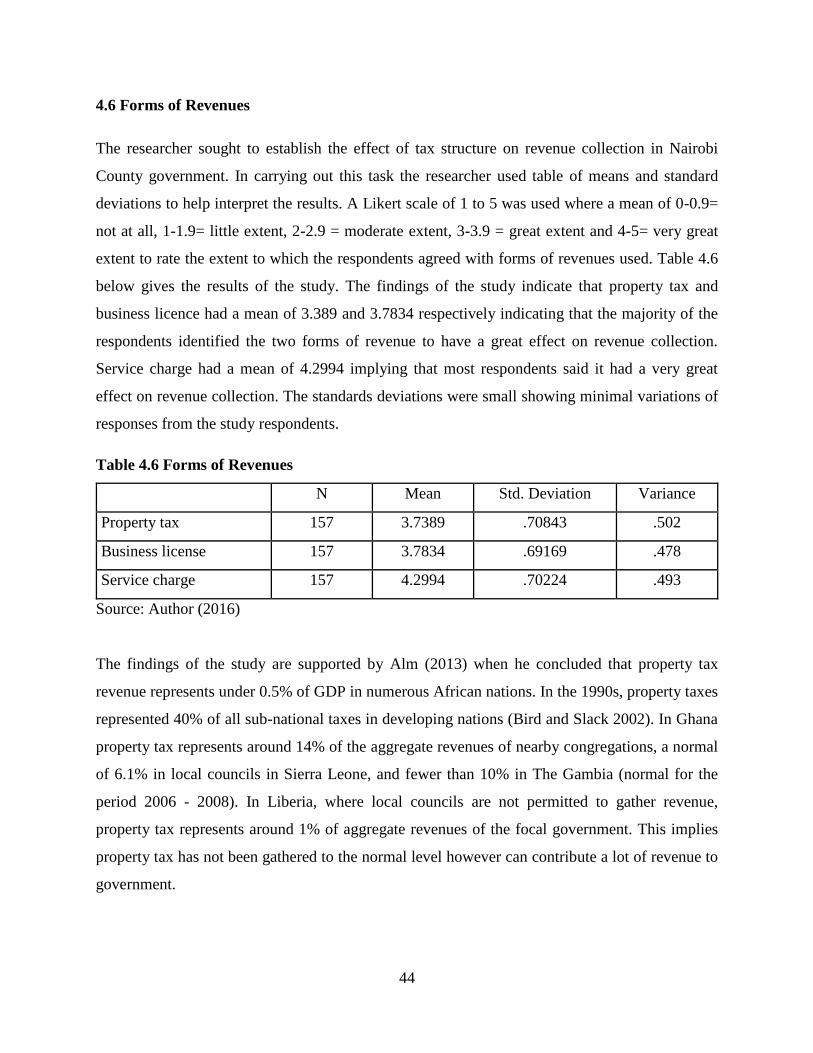
44
4.6 Forms of Revenues
The researcher sought to establish the effect of tax structure on revenue collection in Nairobi
County government. In carrying out this task the researcher used table of means and standard
deviations to help interpret the results. A Likert scale of 1 to 5 was used where a mean of 0-0.9=
not at all, 1-1.9= little extent, 2-2.9 = moderate extent, 3-3.9 = great extent and 4-5= very great
extent to rate the extent to which the respondents agreed with forms of revenues used. Table 4.6
below gives the results of the study. The findings of the study indicate that property tax and
business licence had a mean of 3.389 and 3.7834 respectively indicating that the majority of the
respondents identified the two forms of revenue to have a great effect on revenue collection.
Service charge had a mean of 4.2994 implying that most respondents said it had a very great
effect on revenue collection. The standards deviations were small showing minimal variations of
responses from the study respondents.
Table 4.6 Forms of Revenues
N Mean Std. Deviation Variance
Property tax 157 3.7389 .70843 .502
Business license 157 3.7834 .69169 .478
Service charge 157 4.2994 .70224 .493
Source: Author (2016)
The findings of the study are supported by Alm (2013) when he concluded that property tax
revenue represents under 0.5% of GDP in numerous African nations. In the 1990s, property taxes
represented 40% of all sub-national taxes in developing nations (Bird and Slack 2002). In Ghana
property tax represents around 14% of the aggregate revenues of nearby congregations, a normal
of 6.1% in local councils in Sierra Leone, and fewer than 10% in The Gambia (normal for the
period 2006 - 2008). In Liberia, where local councils are not permitted to gather revenue,
property tax represents around 1% of aggregate revenues of the focal government. This implies
property tax has not been gathered to the normal level however can contribute a lot of revenue to
government.
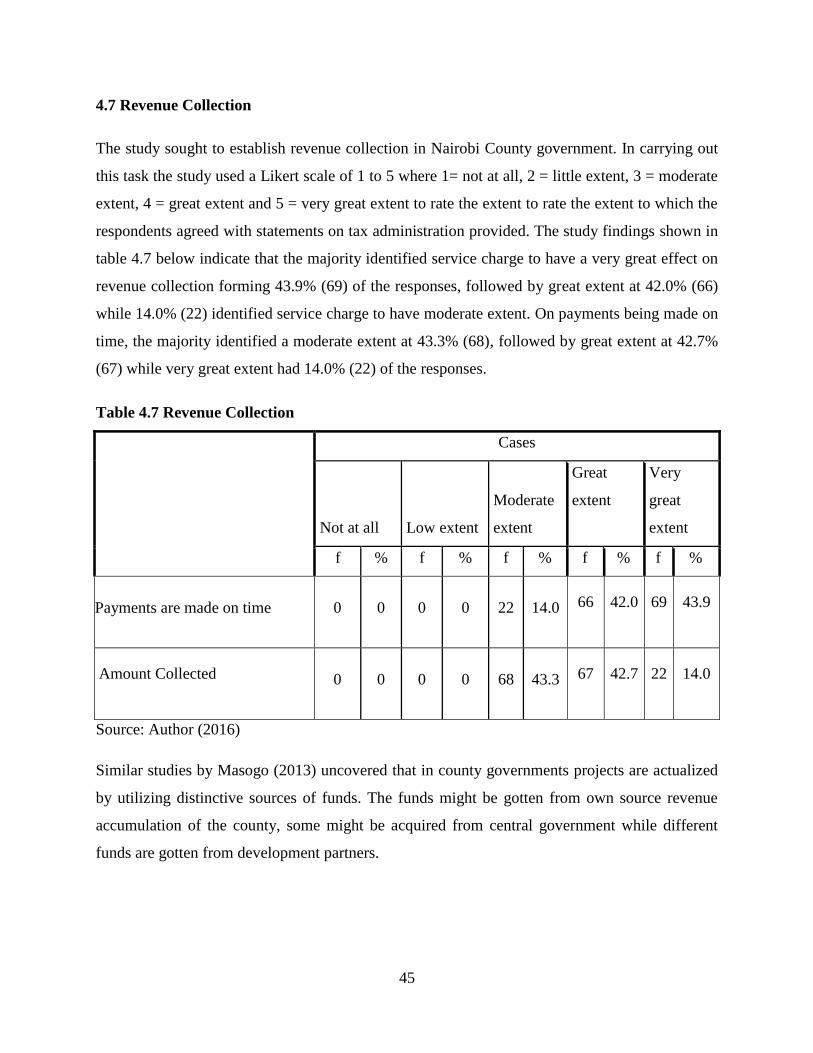
45
4.7 Revenue Collection
The study sought to establish revenue collection in Nairobi County government. In carrying out
this task the study used a Likert scale of 1 to 5 where 1= not at all, 2 = little extent, 3 = moderate
extent, 4 = great extent and 5 = very great extent to rate the extent to rate the extent to which the
respondents agreed with statements on tax administration provided. The study findings shown in
table 4.7 below indicate that the majority identified service charge to have a very great effect on
revenue collection forming 43.9% (69) of the responses, followed by great extent at 42.0% (66)
while 14.0% (22) identified service charge to have moderate extent. On payments being made on
time, the majority identified a moderate extent at 43.3% (68), followed by great extent at 42.7%
(67) while very great extent had 14.0% (22) of the responses.
Table 4.7 Revenue Collection
Cases
Not at all Low extent
Moderate
extent
Great
extent
Very
great
extent
f % f % f % f % f %
Payments are made on time 0 0 0 0 22 14.0 66 42.0
69
43.9
Amount Collected 0 0 0 0 68 43.3 67 42.7
22 14.0
Source: Author (2016)
Similar studies by Masogo (2013) uncovered that in county governments projects are actualized
by utilizing distinctive sources of funds. The funds might be gotten from own source revenue
accumulation of the county, some might be acquired from central government while different
funds are gotten from development partners.

46
4.8 Hypothesis Testing
This research started with a hypothesis that there is no statistically significant effect of selected
factors affecting revenue collection on revenue collection in Nairobi city county government. In
this study, chi-square analysis was conducted to test for the influence of factors of revenue on
revenue collection. The test of significance was tested at the 5% level of significance. Findings
are as illustrated in tables below.
Table 4.8 Test of Hypothesis on revenue diversification
Pearson Chi-
Square
Sample size
(n)
Degrees of freedom
(df)
Sig. (1-
sided)
Revenue
diversification
0.585 157 156 0.027
Source: Author (2016)
Table 4.8 gives the chi-square test results. The table indicates that, the Pearson chi-square testing
the relationship between revenue diversification and revenue collection had a value of 0.585
which is significant at the 5% level as the asymptotic significance (1-sided) indicate a value of
0.027 which is less than 0.05 the critical value at the 5% level in a 1-tailed test. Thus the results
present sufficient evidence of rejecting the Null Hypothesis and therefore the study concludes
that, revenue diversification had a significant effect on revenue collection.
Table 4.9 Test of Hypothesis on Tax Administration
Pearson Chi-
Square
Sample size
(n)
Degrees of freedom
(df)
Sig. (1-
sided)
Tax
administration
1.125 157 156 0.013
Source: Author (2016)

47
From the table 4.9 also, the chi-square test of significance for the relationship between the tax
administration and revenue collection showed a coefficient of 1.125 with 156 degrees of freedom
and a significance value of 0.013 which is less than 0.05. Therefore, the findings give evidence
of the relationship between tax administration and revenue collection in Nairobi city county
government.
Table 4.10 Test of Hypothesis on Tax Structure
Pearson Chi-Square Sample size (n) Degrees of freedom (df) Sig. (1-sided)
Tax structure .301 157 156 0.020
Source: Author (2016)
Similarly from the table 4.10 testing the relationship between tax structure and revenue
collection, the findings showed evidence of rejecting the null hypothesis suggesting that there is
a significant relationship between the two variables. This is as illustrated by the chi-square test
results showing a chi-square coefficient of 0.301 with 156 degrees of freedom and a p-value of
0.020 which is below 0.05.
Table 4.11 Test of Hypothesis on Forms of Revenue
Pearson Chi-
Square
Sample size
(n)
Degrees of freedom
(df)
Sig. (1-
sided)
Forms of
revenue
0.241 157 156 0.042
Source: Author (2016)
From table 4.11, a significant relationship was also present between forms of revenue and
revenue collection in Nairobi city county government. This as shown in Table 4.8 had a chi-
square coefficient of 0.241 with 156 degrees of freedom and a significant value of 0.042 which is
less than 0.05. Therefore this gives evidence of existence of the relationship between forms of
revenue and revenue collection

48
Hypothesis: There is no statistically significant effect of selected factors affecting revenue
collection on revenue collection in Nairobi city county government
4.9 Regression Analysis
In this study, a multiple regression analysis was conducted to test the relationship among
variables (independent variables; revenue diversification, tax administration, tax structure and
forms of revenue collected and the dependent variable; revenue collection).
Table 4.12 Regression Model Summary
Model R R Square Adjusted R Square Std. Error of the
Estimate
1 .772a .727 .709 .61863
a. Predictors: (Constant), Revenue diversification, Tax administration, Tax structure, Forms of
revenue
As illustrated in table 4.12 above the predictor variables (Revenue diversification, Tax
administration, Tax structure, Forms of revenue) explain 77.2% of the variation in revenue
collection. This is as given by the R coefficient with a value of 0.772. Thus, based on this
coefficient, other factors that were not considered in this research contribute to 22.8% (1-0.709=
0.228 expressed as percentage) of the variability in revenue collection in the county. From the
table also, the results presented are 70.9% reliable as indicated by the Adjusted R square
coefficient. This shows that, had the study been conducted using the entire population rather than
a sample or could the sample have been altered to replace some of respondents not selected, the
results would have a variance of 29.1% (1-.709) from the current results.
Table 4.13 Revenue collection ANOVA
Model Sum of Squares df Mean Square F Sig.
1
Regression 28.237 4 7.059 18.446 .000b
Residual 58.170 152 .383
Total 86.408 156
a. Dependent Variable: Revenue collection

49
b. Predictors: (Constant), Revenue diversification, Tax administration, Tax structure, Forms of
revenue
As illustrated in table 4.13 above, the significance value in testing the reliability of the model for
the relationship between Revenue diversification, Tax administration, Tax structure and Forms of
revenue with revenue collection in the county government of Nairobi was obtained as 0.000
which is less than 0.05 the critical value at 95% significance level. Therefore the model is
statistically significant in predicting the relationship between dependent (revenue collection) and
independent variables of the study (Revenue diversification, Tax administration, Tax structure
and Forms of revenue). The F value from the table is 18.446 indicating a significant model for
the relationship as given by the regression coefficients. This shows that the overall model was
statistically significant and reliable in explaining the influence of the predictor variables to the
revenue collection in the county government of Nairobi.
Table 4.14 Regression Coefficients for revenue collection
Model Unstandardized
Coefficients
Standardized
Coefficients
t Sig.
B Std. Error Beta
1
(Constant) 6.885 .589 11.689 .000
Revenue
diversification .584 .076 .569 7.686 .003
Tax administration .695 .079 .685 2.208 .008
Tax structure .659 .086 .632 2.850 .019
Forms of revenue .687 .064 .622 4.465 .000
a. Dependent Variable: Revenue collection
The findings shown in table 4.14 indicate that all the variables had a positive and significant
influence on service delivery. According to the results, revenue diversification had a significant
influence on revenue collection as shown by the coefficient (B = 0.584, t = 7.686, p> 0.03). Tax
administration also showed a significant influence on revenue collection with the coefficients
(B= 0.695, t = 2.208, p> 0.008) indicating a positive effect on revenue collection. Tax structure
as well showed a significant influence with a coefficient of (B = 0.659, t = 2.850, p> 0.019)

50
showing a positive and significant relationship. Similarly, forms of revenue indicated a
significant positive influence with coefficients (B = 0.687, t = 4.465, p> 0.000).
The study used the following regression model:
Y = β0 + β1X1 + β2X2 + β3X3 + β4X4+ ε
Where:
Y= Revenue collection
β0=Constant
β1……... β4= Coefficient of the variables
X1=Revenue diversification
X2= Administration
X3=Tax structure
X4= forms of revenue
ε= Error term
Therefore;
Revenue collection= 6.885 + 0.584 Revenue diversification + 0.695 Tax administration + 0.659
Tax structure + 0.687 Forms of revenue + .589
4.10 Diagnostic Tests
The researcher conducted a multicollinearity test. The researcher made further attempt to
minimize and/or avoid Common Method Variance (CMV) problem in the study. The precautions
taken in designing the questionnaires (i.e. use of multi-item scales) as well as identifying
different respondents for the independent and dependent variables, as already done, are
preliminary mechanisms to minimize this problem. In addition to these precautions, the data is
further tested or checked for CMV problem before commencing data analysis. The study
therefore adopted collinearity analysis to test for collinearity issues, which might have arose
during the study. According to the findings in table 4.15 below, the spread of the VIF values is
very low (less than 2.5), indicating that there were no major problems in the study.

51
Table 4.15 Test of Multicollinearity Coefficients
Model Collinearity Statistics
Tolerance VIF
1
Revenue diversification .896 1.116
Tax administration .434 2.303
Tax structure .418 2.391
Forms of revenue .979 1.021
a. Dependent Variable: Revenue collection
Table 4.16 Multicollinearity Diagnostics
Mod
el
Dimensio
n
Eigenval
ue
Conditio
n Index
Variance Proportions
(Const
ant)
Revenue
diversificati
on
Tax
administrati
on
Tax
structure
Forms
of
revenue
1
1 4.913 1.000 .00 .00 .00 .00 .00
2 .039 11.259 .01 .53 .00 .00 .23
3 .033 12.167 .01 .33 .17 .06 .09
4 .009 23.722 .40 .12 .47 .26 .33
5 .006 28.177 .58 .01 .36 .68 .35
a. Dependent Variable: Revenue collection
The diagnostics test as given by VIFs and Eigen values in this case indicate no major collinearity
problems in the data alongside other diagnostic tests hence revealing no such severity. In
addition to the findings in Table 4.15 and Table 4.16, the overall evidence from the collinearity
diagnostics conducted in this study indicates that collinearity has not caused problems for the
study and that the existence of low level collinearity cannot make the result statistically different
in any way. Therefore there is no significant collinearity in the data set that could hinder
regression analysis as provided in the methodology.
52
CHAPTER FIVE
SUMMARY OF FINDINGS, CONCLUSIONS AND RECOMMENDATIONS
5.1 Introduction
This chapter presented the summary of the findings, conclusions and recommendations on the
factors affecting revenue collection in county governments.
5.2 Summary of the Findings
On revenue diversification, the study found out that it had an effect on the amount of revenue
collected where the majority of the respondents indicated revenue diversification to have a great
and very extent effect on revenue collection. The majority of the respondents said the number of
revenue sources of income, policies and restrictions had a great extent on revenue collection in
the county government of Nairobi.
The study also determined that tax administration affects the amount of revenue collected in
Nairobi County in this case: the majority of the study respondents identified competence of staff,
the availability of computers, the use of a third party to collect revenue, and the availability of
postal and communication system, to have a great extent effect on revenue collection.
The study further found out that tax structure has an effect on the amount of revenue collected in
Nairobi County. On flexibility of the tax structure, the majority identified it to have a very great
extent on revenue collection; the effect of equitability also had a very great on revenue
collection; neutrality as well had a very extent effect on revenue collection as well as simplicity.
Finally, the study found out that different forms of revenues had an effect on the amount of
revenue collected in Nairobi County. The findings of the study indicate that property tax and
business licence had a mean of 3.389 and 3.7834 respectively indicating that the majority of the
respondents identified the two forms of revenue to have a great effect on revenue collection.
Service charge had a mean of 4.2994 implying that most respondents said it had a very great
effect on revenue collection.
53
5.3 Conclusions
Based on the study findings, the study made the following conclusions.
The study concluded that revenue diversification had an effect on the amount of revenue
collected. The number of revenue sources of income, policies and restrictions had a great extent
on revenue collection in the county government of Nairobi.
The study also concluded that tax administration affects the amount of revenue collected in
Nairobi County. Competence of staff, the availability of computers, use of a third party to collect
revenue and the availability of postal and communication system had a great extent effect on
revenue collection.
The study further concluded that tax structure has an effect on the amount of revenue collected in
Nairobi County. Flexibility of the tax structure, equitability, neutrality as well as simplicity all
had an effect on the revenue collected in the government of Nairobi.
Finally, the study concluded that different forms of revenues had an effect on the amount of
revenue collected in Nairobi County. Property tax, business licence and service charge had a
very great effect on revenue collection in the county government of Nairobi.
5.4 Recommendations
5.4.1 Policy Recommendations
The study recommends that since revenue diversification was found to be having an effect on
revenue collection in Nairobi County. The county administrators and the members of county
representatives‟ need to come up with more areas/ channels where revenues can be gotten from
in order to increase the amount collected in the county.
The study further recommends that ways be improved where the tax administrators and staff are
trained on how they can improve their education on tax matters in order to increase on the
amount of tax that that can be collected in the county. It is recommended that county
governments should create competitive terms for their employees in order to attract skilled and
competitive employees. More so, county governments should organize workshops and seminars
as part of in-house training with the aim of imparting skills in their workforce. he study also
54
recommends that enough facilitation in terms of equipment such as computers need to be added
in the county government in order to obtain maximum tax from the county.
The study also recommends that the ax structure be designed in such a way that it fulfills all the
canons of a tax system such that it is equitable, neutral, simple in its administration, economical
while collecting.
The study finally recommends that since different forms of revenue have different effect on
revenue collected the county government need to understand where most of its revenue comes
from and maximize avenues to ensure that maximum revenues are obtained in that form of tax.
This could be in form of adding more resources in terms of staffs and equipment working in that
line to ensure that enough revenues can be obtained from that form of tax.
5.4.2 Recommendations for Further Studies
The study recommends that the findings in this study be generalized to other counties across the
country for decision making purposes on factors affecting revenue collection. The study also
recommends that another study be conducted on the financial strategies to counter the low
revenue collected in Nairobi county government.
In addition to the above recommendations, the researcher recommends for another study on
factors affecting revenue collection using a different methodology i.e. different research
instrument to be used such as interview schedule that would help in obtaining in-depth
suggestions from key informants.
Finally the study recommends that another study be carried out this time to find out the other
factors affecting revenue collection since that factors involved in the study could only explain
77.2% on the factors affecting revenue collection in Nairobi City County. Given the inevitability
of human error, the study may be repeated to revise any errors.

55
REFERENCES
Ajaz, A. (2010). "The Effect of Corruption and Governance on Tax Revenues."The Pakistan
Development Review (2010): 405-417.
Ajaz, T., & Ahmad, E. (2010).The Effect of Corruption and Governance on Tax Revenues.The
Pakistan Development Review, 405-417.
Akantoa, B. (2012). Staff motivation and revenue mobilisation at the Techiman municipal
assembly.
Al-Fuqaha, M. R. A. (2013). Preliminary Assessment of Applying Pre-paid Water Meters
(PWMs): Selected Cases from Palestine (Doctoral dissertation, National University).
Alm, J. (2013). Financing Urban Infrastructure: Knowns, Unknowns, And A Way Forward.
Journal of Economic Surveys.
Andvig, J. C., Fjeldstad, O. H., Amundsen, I., Sissener, T., &Søreide, T. (2001).Corruption.A
review of contemporary research. Chr. Michelsen Institute.
Awitta, M. (2010).Effectiveness of revenue collection strategies at Kenya Revenue Authority in
Nairobi (Doctoral dissertation).
Baxter, P., & Jack, S. (2008). Qualitative case study methodology: Study design and
implementation for novice researchers. The qualitative report, 13(4), 544-559.
Beyuo, P. (2011). Factors influencing worker motivation at the Berekum Holy Family Hospital.
Bird, R. M. (2006).Local business taxes.Perspectives on fiscal federalism, 225.
Bird, R. M. (2007). Tax challenges facing developing countries: a perspective from outside the
policy arena. Available at SSRN 1393991.
Bird, R. M., Martinez-Vazquez, J., &Torgler, B. (2008). Tax effort in developing countries and
high income countries: The impact of corruption, voice and accountability. Economic
Analysis and Policy, 38(1), 55.

56
Bird, R., Martinez-Vazquez, J., &Torgler, B. (2006).Societal institutions and tax effort in
developing countries.The Challenges of tax reform in the global economy. New York:
Springer, 283-338.
Boadway, R., Chamberlain, E., &Emmerson, C. (2010). Taxation of wealth and wealth
ransfers.Dimensions of tax design: The Mirrleesreview, 737-814.
Bodea, T. D. (2008). Choice-based revenue management: a hotel perspective. ProQuest.
Boex, J., & Martinez-Vazquez, J. (2007). Designing intergovernmental equalization transfers
with imperfect data: Concepts, practices, and lessons. In Fiscal Equalization (pp. 291
343).Springer US.
Bohn, H. (2011). Budget balance through revenue or spending adjustments?: Some historical
evidence for the United States. Journal of monetary economics, 27(3), 333-359.
Boyce, J. K., &Ndikumana, L. (2001). Is Africa a net creditor? New estimates of capital flight
from severely indebted sub-Saharan African countries, 1970-96. Journal of Development
Studies, 38(2), 27-56.
Brace, D. J. (2008). A social network perspective on industrial/organizational
psychology. Handbook of industrial and organizational psychology, 1, 107-117.
Cagan, M., & Shank, P. T. (2009).Financial Words You Should Know: Over 1,000 Essential
Investment, Accounting, Real Estate, and Tax Words.Adams Media.
Carroll, D. A. (2009). Diversifying municipal government revenue structures: Fiscal illusion or
instability?.Public Budgeting & Finance, 29(1), 27-48.
Chau, K. K. G., & Leung, P. (2009). A critical review of Fischer tax compliance model: A
research synthesis. Journal of accounting and taxation, 1(2), 34-40.
Chau, K. K. G., & Leung, P. (2009). A critical review of Fischer tax compliance model: A
research synthesis. Journal of accounting and taxation, 1(2), 34-40.
Chesbrough, H. W. (2003). Open innovation: The new imperative for creating and profiting from
technology. Harvard Business Press.

57
Chittenden, F., Foster, H., & Sloan, B. (2010). Taxation and Red Tape: The cost to British
business of complying with the UK tax system. Institute of Economic Affairs Monograph,
(64).
Chung, C. S. (2012). Municipal Securities: The Crisis of State and Local Government
Indebtedness, Systemic Costs of Low Default Rates, and Opportunities for Reform.
Cardozo L. Rev., 34, 1455.
Cha, E. S., Kim, K. H., &Erlen, J. A. (2007). Translation of scales in cross‐cultural research:
Issues and techniques. Journal of advanced nursing, 58(4), 386-395.
Cui, W. (2012). Foreign Administrative Law and International Taxation: a Case Study of Tax
Treaty Implementation in China. Administrative Law Review, 64(1), 191-232.
Doyle, E. M., Hughes, J. F., &Glaister, K. W. (2009).Linking ethics and risk management in
taxation: Evidence from an exploratory study in Ireland and the UK.Journal of business
ethics, 86(2), 177-198.
Ebrill, L., Stotsky, J., &Gropp, R. (2001). Revenue Implications of Trade Liberalisation1.Small
States in the Global Economy: Background Papers Presented to the Commonwealth
Secretariat/World Bank Joint Task Force on Small States, 44, 343.
Eghigian, M., & Nitti, F. (2006).After Capone: The Life and World of Chicago Mob BossFrank"
the Enforcer" Nitti.Cumberland House Publishing.
Egidario, B. A. (2011). Housing Transformation and its Impact on Neighbourhoods in Selected
Low-Income Public Housing Estates in Lagos, Nigeria (Doctoral dissertation, Covenant
University).
Fjeldstad, O. H. (2006). Local Revenue Mobilization in Urban Settings in Africa. Chr. Michelsen
Institute.
Fjeldstad, O. H. (2006). Local Revenue Mobilization in Urban Settings in Africa. Chr. Michelsen
Institute.
58
Fjeldstad, O. H., &Geisler, G. (2005).Local governance, urban poverty and service delivery in
Namibia.CMI Report, 2005(12).
Fjeldstad, O. H., &Heggstad, K. (2013).Local government revenue mobilisation in Anglophone
Africa.ICTD Research in Brief, (5).
Francis, P., & James, R. (2003).Balancing rural poverty reduction and citizen participation: The
contradictions of Uganda‟s decentralization program.World Development, 31(2), 325
337.
Fustey, A. A. (2011). Risk Financial Markets & You: Your Guide to Making Better Investment
Decisions. Alan Fustey.
Gibson, I. Donnelly, 2000,„Organizational Behavior‟, Structure, Processes.
Grindle, M. S. (2007). Good enough governance revisited. Development policy review, 25(5),
533-574.
Hebert, D. J. (2014).Towards A Catallactic Approach to Taxing and Spending (Doctoral
dissertation, George Mason University).
Heim, C. E. (2012). Border wars: Tax revenues, annexation, and urban growth in Phoenix.
International Journal of Urban and Regional Research, 36(4), 831-859.
Heller, M. P. S. (2005).Understanding Fiscal Space (EPub).International Monetary Fund.
Hendrick, R. (2002). Revenue diversification: Fiscal illusion or flexible financial management.
Public budgeting & finance, 22(4), 52-72.
Hill, C., & Jones, G. (2007).Strategic management: An integrated approach. Cengage Learning.
Hoopes, D. G., Madsen, T. L., & Walker, G. (2003). Guest editors' introduction to the special
issue: why is there a resource‐based view? Toward a theory of competitive heterogeneity.
Strategic Management Journal, 24(10), 889-902.
Huefner, R. J., &Largay III, J. A. (2008).The role of accounting information in revenue
management.Business Horizons, 51(3), 245-255.

59
Issah, A. B. (2011). When Nothing Really Works: The Dilemma of Mobilizing Local Revenues in
Ghana: A Comparative Analysis of Local Taxes in the Tamale Metropolis. Erasmus
University.
James, S., &Nobes, C. (2008).The Economics of Taxation 2008/2009.
Kälin, C. H. (2005). International Real Estate Handbook: Acquisition, Ownership and Sale of
Real Estate Residence, Tax and Inheritance Law. John Wiley & Sons.
Kaplinsky, R. (2008). Trends on the distribution of income in Kenya, 1966-76.
Katz, J. A., & Green, R. P. (2007).Entrepreneurial small business (Vol. 200).McGraw
Hill/Irwin.
Kiess, H. O., &Bloomquist, D. W. (2009). Psychological research methods: A conceptual
approach. Allyn& Bacon.
Kim, L & Cha, J. W., (2012). U.S. Patent No. 8,176,057. Washington, DC: U.S. Patent and
Trademark Office.
Kimiru, V. W. (2012). Motivation and satisfaction as functions of Perceptions of reward: a case
study of employees of Kenya Revenue Authority (Doctoral dissertation).
KIPPRA (2005).“Tax Compliance Study.” Draft report.
Kirchler, E. (2007). The economic psychology of tax behaviour.Cambridge University Press.
Kloeden, D. (2011. Revenue administration reforms in angloph)one Africa since the early 1990s.
International Monetary Fund.
Kothari, C. R. (2004). Research methodology: methods and techniques. New Age International.
Kramon, E., & Posner, D. N. (2011). Kenya's new constitution.Journal of Democracy, 22(2),89
103.
Kumar, A., Sinha, C., & Sharma, R. (2007).Customer Relationship Management: Concepts &
Application. John Wiley & Sons.
60
Kumar, A., Sinha, C., & Sharma, R. (2007).Customer Relationship Management: Concepts &
Application. John Wiley & Sons.
Kvaal, E., &Nobes, C. (2013).International Variations in Tax Disclosures.Accounting in
Europe, 10(2), 241-273.
Kothari, C. R. (2006). Research methodology: Methods and techniques. New Age International.
Masogo, M. M. (2013). Contribution of Own Sources Revenue Collections To Implementation of
Development Projects In Dar Es Salaam Municipal Councils: 2003 (I)–2012 (Iv)
(Doctoral dissertation,
Mzumbe University).Malhotra, N. K. (2008). Marketing research: An applied orientation, 5/e.
Pearson Education India.
Ndunda J. M. (2013). Analysis of factors influencing optimal revenue collection by county
governments in Kenya.A Case of Nakuru County.International Journal of Economics,
Commerce and Management United Kingdom 3,(5): 1-16.
Lagomarsino, G., Garabrant, A., Adyas, A., Muga, R., &Otoo, N. (2012).Moving towards
universal health coverage: health insurance reforms in nine developing countries in
Africa and Asia.The Lancet, 380(9845), 933-943.
Lederman, L., &Sichelman, T. M. (2013).Enforcement as Substance in Tax Compliance.
Loughlin, J., & Martin, S. (2006). Options for Reforming Local Government Funding to Increase
Local Streams of Funding: International Comparisons. Prepared for the Lyons Inquiry
into Local Government Funding.
Malhotra, N. (2008). Sociological Methods &. Sociological Methods Research, 37, 3.
Mankiw, N. G., Weinzierl, M., &Yagan, D. (2009).Optimal taxation in theory and practice
(No. w15071). National Bureau of Economic Research.
Margolis, M. J. (2014). So You Want to Be a Landlord. Trafford Publishing.

61
McCluskey, W. J. M. W. J. (2008). Rental Value versus Capital Value: Rental Value versus
Capital Value: Alternative Bases for the Property Tax.
Mikesell, J. (2007). Fiscal Administration in Local Government: An Overview. Local Budgeting,
World Bank, Washington, 15-52.
Moran, B. I. (2008). Capitalism and the Tax System: A Search for Social Justice. SMUL Rev.,
61, 337.
Muehlbacher, S., Kirchler, E., &Schwarzenberger, H. (2011). Voluntary versus enforced tax
compliance: empirical evidence for the “slippery slope” framework. European Journal of
Law and Economics, 32(1), 89-97.
Muriithi, M. K., &Moyi, E. (2003).Tax reforms and revenue mobilization in Kenya (Vol.
131).African Economic Research Consortium.
Neiman, M., &Krimm, D. (2009).Perceptions of local fiscal stress during a state budget crisis.
Public Policy Institute of California.
Nightingale, K. (2002). Taxation: theory and practice. Pearson Education.
Nordhaus, W. D. (2007). To tax or not to tax: Alternative approaches to slowing global warming.
Review of Environmental Economics and policy, 1(1), 26-44.
Nordhaus, W. D. (2007). To tax or not to tax: Alternative approaches to slowing global warming.
Review of Environmental Economics and policy, 1(1), 26-44.
Oates, W. E. (2005). On the nature and measurement of fiscal illusion: A survey. Department of
Economics, University of Maryland.
Phillips, S. J., Dudík, M., Elith, J., Graham, C. H., Lehmann, A., Leathwick, J., & Ferrier, S.
(2009). Sample selection bias and presence-only distribution models: implications for
background and pseudo-absence data. Ecological Applications, 19(1), 181-197.
Price, J., & Forrest, J. (2012).Practical aviation security: predicting and preventing future
threats. Butterworth-Heinemann.
Rosen, H. S. (2004). Public finance (pp. 252-262).Springer US.
62
Sekaran, U. (2006). Research methods for business: A skill building approach. John Wiley &
Sons.
Sekaran, U & Bougie, P. K. (2013). Regression analysis of count data (Vol. 53). Cambridge
university press.
Cameron, A. C., & Trivedi, P. K. (2013). Regression analysis of count data(Vol. 53). Cambridge
university press.
Shields, J. (2007).Managing employee performance and reward: concepts, practices, strategies.
Cambridge University Press.
Shoup, D. C. (2004).The ideal source of local public revenue.Regional Science and Urban
Economics, 34(6), 753-784.
Simiyu, R. S., Mweru, J. N., &Omete, F. I. (2014). The Effects Of Devolved Funding On
Socio-Economic Welfare Of Kenyans: A Case Of Constituency Development Fund In
Kimilili,(Kenya). European Journal of Accounting Auditing and Faineance Research,
2(7), 31-51.
Stewart, F., Brown, G., &Cobham, A. (2009).The Implications of Horizontal and Vertical
Inequalities for Tax and Expenditure Policies.
Tanzi, V. (2008).The role of the state and public finance in the next generation.OECD Journal
on Budgeting, 8(2), 7-27.
Tettey, W. J., Puplampu, K. P., & Berman, B. J. (Eds.).(2003). Critical Perspectives in Politics
and Socio-economic Development in Ghana (Vol. 6).Brill.
United Nations.Division for Public Economics, & Public Administration.(2010). Transparency
and Accountability in Government Financial Management (Vol. 14).United Nations
Publications.
Van Sittert, L., & Swart, S. S. (Eds.). (2008). Canisafricanis: a dog history of Southern Africa
(Vol. 5). Brill.
Wachs, M. (2006). A Quiet Crisis in Transportation Finance.Testimony Presented Before the
Texas Study Commission on Transportation Finance. Santa Monica, CA.

63
Wade, M., &Hulland, J. (2004). Review: the resource-based view and information systems
research: review, extension, and suggestions for future research. MIS quarterly, 28(1),
107-142.
Weisbrod, B. A. (2009). The nonprofit economy. Harvard University Press
Welch, E. W., Hinnant, C. C., & Moon, M. J. (2005). Linking citizen satisfaction with e
government and trust in government.Journal of Public Administration Research and
Theory, 15(3), 371-391.
Williams, C. (2011). Research methods.Journal of Business & Economics Research (JBER),
5(3).
Yan, W. (2008). The impact of revenue diversification and economic base on revenue stability:
An empirical analysis of county and state governments.
Young, J. E. (2009). State fiscal sustainability: A new theoretical approach and case study of the
State of Arizona. ProQuest.
Zigrand, J. P. (2010). Modelling Financial Turmoil through Endogenous Risk and Risk Appetite.

64
APPENDICES
Appendix 1: Questionnaire
Instructions (tick where appropriate)
PART A: DEMOGRAPHIC INFORMATION
1. Age:
18-30 yrs ( )
31-40 yrs ( )
41-50 yrs ( )
Above 51 yrs ( )
2. Education level
Primary level ( )
Secondary level ( )
College level ( )
University level ( )
4. Working experience
Less than 5 years ( )
6-10 years ( )
11-15 years ( )
15 years and above ( )

65
PART B: DIVERSIFICATION
1. By using a scale of 1 to 5; (1= not at all, 2 = little extent, 3 = moderate extent, 4 = great
extent, 5 = very great extent), rate the extent to which the following diversification
factors influence the level of revenue collection.
Diversification 1 2 3 4 5
Number of sources of revenue
Policies
Restrictions
PART C: ADMINISTRATION
6. By using a scale of 1 to 5; (1= not at all, 2 = little extent, 3 = moderate extent, 4 = great extent,
5 = very great extent), rate the extent to which the following administration factors influence the
level of revenue collection.
Administration factors 1 2 3 4 5
Competent staff
Availability of computers
Availability of postal and communication system
Use of a third part to collect revenue
Tax education
PART D: TAX STRUCTURE
7.By using a scale of 1 to 5; (1= not at all, 2 = little extent, 3 = moderate extent, 4 = great extent,
5 = very great extent), rate the extent to which the following tax structure factors influence the
level of revenue collection.

66
Tax structure factors 1 2 3 4 5
Flexibility
Equitability
Neutrality
Simplicity
PART E: FORMS OF REVENUES
8. By using a scale of 1 to 5; (1= not at all, 2 = little extent, 3 = moderate extent, 4 = great extent,
5 = very great extent), rate the extent to which the following forms of revenues affect the level of
revenue collection.
Tax structure factors 1 2 3 4 5
Property tax
Business license
Service charge
PART F: REVENUE COLLECTION
9. By using a scale of 1 to 5; (1= not at all, 2 = little extent, 3 = moderate extent, 4 = great extent,
5 = very great extent), rate the extent to which the revenue collection factors have been achieved
in the last one year.
Revenue collection factors 1 2 3 4 5
Payments are made on time
Amount collected
THANK YOU