selected geologic factors affecting mining of the ... · selected geologic factors affecting mining...
TRANSCRIPT

Bureau of Mines Report of Investigations/l975
Selected Geologic Factors Affecting Mining of the Pittsburgh Coalbed
UNITED STATES DEPARTMENT OF T H E INTERIOR

Report of Investigations 8093
Selected Geologic Factors Affecting Mining of the Pittsburgh Coalbed
By C. M. McCulloch, W. P. Diamond, B. M. Bench, and Maurice Deul Pittsburgh Mining and Safety Research Center, Pittsburgh, Pa.
UNITED STATES DEPARTMENT OF THE INTERIOR Thomas S. Kleppe, Secretary
Jack W. Carlson, Assistant Secretary-Energy and Minerals
BUREAU OF MINES Thomas V. Falkie, Director

T h i s publication has been cataloged as fol lows:
McCulloch, Char les M Selected geologic factors affecting mining of the Pit ts-
burgh coalbed, by C. M. McCulloch [and others. Washing- ton] U.S. Bureau of Mines [1975]
72 p. illus., t ab les . (U.S. Bureau of Mines. Report of invest i- g a t i o n s 8093)
Inc ludes bibliography.
1. C o a l mines and mining-Pennsylvania . 2. Coa l mines and mining-West Virginia. 3. Methane. I. U.S. Bureau of Mines. 11. T i t l e . 111. T i t l e : P i t t sburgh c o a l b e d , P e n n s y l v a n i a and West Virginia. (Ser ies )
TN23.U7 no. 8093 622.06173
U.S. Dept. of the Int. Library
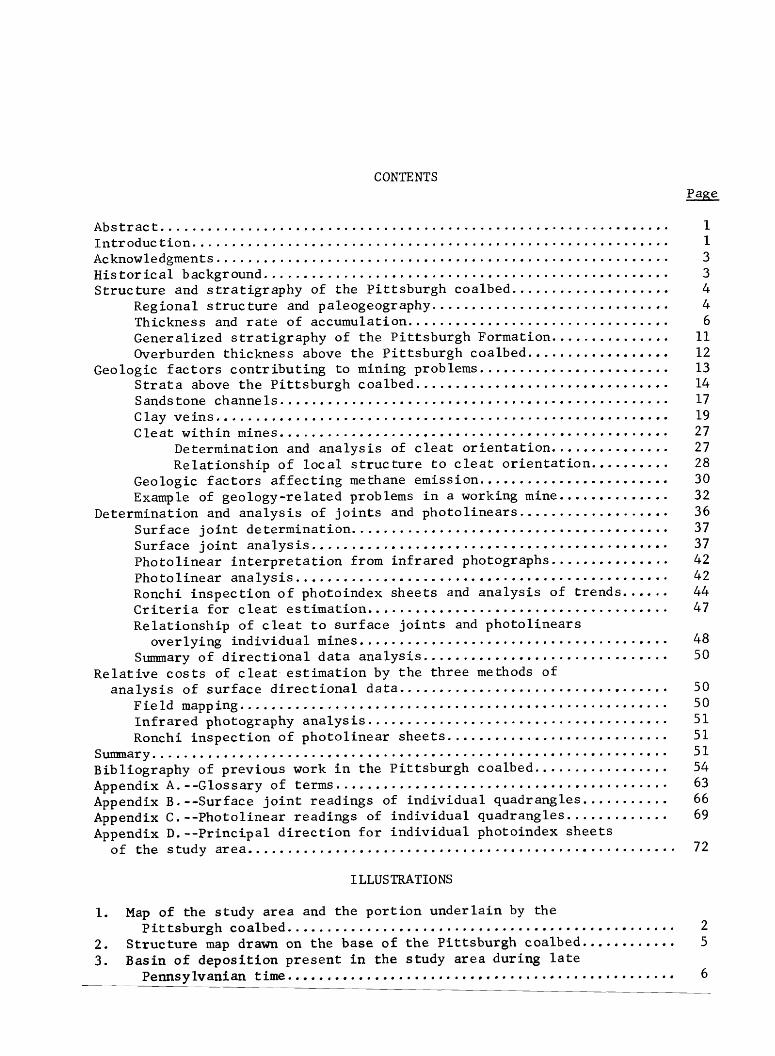
CONTENTS Page
Abs t r ac t ................................................................ 1 I n t r o d u c t i o n ............................................................ 1 Acknowledgments ......................................................... 3 H i s t o r i c a l background ................................................... 3 S t r u c t u r e and s t r a t i g r a p h y of t he P i t t s b u r g h coalbed .................... 4
Regional s t r u c t u r e and paleogeography .............................. 4 Thickness and r a t e of accumulation ................................. 6
............... General ized s t r a t i g r a p h y of t h e P i t t s b u r g h Formation 11 Overburden th ickness above t h e P i t t s b u r g h coalbed .................. 12
........................ Geologic f a c t o r s c o n t r i b u t i n g t o mining problems 13 S t r a t a above t h e P i t t s b u r g h coalbed ................................ 14 Sandstone channels ................................................. 17
......................................................... Clay v e i n s 19 C l e a t w i t h i n mines ................................................. 27
Determination and a n a l y s i s of c l e a t o r i e n t a t i o n ............... 27 .......... Rela t ionsh ip of l o c a l s t r u c t u r e t o c l e a t o r i e n t a t i o n 28
........................ Geologic f a c t o r s a f f e c t i n g methane emission 30 .............. Example of geology-re la ted problems i n a working mine 32
................... Determination and a n a l y s i s of j o i n t s and pho to l inea r s 36 ........................................ Surface j o i n t de te rmina t ion 37
Sur face j o i n t a n a l y s i s ............................................. 37 ............... Pho to l inea r i n t e r p r e t a t i o n from i n f r a r e d photographs 42
Photo l inear a n a l y s i s ............................................... 42 ...... Ronchi i n s p e c t i o n o f photoindex s h e e t s and a n a l y s i s of t r e n d s 44
...................................... C r i t e r i a f o r c l e a t e s t i m a t i o n 47 Re la t i onsh ip of c l e a t t o s u r f a c e j o i n t s and pho to l inea r s
....................................... over ly ing i n d i v i d u a l mines 48 ............................... Summary of d i r e c t i o n a l d a t a a n a l y s i s 50
R e l a t i v e c o s t s of c l e a t e s t i m a t i o n by t h e t h r e e methods of .................................. a n a l y s i s of s u r f a c e d i r e c t i o n a l d a t a 50
...................................................... F i e l d mapping 50 ...................................... I n f r a r e d photography a n a l y s i s 51
............................ Ronchi i n s p e c t i o n of pho to l inea r s h e e t s 51 ................................................................. Sunanary 51
................. Bibl iography of prev ious work i n t h e P i t t sbu rgh coalbed 54 .......................................... Appendix A.--Glossary of terms 63
........... Appendix B.--Surface j o i n t read ings of i nd iv idua l quadrangles 66 ............. Appendix C.--Photol inear read ings of i nd iv idua l quadrangles 69
Appendix D. - -Pr inc ipa l d i r e c t i o n f o r i n d i v i d u a l photoindex s h e e t s of t h e s tudy a r ea ...................................................... 72
ILLUSTRATIONS
1 . Map of t h e s tudy a r e a and t h e p o r t i o n unde r l a in by the ................................................. P i t t s b u r g h coalbed 2 ............ 2 . S t r u c t u r e map drawn on t h e base of t h e P i t t sbu rgh coalbed 5
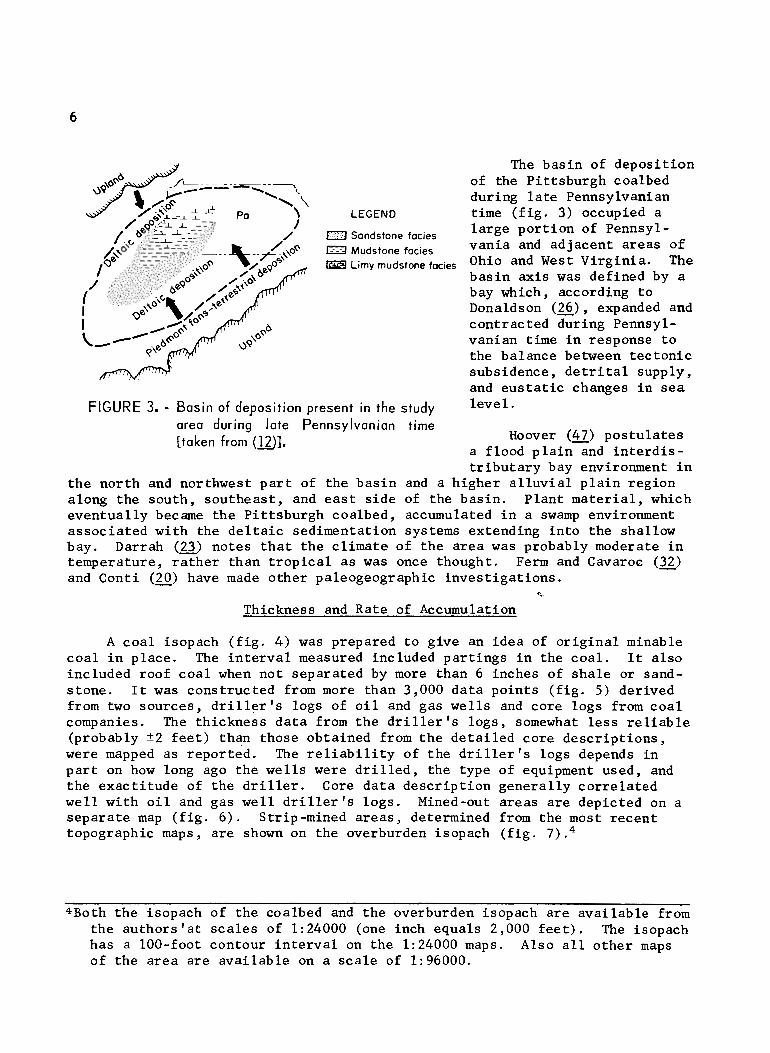
3 . Basin of depos i t i on p r e s e n t i n t h e s tudy a r e a dur ing l a t e Pennsylvanian t i m e ................................................. 6

ILLUSTRATIONS ..Continued Page
Isopach of t h e P i t t s b u r g h coalbed ................................... Locat ion of d a t a p o i n t s f o r t h e s t udy a r e a .......................... Areas of t h e P i t t s b u r g h coalbed t h a t have been mined ou t ............ Overburden i sopach of t h e s t r a t a above t h e P i t t s b u r g h coalbed ....... General ized s t r a t i g r a p h i c column of t he P i t t s b u r g h Formation ........ Fence diagram of t h e s t r a t a d i r e c t l y above t h e P i t t s b u r g h coalbed
f o r t h e s t udy a r e a ................................................ Map o f t h e known sandstone channels c u t t i n g i n t o t h e P i t t s b u r g h
coalbed ........................................................... Isopach of t he P i t t s b u r g h sandstone ................................. Map of t h e Shannopin and Robena mines w i th sandstone cu tou t s . ....... Fence diagram of t h e s t r a t a above t h e P i t t s b u r g h coalbed a t
t h e Shannopin mine ................................................ General ized c r o s s s e c t i o n of c l a y v e i n s i n t e r s e c t i n g coa lbeds ....... Mines ope ra t i ng i n t he P i t t s b u r g h coalbed w i th abundant c l a y v e i n s .. Locat ion and s t r u c t u r e around t h e Marianna No . 58 mine .............. Clay v e i n s i n s y n c l i n a l t rough a t the Marianna No . 58 mine .......... X-ray d i f f r a c t i o n c h a r t s of t h e c l a y v e i n , t h e roof rock , and
t h e f l o o r rock l i t h o l o g i e s ........................................ C l e a t systems i n mines ope ra t i ng i n t he P i t t s b u r g h coalbed .......... Composite r o s e diagram of c l e a t o r i e n t a t i o n i n 18 mines surveyed .... Rela t i onsh ip between l o c a l s t r u c t u r e and c l e a t o r i e n t a t i o n
i n t h e Pursglove No . 15 mine, Monongalia County, W . Va ............ Map of Fede ra l No . 2 mine showing h o r i z o n t a l l y d r i l l e d ho l e s
and c l e a t d i r e c t i o n s .............................................. S t r u c t u r e map drawn on t h e ba se of t h e P i t t s b u r g h coalbed f o r t h e
a r e a ad j acen t t o t h e a c t i v e workings o f t h e Somerset No . 60 mine .. Fence diagram of t h e s t r a t a d i r e c t l y a b w e t h e P i t t s b u r g h coalbed
a d j a c e n t t o t h e a c t i v e workings of t h e Somerset No . 60 mine ....... Sandstone channel p r o b a b i l i t y map of t h e a r e a ad j acen t t o
t h e a c t i v e workings of t he Somerset No . 60 mine ................... Rapid l a t e r a l v a r i a t i o n i n t h e s t r a t a d i r e c t l y above t h e
P i t t s b u r g h coalbed ................................................ I sopach o f "draw s l a t e " above t he P i t t s b u r g h coalbed i n t h e a r e a
ad j acen t t o t he a c t i v e workings of t h e Somerset No . 60 mine ....... Rose diagram of s u r f a c e j o i n t t r e n d s from the New Freepo r t
quadrangle , Pennsylvania .......................................... Composite r o s e diagram of p r i n c i p a l s u r f a c e j o i n t t r ends ............ Rose diagrams of s u r f a c e j o i n t s f o r 39 quadrangles .................. Rose diagram of p h o t o l i n e a r s f o r 39 quadrangles ..................... Composite r o s e diagram of p r i n c i p a l pho to l i nea r t r ends
f o r e n t i r e a r e a ................................................... Composite r o s e diagram of p r i n c i p a l Ronchi t r e n d s f o r e n t i r e a r e a ...
TABLES
C l e a t systems o f 18 mines surveyed .................................. Composition of ga s from t h e P i t t s b u r g h coalbed ......................

TABLES --Continued
iii
Page
Average surface j o i n t o r i e n t a t i o n s , by county ....................... 38 Pr inc ipa l sur face j o i n t t rends i n order of dominance. ............... 38 Average photol inear o r i e n t a t i o n s , by county ......................... 43 Pr inc ipa l photo l inear t rends i n order of dominance .................. 4 3 Average photoindex shee t l i n e a r o r i e n t a t i o n s , by county ............. 45 Pr inc ipa l Ronchi photoindex t rends i n order of dominance ............ 45 Fundamental systems from d i r e c t i o n a l da ta . .......................... 47 Coal c l e a t , dominant su r face j o i n t , and photol inear o r i e n t a t i o n s
of the study area................................................. 49 Time and c o s t requirements f o r measuring j o i n t s and photol inears
f o r the study a rea . . . . . . . . . . . . . . . . . . . . . . . . . . . . . . . . . . . . . . . . . . . . . . . . 50

SELECTED GEOLOGIC FACTORS AFFECTING MINING OF THE PITTSBURGH COALBED
C. M. McCulloch. Wm Pm Diamondl' B. Mm Bench. l and Maurice Deul
1 ABSTRACT
A s p a r t of the Bureau of Mines methane con t ro l program, the Pi t t sburgh coalbed was s tudied i n Washington and Green Counties , Pa. , and i n Marion and 1 Monongalia Counties, W . Va., where t h i s coalbed i s now being mined a t i t s Igreatest depth. The coalbed thickness appeared t o be s t r u c t u r a l l y con t ro l l ed ; the bed was gene ra l ly th inner near the axes of a n t i c l i n e s and th icker near the axes of syncl ines . The overburden isopach shows a s imi la r r e l a t i o n s h i p . Most of the c l a y ve ins i n coa l occur i n the sync l ina l t roughs, gene ra l ly under sandstone roof.
C lea t o r i e n t a t i o n s measured i n 18 underground mines showed t h a t face c l e a t s a r e perpendicular t o the a x i a l t rends of the f o l d s , and t h e b u t t c l e a t s a r e p a r a l l e l t o the a x i a l t r ends , i nd ica t ing s t r u c t u r a l con t ro l of t h e c l e a t .
Measurement and ana lys i s of sur face j o i n t o r i e n t a t i o n s provide a method f o r p red ic t ing the c l e a t o r i e n t a t i o n s of the coalbed, bu t l i n e a r s measured from in f ra red photographs and photoindex shee t s helped only t o determine r eg iona l t rends.
The r e s u l t s of these inves t iga t ions provide a geologic framework f o r r a t i o n a l planning f o r underground mine development t o use the b e s t ava i l ab le technology t o cope with methane emissions, coalbed d i s c o n t i n u i t i e s , and r e l a t e d ground support problems.
I INTRODUC TION I The Pi t t sburgh coalbed i s one of the l a r g e s t and most va luable mineral
depos i t s i n the world. It extends from the western t i p of Maryland, west to Belmont County, Ohio, and from Allegheny County, Pa. , southwest t o Putnam County, W. Va. This r e p o r t i s focused on Washington and Greene Counties, Pa., and Monongalia and Marion Counties , W. Va., because t h i s i s the a rea of g r e a t e s t ac t ive mining. Within t h i s a rea ( f ig . 1) the coalbed crops out only
l ~ e o l o g i s t . 2 ~ e s e a r c h supervisor .

LEGEND
a Study area underlain by Pittsburgh coalbed
i n northern Washington County and along the Monongahela River, necess i - t a t i n g underground mining almost exclusively.
The Pi t t sburgh coalbed l i e s i n an a r e a known physi- ographical ly a s the Allegheny Plateau and char- ac t e r i z e d by a n t i c l i n e s and synclines t h a t normally d i p l e s s than 100 f e e t per m i l e . The s t r a t a above the P i t t s - burgh coalbed a r e composed predominantly of interbedded sha les , sandstones, s i l t - s tones , and limestones with i n t e r m i t t e n t coalbeds. The c r i t i c a l v e r t i c a l sequence above t h e coal is normally l e s s than 50 f e e t .
I n 1964, the U. S. Geological Survey (=l3 determined from an ext rapola t i o n of da ta assembled by
Scale, miles
Latimer ( 7 l ) t h a t the ~ G t s - burgh coalbed had yielded about 8 b i l l i o n tons of c o a l from the beginning of mining i n the e a r l y 1900's t o January 1, 1965. This t o t a l
FIGURE 1. - Map of the study area and the portion under- was about 35 percent of t h e lain by the Pittsburgh coalbed. cumulative production of the
Appalachian bituminous c o a l bas in and 21 percent of the cumulative production of the United Sta tes . The c o a l reserves i n western Washington and Greene Counties, Pa., and Marion and Monongalia Counties, W. Va., represent an important f u t u r e source of coal . The c o a l here i s deeper (up t o 1,500 f e e t ) than t h a t previously mined i n t h e Pi t t sburgh coa l basin. Methane gas has been a continuing source of problems i n the Pi t t sburgh coalbed, and such problems w i l l probably increase wi th g r e a t e r depth of mining. Roof i n s t a b i l i t y and the occurrence of c l a y veins and sandstone channels a re a l s o poss ib le .
This r epor t deals with se lec ted geologic f a c t o r s t h a t a f f e c t the mining of the Pit tsburgh coalbed. Selected f a c t o r s examined include s t r u c t u r e ,
3Underlined numbers i n parentheses represent items i n the bibl iography pre- ceding t h e appendixes.

overburden, immediate roof s t r a t a , r e l a t i o n t o j o i n t s and l i n e a r s , and c l e a t o r i e n t a t i o n s .
Much of t he Bureau of Mines methane c o n t r o l r e sea rch has been conducted i n t h e P i t t s b u r g h coalbed (3, 64, 75). The p r e s e n t r e p o r t g ive s r e s u l t s of one phase of t h i s r e s e a r c h , which i s seek ing t o i d e n t i f y t h e geo log ic f a c t o r s t h a t i n £ luence methane accumulations and emiss ions i n coa lbeds and which may be used i n p lanning t he d e g a s i f i c a t i o n and v e n t i l a t i o n of c o a l mines and t h e r ecove ry of mine ga s . S imi l a r s t u d i e s can be conducted on o t h e r coa lbeds .
ACKNOWLEDGMENTS
This p r o j e c t could no t have been completed wi thout t h e a s s i s t a n c e of many people and companies. We thank Conso l ida t i on Coal Co., Bethlehem Mines Corp. , E a s t e r n Associated Coal Corp. , and Jones & Laughl in S t e e l Corp. , who provided personne l t o e s c o r t u s i n our underground s t u d i e s and supp l i ed c o r e l o g s , mine maps, and o the r necessary d a t a .
We e s p e c i a l l y thank James Marshalek, supe rv i so ry mining i n spec t o r f o r t h e Mining Enforcement and S a f e t y Adminis t ra t ion (MESA); S. M. L inger , W. C . Doran, Jr . , J . G . T i l t o n , and J . C . P a t t o n of t h e Equ i t ab l e Gas Co.; James Barlow of t h e West V i r g i n i a Economic and Geologic Survey; Herb Steinman o f Jones & Laughl in S t e e l Corp. ; and W . Edmonds of t h e Pennsylvania Geolog ica l Survey f o r supplying in format ion and reviewing t h e manuscr ip t .
The c o n t r i b u t i o n s of C . H. E lde r and P. W . J e r a n , Bureau g e o l o g i s t s a r e acknowledged. They have spen t cons ide rab l e time on i n v e s t i g a t i o n s of t h e P i t t s b u r g h coalbed and were most h e l p f u l wi th sugges t i ons and supplying d a t a f o r t h e p r e p a r a t i o n of maps.
HISTORICAL BACKGROUND
The f i r s t i n v e s t i g a t i o n of t h e P i t t s b u r g h coalbed d a t e s back t o 1759 when Kenny (52) r e f e r r e d t o a c o a l be ing mined on t h e h i l l s around P i t t s b u r g h . S ince t h a t t ime , numerous i n v e s t i g a t i o n s have r e s u l t e d i n more than 100 p u b l i - c a t i o n s . See Bibl iography.
Nineteenth cen tu ry i n v e s t i g a t o r s were concerned p r i m a r i l y w i th t he s t r a t - ig raphy of t he a r e a and t h e problems i n working o u t s t r a t i g r a p h i c boundaries (72, 85, 98-100, 107, 115) . Rogers (100) i n 1884 was one of t h e f i r s t t o r e a l i z e t h e importance of t h e P i t t s b u r g h coalbed i n t h e mining i ndus t ry .
The most comprehensive s i n g l e work on t h e P i t t s b u r g h coalbed i s t h a t pub- l i s h e d i n 1954 by Cross (=), who s tud i ed t h e s t r a t i g r a p h y , pe t ro logy , o r i g i n , composi t ion, and mining problems of t he bed. Much of Cros s ' work i s p e r t i n e n t t oday , and h i s paper ha s served a s a model f o r t h e p r e s e n t r e p o r t .
As would be expected f o r s o important a d e p o s i t , mapping has been ex t en - s i v e . The e a r l y 1900 ' s saw a f l u r r y of a c t i v i t y , w i t h t h e P i t t s b u r g h coalbed being mapped i n p a r t s of a l l f ou r c o u n t i e s of t h e s tudy a r e a by Clapp (18) , Munn (B), Hennen (g), and Hennen and Reger ( 4 6 ) . The f i r s t d e t a i l e d map showing t h e a r e a u n d e r l a i n by t he P i t t s b u r g h coalbed i n West V i r g i n i a , Ohio,

and Pennsylvania was published by Burrough (16) i n 1914 and was a f a i r l y accu- r a t e map f o r t h e small amount of d a t a ava i l ab le .
The coal-bearing Upper Pennsylvanian and Lower Permian rocks of the Wash- ington , Pa. , a r e a have been s tud ied by B e r r y h i l l , Schweinfurth, and Kent (=), who prepared a number of isopach and l i t h o f a c i e s maps of t h e area.
I n 1972 Roen and F a r r e l (96) published a s t r u c t u r e map drawn on t h e base of the P i t t sbu rgh coalbed us ing published geologic maps of Pennsylvania, county r e p o r t s from West V i rg in i a and Pennsylvania, and c o a l company da ta . The 7-112-minute geologic quadrangles of Amity, C a l i f o r n i a , El lsworth, Hacket t , Mather, Monongahela, P rospe r i ty , Washington Eas t , Washington West, and Waynesburg have been mapped by t h e U.S. Geological Survey. TheCarmichaels, Oak F o r e s t , and Midway quadrangles have been covered i n o the r s t u d i e s . Geo- l o g i c a l maps of t h e B l a c k s v i l l e , Fairmont Eas t and West, Grant Town, Morgan- town North, Osage, and R i v e s v i l l e 7-112 -minute quadrangles have been prepared by graduate s tuden t s a t West V i rg in i a Univers i ty .
The s t r a t i g r a p h y of t h e Monongahela Group i n West V i rg in i a , Ohio, and Pennsylvania has been s tudied by Hoover (a), who prepared a s e r i e s of i s o - pachs on a l l major u n i t s from the Redstone t o the P i t t sbu rgh coalbed. The Pittsburgh-Redstone c o a l i n t e r v a l i n West V i rg in i a has a l so been s tudied by Conti (20).
I n p repa ra t ion f o r t h e present r e p o r t , underground geologic inves t iga - t i o n s were conducted i n 18 mines opera t ing i n t h e P i t t sbu rgh coalbed. Coal c l e a t o r i e n t a t i o n s were measured, and the loca t ion and t rend of sand channels and c l a y ve ins were obtained. Surface j o i n t s were measured t o eva lua te t h e i r r e l a t i o n s h i p t o c l e a t d i r e c t i o n s underground. An a e r i a l photoanalysis was conducted t o l o c a t e l ineaments and eva lua te t h e i r r e l a t i o n s h i p t o su r face j o i n t s . Geologic f a c t o r s in£ luencing roof c o n t r o l were a l s o inves t iga t ed .
STRUCTURE AND STRATIGRAPHY OF THE PITTSBURGH COALBED
Regional S t r u c t u r e and Paleogeography
Most of t h e P i t t sbu rgh coalbed l i e s i n a broad, gen t ly dipping bas in . The b a s i n i s a h igh ly d i s sec t ed r eg ion of g e n t l y folded a n t i c l i n e s and syn- c l i n e s t h a t decrease i n i n t e n s i t y westward from t h e Allegheny s t r u c t u r a l f r o n t ( f i g . 2 ) . The a rea is known physiographical ly a s t h e Allegheny Pla teau . The f o l d axes gene ra l ly p a r a l l e l t h e axes of t h e bas in . The d i p of t h e rocks is gene ra l ly l e s s than lo. The fo rces t h a t produced t h e fo ld ing and subsequent e ros ion exposed, o r brought near the su r face , numerous coalbeds t h a t otherwise would s t i l l l i e deeply bur ied .
F igure 2 i s a s t r u c t u r a l contour map of the P i t t sburgh coalbed by Roen and F a r r e l (96). The Bureau has d r i l l e d approximately 20 holes t o the P i t t s - burgh coalbed wi th in t h e s tudy a rea , but the add i t iona l information obtained d i d l i t t l e t o a l t e r t h e i n t e r p r e t a t i o n of- the s t r u c t u r a l t rends .

HARRISON COUNTY I FIGURE 2. - Structure map drawn on the base of the Pittsburgh coalbed (me
& FIGURE 3. - Basin of deposition pr
LEGEND
a Sandstone foc~es IZZ Mudstone focies
Ltmy mudstone focies
eesent in the s tudy
The basin of deposi t ion of the Pi t t sburgh coalbed during l a t e Pennsylvanian time ( f i g . 3) occupied a large por t ion of Pennsyl- vania and adjacent areas of Ohio and West Virginia. The bas in ax i s was defined by a bay which, according t o Donaldson (26) , expanded and contracted during Pennsyl- vanian time i n response t o the balance between t ec ton ic subsidence, d e t r i t a l supply, and e u s t a t i c changes i n s e a l eve l .
area dur ing late Pennsylvanian time [taken from (12)l. Hoover (47) postula tes
a flood p l a i n and i n t e r d i s - t r i b u t a r y bay environment i n
the nor th and northwest p a r t of the bas in and a higher a l l u v i a l p l a i n region along the south, southeas t , and e a s t s ide of the basin. Plant ma te r i a l , which eventually became t h e Pit tsburgh coalbed, accumulated i n a swamp environment associated with the d e l t a i c sedimentation systems extending i n t o the shallow bay. Darrah (23) notes t h a t the c l imate of t h e area was probably moderate i n temperature, r a t h e r than t r o p i c a l a s was once thought. Ferm and Cavaroc (32) and Conti (20) have made other paleogeographic inves t igat ions .
7
Thickness and Rate of Accumulation
A coa l isopach ( f i g . 4 ) was prepared t o give an idea of o r i g i n a l minable c o a l i n place. The i n t e r v a l measured included pa r t ings i n the coal . It a l so included roof c o a l when not separated by more than 6 inches of sha le or sand- stone. I t was constructed from more than 3,000 data points ( f i g . 5) derived from two sources, d r i l l e r ' s logs of o i l and gas wells and core logs from c o a l companies. The thickness da ta from the d r i l l e r ' s logs, somewhat l e s s r e l i a b l e (probably '2 f e e t ) than those obtained from t h e de ta i l ed core descr ip t ions , were mapped a s reported. The r e l i a b i l i t y of the d r i l l e r ' s logs depends i n p a r t on how long ago t h e w e l l s were d r i l l e d , the type of equipment used, and the exact i tude of the d r i l l e r . Core da ta descr ip t ion genera l ly corre la ted wel l with o i l and gas wel l d r i l l e r ' s logs. Mined-out areas a r e depicted on a separa te map ( f i g . 6) . S t r i p -mined areas , determined from the most recent topographic maps, a re shown on the overburden isopach ( f i g . 7) .*
4Both the isopach of the coalbed and the overburden isopach a r e avai lable from the authors ' a t sca les of 1:24000 (one inch equals 2,000 f e e t ) . The isopach has a 100-foot contour i n t e r v a l on t h e 1:24000 maps. Also a l l o the r maps of the area a r e ava i l ab le on a s c a l e of 1 : 96000.

LEGEND
I O f t 0 - 4 f t 4 - 8 f t 8 -12f t a 12-16ft
I 6 f t
Scale, miles
FIGURE 4. - lsopach of the Pittsburgh coalbed. (Sandstone cutouts are not included.)

The areas of th icker coa l (greater than 8 f e e t ) do not d i r e c t l y over l i e t h e regional sync l ina l troughs but a r e located genera l ly on t h e i r f lanks. It is sug- gested t h a t t h e deposit ion of the Pit tsburgh coal i s i n p a r t s t r u c t u r a l l y con t ro l l ed , and tha t the axes of the p r inc ipa l s t r u c t u r e s have changed only s l i g h t l y s ince deposit ion.
The dominant isopach trend (greater than 8 f e e t ) coa l begins i n northern Harrison County, W. Va.., runs through c e n t r a l Marion and Monongalia Counties, and extends i n t o e a s t e r n Greene County, Pa . It i s associ- ated with the Shinnston and Greensburg synclines ( f i g . 2 ) . Another t rend, less d i s t i n c t , about 10 miles t o the west, begins i n western Marion County, W . Va., and runs through c e n t r a l Greene County, Pa. , i n t o Washington County. This trend genera l ly l i e s on the eas te rn f lank of the Robinson and Waynesburg synclines. A t h i r d trend over l i e s the Nineveh syn- c l i n e of western Greene and c e n t r a l Washington Counties, Pa.
The th ickes t coa l mea- sured was 16 f e e t i n a core
LEGEND hole i n northern Monongalia :::.'. Data points County, W. Va. ( f ig . 4 ) , near
0 6 12
Scale, miles
the Pennsylvania border. Several thicknesses of 15 f e e t were a l so obtained from
FIGURE 5. - Location of data points for the study area. core descriptions in the same v i c i n i t y .

LEGEND
I Montour No. 4 2 Mathies 3 Maple Creek 4 Westland 5 Somerset No. 60 6 Vesta No. 4 7 Vesta No. 5 8 Marianna No. 58 9 Gateway
10 Mather colleries I / Humphrey No. 7 12 Shannopin 13 Blacksvil le No. 2 I4 Blacksville No. I 15 Pursglove 16 Osage No. 3 17 Federal No. 2 18 Arkwright 19 Loveridge 20 Federal No. I 21 Consol No.93 22 Consol No.9 23 Joanne 24 Bethlehem No. 4 1 25 Bethlehem No.44 26 Consol No. 2 0 27 Robena 28 Nemacolin 29 Crucible 30 Bethlehem No. 51
fJ Mined-out area (as of 1973)
0 6 12
Scale, miles
FIGURE 6, - Areas of the Pittsburgh coalbed that have been mined out.

LEGEND , Stripmine I 0-400ft
400-800ft 800-~200ft h m f t phis L
FIGURE 7. - Overburdbn isopoch of the strata above the Pittsburgh coalbed.

Arkle (1) and Kent and Gomez (58) b e l i e v e t h a t the s t r u c t u r e s may have been "growing" dur ing depos i t i on , which could pos s ib ly exp la in t h e t h inne r c o a l s near t h e axes of a n t i c l i n e s and the t h i c k e r c o a l depos i t s near t h e syn- c l i n a l trough. Areas of low c o a l ( l e s s than 4 f e e t ) a r e s c a t t e r e d throughout t h e a r ea . Many have a p r e f e r r e d o r i e n t a t i o n , p a r a l l e l t o t h a t of t h e r eg iona l s t r u c t u r e . Some a r e c l o s e l y a s soc i a t ed wi th t he a n t i c l i n a l t r ends of t h e p re sen t s t r u c t u r e . These t h i n a r ea s may r e p r e s e n t lower accumulation of p l a n t m a t e r i a l , g r e a t e r e ros ion , o r i r r e g u l a r s u r f a c e of depos i t i on . Severa l of t he t h i n c o a l a r ea s have a s inuous p a t t e r n sugges t ive of meandering streams and a r e probably t he r e s u l t of s t ream e ros ion .
Hoover (47) a t t r i b u t e d t h e v a r i a t i o n s i n t h i cknes s of t he P i t t sbu rgh coalbed t o fou r p o s s i b l e causes : (1) Greater abundance of p l a n t growth i n some p a r t s of t h e coalbed r e l a t i v e t o o t h e r s , (2) b e t t e r p r e se rva t ion of accumulated p l a n t d e b r i s i n some a r e a s , (3) i n f l u x of coa r se r d e t r i t a l mate- r i a l s t h a t may have d i l u t e d p a r t of the p e a t a l ready formed o r terminated p l a n t growth, and (4) t he presence of deeper water , which prevented t e r r e s - t r i a l v e g e t a t i o n from becoming e s t a b l i s h e d .
There were a t l e a s t t h r e e o t h e r p o s s i b l e reasons f o r t h e v a r i a t i o n i n th ickness : (1) Some p a r t s of t h e swamp e x i s t e d longer than o t h e r s , (2) some a r e a s may have been too high and dry t o a l low s u b s t a n t i a l p l a n t growth, and (3) pos tdepos i t i ona l e ros ion .
The time r equ i r ed f o r formation of t he P i t t s b u r g h coalbed can be e s t i - mated from t h e t h e o r e t i c a l r a t e of accumulation f o r an i d e a l coalbed a s d e t e r - mined by Ashley (2). Approximately 10 yea r s would be r equ i r ed f o r 1 f o o t o f pea t t o form from accumulated p l a n t m a t e r i a l . Since compaction and dewatering due t o b u r i a l would reduce 1 f o o t of pea t t o 1-118 inches , approximately 100 yea r s i s r equ i r ed t o produce 1 f o o t of compressed p e a t . The formation of 1 f o o t of c o a l r e q u i r e s between 3 and 3-112 f e e t of compressed pea t , equiva- l e n t t o a t l e a s t 300 years . Thus, a 6-foot t h i cknes s of P i t t s b u r g h c o a l would t h e o r e t i c a l l y r e q u i r e 1,800 yea r s of accumulation of p l a n t m a t e r i a l . This i s on ly a reasonable e s t ima te and cannot be considered a f i rm r u l e because the maximum th i cknes s of 16 f e e t , which would r e q u i r e 4,800 yea r s f o r depos i t i on , i s immediately ad jacent t o t h inne r c o a l s . This maximum th i cknes s may be due t o g r e a t e r accumulation of p l a n t m a t e r i a l i n low a r e a s a s i t was washed down from surrounding he igh t s .
General ized S t r a t i g r a p h y of the P i t t sbu rgh Formation
The Monongahela Formation i n western Pennsylvania was r a i s e d t o group rank by B e r r y h i l l and Swanson (2) who d iv ided i t i n t o two formations, t h e P i t t s b u r g h , which inc ludes dominantly ca lcareous rocks w i th t h e P i t t s b u r g h coalbed a s i t s b a s a l member and extends t o the base of t h e Uniontown coalbed; and t h e Uniontown, which inc ludes t h e Uniontown coalbed and t h e over ly ing p re - dominantly sandy rocks t o t he base of t h e Waynesburg coalbed.
The P i t t s b u r g h Formation ( f i g . 8) has f i v e members: Lower, Redstone, F i shpo t , Sewickley, and Upper. The Lower member i nc ludes the P i t t s b u r g h c o a l - bed a t the base of t h e over ly ing P i t t sbu rgh sandstone (when p r e s e n t ) . This

LEGEND
Limestone Sandstone
Limyshale Coal
Sandy shale
1-1 Limestone bed D - - -A - ----- ----
Limestone bed C
-L Limestone bed B
Limestone bed A
1-1 Benwood limestone bed I Sewickley coal bed
-. - . - , . . . - Redstone coalbed I
Pittsburgh rider coal Pittsburah coal bed
Upper member
Sewickley member
Fishpot member
Redstone member
Lower member
FIGURE 8. - Generalized stratigraphic column of the Pittsburgh Formation.
sandstone i s the t h i c k e s t and most ex t ens ive sandstone i n t h e Monongahela Group.
The Redstone member i s t y p i c a l l y s i l t s t o n e and mud- s tone w e r l a i n by a r e l a - t i v e l y p e r s i s t e n t l imestone. I t s b a s a l member is the Redstone coalbed. The Fishpot member i s composed mainly of s i l t s t o n e and mud- s tone . The Sewickley member has t h e t h i c k e s t l imestone sequence, and the Sewickley coalbed i s a t i t s base. The Upper member has four l ime- s tone u n i t s and no underly- i n g c o a l s ; i t s top is t h e base of t h e Uniontown c o a l - bed. According t o Hoover (47), t h e Monongahela Group inc ludes t h e s t r a t a from t h e base o f t h e P i t t sbu rgh c o a l - bed t o t he top of t h e Waynesburg coalbed. The th ickness ranges from 220 t o 450 f e e t and c o n s i s t s mainly of interbedded sandstone, s i l t s t o n e , l imestone, and s h a l e wi th l e s s e r amounts of c o a l and c l a y . I n gene ra l , throughout t h e s e c t i o n the c o a l s o v e r l i e t h e ca lcareous u n i t s b u t a r e separated from them by underc l ays . The P i t t sbu rgh coalbed is the most ex t ens ive and economi- c a l l y important p a r t of t h e Monongahela Group.
Overburden Thickness Above t h e P i t t sbu rgh Coalbed
An isopach ( f i g . 7) was prepared t o d i s p l a y t h e th ickness of rock over ly- i ng t h e P i t t sbu rgh coalbed i n t h e s tudy area . The map w a s cons t ruc ted by sub- t r a c t i n g t h e e l e v a t i o n of t he s t r u c t u r e , drawn on the base of t h e c o a l from the topographic e l eva t ion . Overburden th ickness ranged from zero , where the P i t t sbu rgh coalbed crops o u t , t o more than 1,500 f e e t . General ly , the coa l i s shal low on t h e axes of a n t i c l i n e s and deeper i n the t roughs of sync l ines . The deepest cover i n t h e s tudy a r e a i s i n southwestern Greene County and western

Monongalia and Marion Counties, where i t averaged 1,200 f e e t with a maximum thickness of s l i g h t l y over 1,500 f e e t .
As mining progresses under deeper cover , methane con t ro l and other mining problems w i l l undoubtedly i n t e n s i f y . A s gas emission r a t e s a re measured by t h e Bureau f o r increas ing depths, attempted c o r r e l a t i o n s with overburden th i ck - ness w i l l be made t o develop a t h e o r e t i c a l model of depth versus gas emission f o r the Pi t t sburgh coalbed.
I n Washington County the Pi t t sburgh coalbed crops out and i s strip-mined i n t h r e e l o c a l i t i e s ( f i g . 7 ) . One outcrop i n the western p a r t of the county has no s t r u c t u r a l dependence. The o ther two occur on t h e axes of the Amity a n t i c l i n e and the top of the Westland dome. Maximum overburden thickness i s s l i g h t l y over 800 f e e t i n the southwestern p a r t of the county. Average t h i c k - ness i s approximately 400 f e e t .
I n Greene County the coalbed crops out and i s strip-mined along t h e Monongahela River. The overburden reaches a maximum thickness of 1,400 f e e t i n southwestern Greene County and averages approximately 800 f e e t . The a rea where the overburden i s r e l a t i v e l y shallow i s roughly p a r a l l e l t o t h e axes of a n t i c l i n e s , and the areas of the g r e a t e s t overburden a re i n the sync l ina l troughs. For example, t he Nineveh syncl ine i n the southwestern p a r t of the county has an overburden of between 800 and 1,200 f e e t . Along the Washington a n t i c l i n e t o the west, t h e overburden ranges between 400 and 800 f e e t .
I n Monongalia County the re i s s t r i p p i n g along the e a s t e r n edge of t h e Pi t t sburgh coalbed where i t c r o p s o u t . Of t h e four coun t i e s , Monongalia'has the most ex tens ive s t r i p p i n g of the Pi t t sburgh coalbed. The coalbed r a p i d l y increases i n depth t o a maximum of 1,500 f e e t of overburden i n the western p a r t of the county.
I n Marion County the Pi t t sburgh coalbed crops out along the e a s t e r n p a r t of t h e county. The c e n t r a l p a r t of the county has an average of 400 f e e t of overburden, whereas the western p a r t has between 800 and 1,200 f e e t of cover.
Only small s ec t ions of Harrison and Wetzel Counties a r e covered i n t h i s study. I n Wetzel County, the e a s t e r n p a r t of which i s included i n t h i s s tudy, the overburden averages between 800 and 1,200 f e e t . I n Harrison County, there i s some outcrop and s t r i p mining. The overburden averages approximately 400 f e e t with a high of 1,300 f e e t along the border between Harrison County and Marion and Wetzel Counties.
GEOLOGIC FACTORS CONTRIBUTING TO M I N I N G PROBLEMS
Geological inves t iga t ions can i d e n t i f y many underground mining problems. Sand channels t h a t may i n t e r s e c t and c u t out the coal can be located i n advance of mining by ana lys i s of core hole logs, and t h e i r probable course and influence on fu tu re mining operat ions can be predicted (76). Clay ve ins can be located and t h e i r t rends can sometimes be es tabl i shed so t h a t high gas con- c e n t r a t i o n s , f requent ly associated with c l a y ve ins , can be an t i c ipa ted .

A d e t a i l e d map of t h e rock above t h e coalbed can be used t o determine t h e l eng th of b o l t s needed t o anchor i n t o competent s t r a t a f o r proper roo f suppo r t . Such a map can a l s o h e l p t o l o c a t e rock known t o d e t e r i o r a t e r a p i d l y when exposed t o a i r s o t h a t r e s i n b o l t s can be used.
Abnormal accumulations o f wate r can be eva lua ted and perhaps r e l a t e d t o f r a c t u r i n g of t h e roof rock o r t o a f a u l t zone. These zones of weakness may a l s o be r e s p o n s i b l e f o r high gas concen t r a t i ons .
A d e t a i l e d a n a l y s i s of s u r f a c e j o i n t s above a mine a r e a can be prepared and examined f o r a p o s s i b l e r e l a t i o n s h i p t o t h e c o a l c l e a t d i r e c t i o n s and roo f j o i n t s . Local d e v i a t i o n s i n j o i n t and c l e a t d i r e c t i o n s s e r v e a s a b a s i s f o r modifying mine p r o j e c t i o n s . The c l e a t and j o i n t ana ly se s a l s o supply informa- t i o n r e l a t e d t o roof s t a b i l i t y . For example, excess ive s p a l l i n g of r i b s when mining p a r a l l e l t o c l e a t d i r e c t i o n s can sometimes be c o r r e c t e d by r o t a t i n g t h e d i r e c t i o n of mining 45".
S t r a t a Above t h e P i t t s b u r g h Coalbed
The s t r a t a over ly ing t h e P i t t s b u r g h coalbed v a r y l o c a l l y and r e g i o n a l l y a s shown i n t h e fence diagram ( f i g . 9 ) . This f i g u r e was prepared u s ing 77 c o r e l o g s , e l e c t r i c l ogs , and o t h e r d a t a s e l e c t e d from more t h a n 500 logs t o b e s t r e p r e s e n t t h e r e g i o n a l s t r a t i g r a p h i c t r ends . The most common rock t ype d i r e c t l y over ly ing t h e P i t t s b u r g h coalbed i s t h e "draw s l a t e " o r "roof s l a t e " (miners ' t e rminology) , c o n s i s t i n g of a l t e r n a t i n g t h i n l y bedded, da rk gray t o b l a c k , f i s s i l e carbonaceous s h a l e , c o a l s t r i n g e r s , and sandstone l e n s e s . This draw s l a t e u n i t i s g e n e r a l l y l e s s t han 4 f e e t t h i c k , bu t t h i cknes se s up t o 12 f e e t have been observed.
I n t h e c e n t r a l p a r t of t h e s t udy a r e a , t h e most common rock t ypes above t h e draw s l a t e a r e l imestone and ca l ca r eous and s i l t y s h a l e s . Surrounding t h e c e n t r a l a r e a i s a sequence of s h a l e s and massive sands. Other a r ea s of mas- s i v e sand development a r e shown on t h e sands tone channel map ( f i g . 10 ) .
I n Monongalia and Marion Count ies , W . Va., t h e rocks above t h e c o a l and draw s l a t e a r e predominantly l imestone and s h a l e , a l though t h e "limestone" o f o l d e r c o r e l ogs i s more l i k e l y in te rbedded l imes tone , s h a l e , and s i l t s t o n e ; i n e a r l i e r y e a r s t h e s e rock types were no t u s u a l l y d i f f e r e n t i a t e d . The only sand d e p o s i t s i n t h e s e two c o u n t i e s a r e a long t h e e a s t e r n margin o f t h e a r ea .
The roof rock i n Greene County, Pa . , i s s i m i l a r t o t h a t i n Monongalia and Marion Count ies , W . Va. Limestone i s s t i l l dominant i n t he sou th bu t dec rea se s i n importance toward t h e n o r t h e r n border where l a r g e sand bodies become more prominent. The P i t t s b u r g h sandstone u n i t may b e up t o 80 f e e t t h i c k .
I n Washington County, Pa . , l imestone dominates t h e southwestern p o r t i o n , sands tone t h e sou thern and c e n t r a l a r e a , and s h a l e t h e no r the rn p o r t i o n . Throughout t he a r e a , a few c o a l s a r e d e t e c t e d , bu t t h e r e appears t o be no p a t t e r n t o t h e i r occurrence.

FIGURE 9, - Fence diagram of the strata direct ly above the Pittsburgh coal- bed for the study area.

LEGEND
4 Sandstone cutouts
Scale, miles
FIGURE 10. - Map of the known sandstone channels cutt ing into the Pittsburgh coal bed,

An isopach of t h e P i t t s b u r g h sandstone prepared by Hoover (47) covers t h e known e x t e n t of t h e P i t t s b u r g h sandstone i n Monongalia and Marion Count ies ,
Greene County, Pa. , and p a r t of Washington County, Pa. ( f i g . 11 ) . The bodies t r end predominantly e i t h e r t o t he n o r t h e a s t o r northwest .
p o r t i o n s of t h e sandstone e s p e c i a l l y seem t o be o r i e n t e d t o t h e n o r t h e a s t , a s a r e t h e axes of t h e f o l d s , which aga in sugges ts some s t r u c t u r a l c o n t r o l . There i s a l s o t h e p o s s i b i l i t y t h a t t h e sandstone bodies a r e s e d i - men to log ica l ly c o n t r o l l e d , a s suggested by W. Edmonds of t h e Pennsylvania Geological Survey (persona l c o m n i c a t i o n , a v a i l a b l e f o r c o n s u l t a t i o n a t Bureau of Mines P i t t s b u r g h Mining and S a f e t y Research Center , P i t t s b u r g h , Pa . ) . The no r theas t -o r i en t ed bodies could be r e l a t e d t o t he s t r i k e of t h e s t r a n d l i n e and could have formed as longshore b'ars. The nor thwes t -or ien ted bodies could be down-paleoslope f e a t u r e s such as a l l u v i a l v a l l e y s . A c o r r e l a t i o n may a l s o e x i s t between t h e t h i cknes s of t he sandstone and a r e a s of sandstone c u t o u t s i n t h e c o a l .
I Sandstone Channels
Sandstone channels a r e l e n t i c u l a r , sometimes s inuous bodies of sandstone extending i n t o , and sometimes complet ly through, a coa lbed . F igure 10 i s a map of known sandstone channels i n t h e P i t t s b u r g h coa lbed , encountered i n underground mining ope ra t i ons . Cross (2) a l s o r e p o r t s a channel extending from southwestern Pennsylvania t o Monongalia County, W. Va., g e n e r a l l y p a r a l - l e l i n g t he Monongahela River. The channel then t u r n s westward a t t h e Monongalia-Marion County border .
Most of t h e known channels a r e w i t h i n t h e p r e s e n t mine workings. Chan- n e l s a r e d i f f i c u l t t o d e t e c t i n advance of mining because exp lo ra to ry d r i l l i n g of a mine p rope r ty i s f r equen t ly on 1 - m i l e c e n t e r s o r more, whereas t h e chan- n e l s a r e u s u a l l y l e s s than 2,000 f e e t wide. A much c l o s e r spac ing , p r e f e r a b l y 2,000 o r 3,000 f e e t , w i l l enable more d e t a i l e d mapping and p r e d i c t i n g of sand- s t o n e channel t r e n d s i n advance of mining.
Even when a sandstone channel i s n o t d i r e c t l y encountered i n t h e co re d r i l l i n g , o t h e r evidence may sugges t t he proximi ty of one. The c o a l may become abnormally t h i c k , sometimes even doubling i n t h i cknes s nea r a sandstone channel by poss ib ly washing t o t h e s i d e o r by d i f f e r e n t i a l compaction. The s u l f u r c o n t e n t m a y i n c r e a s e toward channel a reas . Channels can a l s o p o s s i b l y be de t ec t ed by a n a l y s i s of t h e r e l a t e d sediments us ing sed imento logica l and pa l eodepos i t i ona l t echniques , b u t t h i s would be beyond the scope of t h i s paper. Donaldson and Morton (27) l i s t e d f i v e c r i t e r i a t h a t may be h e l p f u l i n p r e d i c t i n g channels : (1) Presence of c l a y v e i n s , ( 2 ) change i n c o a l type , (3) i nc rease i n t h e number and th i cknes s of p a r t i n g s , ( 4 ) i nc rease i n d e t r i -
( t a l s i n t h e c o a l , and (5) a down-bowed pa r t i ng .

0 5 10 - Scale, mlles
FIGURE 11. - lsopach of the Pittsburgh sandstone (48).

A t the Shannopin and Robena mines i n Greene County, a number of channels i n t e r s ec t the coalbed ( f ig . 12). A fence diagram ( f i g . 13) of the area around the Shannopin mine shows a large l en t i cu l a r sands tone body (Pit tsburgh sandstone) overlying the coal . When
LEGEND the location of the sand- .- :: Sandstone cutout s tone ch anne 1 s tha t i n t e r -
s ec t the Shannopin and -5 Robena mines a r e p lo t t ed on
Scale, miles f igure 11, these washouts a r e seen to occur i n an area where the sandstone i s 40 t o 60 f e e t thick. Bureau geol-
GREENE COUNTY - - --- ~ g i s t s have found t ha t when w. va. MONONGALIA C ~ U N T Y core logs indicate t ha t such
a sandstone body i s approach- FIGURE 12. - Map of the Shannopin and Robena mines ing the coal, the is
with sandstone cutouts. very l i ke ly t o be cu t out. Where the s t r a t a f o r approx-
imately 40 f e e t above the Pittsburgh coalbed cons i s t of limestone and shale , the re i s l i t t l e chance of encountering a sandstone channel during mining. Figure 10 a l s o shows other mines where sandstone channels have occurred.
Clay Veins
Clay veins a r e wedges of indurated c lays and s i l t s t ha t penetrate the coalbed from e i t he r above or below. They can be v e r t i c a l ( pa r a l l e l t o the c l e a t d i rec t ions ) or form an angle of about 45" with the v e r t i c a l ( pa r a l l e l t o shear d i rect ions ) ( f ig . 14).
Clay veins encountered i n mines a r e usual ly crooked, a r e frequently angular, and in te r f inger with the coal r a the r than forming smooth contact su r - faces. They may be hard enough t o damage mining equipment. Thickness nor- mally ranges from 1 inch t o several f e e t but may be up t o 15 f ee t . A t o t a l length of more than 1,000 f e e t has been observed underground.
There a r e two physical types of c lay veins. The f i r s t occurs as inclu- s ions wi thin a c l a y - s i l t matrix and has a conglomeratic or brecciated appear- ance. The second type i s composed of small in ter locking l ens l ike masses of shale fragments wi th convoluted, slickensided surfaces.

P /
/ /
i Mine
\ \ /- ------I
0 U
LEGEND . - + Scale, feet Limy shale
50 Limestone
0 Shale
0 a Sandstone
4,000 8,000 Horizontal Coal
FIGURE 13. - Fence diagram of the strata above the Pittsburgh coalbed at the Shannopin mine.

Scale, feet LEGEND
0 Sandstone Cloy vein
Bottom
Rl Coal
Horizontal
FIGURE 14. - Generalized cross section o f clay veins intersecting coalbeds.
Clay veins were found i n the following mines operating i n the Pit tsburgh coalbed ( f ig . 15): Mathies, Bethlehem Nos. 41 and 44, Marianna No. 58, Gateway, Shannopin, and Vesta No. 5 ; a l l these mines have a predominance of sandstone i n the immediate roof. Two o the r adjacent mines, Loveridge and Federal No. 2 , show no c lay ve ins , and t h e i r roof s t r a t a a r e predominantly sha le :and limestone.
The presence of c l a y veins can g r e a t l y a f f e c t mining conditions. They o f ten form c e l l s within which large volumes of gas a r e i so la ted under high pressure. A t e s t hole d r i l l e d i n t o a c e l l enclosed by such a c lay v e i n mea- sured a confined pressure of 263 lb/ in2 (a). The gas flow from a 2-inch hole d r i l l e d hor izonta l ly i n t o the coalbed through t h e c lay v e i n a t t h i s point pro- duced an average of 78,000 f t3 /d of gas f o r a shor t time. When mining encoun- ters such a c e l l , la rge volumes of gas a r e re leased rap id ly i n t o the mine c r e a t i n g an explosion hazard. Also the chance of an explosion i s increased by the sparks t h a t are generated when mining i n t o c lay veins with both continuous miners and lognwall systems.

LEGEND
Clay vein area
0 6 12
Scale, miles
FIGURE 15. - Mines operating in the Pittsburgh coalbed with abundant clay veins.

-300- Structure contour, 50+t interval Drawn on base of Pittsburgh coalbed Datum is mean sed level Mined-out area
0 2 4
Scale, miles FIGURE 16. - Location and structure around the Marianna No. 58 mine.

Clay ve ins g e n e r a l l y extend i n t o s t r a t a immediately overlying t h e coalbed, sometimes f o r a s much a s 10 f e e t v e r t i c a l l y . This breaks up the l a t e r a l con- t i n u i t y of t h e layered roof s t r a t a , causing roof i n s t a b i l i t y . Roof f a i l u r e s tend t o be more f requent when c l a y ve ins a r e almost p a r a l l e l t o the e n t r y than when they a r e a t r i g h t angles . Mining of c l a y v e i n s a l s o produces a marked i n c r e a s e i n t h e percentage of r e j e c t s i n t he c o a l p repa ra t ion p l a n t .
The Marianna No. 58 mine is an example of a mine wi th c l a y v e i n occur- rences . It i s loca ted i n the trough of t h e Waynesburg sync l ine ( f i g . 16). The g r e a t e s t frequency of c l a y v e i n s occurred i n a s e c t i o n of t he mine loca ted w i t h i n t h e s y n c l i n a l t rough ( f i g . 17) . The c l a y ve ins formed c e l l s w i th s i d e s o r i e n t e d s u b p a r a l l e l and subperpendicular t o the a x i a l t r end of the trough.
Clay samples from t h e Marianna No. 58 mine were analyzed by X:ray d i f f r a c - t i o n t o determine t h e i r minera logica l composition. Comparison of mineral com- p o s i t i o n s showed a nea r -pe r f ec t match between c l a y v e i n s ( f i g . 18A) and t h e draw s l a t e o r roof rocks ( f i g . 18g) above. The major minera l peaKs (quar tz , k a o l i n i t e , and i l l i t e ) a l l matched i n i n t e n s i t y and s lope . The f l o o r rock samples ( f i g . 18s) showed a d i f f e r e n t composition, with c a l c i t e and qua r t z predominating, i n d i c a t i n g t h a t i n t h i s case t h e c l a y v e i n was i n j e c t e d from t h e roof rock , no t from the f l o o r rock. I n some cases , c l a y ve ins a r e i n j e c t e d from underclays o r s h a l e l y ing below t h e coalbed up i n t o it. Examples occur i n t he Redstone coalbed and i n s eve ra l coalbeds i n western Kentucky.
\
LEGEND \
- 410- Structure contour, 5 f t Interval Drawn on base of Pittsburgh coalbed Datum a mean sea level + Syncllne axis
> Cloy vetns
0 2,000
Scale, ft
FIGURE 17. - Clay veins in synclinal trough at the Marianna No. 58 mine.
Based on Bureau r e sea rch , i t has been pos tu- l a t e d t h a t t h e c l a y ve ins in t ruded t h e c o a l a f t e r c o a l i f i c a t i o n had taken p lace . This conclus ion is supported by the presence of c o a l fragments wi th good c l e a t development i n c l a y ve ins . A s t h e c o a l f r a g - ments were layered and the l a y e r s were p a r a l l e l t o t h e d i p of t he c l a y v e i n ( f i g . 14 ) , it would appear t h a t c l a y was not i n j e c t e d i n t o c r acks i n pea t a s sug- ges ted by R a i s t r i c h and Marshall (90) , bu t was forced i n t o t h e coalbed a f t e r c o a l i f i c a t i o n .
I t appears t h a t t h e c l a y v e i n s i n t h e P i t t sbu rgh c o a l bed a r e probably t h e r e s u l t of tectonism, as i n t he Marianna No. 58 and

6 I I I I I I I I I I I I I I I ~ U a, A q 5- Sarnple,roofrock Quartz V)
- C
C s 4- 0
C
Kool ini te
8 3- 0 - I 2 - v, + - 2 I - 3
Sample, clay vein 0 5 \
Quartz
64 60 56 52 48 44 40 36 32 28 24 20 16 12 8 4
SCAN, deg
FIGURE 18. - X-ray diffraction charts of (A) the clay vein, ( B ) the roof rock, and (C) the floor rock lithologies.
V) C \
E 4 - C 3
o
u 5 ' 1 1 ' 1 1 J ' ~ ~ ~ ~ ~ ~ I I 1 1 ~ ~ ~ 1 f Sample, floor rock -
Colci te
3 - 1 .Quartz 0

LEGEND
/ Montour 4 2 Mathies 3 Westland 4 Somerset GO 5 Vesta 5 6 Marianna 58 7 Gateway 8 Shannopin 9 Humphrey 7 /O Pursglove 15 / / Blacksville I /2 Blacksville 2 13 Osage 3 14 Arkwright /5 Federal 2 /6 Consol 93 /7 Loveridge /8 Consol 2 0
,A ~ u t t cleat
\Face cleat
c o a l bed,

Shannopin mines, a l though they may a l s o be r e l a t e d t o d i f f e r e n t i a l compaction i n a d e p o s i t i o n a l environment such a s descr ibed by Wilson (124) i n t h e c e n t r a l Missouri c o a l s . This would exp la in t h e t h i c k sandstone u n i t s found above them, whereas mines wi th l imestone and s h a l e r o o f s have no c l a y ve ins . The only known evidence of igneous a c t i v i t y w i t h i n t h e s tudy a r e a i s a p e r i d o t i t e d ike found i n Faye t t e and Greene Counties , Pa. The d ike has been noted by Cross and o t h e r s , and i t s presence has been confirmed by exposure i n mine workings. The d i k e , which has been t r aced on the s u r f a c e f o r approximately 15 m i l e s , ranges i n width from a few inches t o s e v e r a l f e e t and tends t o be perpendicu- l a r t o t h e a x i a l f o l d s . The coa l around t h e d ike has been n a t u r a l l y "coked. "
C lea t Within Mines
C l e a t i s the n a t u r a l v e r t i c a l f r a c t u r e system i n bituminous c-oalbeds. It i s u s u a l l y composed of a fundamental system of two components ( s e t s ) a t 90" t o each o the r . The more dominant f r a c t u r e p lane i s t h e f a c e c l e a t ; the minor f r a c t u r e p lane i s t h e b u t t c l e a t . The f a c e c l e a t i s more cont inuous, c ros s ing bedding p lanes i n t h e c o a l and extending f o r many f e e t , and tends t o be pe r - pendicu la r t o t h e f o l d axes. The b u t t c l e a t i s s h o r t , i s o f t e n curved, and i s a d i scont inuous f e a t u r e t h a t f r equen t ly te rmina tes a g a i n s t t h e f a c e c l e a t .
I n t h e p a s t , t h e o r i e n t a t i o n of t h e c l e a t i n t h e P i t t sbu rgh coalbed con- t r o l l e d t h e d i r e c t i o n of mining. As c o a l t ends t o break along t h e c l e a t s , i t was e a s i e r t o mine p a r a l l e l to t h e c l e a t t han a t an angle t o i t . This has changed with t he i n t r o d u c t i o n of continuous miners , which mine a s f a s t a t an angle t o t h e c l e a t a s p a r a l l e l t o i t . However, c l e a t i s s t i l l v e r y important because i t s o r i e n t a t i o n determines d i r e c t i o n a l pe rmeab i l i t y which, i n t u r n , determines t h e flow of methane and water i n t o t h e mine workings (64 , 75). When mining advances perpendicu la r t o t h e f a c e c l e a t s , much more gas and water a r e emi t ted i n t o mine workings than when t h e advance i s p a r a l l e l t o t h e f a c e c l e a t .
Determination and Analys is of C l e a t O r i e n t a t i o n
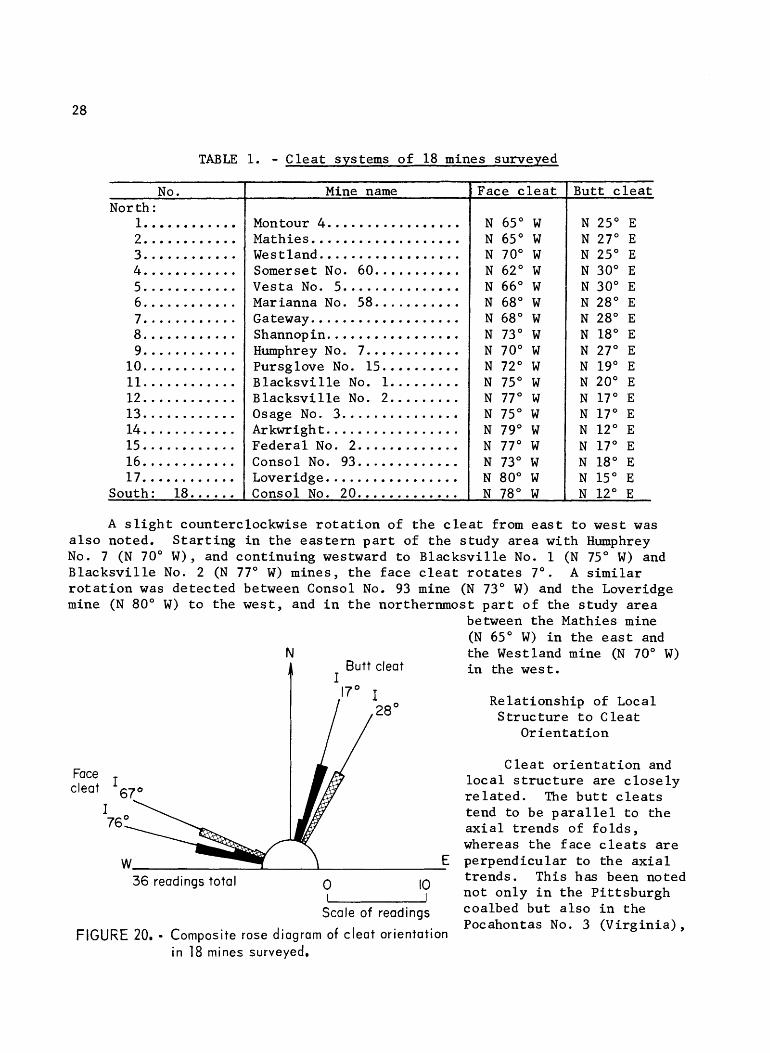
C l e a t surveys were conducted i n 18 mines ope ra t i ng i n t h e P i t t s b u r g h coalbed. The average c l e a t o r i e n t a t i o n s were measured f o r each mine ( t a b l e 1 ) and p l o t t e d according t o geographic l o c a t i o n ( f i g . 19) . A composite r o s e d i a - gram ( f i g . 20) was cons t ruc t ed u s ing t h e va lues from t a b l e l. Two d i s t i n c t peaks a r e p re sen t i n t h e f a c e and b u t t c l e a t d i r e c t i o n s . Two equa l ly dominant fundametal c l e a t systems wi th d i r e c t i o n a l t r ends approximately perpendicu la r a r e c a l c u l a t e d f o r t h e s tudy a rea . These two systems a r e N 76" W - N 17" E , w i th a 93" s e p a r a t i o n ; and N 67" W - N 28" E , wi th a 95" separa t ion .
I n southwestern Pennsylvania and no r the rn West V i r g i n i a , t he c l e a t sys - term r o t a t e c lockwise from sou th t o nor th . I n f i g u r e 20, t h e dominant N 17' E d i r e c t i o n i s composed of t h e measurements from mines i n t h e southern p o r t i o n of t h e a r e a (Nos. 8 t o 18 wi th t h e except ion of No. 9 ) , and t h e dominant N 28' E d i r e c t i o n i s composed of t h e measurements from mines i n t h e n o r t h e r n p o r t i o n of t h e a r e a (Nos. 1 t o 7 p l u s 9 ) . The geographic p l o t of t h e c l e a t systems ( f i g . 19) g ives a more d e t a i l e d p i c t u r e of t h e c l e a t r o t a t i o n on a mine-to-mine b a s i s .
28
TABLE 1. - Clea t systems of 18 mines surveyed
A s l i g h t counterclockwise r o t a t i o n of t he c l e a t from e a s t t o west was a l s o noted. S t a r t i n g i n the e a s t e r n p a r t of t h e s tudy area with Humphrey No. 7 (N 70" W), and continuing westward t o B lacksv i l l e No. 1 (N 75" W) and B lacksv i l l e No. 2 (N 77" W) mines, t h e face c l e a t r o t a t e s 7". A s i m i l a r r o t a t i o n was de tec ted between Consol No. 93 mine (N 73" W) and the Loveridge mine (N 80" W) t o the west , and i n t h e northernmost p a r t of the s tudy a rea
between the Mathies mine (N 65" W) i n the e a s t and
N the West land mine (N 70" W) i n the west.
Relat ionship of Local S t ruc tu re t o Clea t
Or i en ta t ion
C lea t o r i e n t a t i o n and l o c a l s t r u c t u r e a re c l o s e l y r e l a t e d . The b u t t c l e a t s tend to be p a r a l l e l t o the a x i a l t rends of f o l d s , whereas the face c l e a t s a r e perpendicular t o the a x i a l
36 readings total 0 t rends . This has been noted I no t only i n the P i t t sburgh
scale of readings coalbed but a l s o i n the Pocahontas No. 3 (Virg in ia) ,
FIGURE 20. - Composite rose diagram of c leat or ientat ion i n 18 mines surveyed.
Butt c l e a t
N 25" E N 27" E N 25" E N 30" E N 30" E N 28" E N 28" E N 18" E N 27" E N 19" E N 20" E N 17" E N 17" E N 12" E N 17" E N 18" E N 15" E N 12" E
No. North :
I........ .... Z...... ...... 3 . . . . . . . . . . . . 4 . . . . . . . . . . . . s . . . . . . . . . . . . 6 . . . . . . . . . . . . 7. ........... 8. ........... g . . . . . . . . . . . .
10 ............ 11 ............ 12.. .......... 13 ............ 14.. .......... 15 ............ 16 ............ 17 ............
South: 18 ......
Mine name
Montour 4 . . . . . . . . . . . . . . . . . Mathies . . . . . . . ............ Westland .................. Somerset No. 60 ........... Vesta No. 5. .............. Marianna No. 58 ........... Gateway ................... Shannopin. ................ Humphrey No. 7 . . . . . . . . . . . . Pursglove No. 15 .......... Blacksv i l l e No. 1 ......... Blacksv i l l e No. 2.. ....... Osage No. 3 . . . . . . . . . . . . . . . Arkwright.. ............... Federa l No. 2 . . . . . . . . . . . . . Consol No. 93 ............. Loveridge ................. Consol No. 20 .............
1 Face c l e a t
N 65" W N 65" W N 70" W N 62" W N 66" W N 68" W N 68" W N 73" W N 70" W N 72" W N 75" W N 77" W N 75" W N 79" W N 77" W N 73" W N 80" W N 78" W

t h e Lower Ki t tanning (Pennsylvania) , and the Har t shorne (Oklahoma) coalbeds (75)
A good example of t he r e l a t i o n s h i p between l o c a l s t r u c t u r e and c l e a t o r i e n t a t i o n i n the P i t t s b u r g h coalbed can be observed i n t h e Pursglove No. 15 mine, loca ted i n Monongalia County, W. Va. , between the a r e a ' s two dominant s t r u c t u r a l f e a t u r e s - - the Faye t t e a n t i c l i n e and t h e Lambert sync l ine ( f i g . 21) . C l e a t o r i e n t a t i o n s measured i n t he mine de f ine a M 72" W - N 19" E fundamental system. The s t r u c t u r a l s t r i k e w i t h i n t h i s p o r t i o n of the mine averages N 24" E , c l o s e t o t h e N 19" E s t r i k e of t h e b u t t c l e a t . The s t r u c t u r a l d i p i s N 76" W , s i m i l a r t o t h e N 72" W t rend of the face c l e a t . S imi l a r (210") r e l a - t i o n s h i p s between c l e a t o r i e n t a t i o n and l o c a l s t r u c t u r a l t r ends a r e observed f o r the ma jo r i t y of the mines surveyed.
Scale, f t
FIGURE 21. - Relotionship between local structure and cleat orientation i n the Pursglove No. 15 mine, Monongalio County, W. Va.

Geologic Fac to r s Affec t ing Methane Emission
The P i t t s b u r g h coalbed i s a gassy coalbed. According t o I r a n i (50-51) t h e f i v e coun t i e s i n t h e United S t a t e s producing t h e most c o a l gas a r e - -
Monongalia County, W. Va.. ............. 40.7 Marion County, W. V a . . . . . . . . . . . . . . . . . . . 23.1 Buchanan County, Va.. .................. 22.1 Washington County, Pa . . . . .............. 12.4 Greene County, Pa. ..................... 11.7
Four of t he se coun t i e s a r e w i t h i n t he s tudy a r ea . They have a t o t a l gas pro- duc t ion of 87.9 MM f t 3 /d ; approximately 95 percent i s from mining i n the P i t t s b u r g h coalbed. Also K i m (60-61) has es t imated t h a t t h e P i t t sbu rgh c o a l - bed i n southwestern Pennsylvania (over an a r e a o f 575 square mi les ) con ta in s over 500 b i l l i o n f t 3 of methane i n t h e v i r g i n coa l .
Analysis of a number of gas samples c o l l e c t e d from h o r i z o n t a l ho l e s d r i l l e d from a c t i v e f a c e s i n t o v i r g i n c o a l (2) showed t h a t t h e i r methane con- t e n t s ranged from 84 t o 96 percent ( t a b l e 2 ) .
TABLE 2 . - Composition of gas from the P i t t s b u r g h coalbed, percent
s i o n i n i d
Gas CH, ......................... C2H6. . . . .................... CO .......................... O,........................... N2..........................
Although the i s s t i l l no t e n t i f y i n g c e r
t o t a l e f f e c t of t he geology of a coalbed on i t s methane emis- completely understood, cons iderab le progress has been made t a i n c o n t r o l l i n g f a c t o r s . K i s s e l l and B i e l i c k i (64) have
found t h a t an unf rac tured "so l id" block o f c o a l has a v e r y low pe rmeab i l i t y , i n c o n t r a s t t o high pe rmeab i l i t y i n t h e coalbed where f r a c t u r i n g i s ex tens ive . The d e n s i t y of t h e f r a c t u r e s and t h e pe rmeab i l i t y of t h e coalbed depend on t h e c o a l rank. The low-vola t i l e c o a l s tend t o be t h e most h igh ly f r ac tu red . I n a g iven coalbed, f r a c t u r e s a r e no t uniform i n s i z e o r spacing. This could be due t o such f a c t o r s a s the degree of fo ld ing and f a u l t i n g , proximity t o f o l d axes, and t h e th ickness of overburden. The i n s i t u f r a c t u r e spacing c a l c u - l a t e d f o r t h e P i t t sbu rgh coalbed i s 8 cm, as compared wi th 4.5 cm f o r t h e Pocahontas No. 3 coalbed, although observed f r a c t u r e spacings may va ry widely from t h e s e c a l c u l a t i o n s .
Sample 1 88.91
.04 10.97
.04
.05
Permeabi l i ty should be g r e a t e s t i n t he f ace c l e a t d i r e c t i o n . I n one a r e a of a mine opera t ing i n t he P i t t sbu rgh coalbed, t h e methane emission from t h e s o l i d r i b s was s i g n i f i c a n t l y h ighe r than t h e emission from the working face . I t was observed t h a t t h e r i b i n t e r s e c t e d t h e f ace c l e a t s and t h a t t h e working f ace was d ra in ing the l e s s permeable b u t t c l e a t s (64).
Sample 2 95.86
1.08 2.54
.06
.46
Sample 3 93.85
.04 4.75
.05 1.20
Sample 4 84.4 - 14.75
.02 -65

Measurements by Parsons and Dahl (82) of the l a t e r a l compressive s t r e s s e s i n s t r a t a adjacent t o the Pi t t sburgh coalbed showed t h a t the major l a t e r a l s t r e s s is i n an east-west d i r e c t i o n , near ly perpendicular t o the b u t t c l e a t d i r ec t ion . They concluded tha t the b u t t c l e a t s a re squeezed more t i g h t l y , reducing the permeabil i ty even more.
These observations show the importance t h a t c l e a t plays i n determining "di rec t ional permeabil i ty." Any hor izon ta l d r i l l i n g i n mines t o degasify an a rea must take i n t o account t h e prefer red flow due t o d i r e c t i o n a l permeability. Bureau research has shown t h a t a hole d r i l l e d i n t o the coalbed perpendicular t o the face c l e a t could y ie ld from 2.5 t o 10 times a s much gas a s a hole d r i l l e d perpendicular t o t h e b u t t c l e a t . A t the Federal No. 2 mine i n Monongalia County, th ree holes were d r i l l e d perpendicular t o the face c l e a t and a four th was d r i l l e d p a r a l l e l t o i t ( f i g . 22). The hole d r i l l e d p a r a l l e l had the lowest gas pressure , whereas the holes d r i l l e d perpendicular t o the f ace c l e a t maintained t h e i r sustained higher gas pressures even a f t e r produc - ing gas f o r a s much as 45 days. This d i f f e rence i n emission is undoubtedly due t o the d i f ference between the face c l e a t s , which a re much longer and more continuous f r a c t u r e s exposing l a rge r su r face a reas , and the shor te r b u t t c l e a t s , which f requent ly terminate agains t the face c l e a t .
Other geologic f a c t o r s a l s o inf luence gas emission from the coalbed. The amount of overburden i s known t o be important, but no s p e c i f i c r e l a t ionsh ip
can be es tabl i shed u n t i l N more accurate gas emission
da ta are ava i l ab le from operat ing mines. Greater werburden pressures t h a t may tend t o c l o s e f r a c t u r e s and reduce permeabil i ty may be compensated fo r by a
4- grea te r gas content of the deeper coals .
F r i a b i l i t y of the c o a l a l s o a f f e c t s methane emis- s ion . A core from the
MAP Beckley o r Pocahontas No. 3 coalbed (both of which a r e f r i a b l e ) , when allowed t o degasify i n a sealed con- t a i n e r , g ives off approxi- mately 94 percent of i t s
LEGEND t o t a l gas content , whereas I- 4 Measurement holes the same amount of P i t t s -
burgh coa l (which i s blocky) under the same condit ions
Scole, ft gives o f f only 60 t o 65 per-
FIGURE 22. - Map of Federal No. 2 mine showing hori- cent of i t s t o t a l gas. This a l s o may be due t o the
zontally drilled holes and cleat c l o s e r c l e a t spacing i n the directions,

Beckley and Pocahontas No. 3 (114 inch) coalbeds, as compared with the P i t t s - burgh coalbed ( 1 inch) .
Geologic s t r u c t u r e can a l s o a f f e c t gas emission through i t s e f f e c t on waterflow. Even a d ip of l e s s than 1" can decrease t h e flow of gas because any water i n the c o a l must be displaced u p h i l l before gas can flow f r e e l y .
Example of Geology-Related Problems i n a Working Mine
Typical s t r u c tu re - r e l a t ed problems were s tudied a t Somerset No. 60 mine (s), which was being developed down the northwest f l ank of t h e Amity a n t i - c l i n e towards a syncl ine ( f i g . 23). Water has been accumulating a t the f ace of e n t r i e s being dr iven t o the northwest , which d ip i n t o the working face. Once the ax i s of t he syncl ine i s crossed , t he f l o o r w i l l d ip away from the f ace , allowing the water t o run o f f .
The N 62" W ( face) and N 30" E ( b u t t ) c l e a t system i s n e a r l y orthogonal . The measured rock j o i n t o r i e n t a t i o n s a re between N 57" W and N 75" W , c o r r e - sponding roughly t o t h e face c l e a t . Mining was o r i g i n a l l y p a r a l l e l t o the c l e a t o r i e n t a t i o n s bu t a t present i s 45" t o the previous working. According t o the ope ra to r s , t h i s g ives more s t a b l e r i b s and roo f .
The immediate roof i s gene ra l ly coa l . A weak s l ickens ided c lays tone , gene ra l ly up t o 12 inches t h i c k and overlying the c o a l , i s removed during min- i n g , leaving the "s tab le" r i d e r coa l . Study of roof f a l l s shows the weak s t r a t a t o be e i t h e r micaceous sandstone with t h i n l y interbedded sha le , o r a l t e r n a t i n g coa l s and s l ickens ided c lays tones .
I n the western p a r t of the mine workings the re a re sand channels t h a t completely c u t out the c o a l . To i n v e s t i g a t e roof condi t ions and the probabi l - i t y of sandstone channels i n the a rea of f u t u r e advancement ad jacent t o the a c t i v e mine workings, a fence diagram ( f i g . 24) was cons t ruc ted using d a t a on t h e 40 f e e t of s t r a t a immediately above the P i t t sbu rgh coalbed. The probabi l - i t y of t h e coa l being c u t out increases i n a reas where t h e rock type d i r e c t l y above t h e coa l i s predominantly sandstone and where the base of t h e sandstone approaches t h e top of t he coa l . Based on t h i s cons idera t ion and on core d a t a , a sandstone cutout p r o b a b i l i t y map ( f i g . 25) was constructed.

KEY MAP LEGEND
Data points Mined-out area
-700- Structure contour, 25-f t interval Drawn on base of Pittsburgh coalbed Datum is mean sea level
Scale, ft FIGURE 23. - Structure map drawn on the base of the Pi t tsburgh coalbed for the area
adjacent to the act ive workings of the Somerset No. 60 mine.

<>Mine outline
LEGEND
Sondstone
Wild cool intervol
Pittsburgh coalbed' 0 I
Scole, mi
LEGEND Data points Known sandstone cutout
Probabil~ty of sandstone cutout
0 4,000 8,000 - - A Scale, ft
FIGURE 24. - Fence diagram of the strata FIGURE 25. - Sandstone channel probability directly above the Pitts- map of the area adiacent to burgh coalbed adjacent to the active workings of the the active workings of the Somerset No. 60 mine. Somerset No. 60 mine.
Zones of abrupt l i tho log ic change o f ten coincide with areas of unstable roof and high gas emission (53, 58, 75-76). The s i g n i f i c a n t l i tho log ic changes t h a t can occur within a very shor t hor izonta l d is tance above the P i t t s - burgh coalbed a re exemplified i n f igure 26 by two core holes (TH1 and TH2) 620 f e e t apar t and on opposite s ides of the boundary between the zones of low and high p robab i l i ty shown i n f igure 25. The rapid change i n l i thology is due t o the removal of stream eros ion of approximately 20 f e e t of o r i g i n a l sediments a t t h e loca t ion of the TH2 hole along a stream channel t h a t was subsequently f i l l e d with sand. More core d r i l l i n g i n the area adjacent t o the ac t ive work- ings of the Somerset No. 60 mine could provide addi t ional da ta t o substan- t i a l l y r e f i n e the p red ic t ion of s p e c i f i c problem areas. The p rac t i ce of spac- ing core holes 3,000 f e e t o r more apar t makes cor re la t ions and predic t ions d i f f i c u l t , e spec ia l ly where there a r e rapid changes i n l i thology and sedimen- t a t i o n pat terns .

LEGEND 0 Shale
Sandy shale a Sandstone
Coal and Bone Cool
FIGURE 26. - Rapid lateral variation in the strata directly above the Pittsburgh coalbed.
Direct ly overlying the main bench (mined por t ion) of the Pi t t sburgh c o a l - bed i s an i n t e r v a l of v a r i a b l e thickness known a s "draw s l a t e " ( f ig . 27). This rock i n t e r v a l has ve ry l i t t l e s t r eng th and commonly f a i l s , r e s u l t i n g i n sudden gas emissions and rock haulage problems. Most miners p r e f e r t o anchor roof b o l t s i n the more competent rock above the draw s l a t e . The minimum b o l t length t h a t would be necessary t o anchor in to competent rock abwe the "draw s l a t e " u n i t i n any area can be determined from isopach maps l i k e f i g u r e 27.

DETERMINATION AND ANALYSIS OF JOINTS AND PHOTOLINEARS
The frequency, charac - t e r , and prominence of j o i n t i n g i n su r f ace rock exposures vary g r e a t l y , depending on b r i t t l e n e s s and on t h e s u s c e p t i b i l i t y o f each rock type t o the com- p re s s iona l and t e n s i o n a l fo rces exer ted on the e a r t h ' s c r u s t . According t o Nickelsen and Hough (E), j o i n t i n g due t o i nc reas ing t e c t o n i c f o r c e s a f f e c t s c o a l f i r s t , then s h a l e and lime- s tone , and l a s t l y sandstone. This i s ev ident from t h e r e l a t i v e spacing of j o i n t s i n the va r ious rock types. Coal c l e a t s g e n e r a l l y have t h e c l o s e s t spacing, f o l - lowed by s h a l e , l imestone, and then sandstone i n which t h e j o i n t s a r e t h e most widely spaced and most prom-. inent . In spec t ion of t h e
LEGEND j o i n t measurements f o r each rock type g ives an o v e r a l l
Mined-out area view of t h e p r i n c i p a l
-6 - Contour interval, 3 f t t rends .
Photo l inears a r e zones of weakness t h a t gene ra l ly
FIGURE 27. - lsopach of "draw slate" above the Pitts- c o r r e l a t e wi th measured j o i n t t r ends and may or may burgh coalbed in the area adjacent to the not be actual fractures
active workings of the Somerset No. 60 observed in the field. In mine. a reas of heavy vege ta t ion o r
few outcrops , or during per iods of bad weather f o r f ie ldwork, pho to l inea r a n a l y s i s i s an a l t e r n a t i v e t o t h e measurement of su r f ace j o i n t s .
The d i r e c t i o n a l t r ends e s t a b l i s h e d by t h e va r ious techniques i n d i c a t e d i r e c t i o n s of i nhe ren t weakness i n a coalbed and t h e rock surrounding it. An a n a l y s i s of the fundamental d i r e c t i o n a l systems i n a v i r g i n a r e a p r i o r t o mine development can provide an e s t ima te of t he c l e a t system i n a coalbed under- ground. This i n t u r n determines t h e most e f f i c i e n t spacing o f d e g a s i f i c a t i o n ho le s f o r maximum gas flow, and t o some e x t e n t , determines the most e f f i c i e n t mine development i n d i r e c t i o n s t h a t can minimize problems such a s r i b s p a l l i n g and water and gas i n f l u x .

Coal i s the rock type most suscept ib le t o the t e c - ton ic forces t h a t produce d i r e c t i o n a l t rends t h a t r e f l e c t s t r u c t u r a l weakness. The f ace and b u t t c l e a t s mea- s u r e d i n c o a l underground a r e the d i r e c t r e s u l t of these t ec ton ic forces and a re d i r e c t l y r e l a t e d t o the regional s t r u c t u r a l t rends. Because of t h e need to e s t i - mate the d i r e c t i o n a l trend of c l e a t underground and the
137 readings total 0 10 e s tab l i shed- re l a t ionsh ip of
Scale of readings c l e a t t o s t r u c t u r e , the c l e a t d a t a a r e used as a standard
FIGURE 28, - Rose diagram of surface io in t trends aga ins t which t o judge the from the New Freeport quadrangle, r e l i a b i l i t y of da ta obtained Pennsylvania, by o ther methods.
Surface J o i n t Determination
Surface j o i n t s were measured over the th i r ty -n ine 7-1/2-minute quadrangle s tudy a rea i n southwestern Pennsylvania and northern West Virg in ia . An aver - age of 120 j o i n t readings were taken per quadrangle with a minimum of 100 readings per quadrangle and no more than 10 readings a t a s i n g l e outcrop. Rock types and q u a l i t y of j o i n t s were noted a t each outcrop. The d i r e c t i o n s were read as azimuths using damped Brunton compasses correc ted f o r magnetic dec l ina t ion . To evalua te the p r inc ipa l d i r e c t i o n a l t rends , the da ta from each quadrangle were p l o t t e d ind iv idua l ly on rose diagrams ( f i g . 2 8 ) . By p l o t t i n g only the dominant t rends from each indiv idual quadrangle on a s i n g l e rose p l o t , a composite rose diagram ( f i g . 29) of su r face j o i n t t rends f o r the s tudy a rea was constructed. J o i n t o r i e n t a t i o n s by t i e r ( f i g . 30) and corresponding counties from north t o south are given i n t a b l e 3 .
Surface J o i n t Analysis
I t was determined from the da ta shown i n f igu re 29 t h a t the re a r e th ree major d i r e c t i o n a l t rends t o the west and four t o the e a s t ( t a b l e 4 ) . The number d i r e c t l y above the d i r e c t i o n a l t rends i n t a b l e 4 gives the order of dominance wi th in the group, based on the number of readings comprising t h e peaks on f i g u r e 29. The assigning of the same order of dominance t o two readings i n the same group ind ica te s equal ly s t rong d i r e c t i o n a l t rends.

TAB
LE
3.
- A
ver
age
su
rfa
ce
jo
int
ori
en
tati
on
s,
by
c
ou
nty
Tie
r I
Co
un
ty
I 1
I 2
I
3
1 4
I
5
I 6
I
7
I 8
( 9
1,
2,
3
4,
5
6 7
8
WES
T N
3
3"
WI
-
1,
2,
3
4,
5 6
7 8
NO
TE
.--N
umbe
red
tre
nd
s a
re a
rra
ng
ed
wit
hin
th
e 2
dir
ec
tio
na
l g
rou
ps
(ea
st
and
we
st)
by
inc
rea
sin
g
div
erg
en
ce
fr
om
no
rth
an
d
no
t b
y
the
ir o
rde
r of
d
om
inan
ce.
Tre
nd
s w
ith
in
the
sam
e v
ert
ica
l co
lum
n
of
a g
rou
p
are
ass
um
ed
co
rre
lati
ve
. D
ire
cti
on
al
da
ta f
rom
th
e i
nd
ivid
ua
l q
ua
dra
ng
les
are
ta
bu
late
d
in a
pp
end
ix B
.
Was
hin
gto
n..
. . .
. . . .
. .
Gre
ene.
.. . .
.. ..
. . . .
..
We
tze
l an
d M
on
on
gal
ia
Mar
ion
an
d M
on
on
gal
ia
Mar
io
n a
nd
H
arr
iso
n. . TA
BLE
4.
- P
rin
cip
al
surf
ac
e
join
t tr
en
ds
in o
rde
r o
f d
om
inan
ce
Was
hin
gto
n ..
....
....
. G
reen
e. ..
....
....
....
W
etze
l an
d
Mo
no
ng
alia
M
ario
n
and
Mo
no
ng
alia
M
ario
n
and
H
arr
iso
n..
N
6"
W
- - N
5
" W
N
7"
W N
-21
" w
N
19
" W
-
N
20"
W
-
N
7"
E N
2'
N
5
" E
N
2"
E
N
5"
E
- E
'N 1
4"
E N
1
3"
E N
1
5"
E N
14
" E
Wes
t I
N 5
7"
W
N 76"
W
Ea
st
111
N
34
" W
-
I
N
15
" E
- I1
N
27"
E -
111
N
37
" E
- IV
N 4
7"
E -

207 readinas total
of read al (5.8)
ings
- Scale of readings
FIGURE 29. - Composite rose diagram of pr incipal surface joint trends.
The pr incipal d i rec t iona l trends l i s t e d i n t ab le 4 can be paired t o form s i x fundamental jo in t systems:
1. *N 57" W' and N 27" E l ' with an 84" separation.
2. *N 57" W' and N 15" E ' with a 72" separation.
3. *N 57" W ' and N 37" E ' ' ' with a 94" separation.
4. *N 76" W' and N 15" E ' with a 91" separation.
5. *N 76" W ' and N 27" E ' ' with a 103" separation.
6. *N 34" W" ' and N 47" E l V with an 81" separation.
The superscr ip ts i n Roman numerals indicate the order of dominance, and the as te r i sks indicate the most dominant trend of each system. Two surface jo in t systems (Nos. 2 and 4) are composed of jo in t s e t s of the f i r s t order of dominance. Both systems are composed of the N 15" E ' s e t . System 4 , with a 91" separation, more c lose ly approaches the i dea l fundamental system's 90" separation than does system 2 with a 72" separation. System 4 (*N 76" W ' - N 15" E ' ) i s qui te s imi lar i n or ienta t ion t o the *N 76" W' - N 17" E ' c l e a t system established underground. The *N 76" W' s e t of system 4 i s the most dominant s e t of system 4 and pa r a l l e l s the face c l e a t . The N 76' W' s e t could a l so be paired with the N 27" E" s e t (system 5 ) , but the separation of 103"

/09 #
- ,d' GREENE COUNTY
I
I I
WETZEL COUNTY
Eos Glodesville
65 5 0 1 V
New Freeport Hoibrook
Glover Gap //5
I r'
HARRISON COUNTY 9 7
Hundred" 156
-
N i s g rea te r and the N 27" E l '
f s e t is l e s s dominant than the N 15" E' s e t .
Oak Forest
Monnlngton 187
MARION
t The N 57" W t s e t , i f not paired with N 15" E' , can be paired with N 27" E l I
(system 1) f o r an 84" seYa- r a t i o n o r with N 37" E f t (system 3) f o r a 94" separa- t ion . S stem 1 (*N 57" W' - Y N 27" Ef ) is reasonably s imi lar t o the *N 67" W' - N 28" E ' c l e a t system es tab- l ished underground. Sys- tem 3 (W 57" W I - N 37" E' I ' ) , while not sub- s t a n t i a l l y d i s s imi la r from the *N 67" W' - N 28" E' c l e a t system, i s , however, composed of one s e t of t h e t h i r d order of dominance. The *N 57" W' s e t of sys- tems 1 and 3 i s the most dominant s e t of the systems and i s reasonably s imi lar t o the face c l e a t o r i en ta t ion .
/37 1
Wadestown / /7
\ --
The most dominant e a s t - ern corn onents (N 15" E' and P N 27" E ' ) c l o s e l y p a r a l l e l the s t r i k e of the major s t r u c t u r a l axes of the area , and the western trend is near ly perpendicular t o the axes. Therefore, the sys- t e m s a re probably d i r e c t l y r e l a t e d t o the regional s t r u c t u r a l deformation. The s i x t h surface j o i n t system (*N 34" W" ' - N 47" E l V ) may a l s o be r e l a t e d to the regional s t r u c t u r e , although it is composed of s e t s of the t h i r d and four th order
/30 Gorords Fort
Gront Town 300
COUNTY
- 143 -Indicates total readings Scale, miles of dominance and not o r i -
FIGURE 30. - Rose diagrams of surface ioints for 39 ented p a r a l l e l t o the c l e a t d i rec t ions . This system is
quadrangles. oriented a t approximately
45" t o the *N 76" W' - N 15" E' system, which is within t h e t h e o r e t i c a l angle of shears t o the dominant t rends .
Mosontown
Blocksv~l le 143
---- \
109
~!ves; l l le /44\
1%
Osoqe /2/
MONONGALIA COUNTY
South 128
I L :
99
Fjorth 108
126 .
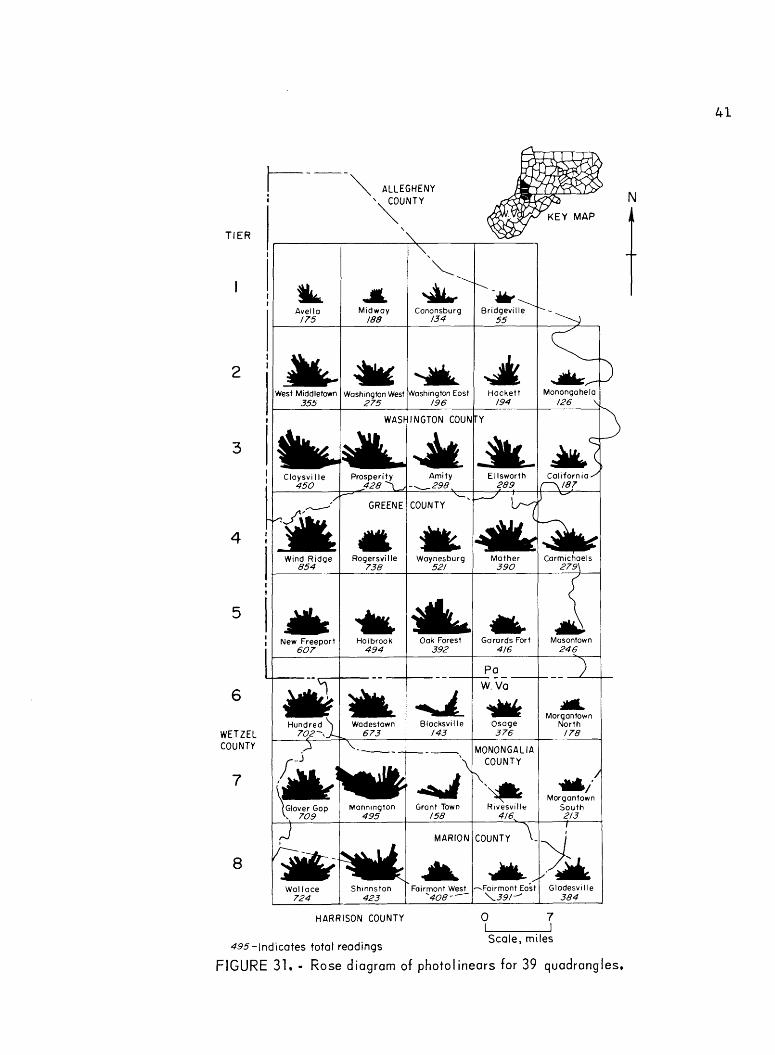
Wol l o c e 724
H A R R I S O N COUNTY 0 7 - Scale, miles
495 -Indicates total readings
FIGURE 31. - Rose diagram of photol inears for 39 quadrangles.
S h ~ n n s t o n 423
- ~ o i r r n o n t West -Fo~rmont ~o;t '408-- \39//
Glodesv i l le 384
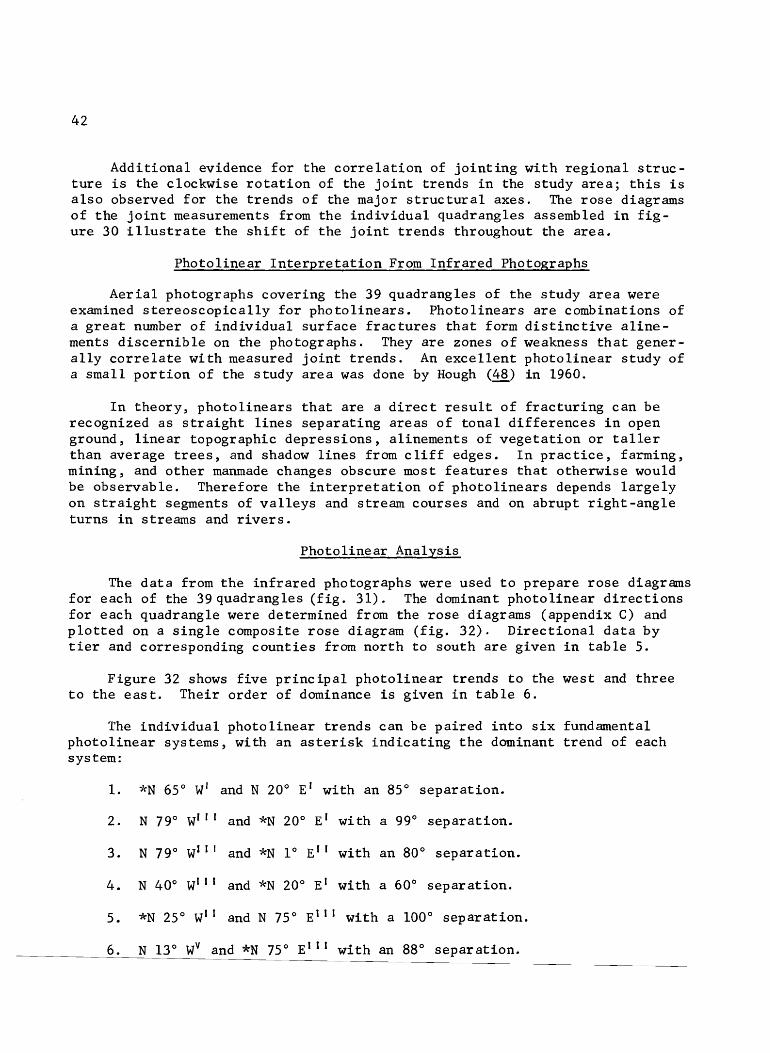
Addi t iona l evidence f o r t he c o r r e l a t i o n of j o i n t i n g w i t h r e g i o n a l s t r u c - t u r e i s the clockwise r o t a t i o n of the j o i n t t r ends i n the s tudy a r e a ; t h i s i s a l s o observed f o r t h e t r ends of t he major s t r u c t u r a l axes . The r o s e diagrams of t h e j o i n t measurements from t h e i n d i v i d u a l quadrangles assembled i n f i g - u r e 30 i l l u s t r a t e t h e s h i f t of t h e j o i n t t r ends throughout t h e a r ea .
Photo l inear I n t e r p r e t a t i o n From I n f r a r e d Photographs
A e r i a l photographs covering t h e 39 quadrangles of t he s tudy a r e a were examined s t e r e o s c o p i c a l l y f o r pho to l inea r s . Pho to l inea r s a r e combinations of a g r e a t number of i nd iv idua l su r f ace f r a c t u r e s t h a t form d i s t i n c t i v e a l i n e - ments d i s c e r n i b l e on the photographs. They a r e zones o f weakness t h a t gener - a l l y c o r r e l a t e w i t h measured j o i n t t r ends . An e x c e l l e n t pho to l inea r s tudy of a smal l p o r t i o n of the s tudy a r e a was done by Hough (48) i n 1960.
I n theory , pho to l inea r s t h a t a r e a d i r e c t r e s u l t o f f r a c t u r i n g can be recognized a s s t r a i g h t l i n e s s epa ra t i ng a r e a s of t o n a l d i f f e r e n c e s i n open ground, l i n e a r topographic dep re s s ions , a l inements of v e g e t a t i o n o r t a l l e r than average t r e e s , and shadow l i n e s from c l i f f edges. I n p r a c t i c e , farming, mining, and o the r manmade changes obscure most f e a t u r e s t h a t o therwise would be observable . Theref o re t h e i n t e r p r e t a t i o n of pho to l inea r s depends l a r g e l y on s t r a i g h t segments of v a l l e y s and s t ream courses and on abrupt r i g h t - a n g l e t u r n s i n s t reams and r i v e r s .
Photo l inear Analysis
The d a t a from t h e i n f r a r e d ~ h o t o g r a p h s were used t o prepare r o s e diagrams f o r each of the 39 quadrangles ( f i g . 31). The dominant pho to l inea r d i r e c t i o n s f o r each quadrangle were determined from the r o s e diagrams (appendix C ) and p l o t t e d on a s i n g l e composite r o s e diagram ( f i g . 32 ) . D i r e c t i o n a l d a t a by t i e r and corresponding coun t i e s from n o r t h t o south a r e g iven i n t a b l e 5.
F igu re 32 shows f i v e p r i n c i p a l pho to l inea r t rends t o t he west and t h r e e t o t h e e a s t . The i r o rde r of dominance i s given i n t a b l e 6 .
The i n d i v i d u a l photo l i n e a r t r ends can be pa i r ed i n t o s i x fundamental pho to l inea r systems, with an a s t e r i s k i n d i c a t i n g t h e dominant t r end of each system:
1. *N 65" W' and N 20" E ' wi th an 85" s epa ra t i on .
2. N 79" W" ' and *N 20" E ' w i th a 99" s epa ra t i on .
3. N 79" W' ' and *N 1" E ' ' wi th an 80" s epa ra t i on .
4. N 40" w"' and *N 20" E' wi th a 60" s epa ra t i on .
5. *N 25" W' and N 75" El1 wi th a 100" s epa ra t i on .
6. N 13" W" and *N 75" E' ' w i t h an 88" s epa ra t i on .

TABLE
5
. -
Av
erag
e p
ho
toli
ne
ar
ori
en
tati
on
s,
by
co
un
ty
Tie
r 1
Co
un
ty
1 1
I 2
I
3
I 4
I
5
I 6
I
7
I 8
T.
rn C
T
WL
IU
J.
NO
TE.
--N
umbe
red
tre
nd
s
are
arr
an
ge
d w
ith
in
the
2
dir
ec
tio
na
l g
rou
ps
(ea
st
and w
est
) by
inc
rea
sin
g
div
erg
en
ce
fr
om
no
rth
an
d
no
t by
the
ir o
rde
r o
f d
om
inan
ce.
Tre
nd
s w
ith
in t
he
sam
e v
ert
ica
l co
lum
n o
f a
gro
up
a
re a
ssu
med
c
orr
ela
tiv
e.
TAB
LE
6.
- P
rin
cip
al
ph
oto
lin
ea
r tr
en
ds
in o
rde
r o
f d
om
inan
ce
- E
AS
T
N 5
2"
W
N 5
4"
W
N 5
1"
W
- N
52
" W
N 3
9"
W
N 4
1"
W
N 4
4"
W
N 4
3"
W
N 4
3"
W
N 6
3"
E N
62
" E
- - N
63
" E
N 3
0"
W
- N
29"
W
N 3
0"
W
N 3
5"
W
N 6
6"
W
N 6
5"
W
N 6
5"
W
N 6
1"
W
N 6
9"
W
N 21"
W
N2
4"
W
N 1
8"
W
- N
23"
W
N 3
7"
E N
31
" E
N 3
2"
E N
37
" E
N 3
8"
E
N 7
8"
E N
75"
E N
72"
E N
69
" E
-
N 1
9"
E N
20"
E N
24"
E N
25"
E N
24"
E
Wes
t
N 8
5"
W
N 76"
W
N 74"
W
N 8
0"
W
N 79"
W
1,
2,
3
4,
5
6 7
8
N 5
1"
E N
44
" E
N 5
4"
E -
N 5
0"
E
- N
89
" E
N 8
8"
E -
N 8
4"
E
N 1
3"
E -
N 1
5"
E N
15
" E
N 1
6"
E
Ea
st
N 3
" W
N
3"
W
N 4
" W
N
4"
W
N 3
" W
....
....
..
Wash
ing
ton
..
Gre
ene ..
....
....
....
..
Wetz
el
and
Mo
no
ng
alia
. M
ario
n
and
Mo
no
ng
alia
. . M
ario
n
and
Ha
rris
on
..
N 4
" E
N 5
" E
N 2"
E
N 3
" E
-
1,
2,
3
4,
5
6 7
8
v - N
13
" W
I - N
20"
E
I - N
65
" W
N 1
2"
W
N1
4"
W
- N
11
" W
N
13
" W
Wash
ing
ton
.. ..
....
....
G
reen
e..
....
....
....
..
Wetz
el
and M
on
on
gal
ia.
Mar
ion
an
d
Mo
no
ng
alia
. . M
ario
n
and
Ha
rris
on
..
I1 -
N 1
" E
I1 -
N 25"
W
I1 I
- N
75"
E
111
N 79"
W
N 4
0"
W

FIGURE 32. - Composite rose diagram of principal photolinear trends for entire area.
The f i r s t i n f r a r e d photo l inear system (*N 65" W' - N 20" El) i s composed of t he most dominant wes t e r ly s e t and t h e most dominant e a s t e r l y s e t . This system b e s t e s t ima te s the e s t ab l i shed *N 67" W' - N 28" Er c o a l c l e a t system. The *N 65" W' s e t i s t h e most dominant of t h e system and i t n e a r l y p a r a l l e l s t h e f a c e c l e a t . The N 20" E! s e t , i f no t pa i red wi th N 65" w', could be pa i red wi th an N 79" w"[ (system 2) which i s s i m i l a r t o t h e *N 76" W' - N 17" E' c l e a t system. Photo l inear system 2 , however, con ta ins one s e t of t h e t h i r d o rde r and has a l a r g e r divergence from 90" than system 1. The N 79" W" I s e t can a l s o be pa i r ed wi th N 1" ' s stem 3 ) f o r an 80" separa- ' Y t i o n . This system, while having one s e t (*N 1" E' ) which d iverges 16" from t h e b u t t c l e a t o f t h e *N 76" W' - N 17" E' c l e a t system, has one s e t (N 79" W' ") which d iverges only 3" from the f a c e c l e a t . System 3 , however, i s composed of one s e t of t h i r d order dominance, and more s i g n i f i c a n t l y , t h e most dominant s e t of t h e system (*N 1" El*) i s i n t h e b u t t c l e a t d i r e c t i o n . The f o u r t h , f i f t h , and s i x t h pho to l inea r systems a r e each composed of one component of t h i r d o r lower o rde r of dominance and have no s i m i l a r i t y t o t h e e s t a b l i s h e d c l e a t systems.
Ronchi In spec t ion of Photoindex Sheets and Analysis of Trends
Th i r t een photoindex s h e e t s covering t h e s tudy a r e a were inspec ted f o r pho to l inea r s using a Ronchi-type d e f r a c t i o n g ra t ing . The s c a l e of t h e index s h e e t s i s 1 inch t o 1 mi le ; hence only gene ra l t rends can be d i f f e r e n t i a t e d , n o t s p e c i f i c l i n e a r s . This method was inves t iga t ed t o determine i t s

r e l i a b i l i t y a s a r e l a t i v e l y inexpensive, r ap id reconnaissance procedure f o r d e l i n e a t i n g s t r u c t u r a l weakness.
P r i n c i p a l d i r e c t i o n a l t r ends a s i n t e r p r e t e d from t h e 13 i n d i v i d u a l index s h e e t s of t h e a r e a were p l o t t e d on a composite r o s e diagram ( f i g . 33) . The i n d i v i d u a l t r ends e s t a b l i s h e d f o r each of t h e 13 s h e e t s a r e presen ted i n appendix D. D i r e c t i o n a l d a t a by county from no r th t o south a r e g iven i n t a b l e 7.
TABLE 7. - Average photoindex s h e e t l i n e a r o r i e n t a t i o n s , by county
EAST
County I 1 1 2 I 3 I 4 WEST
.......... Washington.. Greene ................
.......... Monongalia.. Marion.. ..............
NOTE.--Numbered t r ends a r e arranged w i t h i n t h e 2 d i r e c - t i o n a l groups ( e a s t and west) by i nc reas ing d i v e r - gence from no r th , no t by order of dominance. Trends w i t h i n t h e same v e r t i c a l column of a group a r e assumed t o be c o r r e l a t i v e .
Washington. ........... Greene ................ Monongalia. ........... Marion ................
The r o s e diagram ( f i g . 33) shows fou r d i r e c t i o n a l t rends t o the west and fou r t o t h e e a s t . Although the o rde r of dominance of t h e d i r e c t i o n a l t r ends does not s tand ou t c l e a r l y i n f i g u r e 33, i t was e s t a b l i s h e d ( t a b l e 8) f o r t h e d a t a based on t h e s t r e n g t h of t h e image of t h e d i r e c t i o n a l t r ends viewed through the Ronchi g r a t i n g .
TABLE 8 . - P r i n c i p a l photoindex t rends i n order of dominance
N 70" W N 69" W N 70" W N 73" W
N 10" W N 8" W N 8" W N 8" W
N 19" E N 11" E N 8" E
I N 6" E
The p r i n c i p a l d i r e c t i o n a l t r ends de l inea t ed by t h e Ronchi g r a t i n g can be pa i r ed i n t o f i v e fundamental systems, with t he s u p e r s c r i p t s aga in i n d i c a t i n g t h e o rde r of dominance and an a s t e r i s k t h e most dominant t rend of each system.
N 24" W N 23" W N 22" W N 24" W
N 30" E N 25" E N 23" E N 20" E
1. *N 70" w1 and N 27" E' w i th a 97" s epa ra t i on .
N 45" W N 42" W N 43" W N 43" W
West
2. *N 70" W' and N 12" E~ ' with an 82" s epa ra t i on .
N 51" E N 56" E N 58" E N 58" E
Eas t I
N 70" W
3. N 23" W" ' and *N 77" E I wi th a 100" s epa ra t i on .
N 73" E N 79" E N 80" E N 78" E
I N 77" E
I1 N 44" W
I1 N 77" E
I11 N 23" W
I V N 9" W
I11 N 12" E
I V N 55" E

104 readings total Scale of readings
FIGURE 33. - Composite rose diagram of pr inc ipa l Ronchi trends for ent i re area.
4. *N 44" W" and N 55" E f V with a 99" s epa ra t i on .
5. N 9" w i V and *N 77" E" wi th an 86" sepa ra t i on .
The p a i r i n g of t he most dominant wes t e r ly t r e n d , *N 70" W' wi th e i t h e r N 27" E ' , t he most dominant e a s t e r l y t r end , o r N 12" E"' c l o s e l y approximates the dominant t rend of s t r u c t u r a l weakness as prev ious ly i nd i ca t ed from t h e a n a l y s i s of c l e a t , s u r f a c e j o i n t , and pho to l inea r o r i e n t a t i o n s . The *N 70" W' i s t he most dominant t rend of t h e f i r s t system and c o r r e l a t e s with t he f a c e c l e a t . The components of the l e s s dominant systems 3 , 4 , and 5 appear t o be r e l a t e d t o shea r s t o t h e p r i n c i p a l direcLiuzia1 trer~ds.
A r o t a t i o n of d i r e c t i o n a l t r e n d s , s i m i l a r t o t h a t observed f o r t h e c l e a t and s u r f a c e j o i n t t r e n d s , i s apparent i n a p o r t i o n of t h e Ronchi der ived d a t a . The two t r e n d s a t N 27" E1 and N 12" E" ' on t h e composite r o s e diagram ( f i g . 33) appear t o be p a r t s of a weak bimodal peak. A review of the a c t u a l d a t a f o r t he se two t r e n d s (appendix D , Nos. 1 and 3 e a s t ) shows t h a t they a r e indeed two d i s t i n c t t r ends w i th an e a s t e r l y s h i f t of the county d i r e c t i o n a l means of 10" and 13O, r e s p e c t i v e l y , from south t o nor th .

C r i t e r i a f o r C l e a t Es t ima t i on
The a n a l y s i s of d i r e c t i o n a l d a t a y i e l d e d t r e n d s t h a t cou ld be p a i r e d i n t o v a r i o u s combinations of fundamental systems ( t a b l e 9 ) . Two s u r f a c e j o i n t s y s - tems ( 1 and 4) c o r r e l a t e d b e s t w i t h t h e e s t a b l i s h e d c l e a t systems. These two systems a r e composed of t r ends of t he f i r s t and second o r d e r of dominance. Systems 2 , 3 , and 5 a r e composed of s e t s a l r e a d y p a i r e d i n systems 1 and 4 , and system 6 i s composed of t r e n d s of t h i r d and f o u r t h o r d e r s of dominance and i s n o t s i m i l a r t o t h e c l e a t o r i e n t a t i o n s . One i n f r a r e d p h o t o l i n e a r system (1) c o r r e l a t e d w i t h a c l e a t system and was composed of t r e n d s o f t h e f i r s t o rde r of dominance. An a d d i t i o n a l system (3) was reasonably c o r r e l a t i v e w i th t he remaining c l e a t system, b u t was composed of second- and t h i r d - o r d e r t r e n d s . The second p h o t o l i n e a r system i s composed o f t r e n d s a l r e a d y used i n systems 1 and 3. Systems 4-6 a r e n o t c o r r e l a t i v e wi th a c l e a t system and a r e composed of a t l e a s t one t r end of t h i r d o r lower o r d e r of dominance. One photoindex p h o t o l i n e a r system (1) c o r r e l a t e d wi th a c l e a t system and was composed of t r e n d s of t h e f i r s t o rde r of dominance, Even though system 2 would c o r r e l a t e w i t h a c l e a t system, i t i s composed of one t r e n d a l r e a d y used i n system 1 and one t r e n d of t h e t h i r d o rde r of dominance. Systems 3-5 a r e n o t c o r r e l a t i v e w i t h a c l e a t system and a r e composed of a t l e a s t one t r e n d of t h i r d o r lower o r d e r of dominance. I n each c a s e where a d i r e c t i o n a l d a t a system c o r r e l a t e d w i t h a c l e a t system and was composed of t r e n d s of t h e f i r s t o r second o r d e r of dominance, t h e most dominant t r end c o r r e l a t e d w i t h t h e f a c e c l e a t ,
TABLE 9. - Fundamental systems from d i r e c t i o n a l d a t a
P h o t o l i n e a r s ( i n f r a r e d photographs) .
NOTE. - -Supe r sc r i p t s i n d i c a t e t h e o rde r of dominance w i t h i n t h e d i r e c t i o n a l group ( e a s t o r wes t ) f o r each d a t a s o u r c e , and an a s t e r i s k i n d i c a t e s t h e dominant t r e n d of each system.
Data sou rce
C l e a t ........................... Sur f ace j o i n t s ..................
P h o t o l i n e a r s (photoindex s h e e t s )
System
*N 67" W' N 28" E l J:N 76" W' N 17" El *N57"W1 N 27" E E t *N57"Wr N 15" E ' *N57"W1 N 37" E n ' >kN 76" W' N 15" E1 *N 76" W E N 27" E" * N 3 4 " W r E ' N 4 7 " E " *N65"WB N 20" El
N 79" W' ' *N 20" E' N 790 i ' :~ 10 N 40" W * I ' *N 20" E f
q q 2 5 " w t f ~ 7 5 " ~ " " N 13" WV i ' : ~ 750 E! 1 "
*N 70" W' N 27" EB *N 70" W' N 12" E E D D
N 23" w"' *N 77" E" *N 44" w" N 55" E r V
N go w i V +CN 770 E"
System No. 1 2 1 2 3 4 5 6 1 2 3 4 5 6 1 2 3 4 5
Degrees of s e p a r a t i o n
95 93 84 72 94 9 1
103 8 1 85 99 80 60
100 88 97 82
100 99 86

The procedure proposed f o r t h e es t imat ion of c l e a t o r i e n t a t i o n i s based on t h e r e s u l t s of the d i r e c t i o n a l d a t a ana lys i s summarized above. The p a i r i n g of t h e e s t ab l i shed s e t s i n t o a l l reasonable combinations of fundamental sys - tems i s of primary importance i n ana lys i s of each type of d i r e c t i o n a l da t a . Which system or systems a r e t o be used t o es t imate t h e c l e a t o r i e n t a t i o n i s based on the r e l a t i v e dominance of the s e t s of each system as determined by the number of readings comprising the corresponding peaks on rose diagrams. A system composed of the most dominant s e t and a perpendicular s e t of t h e f i r s t o r second order of dominance w i l l most l i k e l y g ive the b e s t es t imat ion of c l e a t o r i e n t a t i o n . The most dominant s e t of t h e se l ec t ed system i s most l i k e l y t h e f ace c l e a t d i r e c t i o n .
C lea t systems of s i m i l a r , bu t d i f f e r e n t o r i e n t a t i o n may be present . Here, two reg iona l fundamental j o i n t systems were i n f a c t composed of s e t s of t h e requi red orders of dominance, and c o r r e l a t e d wi th the observed c l e a t systems. I n the ana lys i s of l i n e a r s from in f ra red photographs and l i n e a r s on photoindex s h e e t s , one system s a t i s f i e d the dominancy requirements and was c o r r e l a t i v e wi th one c l e a t system, and o the r systems were reasonably c o r r e l a t i v e with the remaining c l e a t system. But these o ther systems would be r e j e c t e d because one component lacks t h e necessary r e l a t i v e dominance. The r e j e c t i o n of an e s t i - mator f o r t he second c l e a t system is not de t r imenta l a s t h e two c l e a t systems a re separa ted by only about 10". I n a l l ca ses the d i r e c t i o n a l systems no t c o r r e l a t i v e with e s t ab l i shed c l e a t systems were r e j e c t e d because they did not meet t he dominance requirements,
Rela t i onsh ip of C lea t t o Surface J o i n t s and Photo l inears Overlying Ind iv idua l Mines
The r e l a t i o n s h i p between coa l c l e a t s measured i n ind iv idua l mines and the d i r e c t i o n a l t rends e s t ab l i shed by measuring j o i n t s and pho to l inea r s d i r e c t l y overlying t h e mines was inves t iga t ed u t i l i z i n g t h e c r i t e r i a e s t ab l i shed i n the r eg iona l ana lys i s . The most dominant d i r e c t i o n a l systems measured with t h e degrees of dev ia t ion from t h e c l e a t d i r e c t i o n s a re l i s t e d i n t a b l e 10. An a s t e r i s k i n d i c a t e s the most dominant t rend of each system. A s with the r eg iona l d a t a , su r face j o i n t s provided the b e s t es t imat ion of c l e a t o r i e n t a - t i on . The most dominant su r face j o i n t system averaged wi th in '7.4" of t h e f ace c l e a t and '6.6" of t he b u t t c l e a t . I t was poss ib l e t o c o r r e c t l y p r e d i c t t h e f ace c l e a t d i r e c t i o n f o r 14 of t he 18 mines using t h e su r face j o i n t da t a . The photo l inear d a t a were considerably l e s s r e l i a b l e , with averages of '23,7" f o r t h e f ace c l e a t and k19.4" f o r t he b u t t c l e a t . The f a c e c l e a t d i r e c t i o n was c o r r e c t l y predic ted i n only 7 of the 18 mines.
The high degree of divergence observed f o r the photo l inear ana lys i s i s p r imar i ly t h e r e s u l t of a dominant wes te r ly photo l inear t r end i n t h e v i c i n i t y of N 15"-30" W. This i s s i m i l a r t o the second most dominant *N 25" W" t r end observed on the photo l inear composite rose diagram ( f i g . 32) , and t h e N 34" w"' t rend on the sur face j o i n t composite rose diagram ( f i g . 31). I n seve ra l ca ses the second most dominant l o c a l photo l inear system above t h e mine had an o r i e n t a t i o n s i m i l a r t o t h a t of t h e c l e a t .

TABL
E 1
0 . . C
oal
cle
at.
d
om
inan
t su
rfa
ce
jo
int.
an
d p
ho
toli
ne
ar
ori
en
tati
on
s o
f th
e s
tud
y a
rea
No .
1
2
3
4 5 6 7
8 9
10
11
12
1
3
14
15
1
6
17
18
-
Min
e
....
....
....
..
Mon
tour
4
M
ath
ies ..
....
....
....
..
Wes
tlan
d ..
....
....
....
. .
So
mer
set
No
60 ..
....
..
Ves
ta N
o .
5 ..
....
....
..
. M
aria
nn
a No
5
8 ..
....
..
Gat
eway
....
....
....
....
S
han
no
pin
....
....
....
..
. H
umph
rey
No
7 ..
....
...
. P
urs
glo
ve
No
15
....
...
. B
lac
ksv
ille
No
1 ..
....
.
Bla
ck
svil
le N
o 2
....
..
....
....
....
O
sage
No .
3 A
rkw
rig
ht .
....
....
....
. .
Fe
de
ral
No
2 ..
....
....
.
Co
nso
l No
93
....
....
..
....
....
....
..
Lo
ver
idg
e .
Co
nso
l No
20
....
....
..
Av
erag
e d
iver
gen
ce ..
...
Fac
e c
lea
t
*N
65"
W
*N
65"
W
*N
70"
W
~'cN
62"
W
*N
66"
W
*N
68"
W
*N
68"
W
7'cN
73
" w
YcN
70
" W
7k
N
72"
W
7kN
75
" W
;k
N
77"
W
;kN
75
" W
*N
79
" W
;'cN
77
" W
*N
73
" W
fc
N
80"
W
*N
78"
W
-
Bu
tt
cle
at
N
25"
E N
27
" E
N
25"
E N
30
" E
N
30"
E N
28
" E
N
28"
E N
18
O
E N
27
" E
N
19"
E N
20"
E N
17
" E
N 1
7"
E N
12
" E
N 17
" E
N
18"
E N
15
" E
N
12
" E
-
Su
rfac
e jo
ints
N
55"
W
*N
60"
W
fcN
73
" W
>
kN 65
" W
fc
N
76"
W
9cN
72
" W
fc
N
78"
W
i'cN
80
" W
7k
N
80"
W
7kN
78
" W
~
cN
66"
W
N
65O
W
N
8
2"
W
;kN
76
" W
;'cN
68
" W
N
80
" W
;k
N
75"
W
;?N
91"
W
-
Deg
rees
of
*N
37"
E
N
27"
E N
23
" E
N
27"
E N
14
" E
N
12
" E
N
13"
E N
23
" E
N
20"
E N
17
" E
N
27"
E *N
13
" E
N
17"
E N
19"
E N
28
" E
;'cN
17
" E
N
17"
E N
3
" E
-
Wes
t 1
0
5 3
3
10
4
10
7
10
6
9
12 7 3 9 7
5
13
7
.4
div
erg
en
ce
. E
ast
12
0
2
3
16
16
15
5
7
2 7
4 0 7
11
1
2 9 6.6
Ph
oto
lin
ea
rs
Insu
ffic
ien
t d
ata
fc
N
66"
WI
N
17"
E In
de
term
ina
te
Deg
rees
of
N
6"W
N
5
3"
W
N
70"
W
N
18"
W
N 26
" W
N
27
" W
N
28
"W
Y
cN68
" W
Y
cN
66"
W
N
51
" W
f:N
66"
W
fcN
75
" W
*
N5
7"W
*N
53
" W
-
div
erp
ence
W
est -
1 -
13
2
5
0
47
43
7
11
24
11 2
25
23
.7
N8
2O
E5
6
*N
27"
E *N
22
" E
N
75"
E N
71
" E
N
5
5"
E N
54
OE
44
N
24
" E
N
17"
E N
34
" E
N5
9"
W*
N2
7"
E2
0
N
25"
E
N
21"
E N
22
OE
23
N
32"
E -
Ea
st
- 1
0 -
52
3
6
47
53
28
35
4 0
19
15
8
3
7
20
19
.4

Analysis of d i r e c t i o n a l d a t a f o r a l imi ted area i s hampered by problems not normally encountered i n a r eg iona l approach. Surface j o i n t measurements a r e l imi t ed by the number and l o c a t i o n of outcrops i n the a rea of i n t e r e s t and a t t imes by weather condi t ions . A s outcrops become l e s s numerous and f a r t h e r from the a rea , the v a l i d i t y of t h e ana lys i s decreases. Under these cond i t ions , pho to in te rp re t a t ion would perhaps be of b e n e f i t s ince it does not r e l y on o u t - crops f o r d a t a , nor does i t depend on the weather. However, photoanalys is , which depends on t h e a v a i l a b i l i t y of q u a l i t y photographs and an experienced pho to in te rp re t e r , i s s i g n i f i c a n t l y l e s s r e l i a b l e than f i e l d measurements o f j o i n t s . Both methods a r e l imi ted by the small number of d i r e c t i o n a l measure- ments usua l ly obta inable f o r a small area. The fewer the d a t a , t he l e s s l i k e l y a r e ind iv idua l t rends t o s tand out c l e a r l y , and t h i s makes ana lys i s d i f f i c u l t .
Summary of D i rec t iona l Data Analysis
The e s t ima t ion of r eg iona l underground c l e a t systems i n c o a l by su r face j o i n t and photo l inear ana lys i s and Ronchi inspec t ion i s r e l i a b l e wi th in t h e e s t a b l i s h e d l i m i t s . The confidence l e v e l i s l e a s t f o r Ronchi inspec t ion r e s u l t s because the order of dominance of Ronchi t rends i s based l a rge ly on a v i s u a l impression of image "s t rength ." Surface j o i n t ana lys i s i s the only technique considered s u f f i c i e n t l y r e l i a b l e t o be used on a l o c a l bas is .
RELATIVE COSTS OF CLEAT ESTIMATION BY THE THREE METHODS OF ANALYSIS OF SURFACE DIRECTIONAL DATA
The r e l a t i v e c o s t s and time requirements f o r t h e th ree a n a l y t i c a l proce- dures a r e discussed below.
F i e ld Mapping
The mapping of su r face j o i n t s r equ i re s approximately 2 days of f ie ldwork per 7 -112 -minute quadrangle by an experienced two-man team. An a d d i t i o n a l day i s requi red f o r t abu la t ion and ana lys i s of da ta . Sa lary or consul t ing f e e and f i e l d expenses f o r such a two-man team would amount t o approximately $650 per 7-112 -minute quadrangle. An a rea of 39 quadrangles, l i k e the one inves t iga t ed i n t h i s r e p o r t , would r e q u i r e 33 weeks t o eva lua te ( t a b l e 11) f o r a t o t a l c o s t of $25,350.
TABLE 11. - Time and c o s t requirements f o r measuring jo in t s and photo l inears f o r t he study a rea
Time, weeks 33
39
1
Me t h od F ie ld measurement of sur face j o i n t s ... Measuring l i n e a r s from in f ra red
photographs .......................... Measuring l i n e a r s from photoindex
shee ts . . .............................
Cost $25,350
25,460
625

In f ra red Photography Analysis
I n t e r p r e t a t i o n of i n f r a r e d photographs r equ i re s approximately 1 week per 7-112-minute quadrangle f o r d e l i n e a t i o n and ana lys i s of d i r e c t i o n a l t r ends . Cost i n t h i s case would include $110 f o r i n f r a r e d photo coverage and t h e s a l - a r y or consul t ing f e e of an experienced pho to in te rp re t e r and would t o t a l approximately $650 per quadrangle. Photol inear i n t e r p r e t a t i o n of a 39- quadrangle a r e a would take 39 weeks and would c o s t $25,460.
Ronchi Inspec t i o n of Photo l i n e a r Sheets
A s a l ready noted, c l e a t e s t ima t ion by Ronchi i n spec t ion of photoindex s h e e t s i s somewhat l e s s r e l i a b l e than t h e two o ther methods, but i t i s f a r l e s s expensive and time consuming. The t o t a l c o s t per 7 -112 -minute quadrangle i s about $15. This i s e s s e n t i a l l y the s a l a r y or consul t ing f e e of a g e o l o g i s t , s i n c e c o s t of t he photoindex s h e e t coverage f o r t h e whole 39-quadrangle a r e a was only $40. An 8-quadrangle a rea could be evaluated i n 1 day and t h e e n t i r e 39 quadrangles i n 1 week. Cost of t he 1-week eva lua t ion would be only $625.
Ronchi inspec t ion i s e s p e c i a l l y a t t r a c t i v e because t h i s r a p i d and inex- pensive reconnaissance technique can provide a good i n i t i a l es t imate of t he c l e a t underground f o r subsequent checking by one of the two o the r methods. I n an a rea of unknown c l e a t o r i e n t a t i o n , a combination of two or perhaps a l l t h r e e of the methods would be advantageous i n t h a t i t would g r e a t l y increase t h e confidence l e v e l of t he r e s u l t s .
SUMMARY
The P i t t sbu rgh coalbed is one of t h e l a r g e s t p o t e n t i a l f u e l resources i n the world with r e spec t t o t o t a l tonnage of coa l and t h e assoc ia ted gas r e se rves . To a i d i n the e f f i c i e n t u t i l i z a t i o n of t h i s depos i t , a s tudy was made of t he southwestern Pennsylvania and nor ther West V i rg in i a a rea which i t under l i e s . The primary ob jec t ive was t o i d e n t i f y geologic f a c t o r s t h a t i n t e r - f e r e wi th e f f i c i e n t mining and e s p e c i a l l y those f a c t o r s t h a t in£ luence gas migra t ion i n t h e coalbed.
For t h i s purpose, a map was prepared of a l l known sandstone bodies t h a t i n t e r s e c t the coalbed. A c o r r e l a t i o n was found between a reas of t h i cke r sand- s tone and t h e occurrence of sandstone channels c u t t i n g i n t o t h e coa l . Predic- t i o n of sandstone channel t rends i s commonly hindered by the l ack of s u f f i - c i e n t subsurface da ta . Core d r i l l i n g on the usua l mi le c e n t e r s may e n t i r e l y m i s s some of t h e s inuous, narrow sandstone channels .
Clay ve ins were found and mapped i n e i g h t of t he mines surveyed and tend t o be c l u s t e r e d along t h e axes of syncl ines . Clay ve ins have been observed more f r equen t ly near channel sandstone bodies . Clay ve ins tend t o i n t e r s e c t , forming boxlike c e l l s t h a t prevent gas migrat ion. A ho le d r i l l e d through two c l a y ve ins had pressures of 220 and 263 lb / in? on t h e v i r g i n s i d e and 0 lb / ina on t h e mined s i d e (41). X-ray d i f f r a c t i o n ana lys i s of c l a y v e i n m a t e r i a l and roof and f l o o r rock i n d i c a t e s t h a t i n t h e mines inves t iga t ed t h e c l a y m a t e r i a l was i n j e c t e d a f t e r c o a l i f i c a t i o n from the roof and no t from t h e f l o o r .

An isopach map of the P i t t sbu rgh coalbed was cons t ruc ted from more than 3,000 d a t a p o i n t s . Wherever p o s s i b l e , s t r i p mines were loca ted and mapped. The coalbed th ickness t r ends were o r i en ted no r theas t t o southwest, c l o s e l y p a r a l l e l i n g t h e r e g i o n a l s t r u c t u r e . Areas of t h i c k c o a l (8 f e e t p lus) gener- a l l y were located near s y n c l i n a l troughs. Some areas of t h i n c o a l ( l e s s t h a n 4 f e e t ) were loca ted near the axes of t h e a n t i c l i n e s . Several o the r a reas of low o r t h i n c o a l had a sinuous p a t t e r n , suggest ing a poss ib l e r e l a t i o n t o anc ient s t ream systems.
A fence diagram was prepared of t he s t r a t a above the P i t t sbu rgh coalbed. The predominant rock type d i r e c t l y above t h e coalbed i s a "draw s l a t e " com- posed of t h i n l y bedded, dark gray t o b lack , f i s s i l e carbonaceous sha le , c o a l , and sandstone, This uns t ab le u n i t i s gene ra l ly l e s s than 4 f e e t t h i c k but may be a s much a s 12 f e e t t h i ck . I n Monongalia and Marion Counties , t he rock above the draw s l a t e i s usua l ly limestone and sha le . I n Greene County, lime- s tone predominates i n the south and sandstone i n t h e no r th , reaching a maximum th ickness of 80 f e e t . I n Washington County t h e r e i s a preponderance of lime- s tone i n the southwest, sandstone i n t h e south and c e n t e r , and s h a l e i n t h e north.
A c l o s e r e l a t i o n s h i p between overburden th ickness and s t r u c t u r e was e s t a b l i s h e d i n Pennsylvania. I n gene ra l , t h e coalbed was nearer t o the s u r - f ace along the axes of a n t i c l i n e s and deeper along the troughs of syncl ines , The overburden thickness ranged from ze ro a t outcrop along the e a s t e r n edge of the s tudy a r e a t o a maximum of 1,500 f e e t i n western Greene and Monongalia Counties, The r e l a t i o n s h i p was l e s s w e l l developed i n West V i rg in i a .
C lea t surveys were completed i n 18 mines opera t ing i n the P i t t sburgh coalbed. Two s i m i l a r , b u t s l i g h t l y d i f f e r e n t c l e a t system (&N 76" W and N 17" E , *N 67" W and N 28" E) were e s t ab l i shed f o r t he a rea , amounting t o approximately a 10" clockwise r o t a t i o n from south t o nor th . A s l i g h t counter - clockwise r o t a t i o n of 4" t o 7" was de tec ted from e a s t t o west. A s t rong r e l a - t i onsh ip was apparent between the c l e a t o r i e n t a t i o n s and the l o c a l and r eg iona l s t r u c t u r e . Face c l e a t s tended t o be perpendicular t o the a x i a l t r ends of f o l d s , and t h e b u t t c l e a t tended t o be p a r a l l e l t o the a x i a l t rends . The r o t a t i o n observed f o r the c l e a t d i r e c t i o n s i n genera l matches the r o t a t i o n of the s t r u c t u r a l t rends .
The need f o r es t imat ing the c l e a t systems i n a reas of v i r g i n c o a l prompted the measurement and a n a l y s i s of sur face j o i n t s and t h e ana lys i s o f photo l inears from in f ra red photographs and photoindex shee t s . Although a l l t h ree techniques provide r e l i a b l e r eg iona l es t imates of the c l e a t systems, su r face j o i n t s provide the b e s t e s t ima te , e s p e c i a l l y on a l o c a l b a s i s . Ronchi i n spec t ion of photoindex shee t s i s t h e f a s t e s t and cheapest method, but t h e l e v e l of confidence i s b e t t e r f o r t he two o the r techniques.
This r e p o r t i s a s tudy of a l a rge a rea and t h e problems t h a t may be encountered i n mining c o a l . The problems t h a t can occur were noted, and pos - s i b l e s o l u t i o n s and methods of d e t e c t i o n of the t roub le a reas a re of fered . The p r o j e c t was implemented because a number of s t u d i e s had been conducted on ind iv idua l mines i n the area and on ind iv idua l quadrangles and s e l e c t e d a r e a s ,

b u t no o v e r a l l geo logic s tudy of t h i s important coalbed had been at tempted. Eighteen c o a l mines were s tud i ed underground, 39 quadrangles were mapped f o r s u r f a c e j o i n t s and pho to l inea r s , and more than 3,000 co re log d e s c r i p t i o n s were c o l l e c t e d .
I t i s hoped t h a t t he r e s u l t s p resen ted i n t h i s r e p o r t can s e rve a s a framework f o r f u t u r e mine planning and ope ra t i ons i n t h e P i t t s b u r g h coalbed. More d e t a i l e d geologic s t u d i e s dea l ing wi th s p e c i f i c problems of i n d i v i d u a l mines can be conducted a s ou t l i ned by McCulloch and Deul (74). Because t h e methodology developed i n t h i s s tudy can be appl ied t o o ther a r e a s , e s p e c i a l l y where t h e r e w i l l be more underground c o a l mining, t h i s approach i s recommended f o r cons ide ra t i on by t h e mining g e o l o g i s t s and engineers r e spons ib l e f o r mine p l a m i n g .

BIBLIOGRAPHY OF PREVIOUS WORK I N THE PITTSBURGH COALBED
A r k l e , T. , Jr. Monongahela S e r i e s , Pennsy lvan ian Sys t e m , and Washington and Green S e r i e s , Permian System, of t h e Appalachian Basin . Guidebook S e r i e s of t h e Geol . Soc. of America, P i t t s b u r g h Meeting, 1959, pp. 117-138.
Arnd t , H. H . , P. A v e r i t t , J . Dowd, D. H. F r a n d z e l , and P. A. G a l l o . Minera l Resources of t h e Appalachian Region. U. S. Geol. Survey P r o f . Paper 580, 1968, pp. 111, 102-120.
Ashley, G. H. The Maximum Rate of D e p o s i t i o n o f Coal . Econ. Geol . , v. 2 , January and February 1907.
. The Monongahela S e r i e s i n Pennsylvania . Proc. W. Va. Acad. of S c i . , v . 3 , 1929, pp. 147-158.
. P r o d u c t i o n and Reserves of t h e P i t t s b u r g h Coalbed. Trans. AIME, v . 130, 1938, pp. 56-64.
Barlow, J. Geology o f Fairmont E a s t 7.5 Minute Quadrangle. M.S. T h e s i s , W. Va. Univ. , Morgantown, W. Va., 1965, 43 pp.
Beck, M. E . , Jr. , and R . E . Mat t i ck . I n t e r p r e t a t i o n of an Aeromagnetic Survey i n Western Pennsy lvan ia and P a r t s of E a s t e r n Ohio, Nor thern West V i r g i n i a , and Western Maryland. Pa. Geol. Survey I C 52 , 1964, 10 pp.
B e r r y h i l l , H. L . , Jr. Geology and Coal Resourses of Belmont County, Ohio. U.S. Geol. Survey P r o f . Paper 380, 1963, 113 pp.
. Geology of t h e Amity Quadrangle , Pa. U. S. Geol. Survey Geology Quad. Map GQ 296, 1964.
B e r r y h i l l , H. L. , Jr . , and S. P. Schweinfur th . Geologic Map of t h e E l l s w o r t h Quadrang le , Pa. U. S. Geol. Survey Geol. Quad. Map GQ 333, 1964.
B e r r y h i l l , H. L . , Jr . , S. P. Schweinfur th , and B. H. Kent. Coal-Bear ing Upper Pennsylvanian and Lower Permian Rocks, Washington Area, Pa. U.S. Geol. Survey P r o f . Paper 621, 1971, 47 pp.
B e r r y h i l l , H. L . , J r . , and V . E . Swanson. Revised S t r a t i g r a p h i c Nomen- c l a t u r e From Upper Pennsylvanian and Lower Permian Rocks, Washington County, Pa. U.S. Geol. Survey P r o f . Paper 450-C, 1962, pp. C43-C46.
. Geology of t h e Washington West Quadrang le , Pa. U . S. Geol. Survey Quad. Map GQ 283, 1964.
Bishop, M. S. Subsur face Mapping. John Wiley & Sons, I n c . , New York, 1960, 198 pp.

15. Brady, S. D . , J r . , and W. D. S t e e l e . P i t t s b u r g h Coal Seam i n Nor thern West V i r g i n i a . Trans . AIME, v . 177, 1948, pp. 13-25.
16. Burroughs, W. G . P i t t s b u r g h Coalbed. Coal Age, v . 5 , 1914, pp. 440-442.
17. C e t i n b a s , A . , R. P. Vinson, J . Cerv ik , and M. G. Z a b e t a k i s . Methane and Dust C o n t r o l by Water I n f u s i o n , P i t t s b u r g h Coalbed (Fa i rv iew, W . Va. ) . BuMines R I 7640, 1972, 17 pp.
18. Clapp, F. G. D e s c r i p t i o n of t h e Amity Quadrangle , Pa. U. S. Geol. Survey Atlas, F o l i o 144, 1907a, 16 pp.
19. . Economic Geology of t h e Amity Quadrang le , E a s t e r n Washington County, Pa. U.S. Geol. Survey B u l l . 300, 1907b, p. 145.
20. C o n t i , L. , Jr. S t r a t i g r a p h y of t h e P i t t sburgh-Reds tone Coal I n t e r v a l i n C e n t r a l and Nor th -Cent ra l West V i r g i n i a . M.S. T h e s i s , W . Va. Univ., Morgantmn, W. Va., 1961, 108 pp.
21. C r o s s , A. T. Geology of t h e P i t t s b u r g h Coal ( S t r a t i g r a p h y , P e t r o l o g y , O r i g i n and Composit ion, and Geologic I n t e r p r e t a t i o n s of Mining Prob - lems) . W. Va. Geol. and Econ. Survey R I 10 , 1954, 99 pp.
22. Dapples , E . C . , W. C . Krumbein, and L. L. S l o s s . Tec ton ic C o n t r o l of L i t h o l o g i c A s s o c i a t i o n . AAPG B u l l . , v. 32 , No. 10 , 1948, pp. 1924-1947.
23. Darrah, W. C . P r i n c i p l e o f Paleobotany. Ronald P r e s s Co., New York, 2d e d . , 1960, 295 pp.
24. Davis , D. H . , and J. G r i f f i n . The P i t t s b u r g h Coal Seam i n Pennsy lvan ia , I ts Reserves , Q u a l i t i e s , and B e n e f i c i a t i o n . Trans . AIME, v. 157, 1944, pp. 22-26.
25. Diamond, W. P . , C . M. McCulloch, and B. M. Bench. E s t i m a t i o n of Coal Cleat O r i e n t a t i o n Using S u r f a c e J o i n t and P h o t o l i n e a r A n a l y s i s . A v a i l a b l e f o r c o n s u l t a t i o n a t Bureau of Mines P i t t s b u r g h Mining and S a f e t y Research C e n t e r , Bruce ton , Pa . , f a c i l i t y .
26. Donaldson, A. C . Anc ien t D e l t a i c Sed imenta t ion (Pennsylvanian) and I ts C o n t r o l on t h e D i s t r i b u t i o n , Th ickness , and Q u a l i t y of Coals . Ch. i n Some Appalachian Coa l s and Carbonates : Models o f Anc ien t Shallow-Water Depos i t ion . W . Va. Geol. and Econ. Survey, 1969, pp. 93-121.
27. Donaldson, A. C . , and A. Morton. Pa leodra inage A n a l y s i s o f Some Pennsy l - v a n i a n Sandstones i n t h e C e n t r a l Appalachians . 1971 Ann. Meeting , Geol. Soc. of America, Washington, D . C . , N w . 1 -3 , 1971; abs . i n GSA A b s t r a c t s With Programs, v . 3 , No. 7 , October 1971, pp. 547-548.
28. Donaven, J . , J. B. Smith , and C . P o l l a r d . A Computer Code f o r E s t i m a t i n g Coal Reserves From Random Data. A v a i l a b l e f o r c o n s u l t a t i o n a t Bureau of Mines Denver Mining Research C e n t e r , Denver, Colo.

Dunbar, C . L . , and J. Rodgers. P r i n c i p l e s of S t r a t i g r a p h y . John Wiley & Sons, I n c . , New York, 1957, 356 pp.
Eavenson, H. N. The P i t t s b u r g h Coa lbed- - I t s E a r l y H i s t o r y and Development. Trans . AIME, v . 130, 1938, pp. 1-55.
. P i t t s b u r g h Coalbed i n West V i r g i n i a . W . Va. Eng. , v . 4 , No. 8 , 1942, pp. 19-21.
Ferm, J . C . , and V . V . Cavaroc. A F i e l d Guide t o Al legheny D e l t a i c Depos i t s i n t h e Upper Ohio Val ley . Ohio Geol. Soc. and P i t t s b u r g h Geol. Soc. , 1969, 21 pp.
Ferm, J. C . , and E. G . Wil l iams. S t r a t i g r a p h i c V a r i a t i o n i n Some A l l e - gheny Rocks of Western Pennsylvania . AAPG B u l l . , v . 44 , No. 4 , 1960, pp. 495-497.
F i e l d s , H. H . , S . Kr ickovic , A. Sa ina to , and M. G . Zabe tak i s . D e g a s i f i - c a t i o n of V i rg in P i t t s b u r g h Coalbed Through a Large Borehole. BuMines RI 7800, 1973, 27 pp.
F i n d l a y , C . , S. Kr i ckov i c , and J . E. Ca rpe t t a . Methane Con t ro l by I s o l a - t i o n of a Major Coal Pane l - -P i t t sbu rgh Coalbed. BuMines R I 7790, 1973, 11 PP*
Fox, J . T. Geology of Fairmont West 7.5 Minute Quadrangle . M.S. T h e s i s , W. Va. Univ. , Morgantown, W . Va., 1965, 40 pp.
Friedman, S. A. Channe l -F i l l Sandstone i n t h e Middle Pennsylvanian Rocks o f Ind iana . I nd . Dept. of Conserva t ion , Geol. Survey, RP 23, 1960, p . 59.
Gray, T. E. , and E. R. Palowitch. P r e p a r a t i o n C h a r a c t e r i s t i c s of Coal From Washington County, Pa. BuMines R I 5475, 1959, 22 pp.
Gre s l ey , W. S. Clay Veins I n t e r s e c t i n g Coal Measures. Bu l l . Geol. Soc. America, v . 9 , January 1898, pp. 35-58.
Grimsley, G . P. Ohio, Brooke, and Hancock Count ies . W. Va. Geol. and Econ. Survey County Repor t , 1907, 378 pp.
Hadden, J. D . , and A. Sa ina to . Gas Migra t ion C h a r a c t e r i s t i c s of Coalbeds. BuMines TPR 12, 1969, 10 pp.
Hass , F. Occurrence of F i r e Damp i n Bituminous Coal Mines. Trans. AIME, V. 74, 1926, pp. 384-391.
Headlee, A. J . , and J. P. No l t i ng , Jr. C h a r a c t e r i s t i c s of Minable Coa ls of W. Va. W. Va. Geol. and Econ. Survey, v. 13, 1940, pp. 146-215.
Heffner, L. B. Geology of Grant Town 7.5 Minute Quadrangle, Marion County, West Virg in ia . M.S. Thesis , W. Va. Univ., Morgantown, W . Va., 1965, 82 pp.
Hennen, R. V . Marshal l , Wetzel, and Tyler Counties. W. Va. Geol. and Econ. Survey County Report, 1909, 654 pp.
Hennen, R. V . , and D. B. Reger. Marion, Monongalia, and Taylor Counties , W. Va. W . Va. Geol. and Econ. Survey, 1913, 844 pp.
Hoover, J . R. S t r a t ig raphy of the Monongahela Group i n West V i rg in i a , Eas tern Ohio, and Southwestern Pennsylvania. M. S. Thesis , W . Va. Univ., Morgantown, W. Va., 1967, 40 pp.
Hough, V. N. D. Photogeologic Techniques Applied t o the Mapping of Rock J o i n t s . W . Va. Geol. and Econ. Survey R I 19, 1960, 21 pp.
Hughart, R. D. Geology of Osage, West Virginia-Pennsylvania 7.5 Minute Topographic Quadrangle. M.S. Thes is , W. Va. Univ., Morgantown, W. Va. , 1967, 64 pp.
I r a n i , M. C . , P. W. J e r an , and M. Deul. Methane Emission From U.S. Coal Mines i n 1973, A Survey (A Supplement t o I C 8558). BuMines I C 8659, 1974, 47 pp.
I r a n i , M. C . , E . D. Thimons, T. G . Bobick, M. Deul, and M. G . Zabetakis . Methane Emission From U. S. Coal Mines, A Survey. BuMines I C 8558, 1972, 58 pp.
Kenny, J . Jou rna l t o Ye Westward. Pennsylvania Magazine of History and Biography, v . 37, 1913, p. 418.
Kent, B. H. Geologic Causes and Poss ib le Preventions of Roof F a l l i n Room-and-Pillar Coal Mines. Pa. Geol. Survey I C 75, 1974, 17 pp.
. Geologic Map of P a r t of t he Carmichaels Quadrangle, Southern Pennsylvania. U. S. Geol. Survey Misc. Geol. Inv. Map 1-588, 1969.
. Geologic Map of the P rospe r i ty Quadrangles , Southwestern Pennsyl- vania . U.S. Geol. Survey Geol. Quad. Map 1003, 1972.
. Geology of the Hackett Quadrangle, Pa. U. S. Geol. Survey Geol. Quad. Map GQ 630, 1967.
. Geology of the Mather Quardrangle, Pa. U.S. Geol. Survey Geol. Quad. Map GQ 826, 1969.
Kent, B. H . , and M. Gornez. Pa leo topographic-St ruc tura l Controls on Thickness and Composition of P i t t sbu rgh Coal i n Southwestern Pennsyl- vania . Pres . a t 1971 Ann. Meeting, Geol. Soc. of America, Washington, D . C . , Nov. 1-3, 1971; abs. i n GSA Abst rac ts With Progams, v. 3 , No. 7, October 1971, p. 17.

K i m , A . G. The Composition of Coalbed Gas. BuMines R I 7762, 1973, 9 pp.
. Methane i n the Pi t t sburgh Coalbed, Greene County, Pa. BuMines R I 8026, 1975, 10 pp.
. Methane i n the Pi t t sburgh Coalbed, Washington County, Pa. BuMines R I 7969, 1974, 16 pp.
K i r r , J . N. Geology of B lacksv i l l e , West Vi rg in ia , Pennsylvania 7.5 Minute Topographic Quadrangle. M. S. Thesis , W. Va. Univ., Mortantown, W . Va., 1968, 44 pp.
K i s s e l l , F. N . The Methane Migration and Storage C h a r a c t e r i s t i c s of the P i t t sburgh , Pocahontas No. 3, and Oklahoma Hartshorne Coalbeds. BuMines R I 7667, 1972, 22 pp.
K i s s e l l , F. N . , and R. J. B ie l i ck i . An In -S i tu Diffusion Parameter f o r the Pi t t sburgh and Pocahontas No. 3 Coalbeds. BuMines R I 7668, 1972, 13 PP*
K i s s e l l , F. N . , C . M . McCulloch, and C . H. Elder . The Direc t Method of Determining Methane Content of Coalbeds fo r Ven t i l a t ion Design. BuMines R I 7767, 1973, 17 pp.
Kosanke, R. M. The C h a r a c t e r i s t i c P lant Microfoss i l s of the P i t t sburgh and Pomeroy Coals of Ohio. Am. Midland N a t u r a l i s t , v . 29, No. 1, 1943, pp. 119-132.
Krickovic, S . , C . Findley, and W . M. Merr i t s . Methane Emission Rate Studies i n a Northern West Vi rg in ia Mine. BuMines TPR 28, 1970, 11 pp.
Krurnbein, W . C . L i thofac ies Maps and Regional Sedimentary-Strat igraphic Analysis. UPG Bul l . , v . 32, No. 10, 1948, pp. 1909-1923.
Krumbein, W. C . , and L. L. S loss . S t ra t igraphy and Sedimentation. W. H. Freeman & Co., San Francisco, C a l i f . , 1963, 660 pp.
Lahee, F. H. F i e ld Geology. McGraw-Hill Book Co., New York, 6 th ed., 1961, 926 pp.
Latimer, I. S . , Jr. Remaining Reserves of t h e Pi t t sburgh Coal i n West Virg in ia . W. Va. Acad. Sci . Proc., v . 34, 1962, pp. 121-124.
MacFarlane, J. The Coal Regions of America. D. Appleton Co., New York, 1875, 695 pp.
Macrae, J. C . , and W. Lawson. The Incidence of Clea t Frac ture i n Some Yorkshire Coal Seams. Trans. Leeds Geol. Assoc., v. 6 , 1954, pp. 224-227.

McCulloch, C . M . , and M. Deul. Geologic Fac tors Causing Roof I n s t a b i l i t y and Methane Emission Problems, The Lower Ki t tanning Coalbed, Cambria County, Pa. BuMines R I 7769, 1973, 25 pp.
McCulloch, C . M . , M. Deul, and P. W . Jeran. Clea t i n Bituminous Coalbeds. BuMines R I 7910, 1974, 25 pp.
McCulloch, C . M . , P. W . J e r an , and C . D. Sul l ivan . Geologic Inves t iga - t i o n of Underground Coal Mining Problems. BuMines R I 8022, 1975, 30 pp.
McGraw-Hill Book Co. Keystone Coal Indus t ry Manual 1973. New York, 1973, 830 pp.
Moore, E . S. Coal. John Wiley & Sons, I n c . , New York, 1922, 216 pp.
Munn, M. J. Descr ip t ion of t he C l a y s v i l l e Quadrangle, Pa. U.S. Geol. Survey Geol. A t l a s F o l i o 180, 1912, 14 pp.
Nickelsen, R . , and V . N. D. Hough. J o i n t i n g i n the Appalachian P la t eau of Pa. Geol. Soc. America Bu l l . , v. 78, 1967, pp. 609-630.
Nordeck, R. E . Geology of t h e R i v e s v i l l e , West V i rg in i a 7.5 Minute Quad- rangle . M.S. Thesis , W . Va. Univ., Morgantown, W. Va., 1967, 128 pp.
Parson, R. C . , and H. D. Dahl. A Study of t h e Causes of Roof I n s t a b i l i t y i n the P i t t sbu rgh Coal Seam. Proc. 7 th Canadian Symp. of Rock Mechan- i c s , A lbe r t a , Canada, Mar. 25-27, 1971, 25 pp.
P l a t t , F. C l e a r f i e l d and J e f f e r s o n D i s t r i c t s . Pa. Geol. Survey 2d Report H I , 1874, 296 pp.
Pohn, H. A. Analysis of Images and Photographs by a Ronchi Grat ing. Remote Sensor Appl ica t ion Studies Progress Report, J u l y 1, 1968, t o June 30, 1969. NTIS Report PB 197-101, Spr ing f i e ld , Va., 1970, 9 pp.
Pomeroy, S. W . Remarks on t h e Coal Region Between Cumberland and P i t t s - burgh. Am. J. S c i . , v . 21, 1832 ,pp . 342-347.
P o t t e r , P. E. Late Paleozoic Sandstones of t h e I l l i n o i s Basin. Ill. Geol. Survey R I 217, 1963, 92 pp.
P r i c e , P. H. Clay Dikes i n Redstone Coal, West V i rg in i a and Pennsylvania. AAPG Bul l . , v . 17, No. 12, 1933, pp. 1527-1533.
P r i c e , P. H., R. L. Anderson, N. H. Snyder, H. M. Cooper, R. F. Abernethy, S. C. Tarpley, and R. J. Swingle. Analysis of West V i rg in i a Coals. BuMines Tech. Paper 626, 1942, 341 pp.
Provost , J. M,, J. J. Dowd, R. F. Abernethy, and D. A. Reynolds. E s t i - mate of Known Recoverable Reserves of Coking Coal i n Marion County, W. Va. BuMines R I 5267, 1956, 30 pp.

R a i s t r i c h , A . , and C . E. Marshal l . The Nature and O r i g i n of Coal and Coal Seams. The E n g l i s h Univ. P r e s s , L td . , London, 1939, pp. 92-99.
Reger, D. B. The Monongahela S e r i e s i n West V i r g i n i a . Proc. W . Va. Acad. S c i . , v. 3 , 1929, pp. 134-146.
Reger, D. B . , and W. W . S t ou t . Pennsylvanian Cyc les i n West V i r g i n i a . I l l . Geol. Survey Bu l l . 60 , 1931, pp. 217-239.
Roen, J . B. Geologic Map o f t h e Oak F o r e s t Quadrangle and P a r t of t h e B l a c k s v i l l e Quadrangle , Southwestern Pennsylvania . U. S. Geol. Survey Misc. Geol. Inv. 1-699, 1972.
. Geology o f t h e Midway Quadrangle Pennsylvania . U. S . Geol . Sur - vey Misc. F i e l d S t u d i e s MF 319, 1972.
. Geology of t h e Waynesburg Quadrangle , Pa. U.S. Geol. Survey Geol. Quad. Map GQ 838, 1970.
Roen, J . B . , and D. E . F a r r e l . S t r u c t u r e Contour Map of t h e P i t t s b u r g h Coalbed, Southwest Pennsylvania and Nor thern West V i rg in i a . U.S. Geol. Survey, 1972.
Roen, J . B . , B. H. Kent, and S. P. Schweinfur th . Geologic Map of t h e Monongahela Quadrangle , Southwestern Pennsylvania . U. S. Geol. Survey Geol. Quad. Map GQ 743, 1968.
Rogers, H. D. The Geology of Pennsylvania . J . P. L i p p i n c o t t & Co., P h i l a d e l p h i a , P a . , v . 2 , 1858, pp. 73-146.
. Third Annual Report . Pa. Geol. Survey, 1839, 119 pp.
Rogers , W. B . Geology of t h e V i r g i n i a s . Appleton and Co., New York, 1884, 832 pp.
Savage, T. E . The Clay Seams (Horsebacks) i n t h e No. 5 Coalbed Near S p r i n g f i e l d , I l l . I l l . Acad. Sc i . Trans . , v . 2 , 1910, pp. 38-44; Econ. Geol. v . 5 , No. 2 , 1910, pp. 178-187.
Schueber t , C. A t l a s of Paleogeolographic Maps of North America. John Wiley & Sons, I n c . , New York, 1955, 177 pp.
Schweinfur th , S. P. Geology of t h e C a l i f o r n i a Quadrangle , Pa. U.S. Geol. Survey Geol. Quad. Map GQ 648, 1967.
S i m s , F. E . , Jr. Geology of t h e Morgantown North , West V i r g i n i a - Pennsy lvan ia 7.5 Minute Topographic Quadrangle. M. S. Thes i s , W. Va. Univ., Morgantown, W . Va., 1960, 198 pp.
S i s l e r , J . D. Bituminous C o a l f i e l d s of Pennsylvania . P a r t 11, De ta i l ed D e s c r i p t i o n of C o a l f i e l d s . Pa. Geol. Survey B u l l . M-6, 1932, 511 pp.

Sloss , L. L., W. C . Krumbein, and E . C . Dapples. In t eg ra t ed Fac ies Analysis. Geol. Soc. America Mem. 39, 1949, pp. 91-123.
Stevenson, J . J . Report of Progress , Greene and Washington D i s t r i c t s . Pa. Geol. Survey Report K , 1875, 419 pp.
S tou t , W. W . Monongahela Se r i e s i n Eas tern Ohio. Geol. Survey of Ohio Open F i l e Report 1, 1954, 794 pp.
S tou t , W . W . , D. B. Reger, and G . H. Asley. The Monongahela S e r i e s i n West V i rg in i a . Proc. W . Va. Acad. Sc i . , v . 3 , 1939, pp. 118-133.
Sturgeon, M. T., and a s soc ia t e s . The Geology and Mineral Resources of Athens County, Ohio. Geol. Survey of Ohio Bull . 57, 1958, 600 pp.
Swanson, V. E . , and H. L. B e r r y h i l l , Jr. Geology of the Washington Eas t Quadrangle, Pa. U.S. Geol. Survey Geol. Quad. Map GQ 334, 1964.
Thiessen, R . , and J . N . Staud. Cor re l a t ion o f Coalbeds i n the Mononga- he la Formation of Ohio, Pennsylvania, and West V i rg in i a . BuMines with the Carnegie I n s t . Technical and t h e Mining and Meta l lu rg ica l Advisory Board, Coop Pub. Bull . 9 , 1923, 64 pp.
T i l t o n , J . G. Channel Sandstone of t h e P i t t sburgh Coal Horizon. Trans. A I M . , v . 238, 1967, pp. 403-408.
T rav i s , R. G . , J . J. Dowd, R . F . Abernethy, and D. A . Reynolds. E s t i - mate of Known Recoverable Reserves of Coking Coal i n Monongalia County, W . Va. BuMines R I 5233, 1956, 30 pp.
U.S. Geological Survey and U.S. Bureau of Mines. Mineral Resources of t he Appalachian Region. U.S. Geol. Survey Prof . Paper 580, 1968, 492 pp.
Wallace, J . J . , J. J. Dowd, J. M. Provost , R. F. Abernethy, and D. A. Reynolds. Est imate of Known Recoverable Reserves of Coking Coal i n Allegheny County, Pa. BuMines R I 5003, 1953, 16 pp.
. Estimate o f Known Recoverable Reserves of Coking Coal i n Greene County, Pa. BuMines R I 5143, 1955, 22 pp.
. Estimate of Known Recoverable Reserves of Coking Coal in Wash- in ton County, Pa. BuMines R I 5109, 1955, 23 pp.
Wanless, H. R . Pennsylvanian Cor re l a t ions i n t h e Eas tern I n t e r i o r and Appalachian Coa l f i e lds . Geol. Soc. America Spec. Papers, v . 17, 1939.
White, I . C . S t r a t ig raphy of the Bituminous Coa l f i e lds of Pennsylvania, Ohio, and West Virg in ia . U.S. Geol. Survey Bul l . 65, 1891, 212 pp.
121. White, I. C . Supplementary Coal Report . W. Va. Geol. and Econ. Survey, v. 2 (A), 1908, 720 pp.
122. White, I. C . , G. H. Ashley, and J. A . Bownocker. The P i t t s b u r g h Coalbed. Trans. AIME, v . 74, 1926, pp. 481-506.
123. Williamson, I. A. Coal Mining Geology. Oxford Univ. P r e s s , Ltd. , Lon- don, 1967, 196 pp.
124. Wilson, W. B. The Or ig in of 'Clay S l i p s . " Econ. Geol . , v. 2, 1916, pp. 381-389.

APPENDIX A. --GLOSSARY OF TERMS
Anticline.--A f o l d i n sedimentary rocks , convex upward wi th the s i d e s d ipping away from a common l i n e , o r c r e s t .
Autochthonous.--Describing c o a l t h a t formed inp lace , from t h e c o n s t i t u e n t p l a n t s t h a t grew, accumulated, and degraded, without t r a n s p o r t .
Axial plane.--A p lane t h a t i n t e r s e c t s t h e c r e s t o r t h e t rough of a fo ld i n such a manner t h a t t h e limbs, o r the s i d e s of t h e f o l d , a r e more o r l e s s symmetrically arranged wi th r e fe rence t o i t .
Axis.--The i n t e r s e c t i o n of t h e a x i a l plane with a p a r t i c u l a r bedding - plane.
Basin of depos i t ion . --Depression i n which sediments accumulate.
Bedding plane. --A su r face t h a t v i s i b l y sepa ra t e s success ive l a y e r s of s t r a t i f i e d rock (of t h e same o r d i f f e r e n t l i t ho logy) .
Butt c l e a t . --A s h o r t , poorly defined j o i n t o r cleavage plane i n a coalbed, u s u a l l y o r i en ted a t r i g h t angles t o t h e f ace c l e a t and te rminat ing aga ins t it.
Clay ve in . --A body of c l a y , u sua l ly inducted, t abu la r t o i r r e g u l a r i n form, which f i l l s a f i s s u r e i n a coalbed. Clay ve ins a r e a l s o known by the fol lowing miner ' s terms: Clay d ikes , c l a y s l i p s , c l a y seams, c l a y c u t o u t s , mud f i l l s , spa r s , and horsebacks.
Coal c l e a t . --A j o i n t o r s e t of j o i n t s along which t h e c o a l i s f r ac tu red . There a r e usua l ly two c l e a t s e t s developed perpendicular t o each o the r . (See b u t t c l e a t and f a c e c l e a t . )
Detr i ta1.--Applied t o m a t e r i a l s occurr ing i n sedimentary rock t h a t were der ived from p r e e x i s t i n g igneous, sedimentary, o r metamorphic rocks and have u s u a l l y been t ranspor ted from place of o r ig in .
Dip.--The angle a t which a s t ra tum o r any p lanar f e a t u r e i s inc l ined from t h e ho r i zon ta l . The d i p is a t a r i g h t angle t o the s t r i k e .
Draw s l a t e . - - S o f t s h a l e t h a t occurs above a coalbed and f a i l s r e a d i l y a f t e r t h e removal of t h e c o a l ( a l s o c a l l e d roof s l a t e ) .
Eustat ic . --A worldwide change i n s e a l e v e l a s opposed t o a r e l a t i v e change i n s e a l e v e l r e s u l t i n g from l o c a l c o a s t a l subsidence o r e l eva t ion .
Extension f r a c t u r e . - -Fractures t h a t form p a r a l l e l t o the d i r e c t i o n of a compressive force. I n a sence they a r e tens ion f r a c t u r e s .
Face c l e a t . --A well-defined j o i n t o r cleavage plane i n a coalbed. The major s e t of j o i n t s i n a coalbed.

Fundamental system ( j o i n t system). --Two s e t s of prominent j o i n t s or iented a t approximately 90" t o each o ther .
I n t e r d i s t r i b u t a r y bay. --Restr icted body of shallow, brackish o r marine water loca ted between d i s t r i b u t a r y branches of a r i v e r i n a d e l t a i c depos i - t i o n a l system.
Isopach map. --A map t h a t shows the v a r i a t i o n of the i n t e r v a l ( th ickness) between two designated s t r a t i g r a p h i c u n i t s o r horizons o r between any horizon and the su r face ; f o r example, a map prepared d i r e c t l y from two s t r u c t u r e - contour maps by sub t rac t ing t h e e l eva t ions of the lower su r face from those of the upper su r face a t each c o n t r o l poin t and drawing new contours .
J o i n t s . - -Fractures i n rock , genera l ly more o r l e s s v e r t i c a l o r perpendic- u l a r t o bedding, along which no appreciable movement has occurred.
Linear or l ineaments. - -S t ra ight or gen t ly curved mappable physiographic f e a t u r e s on the e a r t h ' s sur face .
L i tho fac ie s map. --A map based on l i t h o l o g i c c h a r a c t e r i s t i c s showing v a r i - a t i o n i n t h e l i t h o l o g i c makeup of a se l ec ted s t r a t i g r a p h i c u n i t . The map may emphasize t h e dominant, average, o r s p e c i f i c l i t h o l o g i c aspect of the u n i t , and provides information on the changing composition of t h a t u n i t .
Paleos1ope.--The d i r e c t i o n of i n i t i a l d ip of a former land surface .
P e r i d o t i t e dike.--A v e r t i c a l o r nea r ly v e r t i c a l igneous i n t r u s i o n com- posed of coarse-grained p lu ton ic rock composed c h i e f l y of o l i v i n e .
Rank of coa l . --A genera l ized c l a s s i f i c a t i o n of coa l s according to degree of metamorphism, o r progress ive a l t e r a t i o n , i n t h e n a t u r a l s e r i e s from l i g n i t e t o a n t h r a c i t e .
Release f r a c t u r e s . - -Fractures t h a t form perpendicular t o the major s t r e s s axes. These f r a c t u r e s a r e assumed t o have formed when the load was removed, hence t h e i r name.
Rib. --The s i d e wal l of an ou t s ide en t ry i n a coa l mine. - Rider coa l . --A t h i n unminable c o a l found c l o s e l y above a th i cke r minable
coalbed. Normally only a few inches th ick .
Rose diagram. --Circular o r semic i rcular diagram f o r p l o t t i n g t h e f r e - quency of measured s t r i k e s (or d i p s ) of p lanar f e a t u r e s , such as j o i n t s and c l e a t s .
Sandstone channel. --A body of sand deposi ted i n the channel of a s tream o r river.
Set . --A group of e s s e n t i a l l y p a r a l l e l r e l a t e d p lanar f e a t u r e s , such a s - j o i n t s o r d ikes o r f a u l t s , o r c l a y ve ins .

Shear f r a c t u r e . --A f r a c t u r e t h a t r e s u l t s from opposed s t r e s s e s which d i s - p l a c e one p a r t of a rock mass p a s t t he ad jacent p a r t .
S l ickens ide . --Polished and s t r i a t e d (scratched or grooved) sur f ace t h a t r e s u l t s from f r i c t i o n along a plane. The movement can be ve ry s l i g h t .
Spa l l ing of r i b s o r p i l l a r s . - -The breaking o f f of l aye r s of c o a l p a r a l l e l t o the su r face of r i b s o r p i l l a r s i n underground mines.
Strandline.--The l i n e or l e v e l a t which a body of s tanding water , such a s t h e s e a , meets t h e land; f o r example, t h e shore l ine .
Strike.--The course o r bear ing of t h e i n t e r s e c t i o n of an inc l ined bed o r s t r u c t u r e with t h e ho r i zon ta l . It i s perpendicular t o t h e d i r e c t i o n of d ip .
S t r u c t u r e contour map. --A map t h a t po r t r ays by means of l i n e s drawn through p o i n t s of equal e l e v a t i o n the subsurface conf igu ra t ion of a s t ra tum such a s a coalbed.
Syncl ine. --A f o l d i n sedimentary rock where the s t r a t a d i p inward from both s i d e s toward the a x i s .
Sync1inorium.--A broad r eg iona l sync l ine on which a r e superimposed minor f o l d s .
Tectonic fo rces . --The fo rces involved i n deformation of t h e e a r t h ' s c r u s t , r e s u l t i n g i n fo ld ing and f a u l t i n g .
Washouts.--A channel c u t i n t o o r through a coalbed during o r a f t e r i t s d e p o s i t i o n and gene ra l ly f i l l e d wi th sands tone.
Wild c o a l . - - B r i t t l e s h a l e i n t e r s t r a t i f i e d with t h i n coalbeds.

APPENDIX B . - -SURFACE J O I N T READINGS OF INDIVIDUAL QUADRANGLES
Quadrangle West
West 1 I 2 I 3 I 4 I 5 I 6
Tier 4: Windridge ......... Rogersvi l le . ...... Waynesburg ........ Mather.. .......... Carmichaels. ...... Degrees separa t ion Di rec t iona l mean..
Tier 5 : New Freeport ...... Ho lbrook. ......... Garards For t . ..... Oak Fores t . . ...... Masont own. ........ Degrees separa t ion Di rec t iona l mean.. .
. County separat ion. . County d i r e c t i o n a l mean. ..............
1 I 2 1 3 1 4 1 5 I 6 I 7 1 8
N 22" W - -
N 15" W N 17" W
7 N 18" W
- - -
N 19" W - -
N 19" W 1"
N 19" W
Tier 1: Avel la . . . . ........ Midway.. .......... Cannonsburg ....... Bridgev i l l e ....... Degrees separa t ion Di rec t iona l mean..
T ie r 2 : West Middletown.. . Washington West.. . Washington East . . . Hackett.. ......... Monongahe la. ...... Degrees separa t ion Di rec t iona l mean..
Tier 3 : Claysv i l l e . .......
........ Prosper i ty Amity ............. Ellsworth .........
........ C a l i f o r n i a Degrees separa t ion Di rec t iona l mean..
County separat ion. . . County d i r e c t i o n a l mean. . . . . . . . . . . . . . .
WASHINGTON
- N 21" W
- - -
N 21° W
- -
N 20" W - - -
N 20" W
- - - - -
N 23" W
GREENE
- - - -
N 26" W -
N 26" W
N 28" W - -
N 32" W - 4
N 30" W 4"
N 28" W
- N 7" W -
- -
N 7" W
N 7" W - -
N 8" W -
1 N 8" W
- - -
N 4 " W N 1" W
3 N 3" W
5"
N 6" W
- - - - - - - - - - - - -
N 12" W N 12" W
- - - 0
N 12" W -
N 12" W
COUNTY
N 37" W N 32" W - N 26" W
11 N 32" W
- -
N 38" W -
N 3 1 ° W 7
N 35" W
- -
N 32" W N 2 3 O W N 3 3 " W
N 32" W 1
N 32" W
COUNTY
- - - -
N 37" W -
N 37" W
- N 43" W
- - - -
N 4-3" W 6"
N 40" W
30 1 30 N 21" W N 33" W
N 51" W N 58" W N 57" W - N 49" W
9 N 54" W
- N 61" W N 61" W N 64" W N 56" W
8 N 61" W
7"
N 58" W
- - -
N 87" W -
N 87" W
-
-
N 49" W
- -
N 49" W - -
N 49" W
-
- -
N 77" W N 77" W N 70" W
7 N 75" W
N 74" W N 77" W -
- N 75" W
3 N 75" W
0"
N 75" W
- - - - - -
- - - - - - -
N 56" W N 52" W
- N 60" W
8 N 56" W
N 57" W
- - - - - - -
- -
N 81" W - - -
N 81" W -
N 81" W
N 85" W
- N 74" W -
- -
N 74" W
N 70" W
N 57" W N 73" W
- N 82" W
- - -
N 82" W
- - - - - - - 5"
N 53" W N 59" W N 52" W N 6 4 " W
12 N 57" W
N 60" W - - -
N 58" W 2
N 59" W 3"
N 76" W N 72" W N 67" W -
9 N 71" W
N 76" W N 72" W N 75" W N 72" W N 71" W
5 N 73" W
3"

Quadrangle West 1 I 2 I 3 I 4 I 5 1 6 I 7
WETZEL AND MONONGALIA COUNTIES
N 8 1 ° W N 85" W
- N 77" W N 76" W
9 N 80" W
T i e r 6: Hundred. .......... Wadestown.. ....... B l a c k s v i l l e . ...... Osage ............. Morgantown North.. Degrees s e p a r a t i o n D i r e c t i o n a l mean..
- - - -
N 87" W -
N 87" W
- - - - -
- MAR I O N AND MONONGALIA COUNTIES
- - - - - - -
- N 47" W N 50" W N 57" W
- 10
N 51" W
- - - - - - -
- - - - - - -
N 6 4 " W N 70" W N 66" W
- - 6
N 67" W
T i e r 7: Glover Gap. ....... Manning ton. ....... Grant Town.. ...... Morgantown South.. R i v e s v i l l e . . ...... Degrees s e p a r a t i o n D i r e c t i o n a l mean..
N 3" W - - -
N 7" W 4
N 5" W MARION AND HARRISON COUNTIES
- -
N 23" W N 17" W
- 6
N 20" W
T i e r 8 : Wallace ........... Shinns ton . . ....... Fairmont West . . . . . Fairmont Eas t . . ... G l a d e s v i l l e ....... Degrees s e p a r a t i o n D i r e c t i o n a l mean..
N 50" W N 47" W N 52" W N 54" W
- 7
N 51" W
- - - - - - -
- N 12" W
- -
N 2" W 10
N 7" W
- - - -
N 68" W -
N 68" W
N 84" W N 75" W N 80" W N 84" W
- 9
N 81" W
E a s t 1 I 2 I 3 I 4 I 5 I 6 I 7 1 8
- - - - - - -
T i e r 1: Avel la ............ Midway ............ Cannonsburg ....... B r i d g e v i l l e . ...... Degrees s e p a r a t i o n D i r e c t i o n a l mean..
T i e r 2 : West Middletown.. . Washington West.. . Washington East . . . Hacket t . . ......... Monong ahe l a . ...... Degrees s e p a r a t i o n D i r e c t i o n a l mean..
T i e r 3 : C l a y s v i l l e . .......
...... P r o s p e r i t y . . Amity ............. El l swor th . . ....... C a l i f o r n i a . ....... Degrees s e p a r a t i o n D i r e c t i o n a l mean..
- - - - - -
- - - - - - -
- N 7" E
- - - -
N 7" E
- - - -
N 35" W -
N 35" W
- - - - - -
N 88" E - -
N 89" E - 1
N 89" E
- N 89" E
- - - -
N 89" E
- N 17" E
- N 19" E
2 N 18" E
N 19" E N 17" E
- - - 2
N 18" E
N 19" E - - -
N 2 3 " E 4
N 21" E
- N 51" W
- - - -
N 51" W
COUNTY
- - -
N 37" E -
N 37" E
N 37" E N 37" E
- -
N 37" E 0
N 37" E
- -
N 37" E - - -
N 37" E
WASHINGTON
- N 28" E N 27" E
- 1
N 28" E
- -
N 2 9 " E N 27" E N 27" E
2 N 28" E
- N 3 3 " E N 27" E
- - 6
N 30" E
- -
N 60" W N 58" W N 66" W
5 N 61" W
N 46" E N 44" E N 45" E
- 2
N 45" E
N 47" E -
N 4 7 " E N 47" E
- 0
N 47" E
- - -
N 47" E N 4 5 O E N 6 2 " E
2 N 46" E
- -
N 80" W N 80" W
- -
N 80" W
- N 63" E N 63" E N 57" E
6 N 61" E
- - - - - - -
- -
N 63" E -
- N 63" E
N 89" W - - - - -
N 89" W
- - - - - -
N 70" E - -
N 69" E N 6 9 " E
1 N 69" E
N 7 5 " E N 72" E
- - - 3
N 74" E

Quadrangle East 1 I 2 I 3 I 4 I 5 I 6 1 7 I 8
WASHINGTON COUNTY --Cont inued
T ie r 7 : ...... Glover Gap..
Manning ton. ....... Grant Town........ Morgantown South. . Rivesvi l l e . ....... Degrees separa t ion Di rec t iona l mean. .
Eas t 1 1 2 1 3 1 4 1 5 I 6 I 7
T ie r 8 : Wallace. .......... Shinnston .........
... Fairmont West.. Fairmont E a s t . . . . .
...... Gladesvi l le . Degrees separa t ion Di rec t iona l mean..
County separa t ion . . . .......
MARION AND MONONGALIA COUNTIES I I I I
2" County mean..
N 39" E - - - - -
N 39" E
N 37" E N 37" E N 37" E
- 0
N 37" E 2"
N 38" E
- N 46" E N 43" E
- N44" E
3 N 44" E
- - -
N 52" E 1
N 53" E 8"
N 49" E
5" -
N 80" E -
N 82" E N 76" E N 7 8 " E
6 N 79" E
N 77" E N 85" E
- - 8
N 81" E 2"
N 80" E
- N 26" E
- -
N 29" E 3
N 28" E
- N 27" E N 27" E
- 0
N 27" E 1"
N 28" E
T ie r 4 : Windridge. ........ Rogersv i l l e ....... Waynesburg. ....... Mather. ........... Carmichaels ....... Degrees separa t ion Di rec t iona l mean..
T ie r 5 : New Freepor t ...... Garards For t . . .... Oak Fores t . . ...... Masontown. ........ Degrees separa t ion Di rec t iona l mean..
County separa t ion . . . County mean.. .......
WETZEL AND MONONGALIA COUNTIES
- - -
N 2" E - -
N 2" E
0" 2" 3"
- - - - - - -
N 2" E N 1" E
- -
1 N 2" E
- N 2" E
MARION AND HARRISON COUNTIES I I I
- N 10" E N 17" E
- N 17" E
7 N 15" E
N 63" E , N 72" E N 7" E 0"
- N I O O E N 14" E N 15" E
- 5
N 13" E
N 25" E N 2 7 " E N 27" E
- N 27" E
2 N 27" E
T ie r 6 : Hundred. .......... Wadestown. ........ Blacksv i l l e . . ..... Osage ............. Morgantown North. . Degrees separa t ion Di rec t iona l mean..
N 89" E N 29" E N 19" E 2"
GREENE
N I O O E N 9" E N 12" E N 13" E
- 4
N 11" E
N 16" E - - - -
N 16" E 5"
N 14" E'
N 7" E -
N 3" E - -
4 N 5" E
N 28" E - -
N 22" E - 6
N 25" E
COUNTY
N 2 3 " E - - - - -
N 23" E
- -
N 18" E N 22" E
4 N 20" E
3" N 22" E
- - - - - - -
- - -
N 37" E - -
N 37" E
N 37" E N 46" E
N 57" E - -
N 54" E N 49" E
8 N 53" E
N 74" E -
N 70" E - - 4
N 72" E
- - - - - - -

APPENDIX C . --PHOTOLINEAR READINGS OF INDIVIDUAL QUADRANGLES
West 1 1 2 I 3 I 4 I 5 I 6 1 7
Quadrangle
GREENE COUNTY
West 1 I 2 I 3 I 4 1 5 1 6 I 7 I 8
T i e r 1 : Avel la . ........... Midway. ........... Cannonsburg ....... B r i d g e v i l l e . ...... Degrees s e p a r a t i o n D i r e c t i o n a l mean..
T i e r 2 : West Middletown.. .
. Washington West.. Washington E a s t . . . Hackett ........... Monongahela.. ..... Degrees s e p a r a t i o n D i r e c t i o n a l mean..
T i e r 3 : ....... C l a y s v i l l e .
P r o s p e r i t y ........ ............ Amity.
E l l swor th ......... C a l i f o r n i a . ....... Degrees s e p a r a t i o n D i r e c t i o n a l mean.. .
. County s e p a r a t i o n . . ....... County mean..
T i e r 4 : Windr idge ......... Roger s v i 1 l e ....... Waynesburg ........ Mather. ........... Carmichae 1s . ...... Degrees s e p a r a t i o n D i r e c t i o n a l mean..
T i e r 5 : New Freepor t ...... Holbrook. ......... Oak Fores t . . ...... Garards F o r t . . .... Masontown ....... Degrees s e p a r a t i o n D i r e c t i o n a l mean..
County s e p a r a t i o n . . . ....... County mean..
N 1" W - - - -
N 1" W
- N 3" W
- N 8" W N 6" W
5 N 6" W
- - -
N 2" W - -
N 2" W 5"
N 3"
- - - - - - -
- -
N 2" W -
N 4" W 2
N 3" W -
N 3" W
N 13" W -
N 12" W N 17" W N 13" W
5 N 14" W
- - - - - - - -
N 14" W
- - - - - -
N 10" W - - - - -
N 10" W
N 1 3 " W -
N 14" W - - 1
N 14" W 4"
N 12" W
COUNTY
- - - - - -
- N 29" W
- - - -
N 29" W
- -
N 30" W - - -
N 30" W 1"
N 30" - - W -
WASHINGTON
N 22" W N 22" W N 18" W N 19" W
4 N 20" W
N 24" W -
N 23" W N 18" W
- 6
N 22" W
- N 20" W
- N 20" W N 20" W
0 N 20" W
2" N 21" W
- N 29" W
- - - -
N 29" W
- N 28" W N 25" W N 23" W N 29" W
6 N 26" W
3" N 24" W
- - -
N 38" W -
N 38" W
- N 43" W N 40" W
- - 3
N 42" W
N 3 7 " W - -
N 35" W - 2
N 36" W 6"
N 39" W
N 43" W -
N 35" W N 42" W N 34" W
9 N 39" W
N 37" W -
N 43" W N 47" W
- 10
N 42" W 1"
N 41" W
- -
N 47" W - -
N 47" W
N 5 7 " W - - -
N 57" W 0
N 57" W
- N 53" W
- N 53" W
- 0
N 53" W 10"
N 52" W
- -
N 53" W - N 54" W
1 N 54" W
- N 53" W
- - - -
N 53" W 1"
N 54" W
- -
N 64" W N 69" W
5 N 67" W
- N 62" W N 67" W N 69" W
- 7
N 66" W
N 6 0 ° W N 67" W N 69" W N 69" W N 68" W
9 N 67" W
1" N 66" W
N 61" W N 66" W
- N 67" W
- 6
N 65" W
- -
N 60" W N 62" W N 69" W
9 N 64" W
1" N 65" W
- N 80" W N 89" W
- 9
N 85" W
N 8 8 " W -
N 90" W N 84" W N 80" W
10 N 86" W
- - -
N 83" W N 84" W
1 N 84" W
2" N 85" W
- -
N 73" W -
N 77" W 4
N 75" W
N 77" W - -
N 76" W - 1
N 77" W 2"
N 76" W

-- - - - -
Tier 1 : Avella. ........... Midway ............ Cannonsburg ....... B r idgevi 1 l e ....... Degrees separat ion Di rec t iona l mean..
Tier 2 : West Middleton .... Washington West.. . Washington Eas t . . . Hackett ........... Monongahe l a . ...... Degrees separat ion Di rec t iona l mean..
Tier 3 : C l aysv i l l e . ....... Prosper i ty . ....... Amity ............. Ellsworth. ........ Cal i fo rn ia . . ......
-
Quadr ang l e
WASHI - - -
N 13" E -
N 13" E
- N 14" E
- N 10" E
-
West 1 I 2 I 3 I 4 I 5 I 6 I 7 I 8
'GTON COUNTY
- - N 19" E - N 15" E -
- - 4 -
N 17" E -
WETZEL AND MONONGALIA COUNTIES
- - -
N 51" W - -
N 51" W
- N44"W
- - - -
N 44" W
N 28" W - -
N 29" W N 29" W
1 N 29" W
MARION AND MONONGALIA COUNTIES
N 6 2 " W N 6 6 " W N 68" W N 63" W
- 6
N 65" W
Tier 6: Hundred. .......... Wadestown. ........ B l a c k s v i l l e ....... Osage. ............ Morgantown North. . Degrees separa t ion Di rec t iona l mean..
- - -
N 76" W N 72" W
4 N 74" W
- - - - - - -
- - - -
N 4" W -
N 4" W
- N18"W
- - - -
N 18" W
- N 61" W N 60" W N 59" W N 65" W
6 N 61" W
- - - - - - -
N 77" W -
N 75" W N 84" W N 85" W
10 N 80" W
MARION AND HARRISON COUNTIES
N 32" W - -
N 30" W N 29" W
3 N 30" W
Tier 7 : G l w e r Gap.. ...... Manning ton. ....... GrantTown ........ Rivesvi l l e . ....... Morgantown South.. Degrees separa t ion Di rec t iona l mean.. .
- - - -
N 43" W -
N 43" W
N 6" W -
N l O W - -
5 N 4" W - N
- - - -
N 11" W -
11" W .
- - - - - - -
I East
N 50" W N 53" W
- - - 3
N 52" W
- N 68" W
- N 69" W N 69" W
1 N 69" W
N 76" W -
N 82" W - - 6
N 79" W
Tier 8 : Wallace. .......... Shinnston ......... Fairmont West.. ... Fairmont Eas t . . . . . G ladesv i l l e . . ..... Degrees separa t ion Di rec t iona l mean..
- -
N 43" W - - -
N 43" W
- N 3 " W
- - - -
N 3" W
N 20" W - - -
N 25" W 5
N 23" W
- -
N 14" W N 14" W N 12" W
2 N 13" W
N 36" W N 33" W
- - - 3
N 35" W

-- - - --
Quadr ang l e Eas t
County mean.. ....... I N 4' E ( N 13" E 1 N 19" E 1 N 37" E 1 N 51" E 1 N 63" E I N 78" E
I 1 I 2 1 3 1 4 I 5 I 6 1 7 WASHINGTON COUNTY--Continued
10 N 78" E
0"
- - 4"
T ie r 4 : Windridge.. ....... Rogersvi l le ....... Mather.. .......... Carmichaels . . ..... Waynesburg ........ Degrees s e p a r a t i o n Di rec t iona l mean..
T ie r 5 : New Freepor t ...... Holbrook.. ........ Oak Fores t . . ...... Garards F o r t . . .... Masontown. ........ Degrees sepa ra t ion Di rec t iona l mean..
County sepa ra t ion . . . Countvmean .........
MARION AND MONONGALIA COUNTIES .
Degrees sepa ra t ion Di rec t ion mean.. . . .
County sepa ra t ion . . . GREEN
N 24" E N 22" E N 20" E
- N 18" E
6 N 21" E
- N 17" E N 17" E N 23" E
- 6
N 19" E 2"
N 20" E
N 3" E N 3" E N 3" E N 8" E
- 5
N 4" E
N 5" E N 5" E
- - -
0 _ N 5" E
1" N 5 " E
T i e r 7: Glover Gap. ....... Manning ton. ....... Grant Town.. ...... R i v e s v i l l e . . ...... Morgantown South. . Degrees sepa ra t ion Di rec t iona l mean..
- - 1"
4 N 6" E
WETZEL AND MONONGALIA COUNTIES T i e r 6 :
Hundred, .......... Wadestown. ........ Blacksv i l l e . ...... Osage.. ........... Morgantown North. . Degrees sepa ra t ion Di rec t iona l mean.,
- - -
N 3" E - -
N 3" E
3 N 20" E
3"
COUNTY
- - - - - - -
N 35" E N 33" E N 27" E
- N 30" E
8 N 31" E
- N31° E
MARION AND HARRISON COUNTIES
N 50" E - -
N 44" E N 48" E
6 N 47" E
- - -
N 41" E - -
N 41" E 6"
N 4 4 " E
- - -
N 2" E - -
N 2" E
N 17" E - - -
N 12" E 5
N 15" E
Tier 8 : Wallace. . . . . . . . . . . Shinnston. . . . . . . . . Fairmont West.. ... Fairmont E a s t . . . . , G ladesv i l l e . . ..... Degrees sepa ra t ion Di rec t iona l mean..
4 N 37" E
1"
N 89" E - - - - -
N 89" E
- - - -
N 88" E -
N 88" E 1"
N89" E
- -
N 62" E N 63" E
- 1
N 63" E
- - -
N 60" E - -
N 60" E 3"
N 6 2 " E
- N 48" E
5"
N 73" E - -
N 78" E N 79" E
6 N 77" E
N 70" E -
N 75" E N 73" E N 75" E
9 N 73" E
4" N 75" E
N 17" E N 13" E
- -
N 15" E 4
N 15" E
- N 27" E N 26" E - N 22" E
5 N 25" E
- - - - - - -
- -
N 24" E - - -
N 24" E
- - -
N 41" E N 33" E
8 N 37" E
N 18" E - - -
N 13" E -
N 16" E
- - -
N34" E N 30" E
4 N 32" E
- - - - - - -
- N 26" E N 23" E N 22" E
- 4
N 24" E
N 58" E N 49" E
- N 5 5 " E
- 9
N 54" E
N 64" E - -
N 75" E N 67" E
11 N 69" E
N 33" E - -
N 41" E N 40" E
8 N 38" E
- - - - - - -
N 68" E N 74" E
- N 73" E -
6 N 72" E
- -
N 50" E - - -
N 50" E
- -
N 87" E -
N 89" E -
N 88" E
N 63" E - - - - -
N 63" E
- - -
N 83" E N 85" E
2 N 84" E

APPENDIX D. --PRINCIPAL DIRECTION FOR I N D I V I D U A L PHOTOINDEX SHEETS OF THE STUDY AREA
IN T.mBU.0 F MINES, PGH.%P A. 2070 1
West 1 I 2 I 3 I 4
Eas t 1 I 2 I 3 I 4
WASHINGTON COUNTY
N 72" E N 74" E N 70" E N 77" E N 73" E
7
N 73" E
Sheet : 1.. . . . .. . . . Z . . . . ...... 3 . . . . . . ... . 4. . . .. . . . . . 5.. . .......
Degrees sepa ra t ion . .
Direc t ional mean. .. . ... .
GREENE COUNTY
N 51" E N 52" E N 49" E N 50" E N 53" E
4
N 51" E
N 45" W N 43" W N 44" W N 45" W N 47" W
4
N 45" W
N 23" E N 23" E N 18" E N 17" E N 12" E
11
N 19" W
N 67" W N 67" W N 68" W N 70" W N 77" W
10
N 70" W
N 7" W N 10" W N 13" W N 9" W N 10" W
6
N 10" W
N 30" E N 32" E N 27" E N 34" E N 27" E
7
N 30" E
N 19" W N 24" W N 20" W N 28" W N 27" W
9
N 24" W
Sheet: I. . . ... . . . . 2.. . . . . . . . . 3 ..... . .. . . 4 . . . . . . . . . .
Degrees separa t ion . .
D i rec t iona l
N 14" E N 10" E N 7" E N 12" E
7
N 7" W N 12" W N 9" W N 5" W
7
N 79" E
N 58" E N 56" E N 57" E N 53" E
5
N 68" W N 70° W N 70" W N 67" W
3
N 28" E N 24" E N 21" E N 26" E
7
N 25" W N 23" W N 20" W N 23" W
5
N 81" E N 75" E N 77" E N 82" E
7
N 47" W N 43" W N 42" W N 44" W
5
mean. .. .... . N 8" W MONONGALIA COUNTY
N 23" W N 69" W I N 11" E N 42" W
Sheet : 1. .. ....... 2.. . .. .... .
Degrees separa t ion . .
D i rec t iona l mean.. . . . . . .
N 25" E I N 56" E
N 20" W N 23" W
3
N 22" W
N 8" W N 7" W
1
N 8" W MARION COUNTY
N 42" W N 43" W
1
N 43" W
Sheet: 1. .. . .... . . z * . . . . . . . . .
Degrees sepa ra t ion . .
D i rec t iona l mean.. . .....
N 69" W N 70" W
1
N 70" W
N 8" W N 7" W
1
N 8" W OVERALL
N 5" E N 10" E
5
N 8" E
Degrees sepa ra t ion between coun t i e s . . . .
D i rec t iona l mean.. .. .. ..
N 28" W N 20" W
8
N 24" W I N
N 19" E N 26" E
7
N 23" E
N 42" W N 44" W
2
43" W
N 72" W N 73" W
1
N 73" W
2
N 9" W
N 60" E N 56" E
4
N 58" E
N 4" E N 7" E
3
N 6" E
2
N 23" W
N 79" E N 81" E
2
N 80" E
N 19" E N 21" E
2
N 20" E
2
N 44" W
N 57" E N 59" E
2
N 58" E
3
N 70" W
N 78" E N 77" E
1
N 78" E
13
N 12" E
10
N 27" E
7
N 55" E
7
N 77" E