effect of oxidative stress on viability and selected
TRANSCRIPT

Effect of oxidative stress on viability and selected
characteristics of probiotic bacteria
Mariam Farhad
A thesis submitted in fulfilment of the requirements for the
degree of
Doctor of Philosophy
Centre for Plant and Environment Science School of Natural Science
University of Western Sydney, Australia
December, 2010

i
Statement of Authentication
The work presented in this thesis is, to the best of knowledge and belief, original except as
acknowledged in the text. I hereby declare that I have not submitted this material, either in
whole or in part, for a degree at any other institutions.
Signed…………………………………………
Date……………………………………………
ii
Acknowledgements
At first my most sincere thanks and heartfelt gratitude go to my supervisors Prof. Kasipathy
Kailaspathy and Dr. Michael Phillips for their constant encouragement and support in the
development of this research, particularly for the many stimulating and instructive discussions we
had. Their exceptional enthusiasm and integral views on research and their mission for providing
'only high-quality work and not less', has made a deep impression on me.
I wish to thank all of my colleagues for their friendship, advice and support during this study at
University of Western Sydney, Australia. I wish to acknowledge all the staff members at the Centre
for Plant and Environment Science and School of Natural Science, for their invaluable support
during my research. A special thanks to Prof. Debora Sweeney, A/Prof. John Cairny, A/Prof. Paul
Holford, A/Prof. David Tissue, A/Prof. Samsul Huda, Dr. Mark Jones, Dr. Denis Whitfield, A/Prof.
Minh Nguyen, Dr. David Harland, Dr. Saman Seneweera, Dr Rosalie Durham, Dr. Anya Salih, Ms
Gillian Wilkins, Ms Rosalie laing and Ms Linda Westmoreland for their valuable support throughout
my research.
My sincere thanks to Dr. Alamgir Khan for given me the opportunity to work in his laboratory
(APAF) at Macquarie University, Sydney to enhance my skills in Proteomic research. A special thanks
to my very close friends Junus Salampessy, Sarah Moore and Stephanie Pritchard for their immense
support and encouragement throughout my study. I also acknowledge that this research was
supported and funded by the University of Western Sydney and the Centre for Plant & Environment
Science.
Finally, a huge thanks to my husband (Dr. Mohammad Farhad) and two little boy’s (Ismaael Farhad
and Yusuf Farhad), my parents, family members and friends for their continued support, love,
sacrifices and encouragement in building my educational career.

iii
Abstract
Currently, probiotic bacteria dependent dairy industries are battling to keep required
concentration (more than 106 cfu/ml) of anaerobic bacteria in dairy products. In most cases
the concentration of live bacteria greatly reduced due to the toxic effects of environmental
oxygen. It is essential to maintain a constant volume of microbes (from manufacturing
process to consumer) to exert maximum health benefit. The aims of this study were to screen
and select a number of oxidative resistant probiotic bacteria, to identify any differentially
expressed proteins responsible for their oxidative resistant roles and the characterization of
those selected bacteria by using a number of physiological responses (acid and bile tolerance,
hydrophobicity, auto aggregation and coaggregation). A comparative study was also
conducted using a microencapsulation technique. The screening process was conducted using
a number of Lactobacillus and Bifidobacteria cultures and finally concluded with four
potential probiotic strains selected (L. casei Lc1, L. rhamnosus DR-20, B. infantis 1912 and B.
animalis subsp. lactis Bb12). Relative Bacterial Growth Ratio (RBGR) method was used for
the entire screening process. During the proteomic study with L. casei Lc1 and L. rhamnosus
DR-20, the laser scanning confocal microscopy (LSCM) results showed that the number of
viable oxygen-sensitive cells was comparatively less than the oxidative stress resistant cells.
After the completion of oxygen treatments on both strains, two-dimensional gel
electrophoretic analysis exhibited three proteins with differential expression by 3-fold or more
and 118 proteins by 2-fold or more for L. casei Lc1. Four differentially expressed proteins
were identified by MALDI MS-MS analysis. Treated L. rhamnosus DR20 exhibited no
apparent stress-related proteins. However, in the proteomic study of B. infantis 1912 and the
image analysis data it was revealed that 1 protein increased more than 13 fold, 1 protein
increased more than 5 fold and another 7 proteins (2-fold or more) were up-regulated and 12
proteins were found as down-regulated. All 21 proteins were identified by the combination of
2-DE and MALDI MS-MS analysis. This study is expected to be the first published report
that has identified and described proteins from B. infantis 1912 related to oxidative stress.
The characterization and physiological responses when investigated and revealed that all four
Lactobacillus and Bifidobacterium strains in both anaerobic and aerobic conditions displayed
a better survival rate at pH 2.0 with cell viability higher than 105cfu/ml indicating that they
are able to protect themselves from acid as well as from toxic oxygen effects. In anaerobic
and aerobic conditions, in 1.0% bile salts concentration, L. rhamnosus DR-20 and B. infantis

iv
1912 displayed better bile salt resistance and survived more than107 and 106cfu/ml
respectively. However, in aerobic condition, all four strains demonstrated a slightly lower
survival rate in various concentrations of bile salts compared to anaerobic condition and
indicated that they are able to protect themselves from bile salts and toxic oxygen effects. In
both anaerobic and aerobic conditions, L. rhamnosus DR-20 and B. animalis subsp. lactis
Bb12 displayed higher hydrophobicity (55-60%) compared to the other two strains (36 to
41%). But all 4 strains also displayed slightly higher hydrophobicity in anaerobic conditions
compared to its corresponding strains in aerobic conditions. Between the anaerobic and
aerobic condition, all strains showed only a 5% difference in hydrophobicity rate. As a part of
the present study the autoaggregation ability was investigated in both anaerobic and aerobic
conditions and all strains showed a medium level of auto aggregation (20 to 70 %) with the
exception of B. animalis subsp. lactis Bb12, which showed a lower level of auto aggregation
(<20%). In all cases the coaggregation in anaerobic condition was slightly higher (maximum
9%) than its corresponding aerobic condition. Finally, microencapsulation results revealed
that there were no significant (p<0.05) differences observed between two cell counts (cells in
aerobic condition and encapsulated cells) indicating that all four probiotic strains are able to
protect themselves from the toxic effects of oxygen and have a higher survival rate (from 5.63
log10
cfu/ml to 8.70 log10
cfu/ml free cell counts in aerobic condition). All four probiotic strains
were found to be oxidative resistant strains as expected because they were previously selected
for oxygen resistance. However under both aerobic and anaerobic situations
microencapsulation demonstrated slightly increased viable cells compared to the free cells
samples.

v
List of Publications
Book chapter have been published in 2010, Fermented Foods and Beverages of the world
(Editors: Jyoti Prakash Tamang and Kasipathy Kailasapathy). Chapter 14 (Farhad M.,
Tamang JP. and Kailasapathy K. Health aspects of fermented foods). Published by Taylor
and Francis Group of USA.
Farhad M.1, Kailasapathy K.1, PhillipsM.1 and Khan A.2 (2010). Studies on protein
expression of selected Lactobacillus casei Lc1 and Lactobacillus rhamnosus DR20 grown
in oxidative stress. International Journal of Food Microbiology. (Manuscript submitted).
M. Farhad1, M. Phillips1, Khan A2 and K. Kailasapathy1 (2010). Studies on the effect of
oxidative stress on Bifidobacterium infantis b1912: a proteomic approach. International
Journal of Food Microbiology. (Manuscript submitted).
M. Farhad1, M. Phillips1, S. Moore1 and K. Kailasapathy1 (2010). Studies on interaction
between characteristics of probiotic bacteria with oxidative stress. Food Research
International (Manuscript under preparation).

vi
Conference presentations
Mariam Farhad 1, M. Phillips1 and K. Kailasapathy1 (2009).Effects of oxidative stress on
viability and selected characteristics of probiotic bacteria. III International Conference on
Environmental, Industrial and Applied Microbiology (Biomicrobial world 2009), Lisbon
(Portugal), 2-4 December 2009 (Oral presentation).
Mariam Farhad 1, M. Phillips1 and K. Kailasapathy1 (2010). Physiological, Biochemical and
molecular studies on oxidative stress in probiotic bacteria. International Scientific
conference on Probiotics and Prebiotics, 15th-17th June 2010 Kosice, Slovakia (Oral
Presentation).
M. Farhad, M. Phillip and K. Kailasapathy (2009). Physiological,biochemical & molecular
studies of oxidative stress in probiotic bacteria. 8th Australian peptide confrence, 11th-16th
October, 2009. South Stradbroke Island, Australia (Poster presentation).

vii
Table of Contents
Statement of Authentication.................................................................................................... i
Acknowledgements............................................................................................... ……….... ii
Abstract............................................................................................................................ .iii
List of Publications ............................................................................................................... iii
Conference presentations………………………………………………………………...vi
List of Figures....................................................................................................................... viii
List of Tables..................................................................................................... ................. xiii
List of Abbreviations ........................................................................................... ……….. ..xiv
Chapter 1
1.1 Introduction…………………………………………………….……………………...1
1.2 Aim………………………………………………………………………………........5
1.3 Objectives……………………………………………………………………….…….5
1.4 Justification of the study….………………………………..……………………..…...6
1.5 Thesis overview…………………………………………………………………….....7
1.6 Review of the literature………………………………………………….…………....8
1.6.1 Probiotics…................................................................................................................8
1.6.2 The role of probiotic bacteria in human health……………………………….........21
1.6.3 Oxidative stress on probiotic bacteria…………………………...............................24
1.6.4 Molecular basis of oxidative stress………………………………………………...31
1.6.5 Causes of oxidative stress……………………………………………..……….…..34
1.6.6 Oxidation of proteins……………………………………………………………....36
1.6.7 Oxidative stress and genetic responses……………………………...............…......36
1.6.8 Protection against oxidative stress…………………………….……………..….....38
1.6.9 The viability of Probiotic bacteria as affected by oxygen………………………....39
1.6.10 Adaptive evolution of stress response proteins………………………...................42
1.6.11 Mechanism of oxidative stress on membrane functions………….…....................43
1.6.12 Stress response to Cell Membrane………………………………………..............46
1.6.13 Proteomic study of probiotic Bacteria under oxidative stress……….....................47

viii
1.6.14 Separation techniques in proteomics………………………………………….......52
1.6.15 Analysis of proteins………………………………………………………….…....57
1.6.16 Protein identification………………………………………………….………......62
1.6.17 Peptide mass fingerprinting (PMF)………………………..………………….…..63
1.6.18 Characteristics of probiotic bacteria……………………………………………....64
1.6.19 Protective effect of microencapsulation on oxidative stress in selected probiotic
strains……………………………………………………………………….………….....67
Chapter 2 Material and methods…………………………………………………........75
2.1 Probiotic strains and growth…………………………………………….………...…76
2.2 Media, stock solutions, buffers and reagents………………………………………...76
2.3 Analytical instrumentation…………………………………………………………...83
2.4 Microbiological Methods…………………………………….....................................91
2.5 Proteomic analysis……………………………………………………………..….....94
Chapter 3 Screening and viability of probiotic bacteria under oxidative
stress………………………………………………………………………..……….…..101
3.1 Abstract…………………………………………………………..............................102
3.2 Introduction………………………………………………………………..………..103
3.3 Aims and objectives……………………………………………………………..….106
3.4 Materials and methods……………………………………………………………...106
3.4.1 Probiotic strains and growth……………………………………..……………......108
3.4.2 Determination of RBGR………………………………………………..………....108
3.4.3 Selection and maintenance of organisms…………….............................................110
3.4.4 Growth curves……………………………………………………………..............110
3.4.5 Preparation of culture for LSCM………………………………………………….110
3.5 Results and Discussion…………………………………..……………………….…111
3.6 Conclusion……………………………………………………………….………....125

ix
Chapter 4 Proteome responses of Lactobacillus casei Lc1 and Lactobacillus rhamnosus
DR20 under oxidative stress………………………………………………….…….… 126 4.1 Abstract…………………………………………………….…………………..........127
4.2 Introduction……………………………………………………………….………....128
4.3 Aim and objectives……………………………………………………….……….…129
4.4 Methods of proteome analysis…………………………………………..…………...130
4.4.1 Growth of microorganisms …………………………………………………….….130
4. 4. 2 Extraction of proteins….........................................................................................130
4.4.3 Conductivity and pH measurements……………………….…...............................131
4.4.4 Reduction and alkylation………………………………………………………….131
4.4.5 Protein quantitation………………………………..……………………………....131
4.5 Two-dimensional gel electrophoresis (2-DE)……………………………………….132
4.5.1 (1st
dimensional: iso-electric Focusing, IEF)………………………………..……..132
4.5.2 Sodium Dodecyl Sulphate Polyacrylamide Gel Electrophoresis………….……....132
4. 5. 3 Fixing, staining and destaining……………………………………………….…..133
4. 5. 4 Protein spot visualisation and data acquisition……………………………..….…133
4.5.5 Image analysis……………………………………………………………..…….....134
4.5.6 Protein identification by MALDI MS/MS analysis……………………….…..…...135
4.6 Results and Discussion……………………………………………………..…...……137
4.6.1 1D SDS PAGE analysis…………………………………………………………..137
4.6.2 Two-dimensional electrophoresis (2-DE) analysis……………………..…..….….139
4.6.3 Detection and analysis of protein spots………………………………….….…….141
4.6.4 Image Analysis…………………………………………………………….….…..147
4.6.5 Identification of proteins using MALDI mass spectra
analysis………………………………………………………………….………….…...157
4.7 Key achievements…………………………………………………..………….…...163
4.8 Conclusion……………………………………………………………….………....165

x
Chapter 5 Studies on the effect of oxidative stress on Bifidobacterium infantis B1912: a
proteomic approach……………………………………………………….......…….166
5.1 Abstract …………………………………………………………………………….167
5.2 Introduction………………………………………………………………………....168
5.3 Material and methods…………………………………………………....................171
5.4 Results and discussions…………………………………………………………….176
5.4.1 1D SDS PAGE analysis……………………………………………………….....176
5.4.2 Two-dimensional electrophoresis analysis………………………….…………....177
5.4.3 Detection and analysis of Protein Spots and Image Analysis…………………....177
5.4.4 Image Analysis……………………………………………………………….…..185
5.4.5 Identification of proteins using MALDI-TOF/TOF (or MALDI MS/MS) mass
Spectraanalysis………………………………………………………….…………..…..188
5.5 Key achievements……………………………………………….…….…………….191
5.6 Conclusion……………………………………………………..……..…………..…193
Chapter 6 Effects of oxidative stress in probiotic bacterial characteristics..............194
6.1 Abstract………………………………………………………………….………..…195
6.2 Introduction……………………………………………………………………….....196
6.3 Materials and methods………………………………………………….…………...199
6.3.1. Microorganisms and growth conditions…………………………..........................209
6.3.2. Acid tolerance………………………………………………………….................200
6.3.3 Bile tolerance.…………………………………………………………………......200
6.3.4 Hydrophobicity assays………………………………………………….................202
6.3.5 Auto aggregation and aggregation assay…………………………………….…....203
6.4 Results and Discussion………………………………………………………….......204
6.4.1 Acid tolerance…………………………………………………….…………….....204
6.4.2. Bile salts tolerance………………………………………...……………...............204
6.4.3 Hydrophobicity assay……………………………………………….…..………...212
6.4.4 Auto aggregation assay……………………………………………….……….…..212
6.4.5 Coaggregation assay……………………………………….……….....…….….....215
6.5 Conclusion…………………………………………………………..……................217

xi
Chapter 7 Protective effect of microencapsulation on oxidative stress in selected probiotic
strains………………………………………………..……………..……………….......218
7.1 Abstract…………………………………………………………………………......219
7.2 Introduction…………………………………………………………..……...……...220
7.3 Aim and Objectives…………………………………………………….……….......221
7.4 Materials and Methods……………………………………………………...............222
7.4.1 Preparation of Micro-organisms and media…………………………………..…..222
7.4.2 Preparation of encapsulated bacteria………………………………………..…....223
7.4.3 Survival of encapsulated probiotic bacteria under aerobic conditions …………...224
7.4.4 Release of entrapped cells…………………………………………........................224
7.4.5 Enumeration of cell counts…………………………………………......................225
7.4.6 Experiments control…………………………………………….……….......….....225
7.4.7 Determination of bead size…………………………………………………..........225
7.5 Results and discussion……………………………………………………….……...227
7.6 Conclusions…............................................................................................................232
Chapter 8……………………………………………………………..………………..233
8.1 Overall conclusion…………………………………………..……………………...233
8.2 Future directions…………………………………………………..………………..236
References…………………………………………………………………………..…238

xii
List of Tables Table 1.1 The list of species (by alphabetical order) of the genera Lactobacillus and
Bifidobacterium isolated from human sources (Gomes and Malcata, 1999). 10
Table 1.2 The role of probiotic bacteria for the improvement and prevention of diseases
(Ouwehand et al., 2003). 24
Table 1.3 The enzymetic reaction utilizing oxygen in lactic acid bacteria and respective
catalytic enzymes (Adapted from Condon, 1987). 35
Table 1.4 Commonly used MALDI matrices for analysis of peptides and proteins………60
Table 1.5 Comparison of different techniques used for encapsulating probiotic
microorganisms (Anal and Singh, 2007). 72
Table 3.1 RBGR of probiotic test strains. Results are a mean of nine readings. 112
Table 4.1 Summary of differentially expressed proteins by image analysis in L. casei Lc1 and
L. rhamnosus DR20 148
Table 4.2 Up regulated by more than 2 fold and down regulated by less than -2 fold in sample
A (Lactobacillus casei Lc1 with 0% oxygen) compared to sample B (Lactobacillus casei Lc1
with 21% oxygen). 149
Table 4.3 Up regulated by more than 2 fold and down regulated by less than -2 fold in sample
C (Lactobacillus rhamnosus DR20 with 0% oxygen) compared to sample D (Lactobacillus
rhamnosus DR20 with 21% oxygen. 151
Table 4.4 Summary of the identified proteins by MALDI-TOF/TOF mass spectrometry analysis
from L. casei Lc1 and L. rhamnosus DR20 161
Table 5.1 Summary of differentially expressed proteins by image analysis 183

xiii
Table 5.2 Summary of the identified proteins by mass spectra analysis from bifidobacterium
infantis B1912 has shown in Table 5.2 below. 188
Table 6.1 Survival of Lactobacillus and Bifidobacterial strains in simulated gastric (acid) conditions
(for 3h incubation period)………………………………………….………………………...207
Table 6.2 Survival of Lactobacillus and Bifidobacterium strains in milk-yeast medium (for 3h
incubation period) with oxgall (ox bile extract)……………..…………………………….208
Table 7.1 Effect of encapsulation on oxygen toxicity of probiotic microorganisms in RSM
broth. 227

xiv
List of Figures
Figure 1.1 Some micrographic pictures of probiotic bacterias. (Cited from SciMAT Photo
Researchers, Inc). 11
Figure 1.2 Health benefits of probiotic bacteria (Adapted from Saarela et al., 2002)......22
Figure 1.3 Distribution of oxygen in the gastrointestinal tract and the site of Lactobacillus
spp. and Bifidobacterium spp. (Tannock, 2002; Kullak, 1997). ……………………… .26
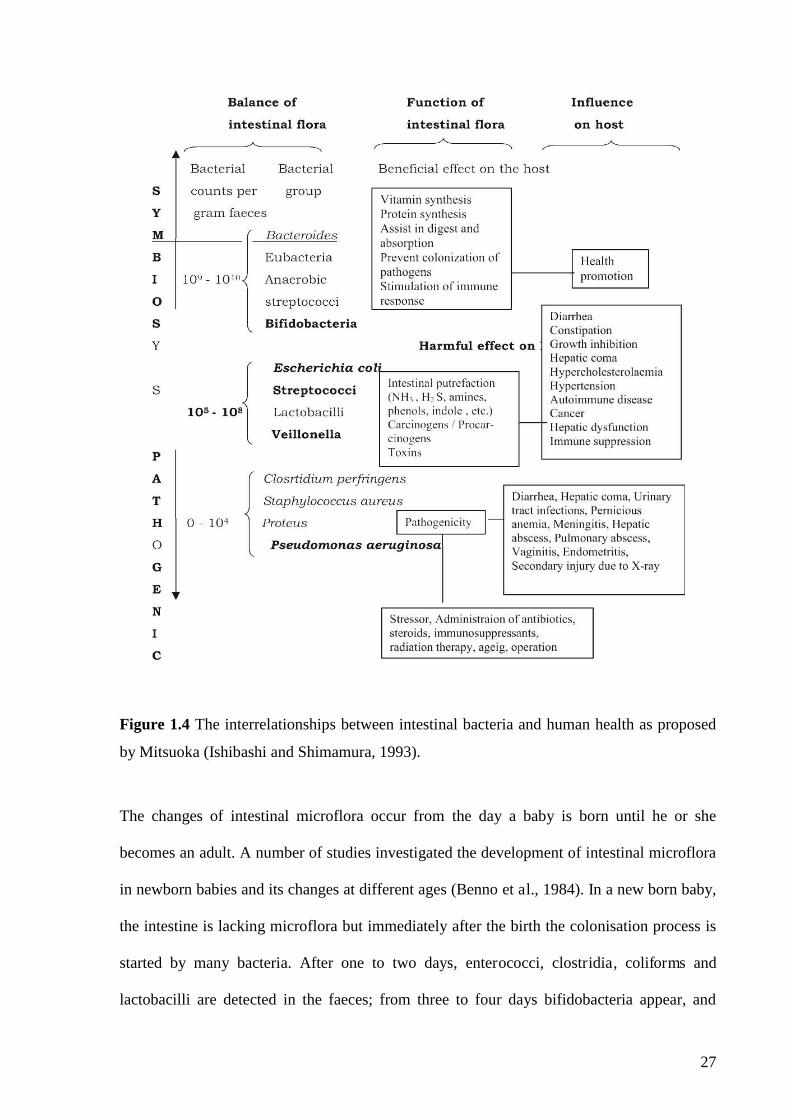
Figure 1.4 The interrelationship between intestinal bacteria and human health as proposed by
Mitsuoka (Ishibashi and Shimamura, 1993). 28
Figure 1.5 Schematic pathway of glucose metabolism in Lactococcus lactis. (Miyoshi et al.,
2003). 33
Figure 1.6 Basic principle of a confocal microscope (Leica Microsystems).………….45
Figure 1.7 Time-line indicating the convergence of different technologies and resources into
the proteomic process. Adapted from Patterson and Aebersold (2003) ……………......48
Figure 1.8 General Schemetic diagram on proteomics, (Garbis et al., 2005) 51
Figure 1.9 The two most common processes for quantitative proteome analysis from the cell
to the identified protein (Adapted from Patterson and Aebersold, 2003)……………….54
Figure 1.10 The principles of proteome analysis by 2-DE gels. 55
Figure 1.11 Incorporation of isotopes into proteins and their use in relative quantitation
(Adapted from Aebersold and Mann, 2003). …………………………………………...57
Figure 1.12 Schematic diagram of the process of encapsulation of bacteria by using extrusion
and emulsion techniques (Krasaekoopt et al., 2003)…………………………………...71

xv
Figure 2.1 Inotech Encapsulator ® (Inotech AG, Dottikon, Switzerland) was used in this
study. www.inotech.ch 83
Figure 2.2 Figure A: Deoxygenating of medium for the estimation of RBGR.
Figure B: Measuring of oxidative stress response in 21% oxygen. ………………….....85
Fig 2.3 DE gel electrophoresis system (Pharmacia biotech) 86
Figure 2.4 Gel imaging system (ProXPRESS, Perkin Elmer Life Sciences……….…....87
Figure 2.5 Spots significantly different (down or up regulated by 2-fold or more) in L.casei
Lc1 under 0% oxygen (sample A average) compared to L.casei Lc1 Under 21% oxygen
(sample B)………………………………………………………………………………..88
Figure 2.6 Matrix Assisted Laser Desorption Ionisation (MALDI) mass spectrometry was
performed with an Applied Biosystems 4700 Proteomics Analyser……………………89
Figure 2.7 Laser scanning confocal microscopy manufactured by Leica Microsystems, North
Ryde, Australia. 90
Figure 2.8 Survivability of encapsulated probiotic bacteria under oxidative stress (21% O2)
and non oxidative stress (0% O2) conditions. 93
Figure 2.9 Overview of experimental techniques used in proteomics-based analyses.....94
Figure 2.10 An illustration of the Bradford assay, used for measuring the total protein
concentration of a solution. Diagram obtained from www.proteomics.embl.de/..............98
Figure 2.11 Isoelectric focusing employs an immobilised pH gradient extending the length of
the gel strip. …………………………………………………………………………......99
Figure 3.1 Schematic diagram of relative bacterial growth ratio (RBGR). 108

xvi
Figure 3.2: 3.2A represents growth curves for L. casei Lc1 and 3.2B represents growth curves
for L.rhamnosus DR20. 114
Figure 3.3: 3.3C represents growth curves for B. infantis B1912 and 3.3D represents growth
curves fort B.lactis Bb12. 115
Figure 3.4 The survival rate of B. lactis Bb12 under oxidative stress (with 0% and 21%
oxygen) treatment. 117
Figure 3.5 The survival rate of B. infantis B1912 under oxidative stress (with 0% and 21%
oxygen treatment). 118
Figure 3.6 (A-D) The image of 3.6A represents L. casei Lc1 (control) while treated without
oxygen (0% O2) and the image of 3.6B represents L. casei Lc1 while treated with oxygen
(21% O2). Similarly, 3.6C represents L. rhamnosus DR20 (control) while treated without
oxygen (0% O2) and 3.6D represents of L. rhamnosus while DR20 treated with oxygen (21%
O2)……………………………………………………………………………………….120
Figure 3.7 Percentage of growth ratio for B. Infantis B1912 bacterial cells after treating with
21% oxygen at 37o C for 18 h compared with 0% oxygen treatment at the same temperature
using a Fluorescence Spectrophotometer. 121
Figure 3.8 Laser scanning confocal microscopic (LSCM) images for Bifidobacterium infantis
B1912 bacterial cells after treatment with 21% oxygen at 37o C for 18 h (Fig. 3.7F) and
compared with 0% oxygen treatment at the same temperature (Fig. 3.7E)…..........…...123
Figure 3.9 Percentage of growth ratio for B. lactis Bb12 bacterial cells after treating with 21%
oxygen at 37o C for 18 h compared with 0% oxygen treatment at the same temperature using a
Fluorescence Spectrophotometer. 126
Figure 4.1: SDS PAGE for serial diluted (2, 1, 0.5 and 0.25 µl) extracted proteins from
samples A (Lactobacillus casei Lc1 with 0% oxygen), B (Lactobacillus casei Lc1 with 21%
oxygen), C (Lactobacillus rhamnosus DR20 with 0% oxygen) and D (Lactobacillus
rhamnosus DR20 with 21% oxygen) 138

xvii
Figure 4.2 Identical triplicate two dimensional electrophoresis gels (Sample A1, A2, A3) of
A=Lactobacillus casei Lc1 grown under 0% oxygen. 141
Figure 4.3 Identical triplicate two dimensional electrophoresis gels (Sample B1, B2, B3) of
B=Lactobacillus casei Lc1 grown under 21% oxygen. 142
Figure 4.4 Protein spots down-regulated by 3 fold or greater in L. casei Lc1 (grown
under 21% oxygen). Protein spots up-regulated by 3 fold or greater in L. casei Lc1 (grown
under 21% oxygen). 143
Figure 4.5 Identical triplicate two dimensional electrophoresis gels (Sample B1, B2, B3) of
B=Lactobacillus casei Lc1 grown under 21% oxygen. 144
Figure 4.6 Identical triplicate two dimensional electrophoresis gels (Sample B1, B2, B3) of
B=Lactobacillus casei Lc1 grown under 21% oxygen. 145
Figure 4.7 Two spots for each protein were cut by ExQuest spot cutter from Sample A. The
position is shown 1.A01 (putative uncharacterized protein) and 1.A02…………….…153
Figure 4.8 Three spots for each protein were cut by ExQuest spot cutter from Sample B
(Lactobacillus casei Lc1 under 21% oxygen) at position 1.A03, 1.A04, 1.A05 (stress response
membrane GTPase), 1.A06 and 1.A07 (Predicted oxidoreductase)………………........154
Figure 4.9 Three spots were cut by ExQuest spot cutter from Sample C at position 1.A08. No
protein was found at position1.A08……………………………………………….…..155
Figure 4.10 Three spots for each protein were cut by ExQuest spot cutter from Sample C at
position 1.A09, 1.A10 and 1.A11 (pyruvate kinase)…………………………………..156
Figure 4.11 4A and 4.7B represents 3D view of protein spots up-regulated by 4 fold or
greater with the L. casei Lc1, compare of 0% O2 to 21% O2. 4.7C and 4.7D shows, 3D view of

xviii
protein spots up-regulated by 4 fold or greater with the L. rhamnosus, compare of 0% O2 to
21% O2. 157
Figure 5.1 Identified down-regulated protein spots in 2DE gel of Bifidobacterium infantis
B1912 grown under 0% oxidative stress at 37°C. Proteins were extracted from 24 h old
culture……………………………………………………………………………………178
Figure 5.2 Identical triplicate two dimensional electrophoresis gels (Sample E1, E2, E3) of
E=Bifidobactrium infantis B1912 grown under 0% oxygen at 37°C incubation. Proteins were
extracted from 24 h old culture. 179
Figure 5.3 Identical triplicate 2DE gels (Sample F1, F2, F3) of F=Bifidobactrium infantis
B1912 grown under 21% oxygen at 37°C incubation. Proteins were extracted from 24 h old
culture. 180
Figure 5.4 Identified up-regulated protein spots in 2DE gel of Bifidobacterium infantis B1912
grown under 21% oxidative stress for 24hrs at 37°C. 181
Figure 5.5 Zoom in image of the B. infantis B1912 spots in quadrant. Protein spots marked in
greens are up-regulated in the 21% oxygen treated samples while spots marked in pinks are
down-regulated. Proteins were extracted from 24 h old culture 182
Figure 5.6 Red and green boxes represents 3D view of protein spots up-regulated by 4 fold or
greater with the B. infantis B1912, compare of 0% O2 (control) to 21% O2 (treated)….185
Figure 7.1 Schematic diagram of microencapsulation process. 217
Figure 7.2 Principle of Encapsulation: Membrane barrier isolates cells from the host immune
system while allowing transport of metabolites and extracellular nutrients (Kailasapathy
2002)………………………………………………………………………………219
xix
List of Abbreviations
ASCC Australian Starter Culture Research Centre
CFU Colony Forming Units
2DGE two-dimentional gel electrophoresis
GIT Gastrointestinal tract
H2O2 hydrogen peroxide
IEF isoelectric focusing
LAB Lactic acid bacteria
MALDI (Matrix Assisted Laser Desorption Ionisation)
MRS de Man, Rogosa and Sharpe agar or broth
MS/MS Mass Spectrometry
MALDI Matrix Assisted Laser Desorption Ionisation
MW Molecular weight
NADH Nicotinamide
NGYC Non-fat skim milk, glucose, yeast extract and cysteine medium
PBS Phosphate buffered saline
pI isoelectric point
RPM rotations per minute
SpOx Spontaneous oxidative stress
RBGR Relative Bacterial Growth Ratio
SOD Superoxide dismutase
OD optical density
U Unit (s)

1
1.1 Introduction
Probiotic bacteria are live micro-organisms, when administered in adequate amounts, exert
beneficial health benefits to human who consumes them (Guarner and Schaafsma, 1998; Gill
and Guarner, 2004). Probiotics are known as live microbial food supplements that can
change the composition and the metabolic activities in the digestive system or can modulate
the activity of the immune system in a way that benefits health (Furrie, 2005). These
probiotic micro-organisms are single-celled, non-pathogenic organisms which do not
promote or cause disease. With an understanding of the probiotic nature of bacteria, many
different organisms have been identified to have probiotic characteristics. Most commonly
used probiotic supplements contain the species of Lactobacillus and Bifidobacteria and they
are the part of normal human intestinal microbiota (Dali and Davis, 1998; Salminen et al.,
1998; Senok et al., 2005).
Probiotic bacteria have been increasingly included into the dairy products such as yoghurts
and other fermented dairy protucts during the past two decades (Mattila-Sandholm et al.,
2002; Phillips et al., 2006). However, there is no generally agreed concentration of
probiotics to achieve maximum therapeutic benefits. Some researchers suggested that the
concentration of above 106 cfu/ mL-1 is minimum requirement to have a therapeutic effect
(Kurmann and Rasic, 1991), while other suggestsed a concentration of >107 or 108 cfu mL-1
is required to achieve satisfactory results (Davis et al., 1971; Ross et al., 2005; Jayamanne
and Adams, 2006). It has been suggested that the maintenance of the bacterial viability in the
probiotic product is the key to achieve maximum health benefits. However, the viability of
bacteria is significantly decreased during the processing of probiotic food (Shah et al., 1995).
For example, a number of market surveys reports on commercial yoghurts have clearly
demonstrated that the counts of L. acidophilus and Bifidobacterials cells are far below than

2
the recommended 106cfu/g at the expiry date of the yoghurt (Iwana et al., 1993). Several
factors may be responsible for the loss of viability of probiotic bacteria. The exposure to
oxygen or oxygen toxicity is considered as one of the major problems for the storage and
manufacture of probiotic products (De Vries and Stouthamer, 1969; Talwalkar and
Kailasapathy, 2004a). A number of studies have been conducted to consider ways to protect
probiotic bacteria from toxic oxygen effects. Their recommendations include introduction of
high oxygen consuming strains, the use of ascorbic acid in yoghurts (considered as an
oxygen scavenger), the use of microencapsulation technique and the use of new packaging
material less permeable to oxygen (Dave and Shah, 1997b) for the adaptation of oxidative
stress (Dave and Shah, 1997a; Talwalkar and Kailasapathy, 2004b; Bolduc et al., 2006).
Dairy products with improved viability of probiotic bacteria over the shelf-life are very
important to deliver adequate numbers of bacterial cells to maintain a healthy gut
environment in humans. Further, reduced oxygen content in the fermented dairy products,
such as in yoghurt, will increase the viability, reduce the incidence of mould attack and also
reduce post acidification. One of the key factors which control the bacterial viability is the
level of oxygen in the medium. Since most of probiotic bacteria are anaerobes, oxygen is
lethal for their growth and proliferation. However, the physiological mechanisms of
oxidative stress tolerance in probiotic bacteria are not well understood and physiological
mechanisms may provide vital information about oxidative stress tolerance in probiotic
bacteria.
To protect against the ROS (reactive oxygen species), three major oxidative defence
mechanism have been evolved which plays a key role in maintaining low ROS levels in
cellular organelles. Those three mechanisms are: (a) the preventing of ROS regeneration, (b)

3
the quenching of ROS; and (c) repair of the damage caused ROS (Skulachev, 1995). Much
of the damage is caused by hydroxyl radicals generated from H2O2 via Fenton reaction which
requires iron and a source of reducing agent such as nicotinamide adenine dinucleotide
(NADH) to regenerate the metal. A number of molecules such as antioxidant, NADPH
(nicotinamide adenine dinucleotide phosphate-oxidase) and NADH, ascorbate and
glutathione have been identified to have a ROS scavenging role (Cabiscol et al., 2000). In
addition, it has been identified that some enzyme systems play an important role in repairing
oxidative damage to molecules like DNA, RNA and enzymes such as protease and lipase. In
contrast, Endonuclease IV is identified to express by ROS and are involved in DNA repair
mechanism. However, the extent of damage caused to very important enzymes such as
protease and lipase is not known and they play an important role in terms of food quality
maintenance. Some organisms have been identified to have oxygen scavenging
characteristics e.g. Streptococcus thermophilus strain (Lourens-Hattingh and Viljoen, 2001).
Therefore, this organism helps to protect probiotics by scavenging excess oxygen (Ishibashi
and Shimamura, 1993).
Large numbers of stress induced proteins have been identified and most of them are heat
related stress proteins or molecular chaperones that maintain protein function or repair the
damage after cell injury. Molecular chaperones are involved in folding newly made proteins
as they are extruded from the ribosome. There are many different families of chaperones and
each family acts to aid protein folding in a different way although the molecular chaperone
proteins are among the most evolutionarily conserved proteins and have a ubiquitous
function in all repair processes (Rutherford and Lindquist, 1998). The study of the proteome
responses to oxidative stress on probiotics will provide key information which would lead to
the discovery of new key mechanisms. Dave and Shah (1997a) and Bolduc et al., (2006)

4
reported that oxygen may re-enter the dairy products during the storage in plastic cups so the
use of deaeration or electroreduction on dairy product (milk) will need additional packaging
for the product. More study is needed to obtain more data on this aspect.
So far, research on oxygen toxicity and its effect on the viability of probiotic bacteria have
been unreported. This is a vast unexplored area concerning the effect of oxygen toxicity on
the viability of probiotic bacteria and the role of certain proteins responsible for the viability
of probiotic bacteria in dairy products. All of those criteria regulate the concentration of
bacteria in dairy products and those are related to desirable market and health benefits.
Previously, some studies have been conducted on the basis of the viability of probiotic
bacteria, but not in relation to oxygen toxicity or protein content responsible for the viability
of probiotic bacteria. In this study, some additional techniques were used such as image
analysis and MALDI (Matrix Assisted Laser Desorption Ionisation) MS/MS or TOF/TOF
(mass spectra) analysis were used to detect and to identify the oxidative stress resistant
proteins and confocal microscope was used to detect the viable cells.
It is important to understand the detail, the interaction of oxygen with probiotic bacteria and
to devise and evaluate techniques that would prevent the viability losses of probiotic bacteria
in dairy product from oxygen toxicity. This would be useful in maintaining sufficient
concentration of probiotic bacteria (above 106 cfu mL-1) in dairy products, thereby meeting
regulatory standards, and assisting in the delivery of therapeutic benefits to consumers. In
addition, it is also important to establish the oxidative stress resistant probiotic bacterial
strains by evaluating their efficacy in different levels of oxygen.

5
1.2 Aim
The aim of this study was to screen probiotic bacteria on the basis of their oxidative stress
responses and to investigate the effects of oxygen stress on selected morphological,
physiological and cellular characteristics of probiotic bacteria.
1.3 Objectives
This study was planned to screen and investigate a number of selected probiotic bacterial
strains the on the basis of a number of objectives and those were described as follows:
To screen a number of selected probiotic bacterial strains for oxygen sensitivity
(oxidative stress) using the RBGR (Relative Bacterial Growth Ratio) method and colony
counts (cfu/ml).
To investigate the physiological basis of oxidative stress by identifying and
characterising the differentially expressed proteins present in bacterial strains using 2D-gel
electrophoresis, image analysis and (Matrix Assisted Laser Desorption Ionisation) MALDI
MS/MS (mass spectra) analysis.
To investigate the morphological responses to oxidative stress on probiotic bacteria using
confocal scanning laser microscopy.
To investigate the correlation between oxidative resistance and probiotic characteristics
such as acid and bile tolerance, hydrophobicity assay, and adherence assay.
To study on the effects of microencapsulation technique on probiotic bacteria for their
viability in aerobic and anaerobic conditions.

6
1.4 Justification of the study
The present study investigated the ―effect of oxidative stress on viability and selected
characteristics of probiotic bacteria‖. From this study a number of probiotic strains were
found to be active after the completion of oxygen treatments. One of the pioneer
achievements was the discovery of new proteins responsible for the survivability of bacteria
in a high oxygen environment. To date, the investigation of oxidative stress and its adverse
effects on the viability of probiotic bacteria remained unreported and the mechanism of
viability of anaerobic organisms (in dairy products) in aerobic or oxygenic atmosphere
remained unexplained. In addition, other techniques such as stress adaptation and
microencapsulation have been studied as general protection of probiotic bacteria against
unfavourable environment but not in relation to oxygen toxicity. Therefore it is clear that there is a need to carefully study the interaction between anaerobic
probiotic bacteria and oxygen and to introduce new techniques which can prevent probiotic
bacteria in dairy products (e.g. yoghurt) from the undesirable toxicity of environmental
oxygen. The experimental outcome of the present study will help the dairy industry to
maintain required cell concentrations of probiotic bacteria in dairy products to meet the
standard cell concentration requirement and will assist in the delivery of the maximum
therapeutic benefits to consumers.
This study is very important to develop dairy product with a higher bacterial concentration
and a longer shelf life. This study will also provide new vital information about the stress
protein responsible for the survivability of bacteria in oxygen environments and this
information will provide new clues for further development of fermented and health based
dairy products.
7
1.5 Thesis overview
This thesis consists of a literature review and seven chapters (Chapter 2-8). The literature
review presents an overview of probiotics, oxidative stress, oxidative defence mechanism
and an evaluation of oxidative stress proteins,
Chapter 2 describes the materials and methods of the study.
Chapter 3 describes the selection of probiotic bacteria using a modified and successful
methodology called the Relative Bacterial Growth Ratio (RBGR) to obtain a quantitative
index of the oxygen tolerance of several probiotic strains including L. acidophilus and
Bifidobacterium spp. A detailed study about the various biochemical oxidative responses of
L. acidophilus and Bifidobacterium spp. when grown in different concentrations of oxygen
such as 0 or 21% oxygen was conducted.
Chapter 4 and 5 dealt with the physiological proteome responses of Lactobacillus and
Bifidobacteria due to oxidative stress. Advanced techniques were used, such as a two-
dimensional gel electrophoresis, image analysis and MALDI (Matrix Assisted Laser
Desorption Ionisation) mass spectra analysis for the identification of new differentially
expressed proteins present in these strains due to oxygen exposure.
Chapter 6 describes a detailed study of biochemical changes in characteristics of
Lactobacillus and Bifidobacteria under aerobic (0%) and anaerobic (21%) conditions. Such a
biochemical characterization of various probiotic bacteria will help in the selection of robust
strains which are able to survive adequately in yoghurts and other dairy products throughout
their shelf life. At the end of this thesis, Section 7 provides a brief conclusion of this study
while Section 8 provides future directions for further research.

8
1.6 Review of the literature
1.6.1 Probiotics
1.6.1.1 What are probiotic bacteria?
The word ‗probiotics‘ originally comes from the Greek word means ‗for life‘. However, the
meaning of probiotics has been evolving over time. Earlier, the term ‗probiotics‘ was applied
to describe as ―organisms and substances that contribute to intestinal microbial balance‖ But
this general definition was then revised by Fuller (1989) to be more precise and he defined
probiotics as ‗a live microbial feed supplement that beneficially affects the host animal by
improving its intestinal microbial balance‘. In 1999, Naidu et al. described probiotic bacteria
as ―a microbial dietary adjuvant that beneficially affects the host physiology by modulating
mucosal and systemic immunity, as well as improving nutritional and microbial balance in
the intestinal tract‖. Schrezenmeir and Vrese (2001) further revised and defined the term as
―a preparation of a product containing viable micro organisms in sufficient numbers, which
alter the microflora (by implantation or colonization) in a compartment of the host and by
that exert beneficial health effects on the host‖.
1.6.1.2 Definition of probiotics
Probiotic bacteria can be defined as live microorganisms which, when administered in
adequate amounts, exert beneficial health benefits on the host (Guarner and Schaafsma,
1998; FAO/WHO, 2001). Probiotics are also defined as live microbial food supplements that
can change the composition and the metabolic activities of the microbiota in the digestive
system or can modulate the reactivity of the immune system in a way that benefits health
(Furrie, 2005; Adams and Moss, 2008). These microorganisms are single celled non-
pathogenic organisms which do not promote or cause disease. With understanding of the

9
probiotic nature of bacteria, many different organisms have been identified and used as
probiotics. Most commonly used probiotic supplements contain Lactobacillus acidophilus
and Bifidobacterium which are part of the normal intestinal microbiota, exert beneficial
influence on health and nutrition when consumed (Dali and Davis., 1998; Salminen et al.,
1998). Lactobacillus acidophilus, L. casei, B. bifidum, B. longum and Saccharomyces
boulardii are frequently used as probiotics food supplements for human consumption
(Playne, 1994), although other bacterial species are also recognised as probiotics. Table (1.1)
represents a list of probiotic species isolated from human sources.
Due to their contribution to health benefits, probiotic bacteria have been increasingly
included in dairy products such as yoghurts and fermented milks during the past two decades
(Mattila-Sandholm et al., 2002). Foods containing probiotics are used in many countries
although their survival in foods is doubtful since some of the probiotic strains are extremely
sensitive to a series of factors. There is no general agreement on the cell concentration of
probiotics to achieve therapeutic benefits. Some researchers suggest cell concentration levels
above 106 cfu mL-1(Kurmann and Rasic, 1991), while other suggests >107 and 108 cfu mL-1
as satisfactory levels (Davis et al., 1971; Kailasapathy and Rybka, 1997; Kailasapathy et al.,
2008).

10
Table 1.1 A list of species (placed in alphabetical order) belongs to genera of Lactobacillus
and Bifidobacterium isolated from human sources (Gomes and Malcata, 1999).

11
Figure 1.1 Some micrographic pictures of probiotic bacterias. (Cited from SciMAT Photo
Researchers, Inc. 2005).
Studies however have shown that low viability of probiotics in market preparations (Shah et
al., 1995). Some market surveys on commercial yoghurts have found the counts of L.
acidophilus and Bifidobacteria are far below the recommended 106cfu/g at the expiry date of
the yoghurt (Iwana et al., 1993; Anonymous 1999). Dairy product with improved viability of
probiotic bacteria over the shelf-life is very important to deliver adequate numbers of
bacterial cells and to maintain a healthy gut environment in human. Reduced oxygen content
in the fermented product such as yoghurt will increase the viability, reduce the incidence of
mould attack and also reduce post acidification. In addition, fermentation of yoghurt in a
sealed tub can minimise oxygen ingress into the yoghurt and enhance the shelf-life and
protect the product from spoilage organisms. Str. thermophilus spp. can protect probiotic
bacteria by consuming high oxygen content (Lourens-Hattingh and Viljoen, 2001). This
particular strain (Str. thermophilus) relies heavily on oxygen for its own metabolic activities
so that it can act as an effective oxygen scavenger by its consumption of the dissolved
oxygen in yoghurt. Therefore, it can protect oxygen sensitive Bifidobacteria from the
exposure of oxygen by scavenging oxygen content (Ishibashi and Shimamura, 1993).
However, Str. thermophilus strains are found as fast acidifying strains and when they are

12
used commercially it can lead to a rapid accumulation of acid in the growth medium. As both
Bifidobacteria and L. acidophilus are sensitive to high acidity it can cause negative impact
on the viability of probiotic bacteria. Among many factors responsible, cell death due to
oxygen exposure is of critical importance (Brunner et al 1993; Dave and Shah, 1997b).
Many micro-organisms including Lactobacilli and Bifidobacteria are derived from the
human gut where an anoxic environment prevails. Consequently, these organisms are not
adapted to oxygen containing environments and the exposure to oxygen results in cell death.
So this project aims to identify and to characterize a number of oxygen tolerant probiotic
bacteria that are commonly used in the dairy industry. Therefore it will be possible to
increase the viability of probiotic bacteria and also will be possible to increase the shelf life
of probiotic dairy products by minimising the bacterial cell death from the exposure of
oxygen during the storage.
1.6.1.3 Lactobacilli
Lactobacillus is a generic name and it belongs to the phylum Firmicutes, class Bacilli, order
Lactobacillales and family Lactobacillaceae (Lebeer et al., 2008). Lactic acid bacteria, or
LAB, represents a large heterogeneous group which includes a number of species (Pfeiler et
al., 2007; Lebeer et al., 2008). LAB is derived from many sources, such as the
gastrointestinal tracts of humans and animals, in plant materials and in sewage (Brandt et al.,
2001). The common metabolic end product for LAB is lactic acid and it is non sporulating
Gram positive, non-flagellated rods coccobacilli (Lebeer et al., 2008). Most of the Lactic
acid bacteria are strictly anaerobic while some species are aerotolerant and can utilize
oxygen through the enzyme called flavoprotein oxidase. For optimum growth, LAB requires
a pH at 5.5-5.8 and the nutritional requirements for LAB are amino acids, peptides,
nucleotide bases, fatty acids, carbohydrates vitamins and minerals (Axelsson, 2004). The GI

13
tracts of human and animals harbour complex microbial communities which are comprised
of hundreds of bacterial species (Tannock, 1995). The analysis of bacterial communities
depends on the bacteriological culture methods and microscopy. Currently, not all bacterial
species can be cultured (O'Sullivan, 1999). The identification of Lactobacillus bacterial
isolation at species and strain level are difficult as well as time consuming, but the bacteria
can be cultured easily (Brandt et al., 2001). The heat adapted cells of L. paracasei showed
increased tolerance against spray drying otherwise it could cause substantial loss of viability.
It has been reported that the viability of lyophilization (freeze-drying) of Lactobacillus
delbrüeckii (subsp. lactis) on lyophilization (freeze-drying) condition considerably increased
after osmotic or heat stress (Koch et al., 2007). Similar problems have been found for L.
rhamnosus species. The strains of this particular species are frequently used as starter and
probiotic cultures, particularly in the dairy industry.
1.6.1.3.1 LAB probiotic species
Some Lactobacillus species are known as probiotic LAB species These include L.
acidophilus, L. casei, L. plantarum, L. brevis, L. reuteri and L. rhamnosus, (Brandt et al.,
2001). LAB represents a very diverse group of bacteria. Currently, on the basis of bacterial
taxonomy, it is believed that LAB consists of a number of bacterial genera, such as
Aerococcus, Carnobacterium, Enterococcus, Lactobacillus, Lactococcus, Leuconostoc,
Oenococcus, Pediococcus, Streptococcus, Tetragenococcus and Vagococcus (Brandt et al.,
2001).
1.6.1.3.2 Sources
LAB is one of the most diverse species of bacteria and they occupy many areas including the
gastrointestinal tract of human and animals, milk, plants, meats and grains (Brandt et al.,

14
2001; Pfeiler et al., 2007). Every human being is exposed to lactic acid bacteria (LAB) on a
daily basis. People from birth, are exposed to this species through the environment and food
intake. On the basis of their physiological activities, the genus is divided into three groups:
(1) homo fermentative (it produces more than 85% lactic acid from glucose), (2) facultative
heterofermentative (it produces only 50% lactic acid and considerable amounts of carbon
dioxide, ethanol and acetic acid) and, (3) obligate heterofermentative (it produces carbon
dioxide, DL-lactic acid and acetic acid) (Slover and Danziger, 2008).
1.6.1.3.3 The protective role of Lactobacilli
Lactobacilli are widely found in nature and many of these species have been found to be
effective in the food industry and its therapeutic role is also widely demonstrated. The
conversion capability of lactobacilli from lactose to lactic acid is used for the successful
treatment of lactose intolerance. These organisms inhibits the growth of other harmful
putrefactive microorganisms by lowering the pH of the intestinal environment and by
producing of bacteriocins and other toxic metabolic products such as hydrogen peroxide
(H2O2), carbon dioxide (CO2) and diacetyl (Ouwehand and Vesterlund, 2004).
H2O2: H2O2 can act as strong oxidizing agent and causes effects on the bacterial cell. Some
of the reactions produced by H2O2 scavenge oxygen to create anaerobic environment that is
uncomfortable for some other organisms. A number of studies suggested that the production
of H2O2 is also an important factor for the colonization of lactobacilli in the urogenital tract.
It has been reported that the colonization of lactobacilli decreases infection, gonorrhoea,
acquisition of human immune deficiency virus (or HIV virus) and urinary tract infections
(Fontaine et al., 1996).
CO2: The formation of CO2 means the creation of an anaerobic environment and CO2 has its
own antimicrobial activity (Ouwehand and Vesterlund, 2004).

15
Diacetyl: Diacetyl is believed to obstructs the formation of arginine-binding protein in Gram
negative bacteria and thus interfere with the utilization of this amino acid.
Bacteriocins: Some of the strains of Lactobacillus have been found to produce bacteriocins
such as L. casei, L. helveticus, L. delbrueckii, L. lactis, L. plantarum, L. johnsonii, L. sake
and L. curvatus (Ouwehand and Vesterlund, 2004). Another important example is the
conversion of Str. Thermophilus from pathogenic Streptococcus species through a series of
losses and decay of virulence-associated genes which are involved in a metabolic resistance
and adhesion process (Pfeiler et al., 2007).
Genomic sequencing is used for the determination of evolution and divergence. Archaea and
Proteobacteria (Snel et al, 2002) reported that the reduction of genome was a trend during
the evaluation process of bacteria. The divergence of LAB emerged, after the loss of 600-
1200 genes from its ancestor (Makarova and Koonin. 2006). LAB and some of these lost
genes are responsible for encoding biosynthetic enzymes, and other lost genes are believed to
be acting as a contributor to sporulation and seems to be unnecessary in nutritional food
environment (Pfeiler et al., 2007). Besides the consequence of gene losses, more recent
studies report the alternation of the shapes of this species including parallel losses of genes
causes various metabolic processes.
1.6.1.3.4 Lactobacillus casei Lc1
Lactobacillus casei is an industrially important lactic acid bacterium and facultative, Gram-
positive, anaerobic, non-motile, non-spore-forming and rod-shaped. The cell size ranges
from 0.7 to1.1 micrometer wide and 2.0 to 4.0 micrometer long. It also possesses other
normal characteristics of LAB such as acid tolerance, cannot synthesize porphyrins and have
a strictly fermentative metabolism with lactic acid, which is a major metabolic end product
(Kandler and Weiss, 1986; Axelsson, 1998). It has been used worldwide for manufacturing

16
of milk and other dairy products (Tuomola and Salminen., 1998; Lee et al., 2005; Bamforth
2005; Phillips et al., 2006). Four subspecies of L. casei have been recognized and published
in the 9th edition of Bergey‘s Manual of Systematic Microbiology: (i) L. casei subsp. casei,
(ii) L. casei subsp. pseudoplantarum, (iii) L. casei subsp. rhamnosus, and (iv) L. casei subsp.
tolerans (Kandler and Weiss, 1986).
In recent years, Lactobacillus casei has attracted a significant interest as a probiotic bacteria
(Mercenier et al., 2003; Oozeer et al., 2005) and the strain L. casei DN-114 001 has been
found to alleviate acute diarrhoea in children (Pedone et al., 1999), to modulate the
production of pro-inflammatory cytokines in Crohn‘s disease (Borruel et al., 2002) and to
increase immune capability during bacterial gastrointestinal transit (Oozeer et al., 2005).
1.6.1.3.5 Lactobacillus rhamnosus DR20
The probiotic strain Lactobacillus rhamnosus DR20, also known as Lactobacillus rhamnosus
HN001 was characterized by a polyphasic approach using microbiological and molecular
biological methods (Klaenhammer et al., 2002; Prasad et al., 2003). Some studies were
conducted for the characterisation of this strain; its ability to with stand bile and acid and the
ability to adhere to human intestinal epithelial cells (Prasad et al, 1999; Gopal et al., 2001).
Another study concluded that L. rhamnosus HN001 has a capacity to enhance immunity in
healthy mice (Gill et al., 2000; Prasad et al., 2003). It has been found that pretreated with
acid, L. collinoides showed 30 fold lower survival rate after heat stress compared to non
adapted cells. The results indicated that acid stress can not increase the thermo tolerance
capacity of these bacteria (Laplace et al., 1999). Sub lethal stress such as heat or osmotic
stress with L. rhamnosus HN001 increase the storage stability the longest (Prasad et al.,
2003). The storage stability of L. rhamnosus HN001 was substantially increased after a sub

17
lethal stress such as heat or osmotic stress. The largest increase was observed after having
sub lethal heat stress during stationary phase with the same bacteria (Prasad et al., 2003).
1.6.1.4 Bifidobacteria
Bifidobacteria are natural and intestinal microflora of human and animal origin and they
represents 99% of intestinal microflora in the gastrointestinal tracts of new born babies for
the first few days after the birth (Sidarenka et al., 2008). At first Bifidobacteria was named
as Bacillus bifidus and initially it was found by Tissier (1900) at the Institut Pasteur in Paris,
who isolated the bacteria from the faeces of breast-fed infants (Doleyres and Lacroix, 2006).
During its first edition, in 1923 the Bergey‘s Manual of Determinative Bacteriology
primarily introduced the name Lactobacillus bifidus (Bergey et al., 1923). A year later Orla-
Jensen proposed the name Bifidobacterium as an independent genus (Orla-Jensens, 1924).
Again, in 1968 after a series of investigations, De Vries and Stouthamer demonstrated the
presence of fructose-6-phosphate phosphoketolase (F6PPk) in Bifidobacteria and the
absence of aldolase and glucose-6-phosphatase dehydrogenase, but the last two enzymes
were found in Lactobacilli. Later (in 1974), Bifidobacteria was accepted as an independent
genus and it is reflected in the eighth edition of Bergey‘s Manual of Determinative
Bacteriology (Buchanan and Gibbons, 1974).
Characteristically, Bifidobacterium is a non-sporing, non-motile, non-filamentous and
anaerobic and Gram positive bacterium and has a rod like shape that tends to be clubbed with
a branch to form a ‗y‘ shape. Various strains of Bifidobacteria can tolerate oxygen in the
presence of carbon dioxide (Tannock, 2002). Normally Bifidobacteria are found in the GI
tract of humans and animals. Currently, there are 30 species that have been included in the
genus Bifidobacterium; among them 10 species from human sources and 17 species from

18
intestinal tracts of animal or their rumen. Six species from human origins have been used in
dairy products such as B. adolescentis, B. breve, B. bifidum, B. lactis, B. infantis and B.
longum (Boylston et al., 2004). Because of its metabolic capabilities, the Bifidobacteria are
often included in the lactic acid bacteria (LAB) family, although they are phylogenetically
distinct with a high G + C (42%-67%) content and belong to the family of Actinomycetaceae
(Klein et al., 1998). To develop a successful food product containing Bifidobacteria, it is
important to understand the growth and characteristics of the organisms so that processing
conditions can be manipulated by optimizing their survival conditions.
Bifidobacteria are naturally obligative anaerobes with an optimum growth temperature of
37°C to 41°C. Some specific strains of Bifidobacteria including B. infantis, B. breve and B.
longum may have a mechanism to avoid the toxicity of oxygen by limiting their metabolic
activity and the production of acid under aerobic conditions (Shimamura et al., 1992). The
growth of Bifidobacteria depends on it species and on certain strains. The optimum pH for
the normal growth of Bifidobacteria is 6.5 to 7.0. The growth of Bifidobacteria is disturbed
or inhibited at pH below 5.0 or above 8.0. There are different metabolic and enzymatic
characteristics of Bifidobacteria, such as the presence of a specific enzyme (the fructose-6-
phosphate phosphoketolase (F6PPK)) in Bifidobacteria that separates it from Lactobacillus
(Doleyres, and Lacroix, 2005).
1.6.1.4.1 Bifidobacterium lactis Bb12
From a recent study with healthy children, it has been found that Bifidobacterium. lactis
Bb12 has the capacity to mediate a positive treatment against acute diarrhoea (Chouraqui et
al. 2004). Another study reported that B. lactis strain can enhance natural immune function
from dietary consumption (Arunachalam et al., 2000; Chiang et al., 2000).
19
1.6.1.4.2. Bifidobacterium infantis 1912
Talwalkar et al. (2004) demonstrated that B. infantis strain lose their maximum cell viability
when they passes through oxygen. They also added that they may have developed resistance;
this strain is able to survive in low oxygen in yoghurt throughout the self life of yoghurt.
.
While studying B. infantis, for the determination of the effect of oxygen on growth and the
formation main product (acetate, lactate, and formate) Talwalkar and Kailasapathy (2003a)
reported the occurrence of changes in metabolic responses to different levels of oxygen (such
as the ratio of lactate to acetate ratio in bacteria decreased with the increase of oxygen
percentage). They also added that the aerotolerance capacity differs in different strain of
Bifidobacteria, so that it is necessary to study the oxygen resistance activity in a particular
microorganism to be utilized and to investigate whether the resistance capacity may translate
into a change in carbohydrate metabolism (Ventura et al., 2006).

20
1.6.2 The role of probiotic bacteria in human health
1.6.2.2.1 Health benefits and therapeutic applications of probiotic bacteria
Probiotic bacteria are known to enhance the beneficial bacterial population in the human gut,
suppress pathogens, build up resistance against intestinal diseases, alleviate lactose
intolerance, prevent some forms of cancer, and modulate immunity (Olivares et al., 2006a)
and may lower serum cholesterol (Kailasapathy and Chin, 2000). They are also capable of
effects of intestinal anti-inflammation (Peran et al., 2005), and effective in the prevention of
allergic diseases (Furrie, 2005).The health benefits have largely come from consumption of
foods containing Acidophilus and Bifidobacterium spp.
Large number of dairy products has been supplemented with probiotic bacteria and,
particularly, yoghurt has been predominant. For these reasons, yoghurt and yoghurt drinks
have gained popularity among consumers around the world (Lourens-Hattingh and Viljoen,
2001; Mattila-Sandholm et al., 2002; Kailasapathy et al., 2008). Therefore, yoghurts and
yoghurt drinks are considered as good vectors for the delivery of probiotic bacteria to the
consumers. However, the inherent properties of yoghurt, such as high acidity, could cause
slow growth and low proteolytic activities and lead to reduced cell numbers of probiotic
bacteria. They also form supplement for functional foods and bio pharmaceutical (Olivares et
al., 2006b). Recently L. coryniformis, strain, CECT5711 was isolated from goat‘s milk and
L. gasseri, CECT5714 was isolated from human breast milk (Martin et al., 2005). These
bacteria have a long history of safe use as a human food supplement.The summary of health
benefits of probiotic bacteria illustrated in the following figure (Fig.1. 2).

21
Figure 1.2 Health benefits of probiotic bacteria (Adapted from Saarela et al., 2002).

22
1.6.2.2 Improve adhesion to intestinal mucus
Adhesion and colonization capacities to the mucosal surfaces seem to be protective
mechanisms of probiotics against pathogens through competition for binding sites, nutrients
and immune modulation (Ouwehand et al., 2002; Collado et al., 2005; Collado et al., 2007).
Also, adhesion is considered as a prerequisite for colonization (Beachey 1981; Collado et al.,
2007). A few studies reported the relationship between in vitro adhesion and in vivo
colonization (Cesena et al., 2001; Collado et al., 2007). Probiotic bacteria were found to
exert a protective effect against a number of diseases such as acute diarrhoea, rotavirus
diarrhoea, antibiotic-associated, diarrhoea, Helicobacter pylori infection and in a protective
role it alleviate the symptoms of gastrointestinal diseases such as irritable bowel syndrome
(Santosa et al., 2006; Gotteland et al., 2006; Collado et al., 2007) and they alleviate
symptoms of gastrointestinal diseases such as irritable bowel syndrome (Kajander et al.,
2005; Kim et al., 2005; Camilleri, 2006). Other health benefits of probiotic bacteria were
found in relation to pathogen infection and the stimulation of the immune system (Reid and
Hammond, 2005; Santosa et al., 2006) (Table 1.2). An increasing numbers of scientific
reports suggest beneficial effects of probiotic combinations on human health (Gionchetti et
al., 2005; Kajander et al., 2005).

23
Table 1.2 The role of probiotic bacteria for the improvement and prevention of diseases
(Ouwehand et al., 2003).

24
Currently the probiotic combinations with additional health benefits are being assessed
before proceeding to use in clinical studies. The well known probiotic combination that have
been investigated in the last few years is a combination of mixture of eight LAB species
(VSL#3) which is found to be effective in a number of human diseases (Kim et al., 2005;
Gionchetti et al., 2005; Camilleri, 2006). Only few reports are available on the adhesion
interactions of probiotic bacteria in the human intestinal mucus system (Ouwehand et al.,
2000).
1.6.2.3 Human gastrointestinal ecology
Probiotics are bacteria designed to maintain the natural balance of organisms in the human
body and are considered one of the key components of a healthy immune system. These
organisms enhance the population of beneficial bacteria in the human gut, suppress
pathogens and build up resistance against intestinal diseases, alleviate lactose intolerance,
prevents some forms of cancers, modulates immunity and may lower serum cholesterol
(Kailasapathy and Chin, 2000; Slover and Danziger, 2008).
The term "intestinal flora‖ or "microflora‖ was used to describe the entire population of
bacteria in the human intestine regardless their types and numbers. The most important parts
of the human GI tract inhabited by bacteria are the distal ileum and the entire colon. The
following Figure (Fig. 3) showed the distribution of oxygen in the gastrointestinal tract and
the site of Lactobacillus spp. and Bifidobacterium spp.

25
Figure 1.3 Distribution of oxygen in the gastrointestinal tract and the site of Lactobacillus
spp. and Bifidobacterium spp. (Tannock, 2002; Kullak, 1997).
Figure 1.3, represents the microbial colonization of the human gastrointestinal tract. The
intestinal flora (Figure 1.3) contains microbes with both positive and negative properties and
microbes with predominantly beneficial effects on the intestines and the entire organism
(Gibson and Roberfroid, 1995). The total intestinal flora consists of more than 100 trillion
viable bacteria and more than 100 different microbial species (Mitsuoka, 1982). Every single
Microaerophilic 2% -17% oxygen
≈ 104- 106 cfu/ml
Aerobic 21% oxygen ≈ 103 cfu/ml
Anaerobic 0.1% - 1% oxygen ≈ 1012 cfu/ml

26
bacterium in the intestinal flora has its own metabolism and, as a result, has an impact on its
environment. The total impact of the intestinal bacteria on their human host can be assessed
from the above figures (Kullak, 1997; Shah, 2007).
The human intestinal tract consists of a complex ecosystem of microorganisms. There are
more than 400 bacterial species that have been identified in human faeces from a single
subject (Finegold et al., 1977). In the large intestine, a comparatively higher bacterial
population was found and the maximum counts reaches up to 1012 cfu g -1. Considerably
lower counts was found in the small intestine (from 104–108 cfu g -1) whereas only 101-102
cfu g -1were found in the stomach, due to the lower pH value (Lourens-Hattingh and Viljoen,
2001; Hoier, 1992).
With the changing of ages in a human a gradual change of the intestinal flora profile occurs.
The third most common genus bifidobacteria decreased its majority in the gastrointestinal
tract. Bacteroides occupies 86% of the total population in the adult gut system, followed by
Eubacterium (Finegold et al., 1977). The infant type bifidobacteria, B. bifidum, are replaced
by the adult type bifidobacteria, B. longum and B. adolescentis. These changes may occur by
the influence of the intake of bifidogenic factors (Modler et al., 1990). The adult types of
bacteria are stable but at the middle age and older more changes occur again and again.
Bifidobacteria may decrease further when certain type of harmful bacteria increases (Benno
et al., 1984). A major decreased in bifidobacteria and the increase in Clostridiu perfringens,
causes diarrhoea in elderly people (Hoier, 1992). The following figure (Fig. 1.4) shows the
interrelationship between intestinal bacteria and human health.
27
Figure 1.4 The interrelationships between intestinal bacteria and human health as proposed
by Mitsuoka (Ishibashi and Shimamura, 1993).
The changes of intestinal microflora occur from the day a baby is born until he or she
becomes an adult. A number of studies investigated the development of intestinal microflora
in newborn babies and its changes at different ages (Benno et al., 1984). In a new born baby,
the intestine is lacking microflora but immediately after the birth the colonisation process is
started by many bacteria. After one to two days, enterococci, clostridia, coliforms and
lactobacilli are detected in the faeces; from three to four days bifidobacteria appear, and

28
around the 5th day it become predominant (Lourens-Hattingh and Viljoen, 2001). Day after
day, coliforms and other bacteria become restricted and decrease in response to the increase
in bifidobacteria. Breast fed infant faeces carries 1010– 1011 cfu/g -1 bifidobacteria which
represents 25% of the total intestinal bacteria (Modler et al., 1990). However, lactococci,
coliforms and enterococci represents less than 1% of total intestinal bacterial population,
while bacteroides, clostridia and other organisms are absent (Rasic, 1983).
1.6.3 Oxidative stress on probiotic bacteria
Oxidative stress has been defined as an imbalance between oxidants and antioxidants in
favour of the overall increase of reactive oxygen species in cellular levels (Klaunig and
Kamenduli., 2004). In other words Klaunig et al. reported that the formation of oxidative
stress may causes damage to critical cellular macromolecules including DNA, lipids, and
proteins (Klaunig et al., 1998). Oxidative stress, which includes bacterial responses to H2O2,
is also considered to induce adaptive responses in anaerobes. Oxidative stress (OS) is a
general term used to describe the steady state of oxidative damage in a cell, tissue, or organ
caused by the reactive oxygen species (ROS). This can affect a specific molecule or the
entire organism. Oxidative stress occurs in a cell or tissue when the concentrations of
reactive oxygen species (ROS) generate excessive amounts of antioxidant capability of that
cell (Sies, 1991; Storz and Hengge-Aronis, 2000). Reactive oxygen species, such as free
radicals and peroxides, represents a class of molecules that are derived from the metabolism
of oxygen and exist inherently in all aerobic organisms. Largely oxidative damage occurs
when anti-oxidative defence systems fail to neutralise the reactive oxygen species in cells or
organs (Sies, 1991). To protect against the ROS, three major oxidative defence mechanisms
have been investigated which plays a key role in maintaining low ROS levels in cellular
organelles. The mechanisms include: 1. Prevention of ROS regeneration, 2. quenching of

29
ROS; 3. Repair of the damage caused by ROS (Skulachev, 1995). However, some literature
supports probiotic organisms developing resistance to oxidative stress during regeneration
processes (development of new antioxidant or reduction of pro-oxidant), therefore it is
possible to develop an oxygen-tolerant cell from an oxygen-sensitive strain. Recently, it has
been reported that developing oxygen resistance is possible with a tolerant mutant of B.
longum by growing and monitoring these cells under a microaerobic atmosphere (Ahn et al.,
2001). One of the selection criteria of a good probiotic is the stability and endurance
throughout the shelf life storage period (Lee and Salminen, 1995). The oxygen susceptibility
of these probiotic bacteria is a major factor influencing this criterion. To overcome the
problem of low cell numbers in probiotic foods, it is essential that potential probiotic strains
be screened for their tolerance to oxygen.
1.6.4 Molecular basis of oxidative stress
Reactive oxygen species such as O2-, OH+ and H2O2 can react at molecular level with
cellular targets, such as proteins and nucleic acids. Among them O2- has a moderate level of
oxidizing capacity and it can attack different compounds such as ascorbate, catecholamines
and polyphenols, (Farr and Kogoma, 1991; Fridovich, 1998). Hydrogen peroxide may
oxidize protein cysteinyl residues result in inactivation of enzymes (Storz and Imlay, 1999).
In addition, it also react with cations, such as Fe2+ and Cu+, and keep increasing the
production of more OH+, through the Fenton reaction (Farr and Kogoma, 1991; Duwat et al.,
1995; Fridovich, 1998). OH- can act as a strong oxidant and it can attack most organic
compounds and can cause breakages of DNA strands and thus it causes a wide range of base
modifications in DNA (Czapski, 1984; Farr and Kogoma, 1991; Fridovich, 1998). More
damage can occur, such as peroxidation of membrane lipids and membrane protein

30
alterations; those affecting the permeability and osmo regulation in cells (Harley et al.,
1978).
Many effects of O2 are observed at the metabolic level. During the anaerobic conditions, L.
lactis has a fermentative metabolism by which it converts different types of carbohydrates
into lactic acid (Holt et al., 1994; Lopez de Felipe et al., 1998). In this instance, 2NADH
molecules (generated from the oxidation of glyceraldehyde-3-phosphate) are reoxidized to
coordinate the reduction process from pyruvate to lactic acid and the reaction is catalysed by
the action of lactate dehydrogenase (LDH). The ratio of NADH/NAD+ determine the
conversion process from homolactic acid to mixed-acid fermentation in L. lactis (Garrigues
et al., 1997). While in aerobic conditions, the increased expression and activities of NADH
oxidase and NADH peroxidase (Table 1.3) struggled with LDH for NADH molecules
(Murphy and Condon, 1984). Due to the earlier consequences, the production of lactic acid is
greatly reduced and glycolytic flux is moved towards the production of ethanol, acetone,
acetate, diacetyl and CO2 (mixed-fermentation). These changes occur by the catalytic action
of pyruvate dehydrogenase (PDH), pyruvate-formate lyase and α-acetolactate synthase
(Figure 1.5). In addition, those changes also lead to the formation of H2O2 and causes
reduction of the growth rate of L. lactis, and even its death. However the concentrations of
H2O2 at 0.2 mM inhibit the growth of this bacterium by 50% whereas concentrations at >1.15
mM, H2O2 can compromise cell viability (Anders et al., 1970; Duwat et al., 1999). NADH
peroxidase is a (Table 1.3 Fig. 1.5) contributory factor for the detoxification of cellular H2O2.
Its activity is low (10 to 30 times lower than that of NADH oxidase) and endogenous or
exogenous H2O2 increase the capacity to deal with the reactive oxygen species (Anders et al.,
1970; Condon, 1987).

31
Figure 1.5 Schematic pathway of glucose metabolism in Lactococcus lactis. Intermediate
and final glucose metabolism products are indicated by arrows. Catalytic enzymes are
abbreviated in bold (LDH: lactate dehydrogenase; PDH: pyruvate dehydrogenase; PFL:
pyruvate-formate lyase; α-ALS: α-acetolactate synthase) (Miyoshi et al., 2003).

32
1.6.5 Causes of oxidative stress
Bacterial stress means the physiological perturbation in bacteria caused by environmental
modifications (physical, chemical and nutritional). It can create many consequences,
including retardation of growth and bacterial cell death (Miyoshi et al., 2003; Farr and
Kogoma, 1991; Fridovich, 1998; Duwat et al., 1999). Oxidative stress also can cause other
damage to the bacterial cell, such as: i) disruptions in the metabolic pathway, ii) spontaneous
mutations, and iii) bacteriostatic and bactericidal effects (Berlett and Stadtman, 1997;
Fridovich, 1998).
Oxygen is unable to cause any damage to the bacterial cell by itself but during the metabolic
cellular processes, oxygen (O2) is partially reduced to water and the formation of reactive O2
species occurs; such as the superoxide anion radical (O2-), the hydroxyl radical (OH-), and
hydrogen peroxide (H2O2). These intermediate products are potentially high oxidizing agents
and responsible for bacterial cellular oxygen toxicity (Farr and Kogoma, 1991; Fridovich,
1998; Storz and Imlay, 1999).
Different experimental data and genomic analyses reveal that L. lactis, similar to E. coli and
B. subtilis, are equipped with different types of stress response mechanisms. A number of
genes and encoded proteins are identified. Those that participate in these mechanisms have
shown to contribute to the oxidative stress resistance process. In addition, the induction of
some of these genes are growth phase-dependent (exponential or stationary) and it is
believed that those genes and their products have multi-stress resistance capacity (Walker,
1996; Duwat et al., 2000). Under certain conditions, the microaerophilic-fermenting LAB
can tolerate and can use O2 (Condon, 1987). The consumption of O2 results in an alteration
redox state and the increase in NADH oxidase activity. The fermentation of sugar moves

33
towards mixed fermentation and O2 participates in the oxido-reduction steps from NADH to
NAD+. Due to the action of NADH oxidases, H2O2 released (Table 1.3; Condon, 1987).
Table 1.3 The enzymetic reaction utilizing oxygen in lactic acid bacteria and respective
catalytic enzymes (Adapted from Condon, 1987).
The formation of O2- may occur through the following reaction: NADH + 2O2 → NAD+ +
H+ + 2O2-; the reason is the flavin group of NADH oxidase performs single-electron transfer
and also two or four electrons can be transferred (Thomas and Pera, 1983; Imlay and
Fridovich, 1991). The formation of OH+ may occur during the Fenton reaction (H2O2 + Fe2+
+ H+ →OH+ + H2O + Fe3+) (Duwat et al., 1995) or may occur through spontaneous reactions
(O2- + H2O2 → OH- + OH+ + O2) (Condon, 1987).
NADH + H+ + O 2 NADH + H 2O2
NADH: H 2O2 oxidase
2NADH + 2H+ + O 2
2NAD+ + 2H 2O
NADH: H 2O oxidase
pyruvate + phosphate + O 2 acetylphasphate + CO 2 + H 2O2 Pyruvate oxidase
glycerophosphate + O 2 dehydroxyacetone phosphate + H 2O2 Alpha-glycerophsphate oxidase
2O2- + 2H+
H2O2 + O 2 Superoxide dismutase
NADH + H+ +H2O2
NAD+ + 2H 2O NADH peroxidase
Enzymatic reaction Catalytic enzymes

34
1.6.6 Oxidation of proteins
The oxidation of proteins, have been characterized, in several classes of damage including
oxidation of sulfhydryl groups, reduction of disulfides, oxidative adduction of amino acid
residues close to metal-binding sites via metal-catalyzed oxidation, reaction with aldehydes,
modification of prosthetic groups or metal clusters, protein-protein cross-linking and peptide
fragmentation (Stadtman,1990). All these protein modifications destroy the overall cell
functions and conditions since they lead to a loss of function of membranes and proteins, and
block the replication of DNA or causes mutations.
Due to the oxidative stress, genetic responses occur in bacteria, yeast, mammalian cell lines
and also in all aerobic organisms. Specifically, E. coli bacteria cells possess a certain defence
mechanism against peroxides which is mediated by the transcriptional activator OxyR, and
also against superoxide that is controlled by the two-stage SoxRS system (Cabiscol et al.,
2000).
The SoxRS (superoxide response) regulon contains at least ten genes, including those
encoding the Mn-SOD; endonuclease IV, glucose-6-P DH, a fumarase, aconitase, ferredoxin
reductase and micF RNA, which is involved in the expression of major membrane proteins.
The oxyR gene regulate other genes and among them the genes encoding the HPI catalase,
glutaredoxin, glutathione reductase, NADPH-dependent alkyl hydroperoxide reductase, and
a protective DNA-binding protein (Dps). The activation of these responses greatly increases
cellular resistance against the oxidative agents (Cabiscol et al., 2000).

35
1.6.7 Oxidative stress and genetic responses
The highly reactive oxygen species (due to the oxidative stress) target the biochemical
mechanisms in the cells; mainly DNA, RNA, proteins and lipids. Hydroxyl radicals cause
most of the damage. These are generated from H2O2 through the Fenton reaction, which
requires iron (or another divalent metal ion, such as copper) and a source of reducing
equivalents (possibly NADH) to regenerate the metal. After the addition of the iron and the
hydrogen peroxide, they are going to react together to generate some hydroxyl radicals as it
shows in the following equations:
(1) Fe2+ + H2O2 → Fe3+ + OH· + OH−
(2) Fe3+ + H2O2 → Fe2+ + OOH· + H+
During the oxidative stress lipids are major targets and in the membrane the free radical can
attack polyunsaturated fatty acids to initiate lipid peroxidation. The toxic effects of lipid
peroxidation are the decrease in membrane fluidity followed by the alteration of membrane
properties which can limit protein movements significantly. These effects increase the whole
process by producing more free radicals and more polyunsaturated fatty acids are degraded.
A variety of products, such as aldehydes, are produced which are found to be very reactive
and can damage the molecules of proteins (Humpries and Sweda 1998).
Compared to free radicals, the aldehydes are long lived and can diffuse from the site of their
origin then attack the targets. This is different from the initial free-radical event and it acts as
―second toxic messengers‖ of the complex chain reactions initiated (Cabiscol et al., 2000).
Many different aldehydes can be formed during lipid peroxidation. Among the intensively
studied aldehydes are malonaldehyde (MDA) and 4-hydroxyalkenals, in particular 4-
hydroxynonenal (HNE).

36
1.6.8 Protection against oxidative stress
Increase in oxygen concentration in the surrounding of anaerobic bacteria may trigger the
various antioxidative defence mechanisms that either keep the concentration of the O2-
derived free radicals at acceptable levels or repair oxidative damages. The maintenance of
oxygen levels and redox potential are important factors for viability of bacteria during
storage (Bruner et al., 1993). In contrast, L. casei and b. lactis are sensitive to oxygen due to
their lower NAD-oxidase and peroxidase activity and also because they lack catalase and
superoxide dismutase (Shimamura et al., 1992).
In general, oxidative defence mechanisms are divided into three major groups; preventing
ROS generation, quenching of chain propagation and repair of damage caused by free
radicals (Skulachev, 1995). To prevent ROS generation, various mechanisms have been
involved. Particularly, influx of iron plays an important role. If the iron influx exceeds
normal levels it can cause potential cell damage to the bacteria. The iron influx and then
solubilization and metabolism is strictly regulated through membrane bound receptors and
two other proteins, known as bacterioferritin and ferritin, which regulate the iron activity in
intercellular organelles (Gregory et al., 2008).
A number of molecules have been identified to show reactive oxygen scavenging activity.
These molecules are nonenzymatic antioxidants such as NADPH and NADH carotene,
ascorbic acid, tocopherol, and glutathione. Particularly, glutathione plays an important role.
Maintenance of glutathione level in the cytosol is regulated through glutathione reductase
which uses NADPH as a source of reducing power. Therefore, expression of these enzymes
in cellular organelles is important to keep the low-reactive oxygen levels low. The levels of
expression of these enzymes in response to oxidative stress are not well understood. In
addition, two superoxide dismutases (SOD) have been identified which convert O2– to H2O2

37
and O2. Some of the SOD contains iron e.g., E. coli and their expression are regulated
through intercellular iron concentration (Niederhoffer et al., 1990). Manganese containing
SOD is very common and its expression is high when cells are anaerobically grown. Catalase
also plays an important role in anti oxidative defence by which it removes H2O2 to yield H2O
and O2. Expression of these enzymes is transcription ally regulated during aerobic growth
(Finn and Condon, 1975; Zhao and Li, 2008, 2009).
Most organisms are known to repair the structural or chemical damage caused by oxygen-
free radicals. This mechanism include repair of DNA. One of the major enzymes involved in
DNA repair is carried out by endonuclease IV induced by oxidative stress. Endonuclease IV
acts on duplex DNA cleaning up 3' termini.
In response to oxidative stress, these enzymes and protein damage are major problems in
terms of cellular function. For example, prokaryotic cells contain some biochemical
intermediates by which damaged proteins and enzymes can be repaired. The protein or
enzyme damage is caused by covalent modification of primary structure of protein and, most
frequently, protein modification occurs through modification through disulfide bonds.
Glutaredoxin is able to reduce disulfide bonds in proteins, e.g. oxidation of methionine to
methionine sulphide commonly occurs in response to oxidative stress. This can be repaired
by methionine sulfoxide reductase (Gazzi, 2005). Therefore, understanding of their
expression in response to oxidative stress is important to explain the mechanism by which
they adapt to oxygen environment.
1.6.9 The viability of probiotic bacteria as affected by oxygen
The viability of probiotic bacteria is limited to their poor survival rate during processing and
storage. Oxygen-induced toxicity is one of the key factors against bacterial cell viability
(Talwalkar and Kailasapathy, 2004). It is reported that other factors that contribute to cell

38
death are extreme heat, cold, acidity, osmosis, high pressure and starvation. These induce
changes in the physiological processes and could contribute to cell death (De Angelis and
Gobbetti, 2004). Some other studies also reported that the surface and antigenic properties of
these organisms may also change as a result of such stresses (Seshu et al., 2004). Talwalkar
and Kailasapathy (2004) demonstrated that probiotic bacteria are significantly stressed in
fermented dairy products such as yoghurt as result of high oxygen concentrations. However,
changes induced in probiotic bacteria due to oxidative stress are not well understood.
Furthermore, reduced oxygen content in fermented dairy products such as yoghurt will
increase cell viability, reduce the incidence of mould attack and also reduce post -
acidification. One of the key factors which control bacterial viability is the level of oxygen in
the medium. Since most of probiotic bacteria are anaerobes, oxygen is lethal for their growth
and proliferation. However, the physiological mechanisms of oxidative stress tolerance in
probiotic bacteria are not well understood. Understanding of the key traits responsible for
variable response will provide greater insight into the physiological basis of how probiotic
bacteria respond to high oxygen levels. Maintaining probiotic bacterial numbers in the gut is
important in terms of lactose digestion, controlling intestinal infections, balancing the
intestinal mucosal barrier and all health benefits largely depend on the viability of the
probiotic bacteria (Salminen et al., 1998; Fuller, 1989). The viability of bacterial strains in
fermented milks is dependent on both the processing method and the strain. For example,
five strains of L. acidophilus, including L. GG (ATCC 53103), were tested to determine the
effect of refrigeration on the viability of the strains in cultured butter milk and in yoghurt
(Nighswonger et al., 1996). In cultured buttermilk, three of the strains showed no significant
loss of viability during storage, but two strains lost their ability to grow. It is possible that
cultures producing organic acids, diacetyl, or other organic compounds in the fermented milk
may influence the survival of some probiotic bacteria.
39
To maximise the health benefit of a probiotic product, it is very important to demonstrate a
good survival rate of the bacteria throughout the shelf life. As they are anaerobic micro-
organisms, the oxygen toxicity is an important and crucial factor for the survivability of
these organisms. During the production of yoghurt, atmospheric oxygen can easily invade
and then dissolve in the milk products so during the preparation of probiotic milk products a
special technique is required to provide an anaerobic environment and to exclude the
involvement of atmospheric oxygen. Nonetheless, oxygen still can enter to the product
during the packaging and storage process.
Without the use of anaerobic conditions, a satisfactory concentration of bacteria was found in
a number of bifidobacterium spp. by using whey-based medium containing L-cysteine (0.05g
per 100mL) and yeast extract(0.3g per 100mL). In both cases, L-cysteine was used to
reduce the redox–potential and to allow the bacterial growth (Dave and Shah., 1997b, 1998).
Oxygen can affect the growth of cultures in two different ways. Firstly, oxygen is toxic to the
probiotic cells; some probiotic cells are sensitive to oxygen and they die in the presence of
oxygen. Secondly, in the presence of oxygen some probiotic cultures, specifically Lb.
delbrueckii subspp, bulgaricus produce superoxide and a synergistic inhibition of probiotic
cultures occurs due to the presence of acid and hydrogen peroxide (Lankaputhra and Shah,
1996). The removal of Lb. delbrueckii subspp, bulgaricus from the starter cultures (such as
ABT starter cultures) has achieved some improvement in the survivability of probiotic
bacteria. Some studies emphasise the use of anti-oxidants or oxygen scavengers, to prevent
the detrimental effects of oxygen in probiotic culture (Dave and Shah, 1997a; Talwalker and
Kailasapathy, 2003a; Talwalker et al., 2004).

40
1.6.10 Adaptive evolution of stress response proteins
An effective probiotic bacterium will have to survive in various stress conditions such as
acid, bile, oxygen, cold, heat, osmotic pressure, starvation and other stresses summarized and
discussed in few review articles (De Angelis and Gobbetti, 2004; Sikora and Grzesiuk,
2007). These stresses occur during starter handling and storage and in a digestive tract when
consumed. The ability to respond quickly to these stresses facilitates probiotic bacteria to
survive. Changes at protein expression because of the stress response (acid, high pressure,
hop and bile salts stresses) have been characterised using proteomics technology (Hormann
et al., 2006 and Lee et al., 2008). Proteomics is a powerful tool for analysing several
hundreds of proteins in a complex mixture and facilitate comparing protein expression
changes between sample sets. Limited information on protein expression is available
particularly due to oxidative stress response by probiotic bacteria. For example, glutathione
reductase, ghioredoxin, ghioredoxin reductase, NADH oxidase, gatalase, pseudocatalase and
RecA were expressed in L. lactis identified by gene sequencing (Bolotin et al., 1999). Some
other enzymes such as NADH oxidase, NADH peroxidase, Superoxide dismutase,
Thioredoxin reductase, Pyruvate oxidase, etc. were reported in various Lactobacillus strains
because of stress response from oxygen or its toxic derivatives and identified these enzymes
using various biochemical methods other than proteomics (Condon, 1987; De Angelis and
Gobbetti, 1999; Cohen et al., 2008; Suokko et al., 2008). Large number of stress-induced
proteins have been identified and most of them are heat stress protein or molecular
chaperones that maintain protein function or repair damage after cell injury. Molecular
chaperones are involved in the folding of newly made proteins as they are extruded from the
ribosome. There are many different families of chaperones, each of the family acts to aid
protein folding in a different way. Although the molecular chaperone proteins are among the

41
most evolutionarily conserved proteins and have a ubiquitous function in all repair processes
(Rutherford and Lindquist 1998).
1.6.11 Mechanism of oxidative stress on membrane functions
Any micro-organism (e.g., probiotic bacteria) experiencing stress will initially try to
acclimatise to the environment by adjusting physiological, morphological and biochemical
parameters (Spano and Masssa, 2006). However, adjustment elasticity is dependant on the
species and magnitude of the response. For example, with regard to the physiological
responses of Bifidobacterium longum to oxygen stress the lag growth phase of the organisms
becomes extended and thereby the cell growth is suppressed (Ahn et al., 2001; Talwalkar
and Kailasapathy, 2003a). Further changes in cellular fatty acid profiles and cellular
morphology have also been reported (Ahn et al., 2001; Fedoroff, 2006). As a result, cells
became longer and with a rough surface due to abnormal or incomplete cell division.
Oxidative stress begins when the cellular systems are in danger or having an adverse
condition. This causes morphological and biochemical changes and cells produces reactive
oxygen species (ROS) such superoxide radical anion (O2 -), hydrogen peroxide (H2O2) and
hydroxyl radical (HO•). Later O2 - and H2O2 can produce highly reactive oxidant HOd via the
Fenton and Haber-Weiss reactions (McCormick et al., 1998; De Angelis and Gobbetti,
2004). The ability LAB to cope with oxidative stress condition depends on the different
groups of lactobacilli and the types of their cellular mechanisms to prevent oxidative stress
(De Angelis and Gobbetti, 2004).
Traditionally the viability of bacteria used to be assessed by plate counting on a suitable
growth medium but there are a number of negative effects involved with this traditional
method: it is time consuming for plate by plate counting, often it requires 2-3 days of

42
incubation period, uneven distribution of microorganism, bacteria may appear in the form of
chain or clumps, and it results in underestimation of true bacterial count (Auty et al., 2001).
Plate counting dead anaerobic microorganisms killed by oxidative stress, such as
Bifidobacterium may also contribute to an underestimation of true bacterial numbers. A more
direct approache such as microscopic technique is required for the determination of live and
dead bacteria. A suitable approache has been developed called direct epifluorescent counting
for the enumeration of total bacteria in environmental samples (Kepner and Pratt., 1994).
The main advantage of fluorescence microscopy is that a direct and rapid assessment of cell
viability can be made but the strains remain unidentified (Kepner and Pratt., 1994). The
fluorescence can detect the viability on the basis of membrane integrity, enzyme activity,
membrane potential, respiration, or pH gradient (Rodriguez et al., 1992: Auty et al., 2001).
The LIVE/DEAD BacLight viability kit (Molecular Probes Inc., Eugene, Oreg.) has been
developed to monitor the growth of bacterial populations and to determine the number of live
and dead bacteria on the basis of plasma membrane permeability (Virta et al., 1998). The kit
contains two different nucleic acid stains; SYTO9 and propidium iodide. SYTO9 (excitation
and emission maxima, at 480nm and 500 nm) penetrates for both viable and nonviable
bacteria, but propidium iodide (excitation and emission maxima, at 490nm and 635 nm) can
penetrate only bacteria with damaged plasma membranes (Auty et al., 2001). So the bacterial
cells compromised of damaged membranes fluoresce red whereas the intact bacterial cells
fluoresce green. Confocal scanning laser microscopy (CSLM) technique is extensively used
in cellular biology and one of its uses is to study the viability of E. coli and Salmonella
where rhodamine 123 and propidium iodide were added to determine the viable and non
viable bacterial cells on the basis of their cellular membrane potentiality and integrity in cell
biology (Figure 1.6). This technique was used to study the viability of E. coli and Salmonella
where rhodamine 123 and propidium iodide were employed to differentiate viable from

43
nonviable bacteria based on membrane potential and integrity (Wright et al., 1993; Auty et
al., 2001). However, the use of conventional epifluorescence microscopy is limited and it is
used for the viability staining of liquid items, for example milk (Pettipher et al., 1980). The
optical sectioning capability of CSLM has more advantages, such as increased sensitivity
and reduced out-of-focus blur, and these attributes enable the observation of the subsurface
structures of foods in situ (Auty et al., 2001). The figure 1.6 below has been shown principle
of confocal laser scanning microscopy.
Figure 1.6 Basic principle of a confocal microscope (Leica Microsystems). A Z-series is a
sequence of optical sections collected at different levels from a specimen by coordinated
movements using the fine focus on the confocal microscope (Paddock 1999).
http://www.ifr.ac.uk/materials/fractures/Confocal_microscopy.html

44
1.6.12 Stress response to cell membrane
Cell membranes are a combination of lipids and proteins. They are noncovalent and
supramolecular particles forming self-contained volumes. Inside the cells are cellular
compartments that act as permeability barriers to polar molecules (Ana et al., 2007).
Bacterial cell membranes are also involved in the transport of energy, necessary particles and
information into the cells and out of the cells. So the membrane and the composition of
complex protein and lipid are involved in a range of cellular activities required for normal
cellular functions. Lipids are organized into the bi-layers cells, which consistsof integral and
associated membrane proteins.
It has been revealed from genetic data that half of genes code for membrane proteins are
responsible for the one third of the dry cell-weight (Douglass and Vale 2005; Zimmerberg
and Gawrisch 2006).
Nevertheless, the diversity of characteristics is fully exploited by the cell. For example, a
mass-spectrometry analysis for the composition of lipids in cells indicates the high levels of
temporal and spatial variability in membrane composition (Van Meer., 2005). Similarly, the
membrane proteins can reorganise the lipid content and thus can modify the physical
properties of membranes (Douglass and Vale 2005).

45
1.6.13 Proteomic study of probiotic bacteria under oxidative
stress
1.6.13.1 Introduction
Proteomics is an increasingly developing area of molecular biology where systematic
analysis of proteins is conducted. It is mainly based on the concept of proteome; meaning a
complete set of proteins in a certain cell or organism at a specified sets of condition
(Twyman, 2004). Most of the biological functions in living cells are controlled by protein so
a comprehensive analysis of protein can provide a global perspective about these molecules
and how they interact and cooperate for maintaining a working biological system. For any
internal and external changes, cells can respond by regulating the level and activity of its
proteins, so the changes in proteome (qualitative or quantitative) provide a brief picture of
the cell‘s action.
Proteome is complex and has a range of dynamic characteristics which can be defined by
some other terms such as structure, sequence, localization, modification, interaction, and
abundance and the biochemical functions of its own components, altogether provide rich and
various sources of data. The analysis of these various types of characteristics of proteome
requires a wider range of technologies. The analysis of proteome involves a combination of
two-dimensional gel electrophoresis (2-DE) and mass spectrometry (MS). The 2-DE method
is used to separate and visualize the variable proteins whereas MS is used to identify the
proteins of interest. In this study, proteomics is used to study the oxidative stress responses
of a probiotic bacterium and to identify the stress proteins presence in probiotic bacteria
during the oxidative stress condition. In 2-DE, proteins are separated in a polyacrylamide gel
matrix in two dimensions; first according to their isoelectric point (charge) and then based on
their molecular weight.

46
Mass spectrometry (MS) is used to measure the molecular masses of charged molecules
(analytes), such as peptides and less frequently charged proteins present in proteomes. The
MS analyses measures the mass-to-charge ratios of charged molecules and produces mass
spectra and essentially provide mass information on all of the ionisable components in a
sample. The following diagram (Fig.1.7) showing the different types of technologies and
resources that are used in proteomic studies.
Adapted from Patterson and Aebersold (2003)
Figure 1.7 Time-line indicating the convergence of different technologies and resources into
the proteomic process. Advances in mass spectrometry and the generation of large quantities
of nucleotide sequence information, combined with computational algorithms that could
correlate the two, led to emergence of proteomics as a field.

47
1.6.13.2 Proteomics
The word ―protein‖ was first introduced into the language in 1938 by a Swedish chemist
Jons Jacob Berzelius who described protein as a particular class of macromolecules, present
in abundance, in living cells or organisms and that create the linear chains of amino acids.
The term protein is derived from the Greek word Proteois meaning ‗of the first order‘ and the
meaning chosen to convey protein as the central importance in the human body. Thousands
of different proteins are present in single cell to multiple cell organisms and they are able to
form every imaginable biological function. The biochemical reactions in a living cell are
mainly catalysed by a group of proteins called enzymes. They bind their substrates with
strong specificity and they increase the reaction strength by millions or billions of times.
There are a few thousands of enzymes that have been identified and catalogued. Some of
them catalyse very simple reactions such as phosphorylation or dephosphorylation and others
are engaged in very complex and intricate process such as DNA replication and transcription.
Proteins are also able to transport or store other molecules, such as haemoglobin (transports
oxygen), ion channels (allow ions to pass across otherwise impermeable membranes for ion),
ferritin (stores iron in a bioavailable form), and the larger structures that contain component
of proteins, such as nuclear pores and plasmodesmata.
1.6.13.3 Expression of proteomics
The expression ‗proteomics‘ means the analysis of protein abundance that involves the
separation of complex protein mixtures by using 2DGE (two-dimentional gel
electrophoresis) and it which was first developed in the 1970s and, still now is considered as
one of the major tools in proteomic studies. This tool can be used to catalogue the proteins
in different organisms and different cells to look for any differences that may represent any

48
alternative states or changes, such as health problems and diseases. Many statistical analysis
methods normally associated with microarray analysis, for example multivariate statistics
and clustering algorithms, were developed along with that of 2DGE protein analysis. There
are, however, major technical limitations such as difficulties for achieving reproducible
separations and identifying the separated proteins.
In the 1990s, one of the major achievements was expression proteomics, when the mass
spectrometry techniques were introduced for protein identification, algorithms and database
searching using mass spectrometry data. Currently thousands of proteins can be rapidly
determined, separated, quantified and identified by using mass spectrometry techniques. The
results can be used to catalogue the proteins produced in a specified cell, to identify those
proteins which are differentially expressed in different samples, and to characterize post-
translational modification of proteins (Twyman, 2004). Nowadays a number of key
technologies are used for expression proteomics. They include 2D-gel electrophoresis and
multidimentional liquid chromatography (for protein separation), mass spectrometry (for
protein identification) and image analysis or mass spectrometry (for protein quantification).

49
1.6.13.4 Proteomic analysis
Proteomics analysis involves two steps: (i) protein separation and (ii) protein identification,
including the characterization of post-transitional modification. The general schematic
diagram on proteomics is as shown below:
Figure 1.8 General Schemetic diagram on proteomics, adapted from Garbis et al. (2005).
Sample preparation (Protein extraction, enrichment)
Two-dimensional electrophoresis (Isoelectric focusing, SDS-PAGE)
In-gel Digestion
Mass Spectrometry ( MALDI-TOF-MS, Ion Trap, Tandem MS)
Protein identification, Detection of protein Changes (Construction of data bases, computer assisted gel analysis, modifications)
Data Storage
Chromatography
Digestion
Liquid Chromatography

50
For the separation of proteins, two approaches exist which have advantages as well as
disadvantages. The well established method includes separation of protein by 2D-gel
electrophoresis and subsequent identification of individual proteins by mass spectroscopy.
Another method is referred to as multidimensional protein identification technology
(MUDPIT). This relies on separation of proteolytic peptides by liquid chromatography and
their identification by directly coupled electro-spray ionization-tandem mass spectrometry.
2D-gel electrophoresis provides data of differential expression, post-translational
modification and protein cleavage events which will not be provided by MUDPIT and there
has been no investigation carried out on proteome response to oxidative stress in probiotic
bacteria. The major objective of the proposed project is to elucidate the physiological basis
of oxidative stress tolerance mechanism in probiotic bacteria using proteomic tools.
1.6.14 Separation techniques in proteomics
In proteomic experiments the 2-DE is an appropriate technique for the separation of proteins
and the aim of 2-DE is to visualize a large number of proteins in a proteome which may
consist of tens of thousands of proteins originated from different types of complex biological
samples. So, in proteomic analysis the separation of proteins or their fragments is one of the
key issues prior to further analysis. In addition, the separation of proteins at whole protein
level is performed by using gel-based electrophoretic or liquid chromatographic methods. At
peptide levels the separation or fractionations can be performed by using chromatographic
methods or peptide isoelectric focusing method (Chick et al., 2008).
51
1.6.14.1 Gel-based separation in proteomics
Two types of gel-based electrophoresis are used for the separation of protein via one-
dimensional gel electrophoresis (1-DE) and two-dimensional gel electrophoresis (2-DE). 1-
DE is used to resolve comparatively simple protein mixtures, usually performed after
purification of the selected protein contents. In 1-DE, proteins are separated on the basis of
their molecular weight (MW). However, 2-DE, a standard separation method in gel-based
proteomics, is able to explore a simultaneous expression of separation and visualization of
thousands of proteins. In 2-DE, proteins are first separated according to their isoelectric point
(pI) by isoelectric focusing (IEF) in a pH gradient, and then separated according to their
MW. By using 2-DE, the expression of semi-quantitative differences can be achieved and the
target proteins are readily identified using mass spectra analysis (Gorg et al., 2004). The two
most common processes for quantitative proteome analysis (Figure 1.9) are: at the top, 2-DE
is used to separate and quantify proteins, and selected proteins are then identified by MS;
where as at the bottom, LC-MS/MS is used to separate proteins from the mixture and
quantification is achieved by labelling peptides with stable isotopes.

52
Figure 1.9 The two most common processes for quantitative proteome analysis from the cell
to the identified protein (Adapted from Patterson and Aebersold, 2003).

53
Figure 1.10 The principles of proteome analysis by 2-DE gels.
The following figure (Figure 1.10) represents the series of steps involved in proteome
analysis by 2-DE gels. Proteins extracted from the cell are first separated according to their
pI and subsequently according to their MW. Protein spot patterns from different samples are
compared and quantified and the proteins from the spots of interest are identified by MS.

54
The predominantly used protein staining methods, such as silver and Comassie Brilliant Blue
(CBB), have a limited dynamic range and they compromise the quantitative differences
between gels. The introduction of fluorescent stains improved the overall staining methods
due to their wider dynamic range (Righetti et al., 2004), but it is unable to do quantification
directly. To determine the quantification by using 2-DE more accurately, protein reactive
cyanine dyes have been developed and introduced to undertake Differential in Gel
Electrophoresis (DIGE) (Marouga et al., 2005).
1.6.14.2 Non-gel-based separation in proteomics
The search for more development techniques has resulted in the introduction of non-gel
based strategies for proteomic analysis. In recent years, the emergence of non-gel-based
proteomic methods has given rise to the application of several techniques such as (a) liquid
chromatographic separation, (b) new protein chemistry and (c) enrichment methods and the
development of mass spectrometry and software for data analysis. Mass spectrometry based
quantification is an important addition to quantification in 2-DE. However, the application of
MS-based technology has several advantages compared to 2-DE-based ones: (a) they can be
automated; (b) they can combine high resolution and high sensitivity in the separation of
extremely complex peptide mixtures (Kolkman et al., 2005). The following figure (Figure
1.12) shows the incorporation of isotopes into proteins and their use in relative
quantification.

55
Figure 1.11 Incorporation of isotopes into proteins and their use in relative quantitation
(Adapted from Aebersold and Mann, 2003). A. Proteins are labelled metabolically by
culturing cells in media that are isotopically enriched (for instance, containing 15N salts, or
13C-labelled amino acids) or isotopically depleted. B. Proteins are labelled at specific sites
with isotopically encoded reagents. C. Proteins are isotopically tagged by means of enzyme-
catalysed incorporation of 18O from 18O water during proteolysis.

56
1.6.15 Analysis of proteins
Protein identification and analytical technologies have evolved to such extent that global
protein expression profile can be investigated within a very short time. Proteomics also
provide information of post-translational modification, translational regulation, the product
of alternative splicing of mRNA, and selective degradation of proteins. This proteome
expression cannot be accounted for by measuring transcript level of mRNA. The analysis of
a complex protein mixture is challenging and increases with the complexity of the protein
(Freeman and Hemby, 2004).
Mass spectrometry is used in a wide range of biological analyses and plays a significant role
in a range of applications. However, mass spectrometers are a combination of three units: (a)
the ion source, (b) the mass analyzer, which separates the ionized analytes in accordance to
their mass-to-charge (m/z) ratios, and (c) the detector, that records the number of ions at each
m/z value. MS data are recorded as ―spectral peaks‖, which displays the ion intensity versus
the m/z ratio (De Hoffman and Stoobant 2007; Watson and Sparkman 2008). In 1988 the
electrospray ionization (ESI) technique came into effect when J. Fenn reported the
identification of polypeptides and proteins using a combination of ESI and mass
spectrometry (MS) (Fenn et al., 1989). As biomolecules are large and polar, their transfer
into the gaseous phase raised enormous challenges. In 1985 Karas and Hillenkamp reported
that an energy-absorbing matrix could be used to volatilize small analyte molecules (Karas
and Hillenkamp 1988). A breakthrough for large biomolecules was reported, when Tanaka
(1987) demonstrated the results of a mass spectrometric analysis of an intact protein with
soft laser desorption (SLD). He also demonstrated that a low-energy nitrogen laser could be
used to generate gaseous macromolecules and this technique was later upgraded by Karas

57
and Hillenkamp (Karas and Hillenkamp 1988) into matrix-assisted laser-desorption
ionization (MALDI).
As stated earlier, the ionization techniques ESI and MALDI led to the success of mass
spectrometry in life sciences. There are mainly four different types of mass analysers used in
proteomic research: (a) time-of flight (TOF), (b) linear and three-dimensional ion traps, (c)
quadrupole and (d) Fourier transform ion cyclotron resonance (FTICR) (Aebersold and
Mann 2003). Sometimes ESI coupled to triple quadrupole, ion trap, orbitrap or hybrid
tandem mass spectrometers such as quadrupole time-offlight (Q-TOF) instruments are used
to generate fragment ion spectra (Morris et al., 1996). MALDI is usually coupled to TOF
analysers that measure the mass of intact peptides. MALDITOF is extensively used to
identify proteins at the MS level in proteomic experiments, because of its simplicity, high
resolution and sensitivity. In tandem mass spectrometry (MS/MS), MALDI ion sources are
combined with quadrupole ion trap MS (Krutchinsky et al., 2001) and TOF/TOF instruments
(Medzihradszky et al., 2000, Loboda et al., 2000).
1.6.15.1 MALDI mass spectra analysis
During MALDI mass spectra analysis, the sample is co-crystallized with a molar excess of
UV-absorbing matrix. The ion formation is accomplished by directing a pulsed laser beam at
sample matrix crystals in a high vacuum. The energy of the laser excites the matrix, causing
a proton to be donated to the sample molecules and thus creating charged ions. The matrix
absorbs the laser radiation, resulting in the vaporization of the matrix and sample embedded
in it. The matrix is a solid material, is fairly to allow facile vaporisation, it is large enough
and it does not evaporate during the sample preparation (De Hoffman and Stoobant 2007;

58
Watson and Sparkman 2008). The following table (Table 1.4) showing the commonly used
MALDI matrices for analysis of peptides and proteins.
Table 1.4 Commonly used MALDI matrices for analysis of peptides and proteins.
Mostly, MALDI is coupled with TOF mass analyzer, in which the flight time of the ion
(from the ion source to the detector) is measured. This flight time is converted into a mass-
to-charge ratio to determine the molecular weight of the ion. In proteomic research, MALDI
–TOF/ (TOF) MS is a widely used technique. It is easy to use and comparatively simple to
automate for high-throughput methodologies.
59
1.6.15.2 ESI MS
Electrospray ionization technique is used to convert gaseous ionized molecules from a liquid
solution. During the ESI, the sample solution is sprayed through a conducting capillary and
then a voltage is applied to form a fine spray of highly charged droplets. In addition during
the solvent evaporation the size of the analyte-solvent droplet is reduced and the charge
density on the droplet surface is increased until it reached the point where the surface tension
can no longer sustain the charge and the droplet is ripped apart. The whole process is
repeated until the charged analyte ions are converted from the droplet into the gaseous phase
(Fenn et al., 1989). Later, the invention of nanoelectrospray improved the sensitivity of the
analysis by lowering the flow rate, to the level required for the proteomic analysis (Wilm and
Mann 1996). Typically, the flow rates are around 200 nl/ min. In the nanoelectrospray, the
tip diameter is 10-50μm, and it has a smaller spraying, thus it generates smaller droplets than
a conventional electro spray.
1.6.15.3 LC-MS/ (MS)
A combination of liquid chromatography and mass spectrometry (LC-MS and LCMS/ MS) is
a widely used powerful technique for the analysis of proteins and peptides. Usually the
proteomic samples are complex, even after pre-fractionation steps. The LC-MS/MS
combines the efficient separation of proteins and peptides. By using LCMS/ MS, the
mixtures of peptides can be analysed directly or, alternatively, the method can be used to
simplify the protein digest by fractionating the sample in LC before MS analysis. Later, the
development of microscale capillary reversed-phase liquid chromatography (capillary LC,
LC-MS) transformed the direct coupling of LC into an ESI interface (Karlsson and Novotny
1988).
60
1.6.16 Protein identification
In proteomic analysis, the identification of proteins is almost exclusively performed by MS
(Aebersold and Mann 2003). The development of MS technology and the computational
protein analysis techniques has dramatically enhanced the sensitivity and throughput of
protein identification. Currently the sensitivity of MS technology has reached a level that
allows for identification of the proteins that are normally visible in conventionally stained
gels (Shen and Smith 2005). In different organisms, the systematic sequencing of genomes
has generated massive amounts of data that is now contained in sequence databases. In
addition, the development of algorithms and other bioinformatic tools for protein
identification has been a great advance in biological MS technology (Mann et al., 2001).
Now, proteins can be identified by using MS and other different techniques. The first,
peptide mass fingerprinting (PMF) technique, is considered as the most common and
straightforward way to identify proteins in proteomic analysis. The second, peptide
fragmentation analysis, utilizes the fragment ion data (partial amino acid sequence) from a
combination of peptide and its molecular mass. Usually, PMF is performed at the MS level
with MALDI-TOF instruments and the peptide fragment ion data is derived from tandem
mass spectrometry (MS/MS) with MALDI-TOF/TOF or ESI MS/MS.

61
1.6.17 Peptide mass fingerprinting (PMF)
In the 1980s, Mass spectrometry was used to analyse peptides from proteolytic digests
(Gibson and Biemann 1984) but its use for protein identification was published in 1993 when
five groups described its use for the identification of gel-separated proteins (Yates et al.,
1993, James et al., 1993). The peptide mass fingerprinting technique was rapidly adopted in
research. In PMF, first the protein is digested with an endoprotease and then the molecular
masses of these peptides are measured. The peptide masses are unique for each protein. The
acquired MS spectra are compared using database search algorithms along with theoretical
peptide masses and then calculated from each sequence entry in the database (Yates et al.,
1993; James et al., 1993). The criterion for a successful identification is that the protein, or
its very close homology, is represented in a sequence database. During the identification
procedure the overlapping masses between measured and calculated spectra are compared
leading to similar scores (Palagi et al., 2006). A variety of scoring algorithms are used some
of which are simple scores based on the number of common masses between the
experimental and theoretical spectra. More sophisticated scoring algorithms are used for the
non uniform distribution of protein and peptide masses in the database.

62
1.6.18 Characteristics of probiotic bacteria
1.6.18.1 Acid and bile tolerance
Acid tolerance of probiotic bacteria is one of the key characteristics for their survival in the
GIT (Lee and Salminen, 1995). Probiotic bacterial passage through the stomach and small
intestine will encounter high acidic and protease-rich conditions. Hence, these organisms
should be able to withstand high acidity therefore probiotic bacteria should be selected for
acid tolerance. Simple in vitro tests can be used to assess acid tolerance and such tests have
been applied in the selection of lactic acid bacteria and Bifidobacterium strains to be used as
probiotics in dairy foods (Tuomola et al., 2001). These in vitro tests are used for the
selection of acid and bile-tolerant strains and can also be applied to ensure the quality of
probiotic cultures during manufacture and storage and throughout the shelf life of the
product. It is possible that acid and bile tolerance may vary in response to environmental
variable such as oxidative stress.
1.6.18.2 Adhesion stability
The ability to adhere to the intestinal mucosa is one of the most important selection criteria
for probiotics because adhesion to the intestinal mucosa is considered to be a prerequisite for
colonization (Salminen et al., 1996). Adhesion is also an important quality control method
for assessing the surface structure of probiotic bacteria and related gut barrier effects
(Tuomola et al., 2001). Adhesion of probiotic lactic acid bacteria (LAB) has been reported to
be host species specific. Host specificity is regarded as a desirable property for probiotic
bacteria and is therefore recommended as one of the selection criteria (Rinkinen et al., 2003).
Early reports have documented that adherence properties are dependant on culture
conditions, the number of transfers in industrial scale fermentation and use of

63
cryoprotectants in freeze-drying (Elo et al., 1991). Transfer of cultures in processing over a
period of three years decreased adhesion and also demonstrated that changing the culture
medium could also result in diminished adhesion properties (Elo et al., 1991; Tuomola et al.,
2001).
In several studies, it was found that adhesion is an important factor for the shortening of
duration of diarrhoea, immunogenic effects, competitive exclusion, and other health effects
(Salminen et al., 1996; Malin et al., 1997). Adhesion of probiotic strains is variable,
adhesion in different in vitro models varies even within the same strain and differences
between strains can be significant (Lehto and Salminen, 1997; Tuomola and Salminen,
1998). Some reports on the stability of adhesion properties are available in the literature. Elo
et al. (1991) tested the stability of Lactobacillus GG from different production lots and
products by comparing the original strain with cultures used for a longer period in industrial
processes. Only slight variation in adhesion properties was observed however a more
significant drop was reported in the adhesion properties of a culture that had been maintained
in MRS broth for 3.5 years with a weekly transfer. L. GG isolated from the faecal samples of
subjects consuming a fermented whey drink containing L. GG had adherence properties equal
to those of the original strain (Elo et al., 1991). If adhesion is modified during industrial
processes, other probiotic traits may also be altered. Adhesion properties, including adhesion
to intestinal cells (eg, Caco-2) and human intestinal mucus preparations, should be monitored
carefully.

64
1.6.18.3 Hydrophobicity assay
Lactobacilli has high rate of survivability due to their capacity to produce many
antimicrobial compounds such as hydrogen peroxide (H2O2), organic acids, carbon dioxide,
acetaldehyde, diacetyl, reuterin and bacteriocins (Ouwehand, 1998). However, different
types of antimicrobial compounds have capacity to exert some specific antagonistic
properties against other micro organisms such as Gram-negative and Gram-positive
pathogens. One of the compounds produced by LAB is bacteriocins which has a specific
inhibitory activity against Gram-positive bacteria (Abee et al. 1995). Gram-negative
pathogens are more sensitive to organic acids produced by LAB (Alakomi et al. 2000). The
production of different types of putative antimicrobial compounds by lactobacilli, when
cultivated in various media and atmospheric conditions, has not been investigated to explore
their effects.
1.6.18.4 Auto aggregation and Co aggregation assays
Researchers have focused on establishing the mechanism(s) of the interaction between
colonic epithelium and micro biota until recently (Gionchetti et al., 2003; McCarthy et al.,
2003). However Morelli et al., (2005) first reported on a probiotic characteristic that
appeared to have a relevant role to exert protective effects on colitis (the aggregation
phenotype). L. crispatus M247 has a protective role and it has ability to co-aggregate or
aggregate with different types of generic bacteria. For example, lactobacilli always aggregate
with E. coli strains or enterococci strains (Reid et al., 1988; Cesena et al., 2001). As another
example, aggregation with other bacterial species in the dental plaque and with yeast is a
well known bacterial relationship to enhance the viability of these microorganisms in a
hostile environment (Morelli et al, 2005). The aggregation may also facilitate their exchange

65
of genetic material and allow them to have new phenotypic characteristics (Reniero et al.,
1992).
1.6.19 Protective effect of microencapsulation on oxidative stress
in selected probiotic strains
1.6.19.1 Definition of microencapsulation
Microencapsulation can be defined as a technology for packaging solids, liquids or gaseous
materials in miniature, sealed capsules so that their contents can be released at controlled
rates under the influences of specific conditions (Kailasapathy and Masondole, 2005:
Doleyres, and Lacroix, 2005: Anal and Singh , 2007). A microcapsule is an entrapped
solid/liquid core material surrounded by a semipermeable, spherical, thin and strong
membrane with a diameter ranging from a few microns to 1 mm (Anal and Singh, 2007).
To increase the viability and to protect the probiotic bacteria from unfavourable
environment, a number of technologies were introduced including cell incubation under sub-
lethal conditions, cell propagation in an immobilized biofilm, and microencapsulation
(Barbaros et al., 2009). Among those techniques, microencapsulation has been found to be
the most effective technique for the protection of probiotic bacteria (Krasaekoopt et al.,
2003; Kim et al., 2008).
1.6.19.2 Microencapsulation techniques
Different types of gels and other materials are used to encapsulate probiotic bacteria and the
microencapsulation process also depends on gel entrapment techniques (Doleyres, and
Lacroix, 2005). For the entrapment process, a number of biopolymers are used such as
starch, calcium alginate, k-carrageenan and gellan gum. Promising results can be obtained at

66
the laboratory scale but it has been found to be difficult to produce in a larger scale
production (Doleyres, and Lacroix, 2005).
Naturally, alginate and gellan gum are acid-resistant and heat-stable and the combination of
both as a coating material for encapsulation may extend the usage of probiotic bacteria in
food processing as a new functional additive for beverages such as hot tea and coffee. A
variety of food-grade polymers are used for different purpose-based microencapsulation
processes. These include gelatine, pectin, alginate, chitosan, carrageenan and carboxymethyl
cellulose (CMC), (Anal and Singh, 2007).
1.6.19.2 .1 Core Materials
Many different types of materials are used as core materials including flavours, antimicrobial
agents, nutraceutical therapeutical actives, vitamins, minerals, antioxidants, colour, acids,
alkalis, buffers, sweeteners, nutrients, enzymes, cross-linking agents and yeasts (Lakkis,
2007).
1.6.19.2.2 Wall forming materials
(a) Lipids and waxes: bee wax, candelilla wax, carnauba wax, micro wax and macro wax
emulsions, natural and modified fats and glycerol distearate.
(b) Proteins materials: Naturally and modified proteins are in this group and include
gelatins, whey proteins, soy proteins and gluten (Lakkis, 2007).
(c) Carbohydrates materials: A range of different carbohydrates are used as wall material
such as starches, alginates, maltodextrins, chitosan, sucrose, glucose, ethylcellulose,
cellulose acetate and carrageenans.
67
(d) Food grade polymers: Different types of Food grade polymers are used including
polypropylene, polyvinylacetate, polystyrene and polybutadiene.
1.6.19.2.3 Methods used in microencapsulation
As reviewd by Gibbs et al. (1999), a number of techniques are used in the food industry in
microencapsulation such as spray-drying, spray-cooling, spray-chilling, fluidized-bed
coating, liposome entrapment, coacervation, inclusion complexation, rotational or centrifugal
suspension separation and extrusion.
1.6.19.3 Different Encapsulation techniques
1.6.19.3.1 Spray drying
During the spray drying technique, an aqueous solution containing the sensitive active core
material and the solution of wall material is used. Spray drying is a process in which an
aqueous solution is changed into a dried particulate form by spraying the feed into a hot
drying medium (Finch, 1993; Reineccius, 1998). Three basic processes are involved:
homogenization of the dispersion, automization, and feeding the mixture into the drying
chamber under controlled temperature and inflow conditions (Nitro Inc, 2004). Spray drying
products can be in different shapes, such as powder, granulate or agglomerate shape.
Particularly heat sensitive foods and pharmaceuticals are using this method (Rattes and
Oliveira, 2004).
1.6.19.3.2 Fluidized-bed coating
At first the solid particles are suspended and then the coating material is atomised. The
amount of coating materials to be used depends on the duration of time the particles are
required to be in the chamber.

68
1.6.19.3.3 Liposomes entrapment
Liposomes consist of uni layer or multi layers of phospholipids. The hydrophilic portion
tends to move towards the aqueous phase but the hydrophobic portion moves towards the
similar portion of other lipid molecules. The conversion of the lipid sheet into a spherical
shape stable the capsule formation and the converted form of lipid sheet can be induced by
aqueous solutions or various types of solvents.
1.6.19.3.4 Coacervation or Emulsification
The coacervation process includes the emulsification of the material and then separation of
the liquid phase. The liquid phase is used to coat the core material. This method is an
efficient one but expensive.
1.6.19.3.5 Inclusion complexation
The inclusion complexation process involved the entrapment of materials into the
hydrophilic core (β-Cyclodextrin) with a hydrophilic surface.
1.6.19.3.6 Rotational or centrifugal suspension
Centrifugal suspension is a separation technique which involves the mixing of the core and
wall materials followed by the transformation onto a rotating disk. The core materials are
then released with a coating of residual liquid. After the removal from the disk, the capsules
are dried and chilled.
1.6.19.3.7 Extrusion and Separation
During the Extrusion and Separation process, the materials are dispersed into a liquid. The
dispersed material then solidifies in the liquids where the liquid material trapping the
particles within a matrix.

69
Figure 1.12 Schematic diagram of the process of encapsulation of bacteria by using
extrusion and emulsion techniques (Krasaekoopt et al., 2003).

70
Table 1.5 Comparison of different techniques used for encapsulating probiotic
microorganisms (Anal and Singh, 2007).

71
1.6.19.4 Development of Microencapsulation Techniques
Chen et al. (2007) conducted another study with aimed to develop encapsulated B. bifidum
coated with gellan, alginate and prebiotics by using a modern optimization technique. They
reported encouraging outcomes for the effects of heat treatment and simulated gastric
conditions on the viability of B. bifidum as microencapsulated products. However, very few
microencapsulation technologies have been able to scale up their production; the starch-
encapsulation technique has been found to be the most effective one (Mattila-Sandholm et
al., 2002; Doleyres, and Lacroix, 2005). Immobilization of cells in hydrocolloid bead matrix
provided improvement for the protection of probiotic bacteria against adverse environmental
conditions (Picot and Lacroix, 2004; Barbaros et al. (2009). Goderska et al. (2003) reported
that microencapsulated Lactobacillus rhamnosus colonies in alginate matrix kept their
viability up to 48 h at pH 2.0, while free cells became inactive under the same conditions
(Barbaros et al., 2009). Another similar study reported that an increasing concentration of
alginate led to increased colony counts of Bifidobacterium longum (Lee and Heo, 2000).
1.6.19.5 Microencupsulation increase the viability of probiotic bacteria
Annan et al. (2007) reported that encapsulation with B. adolescentis 15703T using alginate
coated gelatine microspheres significantly (P < 0.05) improved the survival rate of bacteria
in simulated gastric and intestinal juices compared to the survival rate of free cells or
entrapped cells with uncoated gelatine microspheres.
A number of previous studies demonstrated the low viability of bifidobacteria during the
storage, intestinal transit, heat treatment (for dehydration probiotics/ products), acidity and
exposure to oxygen (Saarela et al., 2005; Chen et al., 2007). In recent years a number of
areas have been studied for the improvement of the viability of probiotic bacteria (in a
variety of products) such as control of over-acidification of products, selection of thermal

72
tolerance/acid-resistant strains, and the addition of cysteine or an oxygen scavenger such as
ascorbic acid. These studies were very limited and there is more to be done (Krasaekoopt et
al., 2003; Chen et al., 2007).

73
Chapter 2
2 Material and methods
74
The general material and methods used in this project are described in this chapter. The
detailed material and methods used for each particular experiment will be introduced in each
individual sub chapter.
2.1 Probiotic strains and growth
Probiotic cultures were supplied as freeze-dried form and obtained from four different
commercial suppliers. L. paracasei LAFTI L26, B. lactis LAFTI B94 & L. acidophillus
LAFTI L10 were provided by DSM Food Specialties Ltd., Sydney, Australia. L. casei subsp.
casei 2603 ASCC, L. rhamnosus 2625 ASCC, B. infantis B1912 ASCC were provided by
Australian Starter Culture Centre, Werribee, VIC, Australia. L. acidophilus LA 5, L. Casei
Lc1, B. lactis Bb12 were provided by Chr. Hansen, Bayswater, VIC and Australia.
Bifidobacterium sp. (HOWARU Bifido DR10) and Lactobacillus rhamnosus (HOWARU
Rhamnosus DR20) strains were provided by Danisco, Copenhagen, Denmark. For the
viability test and proteomic study, the cells were grown aerobically (under 21% O2), and
anaerobically (under 0% O2) and placed in gas jars using the Gas Pak System (Oxoid,
Adelaide, Australia) for 18 h at 37 °C in De Man Rogosa Sharpe (MRS) broth (Oxoid,
Adelaide, Australia). The cells were centrifuged at 5000 g for 15 min at 4 °C, harvested and
then washed twice with sterile 0.01 M phosphate buffered saline (PBS).
2.2 Media, stock solutions, buffers and reagents
All solutions and media were prepared Chambers (1993) and using distilled (dH20) or
deionised water (Milli Q(R)) in accordance with Sambrook et al. (1989) and sterilized by
autoclaving at 121°C for 15 min and then kept at room temperature unless otherwise stated.

75
2.2.1 Media
DeMan-Rogosa-Sharpe (MRS) broth and agar
In all growth experiments, MRS broth and MRS agar were obtained from Oxoid, Adelaide,
Australia, and used to grow both Lactobacillus and Bifidobacteria. MRS broth consists of 20
g/l glucose, 10 g/l peptone, 10 g/l lemco powder, 5 g/l yeast extract, 1 ml Tween 80, 2 g/l
dipottasium hydrogen phosphate, 5 g/l sodium acetate, 2 g/l triammonium citrate, 0.2 g/l
magnesium sulphate and 0.05 g/l managanese sulphate and was prepared as per
manufacturer‘s instructions.
MRS agar consists of 20 g/l glucose, 10 g/l peptone, 8 g/l lemco powder, 4 g/l yeast extract,
1 ml Tween 80, 2 g/l dipottasium hydrogen phosphate, 5 g/l sodium acetate, 2 g/l
triammonium citrate, 0.2 g/l magnesium sulphate and 0.05 g/l managanese sulphate, Agar 10
g/l and was prepared flowing the manufacturer‘s instructions.
MRS Agar plates
Previously prepared medium was sterilized at 121°C for 15 min and then cooled to
approximately 45°C, and poured into sterile disposable petri plates (Selby, Victoria,
Australia). Unless stated otherwise, broths and plate cultures were incubated at 37°C under
anaerobic conditions then maintained using Anaerogenic sachet (Oxoid, Melbourne,
Australia).
NGYC medium
Milk-based NGYC medium was prepared as described by Lankaputhra and Shah (1995). It
consists of 12% non-fat skim milk, 2% glucose, 1% yeast extract and 0.05% L-cysteine. The
pH values of NGYC medium were adjusted to 2.0, 3.0, 4.0 or 6.5 (Control) using 5 M HCL
or 1 M NaOH.

76
Milk-yeast extract medium
The milk-yeast extract medium was prepared as described by Truelstrup Hansen et al.
(2002). It had a pH of 6.9 and consists of 10% non-fat skim milk powder, 0.5% yeast extract,
0.05% L-cysteine and 0% (Control), 0.5% or 1.0% (w/v) bile salts (Oxgall, Sigma,
Australia). The bacterial cell suspensions were inoculated at 37°C into the milk-yeast extract
medium and then incubated anaerobically for 6h.
Sodium alginate
Sodium alginate (viscosity of 2 % w/v solution at 25°C, 250 cps), citric acid, di-sodium
hydrogen phosphate, potassium dihydrogen phosphate, sodium hydroxide and calcium
chloride were purchased from Sigma-Aldrich (Castle Hill, Sydney, Australia).
Starch
Starch (Hi-Maize ™1043) was purchased from the National Starch and Chemical Company
(New Jersey, USA). Microcapsules containing probiotics were prepared aseptically using an
Inotech Encapsulator IE-50 R (Inotech AG, Dottikon, Switzerland) as described in chapter 6.
The ingredients used in the microencapsulation process were 1.5 % (w/v) alginate bacterial
culture (≈106 cfu/ml) hardened for 5 min in 0.1M calcium chloride solution.
2.2.2 Buffers
2D lysis buffer
7M urea, 2M thiourea, 2% CHAPS, 1% C7 and 10 μL of protease inhibitor cocktail were
used to make 5 ml of 2D lysis buffer (Sigma-Aldrich, Castle Hill, Sydney, Australia).

77
Equilibration buffer
Equilibration buffer was prepared using 6M urea, 3% SDS, 20% glycerol and 1 x tris-HCl
buffer (Bio-rad, Gladsville, Australia).
Gel distaining buffer
Gel distaining buffer was prepared using 10% of methanol and 7% of acetic acid (Sigma,
Sydney, Australia).
TAE Buffer (Tris-Acetate-EDTA)
To prepare TAE (50x), 242 g Tris base was dissolved in approximately 750 ml deionized
water, followed by addition 57.1 ml of glacial acetic acid and 100 ml of 0.5 M EDTA (pH
8.0). The final volume was adjusted to one litre using deionized water. A working solution of
1x TAE buffer was prepared by diluting the stock solution 50x in deionized water.
TBE buffer (Tris-Borate-EDTA)
To prepare TBE buffer (5x), 54 g Tris base and 27.5 g boric acid were dissolved in
approximately 900 ml of deionized water, followed by the addition of 20 ml of 0.5 M EDTA
(pH 8.0). The final volume was adjusted to one litre using deionized water. A working
solution of 1x TAE buffer was prepared by diluting the stock solution 10x in deionized
water.
Buffer TS (pH 8.2)
To prepare Buffer TS, 50 ml of 0.2 M potassium dihydrogen phosphate and 15.2 ml of 0.2 M
sodium hydroxide were mixed together and diluted to 200 ml of deionized water.

78
PBS (Phosphate buffered saline)
To prepare the PBS solution, 1 tablet (purchased from Sigma-Aldrich Castle Hill, Sydney,
Australia) was dissolved in 200 ml of deionized water and the pH was adjusted to 7.5. Again
the pH was adjusted to 7.0 by adding HCl and the final volume then adjusted to 1 litre by
adding deionized water. The buffer solution was sterilized in an autoclave at 121°C for 15
min, before use.
Citrate acid buffer solution (pH 8.2)
To make the citrate acid buffer solution, 21 g of citrate acid was dissolved in deionized water
to make 1,000 ml (Solution A). Again 28.4 g of disodium hydrogen phosphate was dissolved
in deionized water up to 1,000 ml (Solution B). Finally, 11 volumes of Solution A were
added to 389 volumes of Solution B.
Tris buffer (pH 7)
Tris (hydroxymethyl) aminomethane buffer solution was prepared using appropriate
concentrations of Tris base. The pH was then adjusted to 7.0 using HCl.
Tris-HCl (100 mM)
15.76 g of tris (hydroxymethyl) methylammonium chloride was dissolved in 800 ml of dH2O
and then the pH was adjusted to 8.0 using 5 M NAOH. Finally, the volume was increased up
to 1 litre using dH2O.

79
2.2.3 Stock solutions
Resazurin solution
0.1 g of resazurin was dissolved in 100 ml deionized water, then filtered, sterilised and stored
at 4°C as a stock solution. It was used as a redox indicator in some experiments to monitor
the anaerobic conditions. The final concentration of resazurin used in media was 4 µg/ml.
Tryptone (10% stock)
10 g of tryptone was dissolved in deionized water to make 100 ml of final volume, then
autoclaved and stored at room temperature.
Tween 80 (20% Stock)
20 g of tween 80 was dissolved in 80 ml of deionized water, the final volume was adjusted to
100 ml, then autoclaved and stored at room temperature.
Calcium chloride (10% stock)
To prepare 10% stock calcium chloride, 10 g of CaCl2 was dissolved in 80 ml of deionized
water and the final volume was adjusted to 100 ml by adding more deionized water. After
that the solution was then autoclaved and stored at room temperature.
Peptone water
Peptone water was prepared by dissolving 20.0 g of Buffered Peptone Water (Oxoid) to 1
litre of distilled water as per the manufacturer‘s instructions (pH: 7.2 ± 0.2 at 25°C). The
solution was then sterilized in an autoclave at 121°C for 15 min before use.

80
Bovine serum albumin (BSA) solution
BSA stock solution (1 mg/ml) was diluted in 0.45 M NaH2PO4 to achieve a concentration of
0-100µg. The BSA solution was stored at 4°C.
2.2.4 Reagents
Phosphate solution (0.45 M)
Phosphate solution was prepared by dissolving 70.2 g of NaH2PO4.2H2O in one litre dH20.
The solution was sterilised by autoclaving and then stored at room temperature.
10M NaOH
40 g of sodium hydroxide was dissolved and made up to 100 ml by adding dH2O. The stock
solution was stored at room temperature.
5 M NaCL
29.22 g of sodium chloride was dissolved and made up to 100 ml by adding dH2O. The stock
solution was sterilized by autoclaving and stored at room temperature.
Hydrochloric acid (pH 1.2)
Dilute 81.5 ml of hydrochloric acid was added to deionized water to make up to 1L.
Measurement of pH
The pH of all reagents samples were measured by using a freshly calibrated pH meter (WTW
Gmbh, Germany) in laboratory.
IPG strips:
Ready strips IPG were used for this study. 17cm of pI 5-8 linear IPG strips (6 -16 % gradient
gels) were purchased from Bio- Rad, Ryde, Australia.

81
2.3 Analytical instrumentation
A number of pieces of tools and instruments were used in this study. Some of the tools and
equipment were described as follows:
2.3.1 Encapsulator
Figure 2.1 Inotech Encapsulator ® (Inotech AG, Dottikon, Switzerland) was used in this
study. www.inotech.ch
Product bottle
Reaction vessel with calcium chloride
300 µm nozzle
82
2.3.2 Deoxygenation
In this study the following (Fig. 2.2A) deoxygenation method was used to create anaerobic
conditions in the medium using nitrogen gas. The flasks are better suited to shaking
conditions. In addition, a better estimate of the bacterial growth characteristics can be
obtained when the culture broth is present in sufficient quantities. Thus, to provide extra
ease, simplicity and a better representation of the RBGR of probiotic bacteria, the L-form
tubes were replaced with 250 ml Erlenmeyer flasks containing 100 ml of culture medium.
The protocol therefore needed to be optimized for the Erlenmeyer flasks. The creation and
maintenance of suitable anaerobic conditions in the flasks was achieved by the
deoxygenation of the media. After the completion of the deoxygenation process and the
medium became sufficiently cooled, the nitrogen gas supply was removed and the flask was
sealed immediately with a rubber stopper. The sealed flasks were then incubated at 100 rpm
(Revolutions per minute) and at 37°C for 48h.
Again, to create an aerobic condition, the culture broth was sparged with oxygen (21%) for 3
hrs before the overnight aerobic incubation (Fig. 2.2B). After the completion of the aerobic
process and the medium became sufficiently cooled, the oxygen supply was then removed
and the flask was sealed immediately with a cotton ball. The sealed flasks were then
incubated at 100 rpm at 37°C for 48h (Talwalkar et al., 2001).

83
Figure 2.2 Figure A: Deoxygenating of medium for the estimation of RBGR.
Figure B: Measuring of oxidative stress response in 21% oxygen.
Boiling broth media was sparged with nitrogen gas (5 psi) for 5 mins before overnight incubation.
Culture broth was sparged with oxygen (21%) for 3 hrs before overnight aerobic incubation.
A B

84
2.3.3 2DE gel electrophoresis system
The first-dimension isoelectric focusiong (IEF) and 2nd dimension was performed using (Fig.
2.3) the Multiphor II horizontal electrophoresis apparatus (Pharmacia biotech) connected to
Bio-Rad Powerpac 3000 and Multitemp II thermostatic circulator (Amersham Pharmacia
Biotech).
2.3.4 2DE gel imaging system
The 2DE gels were further analyzed by imaging and spot analysis (Fig 2.4 and 2.5), using a
cooled scanning CCD camera (ProXPRESS, Perkin Elmer Life Sciences) with excitation at
460nm, emission at 650nm and a total exposure time of 10s. Scanning used a dynamic range
of 0 to 65,000 grey levels and a resolution of 100µm.
Thermostatic Electrophoresis PowerPC Electrophoretic tray circulator apparatus
Figure 2.3 2DE gel electrophoresis system (Pharmacia biotech)

85
The images were uploaded into Progenesis Discovery 2005 image analysis software
(Nonlinear Dynamics Ltd.) using ‗single stain‘ experiment. For differential display analysis
the images were pre-warped using ―Progensis Same Spot‖ (Nonlinear Dynamics Ltd., UK)
(Figure 2.5). Proteins within 2DE gels were detected using a top-down algorithm and spot
volumes were quantified and matched following background subtraction. Proteins up or
down-regulated were presented as least square means of normalised volumes ± the standard
error of the difference in means (Figure 2.5).
Figure 2.4 Gel imaging system (ProXPRESS, Perkin Elmer Life Sciences).

86
Figure 2.5 Spots significantly different (down or up regulated by 2-fold or more) in
L.casei Lc1 under 0% oxygen (sample A average) compared to L.casei Lc1 Under
21% oxygen (sample B). Green spot boundaries indicate spots are up-regulated in
sample A compared to sample B. Pink spot boundaries indicate spots are down
regulated in sample A compared to sample B.
Key: Protein spots down-regulated by 2 fold or greater in sample A compared to
sample B
Protein spots up-regulated by 2 fold or greater in sample A compared to sample B

87
2.3.5 Matrix Assisted Laser Desorption Ionisation (MALDI) mass
spectra analysis
Digestion products were released from the gel plugs by sonication then analysed by MALDI-
TOF/TOF mass spectrometry (Fig. 2.6) using the Applied Biosystems 4700 mass
spectrometer.
Figure 2.6 Matrix Assisted Laser Desorption Ionisation (MALDI) mass spectrometry
was performed with an Applied Biosystems 4700 Proteomics Analyser.

88
2.3.6 Laser scanning confocal microscopy (LSCM)
The confocal microscope (Fig.2.7) used for all images was the Leica TCS SP5 (Leica
Microsystems, North Ryde, Australia). All images were obtained using the 63X objective
with oil. All fluorescent dyes were obtained from Invitrogen Australia Pty Ltd, Victoria,
Australia.
Fluorescence images Laser Microscope
Figure 2.7 Laser scanning confocal microscopy manufactured by Leica Microsystems,
North Ryde, Australia.

89
2.4 Microbiological Methods
2.4.1 Storage of bacterial cultures
For long-term storage, 10 ml of concentrated sub-cultures for each bacterial strain was mixed
with 10 ml of 30% glycerol and dispensed into 2 ml of cryovial tubes and then stored at –
80°C.
Unless otherwise stated, the working cultures from these stocks were prepared by streaking a
loopful of stock onto MRS agar containing 0.05% L-cysteine (Sigma, Australia). Plates were
then incubated anaerobically at 37°C for 48-72h. A single colony was used to inoculate MRS
broth, which was then incubated anaerobically at 37°C for 18-24 h to obtain a working
culture.
2.4.2 Growth determination
Cell growth was monitored by measuring optical density (OD) at 600 nm. OD600 was
determined by using a spectrophotometer and samples were diluted in blank MRS (the same
medium being used for growth) to keep the measurements in the linear range of the Beer-
Lambert plot between 0.1 and 1.0.
2.4.3 Viable counts determination
The dilutions of 10-6 for all strains were plated (in triplicate) for both control (0% Oxygen)
and treatment tubes (21% oxygen respectively) for 18 hrs. The plates were then incubated at
37°C for 48-72h (NU-5500 DH Autoflow CO2 air-jacketed incubator, NuAire, Plymouth,
USA), before the cfu/ml was determined. The tubes were stored at -80°C for further use.
The inoculum broth suspension was serially diluted using 0.1% of peptone water and then
100 μl of appropriate dilutions were spreads into the plates on the selective or differential

90
media in triplicate. Unless stated otherwise, all media plates were incubated anaerobically at
37°C for 48h before enumerating the colonies. Plates (containing 25 to 250 colonies) were
enumerated and the mean of six determinations was used to calculate the colony forming
units of growth curves.
2.4.4 Preparation of bacteria encapsulation
A modified method was employed for encapsulation (Fig. 2.8) of bacteria which was based
on a previously described method by Sultana et al. (2000). For each strain, 5 ml of the 18 h
old cultures was added to previously prepared 45 ml of Milli-Q water (Millipore, U.S.A.)
diluted with 2% w/v alginate and 2% w/v starch slurry. The bacteria-starch-alginate slurry
solution was allowed to mix thoroughly for 30 min. using a magnetic stirrer. 5 ml of the
slurry was added drop wise into a beaker containing 300 ml of 0.1M calcium chloride. After
keeping the beads at 4°C for an hour in CaCl2
for further hardening, the calcium chloride
solution was decanted and the beads were washed with 0.85 % sterile saline. All washed
beads originating from 5 ml of the slurry were treated as an inoculum. The whole process
was carried out aseptically in a laminar flow chamber.

91
Figure 2.8 Survivability of encapsulated probiotic bacteria under oxidative stress (21% O2)
and non oxidative stress (0% O2) conditions.
2.4.5 Statistics
Mean values from nine replicates from all experiments were significantly different (P < 0.01)
and correlation statistics (MS Excel software).
2.5 Proteomic analysis
The following flowchart (Figure 2.9) provides an overview of experimental techniques used
in this project.
Strains grown in MRS-cysteine broth
Beads kept an hour in CaCl
2 for hardening
10ml of slurry taken up in a bottle, slurry added dropwise into 0.1M CaCl
2, forming beads
2% alginate – 2% starch slurry
Bacteria-alginate-starch slurry stirred together
Sparge with food grade N2 to
preparing anaerobic condition
Bubbling with 1% O2 to give an oxygenic
environment

92
Figure 2.9 Overview of experimental techniques used in proteomics-based analyses.
Sample preparation (Protein extraction; quantification; i.e. Bradford assay)
Two-dimensional gel electrophoresis (1D SDS- PAGE, Isoelectric focusing; SDS-PAGE)
Visualisation & Image analysis Fixing; staining; digitalisation of gel images & Using Progenesis software
Mass spectrometry (MALDI TOF) Peptide sequences library
Spot excisions and in gel protein digestion
Protein Identification (Peptide sequence libraries)

93
2.5.1 Extraction of proteins (sample preparation)
The Lb. casei Lc1 and Lb. rhamnosus DR20 cell pellets (from 18 hrs old culture) ~ 400 mg
(wet weight) of each sample was lysed with 2D lysis buffer (7M urea, 2M thiourea, 2%
CHAPS, 1% C7 and 10 μL of protease inhibitor cocktail were used to prepare 5 ml of 2D
lysis buffer).
Protein extraction steps: ~ 400 mg of cell pellets (wet weight) were suspended in 1ml of 2D
lysis buffer, then 2 x vortex for 2 minutes followed by sonication in a water bath
(Ultranssonic 700/H, John Morris Scientific) for 15 minutes and then centrifuged at 20,000 x
g for 20 minutes at 20°C. The supernatant (extracted proteins) was collected, desalted and
concentrated by using 5 kDa cut off filter and stored at -80 °C until required.

94
2.5.2 SDS-PAGE of extracted protein
SDS-PAGE for extracted protein was carried out with a vertical slab gel unit (Biorad
Australia) on a precast 4-20% Tris Glycine iGel (Gradipore, Australia) using a SDS Glycine
running buffer as given below:
SDS Glycine Running Buffer (10X):
Trisma Base (Sigma, Australia) 29 g
Glycine (Sigma, Australia) 144 g
SDS Electrophoresis Grade (Sigma, Australia) 10 g
The buffer was diluted 1 in 10 with deionised water. The pH of the 1X buffer was 8.3
Samples were mixed with a sample buffer, which was prepared as given below:
10% (w/v) SDS Electrophoresis Grade 4 ml
Glycerol (Sigma, Australia) 2 ml
0.1% w/v Bromophenol blue (Sigma, Australia) 1 ml
0.5M Tris-HCl, pH 6.8 2.5 ml
β Mercaptoethanol (Sigma, Australia) 0.5 ml
Deionised water 10 ml
The sample buffer containing protein (100 μl of buffer per mg of protein) was heated for 3-5
min at approximately 100°C. The samples were then clarified by centrifuging at 6,000 rpm
for 3 min. 20 μg of protein was loaded per lane and electrophoresis was performed at 150
mV until the tracking dye (Bromophenol blue) reached the bottom of the gel (approximately
90 min). The gel was stained with Coomassie Blue R-250 (Sigma, Australia) for
visualization. Broad range molecular weight standards (Sigma, Australia) were run in
parallel. Destaining of the gel was carried out using Fairbanks destaining protocol
(Gradipore, Australia).

95
2.5.3 Protein quantification
It is essential to determine the quantification of protein prior to electrophoresis to ensure the
equivalent amounts of protein are compared between samples. To know the precise
concentration of the protein extract is vital as small changes in the amount of protein loaded
onto the 2D gels can confound inferences drawn further downstream and so the
determination of protein in the extracts must be must be made in a reliable manner. Direct
quantification of extracted proteins is not possible but proteins can be quantified indirectly
by various assays. The Bradford assay (Bradford, 1976) is a very popular protein
colorimetric assay method because it is simple, rapid, sensitive and inexpensive.
The assay (Fig. 2.10) works by the action of Coomassie brilliant blue G-250 dye. This dye
specifically binds to proteins at arginine, tryptophan, tyrosine, histidine and phenylalanine
residues, causing a shift in the absorption maximum of the dye from 465 to 595 nm. Both
hydrophobic and ionic interactions stabilize the anionic form of the dye and produce a visible
colour change. The assay is useful since the extinction coefficient of a dye-albumin complex
solution is constant over a 10-fold concentration range. The absorption was measured using a
photometer where the degree of absorption is proportional to the amount of protein present
(Bradford 1976).

96
Figure 2.10 An illustration of the Bradford assay, used for measuring the total protein
concentration of a solution. Diagram obtained from www.proteomics.embl.de/.

97
2.5.4 Two-Dimensional Gel Electrophoresis (2D-GE)
2.5.4.1 Isoelectric Focusing (IEF)
The first-dimension isoelectric focusiong (IEF) was performed using (Fig. 2.11) Multitemp
II thermostatic circulator (Amersham Pharmacia Biotech, Rydalmere, Australia).
Figure 2.11 Isoelectric focusing employs an immobilised pH gradient extending the length
of the gel strip. Proteins migrate to the zone where the surrounding pH equals its isoelectric
point, pI. At any other point in the gradient, the protein acquires a charge, which causes it to
migrate toward its pI (green and blue arrows); (figure obtained from:
http://nationaldiagnostics.com/article_info.php/articles_id/65).

98
2.5.4.1 Sodium Dodecyl Sulphate Polyacrylamide Gel Electrophoresis
(SDS-PAGE)
Second dimension separation by SDS-PAGE follows. This process separates proteins
according to their molecular weights (MW). The focused IPG strips were equilibrated in
SDS to disrupt protein structure and confer a negative charge proportional to the mass of
each protein, allowing separation by MW alone. When an electric current was applied, the
larger proteins moved more slowly than smaller proteins. The result was a 2DGE gel with
proteins resolved by charge along the x-axis and by MW along they-axis.
2.5.5 Conductivity and pH measurements
Conductivities and pH of extracted proteins were measured using a conductivity meter (Twin
Cond conductive meter B-173, Horiba) and pH test strips (Bio-rad, North Ryde, Sydney,
Australia) respectively. If the conductivity of a sample was greater than 300 μS/cm it was
then buffer exchanged (7M urea, 2M thiourea, 4% CHAPS) by using a 5 kDa cut off filter.
The pH of the sample was kept greater than 8.5 prior to reduction and alkylation of proteins.
2.5.6 Reduction and alkylation
Each of the treated (21% oxygen) and untreated (0% oxygen) probiotic strains was reduced
with 5 mM (final concentration) Tributyl phosphine (TBP) and alkylated with 15 mM (final
concentration) acrylamide for 90 minutes to break disulphide bridges between cysteine
residues, to prevent their reforming.

99
Chapter 3
Screening and viability of probiotic bacteria under
oxidative stress

100
3.1 Abstract
In dairy products, the viability of anaerobic probiotic bacteria is greatly reduced due to the
atmospheric oxygen during the manufacturing and industrial process. It is essential to
maintain a constant number of microbes (from manufacturing process to consumer) to exert
maximum health benefit. It is crucial to have lethal oxygen resistant probiotic strains in our
industrial process to achieve total probiotic health benefits. In this study our aims were to
increase the viable probiotic bacteria content by introducing toxic oxygen-resistant probiotic
bacterial strains in the dairy products. To achieve our targets we used a screening method
followed by steps by steps selection process (using growth curves, colony counts and
confocal laser scanning microscope) to determine oxygen-resistant probiotic bacterial strains.
The screening process was conducted using RBGR method, previously described by
Talwalker and Kailasapathy (2003). In this study, we investigated a number of probiotic
strains, screened them and finally selected some of them using RBGR and treated them with
different level of oxygen (0% and 21%). Finally, we identified of four different anaerobic
probiotic strains those were able to survive under high oxygen environment. These newly
selected strains were Lactobacillus (L) casei Lc1, L. rhamnosus DR20, Bifidobacterium (B)
lactis Bb12 and B. infantis b1912. The outcome of this study will provide a number of health
benefits to the consumer and it is also beneficial for the dairy industry as it provides them
with a quality dairy product including increased shelf life.

101
3.2 Introduction
Probiotics are live microorganisms designed to maintain the natural balance of organisms in
the human body and are considered one of the key components of a healthy immune system.
These organisms enhances the population of beneficial bacteria in the human gut, suppresses
pathogens and builds up resistance against intestinal diseases, alleviate lactose intolerance,
prevents some forms of cancers, modulates immunity and may lower serum cholesterol
(Kailasapathy and Chin, 2000; Slover and Danziger, 2008).
In the past two decades, probiotic bacteria have been increasingly included in over seventy
commercial food products worldwide including yoghurt, buttermilk, icecream, fermented
milk products, frozen desserts, fruit juice, oat-based products and fermented milks (Mattila-
Sandholm et al., 2002; Chandan, 2006; Shah 2007; Vasiljeyic and Shah 2008). However,
there is no generally agreed concentration of probiotics to achieve maximum therapeutic
benefits. Some researchers suggest that concentration above 106 cfu mL-1 is a minimum
requirement to have a therapeutic effect (Kurmann and Rasic, 1991), while other suggests
>107 and 108 cfu mL-1 is required to achieve satisfactory results (Davis et al., 1971; Ross et
al., 2005; Jayamanne and Adams, 2006). It has been suggested that the maintenance of the
bacterial viability in the probiotic product is the key to achieve maximum health benefits.
However, bacterial viability is significantly decreased during the processing of probiotic
food (Shah et al., 1995). For example, several market surveys reports on commercial
yoghurts have clearly demonstrated that the counts of L. acidophilus and Bifidobacteria were
found far below than the recommended 106 cfu/g at the expiry date of yoghurt (Iwana et al.,
1993).

102
There are significant technological challenges for intestinal probiotic bacteria because of
their sensitivity to many environmental stresses, such as oxygen, heat and acid (Lacroix and
Yildirim, 2007). Oxygen toxicity is considered to be one of the major problems for the
storage and manufacture of probiotic products (De Vries and Stouthamer, 1969; Talwalkar
and Kailasapathy, 2004a). In 1986, Kikuchi and Suzuki proposed a method for the
quantification of the aerotolerance for oral indigenous anaerobic microbes. The proposed
method was based on the finding of Relative Bacterial Growth Ratio (RBGR), which can be
obtained by dividing the absorbancy of growth of aerobically shaken culture with the growth
of anaerobically shaken culture. The RBGR values forms a scale ranging from ∞ with
obligate aerobic microbes to 0 with obligate anaerobic microbes. The whole process then
allows a quantitative measurement of oxygen tolerance in probiotic bacteria.
Dairy products with improved viability of probiotic bacteria over the shelf-life are very
important to deliver adequate numbers of bacterial cells to maintain a healthy gut
environment in humans (Guarner and Malagelada, 2003; Guarner, 2006). In addition, the
reduced oxygen content in the fermented dairy products, such as in yoghurt, will increase the
viability, reduce the incidence of mould attack and also reduce the post acidification. One of
the key factors which control the bacterial viability is the level of oxygen content in the
medium. Most of the probiotic bacteria are anaerobes and oxygen is lethal for their growth
and proliferation. However, the physiological mechanisms of oxidative stress tolerance in
probiotic bacteria are not well understood and the physiological mechanisms may provide
vital information about oxidative stress tolerance in probiotic bacteria. To protect against the
ROS (reactive oxygen species), three major oxidative defence mechanism which play a key
role in maintaining low ROS levels in cellular organelles have evolved. The mechanisms
have been described as follows: (a) preventing the ROS regeneration, (b) quenching of ROS;

103
(c) repair of the damage caused by ROS (Skulachev, 1995). Much of the damage is caused
by hydroxyl radicals generated from H2O2 via Fenton reaction which requires iron and a
source of reducing agent such as nicotinamide adenine dinucleotide (NADH) to regenerate
the metals. A number of molecules such as antioxidant, NADPH (nicotinamide adenine
dinucleotide phosphate-oxidase) and NADH, ascorbate and glutathione have been identified
to have a ROS scavenging role (Cabiscol et al., 2000).
To ensure positive health benefits, probiotic bacteria should survive through the industrial
process and then the gastrointestinal environment to reach the small intestine followed by
large intestine (Ebringer et al., 2008). The International Dairy Federation has recommended
a guideline to achieve positive health benefits; ―the bacteria are active within the expiration
date and with a minimum level of 107 cfu g/L‖ (Ouwehand and Salminen 1998; Pan et al.,
2008).
A number of factors may be responsible for the loss of viability and exposure to oxygen or
oxygen toxicity is considered to be one of the major problems for the storage and
manufacture of probiotic products (De Vries and Stouthamer 1969; Talwalkar and
Kailasapathy, 2004a).
A number of studies have been conducted to consider the ways to protect probiotic bacteria
from toxic oxygen effects. The recommendations include introduction of high oxygen
consumed strains, the use of ascorbic acid (considered as an oxygen scavenger) in yoghurts,
and the use of microencapsulation technique to introduce new packaging material less
permeable to oxygen (Dave and Shah, 1997b) and oxidative stress adaptation (Dave and
Shah, 1997a; Talwalkar and Kailasapathy, 2004b; Bolduc et al., 2006). In 2005, Rochat et al.
developed a technique to evaluate stress-resistant L. lactis MG1363 species. They developed

104
spontaneous oxidative stress (SpOx) resistant mutants that were against other oxidative
stresses, acidic conditions and bile salts. Initially three spontaneous oxidative stress (SpOx)
mutants were selected on H2O2 and those were not shown to be resistant to other stress
conditions (Oliveira et al., 2009). However, in this study we used a a RBGR screening
method followed by series of selection processes (using growth curves, colony counts and
confocal laser scanning microscope) to develop toxic oxygen resistant anaerobic probiotic
strains.
3.3 Aims and objectives
The aims of this study were to screen and select oxidative stress resistant probiotic bacteria.
The objectives of this study were as follows:
To investigate the effects of oxidative stress using RBGR method for the
selection of probiotic bacteria.
To determine the viability of selected probiotic strains (four) using growth curves,
colony counts and confocal laser scanning microscope.

105
3.4 Materials and methods
3.4.1 Probiotic strains and growth
The relative bacterial growth ratio (RBGR) was performed using eleven probiotic bacterial
strains. These probiotic cultures were supplied in freeze-dried form and were obtained from
four different commercial suppliers. L. paracasei LAFTI L26, B. lactis LAFTI B94 & L.
acidophillus LAFTI L10 were provided by DSM Food Specialties Ltd., Sydney, Australia. L.
casei subsp.casei 2603 ASCC, L. rhamnosus 2625 ASCC, B. infantis B1912 ASCC were
provided by Australian Starter Culture Centre, Werribee, VIC, Australia. L. acidophilus LA
5, L. Casei Lc1, B. lactis Bb12 were provided by Chr. Hansen, Bayswater, VIC and
Australia. Bifidobacterium sp. (HOWARU Bifido DR10) and L. rhamnosus (HOWARU
Rhamnosus DR20) strains were provided by Danisco, Copenhagen, Denmark.
The probiotic cultures were obtained in freeze-dried form. The samples were aseptically
added to a small volume of de Man Rogosa Sharpe (MRS) broth (Oxoid, Adelaide,
Australia) and mixed by Pasteur pipette aspirations until no lumps were visible. The culture
was then added to 10 ml of MRS and incubated at 37°C until its coagulated (18-72h).
For the viability test study, the cells were grown aerobically (under 21% O2), and
anaerobically (under 0% O2) and placed in gas jars using the Gas Pak System (Oxoid,
Adelaide, Australia) for 18h at 37 °C in De Man Rogosa Sharpe (MRS) broth (Oxoid,
Adelaide, Australia). The cells were centrifuged at 5000 g for 15 min at 4 °C, harvested and
then washed twice with sterile 0.01 M phosphate buffered saline (PBS).

106
3.4.2 Determination of RBGR
The RBGR method is described in (Figure 3.1) as was previously described by Talwalker et
al. (2003).
Figure 3.1 Schematic diagram of relative bacterial growth ratio (RBGR).
Means and standard deviations were calculated. The entire experiment was replicated for six
times. Relative Bacterial Growth Ratio (RBGR) can be obtained by dividing the absorbancy
of growth of aerobically shaken culture with the growth of anaerobically shaken culture.
The RBGR values were calculated using the following formula:
250 ml erlenmeyer flask containing 100 ml of medium was added to resazurin concentration of 0.002%, then autoclaved for 15 min.
Sprayed nitrogen gas into boiling media for 5 mins. (Figure: 2.2 A)
Then, cool sufficiently for inoculation of the culture and air was pumped in at the same time.
250 ml erlenmeyer flask containing 100 ml of medium was added to resazurin concentration of 0.002% (as a redox-indicator dye), then autoclaved for 15 min.
For anaerobic growth, the flask was plugged with a rubber stopper immediately after removing the nitrogen supply. Inoculated flasks were incubated on a shaker at 100 rpm at 37 °C for 24 h.
For aerobic growth, the flask was plugged with cotton wool; an inoculated flask was incubated on a shaker at 100 rpm at 37 °C for 24 h.
The optical density of aerobic and anaerobic growth, recorded at 600 nm using a Spectronic 20D spectrophotometer.
Bubbling with the 21% of air in boiling media for 3hrs. (Fig. 2.2 B) (Figure: 2A)
Then, cool sufficiently for inoculation of the culture and nitrogen gas was pumped in at the same time.

107
Absorbance of growth of aerobically shaken culture
Absorbance of growth of anaerobically shaken cultureRBGR =
3.4.3 Selection and maintenance of organisms
Previously selected strains, L. casei Lc1, L. rhamnosus DR20, B. infantis 1912 and B. lactis
Bb12 were obtained as freeze-dried samples. The cultures were subcultured separately into
approximately 20 ml of MRS broth and incubated (Laboratory Incubator Thermoline
Scientific Equipment Pty Ltd, Wetherill Park, Australia) anaerobically at 37°C (anaerobic jar
containing AneroGen satchet (Oxoid, Adelaide, Australia) for 48h. The grown cultures were
then vortexed, and repassaged into 20 ml of MRS broth. The 10% inoculum of Lactobacillus
and the 10% inoculum of Bifidobacteria were then incubated (Laboratory Incubator
Thermoline Scientific Equipment Pty Ltd, Australia) anaerobically at 37°C (anaerobic jar
containing AneroGen satchet (Oxoid, Adelaide, Australia) for 18h. The 18h old cultures
were then subcultured periodically and stored at 4C. Later, the cultures were grown and
passaged in CELLSTAR 50 ml PP-test tubes (Greiner Bio-One, Frickenhausen, Germany)
and used throughout all growth experiments. Spread plating was carried out using disposable
spreader bars (Techno plas, South Australia, Australia).
3.4.4 Growth curves
The dilutions of 10-6 for all strains were plated (in triplicate) for both control (0% Oxygen)
and treatment tubes (21% oxygen respectively) for 18h. The plates were then incubated at
37°C for 48-72h (NU-5500 DH Autoflow CO2 air-jacketed incubator, NuAire, Plymouth,
USA), before the cfu/ml were determined. The tubes were stored at -80°C for further use.

108
The inoculum broth suspensions were serially diluted (using 9.9 ml of PBS buffer and 100 μl
of appropriate dilutions) then spread on to the plates containing agar media. Unless stated
otherwise, all media plates were incubated anaerobically at 37°C for 48h before enumerating
the colonies. Plates (containing 25 to 250 colonies) were enumerated and the mean of six
determinations was used to calculate the colony forming units of growth curves.
3.4.5 Preparation of culture for laser-scanning confocal
microscope
The effects of oxidative stress on their viability at the single cell level were studied using the
laser-scanning confocal microscope (LSCM) (Leica TCS SP5, Leica Microsystems, North
Ryde, and Australia). Initially, an 18 h old culture was centrifuged for 5 min at 3000 g at 4
°C to produce a pellet, the supernatant was removed and the cells were resuspended in 10 ml
of MRS broth media. The LIVE/DEAD BacLight bacterial viability kit (Invitrogen, Australia
Pty Ltd) was used to determine the viability of treated (21% O2) and control (0% O2) samples
by mixing 10 μl of SYTO® 9 green fluorescent nucleic acid stain and 10 μl of propidium
iodide (PI), 10 µl of this mixture was added to each sample (L. casei control 0% and treated
21% O2, L. rhamnosus control 0% and treated 21% O2).
Microscopic slides were prepared by adding 5 µl from each sample and were viewed at 20 x
magnification with oil immersion. Both SYTO 9 and PI were excited using the Argon 488
nm laser. The SYTO 9 emission range was measured between 483 nm – 507 nm and PI
between 610 nm – 700 nm. Six random images of each sample were taken at 2048 x 2048
pixels. Six random Z-stacks were also obtained from each sample.

109
3.5 Results and Discussion
3.5.1 Results of RBGR
The differences in oxygen tolerance among these probiotic strains pointed out the necessity
of potential probiotic strains for their sensitivity towards oxygen, before incorporating them
in dairy foods. Both Lactobacillus and Bifidobacteria, which have been attributed for most of
the health benefits, especially needs to be screened for their oxygen tolerance capacity as it is
evident from their low RBGR values. Before incorporating them in dairy foods, such
screening of probiotic bacteria may help to arrest the decline in cell numbers due to oxygen
toxicity and to increase their survivability over the shelf life period.
The RBGR values of the 11 probiotic strains are listed in Table 3.1. Seven Lactobacillus
strains were screened and only two strains, L. casei Lc1 and L. rhamnosus DR-20, were
found to have an RBGR (values 0.93and 0.98) close to 1, indicated as good aerotolerant
strains. On the other hand, from Bifidobacteria only B. infantis 1912 and B. lactis 920 were
found to have an RBGR value close to 1.0, indicated as good aerotolerant strains. However,
Lactobacillus strains were demonstrated to have a better tolerance to oxygen than
corresponding Bifidobacteria strains. All remaining Bifidobacterium strains grew poorly
under aerobic conditions the values highlighted the extreme sensitivity of Bifidobacteria to
oxygen. L. casei 2603, also a probiotic strain, showed good resistance to oxygen with an
RBGR value of 0.84, demonstrating its healthy nature.

110
Table 3.1 The RBGR screening results of 11 probiotic bacterial strains. The results showed
the mean of nine readings.
Species
Aerobically Shaken
OD(optical density) at
600nm
Anaerobically Shaken OD at
600nm
Average RBGR S.D
L. casei subsp.casei 2603 ASCC
1.07 1.27 0.84 0.02
Lactobacillus paracasei LAFTI L26
2.26 2.45 0.92 0.02
Bifidobacterium Lactis Bb12
0.94 1.27 0.74 0.00
Bifidobacterium sp. (HOWARU)BifidoDR10
0.84 1.31 0.64
0.02
Lactobacillus rhamnosus (HOWARU Rhamnosus DR20)
2.46 2.50 0.98 0.07
Lactobacillus acidophillus LAFTI L10
2.41
2.48 0.97 0.16
Lactobacillus rhamnosus 2625 ASCC
2.24 2.37 0.94 0.01
Bifidobacterium infantis B1912 ASCC
0.92 0.98 0.93 0.01
Lactobacillus casei Lc1 ASCC
2.30 2.47 0.93 0.02
Bifidobacterium lactis LAFTI B94
0.47 1.21 0.38 0.00
L. acidophilus LA 5 0.83 1.30 0.63 0.00

111
3.5.2 Growth curves of Lactobacillus
The viability of both L. casei and L. rhamnosus strains (in aerobic and anaerobic conditions)
were observed from 0 to 72h (Figs. 3.2 & 3.3). When treated with oxygen (21%), the
survivality of L. casei Lc1 (oxygen resistant) strains showed that a slightly decrease of viable
cell numbers compared to the control data (0% oxygen) between 0 to 72h (Fig.3.2).
Similarly, when treated with oxygen (21%), L. rhamnosus DR20 (oxygen resistant) showed a
similar decrease of viable cell numbers compared to the control data (0% oxygen) between 0
to 72h (Fig. 3.3). But the overall cell growth of L. casei Lc1 was found to be higher than L.
rhamnosus DR20 both in treated and untreated samples.
Subsequently, the two strains showed similar trends with a decrease in cell numbers at 40, 50
and 72h. The highest cell growth was observed in 16h for L. casei and in 20h for L.
rhamnosus. However, the growth of both strains was sharply decreased from 40 to 72h. The
concentration of untreated L. casei was 4.61 x 10⁸ cfu/ml at 20h, where as with treated L.
casei growth was 2.22 x 10⁸ cfu /ml at 20h. Similarly, the concentration of untreated L.
rhamnosus was 4.95 x 10⁸ cfu /ml at 20h, where as with treated L. rhamnosus was 2.26 x 10⁸
cfu /ml at 20h. It has been reported that the concentration of probiotic bacteria, at above 108
cfu/ ml is the minimum suggested requirement to have a therapeutic effect (Kurman and
Rasic, 1991).

112
Growth curves of L.casei Lc1
0
50
100
150
200
250
300
350
400
450
500
0h 5h 10h 20h 25h 30h 40h 50h 72h
Hours of survival
Via
ble
ce
lls 1
08
cfu
/ml
0% oxygen
21% oxygen
Figure 3.2 The survival rate of L. casei Lc1 under oxidative stress (with 0% and 21%
oxygen treatment). The data was averaged from triplicate samples of L.casei Lc1. The error
bars showed standard deviations (n=6).

113
Growth curves of Lactobacillus rhamnosus DR20
0
100
200
300
400
500
600
0h 5h 10h 20h 25h 30h 40h 50h
hours of survival
via
ble
ce
lls 1
08 c
fu/m
l
0% oxygen
21%oxygen
Figure 3.3 The survival rate of L. rhamnosus DR20 under oxidative stress (with 0% and
21% oxygen treatment). The data was averaged from triplicate samples of L. rhamnosus
DR20. The error bars showed standard deviations (n=6).
In our study, in all cases we found the cell concentrations of bacterial strains were above 108
cfu /ml indicated that in aerobic condition both strains were able to survive with above 108
cfu/ ml, the level of concentration required for a therapeutic effect. By overcoming the toxic
effects of oxygen, it may be possible to increase the viability of dairy products during their
shelf life by employing oxygen resistant strains. The viability of both strains L. casei and L.
rhamnosus were monitored for 72h after the treatment with oxygen (21%) and before the
treatment with oxygen. The strains of L. casei showed 62% viability, where as L. rhamnosus
showed 88% viability, compare to the control (0% oxygen).

114
So the growth curves (Figs. 3.2 & 3.3) of L. casei and L. rhamnosus demonstrated that both
strains were appeared as oxygen resistant strains and these starins are able to survive in
oxygen environment with a minimum loss of viable cells. After a careful consideration, both
strains were selected as oxygen resistant strains and we used these two strains for further
analysis in the following chapters: Chapter 4, 6 and 7.
3.5.3 Growth curves of Bifidobacteria
The viability of both B. lactis Bb12 and B. infantis B1912 strains (in aerobic and anaerobic
conditions) were observed from 0 to 72h (Figs. 3.4 & 3.5). When treated with oxygen (21%)
(repeated six times) the survivality of B. lactis Bb12 (moderate oxygen resistant) was
decreased and the data showed an decrease numbers of viable cells compared to the control
data (0% oxygen) for 0, 5, 10 and 20h, respectively (Fig.3.4). However, when treated with
oxygen (21%), B. infantis B1912 (oxygen resistant) showed a similar decrease of viable cell
numbers when compared to the control data (0% oxygen) at 0, 5, 10 and 20h, respectively
(Fig. 3.5). Subsequently, both Bifidobacteria strains showed similar trends with a decrease in
cell numbers at 40h, 50h and 72h (Figs. 3.4 and 3.5). The highest growth was observed at
18h for B. lactis Bb12 and at 20h for B. infantis B1912. However, the growth of both strains
sharply decreased from 25h to72h.

115
Growth curves of B. lactis Bb12
0
100
200
300
400
500
600
0h 5h 10h 20h 25h 30h 40h 50h 72h
Hours of survival
Via
ble
cel
ls 1
08 c
fu/
ml
0% oxygen 21% oxygen
Figure 3.4 The survival rate of B. lactis Bb12 under oxidative stress (with 0% and 21%
oxygen treatment). The data was averaged from triplicate samples of B. lactis Bb12. The
error bars showed standard deviations (n=6).

116
Growth curves of B. infantis b1912
0
50
100
150
200
250
300
350
0h 5h 10h 20h 25h 30h 40h 50h 72h
Hours of survival
Via
ble
ce
lls o
f 1
08 c
fu/m
l
0% oxygen
21% oxygen
Figure 3.5 The survival rate of B. infantis B1912 under oxidative stress (with 0% and 21%
oxygen treatment). The data was averaged from triplicate samples of B. infantis B1912. The
error bars showed standard deviations (n=6).
The highest concentration of B. infantis B1912 was observed at 22h (0% oxygen treated) and
it was 3.2 X 10⁸ cfu/ ml, where as after the treatment (with 21% oxygen treated) it was 2.4 X
108 cfu/ ml.
Similarly, the highest concentration of untreated B. lactis Bb12 was observed at 24h and it
was 4.88 X 10⁸ cfu/ ml, where as after the treatment (with 21% oxygen treated) it was 1.9 X
108 cfu/ml. It has been suggested that the concentration of probiotic bacteria, above 106 cfu/
mL1 is the minimum requirement to have a therapeutic effect (Kurman and Rasic, 1991). In
our study in all cases we found the concentration of bacterial cells was above 108 cfu/ ml
indicating that in aerobic conditions both strains was able to survive with above 108 cfu/ ml,
the level of concentration needed for a therapeutic effect.

117
So the growth curves (Figs. 3.4 & 3.5) of B. infantis B1912 and B. lactis Bb12 demonstrated
that both strains were appeared as oxygen resistant strains and these starins are able to
survive in toxic oxygen environment with a minimum loss of viable cells. However B.
infantis B1912 showed more resistant in toxic oxygen environment compare to B. lactis
Bb12. After a careful consideration, both strains were selected as oxygen resistant strains and
we used these two strains for further anlysis in the following chapters: Chapter 5 (only B.
infantis B1912), 6 and 7.
3.5.4 Observation of viability for selected Lactobacillus strains using
LSCM
The following figures (Fig. 3.4) showing the laser scanning confocal microscopic (LSCM)
images of L. casei Lc1 and L. rhamnosus DR20 bacterial cells while treated with 21%
oxygen at 37o C for 18h and compared with same cells while treated with 0% oxygen at the
same temperature. All images were taken at 2048 x 2048 pixels and viewed under 20 x
objectives with oil immersion. Three random Z-series were also obtained from each sample
and the images were compiled with the standard procedure.

118
Figure 3.6 (A-D) The image of 3.6A represents L. casei Lc1 (control) while treated without
oxygen (0% O2) and the image of 3.6B represents L. casei Lc1 while treated with oxygen
(21% O2). Similarly, 3.6C represents L. rhamnosus DR20 (control) while treated without
oxygen (0% O2) and 3.6D represents of L. rhamnosus while DR20 treated with oxygen (21%
O2). Red represents live cells while blue represents dead cells for all four micrographs.
For the determination of cell viability, staining of cells were carried out using SYTO-9 and
PI to determine the quantity of live and dead cells. Here ROS played an important role in cell
signalling pathways which also involved in cellular processes including diverse proliferation
that lead to cell death (Witzany, 2008; Klaunig and Kamenduli, 2004).
The above images were obtained using confocal microscope (Fig. 3.6) in conjunction with
the LIVE/DEAD BacLight bacterial viability Kit (Molecular probes, Australia) for L. casei
Lc1 and L. rhamnosus DR20 strains. The effects of oxygen treatments (Fig 3.6B & 3.6D)
Red live Blue dead
B
Red live Blue dead
A
Red live Blue dead
C
Red live Blue dead
D

119
were clearly visible and were indicated by the quantity of live (red) and dead (blue) cells. In
addition, the total cell counts were obtained by direct confocal laser scanning microscope for
L. casei Lc1 (Fig. 3.6B) and L. rhamnosus DR-20 (Fig. 3.6D) which were found to be lower
than controls (Fig. 3.6A for Lc1 and Fig. 3.6C for DR-20). This data would be useful to
visualise the oxidative stress response of probiotic bacteria including their tolerance to
oxygen.

120
3.5.5 Observation of viability for selected Bifidobacterial strains using
LSCM
Figure 3.7 (E-F) Laser scanning confocal microscopic (LSCM) images for Bifidobacterium
infantis B1912 bacterial cells while treated with 21% oxygen at 37o C for 18h (Fig. 3.7F) and
compared with same cells while treated with 0% oxygen at the same temperature (Fig. 3.7E).
Green cells represents live cells, while red cells represents dead cells for all four
micrographs. The images were averaged from six individual samples.
Various studies reported that the microscopic technique itself is inaccurate and it may
significantly under-report the true numbers (Ward et al., 1990). Cell viability can also be
inferred from enzymatic activities such as esterase conversion of carboxyfluorescein
diacetate (cFDA). However, fluorescence microscope, confocal laser scanning microscope
and flow cytometry have been used to detect viable populations through the use of
fluorescent probes (Lipski et al., 2001). If epifluorescence microscope and/or confocal laser
scanning microscope were applied then the method was usually referred to as fluorescence in
situ hybridization (FISH). FISH has been used to study the composition of GIT microbial
Live cells Dead cells
E
Live cells Dead cells
F
Bifidobacterium infantis B1912, treated cells under 21% O2 107cfu/ml
Bifidobacterium infantis B1912 untreated cells grown under 0% O2

121
system (Tannock et al., 2000). The reduction of tetrazolium salts, or dyes such as propidium
iodide, TOTO-1, SYTO 9, carboxyfluorescein and oxonol have been used as viability
indicators (Goktepe et al., 2006). For the determination of cell viability, staining of cells was
carried out using SYTO-9 and PI to determine the quantity of live and dead cells,
respectively (Fig. 3.7E). As stated erlier, these images were obtained using the LSCM (Fig.
3.7 E & F) in conjunction with the LIVE/DEAD BacLight bacterial viability Kit (Molecular
probes, Australia) for B. infantis B1912 strain. The effects of oxygen treatments (Fig 3.7F)
were clearly visible as indicated by the quantity of live (green) and dead (red) cells. In B.
infantis B1912, the concentration of B. infantis B1912 at 20h (0% oxygen treated) was 2.8 X
107 cfu/ ml and after treatment (with 21% oxygen treated) was 1.3 X 10⁷ cfu/ ml,
respectively.
The minimum detection limit for in situ viability staining in conjunction with confocal
scanning laser microscopy enumeration was 107 bacteria/ ml (or equivalent). It has been
suggested that the concentration of probiotic bacteria, above 106 cfu/ mL1 is the minimum
requirement to have a therapeutic effect (Kurman and Rasic, 1991). Here, ROS played an
important role in cell signalling pathways which also involved in cellular processes including
diverse proliferation that leads to cell death (Klaunig and Kamenduli, 2004; Witzany, 2008).
These results indicate that the value of rapid viability test by fluorescence microscopy was
comparable to other conventional methods which can be used for bacterial cell counts in
probiotic products. This data would be useful to visualise the oxidative stress response of
probiotic bacteria including their tolerance to oxygen.

122
Figure 3.8 (G-H) Laser scanning confocal microscopic (LSCM) images for Bifidobacterium
lactis Bb12 bacterial cells while treating with 21% oxygen at 37o C for 18h (Fig. 3.8H) and
compared with same cells while treating with 0% oxygen the same temperature (Fig. 3.8G).
Green cells represents live cells and Purple cells represents dead cells for all four
micrographs. The images were averaged from six individual samples.
The effects of oxygen treatments (Fig 3.8G & 3.8H) were clearly visible those indicated by
the quantity of live (green) and dead (purple) cells. In B. lactis Bb12, the concentration of
bacterial cells after 20h of treatment without oxygen (0% oxygen treated) was 2.9 X
107cfu/ml and after 20h of treatment with oxygen (with 21% oxygen treated) was 1.7 X 10⁷
cfu/ml, respectively. In addition, the total cell counts obtained by direct confocal laser
scanning microscope for B. lactis Bb12 (Fig. 3.8) indicated lower visibility in the treatments
(3.8F) while compared to the controls (3.8). These results indicated that the value of rapid
viability test by fluorescence microscope was comparable to other conventional methods,
which can be used for bacterial cell counts for probiotic products. This data will be very
useful for the determination of oxidative stress response of probiotic bacteria including their
tolerance to oxygen.
Live cells Dead cells
G
Live cells Dead cells
H
123
3.6 Conclusions This study was conducted with an aim to introduce oxidative resistant probiotic strains in the
dairy products to increase the self life of the products. However, after a series of screening
process finally we concluded with four potential oxidative resistant probitic strains, L casei
Lc1, L. rhamnosus DR20, B lactis Bb12 and B. infantis b1912. These four probiotic strains
were further investigated for other characterization tests, described in the following chapters.

124
Chapter 4
Proteome responses of Lactobacillus casei Lc1 and
Lactobacillus rhamnosus DR20 under oxidative
stress

125
4.1 Abstract
Probiotic bacteria form part of the normal human intestinal microbiota. Many dairy products
have incorporated probiotic strains to provide health benefits. However, maintaining viability
of these organisms in high oxygen environments is difficult. Limited information is available
on the cellular growth of probiotic strains and the exposure to oxygen that causes changes to
cellular proteins. The aim of this study was to differentiate protein expression changes due to
oxidative stress and to identify the differentially expressed proteins. The relative bacterial
growth ratio (RBGR) was determined for eleven probiotic strains. Among them, two strains,
Lactobacillus (L) casei Lc1 and L. rhamnosus DR20 were selected. At an exposure at 21
% oxygen, both L. casei Lc1 and L. rhamnosus DR20 were found to be oxygen-resistant
strains. The laser scanning confocal microscopy (LSCM) results showed that the number of
viable oxygen-sensitive cells was comparatively less than the oxidative stress resistant cells.
After the completion of oxygen treatments on both strains, two-dimensional gel
electrophoresis analysis exhibited three proteins with differential expression by 3-fold or
more and 118 proteins by 2-fold or more for L. casei Lc1. Four differentially expressed
proteins were identified by MALDI MS-MS (mass spectra) analysis. Treated L. rhamnosus
DR20 exhibited no apparent stress-related proteins.

126
4.2 Introduction
The lactic acid bacteria (LAB) such as Lactobacillus (L.) spp. are Gram-positive and non-
sporulating anaerobic bacteria. The LAB has been used world wide in the production of
dairy food products, macromolecules, and enzymes metabolites (Pfeiler et al., 2007; Lee et
al., 2005). During LAB incorporation into dairy products, the exposure to reactive oxygen
species (ROS) such as superoxide and hydrogen peroxide (H2O2) causes oxidative stress; this
results in LAB cell death (Ahn et al., 2001; Lushchak, 2001; Talwalkar and Kailasapathy,
2003a; Serrazanetti et al., 2009). The LAB uses three major defence mechanisms for
protection from the toxic effects of ROS; preventing ROS regeneration, quenching of ROS
and repairing the damage caused by the ROS (Skulachev, 1995; Cabiscol, 2000; Klaunig and
Kamenduli, 2004; Bruno-Barcena et al., 2004; Zhao and Li, 2008). It has been reported that
both L. rhamnosus and Bifidobacterium (B) infantis are capable of resisting oxidative stress
to some extent (Zaizu et al., 1993; Van de Guchte et al., 2002; Talwalkar and Kailasapathy,
2004c).
Limited information is available on the cellular growth of probiotic strains and their
exposure to oxygen or oxidative stress that causes changes to cellular proteins. Identifying
the proteins associated with the oxidative stress will provide key information on the
mechanism of the oxidative stress response by the LAB. Proteomic approaches have been
applied to several probiotic bacterial species such as Lactococcus lactis, Streptococcus
thermophilus, L. acidophilus, and Propionibacterium freudenreichii (Champomier-Verges et
al., 2001; Manso et al., 2005; Wu et al., 2009; Hussain et al., 2009) and have been used in
fermented dairy products for understanding various stress responses such as acid, high
pressure and bile salts stress (Oliver et al., 2002; Len et al., 2004; Vogel et al., 2005;
Hormann, et al., 2006; Behr et al., 2007). Few studies have described the oxidative stress

127
responses and protein expression of LAB though glutathione reductase, thioredoxin,
thioredoxin reductase, NADH oxidase, catalase, pseudocatalase and RecA were over
expressed in L. lactis and identified by gene sequencing (Bolotin et al., 1999; Leverrier et al.,
2004). Other enzymes such as NADH oxidase, NADH peroxidase, superoxide dismutase,
thioredoxin reductase, pyruvate oxidase were reported to be present in various Lactobacillus
strains due to oxidative stress or stresses from other toxic derivatives. These enzymes were
identified by using various biochemical methods other than proteomic approaches (Condon
1987; De Angelis and Gobetti, 1999; Talwalkar and Kailasapathy, 2003a). There are no
published reports available on the differential expression of proteins from oxidative stress of
L. casei and L. rhamnosus. In addition, to-date no published reports are available that utilize
proteomic technology to profile the expression of protein changes or to identify the proteins
caused by oxidative stress in any probiotic strain.
In this work, we have used proteomic technology to identify proteins from two strains of
probiotic bacteria (oxygen-sensitive strain L. casei Lc1 and oxygen-tolerant strain L.
rhamnosus DR20) grown with or without oxygen treatment. These two strains were selected
from ten different probiotic strains after a screening process involving various levels of
oxygen treatments. Understanding the response to oxidative stress at the protein level will
provide key information on the mechanisms involved in the oxidative defence process.
4.3 Aim and objectives
The aim of this part of the study was to investigate the physiological basis of oxidative stress
by identifying and characterising differentially expressed proteins (from L. casei Lc1 and L.
rhamnosus DR20) using 2D-gel electrophoresis whether the proteins were either over
expressed or repressed in both strains because of oxygen treatment to the cells.

128
4.4 Methods of proteome analysis
4.4.1 Growth of microorganisms
The bacterial strains used for this project were L. Casei Lc1 ASCC, L. rhamnosus DR20
from ASCC were obtained from Australian Starter Culture Research Centre, Werribee, VIC,
Australia, DSM Food Specialties Ltd., Melbourne, Australia. Bacterial cells were grown
aerobically and also anaerobically in gas jars using GasPak System (Oxoid, Adelaide,
Australia) for 24h at 37 C in de Man Rogosa Sharpe (MRS) broth (Oxoid, Adelaide,
Australia). The cells were harvested at 5000 g for 15min at 4 C and washed twice with sterile
0.01M phosphate buffered saline (PBS) solution.
4. 4. 2 Extraction of proteins
Extraction of protein sample preparation is explained earlier in 2.5.1.
4.4.3 Conductivity and pH measurements
Conductivities and pH of extracted proteins was measured using a conductivity meter (Twin
Cond conductive meter B-173, Horiba) and pH test strips respectively. If the conductivity of
a sample was greater than 300 μS/cm it was then buffer exchanged (7M urea, 2M thiourea,
4% CHAPS) by using a 5 kDa cut off filter. pH of the sample was kept greater than 8.5 prior
to reduction and alkylation of proteins.

129
4.4.4 Reduction and alkylation
Each of the probiotic strains treated (21% oxygen) and untreated (0% oxygen) was reduced
with 5 mM (final concentration) Tributyl phosphine (TBP) and alkylated with 15 mM (final
concentration) acrylamide for 90 min to break disulphide bridges between cysteine residues
and to prevent them from reforming.
4.4.5 Protein quantitation
Protein content in each (treated (21% oxygen) and untreated (0% oxygen) strain was
determined using the Bradford (Sigma) Protein assay kit using BSA as a standard. The
results of the Bradford assay were used to determine the aliquot size to be taken from each of
the samples to ensure that an equal amount of protein was taken from each sample for
creating composite samples.
4.5 Two-dimensional gel electrophoresis (2-DE)
One-dimensional sodium dodecyl sulfate polyacrylamide gel electrophoresis (1-D SDS-
PAGE or 1-DE) has been used for several decades to separate total protein extracts based on
protein‘s molecular weight (size) difference. However 1-DE can not resolve more than 80-
100 different protein components where cell proteomes are extremely complex having
several thousand of proteins. O‘Farrell firstly introduced high-resolution two-dimensional
sodium dodecyl sulfate polyacrylamide gel electrophoresis (2-D SDS-PAGE or simply 2-
DE) for separation complex protein mixture in 1975 (O‘Farrell 1975). 2-DE is not only used
for complete protein separation but also to analyze the protein alterations due to
environmental stress conditions and to detect co- and post-translation modification which

130
can not be determined from genome sequence. Mainly 2-DE is used as a component of
proteomics and is the step used for separation of proteins for further characterization by mass
spectrometry (MS). 2-DE separates protein mixture according to two distinct properties of
proteins, isoelectric point (pI) in the first dimension and molecular mass (Mr) in the second
dimension. More generally, isoelectric focusing (IEF) is coupling with sodium dodecyl
sulfate polyacrylamide gel electrophoresis (SDS-PAGE) for total proteins separation.
Today‘s modern 2-DE systems has a capacity to separate up to 10,000 protein spots on one
gel theoretically by capability of approximately 100 protein separation in each dimension.
Depending on the pore size in acrylamide gels and pH gradient used, 2-DE systems can
resolve more than 5000 proteins simultaneously having nearly 2000 proteins routinely and
able to detecting and quantifying protein amounts of nearly 1 ng per spot.
4.5.1 (1st
dimensional: iso-electric Focusing, IEF)
A 2D gel was run to determine the differentially expressed proteins and the densitometry of
band intensities to observe the variation in the proteins between treated and untreated
samples.
Following reduction and alkylation, 750 μg each of the sample (for triplicate IPG strips,
therefore each strip contains 250 μg of proteins) was made up to 900 μl with 2D buffer
(contains 1% carrier ampholyte pH 3-10). The samples were centrifuged at 20,000 g for 10
min at 20°C. The sample (300 μl) was then loaded onto each of 17cm pI 5-8 linear IPG strips
and rehydrated for 6 h. Rehydrated IPG strips (containing protein samples) were focused on
an Ettan IPG phor 2 using the following profile:
1 300 volts for 2 h.
2. Linear increase from 300 volts to 8000 volts over 8 h.
131
3. Hold at 8 h until approximately 140 KVh has been reached.
Throughout the focusing the current limit was set at 50 μA/ strip at 20°C.
4.5.2 2nd dimensional SDS PAGE
The focused IPG strips were equilibrated for approximately 2 x 15 min in equilibration
buffer (6M urea, 3% SDS, 20% glycerol, 1 x tris-HCl buffer) then ran in the second
dimension on 17 cm 6 -16 % gradient gels (7mA/gel) overnight followed by 40mA/gel until
bromophenol blue dye front (from the agarose embedding solution) had just run off the
bottom of the gel). The 2nd
dimension gel gradient was chosen based on the information
gathered from 1-D SDS PAGE gel. However, 1-D SDS PAGE gel was carried out to observe
the quality of the protein extraction procedure and densitometry of band intensities was
performed to observe variation in the protein load between samples (for the purpose of
optimisation of protein concentration).
4.5.3 Fixing, staining and destaining
The final component of 2-DE experiment is visualization of separated protein spots on gels
either by universal or by specific staining methods. Universal staining methods for protein
detection on two-dimensional gels include staining with Coomassie blue dye, silver staining,
negative staining with metal cations (e.g. zinc imidazole), staining or labeling with organic
or fluorescent dyes, detection by radioactive isotopes, and by immunological detection. But,
in the recent years, fluorescent dyes were introduced and provide high detection sensitivity,
dynamic range and reproducibility. In this study proteins were stained with a fluorescent dye
SYPRO Ruby (Rabilloud, et al. 2001) after the electrophoretic separation. The detection

132
limit is nearly 1-2 ng protein per spot, and it is compatible with mass spectrometry.
However, their usage remains relatively limited due to their cost and technical difficulties.
Gels were fixed in 10% methanol and 7% acetic acid for 2 hours and stained with SYPRO®
Ruby staining solution at room temperature overnight. Gels were then 2 x de-stained with
de-staining buffer and 1 x with 1 % acetic acid.
4.5.4 Protein spot visualisation and data acquisition
After staining the gel, the gel images have to be converted into digital data using a scanner or
camera and then analyzed with a computer program such as, ExQuest. This program have a
capability for spot detection, spot filtering, spot editing, background correction, gel
matching, normalization, quantification, etc. However, protein spots from SYPRO Ruby
stained gels were cut using an ExQuest Robotic fluorescent spot cutter (cutting head – 1 mm
diameter) equipped with a CCD camera (Bio-Rad, USA) and the gel plugs were placed on a
96-MTP plate.
A Typhoon Trio 9400 variable mode imager was used to scan the images at 100 μm
resolution with 457 nm excitation and 610 nm BP 30 emission filters.
The images were acquired one gel at a time. A laser scanner, Typhoon Trio (GE Healthcare),
was used to acquire images of the gels. The emission filters used for acquisition of images
were 610 nm for Sypro Ruby. The PMT voltage was set to a point where the most abundant
protein spots (2 to 3 spots) in a gel began to saturate while leaving areas of interest
unsaturated. Gels were scanned at 100 µm resolution and the images were saved as 16-bit.gel
files. Finally it can be concluded that the position of protein spots in polyacrylamide gel do
not provide exact identification of it. For that reason, protein spots (i.e. newly expressed and
up- or down-regulated) are excised from gel and digested (in-gel digestion) into peptide

133
fragments with specific enzyme (generally trypsin) and then identified using mass
spectrometry and database searches.
4.5.5 Image analysis
The images were uploaded into Progenesis Discovery 2005 image analysis software
(Nonlinear Dynamics Ltd.) using a ‗single stain‘ experiment. For differential display analysis
images were pre-warped using ―Progensis Same Spot‖ (Nonlinear Dynamics Ltd., UK) with
90 warp vectors. Spots were detected using an auto spot detection method and then the spots
were manually edited, deleted spots which are not possible to analyse, deleted streaks and
removed the background.
4.5.6 Protein identification by MALDI MS/MS (mass spectra)
analysis
4.5.6.1 Spot cutting and tryptic digestion for MALDI MS/MS analysis
Eleven protein spots from SYPRO Ruby stained 2-D gels were cut using an ExQuest Robotic
fluorescent spot cutter (cutting head – 1 mm diameter) equipped with a CCD camera (Bio-
Rad, MA, USA) and placed in a 96-MTP plate. Gel plugs were washed (wash solution -25
mM ammonium bicarbonate in 50% acetonitrile) three times for 10 min each in a 37ºC oven.
Then, the gel plugs were dried with 100% acetonitrile to complete dryness for approximately
10 min at room temperature. After that, 20µL of trypsin solution (Promega, USA) (15ng/µL
in 25mM ammonium bicarbonate) were added to the dry gel plugs and incubated at 4ºC for
1h to allow for the gel plugs to rehydrate with the trypsin solution. After one hour

134
rehydration, the excess trypsin was removed and 20 µL of 25 mM ammonium bicarbonate
was added to each gel plug and incubated at 37ºC overnight. Next morning peptides were
then guanidated (0.25 mg/mL O-methylisourea sulfate in 10% ammonium hydroxide) to
improve the detection of lysine terminated peptides by MALDI (Joss et al., 2006). The
resulting peptides were re-acidified by adding 8.25% TFA (v/v) in the peptide solution,
desalted and concentrated by zip-tip (Perfect Pure C18, Eppendorf) and spotted onto a
MALDI sample plate with 1 μL of matrix (α-cyano-4-hydroxycinnamic acid, 4 mg/mL in
70% v/v acetonitrile, 0.06% v/v TFA, 1 mM ammonium citrate) and allowed to air dry.
4.5.6.2 Data acquisition by MALDI mass spectra analysis
In the last ten years, both matrix-assisted laser desorption ionization (MALDI) mass
spectrometry (MS) and electrospray ionization MS have played more important roles in the
identification and structural characterization of bacterial proteins (Seto et al., 2005). Matrix
Assisted Laser Desorption Ionisation (MALDI) mass spectrometry was performed with an
Applied Biosystems 4700 Proteomics Analyser. A Nd: YAG laser (355 nm) was used to
irradiate the sample. The spectra were acquired in reflection mode in the mass range 700 to
3500Da and are externally calibrated using known peptide standards (pepmix, bradykinin,
neurotensin, angiotensin and ACTH). The instrument was then switched to MS/MS
(TOF/TOF) mode where the eight strongest peptides from the MS scan were isolated and
fragmented (by collision-induced dissociation using filtered laboratory air), then re-
accelerated to measure their masses and intensities. A near point calibration was applied and
gave a typical mass accuracy better than 50 ppm.

135
4.5.6.3 Database search for Protein Identification
The data (peptide peak list) was exported in a format suitable for submission to the database
search program, Mascot (Matrix Science Ltd, London, UK). All samples were searched
against bacteria entries in the NCBInr database (20081107). High scores in the database
search indicated a likely match, confirmed by a qualified operator inspection. Positive
identification should take into account the percentage sequence coverage, the difference
between calculated and observed peptide masses, the number of missed cleavages (if missed
cleavages are present their location in the sequence is critical) and how well the MW and pI
of the identified protein match in other experimental data such as 2-DE indication.

136
4.6 Results and Discussion
In the present study, we used a proteomic approach to identify total proteins those were
present in both Lactobacillus casei Lc1 and Lactobacillus rhamnosus DR20 strains with
(21% oxygen) and without (0% oxygen) oxygen treatment. Proteins were extracted from the
probiotic bacterial cells using a mild wash in phosphate buffer and analysed by sodium
dodecyl sulphate-polyacrylamide gel electrophoresis. Gel bands were excised and in-gel
digested with trypsin. The resulting peptides were analysed by MALDI (Matrix Assisted
Laser Desorption Ionisation) MS/MS (mass spectrometry).
4.6.1 1D SDS PAGE analysis
Initially, proteins were extracted from bacterial cells with a sample solution that contained
two types of detergents such as CHAPS and C7BzO which include two chaotropic reagents;
urea and thiourea. This sample solution is used for global protein extraction that represents
both cytoplasmic and membrane or membrane-associated proteins. A CHAP (Sigma,
Sydney, Australia) is a mild detergent suitable for cytoplasmic proteins and C7BzO is a
strong detergent and is efficient in extracting membrane proteins (Luche et al., 2003). The
view of global protein extraction in this work enabled the observation of any changes in the
protein profiles of either cytoplasmic or membrane proteins due to the oxygen treatment on
the bacterial cells. After that samples were loaded onto a 1D SDS-Polyacrylamide gel (4-
20% criterion gradient gels) and visualized by Coomassie blue staining (Fig. 4.1).

137
1D SDS-PAGE
Figure 4.1: Image of 1SDS PAGE, where 4-20% criterion gradient gels were used. Serial
diluted (2, 1, 0.5 and 0.25 µl) extracted proteins were used in sample A (Lactobacillus casei
Lc1, treated with 0% oxygen), B (Lactobacillus casei Lc1, treated with 21% oxygen), C
(Lactobacillus rhamnosus DR20, treated with 0% oxygen) and D (Lactobacillus rhamnosus
DR20, treated with 21% oxygen).
1. Marker
2. Sample A (2 µl of sample) 10. Sample C (2 µl of sample)
3. Sample A (1 µl of sample) 11. Sample C (1 µl of sample)
4. Sample A (0.5 µl of sample) 12. Sample C (0.5 µl of sample)
5. Sample A (0.25 µl of sample) 13. Sample C (0.25 µl of sample)
6. Sample B (2 µl of sample) 14. Sample D (2 µl of sample)
7. Sample B (1 µl of sample) 15. Sample D (1 µl of sample)
8. Sample B (0.5 µl of sample) 16. Sample D (0.5 µl of sample)
9. Sample B (0.25 µl of sample) 17. Sample D (0.25 µl of sample)
The 1-D SDS-PAGE protein profile indicates that proteins were purified successfully and
also it was clearly visible that several proteins are present in both Lactobacillus casei Lc1
1 2 3 4 5 6 7 8 9 10 11 12 13 14 15 16 17
250
150
100
75
50
37
2520
15
10
1 2 3 4 5 6 7 8 9 10 11 12 13 14 15 16 171 2 3 4 5 6 7 8 9 10 11 12 13 14 15 16 17
250
150
100
75
50
37
2520
15
10
138
and Lactobacillus rhamnosus DR20 strains with and without oxygen treatment (Fig 4.1).
Further analysis of differentially expressed proteins was pursued by 2DE.
4.6.2 Two-dimensional electrophoresis (2-DE) analysis
Two-dimensional sodium dodecyl sulfate polyacrylamide gel electrophoresis (2-D SDS-
PAGE or simply 2-DE) or 2-DE separates protein mixture according to two distinct
properties of proteins, where isoelectric point (pI) in the first dimension and molecular mass
(Mr) in the second dimension. The 2-DE systems can resolve more than 5000 proteins
simultaneously and having nearly 2000 proteins routinely and also able to detecting and
quantifying protein amounts of nearly 1 ng per spot. Here, 2-DE was used as a component of
proteomic study and particularly this step was used for the separation of proteins for further
characterization by using mass spectrometry (MS).
In this study, 2DE was performed (Fig. 4.2) for the samples of proteins previously extracted
from both L. casei Lc1 and L. rhamnosus DR20 grown with or without oxygen (and with
21% and 0% oxygen) and incubated at 37° C for 24h. Later, the detection proteins were
performed by SyproRuby staining, according to the methodology described in section 2.3.4
(Fig. 2.5).
4.6.3 Detection and analysis of protein spots
Briefly, following two dimensional electrophoresis gels were stained and stained images
were captured using a cooled scanning CCD camera (as described in chapter 2). These 2-DE
gel images were analysed by computer-aided software (Progenesis Discovery 2005 image
analysis software, Nonlinear Dynamics Ltd.). 2-DE gel profiles (Figures 4.2, 4.3, 4.5 and

139
4.6) showed significant visual differences in protein expression between the cells of L casei
Lc1 and L. rhamnosus DR20 grown with 0% and 21% oxygen respectively.
2DE protein spot analysis was performed in triplicate and those 2DE gel images were
described in Figures 4.2 (Identical and triplicate 2- dimensional electrophoresis gel images of
A1, A2 and A3. Where A = Lactobacillus casei Lc1, grown in 0% oxygen and incubated at
37°C for 24h), 4.3 (Identical and triplicate 2- dimensional electrophoresis gel images of B1,
B2 and B3. Where B = Lactobacillus casei Lc1, grown in 21% oxygen and incubated at 37°
C for 24h) Figures 4.5 (Identical and triplicate 2- dimensional electrophoresis gel images of
C1, C2 and C3. Where C = Lactobacillus rhamnosus DR20, grown in 0% oxygen and
incubated at 37° C at 37°C for 24h) and 4.6 (Identical and triplicate 2- dimensional
electrophoresis gel images of D1, D2 and D3. Where, D = Lactobacillus rhamnosus DR20,
grown in 21% oxygen and incubated C at 37°C for 24h).
However it was hypothesized that the differential expression in proteins (between the cells
grown in 0% and 21% oxygen), also translate the physiological adaptation and changes in
specific proteins in response to oxidative stress.
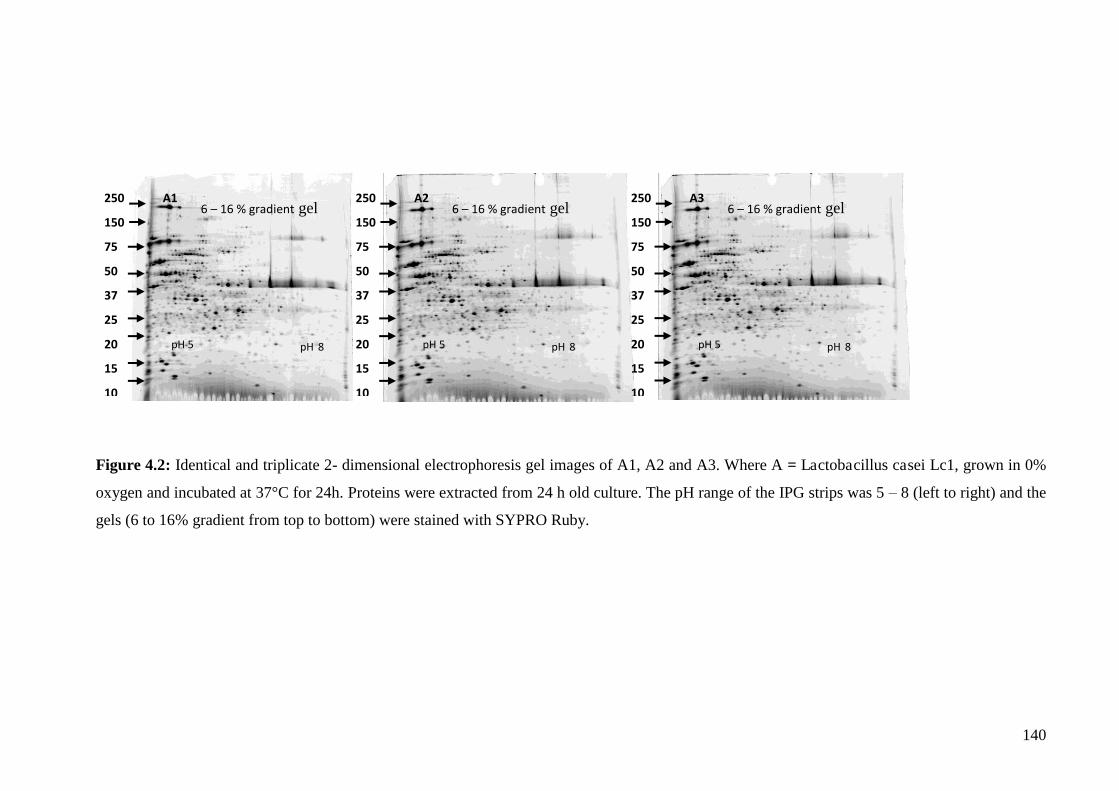
140
Figure 4.2: Identical and triplicate 2- dimensional electrophoresis gel images of A1, A2 and A3. Where A = Lactobacillus casei Lc1, grown in 0%
oxygen and incubated at 37°C for 24h. Proteins were extracted from 24 h old culture. The pH range of the IPG strips was 5 – 8 (left to right) and the
gels (6 to 16% gradient from top to bottom) were stained with SYPRO Ruby.
250
150
75
50
37
25
20
15
10
A2
6 – 16 % gradient gel
pH 5 pH 8
250
150
75
50
37
25
20
15
10
A1
6 – 16 % gradient gel
pH 5 pH 8
250
150
75
50
37
25
20
15
10
A3
6 – 16 % gradient gel
pH 5 pH 8

141
Figure 4.3: Identical and triplicate 2- dimensional electrophoresis gel images of B1, B2 and B3. Where B = Lactobacillus casei Lc1, grown in 21%
oxygen and incubated at 37°C for 24h. Proteins were extracted from 24 h old culture. The pH range of the IPG strips was 5 – 8 (left to right) and
the gels (6 to 16% gradient from top to bottom) were stained with SYPRO Ruby.
250
150
75
50
37
25
20
15
10
B1
6 – 16 % gradient gel
pH 5 pH 8
250
150
75
50
37
25
20
15
10
B3
6 – 16 % gradient gel
pH 5 pH 8
250
150
75
50
37
25
20
15
10
B2
6 – 16 % gradient gel
pH 5 pH 8

142
Figure 4.4 Red circled [ ] spots indicated proteins those were down-regulated by 3 fold or
greater in L. casei Lc1 (while grown in 21% oxygen). Similarly, green circled [] protein
spots indicates as up-regulated by 3 fold or greater in L. casei Lc1 (while grown in 21%
oxygen). All gels were run in triplicates and representative gels were shown in this figure.
pH 5 pH 8 6 – 16 % gradient gel

143
Figure 4.5 Identical and triplicate 2- dimensional electrophoresis gel images of C1, C2 and C3. Where C = Lactobacillus rhamnosus DR20, grown
in 0% oxygen and incubated at 37°C for 24h. Proteins were extracted from 24 h old culture. The pH range of the IPG strips was 5 – 8 (left to right)
and the gels (6 to 16% gradient from top to bottom) were stained with SYPRO Ruby.
250
150
75
50
37
25
20
15
10
C3
6 – 16 % gradient
pH 5 pH 8
250
150
75
50
37
25
20
15
10
C3
6 – 16 % gradient
pH 5 pH 8
250
150
75
50
37
25
20
15
10
C1
6 – 16 % gradient
pH 5 pH 8

144
Figure 4.6: Identical and triplicate 2- dimensional electrophoresis gel images of D1, D2 and D3. Where D = Lactobacillus rhamnosus DR20, grown
in 21% oxygen and incubated at 37°C for 24h. Proteins were extracted from 24 h old culture. The pH range of the IPG strips was 5 – 8 (left to right)
and the gels (6 to 16% gradient from top to bottom) were stained with SYPRO Ruby.
250
150
75
50
37
25
20
15
10
D2
6 – 16 % gradient
pH 5 pH 8
250
150
75
50
37
25
20
15
10
D3
6 – 16 % gradient
pH 5 pH 8
250
150
75
50
37
25
20
15
10
D1
6 – 16 % gradient
pH 5 pH 8

145
The key objective of this study was to find the differential expression of proteins between the
two culture conditions, with (21%) and without (0%) oxygen treatment, which was also
achieved through these two conditions and those proteins were selected for further
comparison tests. The identification and the comparison of previously detected proteins were
intiated using computer software (Progenesis Discovery 2005 image analysis software)
which facilitated the marking of protein spots on 2-DE gels (Fig. 4.4) and assigning a unique
identification number in each case which provided the basis of align and match the gels. In
Figure 4.4, red circled spots indicated the proteins those were down-regulated by 3 fold or
greater in L. casei Lc1 (while grown in 21% oxygen). Similarly, the green circled spots
indicated the proteins those were up-regulated by 3 fold or greater in L. casei Lc1 (while
grown in 21% oxygen). However, a number of spots were excised and selected for the
identification by MALDI-TOF/TOF (or MALDI-MS/MS) mass spectra analysis.
We observed a large number of protein species with molecular mass ranges from 10 to 200
kDa in the pH range from 5 to 8 and the proteins were separated on the 2-DE gels with high
resolution for both L. casei Lc1 and L. rhamnosus DR20 strains with and without oxygen
treated samples (Figures 4.2, 4.3, 4.5 and 4.6). Initially we attempted to separate proteins
with a pH range from 3 to 10 and from 4 to 7 (data not shown) but it appeared that the pH
range 5-8 was the most suitable for these samples and the majority of proteins were separated
in this pH range with high resolution. Therefore, pH 5-8 was considered for this work.
Although we observed a large number of proteins on the gels with high resolution, but still
we may have missed some proteins belonging in the pH ranges below 5 and over 8.
However, our data suggested that we resolved more proteins with high resolution of 2-DE
gels containing probiotic bacteria compared to other reports (Hormann et al., 2006; Koistinen
et al., 2007; Lee et al., 2008).

146
4.6.4 Image Analysis
The final component of 2-DE experiment was the visualization of separated protein spots on
gels either by universal or by specific staining methods. In this study proteins were stained
with a fluorescent dye SYPRO Ruby (Rabilloud, et al. 2001) after the electrophoretic
separation. The detection limit is nearly 1-2 ng protein per spot, and it was also compatible
with mass spectra analysis. However, their usage remains relatively limited due to their cost
and technical difficulties.
Protein spots from SYPRO Ruby stained gels were cut using an ExQuest Robotic fluorescent
spot cutter (cutting head – 1 mm diameter) equipped with a CCD camera (Bio-Rad, USA)
and the gel plugs were placed on a 96-MTP plate.
After staining the gel, the gel images were converted into digital data using a scanner or
camera and then analyzed with a computer program called ExQuest. This program have a
capability for spot detection, spot filtering, spot editing, background correction, gel matching,
normalization, quantification, etc. Finally it can be concluded that the position of protein
spots in polyacrylamide gel do not provide exact identification of it. For that reason, protein
spots (i.e. newly expressed up or down-regulated) were excised from gel and digested (in-gel
digestion) into peptide fragments with a specific enzyme (generally trypsin) and then
identified using mass spectra analysis and database searches.
Previously collected gel images were subjected to image analysis using Progenesis software.
Only proteins that were common in comparing samples set (for example samples from L.
casei Lc1 treated with and without oxygen and L. rhamnosus DR20 treated with and without
oxygen) were considered for differential display analysis. There were 822 proteins (averaged
from six gels) detected in L. casei Lc1 treated with oxygen and without oxygen samples
(Figure 4.2 and 4.3). Among them, two proteins were differentially expressed 4-fold or more

147
in oxygen treated L. casei Lc1 compared to no oxygen treatment and another 70 proteins
were differentially expressed by 2 to 4-fold (Table 4.1 & 4.2). However, proteins those were
changed less than 2-fold (either over expressed or repressed) were not considered for the
comparative analysis in this work, therefore higher statistical confidence could be achieved.
Clearly visible protein spots were showed on the 3D- view with the L. casei Lc1 and L.
rhamnosus DR20 (4.11A & 4.11B). For L. rhamnosus DR20, there were 1062 proteins
(averaged from six gels) detected that were treated with oxygen (Fig. 4.11B), whereas
without oxygen treatment, only one protein was differentially expressed by 4-fold or more
and 48 proteins were differentially expressed by 2 to 4-fold (Table 4.2 and 4.3).
Table 4.1 Summary of the differentially expressed proteins detected by image analysis in L.
casei Lc1 and L. rhamnosus DR20.
Criteria Fold change in B (21% O2)
compared to A (0% O2)
Fold change in D (21% O2)
compared to C (0% O2)
Fold change # spots over
expressed
# spots
repressed
# spots over
expressed
# spots
repressed
4-fold or more
>2 but < 4-fold
2
63
Nil
7
1
43
Nil
5
1 Spots were differentially expressed (over expressed or repressed) in sample B (with oxygen
treatment in L. casei) compared to sample A (no oxygen treatment in L. casei) and similarly,
spots were differentially expressed (over expressed or repressed) in sample D (with oxygen
treatment in L. rhamnosus) compared to sample C (no oxygen treatment in L. rhamnosus).

148
Table 4.2 The following table represents identified proteins those were found as up regulated
by more than 2 fold and down regulated by less than 2 fold in Lactobacillus casei Lc1 with
0% oxygen compared to 21% oxygen.
Average results of Lactobacillus casei Lc1 with 0% oxygen
Average results of Lactobacillus casei Lc1 with 21% oxygen
Spot number Spot volume Spot number Spot volume Fold-change a T-test (p)
UP-REGULATED SPOTS 3 38.671 3 10.120 3.800 0.0004 6 21.884 6 7.187 3.007 0.0007 10 20.147 10 7.165 2.718 0.0004 24 9970.883 24 4082.929 2.407 0.0349 23 272.901 23 111.327 2.382 0.0003 491 285.980 491 128.910 2.190 0.2395 36 191.120 36 87.361 2.127 0.0016 DOWN-REGULATED SPOTS 1 31.267 1 139.793 -4.607 0.0294 2 57.429 2 230.305 -4.177 0.1043 4 26.124 4 92.454 -3.679 0.1619 5 170.675 5 521.502 -3.129 0.0002 7 245.822 7 724.062 -3.064 0.0633 484 29.674 484 88.483 -2.984 0.1970 8 88.436 8 254.061 -2.933 0.0002 9 289.918 9 816.104 -2.891 0.00005 11 47.851 11 132.117 -2.841 0.0014 485 53.290 485 142.952 -2.782 0.2558 12 45.764 12 122.396 -2.747 0.0019 13 47.295 13 125.502 -2.707 0.00003 14 47.167 14 123.830 -2.690 0.0006 15 230.110 15 598.722 -2.675 0.0006 16 66.589 16 169.769 -2.610 0.0001 17 160.239 17 402.199 -2.587 0.0242 19 24.046 19 59.877 -2.581 0.0441 20 * 259.870 20 644.180 -2.550 0.0106 21 784.593 21 1939.797 -2.542 0.0089 486 23.397 486 57.062 -2.525 0.2389 18 23.747 18 59.471 -2.519 0.0319 24 72.577 24 176.458 -2.469 0.0257 25 76.677 25 180.133 -2.409 0.0006 487 12.014 487 27.661 -2.380 0.2920 26 100.126 26 232.846 -2.367 0.0124 27 235.089 27 535.437 -2.331 0.000004 28 49.747 28 112.629 -2.317 0.0003 29 * 50.474 29 112.867 -2.312 0.0036 32 82.720 32 183.908 -2.303 0.0642 30 36.468 30 81.442 -2.288 0.0295 33 12.432 33 27.519 -2.287 0.0032 489 63.309 489 138.660 -2.283 0.2391

149
31 192.990 31 429.120 -2.279 0.0004 34 * 67.449 34 149.028 -2.274 0.0004 37 132.634 37 289.566 -2.246 0.0003 36 64.537 36 140.936 -2.244 0.0731 38 795.727 38 1729.300 -2.234 0.0033 40 60.914 40 131.750 -2.231 0.0248 39 128.303 39 277.875 -2.224 0.0016 41 41.704 41 90.050 -2.216 0.00003 43 70.685 43 151.258 -2.198 0.0235 42 15.245 42 32.656 -2.197 0.0034 44 12.103 44 25.760 -2.162 0.0016 490 49.382 490 104.267 -2.157 0.1147 45 * 152.430 45 318.920 -2.150 0.0001 50 18.060 50 36.790 -2.115 0.1411 46 22.235 46 46.291 -2.114 0.0414 52 45.867 52 93.359 -2.106 0.0192 48 107.316 48 220.554 -2.100 0.0207 47 29.942 47 61.853 -2.099 0.0047 49 24.604 49 50.143 -2.095 0.0003 53 105.031 53 212.511 -2.077 0.0016 54 391.048 54 785.641 -2.060 0.0029 55 98.211 55 196.864 -2.057 0.0006 58 38.342 58 76.320 -2.046 0.0086 60 39.319 60 77.989 -2.045 0.0076 63 151.672 63 299.323 -2.038 0.1069 57 11.575 57 23.100 -2.035 0.0032 61 35.517 61 70.133 -2.035 0.0540 59 12.233 59 24.279 -2.026 0.0646 62 35.684 62 70.424 -2.022 0.0285 64 29.683 64 58.372 -2.016 0.0027 65 202.997 65 395.474 -2.009 0.0015 67 591.911 67 1150.580 -2.005 0.0339 66 127.056 66 247.159 -2.004 0.0306

150
Table 4.3 The following table represents identified proteins those were found as up regulated
by more than 2 fold and down regulated by less than 2 fold in Lactobacillus rhamnosus
DR20 with 0% oxygen compared to 21% oxygen.
Average results of Lactobacillus rhamnosus DR20 with 0% oxygen
Average results of Lactobacillus rhamnosus DR20 with 21% oxygen
Spot number Spot volume Spot number Spot volume Fold-change b T-test (p) UP-REGULATED SPOTS 6 151.115 6 50.386 3.328 0.0012 293 408.618 293 203.423 2.090 0.6016 32 195.811 32 105.047 2.039 0.0013 37 507.391 37 278.450 2.013 0.0015 41 938.644 41 516.642 2.001 0.0021 DOWN-REGULATED SPOTS 1 27.833 1 215.033 -7.071 7.51E-06 2 20.490 2 84.145 -3.749 3.58E-06 266 * 60.228 266 231.037 -3.612 0.4147 265 32.286 265 124.612 -3.609 0.2785 267 64.101 267 239.629 -3.505 0.3608 3 62.851 3 238.188 -3.459 0.0001 268 44.432 268 154.544 -3.274 0.4283 4 43.912 4 154.856 -3.221 0.0023 269 54.097 269 184.321 -3.193 0.3516 5 139.140 5 483.566 -3.169 0.0002 270 * 50.207 270 144.324 -2.710 0.4490 7 561.284 7 1654.542 -2.705 0.0080 8 69.290 8 203.028 -2.687 0.0018 272 * 69.418 272 198.172 -2.675 0.3909 273 50.640 273 143.590 -2.674 0.4472 271 59.105 271 169.653 -2.656 0.1811 274 * 70.384 274 197.792 -2.641 0.4267 275 70.066 275 194.544 -2.592 0.4004 9 63.976 9 179.045 -2.568 0.0651 276 50.547 276 135.983 -2.525 0.4008 277 49.296 277 131.988 -2.494 0.3608 278 * 39.596 278 103.567 -2.452 0.4201 279 65.682 279 163.768 -2.337 0.4082 10 64.433 10 165.231 -2.333 0.0010 280 44.571 280 110.842 -2.329 0.4098 11 138.035 11 344.785 -2.309 0.1879 281 88.045 281 212.282 -2.260 0.4395 282 49.710 282 118.124 -2.237 0.4552 283 45.298 283 106.736 -2.216 0.4728 284 * 65.669 284 153.260 -2.196 0.4932 12 13.105 12 31.223 -2.194 0.1196 14 44.165 14 105.041 -2.176 0.0078 13 116.346 13 276.786 -2.174 0.0001 16 24.677 16 57.530 -2.147 0.1280

151
15 238.624 15 565.035 -2.137 0.1656 17 42.713 17 98.115 -2.115 0.1390 18 267.904 18 613.314 -2.109 0.1529 285 111.487 285 249.143 -2.105 0.5094 286 98.359 286 218.130 -2.082 0.4657 19 29.171 19 64.674 -2.044 0.1732 20 99.443 20 219.760 -2.033 0.0211 288 * 46.218 288 99.451 -2.024 0.5000 287 * 121.242 287 262.455 -2.009 0.3181 21 12.240 21 26.753 -2.007 0.0186

152
Figure 4.7 Two spots for each protein were cut by ExQuest spot cutter from Sample A
(Lactobacillus casei Lc1 under 0% oxygen). The position is shown 1.A01 (putative
uncharacterized protein) and 1.A02. The MS search results are shown in Table 4.4.

153
Figure 4.8 Three spots for each protein were cut by ExQuest spot cutter from Sample B
(Lactobacillus casei Lc1 under 21% oxygen) at position 1.A03, 1.A04, 1.A05 (stress
response membrane GTPase), 1.A06 and 1.A07 (Predicted oxidoreductase). The MS search
results are shown in Table 4.4.

154
Figure 4.9 Three spots were cut by ExQuest spot cutter from Sample C (Lactobacillus
rhamnosus DR20 under 0% oxygen) at position 1.A08. No protein was found at
position1.A08. The MS search results are shown in Table 4.4.

155
Figure 4.10 Three spots for each protein were cut by ExQuest spot cutter from Sample D
(Lactobacillus rhamnosus DR20 under 21% oxygen) at position 1.A09, 1.A10 and 1.A11
(pyruvate kinase). The MS search results are shown in Table 4.4.

156
4.6.5 Identification of proteins using MALDI mass spectra
analysis
The objective of this part of study was to identify protein spots separated on the 2-D gels by
MALDI MS/MS (or TOF/TOF) analysis. Several spots were cut and analysed as follows: 5
spots from sample A (Fig. 4.7), 1 spot from sample B (Fig. 4.8), 1 spot from sample C (Fig.
4.9) and 3 spots from sample D (Fig. 4.10). These selected spots displayed greater than a 3-
fold differences between sample A and B or sample C and D. In addition, we have cut
another spot (spot 11; Table. 4.4) as a reference protein (highly abundant proteins on the gel).
Figure 4.11: In this figure 4.11A and 4.11B represents 3D view of protein spots up-regulated
by 4 fold or greater in L. casei Lc1, comparison of 0% O2 to 21% O2. Similarly, 4.11C and
4.11D represents 3D view of protein spots up-regulated by 4 fold or greater in L. rhamnosus,
comparison of 0% O2 to 21% O2.
L. casei Lc1 21% Oxygen (B)
A1
A2
A3
(A) Lc1 average
(B) Lc1 average
B1
B2
B3
L. casei Lc1 0% oxygen (A)
D1
D2
D3
C1
C2
C3
(D) DR20 average
(C) DR20 average
L. rhamnosus DR20 0% oxygen (C)
L. rhamnosus DR20 21% oxygen (D)

157
It has been reported that 28 proteins were differentially expressed in L. reuteri due to bile
salts stress (Lee et al., 2008). In addition, in another study 12 hop stress-inducible proteins,
two acid stress-inducible proteins, 17 hop stress-over expressed proteins, and 1 hop stress-
repressed protein were observed in L. brevis (Behr et al., 2007). We are unable to compare
our image analysis data (oxidative stress treatment on L. casei Lc1 and L. rhamnosus DR20)
on differentially expressed proteins with other Lactobacillus spp. due to the lack of
availability of any published proteomic data. However, another report revealed that 69
proteins were over expressed (of which 15 were specific to oxidative stress) and 24 proteins
were repressed because of oxidative stress in Streptococcus mutans (Svensater et al., 2000).
In our study, we observed a similar number of differentially expressed proteins either up
regulated or down regulated because of oxygen treatment. From the image analysis results
we discovered that during the bacterial cell viability test L. rhamnosus DR20 showed less
tolerance to oxidative stress when compared to L. casei Lc1 (Fig. 4.5). A lesser number of
proteins were differentially expressed in L. rhamnosus DR20 and less significant difference
was observed in the cell viability test of the same sample culture (Fig. 4.6). On the other
hand, more proteins were differentially expressed because of oxygen treatment in L. casei
Lc1.
For protein identification by MALDI mass spectra analysis, (Table 4.4) primarily we have
focused on the proteins that were differentially expressed rather than on creating a global
protein map on the 2-D gels. We identified three proteins (putative uncharacterised protein,
stress response membrane GTPase and predicted oxidoreductase) from L. casei Lc1 were
differentially expressed by 3-fold or more and all the proteins were matched with the proteins
from L. case in the database (Table 4.4). It is anticipated that these three proteins were
related to oxidative stress, expressed as a 3-fold or more change, although we do not have

158
any functional data that would prove that this expression change was related to physiological
change of the bacterium. Again, there is not enough published data available for comparison
regarding proteins that are changed due to oxidative stress in Lactobacillus spp., however it
was reported that 93 proteins were either over expressed or repressed in S. mutans and 15 of
which were identified as oxidation-specific proteins only (Svensater et al., 2000).
We identified one protein (spot 4) that is present in all four samples and did not
change (or <2-fold change) because of oxygen treatment in either bacterial strain. The protein
was pyruvate kinase and matched with a protein from L. rhamnosus DR20. It would require
further studies on the thorough identification of proteins after oxidative stress in L. casei Lc1
and L. rhamnosus DR20 to make a 2-D map of differentially expressed proteins and to
validate their identity by functional data. This is beyond the scope of this study.
The proteomic and physiological data (Spot positions 1 to 3 in Table. 4.4) presented in this
work revealed that oxidative stress induces a profound biological reformation in L. casei,
which provides coordination for further investigations on Lactobacillus proteome. So we can
conclude, for the first time, the combination of 2-DE and MALDI mass spectra (MALDI-
MS/MS or MALDI TOF/TOF) analysis gave access to the 118 differentially expressed
proteins from L. casei Lc1. The three recognized proteins are putative uncharacterized
protein (Fig. 4.7 and Table 4.4), stress response membrane GTPase (Fig. 4.8 and Table 4.4)
and the predicted oxido-reductase (Fig. 4.8 and Table 4.4) identified by MALDI-MS/MS (or
MALDI TOF/TOF) mass spectrometra analysis. These proteins were changed 3-fold or more.
Similarly, spot position 4 (Table 4.4) presented oxidative stress induced reformation in L.
rhamnosus and only one recognized protein pyruvate kinase was identified by MALDI-
MS/MS (mass spectra) analysis. This protein was changed 2-fold or less.

159
In summary, 4 protein spots out of 11 spots were analysed and identified by MALDI mass
spectra (MALDI-MS/MS or MALDI-TOF/TOF) analysis. One spot was found in sample A
and two spots were found in sample B. Reference spot (spot number 11, dark spot) indicated
the efficiency of the mass spectra analysis and the result shows that reference spot has the
strongest intensity (highest score) out of the 11 spots (Table 4.4). The detail results including
mass method search results was shown in Table 4.1 and the gel images were cut using
ExQuest spot cutter and presented in Figures 4.7, 4.8, 4.9 and 4.10.

160
Table 4.4 Summary of the identified proteins characterised by MALDI-TOF/TOF (or MS/MS) mass spectra analysis (Fig. 4.7 to 4.10) from L.
casei Lc1 and L. rhamnosus DR20.
Spot ID Gel* ID name Name Mascot
name
MOWSE
Score
Matched
peptide
Sequence
coverage
Mass
(Da) pI
1.A01 Spot number 3 in gel L. casei
Lc1 control (A) gi|191637763
Putative uncharacterized protein
[Lactobacillus casei BL23] A1 98 6 11% 43664 5.73
1.A02 spot number 6 in gel L. casei
Lc1 control (A) n/a n/a A2 n/a n/a n/a n/a n/a
1.A03 spot number 1 in gel L. casei
Lc1 treated (B) n/a n/a A3 n/a n/a n/a n/a n/a
1.A04 Spot number 1 in gel L. casei
Lc1 treated (B) n/a n/a A4 n/a n/a n/a n/a n/a
1.A05 spot number 7 in gel L. casei
Lc1 treated (B) gi|116494802
Stress response membrane GTPase
[Lactobacillus casei ATCC 334] A5 84 11 17% 67901 5.11
1.A06 spot number 4 in gel L. casei
Lc1 treated (B) n/a n/a A6 n/a n/a n/a n/a n/a
1.A07 spot number 5 in gel L. casei
Lc1 treated (B) gi|191638459
Predicted oxidoreductase
[Lactobacillus casei BL23] A7 184 13 46% 22785 4.89
1.A08 spot number 6 in gel L.
rhamnosus DR20control (C) n/a n/a A8 59 1 n/a n/a n/a
1.A09 spot number 1 in gel L.
rhamnosus DR20 treated (D) n/a n/a A9 n/a n/a n/a n/a n/a
1.A10 spot number 2 in gel L.
rhamnosus DR20 treated (D) n/a n/a A10 n/a n/a n/a n/a n/a
1.A11 reference spot in gel L.
rhamnosus DR20 (D) gi|199598717
Pyruvate kinase [Lactobacillus
rhamnosus HN001] A11 706 44 64% 62809 5.26
n/a = Not identified
ID = Identified Protein
Spot positions on the gel were shown in Table 4.4. Protein spots 1 to 3 (Uncharacterized protein, stressresponse membrane GTPase and
oxidoreductase) were identified from L. casei Lc1 and protein spot 4 (pyruvate kinase, also present in all four samples) was identified from L.
rhamnosus DR20.

161
4.7 Key achievements
A number of differentially expressed proteins were found in both Lactobacillus rhamnosus
DR20 and L. casei Lc1 cells during the different level of oxidative stress condition and those
proteins may play a key role for the survivability of these micro-organisms. The detailed
oxidative stress responses (which were found in this study for both probiotic bacterial strains)
can be described as follows:
1. The two bacterial strains were able to survive in toxic oxygen environment.
2. The changes in SDS-PAGE pattern of cell growth was observed in both aerobic and
anaerobic conditions.
3. The 1-D SDS-PAGE protein profile indicates that proteins were purified successfully and
it was clear that several proteins are present in both Lactobacillus casei Lc1 and
Lactobacillus rhamnosus DR20 strains with and without oxygen treatment (Fig. 4.1).
4. 2DE protein expression analysis detected 822 proteins in L. casei Lc1 in both treated (with
21% oxygen) and untreated (without oxygen) samples (Figure 4.2 and 4.3). Among them,
two proteins were differentially expressed 4-fold or more in oxygen treated L. casei Lc1
compared to the untreated sample and another 70 proteins were differentially expressed by 2
to 4-fold (Table 4.1 & 4.2).
5. But for L. rhamnosus DR20, 1062 proteins were detected from treated samples (Fig.
4.11B); from untreated samples, only one protein was differentially expressed by 4-fold or
more and 48 proteins were differentially expressed by 2 to 4-fold (Table 4.2 and 4.3).

162
6. From the image analysis results it was discovered that during the bacterial cell viability
test L. rhamnosus DR20 showed less tolerance to oxidative stress when compared to L. casei
Lc1 (Fig. 4.4). A lesser number of proteins were differentially expressed in L. rhamnosus
DR20 and less a significant difference was observed in the cell viability test of the same
sample culture (Fig. 4.6). On the other hand, more proteins were differentially expressed
because of oxygen treatment in L. casei Lc1.
7. For protein identification by MALDI- MS/MS (TOF/TOF) mass spectra analysis, (Table
4.4) the focus was primarily on the proteins that were differentially expressed rather than on
creating a global protein map on the 2-D gels. Three proteins (putative uncharacterised
protein, stress response membrane GTPase and predicted oxidoreductase) were identified
from L. casei Lc1 which were differentially expressed by 3-fold or more and all the proteins
were matched with the proteins from L. casei Lc1 in the database (Table 4.2).
8. The combination of 2-DE and MALDI-TOF/TOF mass spectra analysis gave access to the
118 differentially expressed proteins from L. casei Lc1. The three recognized proteins are
putative uncharacterized protein (Fig. 4.7 and Table 4.4), stress response membrane GTPase
(Fig. 4.8 and Table 4.4) and the predicted oxido-reductase (Fig. 4.8). These proteins were
changed 3-fold or more.
This data will be helpful for further study related to adaptation of oxidative stress resistance
in probiotic bacteria and potentially useful to improve the viability of bacteria in fermented
dairy foods.

163
4.8 Conclusions
In this study, a number of differentially expressed proteins were found in both Lactobacillus
rhamnosus DR20 and L. casei Lc1 cells, while treated with toxic oxygen, it is believed that
and those proteins may played a key role for the survivable of probiotic bacteria. In addition,
a combination of 2-DE and MALDI-TOF/TOF mass spectra analysis gave access to the 118
differentially expressed proteins from L. casei Lc1 of which three recognized proteins are
putative uncharacterized protein, stress response membrane GTPase and the predicted oxido-
reductase. These proteins were changed 3-fold or more compare to untreated samples. But in
L. rhamnosus and only one recognized protein pyruvate kinasewas found and this protein
was changed 2-fold or less. However, our achievements from this proteomic study will
provide valuable information for further study of probiotic bacteria, their adaptation in toxic
oxygen environment and the biological changes at proteome level. This data will be helpful
for further study related to adaptation of oxidative stress resistance in probiotic bacteria and
potentially useful to improve the viability of bacteria in fermented dairy foods.

164
Chapter 5
Studies on the effect of oxidative stress on
Bifidobacterium infantis B1912: a proteomic
approach

165
5.1 Abstract
Probiotic bacteria dependent dairy industries are experiencing difficulties in maintaining the
viability of probiotic bacteria in dairy products due to the aerobic environment. While in
storage (i.e. at supermarkets), the required viable concentration (above 106 cfu/ml) of
probiotic bacteria eventually decreases in dairy products due to the toxic effects of
environmental oxygen. This study aims to increase the bacterial viability by introducing
oxygen-resistant bacterial strains whilst maintaining the maximum health benefits of
probiotics during storage and shelf life. In this study, four different strains of bifidobacteria
were investigated with a series of screening process and finally concluded with one
promising strain of bifidobacteria which was Bifidobacterium (B) infantis 1912 selected as
an oxygen resistant strain with the ability to survive in an aerobic (21% oxygen)
environment. B. infantis 1912 showed a significant level of anti-oxidative activity compare to
other species of Bifidobacteria. The results also indicate that a reduction of 12% cell growth
was found on treated B. infantis 1912 in comparison to the control. Proteomic analysis was
conducted to identify the oxidative stress proteins. The image analysis data revealed that 1
protein more than 13 fold, 1 protein more than 5 fold and another 7 proteins (2-fold or more)
were up-regulated and 12 proteins were found as down-regulated in this strain. However all
21 proteins were identified by the combination of 2-DE and MALDI MS-MS (mass spectra)
analysis. This study is the first published report that has identified and described proteins
from B. infantis 1912 related to oxidative stress.

166
5.2 Introduction
Bifidobacteria are natural and intestinal microflora of humans and animals. They represents
99% of intestinal microflora in the gastrointestinal tracts of a new born baby during the first
few days after birth (Lindner et al., 2007; Sidarenka et al., 2008). Characteristically,
Bifidobacterium are non-sporing, non-motile, non-filamentous, anaerobic and Gram-positive
micro organisms. There are six different species of Bifidobacteria (from human origins) used
in dairy products, such as B. adolescentis, B. breve, B. bifidum, B. lactis, B. infantis and B.
longum (Boylston et al., 2004). These organisms are also known to enhance the beneficial
bacterial population in the human gut, suppress pathogens, build up resistance against
intestinal diseases, alleviate lactose intolerance, prevent some forms of cancer, modulate
immunity and may also lower serum cholesterol (Kailasapathy and Chin., 2000; Prado et al.,
2008; Zaizu et al., 1993).
The use of Bifidobacterium and Lactobacillus species in dairy products (such as yoghurts and
fermented milks) has increased in the past two decades (Mattila-Sandholm et al., 2002).
However, there is no specific general requirement for having a set concentration of probiotics
in the dairy products to achieve maximum therapeutic benefits (Kurman and Rasic, 1991).
However, some researchers have suggested that a concentration above 106 cfu /mL-1 is a
minimum requirement to have a therapeutic effect, while other suggest >107 and 108 cfu/mL-
1 is required to achieve a satisfactory results (Davis et al., 1971; Ross, et al., 2005;
Jayamanne et al., 2006). So the maintenance of bacterial viability in the probiotic product is
one of the key issues to maximise health benefits.
Bacterial viability is significantly decreased during the processing of probiotic food (Shah, et
al., 1995). For example, market survey reports on commercial yoghurts revealed that the

167
counts of L. acidophilus and Bifidobacteria are far below the recommended level (106cfu/g)
at the expiry date of the yoghurt (Iwana, et al., 1993; Shah, et al., 2000).
The exposure to oxygen or oxygen toxicity may be responsible for the loss of viability during
storage and manufacturing of probiotic products (De Vries and Stouthamer, 1969; Talwalkar
and Kailasapathy, 2003a). Therefore, the prevention of oxygen toxicity is crucial during the
manufacturing of dairy products. It is also important to ensure the cell viability of bacteria
during the storage of dairy products. The application of the bifidobacterium species has been
widely used in foods, pharmaceuticals, and livestock feed. Bifidobacterium is a well-
investigated anaerobe organism, widely used in dairy products and beneficial to human
health. The toxic effects of oxygen cause its loss of viability during manufacture and the
storage of dairy products, as the nature of these bacteria is obligative anaerobic. Precautions
are required to contain certain concentration of viable cells, depending on the type of dairy
products (Kawasaki et al., 2006). It is believed that they have a certain capacity to survive
and are able to protect themselves from oxygen toxicity. We will identify those stress
proteins responsible for the survivable of anaerobic bacteria in aerobic conditions. Although
some Bifidobacteria and Lactobacilli (Such as B. infantis and L. rhamnosus) have been
studied to a limited extent, their response to oxidative stress still remains largely
uncharacterized (Talwalkar and Kailasapathy, 2003; Zhao and Li, 2008).
In this study, we examined the changes in protein profiles in B. infantis 1912 under different
level of oxygen (0% and 21%). Bifidobacteria strains were categorized as anaerobes and
microaerophilic - in which oxygen plays a critical role in their metabolism (Hammes and Vogel,
1995; Condon, 1987). However, in the absence of strict anaerobic conditions, a satisfactory
growth of Bifidobacterium spp was observed by Cheng and Sandine (1989). In another study,

168
Meile et al., (1997) reported that while isolated from fermented milk B. lactis displayed as a good
oxygen tolerant strain.
To develop a successful dairy product containing Bifidobacteria, it is important to understand
the growth and characteristics of the organism to enable the processing conditions to be
manipulated to optimize their survival conditions. Zhao et al., (2008) reported that they
identified 36 proteins in H. pylori (in the human stomach) that were performing a protective
role during the acid induced stress condition and were also involved in various cellular
functions during the stress response. Similarly, in this study we assumed that if the anaerobic
bacteria are able to survive in oxidative stress condition then they may have certain type of
proteins that play a protective role in B. infantis 1912 and those proteins may involve in
cellular function during the stress situations.
Therefore, this project is conducted to identify and to characterize a number of oxygen
tolerant Bifidobacteria (as probiotic bacteria) that are commonly used in the dairy industry
and to identify the differentially expressed stress proteins those may responsible for the
survival of bacteria in toxic oxygen environments. It will be possible to increase the shelf
life of probiotic dairy product by minimising the bacterial cell death from the exposure of
oxygen during storage.

169
5.3 Material and methods
5.3.1 Growth of Bifidobacteria
The relative bacterial growth ratio (RBGR) was established using eleven probiotic bacterial
strains including four bifido bacterial strains. Bifidobacterium spp. (HOWARU Bifido DR10)
strains were provided by Danisco, Copenhagen, Denmark, B. lactis B94 ASCC were
provided by Australian Starter Culture Centre, B. infantis B1912 ASCC were provided by
Australian Starter Culture Centre, Werribee, VIC, Australia and B. lactis Bb12 were provided
by Chr. Hansen, Bayswater, VIC Australia.. All probiotic cultures were supplied is freeze-
dried form and obtained from three different commercial suppliers as stated earlier. Finally,
B. infantis 1912 strain was selected based on its response to 21% oxygen; this strain
exhibited resistance to 21 % oxygen. B. infantis B1912 ASCC were provided by Australian
Starter Culture Centre, Werribee, VIC, Australia.
For the viability test and proteomic study, the cells were grown aerobically (under 21% O2),
and anaerobically (under 0% O2) and placed in gas jars using the Gas Pak System (Oxoid,
Adelaide, Australia) for 18 h at 37 °C in De Man Rogosa Sharpe (MRS) broth (Oxoid,
Adelaide, Australia). The cells were centrifuged at 5000 g for 15 min at 4 °C, harvested and
then washed twice with sterile 0.01 M phosphate buffered saline (PBS).
5.3.2 Bacterial viability test
The effects of 0% and 21% oxygen treatments on B. infantis 1912 viability were monitored
for up to 72 h at 37 °C. A serial dilution of 105, 106, 107 cfu/ml (colony forming unit per
millilitre) was prepared by suspending the cultures in PBS buffer at a final volume of 10 ml.
Spread plates on MRS (de Man Rogosa Sharpe ) agar were prepared by using 100 μl from

170
each serial dilution and incubated at 37 °C for 48h. The colonies were counted and used to
calculate the cfu/ml to determine their level of survivability. The colony count results were
used to construct growth curves for each bacterial strain at 0% and 21% oxygen. Six
replicates were used throughout the entire experiment (including assays).
The results of the 106 cfu/ml dilution were used to construct growth curves for B. infantis
1912 at 0% and 21% oxygen. Six replicates were used throughout the entire experiment
(including assays).
The effects of oxidative stress on this strain‘s viability at the single cell level were studied
using the laser-scanning confocal microscope (LSCM) (Leica TCS SP5, Leica Microsystems,
North Ryde, Australia). Initially, an 18 h old culture was centrifuged for 5 min at 3000 g
(4°C), the supernatant was removed and the cells were resuspended in 10 ml of MRS broth
media.
The LIVE/DEAD BacLight bacterial viability kit (Invitrogen, Australia Pty Ltd) was used to
determine the viability of treated (21% O2) and control (0% O2) samples by mixing 10 μl of
SYTO® 9 green fluorescent nucleic acid stain and 10 μl of propidium iodide (PI). 10 µl of
this mixture was added to the control and treated B. infantis 1912 cell suspensions (control
0% and treated 21% O2).
Microscopic slides were prepared by adding 5 µl from each sample and were viewed under a
20 x objective with oil immersion. Both SYTO 9 and PI were excited using the Argon 488
nm laser. The SYTO 9 emission range was measured between 483 nm – 507 nm and PI
between 520 nm – 630 nm. Six random images of each sample were taken at 2048 x 2048
pixels. Six random Z-stacks were also obtained from each sample.

171
5.3.3 Extraction of proteins from proteomic analysis
For the proteomic analysis, the selected bacterial strain (B. infantis 1912) was grown
routinely in MRS broth for 18 h at 37°C. The culture was then centrifuged for 5 min at 3000
g (4°C), the supernatant was removed and the cells were then resuspended in 10 ml of PBS
buffer. Approximately, 400 mg (wet weight) of each sample was taken and then lysed with 5
ml of 2-D lysis buffer (consists of 7M urea, 2M thiourea, 2% CHAPS, 1% C7BzO, and 10
μL of protease inhibitor cocktails, Sigma, USA). To break the cell walls and to extract
proteins from both cytoplasm and cell walls, the lysis buffer containing cells were vortexed
for 2 x 20 sec for each sample using an ultra-sonic probe (Branson Sonifier 450, John Morris
Scientific, Chatswood, Australia) followed by water bath sonication (Transsonic 700/H, John
Morris Scientific, Chatswood, Australia) for 15 min. The protein mixture was then
centrifuged at 20,000 g for 20 min at 20°C after sonication and the supernatant was collected
for reduction and alkylation of proteins. The pH of each sample was increased to
approximately 9 using 1M stock Tris (Bio- Rad, USA) prior to reducing proteins with 5 mM
tributyl phosphine (TBP) and alkylating with 15 mM acrylamide for 90 min at room
temperature. Reduced and alkylated proteins were desalted by buffer exchange to reduce the
conductivity (<300 μS/cm) and then concentrated using a 5 kDa cut off filter as previously
reported using 7M urea, 2M thiourea, 2% CHAPS sample solution (Khan et al. 2005).
Desalted proteins were stored at -80 °C until analysis. Protein concentration in each sample
was determined using the Bradford (Sigma, USA) assay; a standard curve was generated
using BSA (bovine serum albumin).

172
5.3.4 Two-dimensional gel electrophoresis (2D-PAGE)
Two-dimensional (2-D) gel electrophoresis was carried out by using the following standard
methods to separate proteins previously extracted from the four sets of bacterial cells (Khan
et al. 2005). For the first dimension separation, approximately 250 g of proteins was loaded
on a 17 cm linear pH 5-8 IPG (immobilized pH gradient) strip (Bio-Rad, CA, USA) by using
in-gel rehydration method (rehydrated for 6 h). The IPG strips were focused on the first
dimension on Ettan IPGphor II (GE Healthcare, Sweden) at 300 volts for 2 h with a linear
increase from 300 to 8,000 volts over 8 h and at constant 8,000 volts until a total 140 KVh
was reached. The focused IPG strips were equilibrated for approximately 2 x 15 min in
equilibration buffer (6 M urea, 3% SDS, 20% glycerol, 1x Tris-HCl buffer) then run on the
second dimension gels. The gel dimensions were 18 x 20 cm and 6 to 16 % gradient
respectively. The gels were prepared in the laboratory using the Tris-glycine buffer at pH 8.5.
Gels were run in triplicate using an overnight running program (7 mA/ gel for overnight
followed by 40 mA/ gel until tracking dye (bromophenol blue dye) in the agarose embedding
solution had just run off the bottom of the gel). The gels were stained with SYPRO Ruby
(Invitrogen Ltd., Paisley, UK), fixed in 10% methanol and 7% acetic acid for 2 h and stained
at room temperature overnight. 2 x destained with 10% methanol and 7% acetic acid for 2
hours and 1 x with 1% acetic acid. The images were captured using Typhoon Trio 9400
variable mode imager (GE Healthcare, Sweden) at 100 μm resolution.
5.3.5 Image analysis
The images were uploaded into Progenesis Discovery 2005 image analysis software
(Nonlinear Dynamics Ltd, Newcastle-upon-Tyne, UK) using a ‗single stain‘ experiment. For
differential display analysis, the images were pre-warped using ―Progensis Same Spot‖

173
(Nonlinear Dynamics Ltd., UK) with 90 warp vectors. Spots were detected using auto spot
detection method. The spots were manually edited by, deleting spots that were not possible to
analyse, deleting streaks, and removing background as previously reported (Khan et al.
2005).
5.3.6 Spot cutting and MALDI MS/MS analysis for protein
identification
Protein spots from SYPRO Ruby stained gels were cut using an ExQuest Robotic fluorescent
spot cutter (cutting head – 1 mm diameter) equipped with a CCD camera (Bio-Rad, USA)
and the gel plugs were placed on a 96-MTP plate. Gel plugs were washed (wash solution 25
mM ammonium bicarbonate (AMBIC) in 50% acetonitrile (ACN) three times for 10 min
each at 37 ºC. The gel plugs were dried with 100% ACN to complete dryness for
approximately 10 min at room temperature. After that, 20 µL of trypsin solution (Promega,
USA) (15 ng/uL in 25 mM AMBIC) were added to the dry gel plugs and incubated at 4 ºC
for one hour to allow for the gel plugs to rehydrate with the trypsin solution. After 1 h
rehydration, the excess trypsin was removed and 20 µL of 25 mM AMBIC was added to each
gel plug and then incubated at 37ºC overnight. Peptides were then guanidated (0.25 mg/mL
O-methylisourea sulfate in 10% ammonium hydroxide) to improve the detection of lysine
terminated peptides by MALDI (Khan et al., 2008). The resulting peptides were re-acidified
by adding 8.25% TFA (v/v) in the peptide solution, desalted and concentrated by zip-tip
(Perfect Pure C18, Eppendorf) spotted onto a MALDI sample plate with 1μL of matrix (α-
cyano-4-hydroxycinnamic acid, 4 mg/mL in 70% v/v ACN, 0.06% v/v TFA, 1mM
ammonium citrate) and allowed to air dry.

174
5.3.7 Data acquisition by MALDI Mass Spectrometer
Matrix Assisted Laser Desorption Ionisation (MALDI) mass specta was performed with an
Applied Biosystems 4700 Proteomics Analyser. A Nd:YAG laser (355 nm) was used to
irradiate the sample. The spectra were acquired in reflection mode in the mass ranges from
700 to 3500 Da and were externally calibrated using known standard peptides (pepmix,
bradykinin, neurotensin, angiotensin and ACTH). The instrument was then switched to
MS/MS (TOF/TOF) mode where the eight strongest peptides from the MS scan were isolated
and fragmented (by collision-induced dissociation using filtered laboratory air), then re-
accelerated to measure their masses and intensities. A near point calibration was applied and
this gives a typical mass accuracy of ~50 ppm or less.
5.3.8 Database search for protein identification
The data (peptide peak list) was exported into a format suitable for submission to the
database search program known as Mascot (Matrix Science Ltd, London, UK). All samples
were searched against bacterial entries in the NCBInr database (20081107). Precursor ion
tolerance 50 ppm and product ion tolerances ± 0.6 Da, variable modifications were selected
such as Guanidinyl (K), Oxidation (M), Propionamide (C), and a maximum of one missed
cleavage peptide was allowed. Positive identification was considered after taking into
account the percentage of sequence coverage, the number of missed cleavages (if missed
cleavages are present their location in the sequence) and how well the MW and pI of the
identified proteins matched on the 2-D gel data as previously reported (Joss et al. 2006; Khan
and Packer, 2006).

175
5.4 Results and discussions
As stated in the previous chapter, in this study we used a proteomic approach to identify total
proteins present in treated (with 21% oxygen) and untraeted (with 0% oxygen) probiotic
bacterial strain B. infantis B1912. At first proteins were extracted from the probiotic bacterial
cells using a mild wash in phosphate buffer and analysed by sodium dodecyl sulphate-
polyacrylamide gel electrophoresis. Gel bands were excised and in-gel digested with trypsin.
The resulting peptides were analysed by MALDI (Matrix Assisted Laser Desorption
Ionisation) MS/MS (mass spectra analysis).
5.4.1 1D SDS PAGE analysis
As stated in previous chapter, at first, proteins were extracted from bacterial cells with a
sample solution that contained two types of detergents; CHAPS and C7BzO including two
chaotropic reagents urea and thiourea. This sample solution was used for global protein
extraction that represents both cytoplasmic and membrane or membrane-associated proteins.
CHAPS (Sigma, Australia) is a mild detergent suitable for cytoplasmic proteins and C7BzO
is a strong detergent and efficient for extracting membrane proteins (Luche et al. 2003).
Global protein expression in this work was used to observe any changes in the protein
profiles, either cytoplasmic or membrane proteins, due to the different level of oxygen
treatments on bacterial cells.
The 1-D SDS-PAGE protein profile indicates that proteins were purified successfully and
also it was clearly visible that several proteins are present in B. infantis 1912 strain with and
without oxygen treatment. In addition, a large number of protein species were observed with

176
molecular mass ranges from 10 to 200 kDa and pI ranges from 5 to 8. Further analysis of
differentially expressed proteins was pursued by 2DE.
5.4.2 Two-dimensional electrophoresis analysis
This experiment also similar to the previous chapter, stated earlier and here we used B.
infantis 1912 strain instead. The proteins were separated in 2-D gels with high resolution in
B. infantis 1912 strain, treated (with 21% oxygen) and untreated (with 0% oxygen) samples
(Figure 3). Initially, several attempts were made to separate proteins with a pH range from 3
to 10 and from 4 to 7 (data not shown), but it appeared that the pH 5-8 was the most suitable
range for those samples and the majority of proteins were separated in this pH range (pH 5-8)
with high resolution. Therefore, pH 5-8 was considered for this work. Although a large
number of proteins were observed on the gels with high resolution, ahile some of the proteins
were missed those belonged to pH below 5 or over 8. However, our data suggested that we
resolved most proteins with high resolution from the 2-D gels containing probiotic bacteria
compared to other reports (Hormann et al. 2006; Koistinen et al. 2007; Lee et al. 2008).
5.4.3 Detection and analysis of Protein Spots and Image Analysis
Previously collected, gel images were subjected to image analysis with Progenesis image
analysis software. Only common proteins were compared as a sample set. For example B.
infantis 1912 treated with and without oxygen was considered for differential display
analysis (n = 3 for each sample set). There were 840 proteins (averaged from six gels)
detected in B. infantis 1912 treated with oxygen and without oxygen samples (Figure 5.1,
5.2, 5.3, 5.4). Among them, 52 proteins were differentially expressed 4-fold or more in
oxygen treated B. infantis 1912 compared to non oxygen treatment and 154 proteins by 2 to

177
4-fold (Table 5.1). With a view to gaining higher statistical confidence, proteins that had less
than a 2-fold change (either over expressed or repressed) were not considered for
comparative analysis in this work. Clearly visible protein spots were shown using a 3D- view
in B. infantis 1912 (Figure 5.5). Proteins that had less than 2-fold change (either over
expressed or repressed) were not considered for comparative analysis in this work (to
maximise statistical confidence).

178
Figure 5.1 Identified down-regulated protein spots in 2DE gel of Bifidobacterium infantis
B1912 grown under 0% oxidative stress at 37°C. Proteins were extracted from 24 h old
culture. The pH range of the IPG strips are 5 – 8 (left to right) and the gels (6 to 16% gradient
from top to bottom) were stained with SYPRO Ruby. The gels were run at triplicates and a
representative gel is shown in this Figure 5.1.
: Identified down-regulated protein spots in treated samples : Control protein spots
351
99
59
86
50
19
111
364
360
83
64
C2
C3
C4
C5
C6
12
C1
E1

179
Figure 5.2 Identical and triplicate gel images (E1, E2 and E3) of 2- dimensional electrophoresis. E = Bifidobactrium infantis B1912, grown in
0% oxygen and incubated at 37°C for 24h. Proteins were extracted from 24 h old culture. The pH range of the IPG strips are 5 – 8 (left to right)
and the gels (6 to 16% gradient from top to bottom) were stained with SYPRO Ruby. The gels were run at triplicates and a representative gel is
shown in this Figure 5.2.
250
150
75
50
37
25
20
15
10
E2 6 – 16 % gradient gel
pH 5 p
H
8
250
150
75
50
37
25
20
15
10
E3 6 – 16 % gradient gel
pH 5 p
H
8
250
150
75
50
37
25
20
15
10
E1 6 – 16 % gradient gel
pH 5 p
H
8

180
Figure 5.3: Identical and triplicate gel images (F1, F2 and F3) of 2- dimensional electrophoresis. F = Bifidobactrium infantis B1912, grown in
21% oxygen and incubated at 37°C for 24h. Proteins were extracted from 24 h old culture. The pH range of the IPG strips are 5 – 8 (left to
right) and the gels (6 to 16% gradient from top to bottom) were stained with SYPRO Ruby.
250
150
75
50
37
25
20
15
10
F1 6 – 16 % gradient gel
pH 5 pH 8
250
150
75
50
37
25
20
15
10
F3 6 – 16 % gradient gel
pH 5 p
H
8
250
150
75
50
37
25
20
15
10
F2 6 – 16 % gradient gel
pH 5 pH
8

181
Figure 5.4 Identified up-regulated protein spots in 2DE gel of Bifidobacterium infantis
B1912 grown in 21% oxygen and incubated at 37°C for 24h.
[* high fold changes but p-value was higher than 0.05 (i.e. not significant)
: Identified up-regulated protein spots in treated samples * high fold changes but p-value is higher than 0.05 (i.e. not significant)
63
95
2*
88
16
69
120
91
76

182
Figure 5.5 Zoom in image of the B. infantis B1912 spots in quadrant. Protein spots marked
in greens are up-regulated in the 21% oxygen treated samples while spots marked in pinks
are down-regulated. Proteins were extracted from 24 h old culture. The pH range of the IPG
strips are 5 – 8 (left to right) and the gels (6 to 16% gradient from top to bottom) were stained
with SYPRO Ruby. The gels were run at triplicates and a representative gel is shown in this
Figure 5.5.

183
Table 5.1 Summary of the differentially expressed proteins obtained by image analysis
Criteria Fold-change in Treated compared to Control
Up-regulated proteins Down-regulated proteins
More than 4-fold change 52 5
More than 2 fold but less
than 4-fold 154 42
5.4.4 Image Analysis
The final component of 2-DE experiment was the visualization of separated protein spots on
gels either by universal or by specific staining methods. In this study proteins were stained
with a fluorescent dye SYPRO Ruby (Rabilloud, et al. 2001) after the electrophoretic
separation. The detection limit is nearly 1-2 ng protein per spot, and it was also compatible
with mass spectra analysis. However, their usage remains relatively limited due to their cost
and technical difficulties.
However, protein spots from SYPRO Ruby stained gels were cut using an ExQuest Robotic
fluorescent spot cutter (cutting head – 1 mm diameter) equipped with a CCD camera (Bio-
Rad, USA) and the gel plugs were placed on a 96-MTP plate.
After staining the gel, the gel images were converted into digital data using a scanner or
camera and then analyzed with a computer program called ExQuest. This program have a
capability for spot detection, spot filtering, spot editing, background correction, gel matching,
normalization, quantification, etc. Finally it can be concluded that the position of protein
spots in polyacrylamide gel do not provide exact identification of it. For that reason, protein
spots (i.e. newly expressed up or down-regulated) were excised from gel and digested (in-gel

184
digestion) into peptide fragments with a specific enzyme (generally trypsin) and then
identified using mass spectra analysis and database searches.
Previously collected gel images were subjected to image analysis using Progenesis image
analysis software. Only proteins those were common in comparing samples set (for both
treated and untreated samples from B. infantis 1912) were considered for differential display
analysis.
In this study, after treated with oxygen, a number of stress proteins were observed in
oxidative resistant B. infantis 1912 strain, those were found as either upregulated or down
regulated (Table 5.2). The detailed image analysis results that include individual spots,
volume changes (fold-change), statistical significance (p-values) and location of proteins on
the gels are shown in Table 5.2 and Figure 5.6.
In Figure 5.6, Red and green boxes displayed the 3D view of protein spots those are up-
regulated by 4 fold or greater in B. infantis B1912, with compare to 0% O2 (control) to 21%
O2 (treated). This result indicated that this strain was able to survive toxic oxygen
environment and it is believed that these differentilly expressed protein may plays a key role
for the survival of B. infantis B1912 in toxic oxygen environment. Similar results also
described in our previous chapter (Chapter 4) where L. casei Lc1 and L. rhamnosus DR20
were used as probiotic strains. There were 822 proteins detected in L. casei Lc1 treated with
oxygen and without oxygen samples (Figure 4.2 and 4.3). Among them, two proteins were
differentially expressed 4-fold or more in oxygen treated L. casei Lc1 compared to no
oxygen treatment and another 70 proteins were differentially expressed by 2 to 4-fold (Table
4.2 & 4.3).

185
Figure 5.6: Red and green boxes represents 3D view of protein spots those are up-regulated
by 4 fold or greater in B. infantis B1912, with compare to 0% O2 (control) to 21% O2
(treated).

186
5.4.5 Identification of proteins using MALDI-TOF/TOF (or
MALDI MS/MS) mass spectra analysis
From a recent study, a B. longum protein catalogue was established by using 2DE and
MALDI peptide mass fingerprinting (PMF) in which a total of 899 coomassie blue stained
gel spots were processed and 708 spots represented 369 protein entries (Oliver et al., 2002).
Another study reported that 28 proteins were differentially expressed in L. reuteri due to bile
salts stress (Lee et al. 2008). In addition, in another study, 12 hop stress-inducible proteins,
two acid stress-inducible proteins, 17 hop stress-over expressed proteins, and 1 hop stress-
repressed protein were observed in L. brevis (Behr et al. 2007).
However, we were unable to compare our image analysis data (oxidative stress treatment on
B. infantis 1912) on differentially expressed proteins with other Bifido sp. due to the lack of
availability of any published proteomic data. However, another report revealed that 69
proteins were over expressed (of which 15 were specific to oxidative stress) and 24 proteins
were repressed because of oxidative stress in Streptococcus mutans (Svensater et al. 2000).
In the present study, we observed a total of 21 significantly identified and differentially
expressed proteins either up-regulated or down-regulated due to oxygen treatment for B.
infantis 1912. We discovered from our image analysis results that, 9 proteins were found as
up-regulated and 12 proteins showed as down-regulated. During the bacterial cell viability
test, less significant difference was observed in cell viability tests in the same sample culture
(Figure 5.4). However, all 21 proteins were differentially expressed because of oxygen
treatments in B. infantis 1912 (Table 5.2). For the identification of proteins, the primary
focus was on the proteins that were differentially expressed rather than on creating a global
protein map on the 2-D gels. Using the combination of 2-DE and MALDI MS-MS analysis

187
we concluded with differentially expressed 21 proteins; among them 9 proteins indentified as
up-regulated (protein translocase subunit secA, UDP-N-acetylglucosamine diphosphorylase,
hypothetical extracellular protein, thiamine-phosphate kinase, 30S ribosomal protein S5,
acetate kinase, sigma 54 modulation protein / SSU ribosomal protein S30P, glycerol
dehydratase and HPr kinase) were differentially expressed by 2 to 13-fold whereas the
remaining 12 proteins (Table 5.2) were identified as down-regulated. However, all the
proteins were matched with the proteins from Lactobacillus reuteri in the database (Lee et al.
2008).

188
Table 5.2: The summary of the identified proteins as analysed by mass spectra analysis from
Bifidobacterium infantis B1912, shown below:
Spot
No Fold change Protein Name Species Matched
peptide Protein
coverage pI
Positive (+ve) values: up-regulated values in treated gels
2* 13.8* protein translocase subunit secA
Lactobacillus reuteri 66 47% 5.88
16 5.36 UDP-N-acetylglucosamine diphosphorylase
Lactobacillus reuteri 30 63% 6.16
63 2.87 hypothetical extracellular protein
Lactobacillus reuteri 38 42% 5.12
69 2.78 thiamine-phosphate kinase
Lactobacillus reuteri 45 74% 6.4
76 2.66 30S ribosomal protein S5
Lactobacillus reuteri 32 75% 9.6
88 2.55 acetate kinase Lactobacillus reuteri 37 61% 6.08
91 2.53
sigma 54 modulation protein / SSU ribosomal protein S30P
Lactobacillus reuteri 21 65% 5.86
95 2.46 glycerol dehydratase Lactobacillus reuteri 14 20% 4.74
120 2.11
HPr kinase
Lactobacillus reuteri 20 44% 6.41
Negative (-ve) values: down-regulated values in treated gels
12 -6.59
glycerol dehydrogenase
Lactobacillus reuteri 20 58% 4.83
19 -4.65 pyruvate dehydrogenase (acetyl-transferring)
Lactobacillus reuteri 47 69% 5.27
50 -3.27 Phosphopyruvate hydratase
Lactobacillus reuteri 40 72% 4.72
59 -2.93 lr1039 Lactobacillus reuteri 46 46% 5.43
351 -2.58 acetaldehyde dehydrogenase (acetylating)
Lactobacillus reuteri 44 49% 6.08
64 -2.86
carbon dioxide concentrating mechanism/carboxysome shell protein
Lactobacillus reuteri 11 93% 5.12
83 -2.57 phosphocarrier protein HPr
Lactobacillus reuteri 10 63% 5.09
86 -2.56 F0F1 ATP synthase subunit beta
Lactobacillus reuteri 55 84% 4.82
99 -2.37 glycosyl hydrolase family 65 protein
Lactobacillus reuteri 50 52% 4.93

189
360 -2.31 50S ribosomal protein L10P
Lactobacillus reuteri 26 83% 4.86
111 -2.23 2-dehydropantoate 2-reductase
Lactobacillus reuteri 12 30% 5.29
364 -2.21 ribulose-phosphate 3-epimerase
Lactobacillus reuteri 10 41% 4.91

190
5.5 Key achievements
After a thorough investigation, a number of differentially expressed proteins were found in B.
infantis B1912 cells during the oxidative stress condition and these proteins may play a key
role in the survivability of these micro-organisms. Hence, the oxidative stress responses
(observed in this probiotic bacterial strain) can be described as follows:
1. The probiotic bacterial strain used in this study is able to survive in toxic oxygen
environment.
2. The changes in SDS-PAGE pattern of cell growth was observed in both aerobic and
anaerobic conditions.
3. The 1-D SDS-PAGE protein profile indicates that proteins were purified successfully and
also it was clear that several proteins are present in B. infantis B1912 strain in both with and
without oxygen treatment.
4. Using the combination of 2-DE and MALDI-MS-MS analysis it was observed that a total
of 21 significantly identified and differentially expressed proteins either up-regulated or
down-regulated due to oxygen treatment for B. infantis 1912.
5. All 21 proteins were differentially expressed because of oxygen treatments in B. infantis
1912 (Table 5.2).
6. For protein identification by using MALDI- MS-MS mass spectra analysis, 9 proteins
(protein translocase subunit secA, UDP-N-acetylglucosamine diphosphorylase, hypothetical

191
extracellular protein, thiamine-phosphate kinase, 30S ribosomal protein S5, acetate kinase,
sigma 54 modulation protein / SSU ribosomal protein S30P, glycerol dehydratase and HPr
kinase) were identified as up-regulated and those were differentially expressed by 2 to 13-
fold whereas the remaining 12 proteins (Table 5.2) were identified as down-regulated.
7. In the 3D view, red and green boxes (Fig. 5.6) represented the images of protein spots that
are up-regulated by 4 fold or greater in B. infantis B1912, when compared to 0% O2 (control)
to 21% O2 (treated).
8. The image analysis results revealed that during the bacterial cell viability test, less
significant difference was observed in cell viability tests in the same sample culture (Figure
5.4). However, all 21 proteins were differentially expressed because of oxygen treatments in
B. infantis 1912 (Table 5.2).
9. In this study the image analysis data was very strong, reproducible and comprehensive, but
the study was unable to compare image analysis data (oxidative stress treatment on B.
infantis 1912) on differentially expressed proteins with other Bifidobacterium sp. due to the
lack of availability of any published proteomic data.
This data will be helpful for further study related to adaptation of oxidative stress resistance
in probiotic bacteria and be potentially useful to the improvement of the viability of bacteria
in fermented dairy foods.

192
5.6 Conclusion
The physiological and proteomic data presented in this work revealed that oxidative stress
induced a profound biological reformation in B. infantis b1912 and those data provides us
with indications for further investigations of Bifidobacteria on proteome. The combination of
2-DE and MALDI-TOF/TOF mass spectra analysis gave us access to the 369 differentially
expressed proteins from B. infantis b1912. Among them, 21 oxidative stress proteins were
indentified by using MALDI-TOF/TOF mass spectra analysis; these were changed 4-fold or
more than 2- fold, (for example protein translocase subunit secA, UDP-N-acetylglucosamine
diphosphorylase, hypothetical extra cellular protein) (Table 5.2). This valuable data may
assist in further study of the adaptation of probiotic bacteria in oxidative stress and also be
potentially useful in improvement of the viability of fermented dairy foods. This study will
provide valuable information for further investigation into this organism‘s oxidative
physiological stress responses including both global and specific responses to stress at
proteome label.

193
Chapter 6
Effects of oxidative stress in probiotic bacterial
characteristics
194
6.1 Abstract
The physiological characteristics (micro-organisms growth, acid and bile tolerance,
hydrophobicity, auto aggregation and coaggregation) of probiotic strains (L. casei Lc1, L.
rhamnosus DR-20, B. infantis 1912 and B. animalis subsp. lactis Bb12) were investigated
under oxidative stress. Al l four Lactobacillus and Bifidobacterium strains in both anaerobic
and aerobic conditions displayed a survival rate of higher than 105cfu/ml at pH2. Indicating
that they are able to protect themselves from acid as well as from the harmful effects of
oxygen. While interaction with bile salts (1.0%), both in anaerobic and aerobic conditions L.
rhamnosus DR-20 and B. infantis 1912 displayed considerable bile salt resistance with a
survivable rate of more than 107 and 106 cfu/ml indicated that they able to protect
themselves from bile salts and toxic oxygen effects. Here, in both anaerobic and aerobic
conditions, L. rhamnosus DR-20 and B. animalis subsp. lactis Bb12 displayed higher
hydrophobicity (55-60%) compared to the other two strains (36 to 41%). All strains showed a
medium level of auto aggregation (20% to 70 %) with the exception to B. animalis subsp.
lactis Bb12, which showed a lower level of auto aggregation (˂20%). Previously stated 4
starains and Lactobacillus acidophilus LAFTI L10 demonstrated slightly higher rate
(maximum 9%) of co-aggregation in anaerobic condition than its corresponding aerobic
condition. Finally, it was firmly established that all four probiotic strains acted as oxidative
resistant strains and at the same time they also demonstrated a substantial growth and
viability of more than 105cfu/ml in different levels of characterization studies stated earlier.

195
6.2 Introduction
Probiotic bacteria formed a part of the normal human intestinal microbiota, where a strict
anaerobic environment prevails. Many dairy products have incorporated probiotic strains
because of their health benefits. A number of commercial dairy products such as yoghurt,
fermented milk, and cheese are being supplemented with probiotic bacteria. However,
maintaining the viability of these organisms in high oxygen environments is difficult.
Limited information is available on the cellular growth of probiotic strains in aerobic
environment or about exposure to oxygen that causes changes of cellular physiological
characteristics, such as micro-organism growth, acid and bile tolerance, hydrophobicity, auto
aggregation and coaggregation.
Largely oxygen incorporation occurs when food is processed and stored and resulting
bacterial cell death. In addition, passage through the gastrointestinal tract can also result in
cell death. However, it has been shown that there is large intra-specific variation in response
to oxidative stress among probiotic species (Miyoshi et al., 2003). A number of studies have
been carried out to elucidate the oxidative defence mechanism, but only focused on some
physiological parameters (Ahn et al., 2001; Fridovich, 1998). Hence, the mechanism of how
bacterial cells respond to oxidative stress is not well understood. An understanding of intra-
specific differences in response to oxidative stress will provide greater insight on how
probiotic species adapt to a high oxygen environment.
Acid tolerance of probiotic bacteria is one of the key characteristics for their survival in the
GIT (Lee and Salminen, 1995). In particular, probiotic bacterial passage through the stomach
and small intestine will encounter high acidic and protease-rich conditions. Hence, these
organisms should be able to withstand in high acidity and probiotic bacteria should be
selected on the basis of their acid tolerance capacity. Simply, in vitro tests can be used to

196
assess their acid tolerance capacity and such tests have been applied in the selection of lactic
acid bacteria and Bifidobacterium strains were selected to be used as probiotics in dairy foods
(Tuomola et al., 2001). These in vitro tests are used for the selection of acid and bile-tolerant
strains and can also be applied to ensure the quality of probiotic cultures during manufacture,
storage and throughout the shelf life of the product. It is also possible that acid and bile
tolerance may vary in response to environmental variables such as oxidative stress.
In human stomach, the acidity ranges from pH 2.5 to 3.5 and also can vary from 1.5 to 6.0 or
may even increase further acidity after the consumption of food (Johnson, 1977; Lankaputhra
and Shah, 1995; Holzapfel et al., 1998). A wide range of pH conditions and in vitro methods
were used to screen the acid tolerant probiotic strains (Lankaputhra and Shah, 1995; Chou
and Weimer, 1999; Zarate et al., 2000).
Many probiotic bacteria have lack of ability to survive in the harsh acidity or bile
concentration commonly encountered in the GIT (Ding and Shah 2007; Shah and
Lankaputhra 1997; Gardiner et al., 2000). Based on its concentration, all bile salts can inhibit
the growth of probiotic bacteria (Ding and Shah 2007). In 1992, Goldin and Gorbach
reported that the concentration of bile salts in the range from 0.15% – 0.3% was considered
as suitable for the screening of probiotic bacteria for human consumption. However, the bile
salts concentrations ranging from 0.3% – 1.0% were used for the in vitro screening method to
identify the potential probiotic strains that were resistant to bile acids (Prasad et al., 1998;
Jacobsen et al., 1999).
It is considered that bifidobacteria as well as any other probiotic bacteria must reach the
intestine and adhere to the intestinal wall before they can exert their beneficial effects

197
(Pedersen and Tannock 1989; Alander et al., 1999). This adherent ability plays an important
role in colonization and consequently has been proposed as one of the main selection criteria
for potential probiotic strains (FAO/WHO 2001). However, in vivo evaluation for adhesion
ability is not easy to perform and is also expensive in terms of materials. Autoaggregation
ability and surface hydrophobicity of bacteria are two independent traits, and those
determinations have been proposed as indirect methods for evaluating the adhesion ability of
bacteria. Several researchers have been reported a good relationship between autoaggregation
and adhesion ability (Pan et al., 2006; Seshu et al., 2004; Del Re et al., 1998, 2000; Perez et
al., 1998) and surface hydrophobicity and adhesion ability (Marin et al. 1997; Wadstrom et
al., 1987). On the other hand, some researchers have proposed auto aggregation ability as a
more effective one, easier and reproducible tool for evaluating adhesion ability than surface
hydrophobicity (Del Re et al., 1998, 2000; Perez et al., 1998).
However, few studies have been investigated the correlation between autoaggregation ability
and surface hydrophobicity using several probiotic strains (Prasad et al., 1998; Del Re et al.,
2000; Kos et al., 2003; Castagliuolo et al., 2005; Otero et al., 2006; Bujalance et al., 2007).
Therefore, this study was undertaken to investigate the physiological properties
(microorganism growth, acid and bile tolerance, hydrophobicity, auto aggregation and
coaggregation) of four Lactobacillus and Bifidobacterium strains under oxidative stress. At
first, a total of 11 probiotic strains were screened to select oxygen tolerant strains and finally 4
strains (L. casei Lc1, L. rhamnosus DR-20 B. infantis 1912 and B. animalis subsp. lactis
Bb12) were selected as oxygen tolerant strains. Those 4 strains were further investigated for their
response to different probiotic physiological characterics such as microorganism growth, acid
and bile tolerance, hydrophobicity, auto aggregation and coaggregation.

198
6.3 Materials and methods
Selection and characterisation of probiotic bacteria were carried out using a number of
physiological characteristics to determine potential probiotic strains. However, only limited
information is available on the cellular growth of probiotic strains and the exposure to
oxygen that causes changes in cellular and physiological characteristics, such as micro-
organism growth, acid and bile tolerance, hydrophobicity, auto aggregation and
coaggregation. After a number of screening processes, only four probiotic strains (L. casei
Lc1, L. rhamnosus DR-20 B. infantis 1912 and B. animalis subsp. lactis Bb12) were selected
as oxygen tolerant strains and those strains were used for further investigation. All four
strains were determined against some basic physiological characterics (micro-organisms
growth, acid and bile tolerance, hydrophobicity, auto aggregation and coaggregation) of
probiotic bacteria required for potential strains for the dairy industries.
6.3.1. Micro-organisms and growth conditions
The bacterial strains used for this study were L. Casei Lc1 obtained from ASCC (Australian
Starter Culture Research Centre, Werribee, VIC, Australia), L. rhamnosus DR20, obtained
from ASCC, B. infantis 1912 supplied by DSM Food Specialties Ltd., Melbourne, Australia
and B. animalis subsp. lactis Bb12, Supplied by Chr. Hansen, Bayswater, VIC, Australia.
All four strains were grown anaerobically in gas jars using GasPak System (Oxoid, Adelaide,
Australia) for 24h at 37°C in de Man, Rogosa and Sharpe (MRS) broth (Oxoid, Adelaide,
Australia). The bacterial cells were harvested at 4000 x g for 15 min at 4°C and washed twice
with sterile 0.01 M phosphate buffered saline (PBS) solution. The cell viability of the
bacterial cultures was determined by spread plate count on MRS agar, which was incubated
under anaerobic conditions at 37°C for 48h.

199
Auto aggregation assay was performed using a modified method as previously described by
Mathara et al. (2008).
6.3.2. Acid tolerance
Acid tolerance of probiotic bacteria was tested using a method as previously described by
Lankaputhra and Shah, (1995). Milk-based medium or NGYC medium (12% non-fat skim
milk, 2% glucose, 1% yeast extract and 0.05% L-cysteine) was used for this experiment and
the pH value of the medium was adjusted to 2.0, 3.0, 4.0 or 6.5 (control) using 5 M HCL or 1
M NaOH. The bacterial cell suspensions were added to the pH adjusted NGYC medium and
then incubated anaerobically at 37°C for 3h. After the anaerobic incubation at 37°C for 48h,
the survivability of each bacterial sample was determined by using spread plate count on
MRS agar. Means and standard deviations were calculated. The entire experiment was
replicated for six times. The overall reduction in the viability of bacterial strains in different
pH conditions was calculated using following formula:
Overall reduction of viability =
(pH6.5 - pH4.0) + (pH6.5 - pH3.0) + (pH6.5 - pH 2.0)
6.3.3 Bile tolerance
The determination of bile tolerance of probiotic bacteria was performed using a method
previously described by Truelstrup Hansen et al. (2002). Here milk-yeast extract medium
(pH 6.9) was used that consists of 10% non-fat skim milk powder, 0.5% yeast extract, 0.05%
L-cysteine and in addition 0% (Control), 0.5% or 1.0% (w/v) bile salts (Oxgall, Sigma,

200
Australia) were used. The bacterial cell suspensions were inoculated into the milk-yeast
extract medium and incubated at 37°C anaerobically for 6h.
After an anaerobic incubation at 37°C for 6h, the survival rate of the bacterial cells was
determined using spread plate count on MRS agar.
Means and standard deviations were calculated. The entire experiment was replicated for six
times. The overall reduction in the viability of bacterial strains in different bile
concentrations was calculated using the following formula:
Overall reduction of viability = (0% - 0.5%) + (0% - 1.0%)
6.3.4 Hydrophobicity assays
The in vitro cell surface hydrophobicity was determined by the bacterial adherence to
hydrocarbon which was investigated using a modified method as previously described by
Rosenberg et al. (1980). The bacterial cultures were grown in MRS broth at 37 °C for 24h, in
anaerobic condition. The test cultures were harvested after centrifuging at 5,000 rpm for 10
min, washing twice with 0.01 M PBS solution and resuspending in 0.01 M PBS. The
absorbance (A0) was measured at 600 nm. A volume of 0.6 ml n-hexadecane (Merck,
Melbourne, Australia) was added to 3-ml aliquots of bacterial cell suspension. The mixture
was blended thoroughly using a vortex mixer for 120s. The tubes were allowed to stand at 37
°C for 30 min to separate the two phases. The aqueous phase was carefully removed and the
absorbance (A) was measured at 600 nm. The percentage of hydrophobicity was calculated
for six replicates. Means and standard deviations were calculated. The decreased percentage
in absorbance of the initial aqueous bacterial suspension was due to cells partitioning into a

201
hydrocarbon layer. The percentage of cell surface hydrophobicity (%H) of the strain adhering
to hexadecane was calculated using the following equation:
Hydrophobicity (%H) = [(A 0 - A)/A 0] X 100
Where A0 and A are the absorbance of before and after extraction with n-hexadecane,
respectively.
6.3.5 Auto aggregation and coaggregation assays
The bacterial strains were grown anaerobically for 18h at 37 °C in MRS broth and then cells
were harvested by centrifuging at 5000 rpm for 15 min, and washing twice with sterile 0.01
M PBS solution. Cells were then re-suspended in 0.01 M PBS solution and prepared for
autoaggregation and coaggregation assays.
6.3.5.1 Auto aggregation assays
Auto aggregation assay was performed using a modified method as previously described by
Mathara et al. (2008). 4 ml aliquots of the cell suspensions were mixed by vortexing for 10s
and autoaggregation was determined during the 5h of incubation at room temperature. Every
hour 0.1 ml of the upper suspension was transferred to another tube containing 0.9 ml of PBS
and the absorbance (A) was measured at 600 nm. Means and standard deviations were
calculated. The entire experiment was replicated for six times.
Autoaggregation ability was expressed as autoaggregation percentage (AAg%) and
calculated using the following formula:
AAg%= [(A0 - A)/A0] X 100
Where A0 and A are the absorbances of cultured media at 0-h and after 6-h intervals,
respectively. As described by Rahman et al. (2008) AAg% could be classified into three

202
groups: high autoaggregation (HAag: 70% and above AAg), medium autoaggregation
(MAag: between 20–70% AAg), and low autoaggregation (LAag: 20% AAg) strains.
6.3.5.2 Coaggregation assays
Coaggregation assay was performed using a modified method as previously described by
Handley et al. (1987). Equal volumes (2-ml aliquots) of different bacterial cell suspensions
were mixed together by vortexing for 10s and control tubes consist of 4-ml aliquots of
individual bacterial cell suspensions. Both, mixed bacterial cell suspensions and control tubes
were incubated for 6h at 37°C.
The absorbance (A) of the upper cell suspension (0.1 ml) was measured at 600 nm.
The entire experiment was replicated for six times. Means and standard deviations were
calculated. Coaggregation assay was repeated six times to estimate the average and standard
error.
The coaggregation percentage is expressed as:
=Coaggregation (%)(Ax + Ay)/2 - A (x+y)
(Ax + Ay)/2
X 100
Where Ax and Ay represents individual bacterial strains in the control tubes and A (x + y)
represents the mixture of bacterial strains.

203
6.4 Results and Discussion
6.4.1 Acid tolerance
The effect of various levels of gastric conditions on Lactobacillus and Bifidobacterium
strains showed in Table 6.1. All bacterial strains demonstrated differences in cell viability in
various pH conditions for a period of 3h. To provide adequate health benefit to the host,
probiotic bacteria must be tolerant to harsh gastric conditions and high bile salt
concentrations in the GI tract. The normal pH of human gastric juice can be below 3.0, and
that can be enough to prevent all bacterial growth in the GI tract. In addition, the pH level of
the stomach can be decreased to 1.0 however a number of studies suggested a pH level of 3.0
for in vitro assays (Garriga et al., 1998; Suskovic et al., 1997). The earlier suggestion is also
supported by Usman and Hosono (1999) who recommend the survival of probiotic bacteria at
pH 3.0 for 2h as an optimal screening condition for the characterisation of probiotic strains
towards acid tolerance. In this study the overall reduction in cell viability of probiotic
bacterial strains at various pH levels can be considered as selection criteria for the
characterisation of Lactobacillus and Bifidobacterium strains towards acid tolerance.
In anaerobic condition, all four bacterial strains (L. casei Lc1, L. rhamnosus DR-20, B.
infantis 1912 and B. animalis subsp. lactis Bb12) demonstrated as tolerant strains to acid at
pH level 2.0 with a reduction of 1.84 to 2.71 log colony-forming units (cfu)/ml. Similarly, in
aerobic condition all strains demonstrated as tolerant strains to acid at pH level 2.0 with a
reduction of 0.99 to 1.76 log cfu/ml. All four Lactobacillus and Bifidobacterium strains (L.
casei Lc1, L. rhamnosus DR-20, B. infantis 1912 and B. animalis subsp. lactis Bb12) in both
anaerobic and aerobic conditions displayed a better survival rate at pH2.0 with cell viability
of higher than 105 cfu/ml (Table 6.1). However, in both anaerobic and aerobic conditions L.
rhamnosus DR-20 and B. animalis subsp. lactis Bb12 demonstrated as highly tolerant (more

204
than106 cfu/ml) strains to various pH conditions with less overall decrease in cell viability. In
pH2.0, L. rhamnosus DR-20 and B. animalis subsp. lactis Bb12 were survived by more than
106 cfu/ml, whereas other bacterial strains L. casei Lc1 and B. infantis 1912 were survived by
more than105 cfu/ml. So, this study demonstrated that all 4 probiotic strains acted as
oxidative resistant cells and they are able to protect themselves from the toxic oxygen effects
and at the same time they also can protect themselves from toxic acid effects. The present
study was conducted to examine the interaction of different probitic strains under various pH
conditions. Similar studies using similar strain-specific variations to simulated gastric
conditions wre also reported by others (Truelstrup Hansen et al., 2002; Mishra and Prasad,
2005). In addition, this study also demonstrated that all 4 probiotic strains acted as oxidative
resistant cells and they able to protect themselves from the toxic oxygen effects.
In anaerobic condition, at pH3.0 and 3h incubation period, L. rhamnosus DR-20 and B.
animalis subsp. lactis Bb12 showed a greater survival rate of over 106 cfu/ml and with the
same conditions, L. casei Lc1 and B. infantis 1912 showed a lower survival rate of over 105
cfu/ml. But in aerobic condition and at pH level 3.0, all four strains showed similar survival
rates of over 105 cfu/ml after 3h of incubation. Again, in anaerobic condition at pH3.0, B.
animalis subsp. lactis Bb12 showed greater tolerance with less reduction in cell viability of
1.65 cfu/ml, followed by L. rhamnosus DR-20 with a viability reduction of 2.5 cfu/ml with
the same conditions. However, at pH level 3, the lowest reduction was observed for B.
animalis subsp. lactis Bb12 of 0.97 cfu/ml in aerobic condition with a survival rate of over
105 cfu/ml. However at pH3.0 in aerobic condition B. infantis 1912 demonstrated a survival
rate of over 105 cfu/ml with a reduction rate of 1.55 cfu/ml after a period of 3h incubation.

205
At pH level 4.0, in anaerobic condition, all four bacterial strains, L. casei Lc1, L. rhamnosus
DR-20, B. infantis 1912 and B. animalis subsp. lactis Bb12 displayed high tolerance with a
survival rate of more than 106cfu/ml, with a reduction rate of 2.36, 2.33, 2.01 and 2.03
cfu/ml. But in aerobic condition all four strains displayed less tolerant rate (compare to
anaerobic condition) of over 105 cfu/ml with less reduction rate of 1.17, 1.15, 1.2 and 1.17
cfu/ml (Table 6.1). All bacterial strains (Lactobacillus and Bifidobacterium) were screened in
anaerobic and aerobic condition to determine their tolerance to pH 2.0, pH 3.0 and pH 4.0.
The results showed a significant variations (P < 0.01) in their cell viability when compared
with pH 6.5 (control).
All 4 probiotic strains were previously selected as oxidative stress resistant strains. All strains
were investigated in both anaerobic and aerobic conditions, with a different pH level pH2.0,
pH3.0, pH4.0 and pH6.5 (control), incubated at 37°C for 3h then overall reduction of cell
viability was calculated to determine the potential probiotic strains. However, in anaerobic
condition and at various pH levels L. rhamnosus DR-20 and B. animalis subsp. lactis Bb12
exhibited greater tolerance. Even at pH 2.0 both strains displayed a survival rate of more
than106 cfu/ml. The details of the viability results are described in Table 6.1.
6.4.2. Bile salts tolerance
The ability of bacteria to protect themselves against bile stress is one of the criteria often
used for the selection of potential probiotic bacteria. Bile is a complex material which
consists of bile acids, phospholipids, proteins, ions, and pigments and it also carries potent
antimicrobial properties, particularly to protect against gram-positive bacteria (Whitehead et
al. 2008). Previously a number of studies reported the effects of various bile salt
concentrations on the growth of probiotic bacteria (Lankaputhra and Shah, 1995; Prasad 52 et

206
al., 1998; Truelstrup Hansen et al., 2002) but no reports suggested the ideal concentration of
bile salts that can be used as selection criteria towards the characterisation of probiotic
bacteria.
The concentration of bile salts varies in the human GI tract and it is believed that the bile
concentration in human is 0.3% w/v (Sjovall, 1959, Gilliland et al., 1984). In this study, the
tolerance of probiotic bacteria towards bile salts was investigated using 0.5% and 1.0%
concentrations of bile salts. Table 6.2 showed the effect of bile salts on the growth of two
selected Lactobacillus and two Bifidobacterium strains.
In anaerobic condition, the effects of bile salts at 0.5% and 1.0% levels for 6h incubation were
found to be less detrimental to L. casei Lc1, L. rhamnosus DR-20, B. infantis 1912 and B.
animalis subsp. lactis Bb12. That means less reduction in overall cell viability when compared
to aerobic condition. Both in anaerobic and aerobic conditions, all strains in 0.5% and 1.0% bile
salts showed less than (1.0)6 cfu/ml reduction in survivality. Both in anaerobic and aerobic
conditions the resistance of L. casei Lc1, L. rhamnosus DR-20 and B. animalis subsp. lactis
Bb12 strains towards 0.5% bile salts also showed reduction in cell survivality, which was not
higher than (0.50)6 cfu/ml, with the exception of B. infantis 1912 (both in anaerobic condition)
which exhibited a slightly higher reduction rate of (0.56)6 cfu/ml. The overall reduction of cell
viability in different bile salts demonstrated that L. rhamnosus DR-20, L. casei Lc1 and B.
animalis subsp. lactis Bb12 were three potential probiotic strains with high tolerance to bile
salts, whereas B. infantis 1912 demonstrated similar overall reduction of survival at different
bile salt concentrations. However, on the preference basis within three selected strains, L.
rhamnosus DR-20, showed better tolerance to bile salts compared to L. casei Lc1 and L. B.
animalis subsp. lactis Bb12.

207
Again in anaerobic condition, L. rhamnosus DR-20 and B. infantis 1912 displayed better bile
salt resistance and survived by more than 107 cfu/ml in 1.0% bile salts, whereas in aerobic
condition both strains displayed a lower survival rate by more than 106 cfu/ml in 1.0% bile
salts. Here the effects of oxygen toxicity played a negative role on the growth of probiotic
bacteria. However, in aerobic condition, all four strains (L. casei Lc1, L. rhamnosus DR-20,
B. infantis 1912 and B. animalis subsp. lactis Bb12) demonstrated a lower survival rate in
various concentrations of bile salts when compared to anaerobic condition. Both in anaerobic
and aerobic conditions L. casei Lc1 and B. animalis subsp. lactis Bb12 strains showed very
similar growth with a survival rate of over 106 cfu/ml in various bile salt concentrations but
in all cases the survival rate in aerobic condition was slightly lower than corresponding
anaerobic conditions. So in aerobic condition every single strain in every single bile salt
concentration displayed a negative effect on the growth of probiotic bacteria due to the toxic
effects of oxygen. However, all strains are able to survive with a higher growth rate (over 106
cfu/ml) in various bile salt concentrations in both anaerobic and aerobic conditions. The
effect of bile salts and oxygen on the growth of probiotic strains was less than (1)6cfu/ml.
This study also demonstrated that all four probiotic strains are likely to survive in varying GI
tract conditions, where they could exert positive health effects on the host. Therefore no
significant differences were found between anaerobic and aerobic condition. This study also
demonstrated that all 4 probiotic strains acted as oxidative resistant cell and they able to
protect themselves from the toxic oxygen effects.

208
Table 6.1 Survival of Lactobacillus and Bifidobacterial strains in simulated gastric (acid) conditions (for 3h incubation period).
aInitial bacterial cell concentration. Red = Cell viability reduction with compare to control bValues (Log10 CFU ml-1) are mean ± SEM (n = 6). cExpressed as Log10 values using the formula: (pH 6.5 – pH 4.0) + (pH 6.5 – pH 3.0) + (pH 6.5 – pH 2.0). dNot detected. Detection limit was 101 CFU/ml. ..Mean values were significantly different (P < 0.01) from the pH 6.5 (Control)٭
Probiotic strains
Cell Countsa,b
pH 6.5b (Control)
pH4.0b Reduced at pH4
pH 3.0b Reduced at pH3
pH 2.0b Reduced at pH2
Overall reductionc
L. rhamnosus DR-20 (anaerobic)
9.38 ± 0.52
9.06 ± 0.84
6.70 ± 0.91*
2.36 6.83 ± 1.63*
2.23 6.45 ± 0.47*
2.61 7.6
L. rhamnosus DR-20 (aerobic)
7.51 ± 0.52
7.12 ± 1.03
5.95 ± 1.00*
1.17 5.96 ± 0.94*
1.16 5.94 ± 0.94*
1.18 3.49
L. casei Lc1 (anaerobic)
8.71 ± 1.17
8.41 ± 1.55
6.08 ± 0.50*
2.33 5.91 ± 1.53*
2.5 5.70 ± 0.47*
2.71 7.54
L. casei Lc1 (aerobic)
7.58 ± 0.52
6.79 ± 1.37
5.64 ± 0.58*
1.15 5.51 ± 1.25*
1.28 5.28 ± 0.82*
1.51 3.94
B. infantis 1912 (anaerobic)
8.25 ± 0.89
8.19 ± 1.03
6.18 ± 0.58*
2.01 5.52 ± 1.21*
2.67 5.50 ± 0.82* 2.69
7.37
B. infantis 1912 (aerobic)
7.96 ± 0.11
6.96 ± 1.03
5.76 ± 1.4*
1.2 5.46 ± 0.94*
1.5 5.20 ± 0.47* 1.76
4.46
B. Lactis Bb12 (anaerobic)
8.22 ± 1.37
8.13 ± 0.52
6.10 ± 1.00*
2.03 6.48 ± 0.69*
1.65 6.29 ± 0.82* 1.84
5.52
B. Lactis Bb12 (aerobic)
7.06 ± 0.98
6.38 ± 0.89
5.21 ± 0.58*
1.17 5.41 ± 1.5*
0.97 5.39 ± 0.47*
0.99 2.62

209
Table 6.2 Survival of Lactobacillus and Bifidobacterium strains in milk-yeast medium (for
3h incubation period) with oxgall (ox bile extract).
Probiotic strains
Normal cells
0% bile 0.5% bile 1% bile Overall viability reduction
L. rhamnosus DR-20 (anaerobic)
8.18 ± 0.52
7.96 ± 1.03
7.81 ± 0.89 7.19 ± 1.1* 0.92
L. rhamnosus DR-20 (aerobic)
7.31 ± 0.52
7.06 ± 1.03
6.94 ± 1.03 6.94 ± 1.05 0.24
L. casei Lc1 (anaerobic)
7.71 ± 1.17
7.28 ± 0.55
7.10 ± 0.52 6.94 ± 1.01 0.52
L. casei Lc1 (aerobic)
6.48 ± 0.52
6.55 ± 1.03
6.18 ± 0.52 6.28 ± 0.52 0.64
B. infantis 1912 (anaerobic)
8.25 ± 0.89
7.76 ± 1.33
7.20 ± 0.52* 7.20 ± 0.41* 1.12
B. infantis 1912 (aerobic)
6.96 ± 1.1
6.72 ± 1.03
6.68 ± 0.52
6.51 ± 1.37 0.25
B. Lactis Bb12 (anaerobic)
8.22 ± 1.37
7.12 ± 1.03
7.03 ± 1.86
6.94 ± 1.03 0.27
B. Lactis Bb12 (aerobic)
7.06 ± 0.98
6.17 ± 1.55
6.08 ± 0.52
6.08 ± 0.32 0.18
aInitial bacterial cell concentration.
Overall viability reduction = Cell viability reduction with compare to control bValues (Log10 CFU ml-1) are mean ± SEM (n = 6). cNot detected. Detection limit was 101 CFU/ml. . Mean values were significantly different (P < 0.01)٭

210
hydrophobicity
0
10
20
30
40
50
60
70
Lc1anaerobic
Lc1 aerobic DR20anaerobic
DR20aerobic
BB12anaerobic
BB12aerobic
1912anaerobic
1912aerobic
probiotic bacteria
perc
en
tag
e
Figure 6.1 Surface hydrophobicity of L. casei Lc1, L. rhamnosus DR-20, B. infantis 1912 and B. animalis subsp. lactis Bb12
Values are mean ± SEM (n = 6).

211
Percentage of autoaggregation
0
5
10
15
20
25
30
Lc1 on0%
oxygen
Lc1 on21%
oxygen
DR20 on0%
oxygen
DR20 on21%
oxygen
BB12 on0%
oxygen
BB12 on21%
oxygen
B1912 on0%
oxygen
B1912 on21%
oxygen
probiotic bacteria
Rati
o o
f %
Figure 6.2 Autoaggregation abilities of L. casei Lc1, L. rhamnosus DR-20, B. infantis 1912 and B. animalis subsp. lactis Bb12
Values are mean ± SEM (n = 6).

212
Coaggregation
0
10
20
30
40
50
60
Lc1+DR20under 0%oxygen
Lc1 + DR20 under 21%
oxygen
DR20+L10under 0%oxygen
DR20 +L10under 21%
oxygen
BB12+Lc1under0% oxygen
BB12+Lc1under 21%
oxygen
B1912+DR20under 0%oxygen
B1912+DR20under 21%
oxygen
probiotic bacteria
perc
enta
ge
Figure 6.3 Coaggregation abilities of L. casei Lc1, L. rhamnosus DR-20, B. infantis 1912, B. animalis subsp. lactis Bb12 and Lactobacillus
acidophilus LAFTI L10. Values are mean ± SEM (n = 6).

213
6.4.3 Hydrophobicity assay
Adhesion and colonisation of probiotic bacteria in the gastrointestinal tract of the host is one
of the essential requirements for the delivering of health benefits (Bernet et al., 1994). In
recent years, a number of studies have been published on the usefulness of human intestinal
cell-lines (e.g. HT-29, Caco-2 and HT29-MTX) as in vitro model systems for assessing the
colonisation of potential bacterial strain (Elo et al., 1991; Bernet et al., 1993; Adlerberth et
al., 1996; Tuomola and Salminen, 1998). In this study, the adhesion of bacteria to n-
hexadecane was used to predict the adherence ability of Lactobacillus and Bifidobacterium
strains. Here, in both anaerobic and aerobic conditions, out of 4 strains (L. casei Lc1, L.
rhamnosus DR-20, B. infantis 1912 and B. animalis subsp. lactis Bb12) L. rhamnosus DR-20
and B. animalis subsp. lactis Bb12 displayed higher hydrophobicity (55-60%) when
compared to the other two strains (36 to 41%). But all 4 strains also displayed slightly higher
hydrophobicity rates in anaerobic condition compared to its corresponding strains in aerobic
condition. In all anaerobic and aerobic conditions, the strains showed only 5% difference in
hydrophobicity rate. In all cases, no significant difference was observed in anaerobic and
aerobic condition. The hydrophobicity results also indicated that all four strains appeared as
oxygen tolerant strains and in aerobic condition their ability to adhere with GI tract was
found to be slightly less than corresponding anaerobic conditions.
6.4.4 Auto aggregation assay
The ability of probiotic bacteria to adhere to the intestinal epithelium is a prerequisite for
probiotic micro-organisms to be effective. Thus, the ability to adhere to epithelial cells and
mucosal surfaces has been suggested to be an important property of many probiotic bacterial
strains (Ouwehand et al. 1999; Collado et al. 2005). As a part the present study the
autoaggregation ability was investigated in both anaerobic and aerobic conditions using four

214
strains of Lactobacillus and Bifidobacteria. In thos study, it was found that all four probiotic
strains showed good autoaggregation ability and surface hydrophobicity, which is consistent
with the results of Del Re et al. (2000) who reported that some strains of B. longum showed
autoaggregation ability, good degree of surface hydrophobicity, and capability to adhere to
Caco-2 cells.
All strains used in this study have showed differences in their autoaggregation abilities from
one strain to another. But interestingly, very little autoaggregation ability differences were
observed between anaerobic and aerobic conditions for each individual strain. Precisely, the
highest autoaggregation was observed in L. rhamnosus DR-20 followed by B. infantis 1912,
L. casei Lc1 and B. animalis subsp. lactis Bb12. According to Rahman et al. (2008) in this
study all strains showed medium levels of autoaggregation (20 to 70 %) with the exception to
B. animalis subsp. lactis Bb12, which showed a lower levels of autoaggregation (˂20%). As
stated earlier, similar differences in autoaggregation and hydrophobicity of bacterial strains
were also reported by Del Re et al., (2000). However, for all probiotic strains the
autoaggregation results were found to be slightly different (˂4%) between anaerobic and
aerobic conditions indicating that all strains displayed as oxidative stress resistant strains and
they are able to adhere with similar capacity in both anaerobic and aerobic conditions. So the
toxic oxygen effects were not able to do much damage to their capacity for adherence or
autoaggregation or hydrophobicity.
6.4.5 Coaggregation assay
In recent years, coaggregation has been investigated among the different types of probiotic
bacteria that were isolated from mammalian GI tracts and human urogenital tract and human
oral cavity (Rickard et al., 2003). Previously the coaggregation ability of Lactobacillus

215
strains with enterotoxigenic E. coli was described by Drago et al. (1997). A number of
studies reported the beneficial effects of cell aggregation in promoting the colonisation of
lactobacilli in GI and vaginal tracts (Kmet and Lucchini, 1997; Cesena et al., 2001; Jankovic
et al., 2003). In this study coaggregaion was conducted among four different oxidative
resistant probiotic strains (L. casei Lc1, L. rhamnosus DR-20, B. infantis 1912 and B.
animalis subsp. lactis Bb12) and Lactobacillus acidophilus LAFTI L10 in both anaerobic
and aerobic conditions. The highest (47%) coaggregaion was observed with B. animalis
subsp. lactis Bb12 and L. casei Lc1 in anaerobic condition whereas under aerobic conditions
it was 38%. Similarly the next highest (45%) coaggregaion was observed between L.
rhamnosus DR-20 and Lactobacillus acidophilus LAFTI L10 in anaerobic condition whereas
under aerobic conditions it was 38%. Between B. infantis 1912 and L. rhamnosus DR-20 L.
rhamnosus DR-20 it was found to be 37% (anaerobic) and 30% (aerobic), and between L.
casei Lc1 and L. rhamnosus DR-20 it was found to be 33% (anaerobic) and 25% (aerobic).
So in all cases the coaggregation in anaerobic conditions was slightly higher (maximum 9%)
than in the corresponding aerobic condition. So the lower coaggregation in aerobic
conditions was due to the lower level of oxygen toxicity. However, in this study all four
strains appeared as oxidative resistant strains.

216
6.5 Conclusion
In both anaerobic and aerobic conditions all four primarily selected oxidative resistant
Lactobacillus and Bifidobacterium strains displayed a survival rate of higher than 105 cfu/ml
in both low pH (2.0) and high bile salt concentration (1.0) indicating that they are able to
protect themselves from the toxic effects of acid and bile salts. All strains also demonstrated
satisfactory results during other physiological characteristic tests such as hydrophobicity,
auto aggregation and coaggregation. B. animalis subsp. lactis Bb12 displayed higher
hydrophobicity (55-60%) compared to the other two strains (36 to 41%). Again all strains
showed a medium level of auto aggregation (20% to 70 %) with the exception to B. animalis
subsp. lactis Bb12, which showed a lower level of auto aggregation (˂20%). In all cases the
coaggregation in anaerobic condition was slightly higher (maximum 9%) than its
corresponding aerobic condition. So the selected all four probiotic strains showed a better
survival rate both in aerobic and anaerobic conditions during the characteristic tests where in
most case the survival rate in anaerobic condition were slightly higher than its corresponded
aerobic condition, The results also indicated that all those strains are able to protect
themselves from oxygen toxicity with a high volume of survival rate. More investigation may
require demonstrating whether they are able to survive at a similar level of protective roles
and survivability in probiotic food products.

217
Chapter 7
Protective effect of microencapsulation on oxidative
stress in selected probiotic strains

218
7.1 Abstract
In this study microencapsulation technology was used to investigate its protective role
against oxidative stress in four probiotic bacterial strains (L. casei Lc1, L. rhamnosus DR20,
B. infantis 1912 and B. lactis bb12). All four strains were encapsulated in calcium alginate
and grown aerobically in Reconstituted Skim Milk (RSM) broth for 24h. Encapsulated cells
were counted for each bacterial strain and it was found that in all cases the encapsulated cell
counst were slightly higher than its corresponding free cell counts. There were no significant
(p<0.05) differences observed between two cell counts indicating that all four probiotic
strains are able to protect themselves from the toxic effects of oxygen with a high survival
rate (from 5.63 log10
cfu/ml to 8.70 log10
cfu/ml free cell counts in aerobic condition). All four
probiotic strains were found to be as oxidative resistant strains as expected because those
strains were previously selected as oxidative resistant strains. However under both
aerobically and anaerobically situations microencapsulation demonstrated slightly increased
viable cells compared to the free cells samples. This study also demonstrates the protective
role of microencapsulation for probiotic bacteria against oxidative stress when cells were
allowed to grow in aerobic conditions. Further investigation may be required to confirm the
use of microencapsulated cells in different types of dairy product.
219
7.2 Introduction
In general, the concentration of probiotic bacteria is expected to be at the level of 107 cfu/ml
of product at the time of consumption (Ding and Shah, 2007) but a large proportion of the
bacteria in probiotic products die following their passage through the stomach and the upper
part of the small intestine. Again, the technologies that are used to process and store probiotic
foods are also known to impose major stresses to these microbial cells.
The incorporation of probiotics into food products has been proposed as a new approach to
improve the health value of functional foods. The applications of probiotics in food products
has been limited due to the industrial food processes where elevated temperatures,
compression, and the presence of oxygen and moisture can adversely affect their survival
rates. With microencapsulation technologies, probiotics can now become a key ingredient in
functional foods, expanding probiotic applications outside the pharmaceutical and
supplement industries.
Microencapsulation is a packaging technology used to protect solids, liquids or gaseous
materials with the help of protective membranes in miniature or in sealed capsules so that
their contents can be released at controlled rates under the influences of specific conditions
(Picot and Lacroix., 2004; Kailasapathy and Masondole, 2005: Anal and Singh, 2007; Boh,
2007). A microcapsule is an entrapped solid/liquid core material surrounded by a
semipermeable, spherical, thin and strong membrane with a diameter ranging from a few
microns to 1 mm (Anal and Singh, 2007). In developed countries Lactobacillus and
Bifidobacterium species are the most popular bacteria applied in probiotic food products
(Poonam et al., 2010). Thus, a number of technologies were introduced to protect the
probiotic bacteria from unfavourable environments and to increase the viability of probiotic
bacteria. These include cell incubation under sub-lethal conditions, cell propagation in an

220
immobilized biofilm, and microencapsulation (Barbaros et al., 2009). Only
microencapsulation has been found to be the most promising and most effective technique
for the protection of probiotic bacteria (Krasaekoopt et al., 2003; Kim et al., 2008).
Talwalkar and Kailasapathy (2003) reported that alginate-starch gel beads can be used to
protect Lactobacillus acidophilus and Bifidobacterium lactis and also added that
encapsulation prevented cell death from oxygen toxicity. A number of methods have been
developed for the encapsulation of probiotic bacteria to use in fermentation and for
incorporating into functional food products. These include spray drying, gel encapsulation
techniques complex coacervation, and extrusion spheronization (Poonam et al., 2010). As
high levels of viable micro-organisms are recommended for the efficacy of the probiotic food
products, so protecting the viability and stability of probiotics have been major challenges for
the industrial producers (Knorr, 1998).
Microencapsulation of probiotic cells has been shown to preserve them from adverse
environmental factors such as high acidity (Wenrong and Griffiths, 2000), bile salts (Lee and
Heo, 2000), heat shocks caused by process conditions such as spray drying, cold shocks
induced by the process conditions such as deep freezing and freeze drying (Shah and Rarula,
2000), molecular oxygen in case of obligatory anaerobic micro-organisms (Sunohara et al.,
1995), bacteriophages (Steenson et al., 1987) and chemical antimicrobial agents (Sultana,
2000). Some other advantages can also be achieved such as increase of sensory properties
stability and its improvement (Gomes and Malcata, 1999) and immobilization of the cells for
their homogeneous distribution throughout the product (Steenson et al., 1987).

221
In this part of the study, the target is to investigate the protective role of microencapsulation
against oxidative stress on four different probiotic strains L. casei Lc1, L. rhamnosus DR20,
B. infantis 1912 and B. lactis bb12.
7.3 Aim and Objectives
In this study, the aim is to investigate whether microencapsulated cells survive better than
free cells under aerobic environments. In addition, it aims to develop a protocol for
evaluating the protective effect of microencapsulation against oxygen toxicity in both culture
broths (RSM), and to compare the encapsulated cell counts with the free cell counts after
aerobic incubation. Calcium alginate has been chosen as the encapsulation material because
of its lower cost, non-toxicity and for its ability to release cells from the alginate gel under
appropriate conditions.
7.4 Materials and Methods
7.4.1 Preparation of Micro-organisms and media
In this investigation, four different probiotic strains were used: L. casei Lc1, L. rhamnosus
DR20, B. infantis 1912 and B. lactis bb12. Inoculamn for each bacterial strain were prepared
in MRS broth supplemented with 0.05% cysteine. The phosphates in MRS broth, however,
dissolved the capsules and therefore for the encapsulation study it was replaced with 9.5%
reconstituted skim milk supplemented with 2% glucose and 0.5% yeast extract.

222
7.4.2 Preparation of encapsulated bacteria
The encapsulation method employed in this study (Fig. 7.1) was based on the method
primarily proposed by Sheu and Marshall (1993) and later modified by Sultana et al. (2000).
For each strain, 5 ml of the 18 h old cultures was added to 45 ml 2% w/v alginate- 2% w/v
starch slurry prepared in Milli-Q water (Millipore, Massachusetts, USA) and the pH was
adjusted to 6.2 using NaOH (1.0M and 0.1M) (Ajax chemicals, Sydney, Australia). The
bacteria-starch-alginate slurry was allowed to mix thoroughly for 30 min using a magnetic
stirrer. 5 ml of the slurry was added drop wise into a beaker containing 0.1M calcium
chloride, using a sterile 1ml syringe (0.5 mm gauge). The beads were kept at 4°C overnight
in CaCl2 (Sigma, Sydney, Australia) for further hardening; the calcium chloride solution was
decanted and the beads were washed with 0.85 % sterile saline. All the washed beads
originating from 5 ml of the slurry were treated as an inoculum. The entire process was
carried aseptically in a laminar flow chamber.

223
Figure 7.1 Schematic diagram of microencapsulation process.
7.4.3 Survival of encapsulated probiotic bacteria under aerobic
conditions
Initial studies demonstrated that the cell counts from 500 μl of free cells were similar to cell
counts from 5 ml of alginate-starch-bacteria beads. Therefore, the encapsulation experiments
were performed by adding the same inoculum levels (i.e. 500 μl of free cells and 5 ml of
alginate-starch-bacteria beads of the probiotic strains) separately to 250 ml Erlenmeyer flasks
containing 100 ml of medium. The broth experiment was conducted in RSM broth using L.

224
casei Lc1, L. rhamnosus DR20, B. infantis 1912 and B. lactis bb12. All flasks were plugged
with cotton wool to maintain aerobic conditions and incubated aerobically at 37°C on a
shaker at 100 rpm for 24h. The RSM broth experiment was conducted at 37°C. In addition,
the pH of the media was also monitored. Duplicate flasks were used throughout this entire
study. In addition, the entire experiment was conducted twice.
7.4.4 Release of entrapped cells
All beads were harvested and were washed free of media by rinsing them thrice with 0.85%
sterile saline. The beads were added to 45 ml 0.1M phosphate buffer (pH 7.0) in a stomacher
bag and homogenized for 30 min in a stomacher. The beads were then dissolved and released
the cells. Finally, the cell count in the homogenized suspension was enumerated on
appropriate media plates.
7.4.5 Enumeration of cell counts
The RSM broth containing the free cells and the homogenized suspension were serially
diluted in peptone water and then spread-plated on MRS agar plates containing 0.05%
cysteine. For the broth study, selectivity of MRS-LP and MRS-S was ensured by streaking
pure cultures of L. casei Lc1, L. rhamnosus DR20, B. infantis 1912 and B. lactis bb12. All of
these strains were used in this study on both media and confirmed that L. casei Lc1 and L.
rhamnosus DR20 were inhibited on MRS-LP and B. infantis 1912 and B. lactis bb12 were
inhibited on MRS-S by plating a broth sample on it. All plates were incubated anaerobically
at 37°C for 48h before enumerating the colony forming units.

225
Figure 7.2 Principle of Encapsulation: Membrane barrier isolates cells from the host immune
system while allowing transport of metabolites and extracellular nutrients (Kailasapathy
2002). Membrane with size selective pores (30-70 kDa). Source: INOTECH Encapsulation.

226
7.4.6 Experiment controls
The leaching of bacterial cell was tested (during the bead hardening and the washing process)
by plating samples of calcium chloride and saline on MRS agar. In addition, cell loss (due to
the encapsulation process) was also studied by enumerating the cell counts of the beads
immediately after the formation and hardening of the bead. The above protocol was
conducted under anaerobic conditions to ensure that the protective effect of encapsulation
was being tested against oxygen. The flasks containing Reconstituted Skim Milk (RSM)
broth were deoxygenated by sparging nitrogen gas in boiling media for 5 min. In this
investigation, during the broth study, deoxygenation was achieved by overnight stirring of
the broth on a magnetic shaker in an anaerobic glove box (95% N2, 5% H2, Coy Products,
U.S.A.). Deoxygenation of the broth was confirmed using a Clark type dip-type micro-
oxygen electrode (MI-730, Microelectrodes, New Hampshire, U.S.A). The deoxygenated
medium was inoculated anaerobically and the flasks were sealed with a rubber stopper to
prevent oxygen entry. Sealed flasks with the probiotic culture were treated in a similar way to
the aerobic flasks.
7.4.7 Determination of bead size
The bead diameter of 100 beads was measured using a stage and ocular micrometer under a
10X objective of a light microscope.

227
7.5 Results and discussion
The results indicated that any difference in the colony counts between the free and
encapsulated cells in the test flasks was due to the presence of oxygen. When tested in RSM
broth at 37°C, all three probiotic strains had significantly higher (p<0.05) encapsulated cell
counts than free cell counts. Counts of encapsulated cells in all the three strains were one log
higher than their free cell counts (Table 16). Loss of bacterial cells was not observed during
the formation of bead, or during hardening and washing. In addition, in all strains the loss of
cells was not detected during the encapsulation process. In the broth experiment, no
significant difference (p>0.05) was observed between free cell counts and encapsulated cell
counts in the control anaerobic flasks. At the end of the study, the pH of RSM broths
(containing free cells and the encapsulated cells) was found to be similar. This indicated that
any difference in the colony counts between the free and encapsulated cells in the test flasks
was due to the presence of oxygen.
When tested in RSM broth at 37°C, it was found that all four probiotic strains had
significantly higher (p<0.05) encapsulated cell counts compared to free cell counts. However,
all four strains (L. casei Lc1, L. rhamnosus DR-20 B. infantis 1912 and B. animalis subsp.
lactis Bb12) demonstrated comparatively higher encapsulated cell counts than their
corresponded free cell counts (Table 7.1).
7.5.1 Aerobic situation (21 % O2)
In aerobic situation, the encapsulated cell count of L. casei Lc1 was found to be higher (6.33
log10
cfu/ml) than its corresponding free cell count of 5.63 log10
cfu/ml. In L. rhamnosus
DR20, the encapsulated cell count was found to be higher (8.13 log10
cfu/ml) than its

228
corresponding free cell count of.36 log10
cfu/ml. Again, the encapsulated cell count of B.
infantis 1912 was found to be higher (8.09 log10
cfu/ml) than its corresponding free cell count
of 7.52 log10
cfu/ml. The encapsulated cell count of B. lactis bb12 DR20 was found to be
higher (6.23 log10
cfu/ml) than its corresponding free cell count of 5.67 log10
cfu/ml.
Table 7.1 Effect of encapsulation on oxygen toxicity of probiotic micro-organisms in RSM
broth.
Encap: encapsulated cell counts
Free: Free cell counts
Flasks were incubated for 24h
Mean of six determinations ± s.d. nSignificant difference (p<0.05) between free cell counts and encapsulated cell counts
Strain
Aerobic incubation Anaerobic incubation
Encap.
log10
cfu/ml
Free
log10
cfu/ml
Encap.
log10
cfu/ml
Free
log10
cfu/ml
L. casei Lc1 6.33 ± 0.3 5.63 ± 0.8 n 9.47 ± 0.5 9.20 ± 0.7 n
L. rhamnosus
DR20 8.13 ± 1.0 7.36 ± 1.3 n 9.54 ± 1.1 9.10 ± 0.8 n
B. infantis 1912 8.09 ± 0.8 7.52 ± 0.9 n 9.93 ± 0.8 870 ± 0.9 n
B. lactis bb12 6.23 ± 0.5 5.67 ± 0.3 n 9.71 ± 0.7 8.93 ± 0.6 n

229
7.5.2 Anaerobic situation
In anaerobic situation, the encapsulated cell count of L. casei Lc1 was found to be higher
(9.47log10
cfu/ml), than its corresponding free cell count of 9.20 log10
cfu/ml. The
encapsulated cell count of L. rhamnosus DR20 was found to be higher (9.54log10
cfu/ml) than
its corresponding free cell count of 9.10log10
cfu/ml. Again, the encapsulated cell count of B.
infantis 1912 was found to be higher (9.93 log10
cfu/ml), than its corresponding free cell
counts of 8.70 log10
cfu/ml, In B. lactis bb12 DR20 the encapsulated cell count was found to
be higher (9.71 log10
cfu/ml) than its corresponding free cell count of 8.93 log10
cfu/ml.
The current study demonstrates that in both aerobic and anaerobic conditions all four
probiotic strains (L. casei Lc1, L. rhamnosus DR20, B. infantis 1912 and B. lactis bb12)
encapsulated cells displayed slightly higher cell counts compared to their corresponding free
cell counts but there was no significant (p<0.05) differences observed between two cell
counts. This indicates that all four probiotic strains are able to protect themselves from the
toxic effects of oxygen and are able to survive with a high survival rate (from 5.63
log10
cfu/ml to 8.70 log10
cfu/ml free cell counts in aerobic condition). This study also
indicates that all four probiotic strains are resistant to oxidative stress and are able to protect
themselves from the toxic oxygen effects.
In addition, the results also indicated that the encapsulation technique was prevented cell
death from oxygen toxicity in probiotic bacteria. It has been reported that alginate restricts
the diffusion of oxygen, preventing cell death from oxygen toxicity through the gel creating
anoxic regions in the centre of the beads (Talwalkar and Kailasapathy 2003; Beunik et al.
1989). Compared to free cells therefore, encapsulated cells would be subjected to either none

230
or much less exposure to oxygen than free cells resulting in less cell death from oxidative
stress or oxygen toxicity. This may translate to the higher cell counts in encapsulated cells.
In this study, the results of broth experiments in which probiotic strains were incubated at
37°C showed a promising outcome for the encapsulation technique. In all cases, the
encapsulated cell counts in probiotic strains were significantly higher than their corresponded
free cell counts. In all cases, the higher number of encapsulated cell counts in probiotic
strains suggests that the encapsulated technique provided a strong protection role in different
environmental conditions.
However, the factors involved in the encapsulation process may play a role in determining
the protective role of microencapsulation from oxygen toxicity. A number of studies on
immobilized systems (Gossmann and Rehm 1986, 1988; Beunik and Rehm 1988) had
concluded with an idea that microbial aggregates could develop anaerobic parts in their
centres, highlighting the importance of cell distribution within the beads. However, the size
of the bead also can affect the distribution of cells characteristics and the smaller the diameter
is the better for the distribution of cells in the interior of the beads (Omar 1993). The average
bead diameters in this experiment were 2.38 mm. The large and variable bead size in this
study could have resulted in different cell distributions within the beads, exposing more cells
to oxygen toxicity. In another study Poonam et al. (2010) reported that microencapsulated L.
fermentum cells showed better acid tolerance, bile tolerance and temperature stability than its
corresponded free cells.
In addition, the results also indicated that all four oxidative resistant strains are able to
survive in toxic oxygen environments in both circumstances (free cells or encapsulated cells).
The overall conditions involved in broth experiments are completely different from the

231
probiotic bacteria which are exposed daily during the shelf life in different probiotic
products. In broth experiments, probiotic strains were incubated at 37°C, but in the
supermarket shelves probiotic strains containing yoghurts are stored at temperatures ranging
between 6-8°C. The current study demonstrated that there was no significant (p<0.05)
difference between the free cell counts and the encapsulated cell counts and the results
suggest that the lower temperature and different environmental factors in dairy products may
play a role in determining the extent of oxygen toxicity.

232
7.6 Conclusions
Both in aerobic and anaerobic conditions previously selected, all four oxidative stress
resistant probiotic strains (L. casei Lc1, L. rhamnosus DR20, B. infantis 1912 and B. lactis
bb12) displayed slightly higher cell viability when microencapsulated, compared to
corresponding free cell counts. So the microencapsulation results also suggestsed that all four
probiotic strains are oxidative stress resistant and those strains are able to protect themselves
from toxic oxygen effects.
This study also demonstrates the protective role of microencapsulation against oxidative
stress or oxygen toxicity of probiotic bacteria in broth medium. However, the current study
was only limited to broth medium. More study is required to explore the role of
microencapsulation in other mediums and other probiotic dairy products. The techniques
involved in the microencapsulation process and the incubation conditions may play a
significant role in deciding the oxygen-alginate-bacteria interaction. The relationship
between the encapsulation material and oxygen may assist the development of new
techniques that will ensure the presence of high numbers of probiotic micro-organisms in
probiotic foods throughout the shelf life.

233
Chapter 8

234
8.1 Overall conclusions
The project was designed in different chapters (chapters 3 to 7) depending on different
experimental needs. Chapter 3 was conducted to screen and select a number of oxygen
tolerant probiotic bacteria. The screening process was delivered using RBGR method
(Talwalker and Kailasapathy, 2003) and finally 4 different Lactobacillus and Bifido bacterial
strains (Lactobacillus casei Lc1, Lactobacillus rhamnosus DR20, Bifidobacterium lactis
Bb12 and Bifidobacterium infantis b1912) were selected as oxygen tolerant strains. The
outcome of this study will ensure the maximum health benefit to the consumer. It is also
beneficial for the dairy industry because it provides them with a quality dairy product with
increased shelf life. These four strains were used for the following investigations as described
in Chapters 4 to 7.
The determination of proteome responses of Lactobacillus casei Lc1 and Lactobacillus
rhamnosus DR20 was investigated under oxidative stress (Chapter 4). The study also
differentiated protein expression changes due to oxidative stress and identified the
differentially expressed proteins. This was the first time where a proteomic approach was
involved to identify the expression of proteins that are responsible for the protective role
during oxidative stress in probiotic bacteria. After the investigation a number of differentially
expressed proteins were identified as those are responsible for the protective role during
oxidative stress in probiotic bacteria.The laser scanning confocal microscopy (LSCM) results
showed that the number of viable oxygen-sensitive cells was comparatively fewer than the
oxidative stress resistant cells. After the completion of oxygen treatments on both strains,
two-dimensional gel electrophoresis analysis exhibited three proteins with differential
expression by 3-fold or more and 118 proteins by 2-fold or more for L. casei Lc1. Four

235
differentially expressed proteins were identified by MALDI MS-MS analysis. Treated L.
rhamnosus DR20 exhibited no apparent stress-related proteins.
Chapter 5 was very similar to Chapter 4, where the determination of proteome responses was
investigated under oxidative stress using different strains of Bifido bacteria. In this study,
four different strains of bifidobacteria were investigated with a series of screening process
and finally concluded with one promising strain of bifidobacteria which was Bifidobacterium
(B) infantis 1912 selected as an oxygen resistant strain with the ability to survive in an
aerobic (21% oxygen) environment. This study investigated four different strains of
bifidobacteria with a series of screening process and finally concluded with one promising
strain of bifidobacteria which was Bifidobacterium (B) infantis 1912 selected as an oxygen
resistant strain with the ability to survive in an aerobic (21% oxygen) environment. A
number of differentially expressed proteins were discovered that are believed to be
responsible for the protective role during oxidative stress in probiotic bacteria. The image
analysis data revealed that 1 protein up regulated more than 13 fold, another one up regulated
more than 5 fold, 7 proteins were up-regulated more than 2-fold and 12 proteins were found
as down-regulated in this strain. However all 21 proteins were identified by the combination
of 2-DE and MALDI MS-MS analysis. This study is expected to be the first published report
that has identified and described proteins from B. infantis 1912 related to oxidative stress.
This part of the study (Chapter 6) investigated the physiological properties (micro-organism
growth, acid and bile tolerance, hydrophobicity, auto aggregation and coaggregation) of four
probiotic bacterial strains under oxidative stress. At first, a total of eleven probiotic strains
were screened to select oxygen tolerant strains and finally four strains (L. casei Lc1, L.
rhamnosus DR-20 B. infantis 1912 and B. animalis subsp. lactis Bb12) were selected as

236
oxygen tolerant strains. Those 4 strains were further investigated for their response to
different probiotic physiological characteristics stated earlier. All four Lactobacillus and
Bifidobacterium strains in both anaerobic and aerobic conditions displayed a survival rate
higher than 105cfu/ml in both different pH and bile concentrations indicating that they are
able to protect themselves from acid and bile as well as from toxic oxygen effects. However,
in aerobic condition, all four strains demonstrated a slightly lower survival rate in various
concentrations of acid and bile salts compared to anaerobic condition and indicated that they
able to protect themselves from acid and bile salts as well as toxic oxygen effects. However,
in both anaerobic and aerobic conditions, out of four strains L. rhamnosus DR-20 and B.
animalis subsp. lactis Bb12 displayed higher hydrophobicity (55-60%) compared to the other
two strains (36 to 41%). But all four strains also displayed slightly higher hydrophobicity in
anaerobic conditions compared to corresponding strains in aerobic conditions.
During the autoaggregation study, all strains showed a medium level of auto aggregation
(20% to 70 %) with the exception of B. animalis subsp. lactis Bb12, which showed a lower
level of auto aggregation (˂20%). In all cases the coaggregation in anaerobic condition was
slightly higher (maximum 9%) than its corresponding aerobic condition. In all cases, all four
probiotic strains acted as oxidative resistant strains and they are able to protect themselves
from toxic oxygen effects. At the same time they also demonstrated higher growth and
viability in different characterization experiments such as acid and bile tolerance,
hydrophobicity, auto aggregation and coaggregation.
In Chapter 7, microencapsulation technology was used to investigate its protective role
against oxidative stress in four probiotic bacterial strains (L. casei Lc1, L. rhamnosus DR20,
B. infantis 1912 and B. lactis bb12). Encapsulated cells were counted for each bacterial strain

237
and it was found that in all cases the encapsulated cell count was slightly higher than for its
corresponding free cell count. There were no significant (p<0.05) differences observed
between two cell counts indicating that all four probiotic strains are able to protect
themselves from the toxic effects of oxygen and have a high survival rate (from 5.63
log10
cfu/ml to 8.70 log10
cfu/ml free cell counts in aerobic condition). All four probiotic
strains were found to be oxidative resistant strains as expected because those strains were
previously selected as oxidative resistant strains. This study also demonstrates the protective
role of microencapsulation for probiotic bacteria against oxidative stress when cells were
allowed to grow in aerobic conditions.
8.2 Future directions
There is a potential for the probiotic bacteria in the dairy industry but very little is known
about the molecular mechanisms underlying the probiotic traits. Whilst various stress
responses are closely related in several Gram positive bacteria, little is known about the
possible overlap of stress defence mechanisms and the probiotic nature of bacteria. This
study selected and used four oxidative resistant (L. casei Lc1, L. rhamnosus DR20, B.
infantis 1912 and B. lactis bb12) probiotic strains. The study has identified a number of
oxidative stress resistant proteins that are responsible for the survival of probiotic bacteria in
aerobic environment. For future study, these results need to be explored by using more
species of probitic bacteria and then more oxidative stress resistant strains would available
for the dairy industry and other probitic dependent industries. The proteomic methods
developed and applied in this research proved their strength in visualizing, detecting and
identifying the proteins of interest. Proteomics is a rapidly developing area of research and
new technologies are being developed and validated. The combination of proteomics and

238
other ‗-omics‘ data, such as genomics, transcriptomics, metabolomics, and bioinformatics,
will lead to a more complete understanding of the biology of systems at the molecular level.
In addition, comparative functional genomic studies of phylogenically unrelated lactobacilli
and bifidobacteria may reveal whether there is a set of specific ‗oxidative resistant factors‘,
shared between virtually all probiotic bacteria.

239
References Abee, T., Krockel, L. and Hill, C. (1995). Bacteriocins: modes of action and potentials in
food preservation and control of food poisoning. International Journal of Food Microbiology
28, 169–185.
Aebersold, R. and Mann, M. (2003). Mass spectrometry-based proteomics. Nature 422, 198-
207.
Adams, M. R. and Moss, M. O. (2008) Food Microbiology, Cambridge, UK, The Royal
Society of Chemistry.
Adlerberth, I., Ahrne, S., Johansson, M.-L., Molin, G., Hanson, L.A., Wold, A.E., 1996. A
mannose specific adherence mechanism in Lactobacillus plantarum conferring binding to the
human colonic cell line HT-29. Appl. Environ. Microbiol. 62, 2244–2251.
Ahn, J. B., Hwang, H. J. and Park, J. H. (2001). Physiological responses of oxygen tolerant
anaerobic Bifidobacterium longum under oxygen. Journal of Microbiology and
Biotechhnology 11, 443-451.
Alakomi, H.-L., Skytta, E., Saarela, M., Mattila-Sandholm, T., Latva-Kala, K. and Helander,
I. M. (2000) Lactic acid permeabilizes Gramnegative bacteria by disrupting the outer
membrane. Applied and Environmental Microbiology 66, 2001–2005.
Anal, A. K. and Singh, H. (2007). Recent advances in Microencapsulation of probiotics for
industrial applications and targeted delivery, Trends in Food Science and Technology 18,
240-251.
Annan, N. T., Borza, A. D. and Truelstrup Hansen, L. 2007. Encapsulation in alginate-
coated gelatin microspheres improves survival of the probiotic Bifidobacterium adolescentis
15703T during exposure to simulated gastro-intestinal conditions. Food Research
International 41, 184-193.
Anonymous. 1999. Yoghurt for inner balance. Choice 9, 14–6.

240
Arunachalam, K., Gill, H. S. and Chandra, R. X. (2000) Enhancement of natural immune
function by dietary consumption of Bifidobacterium lactis (HN019). Eur J Clin Nutr 54,
263–267.
Auty, M. A. E., Gardiner, G. E., McBrearty, E. O., O‘Sullivan, E. O., Mulvihill, D. M.,
Collins, J. K., Fitzgerald, G. F., Stanton, C. and Rossi, R. P. (2001). Direct In Situ Viability
Assessment of Bacteria in Probiotic Dairy Products Using Viability Staining in Conjunction
with Confocal Scanning Laser Microscopy. Applied and Environmental Microbiology 67,
420–425.
Axelsson, L. (2004). Lactic Acid Bacteria: Classification and Physiology. In Salminen, S.,
Von Wright A., (Eds.), Lactic Acid Bacteria (pp. 1-66). New York, USA: Marcel Dekker Inc.
Bamforth, C. W. (2005) Food, Fermentation and Micro-organisms, Oxford, UK, Blackwell
Science Ltd.
Barbaros O, Hu¨ seyin Avni Kirmaci, Ebru S¸ enel, Metin Atamer, Adnan Hayalog˘lu.
(2009). Improving the viability of Bifidobacterium bifidum BB-12 and Lactobacillus
acidophilus LA-5 in white-brined cheese by microencapsulation. International Dairy Journal
19, 22–29.
Beachey, E. H. (1981). Bacterial adherence: Adhesin-receptor interactions mediating the
attachment of bacteria to mucosal surfaces. J. Infect. Dis. 143, 325–345.
Behr, J., Israel, L., Ganzle, M. G., Vogel, R. F., (2007). Proteomic approach for
characterization of hop-Inducible proteins in Lactobacillus brevis. Applied Environmental
Microbiology 73, 3300–3306.
Benno, Y., Sawada, K., Mitsuoka, T. (1984). The intestinal microflora of infants:
Composition of fecal flora in breastfed and bottle-fed infants. Microbiology and Immunology
28, 975–986.

241
Bergey, David H. Bergey's Manual of Determinative Bacteriology. 1st ed. 1923; 2nd a. 1925;
3rd ed. 1930; 4th ed. 1934; 5th ed. 1939; 6th ed. 1948. The Williams and Wilkins Go.,
Baltimore.
Berlett, B.S. and Stadtman, E.R. (1997). Protein oxidation in aging, disease and oxidative
stress. J. Biol. Chem. 272, 20313-20316.
Bernet, M.-F., Brassart, D., Neeser, J. R., Servin, A. L., (1993). Adhesion of human
bifidobacterial strains to cultured human itestinal epithelial cells and inhibition of
enteropathogen–cell interactions. Appl. Environ. Microbiol. 59, 4121–4128.
Bernet, M. F., Brassart, D., Neeser, J.-R., Servin, A. L. (1994). Lactobacillus acidophilus
LA-1 binds to cultured human intestinal cell lines and inhibits cell-attachment and cell-
invasion by enterovirulent bacteria. Gut 35, 483–489.
Beunik, J., Baumgartl H., Zimelka W. and Rehm H. J. (1989). Determination of oxygen
gradients in single Ca-alginate beads by means of oxygen microelectrodes. Experientia 45
1041-1047.
Boh, B (2007) Developements et applications industrielles des microcapsules. In:
Vandamme, Thierry F. (ed.). Microencapsulation: des sciences aux technologies. Paris:
Lavoisier, pp. 9–22.
Bolotin, A., Mauger, S., Malarme, K., Ehrlich, S. D. and Sorokin, A. (1999). Low-
redundancy sequencing of the entire Lactococcus lactis IL1403 genome. Antonie Van
Leeuwenhoek 76, 27–76.
Borruel, N., M. Carol, F. Casellas, M. Antolin, F. de Lara, E. Espin, J. Naval, Guarner, F. and
Malagelada, J. R. (2002). Increased mucosal tumour necrosis factor alpha production in
Crohn‘s disease can be downregulated ex vivo by probiotic bacteria. Gut 51, 659–664.
Bolduc, M. P., Raymond, Y., Fustier, P. (2006). Sensitivity of bifidobacteria to oxygen and
redox potential in non-fermented pasteurized milk. Int Dairy J. 16, 1038–1048.

242
Boylston, T. D., Celso G. Vinderola, Hamid, B. Ghoddusic, Jorge, A. Reinheimer, (2004).
Incorporation of bifidobacteria into cheeses: challenges and rewards. International Dairy
Journal 14, 375–387.
Brandt, K, Tilsala-Timisjarvi, A and Alatossava, T (2001). Phage-related DNA
polymorphism in dairy and probiotic Lactobacillus.
Micron. 32, 59-65.
Bradford M. M. (1976). A rapid and sensitive method for the quantification of microgram
quantities of protein utilizing the principle of dye-binding. Analytical Biochemistry 72 248-
254.
Brunner, J. C., Spillman, H. and Puhan, Z. (1993). Metabolism and survival of bifidobacteria
fermented milk during cold storage. Milchwirtschaftliche-Forschung 22, 19-25.
Bruno-Barcena, J. M., Andrus, J. M., Libby, S. L., Klaenhammer, T. R., Hassan, H. M.,
(2004). Expression of a heterologous manganese superoxide dismutase gene in intestinal
lactobacilli provides protection against hydrogen peroxide toxicity. Applied and
Environmental Microbiology 70, 4702–10.
Buchanan, R. E. and Gibbons N. E. (eds), (1974). Bergey's Manual of Determinative
Bacteriology, eighth edition, The Williams & Wilkins Co, Baltimore.
Bujalance, C., Moreno, E., Jimenez-Valera, M., Ruiz-Bravo, A., (2007). A probiotic strain of
Lactobacillus plantarum stimulates lymphocyte responses in immunologically intact and
immunocompromised mice. International Journal of Food Microbiology 113, 28-34.
Cabiscol, E. Tamarit, J. Ros, J. (2000) Oxidative stress in bacteria and protein damage by
reactive oxygen species. International Microbiology. 3, 3-8.
Camilleri, M.(2006). Probiotics and irritable bowel syndrome: Rationale, putative
mechanisms, and evidence of clinical efficacy. J. Clin. Gastroenterol. 40, 264–269.

243
Castagliuolo, I., Galeazzi, F., Ferrari, S., Elli, M., Brun, P., Cavaggioni, A., Tormen, D.,
Sturniolo, G.C., Morelli, L., Palu, G., (2005). Beneficial effect of auto-aggregating
Lactobacillus crispatus on experimentally induced colitis in mice. FEMS Immunology and
Medical Microbiology 43, 197-204.
Cesena, C., Morelli, L., Alander, M., Siljander, T., Tuomola, E., Salminen, S., Mattila-
Sandholm, T., Vilpponen-Salmela, T. and von Wright, A. (2001) Lactobacillus crispatus and
its no aggregating mutant in human colonization trials. J. Dairy Sci. 84, 1001–1010.
Champomier-Verges, M. C., Maguin, E., Mistou, M. Y., Anglade, P., Chich, J. F., (2001).
Lactic acid bacteria and proteomics: Current knowledge and perspectives. Journal of
Chromatography B Analytical Technol Biomed Life Science 771, 329–342.
Chou, L.S., Weimer, B., (1999). Isolation and characterization of acid- and bile-tolerant
isolates from strains of Lactobacillus acidophilus. Journal of Dairy Science 82,23-31.
Cheng, R. and Sandine, W. E. (1989). Growth characteristics of bifidobacteria species in
whey base medium. Journal of Dairy Science 72 (Suppl. 1), 148 (Abstr.).
Chiang, B. L., Sheih, Y. H., Wang, L. H., Liao, C. K. and Gill, H. S. (2000). Enhancing
immunity by dietary consumption of a probiotic. lactic acid bacterium (Bifidobacterium
lactis HN019): optimization and definition of cellular immune responses. Eur J Clin Nutr 54,
849–855.
Chouraqui, J. P., Van Egroo, L. D. and Fichot, M. C. (2004). Acidified milk formula
supplemented with Bifidobacterium lactis: impact on infant diarrhea in residential care
settings. J Pediatr Gastroenterol Nutr 38, 288–292.
Collado, M. C., Gueimonde M., Hernandez M., Sanz Y., and Salminen S (2005). Adhesion
of selected Bifidobacterium strains to human intestinal mucus and the role of adhesion in
enteropathogen exclusion. J. Food Prot. 68, 2672–2678.

244
Collado, M. C., Meriluoto, J. and Salminen, S. (2007). Development of New Probiotics by
Strain Combinations: Is It Possible to Improve the Adhesion to Intestinal Mucus? J. Dairy
Sci. 90, 2710–2716.
Cesena, C., Morelli , L., Alander, M., Siljander, T., Tuomola, E., Salminen, S., Mattila-
Sandholm, T., Vilpponen-Salmela T., and Von Wright A. (2001). Lactobacillus crispatus and
its nonaggregating mutant in human colonization trials. J. Dairy Sci. 84, 1001–1010.
Chen, M. J., Chen, K. N. and Kuo, Y. T. (2007) Optimal thermotolerance of Bifidobacterium
bifidum in gellan-alginate microparticles. Biotechnol. Bioeng. 98, 411-419.
Chandan, R. (2006) Manufacturing yogurt and fermented milks, Iowa, Blackwell Publishing.
Chick, J. M., Haynes, P.A., Molloy, M. P., Bjellqvist, B., Baker, M. S., Len, A. C. (2008).
Characterization of the rat liver membrane proteome using peptide immobilized pH gradient
isoelectric focusing. Journal of Proteome Research 7, 1036-45.
Cohen, D. P. A., Vaughan, E. E., de vos, W. M. & Zoetendal, E. G. (2008) Proteomic
Approaches to Lactic Acid Bacteria. IN VERSALOVIC, J. & WILSON, M. (Eds.)
Therapeutic Microbiology: Probiotics and Related Strategies. Washington, DC, ASM Press.
Condon, S. (1987). Responses of lactic acid bacteria to oxygen, FEMS Microbiol. Rev. 46,
269–280.
Czapski, G. (1984). Reaction of OH. Methods Enzymol. 105, 209-215.
Dali, C. and Davis, R. (1998). The biotechnology of lactic acid bacteria with emphasis on
application in food safety and human health. Agric. Food Sci. Finland 7 219-250.
Davis, J. G., Ashton, T. R. and McCaskill, M. (1971). Enumeration and viability of
Lactobacillus bulgaricus and Streptococcus thermophilus in yoghurt. Dairy Industries 36,
569-573.

245
Dave, R. I., and Shah, N. P. (1997a). Effectiveness of ascorbic acid as an oxygen scavenger
in improving viability of probiotic bacteria in yoghurts made with commercial starter
cultures. International Dairy Journal 7, 435–443.
Dave, R. I., and Shah, N. P. (1997b). Viability of yoghurt and probiotic bacteria in yoghurts
made from commercial starter cultures. International Dairy Journal 7, 31–41.
Dave, R. I. and Shah, N. P (1998). Ingredient supplementation effects on viability of
probiotic bacteria in yoghurt. Journal of Dairy Science 81, 2804-2816.
Davis, J. G., Ashton, T. R. and McCaskill, M. (1971).Enumeration and viability of
Lactobacillus bulgaricus and Streptococcus thermophilus in yoghurt. Dairy Industries 36,
569-573.
De Angelis, M. and Gobbetti, M. (1999). Lactobacillus sanfranciscensis CB1: manganese,
oxygen, superoxide dismutase and metabolism. Applied Microbiology and Biotechnology.
51, 358–363.
De Angelis, M. and Gobbetti, M. (2004). Environmental stress responses in Lactobacillus: a
review. Proteomics 4, 106-122.
De Hoffman, E. and Stoobant, V. (2007) Mass Spectrometry Principles and Applications,
West Sussex, England, John Wiley and Sons.
De Vries, W., and Stouthamer, A. H. (1969). Factors determining the degree of anaerobiosis
of Bifidobacterium strains. Archives Mikrobiologie 65, 275–287.
Del Re, B, Sgorbati, B, Miglioli, M, Palenzona, D. (2000) Adhesion, autoaggregation and
hydrophobicity of 13 strains of Bifidobacterium longum. Lett Appl Microbiol 31, 438–442.
Del Re, B., Busetto, A., Vignola, G., Sgorbati, B., Palenzona, D.L., (1998). Autoaggregation
and adhesion ability in a Bifidobacterium suis strain. Letters in Applied Microbiology 27,
307-310.

246
Ding, W. K. and Shah, N. P. (2007) Acid, Bile, and Heat Tolerance of Free and
Microencapsulated Probiotic Bacteria. Journal of Food Science. 72, M446-M450
Douglass, A. D., Vale, R. D. (2005). Single-molecule microscopy reveals plasma membrane
microdomains created by protein-protein networks that exclude or trap signaling molecules
in T cells. Cell 121, 937–950.
Doleyres, Y., Fliss, I., and Lacroix, C. (2005). Increased stress tolerance of Bifidobacterium
longum and Lactococcus lactis produced during continuous mixed-s train immobilized-cell
fermentation. Journal of Applied Microbiology, 97, 527–539.
Doleyres, Y. and Lacroix, C. (2006). Technologies with free and immobilised cells for
probiotic bifidobacteria production and protection. International Dairy Journal 15, 973–988.
Drago, L., Gismondo, M.R., Lombardi, A., de Haen, C., Gozzini, L. (1997). Inhibition of in
vitro growth of enteropathogens by new Lactobacillus isolates of human intestinal origin.
FEMS Microbiology Letters 153, 455-463.
Duwat, P. (1999). Stress response pathways in Lactococcus lactis. Recent Res. Devel.
Microbiol. 3, 335-348.
Duwat, P., Ehrlich, S.D. and Gruss, A. (1995). The recA gene of Lactococcus lactis:
characterization and involvement in oxidative and thermal stress. Mol. Microbiol. 17, 1121-
1131.
Duwat, P., Cesselin, B., Sourice, S. and Gruss, A. (2000). Lactococcus lactis, a bacterial
model for stress responses and survival. Int. J. Food Microbiol. 55, 83-86.
Elo, S., Saxelin, M. and Salminen, S. (1991) Attachment of Lactobacillus casei strain G G to
human colon carcinoma cell line Caco-2: comparison with other dairy strains. Lett. Appl.
Microbiol. 13, 154–156.
Farr, S. B, Kogoma, T. (1991). Oxidative stress responses in Escherichia coli and Salmonella
typhimurium. Microbiol Rev 55, 561–585.

247
FAO/WHO (2001). Evaluation of health and nutritional properties of probiotics in food,
including powder milk with live lactic acid bacteria. Food and Agricultural Organization of
United Nations and World Health Organization Expert Consultation
Report. http://ftp.fao.org/es/esn/food/probio_report_ en.pdf.
Fedoroff, N. (2006). Redox regulatory mechanisms in cellular stress responses. Ann Bot
(Lond) 98, 289-300.
Fenn, J. B., Mann, M., Meng, C. K., Wong, S.F., Whitehouse, C. M. (1989). Electrospray
ionization for mass spectrometry of large biomolecules. Science 246, 64-71.
Finch, C. A. (1993). Industrial microencapsulation: polymers for microcapsule walls. In
Karsa. D.R. Stephension R. A. eds. Microencapsulation and controlled release.The Royal
Society of Chemistry, Cambridge. 1-12.
Finn, G. J. and Condon, S. (1975) Regulation of catalase synthesis in Salmonella
typhimurium. Journal of Bacteriology 123, 570-9.
Finegold, S. M., Sutter V. L., Sugihara P. T., Elder, H. A., Lehmann, S. M., Phillips S., R. L.
(1977). Fecal microbial flora in seventh day adventist populations and control subjects. The
American Journal of Clinical Nutrition, 30, 1781–1792.
Fridovich, I. (1975). Superoxide dismutases. Annual review of biochemistry 44, 147-159.
Freeman, W. M. and Hemby, S. E. (2004) Proteomics for protein expression profiling in
Neuroscience. Neurochemical Research 29, 1065-1081.
Fontaine, E.A., Claydon, E. and Taylor-Robinson, D. (1996) Lactobacilli from women with
or without bacterial vaginosis and observations on the significance of hydrogen peroxide.
Microbial Ecology in Health and Disease 9, 135–141.
Furrie, E (2005) Probiotics and allergy. Proceedings of the Nutrition Society 64, 465–469.
Fuller, R. (1989) Probiotics in man and animals. J Appl Bacteriol 66, 365–78.

248
Garbis, S., Libec, G., Fountoulakis, M. (2005). Limitations of current proteomics
technologies. Journal of Chromatography A. 1077, 1-18.
Gardiner GE, O‘Sullivan E, Kelly J, Auty MA, Fitzgerald GF, Collins JK, Ross RP, Stanton
C. 2000. Comparative survival rates of human derived probiotic Lactobacillus paracasei and
L. salivarius strains during heat treatment and spray drying. Appl Environ Microbiol 66,
2605–12.
Garriga, M., Pascual, M., Monfort, J. M., Hugas, M. (1998). Selection of lactobacilli for
chicken probiotic adjuncts. Journal of Applied Microbiology 84, 125-132.
Garrigues, C., Loubiere, P., Lindley, N.D. and Cocaign-Bousquet, M. (1997). Control of the
shift from homolactic acid to mixed-acid fermentation in Lactococcus lactis: predominant
role of the NADH/NAD+ ratio. J. Bacteriol. 179, 5282-5287.
Gazzi, p. (2005) Oxidoreduction of protein thiols in redox regulation. Biochem. Soc. Trans.
33, 1378–1381.
Gibson, G. R., Roberfroid, M. B. (1995). Dietary modulation of the human colonic
microbiota: introducing the concept of prebiotics. Journal of Nutrition 125, 1401-1412.
Gibbs, B. F., Kermasha, S., Alli, I. and Mulligan, C. (1999) Encapsulation in the food
industry: a review. International Journal of Food Science and Nutrition 50, 213-224.
Goderska, K., Zybals, M., & Czarnecki, Z. (2003). Characterization of microcapsulated
Lactobacillus rhamnosus LR7 strain. Polish Journal of Food and Nutrition, 12, 237–238.
Gorg A, Weiss, W., Dunn, M. J. (2004). Current two dimensional electrophoresis technology
for proteomics. Proteomics 4, 3665-85.
Gill, H. S. Rutherfurd, K. J. Prasad J. and Gopal P. K. (2000). Enhancement of natural and
acquired immunity by Lactobacillus rhamnosus (HN001), Lactobacillus acidophilus
(HN017) and Bifidobacterium lactis (HN019). Br. J. Nutr. 83, 167–176.

249
Gill, H. S., and Guarner, F. (2004). Probiotics and human health: a clinical perspective.
Postgrad. Med. J. 80, 516-526.
Goldin, B. R., Gorbach, S. L., (1992). Probiotics for humans. In: Fuller, R., (ed.), Probiotics:
The scientific basis, Chapman and Hall, London, pp. 355-376.
Gotteland M., Brunser O. and Cruchet S. (2006). Systematic review: Are probiotics useful in
controlling gastric colonization by Helicobacter pylori? Aliment. Pharmacol. Ther. 23, 1077–
1086.
Gosmann B. and Rehm, H. J. (1986). Oxygen uptake of microorganisms entrapped in Ca-
alginate. Applied Microbiology and Biotechnology 23, 163-167.
Gomes, A. M. P. and Malcata, F. X. (1999). Bifidobacterium spp. and Lactobacillus
acidophilus: biochemical, technological and therapeutical properties relevant for use as
probiotics. Trends in Food Science and Technology 10, 139-157.
Gopal, P. K., Prasad, J., Smart, J., Gill, H. S., (2001). In vitro adherence properties of
Lactobacillus rhamnosus DR20 and Bifidobacterium lactis DR10 strains and their
antagonistic activity against an enterotoxigenic Escherichia coli. International Journal of
Food Microbiology 67, 207-216.
Gionchetti, P., Rizzello, F., Helwig, U., Venturi, A., Lammers, K. M., Brigidi, P., Vitali, B.,
Poggioli, G., Miglioli, M. and Campieri, M. (2003) Prophylaxis of pouchitis onset with
probiotic therapy: a double-blind, placebo-controlled trial. Gastroenterology 124, 1202–
1209.
Gionchetti, P., Lammers, K. M., Rizzello, F. and Campieri. M. (2005). VSL#3: An analysis
of basic and clinical contributions in probiotic therapeutics. Gastroenterol. Clin. North Am.
34, 499–513.
Goktepe, I., Juneja, V. K. and Ahmedna, M., (2006). Probiotics in food safety and human
health. Boca Raton, FL: Taylor and Francis group.

250
Gregory, J. F. (2008). Vitamins. In: S. Damodaran, K. L. Parkin, & O. R. Fennema,
Fennema’s food chemistry (pp. 439-521). Boca Raton: CRC Press/Taylor & Francis.
Guarner, F. and Schaafsma, G. J. (1998). Probiotics. Int. J Food Microbiol. 39, 337-338.
Gastrointestinal Physiology, CV Mosby., St. Louis, pp. 62-69.
Guarner, F. and Malagelada, J. R. (2003). Gut flora in health and disease. Lancet 361, 512–
519.
Harley, J. B., Santangelo, G. M., Rasmussen, H. and Goldfine, H. (1978). Dependence of
Escherichia coli hyperbaric oxygen toxicity on the lipid acyl chain composition. J. Bacteriol.
134, 808-820.
Humpries, K. M., Sweda, L. I. (1998). Selective inactivation of α-ketoglutarate
dehydrogenase: reaction of lipoic acid with 4-hydroxy-2-nonenal. Biochemistry 37, 15835–
15841.
Hoier, E. (1992). Use of probiotic starter cultures in dairy products. Food Australia, 44, 418–
420.
Hormann, S., Scheyhing, C., Behr, J., Pavlovic, M., Ehrmann, M., Vogel, R. F. (2006).
Comparative proteome approach to characterize the high-pressure stress response of
Lactobacillus sanfranciscensis DSM 20451(T). Proteomics. 6 , 1878-85.
Holzapfel, W. H., Haberer, P., Snel, J., Schillinger, U., Huis in't Veld, J. H., (1998).
Overview of gut flora and probiotics. International Journal of Food Microbiology 41, 85-
101.
Holt, J. G., Krieg, N. R., Sneath, P. H. A., Staley, J. T. and Williams, S.T. (1994). Gram-
positive cocci. In: Bergey’s Manual of Determinative Microbiology (Holt, J.G., ed.).
Williams & Wilkins, Baltimore, MD, USA, pp. 527-558.
251
Hussain, M. A., Knight, M. I., Britz, M. L., (2009). Proteomic analysis of lactose-starved
Lactobacillus casei during stationary growth phase. Journal of Applied Microbiology 106,
764-773.
Imlay, J. A. and Fridovich, I. (1991). Assay of metabolic superoxide production in
Escherichia coli. J. Biol. Chem. 266, 6957-6965.
Iwana, H., Masuda, H., Fujisawa, T., Suzuki, H. and Mitsuoka, T. (1993). Isolation and
identification of Bifidobacterium spp. in commercial yoghurts sold in Europe. Bifidobacteria
Microflora 12, 39-45.
Ishibashi, N. and Shimamura, S. (1993). "Bifidobacteria: research and development in Japan"
Food Technology, 47, 126 - 134.
James, P, Quadroni, M, Carafoli, E, Gonnet, G. (1993). Protein identification by mass
profilefingerprinting. Biochem Biophys Res Commun 195, 58-64.
Jayamanne, V. S. and Adams, M. R. (2006). Determination of survival, identity and stress
resistance of probiotic bifidobacteria in bio-yoghurts. The Society for Applied Microbiology,
Letters in Applied Microbiology 42, 189–194.
Jacobsen, C.N., Rosenfeldt Nielsen, V., Hayford, A.E., Moller, P.L., Michaelsen, K.F.,
Paerregaard, A., Sandstrom, B., Tvede, M., Jakobsen, M., (1999). Screening of probiotic
activities of forty-seven strains of Lactobacillus spp. by in vitro techniques and evaluation of
the colonization ability of five selected strains in humans. Applied and Environmental
Microbiology 65, 4949-4956.
Jankovic, I., Ventura, M., Meylan, V., Rouvet, M., Elli, M., Zink, R., (2003). Contribution of
aggregation-promoting factor to maintenance of cell shape in Lactobacillus gasseri 4B2.
Journal of Bacteriology 185, 3288-3296.
Johnson, L.R., (1977). Regulation of gastric secretion. In: Johnson, L.R., (ed.),

252
Joss, J. L., Molloy, M. P., Hinds, L.A., Deane, E. M., (2006). Evaluation of chemical
derivatisation methods for protein identification using MALDI MS/MS. International
Journal of Peptide Research. 12, 225–235.
Kajander, K., Hatakka K., Poussa T., Farkkila M. and Korpela R. (2005). A probiotic mixture
alleviates symptoms in irritable bowel syndrome patients: A controlled 6-month intervention.
Aliment. Pharmacol. Ther. 22, 387–394.
Kailasapathy, K. and Rybka, S. (1997). L. acidophilus and Bifidobacterium spp. their
therapeutic potential and survival in yoghurt. Aust. J. Dairy Technol. 52, 28-35.
Kailasapathy, K. and Chin, J. (2000).Survival and therapeutic potential of probiotic
organisms with reference to Lactobacillus acidophilus and Bifidobacterium spp.
Immunology and Cell Biology. 78, 80-88.
Kailasapathy, K. (2002) Microencapsulation of Probiotic Bacteria: Technology and Potential.
Applications Curr. Issues Intest. Microbiol. 3, 39-48.
Kailasapathy, K. and Masondole, L. (2005). Survival of free and microencapsulated
Lactobacillus acidophilus and Bifidobacterium lactis and their effect on texture of feta
cheese. Australian Journal of Dairy Technology 60, 252-258.
Kailasapathy, K., Harmstorf, I. and Phillips, M. (2008) Survival of Lactobacillus acidophilus
and Bifidobacterium animalis ssp. lactis in stirred fruit yoghurts. LWT - Food Science and
Technology, 41, 1317-1322.
Karas, M and Hillenkamp, F. (1988). Laser desorption ionization of proteins with molecular
masses exceeding 10000 daltons. Anal Chem 60, 2299-301.
Karlsson, KE and Novotny, M. (1988). Separation efficiency of slurry-packed liquid
chromatography microcolumns with very small inner diameters. Anal Chem 60, 1662-5.

253
Kawasaki, S., Mimura T., Satoh, T., Takeda, K., and Niimura, Y. (2006). Response of the
microaerophilic bifidobacterium species, B. boum and B. thermophilum, to oxygen.
Environmental Microbiology, p 6854-6858.
Kos, B., Suskovic, J., Vukovic, S., Simpraga, M., Frece, J., Matosic, S., (2003). Adhesion
and aggregation ability of probiotic strain Lactobacillus acidophilus M92. Journal of Applied
Microbiology 94, 981-987.
Kandler, O. and Weiss, N. (1986). Genus Lactobacillus, pp. 1063-1065. In, P. H. A. Sneath,
N. S. Mair, M. E. Sharpe, and J. G. Holt (eds.), Bergey's Manual of Systematic Bacteriology,
vol 2, 9th ed. Williams and Wilkins, Baltimore.
Kepner, R. J. and Pratt, J. R. (1994) Use of fluorochromes for direct enumeration of total
bacteria in environmental samples: past and present. Microbiol. Rev. 58, 603–615.
Koch, S., G. Oberson, E. EugsterMeier, L. Meile, and C. Lacroix. (2007) Osmotic stress
induced by salt increases cell yield, autolytic activity, and survival of lyophilization of
Lactobacillus delbrüeckii subsp. lactis. Int J Food Microbiol 117, 3642.
Kikuchi, H. E. and Suzuki, T. (1986). Quantitative method for the measurement of
aerotolerance of bacteria and its application to oral indigeneous anaerobes. Applied and
Environmental Microbiology 52, 971-973.
Kim, H. J., M. I. Vazquez Roque, M. Camilleri, D. Stephens, D. D. Burton, K. Baxter, G.
Thomforde, and A. R. Zinsmeister.(2005). A randomized controlled trial of a probiotic
combination VSL#3 and placebo in irritable bowel syndrome with bloating.
Neurogastroenterol.Motil. 17, 687–696.
Kim, S. J., Cho, S. Y., Kim, S. H., Song, O. J., Shin, I. S., Cha, D. S. & Park, H. J. (2008)
Effect of microencapsulation on viability and other characteristics in Lactobacillus
acidophilus ATCC 43121. LWT, 41, 493-500.

254
Khan, A., Grinyer J., Truong, S. T., Breen, E. J., Packer, N. H., (2005). New urinary EPO
drug testing method using two-dimensional gel electrophoresis. International Journal of
Clinical Chemistry 358, 119-130.
Khan, A., Packer, N. H., (2006). Simple urinary sample preparation for proteomics analysis.
Journal of Proteome Research 5, 2824-2838.
Khan, A., Williams, K. L., Soon, J., Nevalainen, H., (2008). Proteomic analysis of the knob-
producing nematode trapping fungus Monacrosporium lysipagum. Mycological Research
112, 1447-1452.
Koistinen, K. M., Plumed-Ferrer, C., Lehesranta, S. J., Karenlampi, S.O., Von Wright, A.,
2007. Comparison of growth-phase-dependent cytosolic proteomes of two Lactobacillus
plantarum strains used in food and feed fermentations. FEMS Microbiology Letters. 273, 12-
21.
Krasaekoopt, W., Bhandari, B. and Deeth, H. (2003). Evaluation of encapsulation techniques
of probiotics for yoghurt. International Dairy Journal 13, 3–13.
Klaenhammer T., E. Altermann E., Arigoni F., Bolotin A., Breidt F., Broadbent J., Cano R.,
S. Chaillou S., J. Deutscher J., Gasson M., M. van de Guchte, J. Guzzo, A. Hartke, T.
Hawkins, P. Hols, R. Hutkins, M. Kleerebezem, J. Kok, O. Kuipers, M. Lubbers, E. Maguin,
L. Mckay, D. Mills, A. Nauta, R. Overbeek, H. Pel, D. Pridmore, M. Saier, D. van Sinderen,
A. Sorokin, J. Steele, D. (2002 ). Discovering lactic acid bacteria by genomics. Antonie Van
Leeuwenhoek. 82, 29-58.
Klaunig, J. E. and Kamenduli, L. M. (2004). The role of oxidative stress in carcinogenesis.
Annual Review of Pharmacology and Toxicology 44, 239-267.
Klaunig, J. E., Xu, Y., lsenberg, J. S., Bachowski, S., Kolaja, K. L., Jiang, J., Stevenson, D.
E.and Walborg, E.F. Jr.(1998) The Role of Oxidative Stress in Chemical Carcinogenesis.
Environmental Health Perspectives. 106, 289-295.

255
Klein, G., Pack, A., Bonaparte, C. and Reuter, G. (1998). Taxonomy and physiology of
probiotic lactic acid bacteria. International. Journal of Food Microbiology, 41, 103–125.
Knorr, D. (1998). Technology aspects related to microorganisms in functional foods.Trends
in Food Sci. Technol. 9, 295–306.
Kmet, V., Lucchini, F. (1997). Aggregation-promoting factor in human vagina Lactobacillus
strains. FEMS Immunology and Medical Microbiology 19, 111- 114.
Kolkman, A., Dirksen, E. H. C., Slijper, M., Heck, A. J. R. (2005). Double standards in
quantitative proteomics - direct comparative assessment of difference in gel electrophoresis
and metabolic stable isotope labeling. Molecular and Cellular Proteomics 4, 255-66.
Krutchinsky, A. N., Kalkum, M, Chait, B. T. (2001). Automatic identification of proteins
with a MALDI-quadrupole ion trap mass spectrometer. Anal Chem 73, 5066-77.
Kurman, J. A. and Rasic, J. L. (1991). The health potential of products containing
bifidobacteria. In therapeutic properties of fermented milks (edited by Robison R. K.) pp
117-158. Elsvier, London.
Kullak, K (1997) Bedeutung der Darmflora für den Menschen Medizin und Ernährung 6,
Supplement 56-59.
Lakkis, J. M. (2007) Encapsulation and controlled release technologies in food systems.
Blackwell publishing Ltd, Oxford, UK, pp 1-11.
Lankaputhra, W. E. V., Shah, N. P. (1995). Survival of Lactobacillus acidophilus and
Bifidobacterium spp in the presence of acid and bile salts. Cultured Dairy Products Journal
30, 2-7.
Laplace, J. M., Sauvageot, N., Hartke, A. and Auffray, Y. (1999). Characterization of
Lactobacillus collinoides response to heat, acid and ethanol treatments. Appl Microbiol
Biotechnol 51, 659-663.

256
Lee, K. Y. and Salminen, S. (1995).The coming of age of probiotics Trends in Food Science
and Technology 6, 241-245.
Lee, K. Y., Heo, T. R. (2000). Survival of Bifidobacterium longum immobilized in calcium
alginate beads in simulated gastric juices and bile salt solution. Applied and Environmental
Microbiology, 66, 869–873.
Lee, J., Hwang, K. T., Chung, M. Y., Cho, D. H. and Park, C. S. (2005). Resistance of
Lactobacillus casei KCTC 3260 to Reactive Oxygen Species (ROS): Role for a Metal Ion
Chelating Effect. Journal of food science 70.
Lee, K., Lee, H. G., Choi, Y. J. (2008). Proteomic analysis of the effect of bile salts on the
intestinal and probiotic bacterium Lactobacillus reuteri. J Biotechnol. 10, 14-9.
Lebeer, S., Vanderleyden, J. and De Keersmaecker, J. C. S. (2008). Genes and Molecules of
Lactobacilli Supporting Probiotic Action. Microbiology and Molecular Biology, 728–764.
Lehto, E. M. and Salminen, S. (1997). Adhesion of two Lactobacillus strains, one
Lactococcus and one Propionibabacterium strains to culture human intestinal Caco-2 cell
line. Biosci.Microflora 16, 13-17.
Len, A.C., Harty, D.W., Jacques, N. A., (2004). Stress-responsive proteins are upregulated in
Streptococcus mutans during acid tolerance. Journal of Microbiology 150, 1339-51.
Leverrier, P., Vissers, J. P. C., Rouault, A., Boyaval, P., Jan, G., (2004). Mass spectrometry
proteomic analysis of stress adaptation reveals both common and distinct response pathways
in Propionibacterium freudenreichii. Archives of Microbiology. 181, 215-230.
Lopez de Felipe, F, Kleerebezem, M, de Vos, W. M. and Hugenholtz, J. (1998) Cofactor
engineering: a novel approach to metabolic engineering in Lactococcus lactis by controlled
expression of NADH oxidase. J. Bacteriol. 180, 3804–3808.

257
Luche, S., Santoni, V., Rabilloud, T., (2003).Evaluation of non-ionic and zwitterionic
detergents as membrane protein solubilizers in two-dimensional electrophoresis. Proteomics
3, 249-253.
Lushchak, V. I., (2001). Oxidative stress and mechanisms of protection against it in bacteria.
Biochemistry (Mosc.) 66, 476–489.
Lindner, J. D.; Canchaya, C.; Zhang, Z.; Neviani, E.; Gerald, F.; Fitzgerald, G. F.; Sinderen,
D.; Ventura M. (2007).Exploiting Bifidobacterium genomes: The molecular basis of stress
response. Inter. J. F. Microbiol. 120, pp-13–24.
Loboda, A. V., Krutchinsky, A. N., Bromirski, M., Ens, W., Standing, K. G. (2000). A
tandem quadrupole/time-of-flight mass spectrometer with a matrix-assisted laser
desorption/ionization source: Design and performance. Rapid Commun Mass Spectrom 14,
1047-57.
Lourens-Hattingh, A. and Viljoen, B. C. (2001).Yoghurt as probiotic carrier food.
International Dairy Journal 11, 1-17.
Lipski, A., Friedrich, U., and Altendorf, K., (2001). Application of rRNA-targeted
oligonucleotide probes in biotechnology. Appl. Microbiol. Biotechnol., 56, 40-57.
Mathara, J. M., Schillinger, U., Guigas, C., Franz, C., Kutima, P. M., Mbugua, S. K., Shin,
H-K., Holzapfel, W. H. (2008) Functional characteristics of Lactobacillus spp. from
traditional Maasai fermented milk products in Kenya. International Journal of Food
Microbiology 126, 57–64.
Malin, M., Verronen, P. and Korhonen, H. (1997). Dietary therapy with Lactobacillus GG,
bovine colostrums or bovine immune colostrum in patients with juvenile chronic arthritis,
mallet evaluation of effect of gut defence mechanisms. Inflammopharmacology 5, 219-36.
Marin, M. L., Benito, Y., Pin, C., Fernandez, M. F., Garcia, M. L., Selgas, M. D., Casas,
C., (1997). Lactic acid bacteria: hydrophobicity and strength of attachment to meat
surfaces. Letters in Applied Microbiology 24, 14-18.

258
Mann, M., Hendrickson, R. C., Pandey, A. (2001). Analysis of proteins and proteomes by
massspectrometry. Annu Rev Biochem 70, 437- 73.
Makarova, K., A. Slesarev, Y. Wolf, A. Sorokin, B. Mirkin, E. Koonin, A. Pavlov, N.
Pavlova, V. Karamychev, N. Polouchine, V. Shakhova, I. Grigoriev, Y. Lou, D. Rohksar, S.
Lucas, K. Huang, D. M. Goodstein, T. Hawkins, V. Plengvidhya, D. Welker, J. Hughes, Y.
Goh, A. Benson, K. Baldwin, J. H. Lee, I. Diaz-Muniz, B. Dosti, V. Smeianov, W. Wechter,
R. Barabote, G. Lorca, E. Altermann, R. Barrangou, B. Ganesan, Y. Xie, H. Rawsthorne, D.
Tamir, C. Parker, F. Breidt, J. Broadbent, R. Hutkins, D. O'Sullivan, J. Steele, G. Unlu, M.
Saier, T. Klaenhammer, P. Richardson, S. Kozyavkin, B. Weimer, and D. Mills.
(2006).Comparative genomics of the lactic acid bacteria. Proc. Natl. Acad. Sci. U.S.A. 103,
15611-15616.
Mattila-Sandholm T., Myllarinen P., Crittenden R., Mogensen G., Fonden R. and Saarela M.
(2002). Technological challenges for future probiotic foods. Int. Dairy J. 12, 173-182.
Marouga, R, David, S, Hawkins, E. (2005). The development of the DIGE system: 2D
fluorescence difference gel analysis technology. Analytical and Bioanalytical Chemistry
382, 669-78.
Mercenier, A., Pavan, S. and Pot, B. (2003). Probiotics as biotherapeutic agents: present
knowledge and future prospects. Curr. Pharm. Des. 9, 175–191.
McCarthy, J., O_Mahony, L., O Callaghan, L., Sheil, B., Vaughan E. E., Fitzsimons N.,
Fitzgibbon J., O. Sullivan, G.C., Kiely B., Collins J.K. and Medzihradszky K. F, Campbell
J. M, Baldwin M. A., Falick AM, Juhasz P, Vestal ML, Burlingame A. L. (2000). The
characteristics of peptide collision-induced dissociation using a high-performance MALDI-
TOF/ TOF tandem mass spectrometer. Anal Chem 72, 552-8.
Mitsuoka, T. (1982). Recent trends in research on intestinal microflora. Bifidobacteria
Microflora 1 13-24.

259
Mishra, V., Prasad, D.N. (2005). Application of in vitro methods for selection of
Lactobacillus casei strains as potential probiotics. International Journal of Food
Microbiology 103, 109-115.
Manso, M. A., Leonil, G. J., Gagnaire, V., (2005). Application of proteomics to the
characterisation of milk and dairy products. International Dairy Journal 15, 845–855.
Miyoshi, A, Tatiana Rochat, Jean-Jacques Gratadoux, Yves Le Loir, Sérgio Costa Oliveira,
Philippe Langella and Vasco Azevedo (2003) Oxidative stress in Lactococcus lactis. Genet.
Mol. Res. 2, 348-359.
Modler, McKellar, a Yaguchi, Modler, H. W., McKellar, R. C., a Yaguchi, M. (1990).
Bifidobacteria and bifidogenic factors. Canadian Institute of Food Science and Technology
Journal, 23, 29–41.
Morelli, L. (2000) In vitro selection of probiotic lactobacilli: a critical appraisal. Curr. Iss.
Intest. Microbiol. 1, 59–67.
Morris, H. R., Paxton, T., Dell, A., Langhorne, J., Berg, M., Bordoli, R. S., Hoyes, J.,
Bateman, R. H. (1996). High sensitivity collisionally activated decomposition tandem mass
spectrometry on a novel quadrupole. Rapid Communications in Mass Spectrometry 10, 889-
896.
Murphy, M.G. and Condon, S. (1984). Correlation of oxygen utilization and hydrogen
peroxide accumulation with oxygen induced enzymes in Lactobacillus plantarum cultures.
Arch. Microbiol. 138, 44-48.
Naidu, A. S., Bidlack, W. R. and Clemens, R. A. (1999). Probiotic spectra of Lactic Acid
Bacteria (LAB). Critical Reviews.
Niederhoffer, E. C., Naranjo, C. M. Bradley, K. L. and Fee, J. A. (1990). Control of
Escherichia coli superoxide dismutase (sodA and sodB) genes by the ferric uptake regulation
(fur) locus. J. Bacteriol. 172, 1930-1938.

260
Nighswonger, B. D., Brashears, M. M., Gilliland, S.E. (1996). Viability of Lactobacillus
acidophilus and Lactobacillus casei in fermented milk products during refrigerated storage.
J. Dairy Sci. 79, 212–219.
O'Farrell, P.H. (1975). High resolution two-dimensional electrophoresis of proteins. Journal
of Biological Chemistry 250, 4007-4021.
Omar, S. H. (1993). Oxygen diffusion through gels employed for immobilization. Applied
Microbiology and Biotechnology 40 173-181.
Oozeer, R. J. P. Furet, N. Goupil-Feuillerat, Mengaud, A. J. and Corthier, G. (2005).
Differential Activities of Four Lactobacillus casei Promoters during Bacterial Transit
through the Gastrointestinal Tracts of Human-Microbiota-Associated Mice. Applied and
environmental microbiology, 1356–1363.
Oliver, D., Walter, W., Gerold, R., Harun, P., Robin, W., Angelika, G., (2002). High pressure
effects step-wise altered protein expression in Lactobacillus sanfranciscensis. Proteomics 2,
765-74.
Olivares, M., Diaz-Ropero, M. P., Gomez, N., Lara-Villoslada, F., Sierra, S., Maldonado, J.
A., Martin, R., Rodriguez, J. M. and Xaus, J. (2006a). The consumption of two new probiotic
strains, Lactobacillus gasseri CECT 5714 and Lactobacillus coryniformis CECT 5711,
boosts the immune system of healthy humans. International Microbiology 9, 47-52.
Olivares, M. Paz Diaz-Ropero, M. Gomez, N. Sierra, S. Lara-Villoslada, F. Martin, R.
Miguel Rodriguez, J. Xaus, J. (2006b). Dietary deprivation of fermented foods causes a fall
in innate immune response. Lactic acid bacteria can counteract the immunological effect of
this deprivation. Journal of Dairy Research. 73, 492-8.
Orla-Jensen S. (1924). La classification des bacte´rieslactiques. Le Lait 4, 468–480.
O‘Sullivan, D. J. (1999) Methods of analysis of the intestinal microflora. In: Tannock, G.W.
(Ed.) Probiotics: a Critical Review, Horizon Scientific Press, Wymondham, UK, pp. 23–44.

261
Otero, M.C., Morelli, L., Nader-Macías, M.E., (2006). Probiotic properties of vaginal
lactic acid bacteria to prevent metritis in cattle. Letters in Applied Microbiology
43, 91-97.
Ouwehand, A. C., Isolauri, E., Kirjavainen, P. V., & Salminen, S. J. (1999). Adhesion of four
Bifidobacterium strains to human intestinal mucus from subjects in different age groups.
FEMS Microbiological Letters, 172, 61–64.
Ouwehand A. C., Isolauri E., Kirjavainen P.V., Tolkko S. and Salminen S. J. (2000). The
mucus binding of Bifidobacterium lactis Bb12 is enhanced in the presence of Lactobacillus
GG and Lact. delbrueckii subsp. bulgaricus. Lett. Appl. Microbiol. 30, 10–13.
Ouwehand, A. C., Salminen S. and Isolauri E. (2002). Probiotics: An overview of beneficial
effects. Anton. Leeuw. Int. J. G. 82, 279–289.
Ouwehand, A. C. and Vesterlund, S. (2004). Antimicrobial components from lactic acid
bacteria. In Salmien, S., Wright, A.V., & Ouwehand, A., (Eds.), Lactic Acid Bacteria
Microbiological and Functional Aspects (pp 375-389). New York, US: Marcel Dekker Inc.
Paddock, S. W. (1999) Introduction to Confocal Imaging. IN PADDOCK, S. W. (Ed.)
Confocal Microscopy Methods and Protocols. Totowa, New Jersey, Humana Press.
Palagi, P. M., Hernandez, P., Walther, D., Appel, R. D. (2006). Proteome informatics I:
Bioinformatics tools for processing experimental data. Proteomics 6, 5435- 44.
Pan, W.H., Li, P.L., Liu, Z., 2006. The correlation between surface hydrophobicity and
Adherence of Bifidobacterium strains from centenarians' faeces. Anaerobe 12,148-152.
Patterson S. D. and Aebersold R. H. (2003). Proteomics: The first decade and beyond. Nat
Genet 33, 311-23.
Picot, A., and Lacroix, C. (2004). Encapsulation of bifidobacteria in whey protein-based
microcapsules and survival in simulated gastrointestinal conditions and in yoghurt.
International Dairy Journal, 14, 505–515.

262
Pedone, C. A., Bernabeu A. O., E. R. Postaire, C. F. Bouley, and P. Reinert. (1999). The
effect of supplementation with milk fermented by Lactobacillus casei (strain DN-114 001)
on acute diarrhoea in children attending day care centres. Int. J. Clin. Pract. 53, 179–184.
Perez, P. F., Minnaard, Y., Disalvo, E. A., De Antoni, G. L. (1998). Surface properties of
bifidobacterial strains of human origin. Applied and Environmental Microbiology 64, 21-26.
Peran L., Camuesco D., Comalada M., Nieto A., Concha A., Díaz-Ropero M.P., Olivares M.,
Xaus J. (2005). Preventive effects of a probiotic, Lactobacillus salivarius ssp. Salivarius, in
theTNBS model of rat colitis. World J Gastroenterol 11, 5185–5192.
Pfeiler, E. A., Azcarate-Peril, M. A. and Klaenhammer. T. R. (2007) Characterization of a
novel bile-inducible operon encoding a two-component regulatory system in Lactobacillus
acidophilus. J. Bacteriol. 189, 4624–4634.
Phillips, M., Kailasapathy, K. and Tran, L. (2006). Viability of commercial probiotic cultures
(L. acidophilus, Bifidobacterium sp., L. casei, L. paracasei and L. rhamnosus) in cheddar
cheese. International Journal of Food Microbiology 108, 276–280.
Poonam, R. B. Shrikant, A. S. Mahesh, V. B. and Rekha, S. S. (2010) Studies on Viability of
Lactobacillus fermentum by Microencapsulation Using Extrusion Spheronization. Food
Biotechnology, 24, 150 — 164
Prasad, J., Gill, H., Smart, J., Gopal, P.K., (1998). Selection and Characterisation of
Lactobacillus and Bifidobacterium Strains for Use as Probiotics. International Dairy Journal
8, 993-1002.
Prasad J., Gill H. S., Smart J. and Gopal P. K. (1999). Selection and characterisation of
Lactobacillus and Bifidobacterium strains for use as probiotics. Int. Dairy J. 8, 993–1002.
Prasad J., McJarrow P. and Gopal P. (2003). Heat and Osmotic Stress Responses of Probiotic
Lactobacillus rhamnosus HN001 (DR20) in Relation to Viability after Drying . Applied and
Environmental Microbiology p. 917–925.

263
Prado, F. C., Parada, J. L., Pandey, A., Soccol, C. R. (2008).Trends in non-dairy probiotic
beverages. Food Res. International 41, 111-123.
Playne, M. (1994). Probiotic foods. Food Australia, 46, 362.
Rabilloud, T., Strub, J. M., Sylvie, L., Dorsselaer, A.A., and Lunardi, J. (2001). A
comparison between sypro ruby and ruthenium II tris (bathophenanthroline disulfonate) as
fluorescent stains for protein detection in gels. Proteomics 1, 699-704.
Rahman, M. M., Kim, W. S., Kumura, H. and Shimazaki, K (2008) Autoaggregation and
surface hydrophobicity of bifidobacteria. World J Microbiol Biotechnol. 24, 1593–1598.
Rasic, J. L. (1983). The role of dairy foods containing bifido and acidophilus bacteria in
nutrition and health? North European Dairy Journal, 4, 1–5.
Rattes, A. L. P. Oliveira, R. P. (2004). Spray drying as a method for microparticulate
modified release systems preparation. Procedings of the 14th international drying
symposium. (IDS). Sao Paulo, Brazil. Vol. B. pp. 1112-1119.
Reineccius, G. A. (1998). Spray drying of food flavours. In Risch, J., Reineccius G. A. eds.
Flavour Encapsulation. American chemical society., Washington, DC.pp.55- 66.
Reid, G., McGroarty, A. J., Angotti, R. and Cook, R. L. (1988) Lactobacillus inhibitor
production against Escherichia coli and co aggregation ability with uropathogens. Can. J.
Microbiol. 34, 344–351.
Reid, G. and Hammond, J. A. (2005). Probiotics. Some evidence of their effectiveness. Can.
Fam. Physician 51, 1487–1493.
Reniero, R., Cocconcelli, P., Bottazzi, V. and Morelli, L. (1992) High frequency of
conjugation in Lactobacillus mediated by an aggregation-promoting factor. J. Gen.
Microbiol. 138, 763–768.

264
Rickard, A. H., Gilbert, P., High, N. J., Kolenbrander, P. E., Handley, P. S. (2003). Bacterial
coaggregation: an integral process in the development of multi-species biofilms. Trends in
Microbiology 11, 94-100.
Righetti, P.G., Campostrini, N., Pascali, J., Hamdan, M., Astner, H. (2004). Quantitative
proteomics: A review of different methodologies. European Journal of Mass Spectrometry
10, 335-48.
Rinkinen, M., Westermarc, E., Salminen, S. and Ouwehand, A. C. (2003). Absence of host
specificity for in vitro adhesion of probiotic lactic acid bacteria to intestinal mucus. Vet.
Microbiol. 97, 55-61.
Rodriguez, G. G., Phipps, K. D., Ishiguro, and H. F. Ridgway. (1992). Use of a fluorescent
redox probe for visualization of actively respiring bacteria. Appl. Environ. Microbiol. 58,
1801–1808.
Rosenberg, M., Gutnick, D., Rosenberg, E. (1980) Adherence of bacteria to hydrocarbons: a
simple method for measuring cell surface hydrophobicity. FEMS Microbiol Lett. 9, 29–33.
Ross, R. P., Desmond, C., Fitzgerald, G. F. and Stanton, C. (2005) Overcoming the
technological hurdles in the development of probiotic foods. J Appl Microbiol 98, 1410–
1417.
Rutherford, S. L. and Lindquist, S. (1998) Hsp90 as a capacitor for morphological evolution.
Sorum H, L‘Abee-Lund TM. 2002. Antibiotic resistance in food-related bacteria a result of
interfering with global web of bacterial genetics. Int J Food Microbiol 78, 43-56.
Saarela, M., Lahteenma, ki L., Crittenden, R., Salminen, S. and Mattila-Sandholm, T. (2002).
Gut bacteria and health foods—the European perspective. International Journal of Food
Microbiology 78, 99– 117.
Serrazanetti, D. I., Elisabetta, M., Guerzoni, M. E., Corsetti, A., Vogel, R., (2009). Metabolic
impact and potential exploitation of the stress reactions in lactobacilli. Food Microbiology
26, 700–711.

265
Svensater, G., Sjogreen, B., Hamilton, I. R., (2000). Multiple stress responses in
Streptococcus mutans and the induction of general and stress-specific proteins. Journal of
Microbiology 14, 6107-6117.
Shah N. P, Lankaputhra W. E. V. (1997). Improving viability of Lactobacillus acidophilus
and Bifidobacterium spp. in yogurt. International Dairy Journal 7,349–56.
Salminen S., Isolauri E. and Salminen E. (1996). Clinical uses of probiotics for stabilizing
the gut mucosal barrier: successful strains and future challenges. Antonie Van Leeuwenhoek
70, 347–58.
Salminen S., Bouley C. and Boutron-Ruault M. C. (1998). Functional food science and
gastrointestinal physiology and function. Br. J. Nutr. 80, 147–71.
Santosa S., Farnworth E. and Jones P. J. (2006). Probiotics and their potential health claims.
Nutr. Rev. 64, 265–274.
Schrezenmeir J. and de Vrese M. (2001). Probiotics, prebiotics, and synbiotics –
approaching a definition. Am .J. Clin. Nutr. 73, 361-4.
Seshu, J., Boylan, J. A., Gherardini, F. C. and Skare, J. T. (2004). Dissolved oxygen levels
alter gene expression and antigen profiles in Borrelia burgdorferi.Infection and Immunity 72,
1580-1586.
Senok, A. C., Ismaeel, A. Y. and Botta. G. A. (2005). Probiotics: facts and myths. Clin
Microbiol Infect 11, 958966.
Shah N.P., Lankaputhra W.E.V., Britz M. and Kyle W.S.A. (1995). Survival of L.
acidophilus and Bifidobacterium bifidum in commercial yoghurt during refrigerated storage.
Int. Dairy J. 5, 515–521.
266
Shah, N. P., Ali, J. F. and Ravula., R. R. (2000). Populations of Lactobacillus acidophilus,
Bifidobacterium spp. and Lactobacillus casei in commercial fermented milk products. Biosci.
Microflora 19, 35–39.
Shah N. P, Rarula R. R. (2000). Microencapsulation of probiotic bacteria and their survival
in frozen fermented dairy desserts. Aust J Dairy Technol. 55, 139-144
Shah, N. P. (2007). Functional cultures and health benefits. International Dairy Journal, 17,
1262-1277.
Sheu, T. Y., Marshall, R. T., and Heymant, H. (1993). Improving survival of culture
bacteria in frozen desserts by microentrapment. Journal of Dairy Science, 76, 1902-1907.
Shen, Y. F. and Smith, R. D. (2005). Advanced nanoscale separations and mass spectrometry
for sensitive high-throughput proteomics. Expert Review of Proteomics 2, 431-47.
Shimamura, S., Fumiaki, A.B.E., Ishibashi, N., Miyakawa, H., Yeashima, T., Araya, T., &
Tomita, M. (1992). Relationship between oxygen sensitivity and oxygen metabolism of
Bifidobacterium sp. Journal of Dairy Science, 75, 3296-3306.
Sikora, A. & Grzesiuk, E. (2007) Heat shock response in gastrointestinal tract. Journal of
Physiology and Pharmacology, 58, 43-62.
Sidarenka, A. V., Novik G. I. and Akimov, V. N. (2008). Application of molecular methods
to classification and identification of bacteria of the genus bifidobacterium. Microbiology,
77, 251–260.
Sies H. (1991). Oxidative stress: introduction. In: Oxidative Stress: Oxidants and
Antioxidants (Sies H, ed). San Diego, CA: Academic Press; 15-22.
SciMAT Photo Researchers, Inc. (cited from:
http://www.magma.ca/~scimat/science/images.htm)

267
Skulachev V. P. (1995).Nonphosphorylating respiration as the mechanism preventing the
formation of active forms of oxygen. Molekuliarnaia Biologiia. 29, 1199-1209.
Spano, G. and Massa, S. Environmental Stress Response in Wine Lactic Acid Bacteria
(2006). Beyond Bacillus subtilise. Critical Reviews in Microbiology 32, 77–86.
Stadtman E. R. (1990) Metal ion-catalyzed oxidation of proteins: biochemical mechanism
and biological consequences. Free Rad Biol Med. 9:315–325.
Steenson LR, Klaenhammer TR, Swaisgood HE (1987). Calcium alginate-immobilized
cultures of lactic streptococci are protected from attack by lytic bacteriophage. J Dairy Sci.
70, 1121- 1127.
Storz, G. and Hengge-Aronis, R. (2000) Bacterial Stress Response, Washington, D.C., ASM
Press.
Slover, C. M. & Danziger, L. (2008) Lactobacillus: a Review. Clinical Microbiology
Newsletter, 30, 23-27.
Snel B., Bork P. and Huynen M. A. (2002).Genomes in flux: the evolution of archaeal and
proteobacterial gene content. Genome res. 12, 17-25.
Storz, G. and Imlay, J.A. (1999). Oxidative stress. Curr. Opin. Microbiol. 2: 188-194.
Suokko, A., Poutanen, M., Savijoki, K. & Kalkkinen, N. V., P (2008) ClpL is essential for
induction of thermotolerance and is potentially part of the HrcA regulon in Lactobacillus
gasseri. Proteomics, 8, 1029-1041.
Sultana K., Godward G., Reynolds N., Arumugaswamy R., Peiris P. and Kailasapathy K.
(2000). Encapsulation of probiotic bacteria with alginate-starch and evaluation of survival in
simulated gastrointestinal conditions and in yoghurt. International Journal of Food
Microbiology 62 47-55.

268
Sunohara H, Ohno T, Shibata N, Seki K (1995). Process for producing capsule and capsule
obtained thereby. US Patent. 5: 478-570.
Suskovic, J., Brkic, B., Matosic, S., Maric, V., (1997). Lactobacillus acidophilus M92 as
potential probiotic strains. Milchwissenschaft 52, 430-435.
Talwalkar A., Kailasapathy K., Peiris P. and Arumugaswamy R. (2001). Application of
RBGR-a simple way for screening of oxygen tolerance in probiotic bacteria. International
Journal of Food Microbiology 71 245-248.
Talwalkar A, Kailasapathy K (2003a) Metabolic and biochemical responses of probiotic
bacteria to oxygen. J Dairy Sci 86:2537–254.
Talwalkar A. and Kailasapathy K. (2003b). Effect of microencapsulation on oxygen toxicity
in probiotic bacteria. Australian Journal of Dairy Technology 58, 36–39.
Talwalkar A., Miller C. W., Kailasapathy K and Nguyen M. H. (2004). Effect of packaging
materials and dissolved oxygen on the survival of probiotic bacteria in yoghurt. International
Journal of Food Science and Technology 39, 605–611.
Talwalkar, A., and Kailasapathy, K. (2004a). A review of oxygen toxicity in probiotic
yogurts: Influence on the survival of probiotic bacteria and protective techniques.
Comprehensive Reviews in Food Science and Food Safety, 3, 117–124.
Talwalkar A. and Kailasapathy K. (2004b). Comprehensive reviews in food Science and
Food Safety.3, 117-124.
Talwalkar, A., Kailasapathy, K., (2004c). The role of oxygen in the viability of probiotic
bacteria with reference to L. acidophilus and Bifidobacterium spp. Current Issues in
Intestinal Microbiology 5, 1-8.
Tannock, G.W., (1995). Normal microflora. An introduction to microbes inhabiting the
human body, Chapman & Hall, London.

269
Tannock G. W. (2002). The Bifidobacterial and Lactobacillus microflora of humans. Clinical
Reviews in Allergy and Immunology 22 231-253.
Thomas, E. L. and Pera, K. A. (1983). Oxygen metabolism of Streptococcus mutans: uptake
of oxygen and release of superoxide and hydrogen peroxide. J. Bacteriol. 154, 1236-1244.
Tissier H. (1900). Recherches sur la flore intestinale des nourrissons (e´tat normal et
pathologique). France: The`s e de me´decine, Universite´ de Paris.
Truelstrup Hansen, L., Allan-Wojtas, P.M., Jin, Y.L., Paulson, A.T., (2002). Survival of
Ca-alginate microencapsulated Bifidobacterium spp. in milk and simulated gastrointestinal
conditions. Food Microbiology 19, 35-45.
Tuomola E. M. and Salminen S. J. (1998). Adhesion of some probiotic and dairy
Lactobacillus strains to Caco-2 cell cultures. International Journal of Food Microbiology 41,
45-51.
Tuomola E., Crittenden R., Martin P., Isolauri E. and Salminen S. (2001).Quality assurance
criteria for probiotic bacteria. American Journal of Clinical Nutrition 73, 393-398.
Twyman R. M. (2004) Principles of proteomics. Garland Scince/ BIOS Scientific Publishers.
Trowbridge, UK. pp1-20.
Usman, H. A., (1999). Bile tolerance, taurocholate deconjugation, and binding of
Cholesterol by Lactobacillus gasseri strains. Journal of Dairy Science 82, 243–
248.
Van Meer, G. (2005) Cellular lipidomics. EMBO J 24:3159–3165.
Van de Guchte, M., Serror, P., Chervaux, C., Smokvina, T., Ehrlich, S. D., Maguin, E.,
(2002). Stress responses in lactic acid bacteria. Antonie Van Leeuwenhoek 82,187-216.

270
Ventura, M., Canchaya, C., Zhang, Z., Bernini, V., Fitzgerald, G. F., D. van S. (2006) How
high G+C Grampositive bacteria and in particular bifidobacteria cope with heat stress:
protein players and regulators. FEMS Microbiol Rev 30, 734-759.
Vogel, R. F., Pavlovic, M., Hormann, S., Ehrmann, M. A., (2005). High pressure-sensitive
gene expression in Lactobacillus sanfranciscensis. Brazilian Journal of Medical and
Biological Research. 38, 1247-52.
Wadstrom, T., Andersson, K., Sydow, M., Axelsson, L., Lindgren, S., Gullmar, B., (1987).
Surface properties of lactobacilli isolated from the small intestine of pigs. Journal of Applied
Bacteriology 62, 513-520.
Walker, G. C. (1996). The SOS response of Escherichia coli. In: Escherichia coli and
Salmonella typhimurium: Cellular and Molecular Biology (Neidhardt, F.C., ed.). ASM,
Washington, DC, USA, pp. 1400-1416.
Watson, J. T. and Sparkman, O. D. (2007) Introduction to Mass Spectrometry
Instrumentation, applications and strategies for data interpretation, West Sussex, England,
John Wiley and Sons, Ltd.
Wenrong, G. (2000). Survival of bifidobacteria in yogurt and simulated gastric juice
following immobilization in gellan-xanthan beads. Int J Food Microbiol. 61, 17-26.
Whitehead, K., Versalovic, J., Roos, S. and Britton, R. A. (2008). Genomic and Genetic
Characterization of the Bile Stress Response of Probiotic Lactobacillus reuteri ATCC 55730.
Applied and Environmental Microbiology 74, 1812–1819.
Witzany, G. (2008) Biocommunication of Unicellular and Multicellular Organisms. triple C
6, 24-53.
Wilm, M. and Mann, M. (1996). Analytical properties of the nanoelectrospray ion source.
Anal Chem 68, 1-8.

271
Wright, S. J., Centonze, V. E., Stricker, S. A., P. J. DeVries, S. W. Paddock, and G. Schatten.
(1993). Introduction to confocal microscopy and three dimensional reconstruction. Methods
Cell Biol. 38, 1–45.
Wu, R., Wang, W., Yu, D., Zhang W., Li, Y., Sun, Z., Wu, J., Meng, H., Zhang, H., (2009).
Proteomics Analysis of Lactobacillus casei Zhang, a New Probiotic Bacterium Isolated from
traditional Home-made Koumiss in Inner Mongolia of China. Molecular & Cellular
Proteomics 8, 2321-2338.
Yates J. R., Speicher S., Griffin P. R., Hunkapiller T. 1993.Peptide mass maps- a highly
informative approach to protein identification. Anal Biochem 214, 397- 408.
Zaizu, H., Sasaki, M., Nakajima, H., Suzuki, Y. (1993). Effect of anti oxidative lactic acid
bacteria on rats fed a diet deficient in vitamin E. Journal of Dairy Science 76, 2493–2499.
Zarate, G., Chaia, A. P., Gonzalez, S. and Oliver, G. (2000). Viability and beta-galactosidase
activity of dairy propionibacteria subjected to digestion by artificial gastric and intestinal
fluids. Journal of Food Protection 63, 1214-1221.
Zhao, X., Li, D. (2008). A new approach to eliminate stress for two probiotics with
chemicals in vitro. European Food Research and Technology 227, 1569-1574.
Zhao, X., Li, D. (2009). Elimination of acidic or oxidative stress for four probiotics with
some chemicals in vitro. African Journal of Microbiology Research 3. 353-357.
Zimmerberg, J. and Gawrisch, K. (2006). The physical chemistry of biological membranes.
Nat Chem Biol 2:564–567.
http://www.customprobiotics.com/about_probiotics.htm
http://www.customprobiotics.com/yogurt_starter