effect of glucose and glutamine on biofilm formation by several candida...
TRANSCRIPT
outubro de 2013
Universidade do MinhoEscola de Engenharia
Bruno Filipe Gomes Ribeiro
Effect of glucose and glutamine on biofilm formation by several Candida species
UM
inho
|20
13B
runo
Fili
pe G
omes
Rib
eiro
Eff
ect
of
glu
cose
an
d g
luta
min
e o
n b
iofi
lm f
orm
ati
on
by
seve
ral Candid
a s
pe
cie
s

Dissertação de Mestrado Mestrado Integrado em Engenharia BiomédicaRamo Engenharia Clinica
Trabalho efetuado sob a orientação da Joana Azeredo
e da Drª Sónia Silva
Drª
outubro de 2013
Universidade do MinhoEscola de Engenharia
Bruno Filipe Gomes Ribeiro
Effect of glucose and glutamine on biofilm formation by several Candida species

iii
Aknowledgments
Gostaria de exprimir a minha mais suprema gratidão à Professora Joana
Azeredo, pela disponibilidade, paciência e conselhos dados ao longo deste trabalho,
orientando-em sempre na direcção certa.
À minha co-orientadora, Drª Sónia Silva, muito obrigado, pela simpatia, boa
disposição, apoio e pelos conselhos e ensinamentos, que me fizeram aprender
metodologias que levaram à realização desta tese. Nem nas situações mais difíceis me
deixou desanimar.
Ao Carlos Tiago Alves, Leonel Pereira e muitos outros do Departamento de
Engenharia Biológica, muito obrigado pelo apoio e pelas orientações.
A todos os colegas que passaram do grupos das Candidas (e também dos
fagos), foi um prazer trabalhar no mesmo espaço que vós.
E por fim à minha família, o meu suporte, sempre lá para mim….

iv
Abstract/Sumário

v
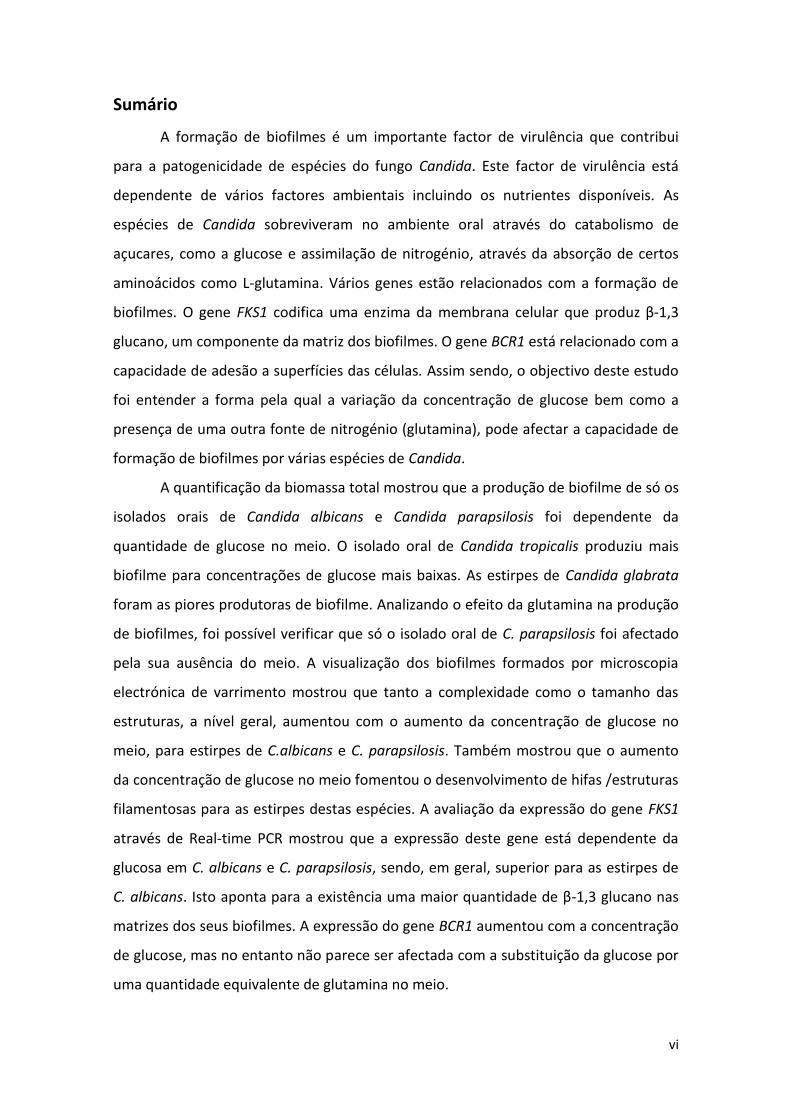
Abstract
Biofilm formation is an important virulence factor that contributes greatly to
Candida species pathogenicity. This virulence factor is dependent on several
environmental factors including the available nutrients. Candida species survive in the
oral environment through the catabolism of sugars, as glucose, and nitrogen
assimilation, through the absorption of certain aminoacids as L-glutamine. There are
several genes related with biofilm formation. The FKS1 gene encodes an membrane
bound enzyme that produces β-1,3 glucan, a component of the biofilm matrix, from
glucose. BCR1 gene is a fungal transcription factor that regulates the expression of
important Candida adhesins. Thus, the aim of this study was to understand the effect
of the glucose concentration variation as well as the presence of a nitrogen source
(glutamine), in the biofilm formation by several Candida species.
Total biomass quantification by crystal violet showed that only the oral isolates
of Candida albicans and Candida parapsilosis biofilm production dependent upon the
glucose level in the medium. The oral isolate of Candida tropicalis produced more
biofilm for smaller amounts of glucose, whereas, C. glabrata strains were less able to
form biofilm than any other studied strain. Analyzing the effect of glutamine on
biofilms in terms of total biomass, only the oral isolate of C. parapsilosis was affected
by the absence of glutamine from the medium. Scanning-Ellectron microscopy of the
biofilms formed by C. albicans and C. parapsilosis, showed that the complexity and
overall structural size of the biofilm increased when the glucose concentration was
higher. It also showed, that glucose presence enhanced the development and growth
of hyphal/filamentous forms. Genetic expression assessment through Real time PCR,
showed that FKS1 gene expression was glucose dependent for both C. albicans and C.
parapsilosis, and overall higher for C. albicans, hinting at a greater β-1,3 glucan
incorporation on biofilm of this specie. BCR1 gene expression increased for higher
glucose levels in the medium. However, when glucose was replaced by an equal
amount of glutamine, the expression of this gene didn’t decrease for any of the
studied strains, hinting that cell adhesion is not dependent on the presence of glucose,
but may be dependent on nutrient concentration.
vi
Sumário
A formação de biofilmes é um importante factor de virulência que contribui
para a patogenicidade de espécies do fungo Candida. Este factor de virulência está
dependente de vários factores ambientais incluindo os nutrientes disponíveis. As
espécies de Candida sobreviveram no ambiente oral através do catabolismo de
açucares, como a glucose e assimilação de nitrogénio, através da absorção de certos
aminoácidos como L-glutamina. Vários genes estão relacionados com a formação de
biofilmes. O gene FKS1 codifica uma enzima da membrana celular que produz β-1,3
glucano, um componente da matriz dos biofilmes. O gene BCR1 está relacionado com a
capacidade de adesão a superfícies das células. Assim sendo, o objectivo deste estudo
foi entender a forma pela qual a variação da concentração de glucose bem como a
presença de uma outra fonte de nitrogénio (glutamina), pode afectar a capacidade de
formação de biofilmes por várias espécies de Candida.
A quantificação da biomassa total mostrou que a produção de biofilme de só os
isolados orais de Candida albicans e Candida parapsilosis foi dependente da
quantidade de glucose no meio. O isolado oral de Candida tropicalis produziu mais
biofilme para concentrações de glucose mais baixas. As estirpes de Candida glabrata
foram as piores produtoras de biofilme. Analizando o efeito da glutamina na produção
de biofilmes, foi possível verificar que só o isolado oral de C. parapsilosis foi afectado
pela sua ausência do meio. A visualização dos biofilmes formados por microscopia
electrónica de varrimento mostrou que tanto a complexidade como o tamanho das
estruturas, a nível geral, aumentou com o aumento da concentração de glucose no
meio, para estirpes de C.albicans e C. parapsilosis. Também mostrou que o aumento
da concentração de glucose no meio fomentou o desenvolvimento de hifas /estruturas
filamentosas para as estirpes destas espécies. A avaliação da expressão do gene FKS1
através de Real-time PCR mostrou que a expressão deste gene está dependente da
glucosa em C. albicans e C. parapsilosis, sendo, em geral, superior para as estirpes de
C. albicans. Isto aponta para a existência uma maior quantidade de β-1,3 glucano nas
matrizes dos seus biofilmes. A expressão do gene BCR1 aumentou com a concentração
de glucose, mas no entanto não parece ser afectada com a substituição da glucose por
uma quantidade equivalente de glutamina no meio.

vii
Table of contents
viii
Acknowledgements…………………………………………………………………………………………………………………iii
Abstract ………………………………………………………………………………………………………………………………….iv
List of figures and tables ……………………………………………………………………………………………xi
Nomenclature………………………………………………………………………………………………………….xviii
1 -Introduction ……………………………………………………………………………………………………………1
1.1 - Oral candidosis …………………………………………………………………………………………2
1.1.1 - Causative agents of oral candidosis……………………………………………3
1.1.2 - Predisposing factors ………………………………………………………………….4
1.1.3 - Incidence rates ………………………………………………………………………….5
1.1.4 - Emergence of Non-Candida albicans Candida as pathogens………..6
1.2 - Candida species: biology and metabolism …………………………………………………8
1.2.1 - Growth forms of Candida species. …………………………………………….8
1.2.2 - Metabolism of Candida species ………………………………………………….9
1. 3 - The oral cavity and the oral environment ……………………………………………..11
1.3.1- Ecology of the oral cavity ………………………………………………………….11
1.3.2 - Microbial growth-influencing factors ……………………………………….12
1.5 - Candida species biofilm formation …………………………………………………………15
1.5.1 - The first steps of biofilm formation ………………………………………….15
1.5.2 - Biofilm formation …………………………………………………………………….16
1.5.3 - Candida species biofilm structure and composition ………………..17
1.6 - Genes BCR1 and FSK1 …………………………………………………………………………….18
ix
2- Matherials and methods ………………………………………………………………………………………22
2.1 – Organisms ……………………………………………………………………………………………..23
2.2 - Growth conditions and media ………………………………………………………………..23
2.3 - Biofilm formation …………………………………………………………………………………..24
2.3.1 – Biofilm quantification……………………………………………………………...24
2.3.2 -Biofilm cells viability ………………………………………………………………. 24
2.3.3 – Biofilm structure analysis ……………………………………………………….25
2.4 – Gene expression analysis……………………………………………………………………….25
2.4.1 – Primer design ………………………………………………………………………….25
2.4.2 – Candida species DNA extraction………………………………………………26
2.4.3 – Primer specificity assessment………………………………………………….27
2.4.4 – Candida species RNA extraction ……………………………………………..27
2.4.5 – cDNA synthesis ……………………………………………………………………….28
2.4.6 – Quantitative Real-time PCR …………………………………………………….28
2.5 – Statistical Analysis …………………………………………………………………………………29
3 – Results ………………………………………………………………………………………………………………..30
3.1 - Assessment of the effect of glucose in Candida species biofilm forming
ability and cell viability………………………………………………………………………………………………31
3.2 - Assessment of the effect of the glutamine on Candida albicans and
Candida parapsilosis biofilm formation and in cell viability ……………………………………….34
3.3 - Influence of glucose and glutamine in Candida albicans and Candida
parapsilosis biofilms structure ………………………………………………………………………………….36

x
3.4 - Assessment of the expression level of BCR1 and FKS1 gene in biofilm cells
in presence of glutamine or glucose …………………………………………………………………………37
4 –Discussion ……………………………………………………………………………………………………………41
4.1 - Assessment of the effect of glucose in Candida species biofilm forming
ability and cell viability………………………………………………………………………………………………42
4.2 - Assessment of the effect of the glutamine on Candida albicans and
Candida parapsilosis biofilm formation and in cell viability ……………………………………….45
4.3 - Influence of glucose and glutamine in Candida albicans and Candida
parapsilosis biofilms structure ………………………………………………………………………………….46
4.4 - Assessment of the expression level of BCR1 and FSK1 gene in biofilm cells
in presence of glutamine or glucose …………………………………………………………………………47
5 – Concluding remarks …………………………………………………………………………………………....49
6 – Future perspectives …………………………………………………………………………………………….52
8 – Bibliography ………………………………………………………………………………………………………..54

xi
List of figures and tables

xii
List of Figures
1 – Introduction
Figure 1.1 – Different aspects of Oral candidosis. A) Aspect of acute
Pseudomembranous candidosis or trush, the most easily identifiable type of oral
candidosis and tradicionally associated with this disease; B) Candida albicans colonies
aspect seen under light microscopy. …………………………………………………………………………..2
Figura 1.2 – Model for glucan matrix production and delivery to the biofilm matrix. β-
1.3-glucan production occurs at the FSK1p cell membrane-bound protein. The glucan is
then modified and incorporated into the cell wall and extracellular matrix. It is
proposed that PHR1p, BGL2p and XOG1p act in complementary form and
independently from another described pathway form glucan incorporation in the
biofilm matrix, the ZAP1p matrix pathway. Matrix glucan are highlighted in purple. The
cell wall glucan are grey colored The black arrows represent the pathway taken by
glucan from synthase product to the modified sugars that are incorporated into the
biofilm matrix. Circles represent modification or production enzymes (adapted from
Taff, et al.). ……………………………………………………………………………………………………………….20
3- Results
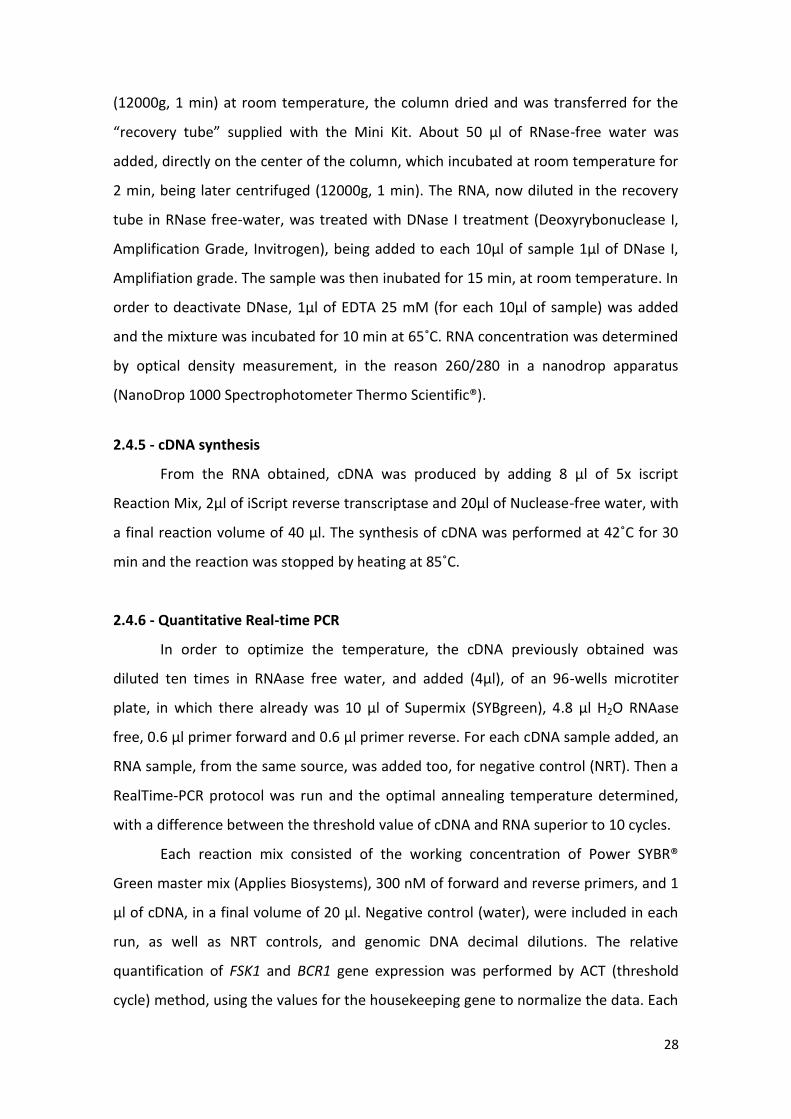
Figure 3.1 – Candida albicans biofilm formation ability in presence of different
percentages of glucose. Total biomass quantification (1) and number of CFUs (2) values
obtained from 24h biofilms at 37º C grown in RPMI medium supplemented with 0.2%,
1%, 2%, 3%, 4%, 5% and 10% of glucose with 0.3% of glutamine. (● reference strain
and ● oral isolate). Error bars represent standard deviation. Statically differences
obtained when compared with 0.2% of glucose with 0.3% of glutamine (* p<0.1, **
p<0.01, ***p<0.001, ****p<0.0001). ………………………………………………………………………..32
Figure 3.2 – Candida parapsilosis biofilm formation ability in presence of different
percentages of glucose. Total biomass quantification (1) and number of CFUs (2) values
obtained from 24h biofilms at 37º C grown in RPMI medium supplemented with 0.2%,
1%, 2%, 3%, 4%, 5% and 10% of glucose with 0.3% of glutamine. (● reference strain
xiii
and ● oral isolate).. Error bars represent standard deviation. Statistically differences
obtained when compared with 0.2% of glucose with 0.3% of glutamine (* p<0.1, **
p<0.01, ***p<0.001, ****p<0.0001). ………………………………………………………………………..32
Figure 3.3 – Candida glabrata biofilm formation ability in presence of different
percentages of glucose. Total biomass quantification (1) and number of CFUs (2) values
obtained from 24h biofilms at 37º C grown in RPMI medium supplemented with 0.2%,
1%, 2%, 3%, 4%, 5% and 10% of glucose with 0.3% of glutamine. (● reference strain
and ● oral isolate). Error bars represent standard deviation. Statically differences
obtained when compared with 0.2% of glucose with 0.3% of glutamine (* p<0.1, **
p<0.01, ***p<0.001, ****p<0.0001). ………………………………………………………………………..33
Figure 3.4 – Candida tropicalis biofilm formation ability in presence of different
percentages of glucose. Total biomass quantification (1) and number of CFUs (2) values
obtained from 24h biofilms at 37º C grown in RPMI medium supplemented with 0.2%,
1%, 2%, 3%, 4%, 5% and 10% of glucose with 0.3% of glutamine. ( ● reference strain
and ● oral isolate).. Error bars represent standard deviation. Statically differences
obtained when compared with 0.2% of glucose with 0.3% of glutamine (* p<0.1, **
p<0.01, ***p<0.001, ****p<0.0001). ………………………………………………………………………..34
Figure 3.5 – Influence of glutamine in Candida albicans biofilm formation ability. (1)
Total biomass quantification (1) and number of CFUs (2) values obtained from 24h
biofilms at 37º C grown in RPMI medium supplemented with 0.3% of glutamine
without glucose and 0.2% and 10% of glucose in presence (glucose) and absence
(glucose WG) of 0.3% of glutamine. (● reference strain and ● oral isolate). Error bars
represent standard deviation. Statistically differences obtained when compared with
0.2% of glucose with 0,3% of glutamine (* p<0.1, ** p<0.01, ***p<0.001,
****p<0.0001). …………………………………………………………………………………………………………34
Figure 3.6 – Influence of glutamine in Candida parapsilosis biofilm formation ability. (1)
Total biomass quantification (1) and number of CFUs (2) values obtained from 24h
biofilms at 37º C grown in RPMI medium supplemented with 0.3% of glutamine
without glucose and 0.2% and 10% of glucose in presence (glucose) and absence
(glucose WG) of 0.3% of glutamine. ( ● reference strain and ● oral isolate). Error bars
xiv
represent standard deviation. Statically differences obtained when compared with
0.2% of glucose with 0.3% of glutamine (* p<0.1, ** p<0.01, ***p<0.001,
****p<0.0001)………………………………………………………………………………………………………….35
Figure 3.7 – Scanning electron microscopy of Candida species biofilms after 24 h. a)
Candida albicans ATCC 90028, b) Candidas albicans 324 LA/94, c) Candidas parapsilosis
ATCC 22019 and d) Candidas parapsilosis AD in RPMI medium 1) 0.3% of glutamine and
0% glucose, 2) 0.2% of glucose and 3) 10% of glucose. The bar in the images
corresponds to 20 µm. Magnification 1000x. …………………………………………………………….37
Figure 3.8 – Results of primer specificity , in DNA gel 1% of agarose, relatively to the
genes A) ACT1, B) FKS1 and C) BCR1 for the strains: 1) Candida albicans ATCC 90028,
2)Candida albicans 324 LA/94, 3)Candida parapsilosis ATCC 20019 and D) Candida
parapsilosis AD. …………………………………………………………………………………………………………38
Figure 3.9 – Results of BCR1 gene expression for (1) Candida albicans and (2) Candida
parapsilosis. (● reference strain and ● oral isolate). Error bars represent standard
deviation. Statically significant differences obtained when compared with the
expression levels for 0.2% of glucose RPMI medium (* p<0.1, ** p<0.01, ***p<0.001,
****p<0.0001). …………………………………………………………………………………………………………39
Figure 3.10 – Results of FSK1 gene expression for (1)Candida albicans and (2)Candida
parapsilosis normalized by the ACT1 housekeeping gene expression for each strain ( ●
reference strain and ● oral isolate). Error bars represent standard deviation.
Statistically significant differences obtained when compared with the expression levels
for 0.2% of glucose RPMI medium (* p<0.1, ** p<0.01, ***p<0.001, ****p<0.0001). .40
xv
List of Tables
1 – Introduction
Table 1.1 – Predisposing factors to oral candidosis ……………………………………………………5
Table 1.2 – Morphologic characteristics of Candida species (adapted from Calderone,
2002) ………………………………………………………………………………………………………………………….9
2- Matherials and Methods
Table 2.1 – Species and strains (reference and oral isolate) used under this work. …..23
Table 2.2 – Primers for Real-time PCR ………………………………………………………………………26

xvi
Nomenclature

xvii
Symbols
pH –hydrogen ion concentration
˚C – Celsium degrees
µm - Micrometer
ml – Milliliters
% - Percent
ml/min – milliliter per minute
cell/ml - cells per milliliter
rpm - rotations per minute
h – hour
min – minute
sec - seconds
µl – microliter
mn – nanometer
abs/cm2 – absorvance per square centimeter
Log CFU/ cm2 – Logarithm of the number of Colony formation units per square
centimeter
M – molar
mM – milimolar
g – gravity
p – significance value
xviii
Abbreviations
Abs – Absorvance
ACT1 – Actin 1
AIDS - acquired immunodeficiency syndrome
ALS – Agglutinin-like sequence gene
AMP - adenosine monophosphate
ANOVA – Analysis of varince
ATCC – American type culture collection
ATP - adenosine triphosphate
BCR1 – Biofilm cell wall regulator 1 gene
CaCl2 – Calcium chloride
cDNA – complementary Desoxyribonucleic acid
CO2 – carbon dioxide
CTP - cytidine triphosphate
CV – Crystal violet
DNA – Desoxyribonucleic acid
DNase - desoxirribonuclease
dNTP – Desoxynucleoside triphosphate
ECM – Extracellular matrix
EDTA - Ethylenediaminetetraacetic acid
EPA – Epithelial adhesin gene
GMP - Guanosine monophosphate
xix
GPI - Glycosyl-phosphatidylinositol
HIV - Human immunodeficiency virus
H2O – water
HWP1 – Hyphal Wall protein 1 gene
IgG - Immunoglobulin G
IgM – Immunoglobulin M
KH2PO4 - potassium dihydrogen phosphate
mRNA – messenger Ribonucleic acid
NCAC species – Non – Candida albicans Candida species
NAD - Nicotinamide adenine dinucleotide
NRT - negative real time control
PBS – Phosphate-buffered saline
PCR – Polymerase chain reaction
RNA – Ribonucleic acid
RNAase - Ribonuclease
RPMI – Roswell Park Memorial Institute culture medium
SDA - Sabouraud dextrose agar
SDS – Sodium dodecyl sulfate
SIgA – Salivary Immunoglobulin A
Tris-HCl -Tris-Hidrochloride
TAE - Tris-acetate-EDTA
w/V – weight per volume
1
1 - Introduction
This chapter consists on a general introduction in which is given a detailed context to the aim
of the work developed under this thesis. The latest information concerning Candida species
biology, epidemiology and biofilm formation is presented.

2
1.1 - Oral candidosis
Oral candidosis or oropharyngeal candidosis is an opportunistic mycosis of the oral
mucosa that, in more extreme cases, can evolve from a superficial infection to a
systemic and life threatening infection known as candidaemia (Murray, 1995). The
symptoms of candidosis often include local discomfort, an altered taste sensation,
dysphagia from esophageal overgrowth. Therefore, it results in a poor nutrition, slow
recovery and prolonged hospital stay. In extreme cases, the infection can spread
through the bloodstream or upper gastrointestinal tract leading to severe infection
with a significant morbidity and mortality rate. Moreover, immunocompromised
patients, such as HIV or cancer patients, and diabetes mellitus patients are also
specially proponent to candidosis in general (Akpan et al., 2002; Epstein, 1990; Guida,
1988; Hoeql et al., 1998). There is a diverse number of oral candidosis types. The most
common, and most easily diagnosed, is the pseudomembranous candidosis (Figure 1.1
A) or thrush, which accounts for at least a third of the cases. It is characterized by
extensive white pseudomembrane consisting of desquamated epithelial cells, fibrin,
and fungal hyphae (Akpan et al., 2002).
Figure 1.1 – Different aspects of Oral candidosis. A) Aspect of acute Pseudomembranous Candidosis or trush, the most easily
identifiable type of oral candidosis and tradicionally associated with this disease; B) Candida albicans colonies aspect seen
under light microscopy (adapted from Akpan et al. 2002).
A B

3
Accutic atrophic candidosis is associated with a burning sensation in the mouth
or on the tongue and is of difficult diagnosis, which is helped by a swab of the tongue.
Chronic hyperplastic candidiasis, is characterized by several white lesions that occur in
the buccal mucosa or lateral border of the tongue. However, because Candida species,
are not frequently isolated from clinical sites of the disease, it is believed that this
condition may be confused with others. Chronic atrophic candidiasis also known as
denture stomatitis is characterized by localized chronic erythema of tissues covered by
dentures. Lesions can also occur on the palate, upper jaw and mandibular tissue.
Median rhomboid glossitis is a chronic symmetrical area on the tongue anterior to the
circumvallate papillae. It is made up of atrophic filiform papillae. Angular cheilitis is an
erythematous fissuring at one or both corners of the mouth and is usually associated
with an oral candida infection.(Akpan et al., 2002)
1.1.1 – Causative agents of oral candidosis
Oral candidosis is caused by the overgrowth or infection of the oral mucosa by
a Candida fungus. Several species of Candida, like C. albicans, C. tropicalis, C.
parapsilosis and C. glabrata, among others, have been identified in the isolates of
clinical infection. These, however, are also commensal microorganisms that can be
found in the normal flora of humans, as the oral, gastrointestinal or rectal cavities, and
generally causes no problems to healthy people (Akpan et al., 2002; Hoeql et al., 1998;
Murray, 1995). They can also be found in environmental surfaces, and infections can
also originate from exogenous sources (Lass-Flörl, 2009). From sampling and isolation,
it has been determined that, in healthy adults and children, there was a median
carriage frequency of 34.4% in general of yeasts and from those, 17% were from C.
albicans alone. C. tropicalis, C. glabrata and C. parapsilosis followed in dominance
(Odds, 1988). Almost 50% of healthy and disease humans carrie commensally C.
albicans (Shimizu et al., 2007).
4
1.1.2 – Predisposing factors
Clinical observations suggested that nutritional factors can affect, either locally
or systemically, the pathogenicity of oral candidosis (Akpan et al., 2002;
Samaranayake, 2006). According to various studies, the presence of certain dietary
carbohydrates in the growth medium, can influence the superficial adhesion of the
yeasts, the development of biofilms, morphogenesis, enzyme production and activity
and growth over time (Samaranayake et al., 1982; Santana et al., 2013). Population
based surveillance of candidosis conducted in USA, Canada and Europe revealed that
the highest rates of the desease were registered to infants with less than 1 year of age
and in adults over the age of 65 have been reported in the US studies. It is also
documented a high incidence of candidosis among cancer patients and adults with
diabetes as well as the near universality of central venous catheters among patients
diagnosed with candidaemia (Pfaller et al., 2007). The widespread use of
broadspectrum antibiotics and invasive medical devices, the rising number of
immunocompromised and HIV patients, and the increase of the elder population have
contributed to the increase in the incidence of candidosis infections (Fanello et al.,
2001; Kojic et al., 2004; Silveira et al., 2007). The breach of the mucosal barrier or the
insertion of contaminated syringes can cause infection, by giving hematogenous access
to fungus. An insufficient salivary flow, for example, due to drug action, radiotherapy
or Sjgnören’s syndrome, diminishes the dilutional effect of saliva, and so, the removal
of these microorganisms from the mucosa as well as the effect of antimicrobial
proteins like lactoferrin, sialoperoxidase, lysozyme, hisitidine-rich polypeptides, and
specific anticandida antibodies that can be found in saliva (Akpan et al., 2002). Drugs,
such as inhaled steroids, are suspected of suppressing cellular immunity and
phagocytosis of the local mucosa (Akpan et al., 2002; Ellepola et al., 2001). The use of
dentures provides a microenvironment, in the denture fitting, with low oxygen, low pH
and an anaerobic environment, in which there is a reduced salivary flow. This, aided by
the great affinity of Candida species to acrylic and poor oral hygiene leads to
overgrowth and infection (Akpan et al., 2002; Henriques et al., 2004).

5
Table 1.1 – Predisposing factors to oral candidosis
Factor Description References
Age Under 1 year and above 65
years;
(Akpan et al., 2002)
(Douglas, 2003)
Immunodeficiency HIV patients;
Cancer patients including the
ones under chemotherapy;
Drugs;
Reduced salivary flow;
(Akpan et al., 2002)
(Douglas, 2003)
(Odds, 1988)
Invasive treatments Syringes;
Catheters;
Trauma cirurgy patients;
(Akpan et al., 2002)
(Wisplinghoff et al., 2004)
(Negri et al., 2011)
Oral sugars Reduced salivary flow;
Radiotherapy;
Signören’s syndrome;
Xerostemia;
Diabetes;
(Akpan et al., 2002)
(Hill et al., 1989)
(Silva et al., 2012)
(Andrés et al., 2008)
Dentures High adhesion to denture
surfaces;
Environment with low oxygen
and pH;
(Akpan et al., 2002)
(Henriques et al., 2004)
(Douglas, 2003)
1.1.3– Incidence rates
In the last decades, there has been a rise in the incidence of Candida infections.
The report of Epidemiologic surveillance of bloodstream infections, of 2010 by the
health quality department in Portugal, stated that 61.9% of all bloodstream fungal
infections were related to Candida alone (Pina et al., 2010). In the United States,
Candida infections are the fourth most common cause of all nosocomial bloodstream
infections, representing 8 to 10% of all bloodstream acquired in the hospitals (Pfaller
et al., 2007; Wisplinghoff et al., 2004). Population-based surveys, conducted in the US,
between 1996 and 2003, in several major cities as San Francisco, Atlanta showed an
6
incidence of 8 per 100000 population, while surveys conducted in Iowa, Baltimore and
Connecticut reported a incidence of 24 per 100000. Rates of 6-14 per 100000 have
been reported in average, across the country. In Europe, among the Nordic countries,
Norway, Finland and Sweden reported incidence of candidaemia around 3 per 100000
population whereas Denmark reports 11 per 100000 population. In the middle and
southern parts of Europe the UK, Scotland, Spain and Italy reported 1.2-6.4 per 100000
population. The results showed not only that the incidence rates are significantly more
superior in the United States than in Europe, but also that generally there was an
increase in the incidence rates over the years (Arendrup, 2010; Pfaller et al., 2007).
1.1.4 – Emergence of Candida Non-Candida albicans as pathogens
Despite of most of the candidosis infections being attributed to Candida albicans,
in the last three decades there has been an increase of cases caused by Non-Candida
albicans Candida (NCAC) species, such as C. parapsilosis, C. tropicalis and C. glabrata.
Brachiesi et al. reported that the frequency of isolation of NCAC from clinical sites,
raised from 3-4% in 1988-1989 to 16-18% 1990-1991 (Brachiesi et al., 1993). Masiá et
al realized that 21% of HIV patients with diagnosed candidiasis, were infected with
NCAC (Masiá et al., 1999). More recently, Ventura et al. while studying the species and
susceptibility in several candidaemia cases in a large Brazilian hospital, realized that
51.6% of the cases was caused by a NCAC pathogen (Ventura et al., 2004). Lass-Flörl, J
in a review about the changing epidemiology of fungal infections in Europe, reported
that despite of Candida albicans still be responsible for more than half the cases of
candidaemia in Europe, the number of NCAC species-related candidaemia cases are
rising. 14% of the cases were caused by C. glabrata or C. parapsilosis each and 7% of
them by C. tropicalis.(Lass-Flörl, 2009). Globally, C. albicans is still the major pathogen,
being related to 50-70% of the cases of invasive candidaemia worldwide, although
these values are lower than a few decades ago (Arendrup, 2010).
The causes for this change in Candida epidemiology may be related to an increase
in the incidence of Candida oral infections due to the advent of immunodeficiency
virus infection (AIDS), as well as immunosuppressive treatments for certain diseases,
as cancer, which debilitated the host immune control of commensal Candida
populations, leading to overgrowth. The advent of new medical procedures, the rise in

7
the use of invasive medical procedures and devices and the widespread use of broad-
spectrum antibiotics also contributed to an increase in Candida incidence.(Odds, 1988)
On the other hand, the development of new diagnostic technics that implemented
molecular and serological techniques into the identification of Candida, lead no only to
a more accurate diagnosis of the disease, which was mistaken for other similar
conditions, as well as a more accurate identification of Candida specie and
strain.(Calderone, 2002; Suzuki, 2002)
8
1.2 - Candida species: growth and metabolism
There are about 350 different species in the genus Candida, which belongs to the
Fungi kingdom. From those, however, only a small percentage is pathogenic to
humans, being 65% unable to grow at a temperature of 37˚C. Over the years, many
taxonomic changes led to not only the rename of some Candida species into new ones,
but also the addition of more elements to the family, recently discovered or
reclassified into new taxonomic branches. Initially, Candida species without a sexual
stage were classified as Deuteromycota. The species with a sexual stage, on the other
hand, belonged to the phylum of the Ascomycota. Later genetic studies proved a
phylogenetic relationship between the organisms that presented or not a sexual stage,
thus validating the alignment of Candida spp. among the Ascomycota. Besides the
genetic approach, there were other characteristics that distinguished Candida species
as Ascomycota, as the fact that they are urease negative, non-encapsulated,
fermentative, and non-inositol assimilative and the production of β-glucans into their
cell wall (Calderone, 2002; Kourkoumpetis et al., 2010; Odds, 1988).
1.2.1 – Growth forms of Candida species
Candida species generally grow as yeasts and most of them can also produce
hyphae or pseudohyphae (filamentous type of growth). The main difference between
hyphae and pseudohyphae is related to the way in which they are formed.
Pseudohyphae are formed form yeast cells or from hyphae by budding, but the new
growth remains attached to the parent cell and is elongate, resulting in filaments with
constrictions at the cell-cell junctions. There is no internal cross walls (septa)
associated with pseudohyphae. Pseudohyphae are chains of more or less elongated
yeast cells joined end to end. Budding occurs laterally, just behind the septa, the latter
of which are perpendicular to the main axis. True hyphae, however, forms from
existing cells or branches and grows by apical extension, firstly as a germ tube, and
later, cross walls are formed behind the growing tip of the hyphae (Calderone, 2002;
Gow, 2002).
Candida albicans is able to grow in yeast form but also to produce pseudohyphae
and/or true hyphae, being truly polymorphic (Calderone, 2002; Gow, 2002). Candida
9
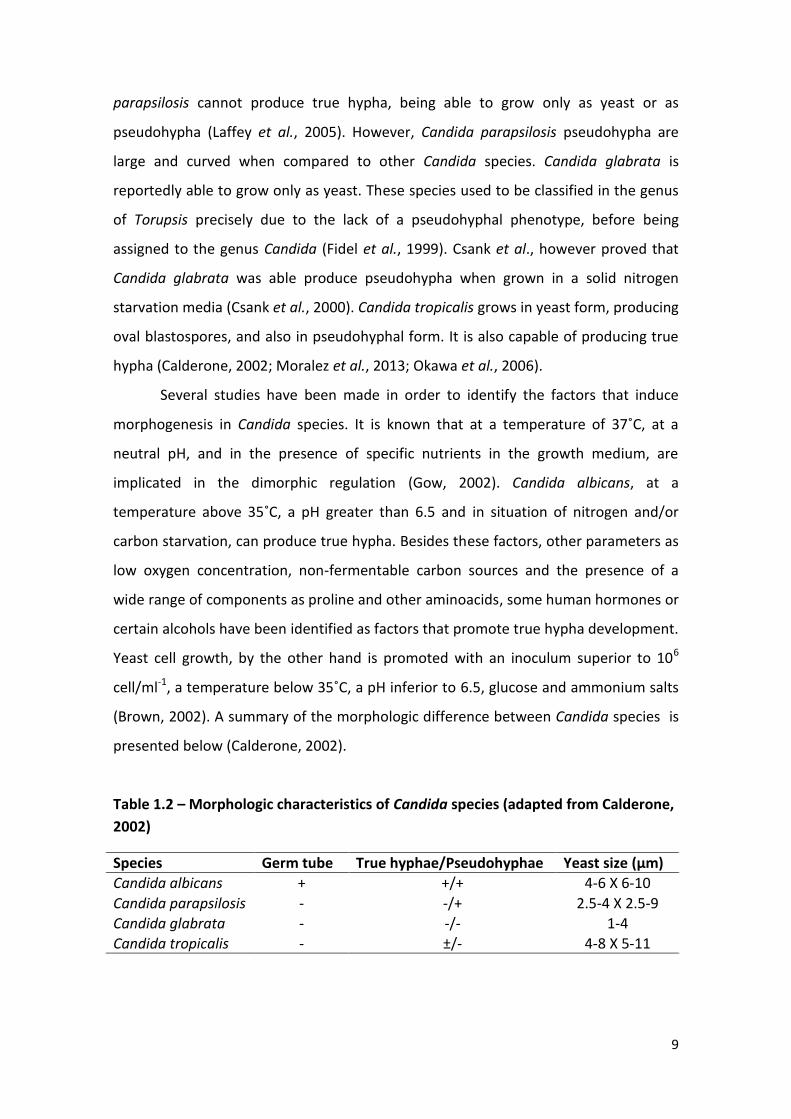
parapsilosis cannot produce true hypha, being able to grow only as yeast or as
pseudohypha (Laffey et al., 2005). However, Candida parapsilosis pseudohypha are
large and curved when compared to other Candida species. Candida glabrata is
reportedly able to grow only as yeast. These species used to be classified in the genus
of Torupsis precisely due to the lack of a pseudohyphal phenotype, before being
assigned to the genus Candida (Fidel et al., 1999). Csank et al., however proved that
Candida glabrata was able produce pseudohypha when grown in a solid nitrogen
starvation media (Csank et al., 2000). Candida tropicalis grows in yeast form, producing
oval blastospores, and also in pseudohyphal form. It is also capable of producing true
hypha (Calderone, 2002; Moralez et al., 2013; Okawa et al., 2006).
Several studies have been made in order to identify the factors that induce
morphogenesis in Candida species. It is known that at a temperature of 37˚C, at a
neutral pH, and in the presence of specific nutrients in the growth medium, are
implicated in the dimorphic regulation (Gow, 2002). Candida albicans, at a
temperature above 35˚C, a pH greater than 6.5 and in situation of nitrogen and/or
carbon starvation, can produce true hypha. Besides these factors, other parameters as
low oxygen concentration, non-fermentable carbon sources and the presence of a
wide range of components as proline and other aminoacids, some human hormones or
certain alcohols have been identified as factors that promote true hypha development.
Yeast cell growth, by the other hand is promoted with an inoculum superior to 106
cell/ml-1, a temperature below 35˚C, a pH inferior to 6.5, glucose and ammonium salts
(Brown, 2002). A summary of the morphologic difference between Candida species is
presented below (Calderone, 2002).
Table 1.2 – Morphologic characteristics of Candida species (adapted from Calderone,
2002)
Species Germ tube True hyphae/Pseudohyphae Yeast size (µm)
Candida albicans + +/+ 4-6 X 6-10
Candida parapsilosis - -/+ 2.5-4 X 2.5-9
Candida glabrata - -/- 1-4
Candida tropicalis - ±/- 4-8 X 5-11

10
1.2.2 – Metabolism of Candida species
Candida is a fungus and like other fungus, they are non-photosyntetic,
eukaryotic organisms, which obtain their energy by metabolizing several chemical
compounds. Glucose is the main carbon source of Candida spp. although they all are
capable of metabolizing others sugar as galactose and fructose (Calderone, 2002; Gow,
2002; Murray, 1995). Therefore polymeric sugars as lactose, sucrose and maltose, can
equally be metabolized by Candida spp. The breakdown of these organic compounds
allows the fungus to obtain energy in the form of ATP. Candida albicans is able to
assimilate and ferment a wide variety of sugar, except sucrose. Candida glabrata
ferments and assimilates only glucose and trehalose. C. tropicalis has the ability to
ferment and assimilate sucrose and maltose. Curiously, C. parapsilosis was firstly
include as a specie of Monilia, due to its inability to ferment maltose (Odds, 1988;
Trofa et al., 2008).
Candida metabolism happens mainly in two distinct pathways, in which occurs
conversion of glucose to pyruvate, with associated glucose formation. In the presence
of oxygen, pyruvate, enters the mitochondrial organelle and is decarboxylated in the
citric acid cycle, producing both ATP and CO2. In the absence of oxygen, pyruvate is
decomposed, by pyruvate decarboxylase in ethanol, CO2 and oxaloacetate. Candida
cells populations grow in aerobic conditions but cannot grow in anaerobic conditions.
However, grown populations of Candida species can adapt to anaerobic conditions
(Gow, 2002).
Glutamine is an aminoacid that plays an essential role for a variety of cell types
of the human organism, and a large number of tissues in the body. It acts as a
precursor for neurotransmissors, immune-function and acid-base balance, among
others. Is the most abundant extracellular aminoacid in vivo, being principally found, at
high concentrations, in the blood plasma and skeleton-muscle. It is used as alternative
energy source for several fast growing cells, as tumoral cells. (Aledo, 2004; Newsholme
et al., 2003) In Candida species, glutamine can act as nitrogen source, and is required
as a prominent precursor in several important pathways as the synthesis of
tryptophane, asparagine, histidine, phosphate, CTP, AMP, GMP and NAD (Gow, 2002;
Odds, 1988).

11
1.3– The oral cavity and the oral environment
In the oral cavity, there are several habitats characterized by different
physicochemical factors, in which proliferates a wide range of microbial communities.
This is partly due to the great anatomical diversity of the oral cavity and the
interrelationship between the different anatomic structures. The oral cavity possesses
both hard and soft tissues, namely, the tooth and the mucosa and in general, is a moist
environment at a relatively constant temperature (34 to 36˚C) and a pH close to
neutrality in most areas. The tooth is a hard surface, that offers many sites of
colonization, both above and below the gingival margin. The oral mucosa, on the other
hand, is a soft surface characterized of undergoing constant desquamation, which
allows the rapid elimination of adhering microorganisms. The mucosa covers the
cheek, the tongue, the gingiva, the palate and the floor of the mouth. However, it
varies according to the anatomical site. For example, in the palate the epithelium is
keratinized while in gingival crevice, it is not. The mucosal surfaces are bathed by
saliva, with the exception of the gingival crevice which is bathed by another
physiological fluid, the gingival crevicular fluid, which is an exudate originated from
plasma that baths only tooth and gingival from the junctional epithelium in gingival
crevice (Marcotte et al., 1998).
1.3.1 – Ecology of the oral cavity
The oral microbiota of the human mouth is composed by a wide and complex
variety of species. There are more than 300 species of bacteria alone, to which must be
added protozoa, yeasts, and mycoplasmas. This so high diversity of microorganisms
may be due to the great anatomical diversity of the mouth, which contributes to the
existence of a diverse number of different physicochemical niches. Specie distribution
varies quantitatively according to the habitat (Marcotte et al., 1998).
On the teeth, microorganisms form a dense mass called a dental plaque, which
consists of microbial communities organized in a complex matrix composed of
microbial extracellular products and salivary compounds. This plaque forms
preferentially on surfaces protected from friction as the area between two adjacent
teeth, the gingival crevice, or the bits and fissures on the upper surfaces of the tooth,

12
responsible by biting. The majority of the organisms isolated from dental plaque are
fermentative anaerobic gram-positive bacteria. Gram-negative bacteria may also be
isolated but in lower proportions (Marcotte et al., 1998).
The oral mucosa of the gingiva, palate, cheeks and mouth floor is colonized
with few organisms. Streptococci constitutes the highest portion of them. On the
mucosa of the tongue, a higher bacterial density and diversity is found (Marcotte et al.,
1998). Candida albicans primarily colonizes the tongue, flowing into the oral mucosa,
tooth surfaces, the biofilm and the saliva. Its pathogenic action is favored by local or
systemic changes (Silva et al., 2012). Comparatively, Candida glabrata has lower
keranocyte-adherence capacity, but higher adherence ability to surface of dentures,
thus possessing a lower capacity of adhesion and invasion of the oral mucosa (Li et al.,
2007). However, it has already been reported a high capacity of co-infection of human
oral epithelium of this specie with C. albicans (Silva et al., 2011). Both Candida
parapsilosis and Candida tropicalis have a great adherence and invasion capacity to
the oral epithelium (Meurman et al., 2007).
1.3.2 – Microbial growth-influencing factors
The growth of microorganisms, including Candida species in the oral cavity is
influenced by a great number of factors. These include temperature, oxidation-
reduction potential, pH and the availability of nutrients (dietary sugar intake), water,
the anatomy of oral structures, salivary flow, and antimicrobial substances. Each factor
in a given oral habitat influences the selection of oral microorganisms (Meurman et al.,
2007).
1.3.2.1 – Temperature
The temperature of the oral mucosa is relatively constant (34 to 36˚C), which
allows a wide range of microorganisms to grow. The temperature may be more
variable on the mucosal and tooth supragingival surface. During food intake,
microorganisms colonizing these sites are exposed to hot and cold meals and probably
must adapt to these extreme variations of temperature (Meurman et al., 2007).
13
1.3.2.2 - pH
The pH or hydrogen ion concentration of an environment affects
microorganisms and microbial enzymes directly and also influences the dissolution of
many molecules that indirectly influence microorganisms. Microorganisms generally
cannot tolerate extreme pH values. In the oral cavity, the pH is maintained near
neutrality (6.7 to 7.3) by saliva. The saliva contributes to maintenance of the pH by two
mechanisms. First, the flow of saliva eliminates carbohydrates that could be
metabolized by bacteria and removes acids produced by bacteria. Second, acidity from
drinks and foods, as well as from bacterial activity, is neutralized by the buffering
activity of saliva. Bicarbonate is the major salivary buffering system of saliva, but
peptides, proteins, and phosphates are also involved. Increases in pH also result from
bacteria that metabolize saline and urea into ammonia. Acids that are produced by the
microbial metabolism of carbohydrates may accumulate in dental plaque because of
the slow diffusion of saliva through it. Following sugar intake, the pH of dental plaque
may decrease to below 5. A high concentration of sugar in the oral environment, due,
for example, to frequent sugar intake leads to the growth of acidosis bacteria whose
carbon metabolism may result in a decrease of the environment pH (Marcotte et al.,
1998). Candida species carbohydrate metabolism also result in acid production
(Samaranayake, 2006).
1.3.2.3 – Dietary sugar intake
Microorganisms living in the supragingival environment have access to nutrient
from endogenous sources or exogenous sources. Several components in saliva, as
water, carbohydrates, glucoproteins, proteins, aminoacids and various ions as
potassium, calcium, chloride, bicarbonate and phosphate, are important nutrients to
Candida species development. Moreover, exogenous, dietary carbohydrates and
proteins have the greatest influence on the composition of the oral microbiota
(Marcotte et al., 1998). Exogenous glucose is rarely found in food in its single
molecular form, being found in most dietary carbohydrates, either as their only
building block, which is the case of starch and glycogen, or associated with other
monosaccharides as fructose and galactose, forming respectively sucrose and lactose.
Grain product such as bread, past, cereals and rice, fruits and vegetables, milk and
14
duiary products, meat, table sugar, honey among others are foods that contain glucose
(Konig, 2000; Samaranayake, 2006). Glutamine can also be found in the composition of
the aforementioned foods, besides existing on saliva, in residual concentrations, due
to the contributions of the crevicular fluid from blood.
Glucose concentration in saliva may vary due to several factors that may
include food intake, mastication, salivary flow, oral hygiene and diabetes. Salivary
glucose concentration after the drinking of a glass of water is around 1.38% a value
that increases on diabetics to 3.37%, in gram per liter, to man and woman alike. During
physiologic operations in the mouth as mastication, the salivary flow increases and the
glucose concentration of saliva in the oral environment may decrease or even increase
(Jurysta et al., 2009). In fasting conditions, the glucose level in saliva is estimated to be
1.23% for healthy individuals, and 4.22% in diabetic individuals. Age and gender do not
appear to be relevant. However, the blood-serum glucose concentration has a direct
relation to the salivary glucose concentration (Abikshyeet et al., 2012). Panchbhai et al.
estimated a glucose concentration of 6.66% for individuals with controlled diabetes,
8.11% for individuals with uncontrolled diabetes and 1.98% for healthy individuals
after saliva swallowing (Panchbhai, 2012). A decreased salivary flow rate in diabetes
mellitus individuals, can lead to an higher accumulation of sugars in the oral cavity
(Jawed et al., 2011). Cases of xerostemia, or dry mouth, are common among diabetic
individual, and are directly associated with low salivary flow rates. The normal
unstimulated flow rates are about 0.3 to 0.4 ml/min. In stimulated flow rate, as in
mastication, the flow rate increases to 1 to 2 ml/min in normal conditions and in
diabetes patients without xerostomia, those values decreased considerably to 0.12
ml/min in unstimulated conditions, being equal to the minimum acceptable to the
stimulated flow. In such conditions, healthy people, would complain of dry mouth. In
the cases of xerostemia diabetic patients, the salivary flow rates were abnormally low,
with values from 0 to 0.05 ml/min (Sreebny et al., 1992).
15
1.4 - Candida species biofilm formation
Pathogenic Candida species have an already known number of virulence
factors. The ability to adhere to medical devices and/or host cells, biofilm formation,
dimorphism and secretion of hydrolytic enzymes, such as proteases, phospholipases
and lipases, and haemolysins (Silva et al., 2009; Yanq, 2003). This allows the
microorganism to colonize the tissue, to degrade it, and to gain access to the blood
stream and nutrients. Biofilm formation, particularly, occurs after initial attachment of
the fungus to the host cells and/or medical devices. Cells then divide, proliferate and
subsequently, biofilm is formed. Biofilms are described as surface associated
communities of microorganisms embedded within an extracellular matrix. It confers
significant resistance to antifungal therapy by limiting the penetration of substances
through the matrix and protecting cells form host immune responses. High mortality
rates have been associated with strains of C. albicans, C. parapsilosis, C. tropicalis, and
C. glabrata capable of forming biofilms, when compared with strains incapable of
forming biofilms (Silva et al., 2011).
1.4.1 – The first steps of biofilm formation
Cell adherence to the host cell, or abiotic medical device surface is the first step
in the infection by Candida spp. From surface adhesion, the cell proliferates and can
potentially form biofilms. It is in the cell wall of the Candida spp. that physicochemical
interactions with some specific components with host/abiotic surface can occur. Some
cell wall glycoproteins or polyssacharides are directly involved in surface adhesion
(Calderone, 2002; Silva et al., 2011). In C. albicans there is a family of nine proteins,
encoded by genes of the ALS family, that can adhere to endothelial and epithelial
cells.(Hoyer, 2001) Hwp1, is a hypha cell wall protein linked by a GPI anchor to the cell
wall, that is capable of linking small proline rich proteins, found in the surface of C.
albicans, to the keratinized surface of the human mucosa (Hoyer, 2001). C. glabrata
possesses a family of 23 proteins, that is encoded by the EPA gene family, and that are
capable of mediating adherence to epithelial cells (Kaur et al., 2005).
Hydrophobicity of the yeast cell surface is another determining factor for a
successful surface adherence. The initial adhesion of C. parapsilosis cells is associated

16
with surface hydrophobicity. It was demonstrated that these species had a greater
ability to adhere to epithelial cells and acrylic than C. albicans (Panagoda et al., 2001).
Hazen et al. demonstrated that there was comparable degree of hydrophobicity
between, a limited number of isolates of C. albicans and C. glabrata when grown in
specific conditions (Hazen et al., 1986). Contradictorily, however, Kikutaní et al.
demonstrated that in some growth conditions there was a high variability of the
hydrophobicity of C. albicans while the hydrophobicity of several isolates of C. glabrata
remained relatively constant (Kikutani et al., 1992). Once adhered to the epithelium,
Candida species have the ability to secrete enzymes, proteases and phospholipases
that contribute to tissue invasion by this species. Secreted aspartyl proteinases
possessed the capability of degrading important immunological and structural defense
proteins, disrupting the host mucosal barrier and invading the human epithelium.
Phospholipases are capable of degrade phospholipid into fatty acids, damaging also
host-cells membranes and increasing the ability to invade and damage the human
tissues (Silva et al., 2011).
1.4.2 – Biofilm formation
Biofilm formation is a virulence factor of Candida albicans, Candida
parapsilosis, Candida glabrata and Candida tropicalis species and is linked to the high
mobility and mortality (Negri et al., 2012; Negri et al., 2011; Silva et al., 2009; Silva et
al., 2010; Silva et al., 2011). Biofilm formation begins by the adhesion of the cells to a
surface, through the mechanisms previously described. The cells proliferate, and not
much later, distinct microcolonies are formed. If the species are able to form true
hyphae, then the first germ tubes start forming after 3-6h (Chandra et al., 2001;
Hawser et al., 1994). After 12-14h, the cell colonies, who have grown and aggregated,
began to be covered by the extracellular matrix (ECM) produced by the cells (Chandra
et al., 2001). After 18-24h, the population increased to high number being composed
by yeats, pseudohypha, or hypha. Until 48h the biofilm is considered mature,
producing higher quantities of the ECM (Hawser et al., 1994). It is assumed that the
formation of mature biofilms and subsequent production of extracellular matrix is
strongly dependent upon species, strain, and environmental conditions as pH, medium
composition and oxygen availability.

17
Candida albicans biofilm formation is associated with the dimorphic switch
from yeast to hyphal growth (Donlan et al., 2002). Invasive C. albicans strains form
more biofilm than non-invasive strains, but the metabolic activity of the biofilms of
non-invasive strains is higher. Candida albicans has a greater ability to form biofilm
than other Candida species, such as Candida parapsilosis. Candida parapsilosis biofilms
in general are smaller and produce less ECM than C. albicans biofilms. In contrast to C.
albicans, C. parapsilosis biofilms are thinner, less structured, and consist exclusively of
aggregate blastospores (Kuhn et al., 2002). Interestingly, however, biofilms formed by
several different clinical-isolated strains of C. parapsilosis presented a great
heterogeneity in biofilm formation. Oral isolates of C. parapsilosis are actually more
capable of forming biofilms than several strains of C. tropicalis and C. glabrata (Silva et
al., 2009). Candida parapsilosis cells are able to form biofilms in a diversity of clinical
medical devices when exposed to higher glucose concentration, having a great
prevalence in bloodstream infections and parental nutrition patients (Kuhn et al.,
2002; Trofa et al., 2008). Therefore, in growth media containing higher concentrations
of glucose and/or lipids, C. parapsilosis has an expeditious capacity of forming biofilms.
The selective preference of this species for plastic medical devices is of particular
interest, as biofilm formation enhances the capacity of the organism to colonize
catheters and intravascular cellular lines (Trofa et al., 2008). Candida tropicalis clinical
isolates have been classified as being strong biofilm formers, and the biofilm formation
seems to be homogenic between different strains (Negri et al., 2011; Silva et al., 2009).
Candida glabrata biofilm formation ability has been reported to be more reduced
when compared with other Candida species, when grown in rich culture media. Biofilm
formation ability also appears to be homogeneous between different strains of this
specie (Silva et al., 2009).
1.4.3 – Candida species biofilm structure and composition
The biofilm matrix is composed, in generally by carbohydrates, glucose,
proteins, hexosamine, phosphorus and uronic acid. Candida albicans biofilms are
composed mainly by carbohydrates and glucose, and small amounts of protein,
hexosamine, phosphorus and uronic acid. C. tropicalis biofilms consisted mainly in
hexosamine, with small amounts of carbohydrates and glucose, protein and
18
phosphorus (Al-Fattani et al., 2006). Comparatively to other NCAC species, C. tropicalis
has the lower amount of both protein and carbohydrate. However, the quantitative
composition of the biofilm for this specie is strain dependent. Candida parapsilosis
biofilms composition is strain dependent having, in general, high amounts of
carbohydrates, and low amounts of protein (Silva et al., 2009). Candida glabrata
biofilms have relatively high amounts of carbohydrates and protein, being the protein
levels several times higher than those from C. albicans and C. parapsilosis (Silva et al.,
2009).
Candida albicans biofilm structure involves, generally, two distinct layers: a
thin, basal yeast layer and a thicker, less compact hyphal layer (Donlan et al., 2002).
The basal layer is covered by a thick, biphasic matrix consisting of extracellular
components comprised of cell-wall like compounds and abundant hyphal elements. C.
parapsilosis biofilms are shallower, less thick and less compling than C. albicans
biofilms (Kuhn et al., 2002). They consisted only on a non-continuous aggregate of
cells. However, the biofilm structure for this species is highly strain dependent, and
some oral isolates biofilms, not only are constituted by a thick layer of aggregated
yeast and pseudohyphal cells, but also presented a multilayered and compact
structure that covers the entire surface(Silva et al., 2009). C. tropicalis biofilms were
also strain dependent with some strains possessing a thick biofilm of co-aggregated
cells, sometimes with particularly long hyphal elements, while for other strains
biofilms were a discontinuous monolayer of yeasts anchored to the surface. Candida
glabrata biofilms were either a thick multilayer biofilm structure or clusters of several
cells. This one was valid for C. glabrata ATCC 2001 strain and C. glabrata D1 strain
(Silva et al., 2009).

19
1.6 - Genes BCR1 and FSK1
One key component present in Candida albicans and Candida parapsilosis
biofilms is β-1,3 glucan. It is one of the main components of the cell wall of Candida
species, being synthesized by a membrane-bound enzyme, the β-1,3 glucan synthase
from UDP-D-glucose (Chauhan et al., 2002). The UDP-D-glucose forms from glucose
combination with phosphate and later with urydil transferase (Lee et al., 2003). β-1,3
glucan synthase is a transmembranar, multisubunit enzyme complex, which is
activated by GTP, and has been fractionated into two components, the GTP-bound
component and the membrane bound component, also known as catalytic
component. The catalytic component is encoded by two isogenes, the FKS1 and the
FKS2 (Chauhan et al., 2002).
Three enzymes are involved in the delivery and incorporation of β-1,3 glucan
from the cell wall to the biofilm matrix. BGL2p glucanosyltransferase, the PHR1p
glucnaosyltransferase e a XOG1p glucanosyltransferase. It is supposed that these
enzymes release and modify cell wall glucan for deposition in the extracellular space.
An alternative explanation is that the enzymes act in the extracellular space,
contributing to steric changes in glucan that are important for mature matrix
organization and function. Deletions in the PHR1 gene reduce cell adhesion and biofilm
formation. Deletion in the genes PHR1, XOG1 and BLG2 reduce up to 10-fold the
glucan concentration in the matrix. It also, augments biofilm susceptibility to
antifungal agents, and fluorescence test proves that in the gene deletion cases the
biofilm capability to sequester the drugs, which supports the idea that this proteins
have a key role in glucan incorporation (Taff et al., 2012).
The pathway is ilustrated in figure 2. Basically, the three enzymes, Bgl2, Xog1
and Phr1 have a complementary role in glucan modification. The process of glucan
modification involves glucan hydrolysis and the formation of new branch linkages. This
enzymes act independently of previously identified Zap1, a transcription factor known
to function in matrix production. The overall expression of the ZAP1 gene have no kind
of relation with XOG1, PHR1 or BGL2 gene expression (Taff et al., 2012).

20
Figura 1.2 – Model for glucan matrix production and delivery to the biofilm matrix. β-1.3-glucan production occurs at the FSK1p cell membrane-bound protein.. The glucan is then modified and incorporated into the cell wall and extracellular matrix. It is proposed that PHR1p, BGL2p and XOG1p act in complementary form and indenpendently from another described pathway form glucan incorporation in the biofilm matrix, the ZAP1p matrix pathway. Matrix glucan are highlited in purple. The cell wall glucan are grey colored The balck arrows represent the pathway taken by glucan from synthase product to the modified sugars that are incorporated into the biofilm matrix. Circles represent modification or production enxymes (adapted from Taff, et al.).
BCR1, or Biofilm Cell wall Regulator 1, is a fungal transcription factor required
for biofilm formation in C. albicans and C. parapsilosis. The expression genes that
encode some important adhesins as proteins of the ALS family or protein from the
HWP family, are regulated by the BCR1 gene. Thus gene is involved in the initial
adhesion of the cell to the surfaces. Gene deletion studies were performed in both C.
albicans and C. parapsilosis strains. As referred previously, C. parapsilosis can form a
thick layered biofilm. When the BCR1 gene is deleted, biofilm formed is very sparse
and thin. In Candida albicans the same phenomenon was observed. Thus it was safe to
conclude that BCR1 gene expression is directly related to the biofilm forming ability of
C. albicans and C. parapsilosis (Ding et al., 2011).

21
1.7 – Aim
Oral candidosis is an opportunistic infection of the oral cavity caused by the
overgrowth of Candida species on the oral mucosa. This infection can develop into a
systemic and very dangerous disease named candidaemia, being a most common case
in immunocompromised patients. C. albicans is regarded as the most prevalent species
involved in oral candidosis. However in the last three decades, there has been a rise in
the prevalence of Non-Candida albicans Candida species in clinical sites with C.
parapsilosis, C. glabrata and C. tropicalis being identified as other common pathogens.
Candida species normally exists as commensal organisms in the oral epithelium but
some predisposing factors such as diet, age, diabetes among others, can, somehow,
turn those commensal microorganisms into pathogenic agents.
The oral cavity is a warm and moist environment, constituted by different
structures that create very different habitats in which a large a diverse community of
microorganisms lives.. Candida species use glucose as main carbon source, although
they can survive in the presence of nitrogen-only sources as glutamine. These
elements can be provided either from endogenous sources, by saliva, or exogenous
sources through food. When food is being processed in the mouth, glucose levels
present in the environment can increase up to 10 times. Generally a healthy salivary
flow reduces glucose concentration, overtime, but in some diseases, as diabetes, the
salivary flow is significantly reduced and glucose basal oral concentration increases.
The ability to form biofilm is one of the most important virulence factors of
Candida species as it allows the cell to survive in protected communities against
starvation, host immunological action and drug therapy. BCR1 is a transcription factor
required for biofilm formation. One of the components of the biofilm structure is β-1,3
glucan, produced by a cell-membrane bound enzyme encoded by the FKS1 gene.
Therefore, the aim of this work was to understand the effect of glucose concentration
and presence of the aminoacid L-glutamine on Candida species biofilm formation, and
its effect in the mentioned biofilm related genes expression.
22
2 – Materials and Methods
This chapter addresses the techniques and conditions used in this work. Firstly the selected
species and strains of Candida are enumerated, as well as, the growth conditions for each
assay. Then the analysis techniques and procedures are described, from biofilm biomass
quantification, to cell viability assays, structure study and genetic expression.

23
2.1 - Organisms
A total of 8 strains, a reference strain and an oral isolate of Candida albicans,
Candida parapsilosis, Candida glabrata and Candida tropicalis were used under this
work (Table 2.1). The oral isolates (Candida albicans 324 LA/94, Candida parapsilosis
AD, Candida tropicalis T2.2 and Candida glabrata D1), were obtained from the Biofilm
group of the Center of Biological Engineering, and were originally isolated from Clinic
of Dentistry, Congregados, Portugal. The reference strains used belonged to the
American Type Culture Collection.
Table 2.1 – Species and strains (reference and oral isolate) used under this work.
Specie Strain
Candida albicans Candida albicans ATCC 90028
Candida albicans 324 LA/94
Candida parapsilosis Candida parapsilosis ATCC 22019
Candida parapsilosis AD
Candida glabrata Candida glabrata ATCC 2001
Candida glabrata D1
Candida tropicalis Candida tropicalis ATCC 750
Candida tropicalis T 2.2
2.2 - Growth conditions and media
For each assay, strains were subcultured on sabouraud dextrose agar (SDA)
(Merck, Darmstadt, Germany) for 48h at 37˚C, and then inoculated in sabouraud
dextrose broth (SDB) (Merk, Darmstadt, Germany) for 18h at 37˚C under agitation at
120 rpm (overnight). After incubation, cells were harvested by centrifugation at 3000 g
for 10 min, and washed twice in PBS (Phosphate-buffered saline 0.1 mM pH 7).
Pellets were ultimately ressuspended in RPMI medium (SIGMA-Aldrich), and
cellular concentration adjusted to 1x10⁷ cells/ml using a Neubauer counting chamber.
The RPMI medium used changed depending on the condition tested. Ten different
RPMI mediums were used. To study the effect of the increase of glucose concentration
on biofilm formation by the referred species of Candida the mediums used were RPMI
with 0.3% of glutamine and increasing concentrations of glucose: 0.2%,
1%,2%,3%,4%,5% and 10% (w/V). To acess the role of glutamine on biofilm formation
RPMI medium with 0.3% of glutamine and no glucose and RPMI with no glutamine and
with 0.2% and 10%of glucose were also tested.
24
2.3 - Biofilm formation
The 1x10⁷ cell/ml suspensions previously prepared, were plated into selected
wells of 96-wells polystyrene microtiter plates (Orange Scientific, Braine-l’ Alleud,
Belgium) and incubated at 37˚C on a shaker at 120 rpm for 24 h. The medium was then
aspirated and non-adherent cells removed by washing the biofilms twice with PBS.
2.3.1 - Biofilm quantification
Quantification of total biomass was used to access the biofilm forming ability of
each strain, at a given condition. Total biomass was quantified by cristal violet (CV)
staining. Briefly, after washing with PBS, the biofilms were fixed by pipeting 200µl of
methanol into each well. After 15 minutes of contact, the methanol was removed and
the wells were allowed to dry at room temperature. Then, 200µl of CV (1% v/v) were
added to each well, and the plates incubated for 5 min. The CV was removed, and the
wells were gently washed twice with distilled water, and 200 µl of acetic acid was
added to each well, to release and dissolve the stain. The absorbance of the obtained
solutions were read in triplicate in a microtiter plate reader (Bio-Tek, Synergy HT, Izasa,
Lisbon, Portugal) at 570 nm. Three or more (when necessary) assays were performed.
The results were presented as abs values/cm2.
2.3.2 - Biofilm cells viability
Cell viability was determined by counting colony formation units (CFUs)
following the ressuspension of biofilm cells. After washing the plate wells with PBS, for
each condition, biofilm was detached by scraping with a sterile pippete tip and
ressuspended in 200µl of PBS. After biofilm detachment, the PBS from all 3 wells was
collected into a single collecting tube and another 100µl of PBS were pipetted into
each well, for further scraping. The ressuspended biofilm (900 µl), was vigorously
vortexed for 5 min to disrupt the biofilm matrix and serial decimal dilutions were
plated onto SDA. The agar plates were incubated for 24 h at 37˚C (overnight), and the
colonies enumerated. The results were presented as the total CFU per area unit (Log
CFU/ cm2). Three or more, whenever necessary, independent assays were performed.
25
2.3.3 - Biofilm structure analysis
To examine the structure of biofilms by scanning electron microscopy 2 ml of
the cell suspensions of Candida albicans and Candida parapsilosis strains(1x10⁷ cell ml
in the several previously referred RPMI mediums) was introduced into 24-wells
polystyrene plates (Orange Scientific) and incubated for 24 h at 37 C. Then, the
medium was aspirated and non-adherent cells removed by washing the biofilms twice
with PBS. Samples were dehydrated with alcohol (using 70% ethanol for 10 min, 95%
ethanol for 10 min and 100% ethanol for 20 min), air dried and kept on a desiccator.
The base of the wells were then removed from the plate and mounted onto aluminum
stubs, sputter coated with gold and observed with an S-360 scanning electron
microscope (Leo, Cambridge, USA).
2.4 - Gene expression analysis
BCR1 and FSK1 gene expression was assessed for Candida albicans ATCC 90028,
Candida albicans 324 LA/94, Candida parapsilosis ATCC 22019 and Candida
parapsilosis AD cells from biofilms grown in RPMI medium with 0.2% and 10% glucose
and 0% of glutamine, and in RPMI medium with 0.3% of glutamine and 0% of glucose.
2.4.1 - Primer design
Real-time PCR was used to determine the relative expression level of FSK1 and
BCR1 gene comparatively to the ACT1 used as a candida housekeeping gene, in RNA
transcripts. The primers were designed using Primer 3 web-based software
(http://fokker.wi.mit.edu\cgibin\primer3\primer3_www.cgi) and are listed in table 2.2.
In order to verify the specificity of each primer pair for its corresponding target gene,
PCR products were firstly amplified from C. albicans ATCC 90028 and C. parapsilosis
ATCC 22019 genomic DNA. Control ACT1 primers were also used to detect human
recombinant DNA.
26
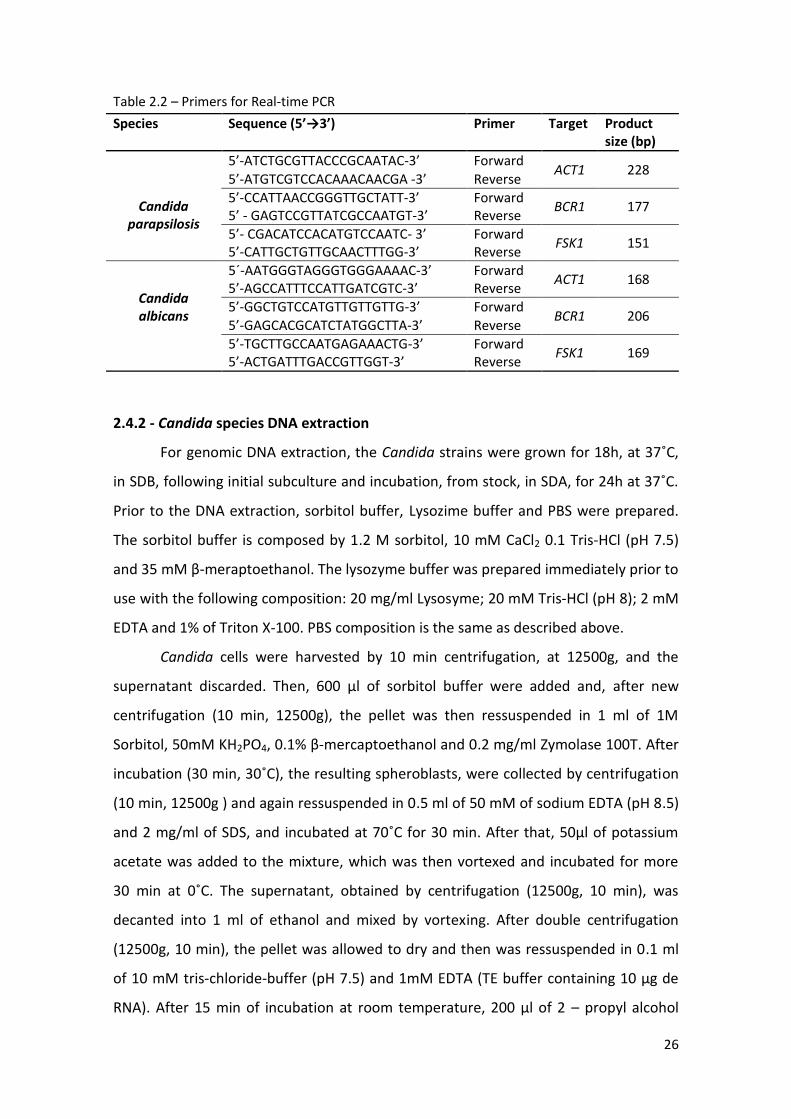
Table 2.2 – Primers for Real-time PCR
Species Sequence (5’→3’) Primer Target Product size (bp)
Candida
parapsilosis
5’-ATCTGCGTTACCCGCAATAC-3’ Forward ACT1 228
5’-ATGTCGTCCACAAACAACGA -3’ Reverse
5’-CCATTAACCGGGTTGCTATT-3’ Forward BCR1 177
5’ - GAGTCCGTTATCGCCAATGT-3’ Reverse
5’- CGACATCCACATGTCCAATC- 3’ Forward FSK1 151
5’-CATTGCTGTTGCAACTTTGG-3’ Reverse
Candida albicans
5´-AATGGGTAGGGTGGGAAAAC-3’ Forward ACT1 168
5’-AGCCATTTCCATTGATCGTC-3’ Reverse
5’-GGCTGTCCATGTTGTTGTTG-3’ Forward BCR1 206
5’-GAGCACGCATCTATGGCTTA-3’ Reverse
5’-TGCTTGCCAATGAGAAACTG-3’ Forward FSK1 169
5’-ACTGATTTGACCGTTGGT-3’ Reverse
2.4.2 - Candida species DNA extraction
For genomic DNA extraction, the Candida strains were grown for 18h, at 37˚C,
in SDB, following initial subculture and incubation, from stock, in SDA, for 24h at 37˚C.
Prior to the DNA extraction, sorbitol buffer, Lysozime buffer and PBS were prepared.
The sorbitol buffer is composed by 1.2 M sorbitol, 10 mM CaCl2 0.1 Tris-HCl (pH 7.5)
and 35 mM β-meraptoethanol. The lysozyme buffer was prepared immediately prior to
use with the following composition: 20 mg/ml Lysosyme; 20 mM Tris-HCl (pH 8); 2 mM
EDTA and 1% of Triton X-100. PBS composition is the same as described above.
Candida cells were harvested by 10 min centrifugation, at 12500g, and the
supernatant discarded. Then, 600 µl of sorbitol buffer were added and, after new
centrifugation (10 min, 12500g), the pellet was then ressuspended in 1 ml of 1M
Sorbitol, 50mM KH2PO4, 0.1% β-mercaptoethanol and 0.2 mg/ml Zymolase 100T. After
incubation (30 min, 30˚C), the resulting spheroblasts, were collected by centrifugation
(10 min, 12500g ) and again ressuspended in 0.5 ml of 50 mM of sodium EDTA (pH 8.5)
and 2 mg ml of SDS, and incubated at 70˚C for 30 min. After that, 50µl of potassium
acetate was added to the mixture, which was then vortexed and incubated for more
30 min at 0˚C. The supernatant, obtained by centrifugation (12500g, 10 min), was
decanted into 1 ml of ethanol and mixed by vortexing. After double centrifugation
(12500g, 10 min), the pellet was allowed to dry and then was ressuspended in 0.1 ml
of 10 mM tris-chloride-buffer (pH 7.5) and 1mM EDTA (TE buffer containing 10 µg de
RNA). After 15 min of incubation at room temperature, 200 µl of 2 – propyl alcohol
27
was added and the mixture was clarified by centrifugation. The pellet was
ressuspended in TE buffer, and stored at -70˚C, for further use.
2.4.3 – Primer specificity assessment
To access primer specificity, a traditional PCR was run for the DNA previously
extracted (see section 2.4.2) and for all selected genes (Table 2.1). Briefly, to each gene
and each strain of the respective specie, 1µl of DNA sample was collected and 1µl of
primer reverse, 1µl of primer forward as well as 12,5µl of Nzytech® Master Mix (2x)
were added. Then the following PCR protocol was run: an initialization step at a
temperature of 95˚C during 5 min, then the denaturation step at 95˚C during 30 sec,
following the annealing step 55˚C for 30 sec and the elongation step at 72˚C during
another 30 sec. The last three steps were repeated thirty times. Meanwhile, an 1%
agarose gel was prepared in 100 ml of TAE buffer (1x) with 2.5 ml of SYBR® Safe. After
PCR conclusion and sample cooling, to selected wells of the agarose gel was added 5µl
of sample (PCR amplification product) and 1µl of SYBR® Green. For each strain a
negative control was made. Electrophoresis was run on an horizontal lucite slab gel
apparatus. The results were accessed using the Nzytech® V DNA molecular weight
marker.
2.4.4 - Candida species RNA extraction
For RNA extraction, biofilm cells were cultured in the above referred RPMI
mediums. Those cells were then collected: the biolfilm cells by washing with PBS and
scraping; the planktonic by centrifugation (8000g, 5 min). Cells were disrupted by
sonication (velocity 6.5 of intensity during 35 seconds, twice), in RNAase free
eppendorfs in presence of glass beads. After centrifugation (14000 rpm, 5 min), the
supernatant was collected and an equal volume of etanol 70% (v/v) RNase-free was
added. RNA was purified with PureLink RNA Mini Kit®(Invitrogen). Briefly, 500 µl of the
mix was transferred for the “Spin Cartridge” column, of the Mini Kit, and then
centrifuged at 12000g for 15 sec. This was repeated and then the column was washed
with wash buffer I (700 µl).The collection tube, was discarded and replaced by a new.
The column was then washed with wash buffer II (500 µl) and the content of the
collection tube was discarded (this step repeated one more time). After centrifugation
28
(12000g, 1 min) at room temperature, the column dried and was transferred for the
“recovery tube” supplied with the Mini Kit. About 50 µl of RNase-free water was
added, directly on the center of the column, which incubated at room temperature for
2 min, being later centrifuged (12000g, 1 min). The RNA, now diluted in the recovery
tube in RNase free-water, was treated with DNase I treatment (Deoxyrybonuclease I,
Amplification Grade, Invitrogen), being added to each 10µl of sample 1µl of DNase I,
Amplifiation grade. The sample was then inubated for 15 min, at room temperature. In
order to deactivate DNase, 1µl of EDTA 25 mM (for each 10µl of sample) was added
and the mixture was incubated for 10 min at 65˚C. RNA concentration was determined
by optical density measurement, in the reason 260/280 in a nanodrop apparatus
(NanoDrop 1000 Spectrophotometer Thermo Scientific®).
2.4.5 - cDNA synthesis
From the RNA obtained, cDNA was produced by adding 8 µl of 5x iscript
Reaction Mix, 2µl of iScript reverse transcriptase and 20µl of Nuclease-free water, with
a final reaction volume of 40 µl. The synthesis of cDNA was performed at 42˚C for 30
min and the reaction was stopped by heating at 85˚C.
2.4.6 - Quantitative Real-time PCR
In order to optimize the temperature, the cDNA previously obtained was
diluted ten times in RNAase free water, and added (4µl), of an 96-wells microtiter
plate, in which there already was 10 µl of Supermix (SYBgreen), 4.8 µl H2O RNAase
free, 0.6 µl primer forward and 0.6 µl primer reverse. For each cDNA sample added, an
RNA sample, from the same source, was added too, for negative control (NRT). Then a
RealTime-PCR protocol was run and the optimal annealing temperature determined,
with a difference between the threshold value of cDNA and RNA superior to 10 cycles.
Each reaction mix consisted of the working concentration of Power SYBR®
Green master mix (Applies Biosystems), 300 nM of forward and reverse primers, and 1
µl of cDNA, in a final volume of 20 µl. Negative control (water), were included in each
run, as well as NRT controls, and genomic DNA decimal dilutions. The relative
quantification of FSK1 and BCR1 gene expression was performed by ACT (threshold
cycle) method, using the values for the housekeeping gene to normalize the data. Each

29
reaction was performed in triplicate and mean values of relative expression analyzed,
through the PFAFFL method of quantification, for each gene and condition.
2.5 - Statistical Analysis
Results from the several assays were compared using One-Way analysis of
variance (ANOVA) by applying Sidak’s multiple comparisons test, using Prism®
software (Graphpad Inc., San Diego, California). All tests were performed with a
confidence level of 95%.

30
3 - Results
This chapter presents the obtained results from the worked developed. First total biomass
values are presented along with colony formation units counts to understand the effect of
glucose variation in the growth medium. The same is done later relatively to the
presence/absence of glutamine in the medium. Then, SEM biofilm structure visualization is
presented, and lastly the genetic expression results, beginning with the evaluation of primer
desing and specificity and ending with the expression results, for different mediums.

31
3.1 – Assessment of the effect of glucose in Candida species biofilm forming ability
and cell viability
Figure 3.1, 3.2, 3.3 and 3.4 presents the results of the total biomass
quantification through CV staining as well as the respective cell viability values, for
Candida biofilms formed in RPMI medium with 0.3% of glutamine and supplemented
with increasing percentages of glucose 0.2% to 10% of glucose. All values obtained
were statistically compared with the values obtained for the condition RPMI
supplemented with 0.2% of glucose.
All the studied Candida species and strains were able to form biofilms in all
conditions, although differences occurred depending on species, strains and conditions
tested. In fact, in general, no similarities were found in each condition, between the
total biomass values for different strains of the same species. Moreover, no direct
correlation was observed concerning the values of total biomass and the CFUs number
obtained.
Candida albicans biofilm forming ability was different between the two strains
tested (Figure 3). Concerning, C. albicans ATCC 90028 the quantity of the biofilm
formed does not seem to be dependent of the amount of the glucose present in
medium regarding total biomass quantification. It is important to highlight that the
number of cultivable cells increased significantly for percentages of glucose of 1%
(p<0.01), 2%(p<0.0001) and 5%(p<0.0001). In the case of C. albicans 324 LA/94, the
total biomass values remained constant for values of glucose between 0.2% and 1%,
but was observed an increase (0.8 times more) in the case of biofilms grown in RPMI
supplemented with 2% of glucose (p<0.001). Morevoer, for percentages above 3% of
glucose, the pattern of biofilm formation decreased significantly for values of
absorbance similar to that observed in RPMI supplemented only with 0.2% of glucose.
No statistical differences were observed concerning CFUs count for any of the
conditions tested.
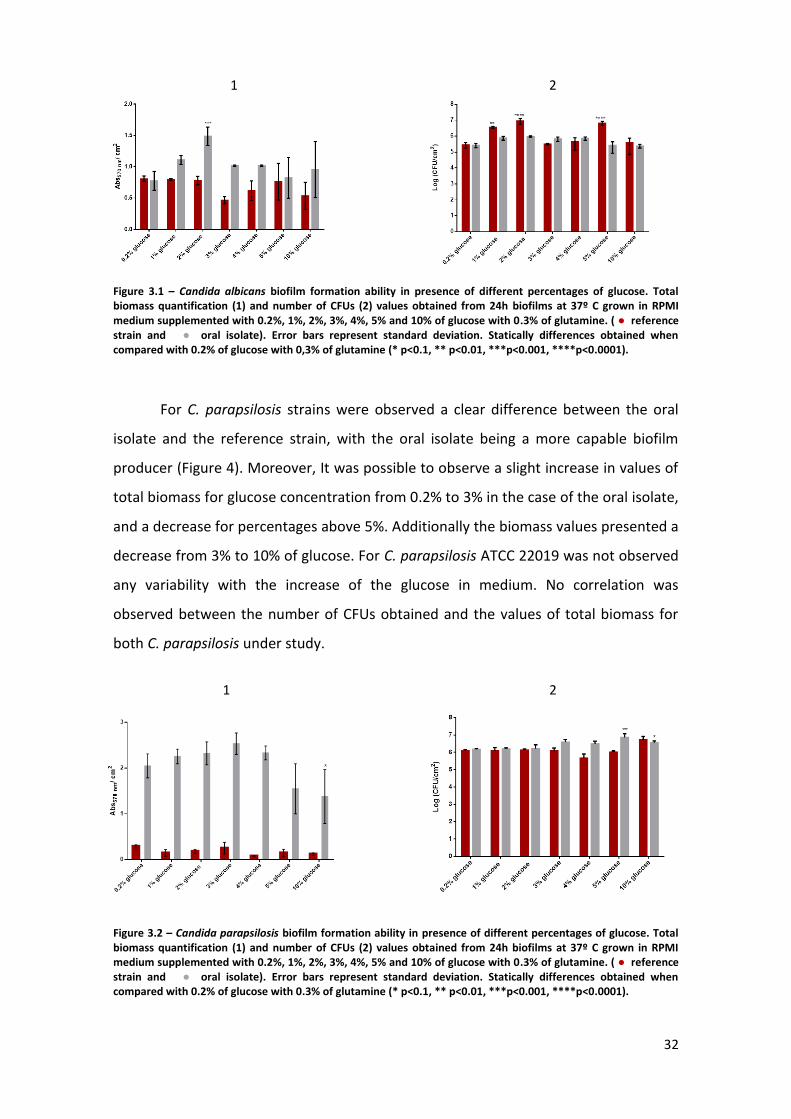
32
Figure 3.1 – Candida albicans biofilm formation ability in presence of different percentages of glucose. Total biomass quantification (1) and number of CFUs (2) values obtained from 24h biofilms at 37º C grown in RPMI medium supplemented with 0.2%, 1%, 2%, 3%, 4%, 5% and 10% of glucose with 0.3% of glutamine. ( ● reference strain and ● oral isolate). Error bars represent standard deviation. Statically differences obtained when compared with 0.2% of glucose with 0,3% of glutamine (* p<0.1, ** p<0.01, ***p<0.001, ****p<0.0001).
For C. parapsilosis strains were observed a clear difference between the oral
isolate and the reference strain, with the oral isolate being a more capable biofilm
producer (Figure 4). Moreover, It was possible to observe a slight increase in values of
total biomass for glucose concentration from 0.2% to 3% in the case of the oral isolate,
and a decrease for percentages above 5%. Additionally the biomass values presented a
decrease from 3% to 10% of glucose. For C. parapsilosis ATCC 22019 was not observed
any variability with the increase of the glucose in medium. No correlation was
observed between the number of CFUs obtained and the values of total biomass for
both C. parapsilosis under study.
Figure 3.2 – Candida parapsilosis biofilm formation ability in presence of different percentages of glucose. Total biomass quantification (1) and number of CFUs (2) values obtained from 24h biofilms at 37º C grown in RPMI medium supplemented with 0.2%, 1%, 2%, 3%, 4%, 5% and 10% of glucose with 0.3% of glutamine. ( ● reference strain and ● oral isolate). Error bars represent standard deviation. Statically differences obtained when compared with 0.2% of glucose with 0.3% of glutamine (* p<0.1, ** p<0.01, ***p<0.001, ****p<0.0001).
1 2
1 2
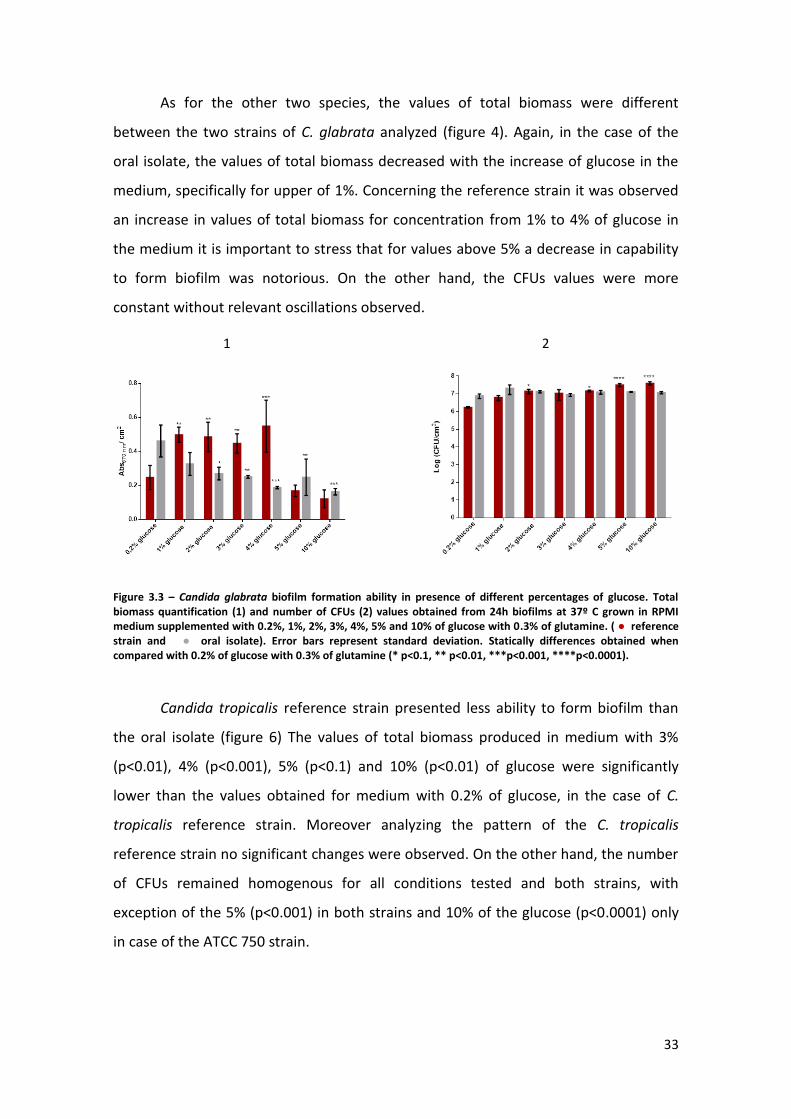
33
As for the other two species, the values of total biomass were different
between the two strains of C. glabrata analyzed (figure 4). Again, in the case of the
oral isolate, the values of total biomass decreased with the increase of glucose in the
medium, specifically for upper of 1%. Concerning the reference strain it was observed
an increase in values of total biomass for concentration from 1% to 4% of glucose in
the medium it is important to stress that for values above 5% a decrease in capability
to form biofilm was notorious. On the other hand, the CFUs values were more
constant without relevant oscillations observed.
Figure 3.3 – Candida glabrata biofilm formation ability in presence of different percentages of glucose. Total biomass quantification (1) and number of CFUs (2) values obtained from 24h biofilms at 37º C grown in RPMI medium supplemented with 0.2%, 1%, 2%, 3%, 4%, 5% and 10% of glucose with 0.3% of glutamine. ( ● reference strain and ● oral isolate). Error bars represent standard deviation. Statically differences obtained when compared with 0.2% of glucose with 0.3% of glutamine (* p<0.1, ** p<0.01, ***p<0.001, ****p<0.0001).
Candida tropicalis reference strain presented less ability to form biofilm than
the oral isolate (figure 6) The values of total biomass produced in medium with 3%
(p<0.01), 4% (p<0.001), 5% (p<0.1) and 10% (p<0.01) of glucose were significantly
lower than the values obtained for medium with 0.2% of glucose, in the case of C.
tropicalis reference strain. Moreover analyzing the pattern of the C. tropicalis
reference strain no significant changes were observed. On the other hand, the number
of CFUs remained homogenous for all conditions tested and both strains, with
exception of the 5% (p<0.001) in both strains and 10% of the glucose (p<0.0001) only
in case of the ATCC 750 strain.
1 2
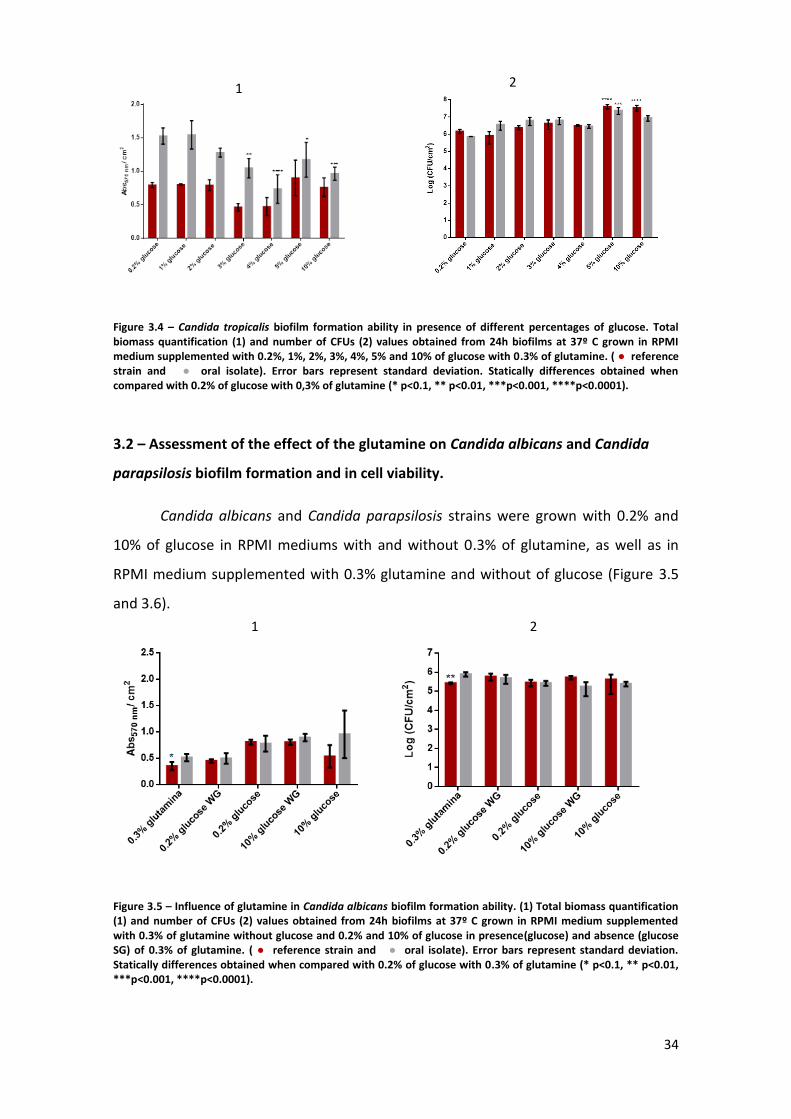
34
Figure 3.4 – Candida tropicalis biofilm formation ability in presence of different percentages of glucose. Total biomass quantification (1) and number of CFUs (2) values obtained from 24h biofilms at 37º C grown in RPMI medium supplemented with 0.2%, 1%, 2%, 3%, 4%, 5% and 10% of glucose with 0.3% of glutamine. ( ● reference strain and ● oral isolate). Error bars represent standard deviation. Statically differences obtained when compared with 0.2% of glucose with 0,3% of glutamine (* p<0.1, ** p<0.01, ***p<0.001, ****p<0.0001).
3.2 – Assessment of the effect of the glutamine on Candida albicans and Candida
parapsilosis biofilm formation and in cell viability.
Candida albicans and Candida parapsilosis strains were grown with 0.2% and
10% of glucose in RPMI mediums with and without 0.3% of glutamine, as well as in
RPMI medium supplemented with 0.3% glutamine and without of glucose (Figure 3.5
and 3.6).
Figure 3.5 – Influence of glutamine in Candida albicans biofilm formation ability. (1) Total biomass quantification (1) and number of CFUs (2) values obtained from 24h biofilms at 37º C grown in RPMI medium supplemented with 0.3% of glutamine without glucose and 0.2% and 10% of glucose in presence(glucose) and absence (glucose SG) of 0.3% of glutamine. ( ● reference strain and ● oral isolate). Error bars represent standard deviation. Statically differences obtained when compared with 0.2% of glucose with 0.3% of glutamine (* p<0.1, ** p<0.01, ***p<0.001, ****p<0.0001).
1 2
1 2
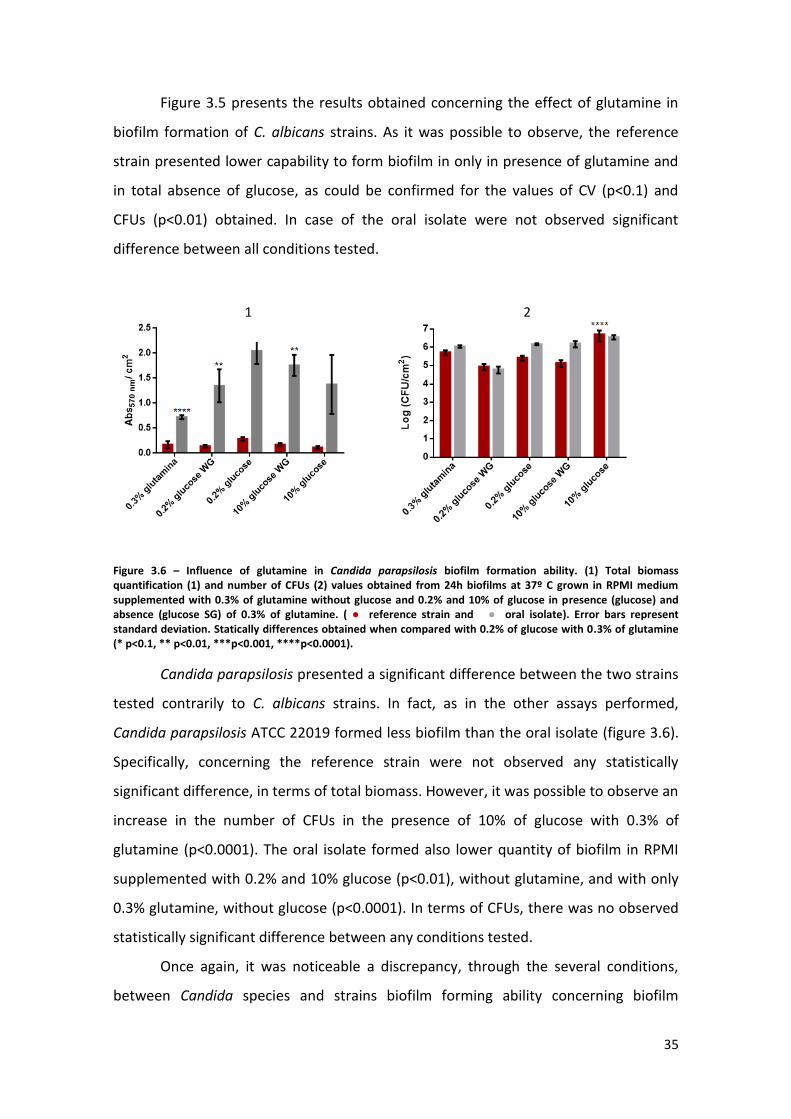
35
Figure 3.5 presents the results obtained concerning the effect of glutamine in
biofilm formation of C. albicans strains. As it was possible to observe, the reference
strain presented lower capability to form biofilm in only in presence of glutamine and
in total absence of glucose, as could be confirmed for the values of CV (p<0.1) and
CFUs (p<0.01) obtained. In case of the oral isolate were not observed significant
difference between all conditions tested.
Figure 3.6 – Influence of glutamine in Candida parapsilosis biofilm formation ability. (1) Total biomass quantification (1) and number of CFUs (2) values obtained from 24h biofilms at 37º C grown in RPMI medium supplemented with 0.3% of glutamine without glucose and 0.2% and 10% of glucose in presence (glucose) and absence (glucose SG) of 0.3% of glutamine. ( ● reference strain and ● oral isolate). Error bars represent standard deviation. Statically differences obtained when compared with 0.2% of glucose with 0.3% of glutamine (* p<0.1, ** p<0.01, ***p<0.001, ****p<0.0001).
Candida parapsilosis presented a significant difference between the two strains
tested contrarily to C. albicans strains. In fact, as in the other assays performed,
Candida parapsilosis ATCC 22019 formed less biofilm than the oral isolate (figure 3.6).
Specifically, concerning the reference strain were not observed any statistically
significant difference, in terms of total biomass. However, it was possible to observe an
increase in the number of CFUs in the presence of 10% of glucose with 0.3% of
glutamine (p<0.0001). The oral isolate formed also lower quantity of biofilm in RPMI
supplemented with 0.2% and 10% glucose (p<0.01), without glutamine, and with only
0.3% glutamine, without glucose (p<0.0001). In terms of CFUs, there was no observed
statistically significant difference between any conditions tested.
Once again, it was noticeable a discrepancy, through the several conditions,
between Candida species and strains biofilm forming ability concerning biofilm
1 2

36
forming ability. Moreover, the glucose seems to be a principal role in biofilm than the
glutamine, once the biofilms formed in absence of glucose and in the presence of
glutamine presented in general lower values of total biomass.
3.3 –Influence of glucose and glutamine in Candida albicans and Candida parapsilosis
biofilms structure.
The biofilm structure and the cells morphology of the Candida albicans and
Candida parapsilosis strains were analyzed through SEM. For that, 24h biofilms of C.
albicans ATCC 90028, C. albicans 324 LA/94, C. parapsilosis ATCC 22019 and
C.parapsilosis AD, were grown in 0.3% glutamine medium RPMI medium without
glucose and in RPMI medium supplemented with 2% and 10% of glucose without
glutamine (Figure 9).
Candida albicans ATCC 90028 biofilms consists of a network of cells of a variety
of morphologies(figure 9 A). Biofilms formed in RPMI only supplemented with
glutamine, presents as a thin, shallow layer of yeast and filamentous forms (figure 9 A -
1). Moreover, when grown in glucose RPMI medium, the biofilm showed a more dense
structure, with thicker and longer hyphal forms. The increase for 10% of glucose in
medium, results in an increased amount of hyphal filamentous forms in a more dense
network (figure 3.7 A - 3).
Candida albicans 324 LA/94 biofilms grown in RPMI glutamine free of glucose,
presented more quantity of ECM covering layers of yeast and hyphal forms, relatively
to the other strains. As the glucose in the medium increases (from 0.2% to 10%) a
higher number of hyphal forms appears in the biofilms.
C. parapsilosis ATCC 22019 biofilm structure (Figure 3.7 C and D) formed micro
communities of yeasts anchored to surface. However, it is important to address an
increase in size of the micro communities with the increase of the percentages of
glucose in medium. C. parapsilosis AD, in the absence of glucose, forms only
agglomerates of yeast cells. Interestingly, it was observed that in the presence of
glucose, the size of this clusters increase and pseudohyphal structures emerge (see
arrows (Figure 3.7 D - 3). An alteration on RPMI composition is able to influence the
structure of C. parapsilosis and C. albicans biofilms as well as its cell morphologies.
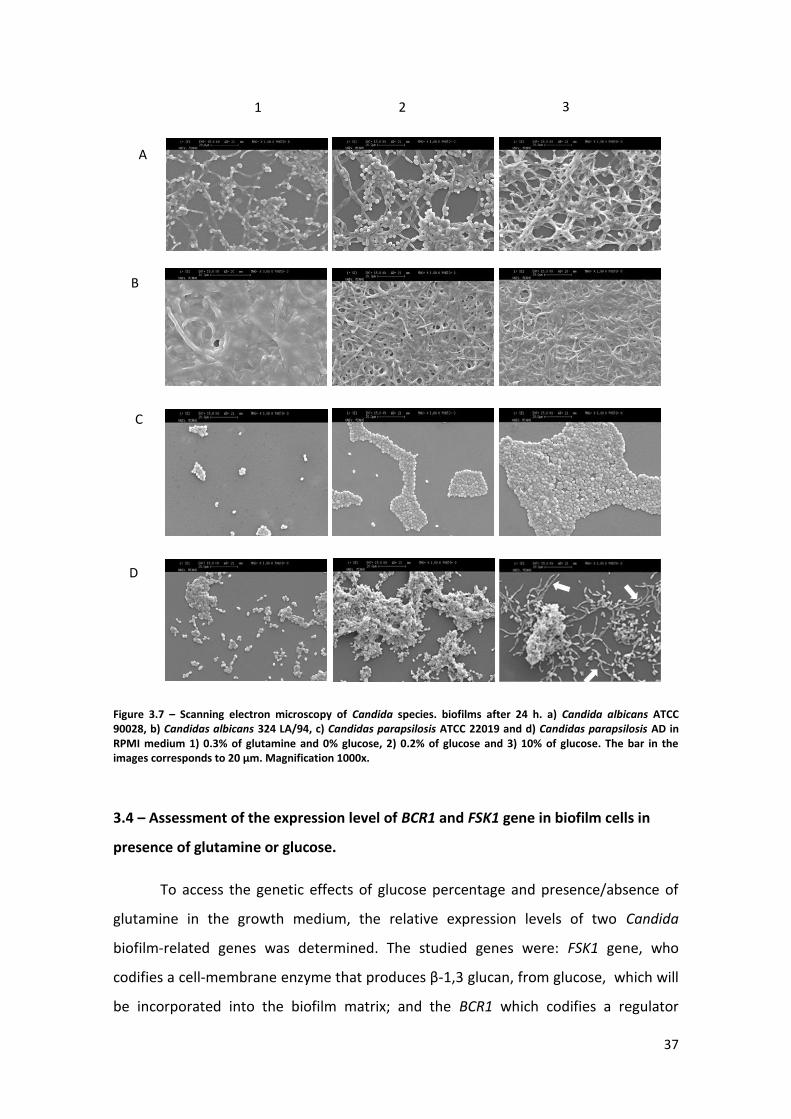
37
Figure 3.7 – Scanning electron microscopy of Candida species. biofilms after 24 h. a) Candida albicans ATCC 90028, b) Candidas albicans 324 LA/94, c) Candidas parapsilosis ATCC 22019 and d) Candidas parapsilosis AD in RPMI medium 1) 0.3% of glutamine and 0% glucose, 2) 0.2% of glucose and 3) 10% of glucose. The bar in the images corresponds to 20 µm. Magnification 1000x.
3.4 – Assessment of the expression level of BCR1 and FSK1 gene in biofilm cells in
presence of glutamine or glucose.
To access the genetic effects of glucose percentage and presence/absence of
glutamine in the growth medium, the relative expression levels of two Candida
biofilm-related genes was determined. The studied genes were: FSK1 gene, who
codifies a cell-membrane enzyme that produces β-1,3 glucan, from glucose, which will
be incorporated into the biofilm matrix; and the BCR1 which codifies a regulator
A
B
C
D
1 2 3

38
protein important for encoding biofilm matrix proteins. The ACT1 gene, that is
constitutively expressed, codifies for the actin and for that was selected as the
housekeeping gene (the normalize gene).
Figure 3.8, presents the results of the traditional PCR with genomic DNA
extracted from the 4 strains relatively to the 3 genes under study. This was performed
in order to access the correct design of the primers and its specificity (Table 2.2).
Figure 3.8 – Results of primer specificity , in DNA gel 1% of agarose, relatively to the genes A) ACT1, B) FKS1 and C) BCR1 for the strains: 1) Candida albicans ATCC 90028, 2)Candida albicans 324 LA/94, 3)Candida parapsilosis ATCC 20019 and D) Candida parapsilosis AD.
As it is possible to observe, all primers were well designed, once that all the
products of amplification presented the expected size. Namely, for C. parapsilosis with
a product of amplification for BCR1 and FKS1 between the 100 bp and 200 bp marker
bands, with the correct size of 177 bp and 151 bp respectively. The ACT1 gene
amplification product appeared above the marker of 200 bp, also in accordance with
the dimension of the target expected, 228 bp. Regarding C. albicans, the gel showed
that ACT1 and FKS1 amplification product appeared at the same level, between the
marker’s bands of 100 bp and 200 bp, in accordance with the target dimension of 168
bp and 169 bp, respectively. The BCR1 amplification product appears slightly above the
200 bp marker’s band, also in accordance with the target dimension expected of 206
bp.
The work followed with the genes expression studies by quantitative real time
PCR for the FKS1 and BCR1. For that, all four Candida strains biofilms grown during 24h
in RPMI supplemented with 0.2% of glucose, 10% of glucose (both with 0% of
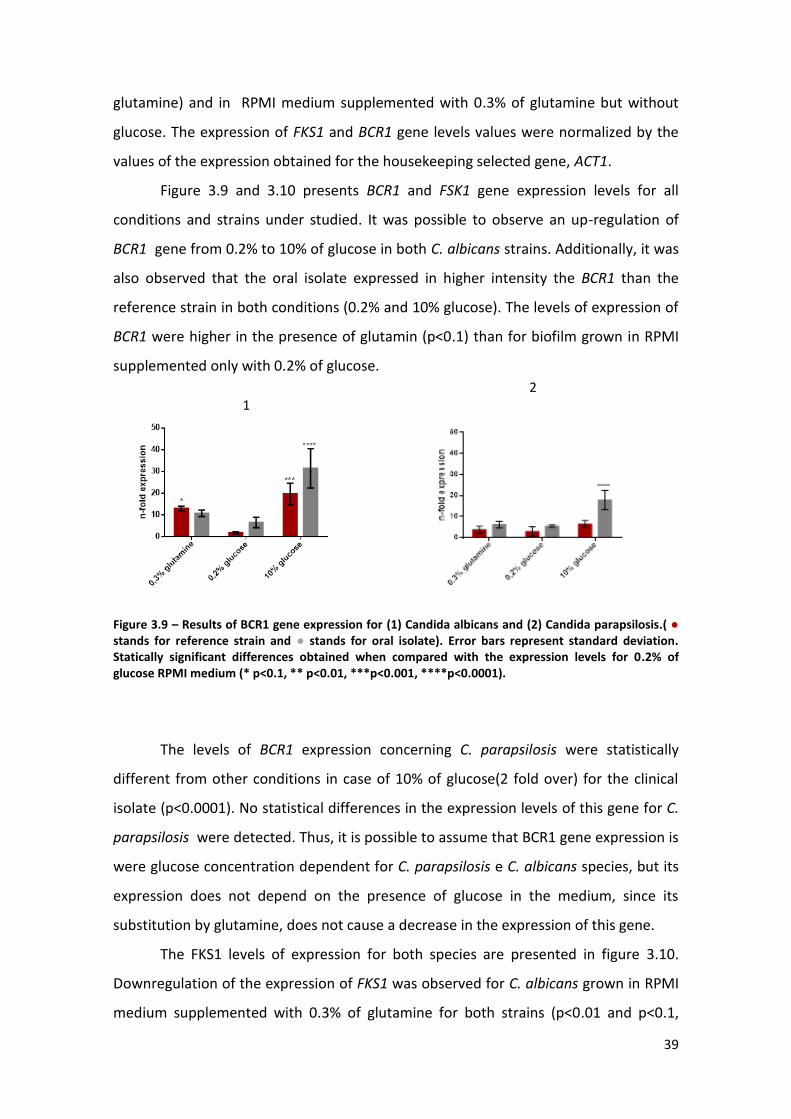
39
glutamine) and in RPMI medium supplemented with 0.3% of glutamine but without
glucose. The expression of FKS1 and BCR1 gene levels values were normalized by the
values of the expression obtained for the housekeeping selected gene, ACT1.
Figure 3.9 and 3.10 presents BCR1 and FSK1 gene expression levels for all
conditions and strains under studied. It was possible to observe an up-regulation of
BCR1 gene from 0.2% to 10% of glucose in both C. albicans strains. Additionally, it was
also observed that the oral isolate expressed in higher intensity the BCR1 than the
reference strain in both conditions (0.2% and 10% glucose). The levels of expression of
BCR1 were higher in the presence of glutamin (p<0.1) than for biofilm grown in RPMI
supplemented only with 0.2% of glucose.
Figure 3.9 – Results of BCR1 gene expression for (1) Candida albicans and (2) Candida parapsilosis.( ● stands for reference strain and ● stands for oral isolate). Error bars represent standard deviation. Statically significant differences obtained when compared with the expression levels for 0.2% of glucose RPMI medium (* p<0.1, ** p<0.01, ***p<0.001, ****p<0.0001).
The levels of BCR1 expression concerning C. parapsilosis were statistically
different from other conditions in case of 10% of glucose(2 fold over) for the clinical
isolate (p<0.0001). No statistical differences in the expression levels of this gene for C.
parapsilosis were detected. Thus, it is possible to assume that BCR1 gene expression is
were glucose concentration dependent for C. parapsilosis e C. albicans species, but its
expression does not depend on the presence of glucose in the medium, since its
substitution by glutamine, does not cause a decrease in the expression of this gene.
The FKS1 levels of expression for both species are presented in figure 3.10.
Downregulation of the expression of FKS1 was observed for C. albicans grown in RPMI
medium supplemented with 0.3% of glutamine for both strains (p<0.01 and p<0.1,
1 2
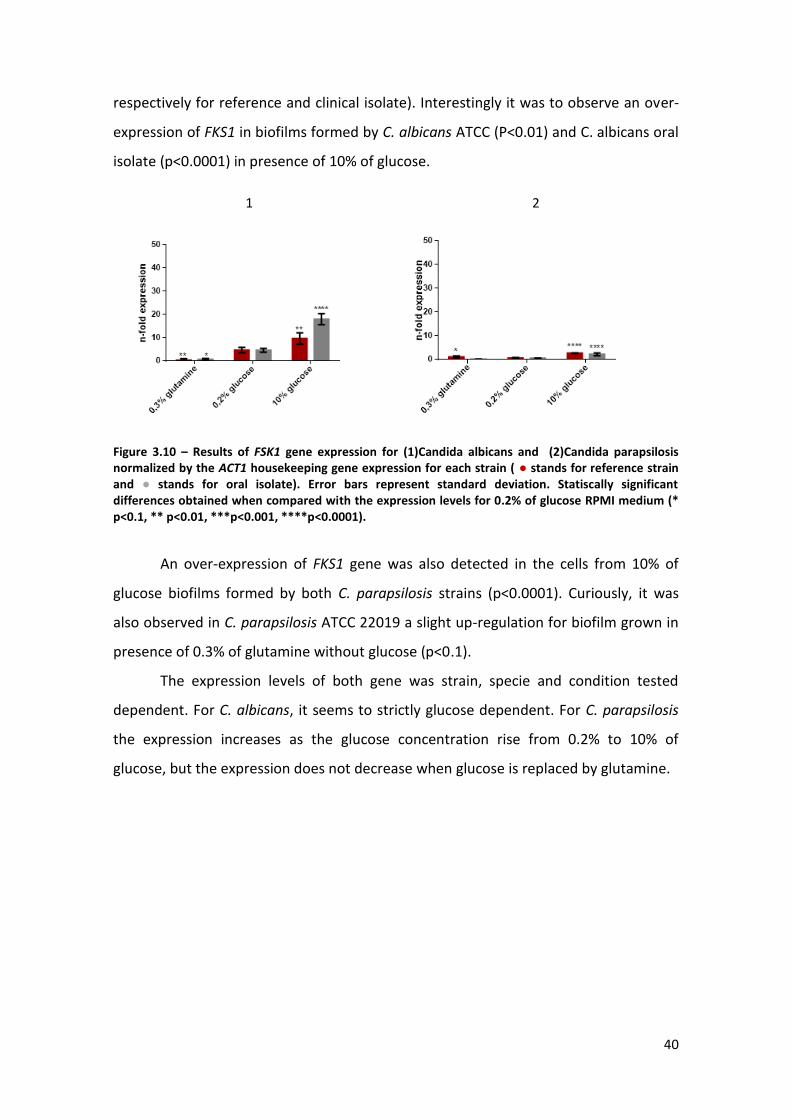
40
respectively for reference and clinical isolate). Interestingly it was to observe an over-
expression of FKS1 in biofilms formed by C. albicans ATCC (P<0.01) and C. albicans oral
isolate (p<0.0001) in presence of 10% of glucose.
Figure 3.10 – Results of FSK1 gene expression for (1)Candida albicans and (2)Candida parapsilosis normalized by the ACT1 housekeeping gene expression for each strain ( ● stands for reference strain and ● stands for oral isolate). Error bars represent standard deviation. Statiscally significant differences obtained when compared with the expression levels for 0.2% of glucose RPMI medium (* p<0.1, ** p<0.01, ***p<0.001, ****p<0.0001).
An over-expression of FKS1 gene was also detected in the cells from 10% of
glucose biofilms formed by both C. parapsilosis strains (p<0.0001). Curiously, it was
also observed in C. parapsilosis ATCC 22019 a slight up-regulation for biofilm grown in
presence of 0.3% of glutamine without glucose (p<0.1).
The expression levels of both gene was strain, specie and condition tested
dependent. For C. albicans, it seems to strictly glucose dependent. For C. parapsilosis
the expression increases as the glucose concentration rise from 0.2% to 10% of
glucose, but the expression does not decrease when glucose is replaced by glutamine.
1 2
41
4 - Discussion
This chapter consists on a thorough analysis on the results presented in the previous section.
The values are compared with the theoretical expected results and possible discrepancies are
addressed, as well as explanatory hypothesis
42
Biofilm formation is an important virulence factor of Candida species,
contributing to its pathogenicity and associated with high morbidity rates in cases of
oral candidosis (Fanning et al., 2012; Yanq, 2003). It confers Candida species significant
resistance to both antifungal agents and host immune response, allowing the cells to
resist to several environmental stress factors, such as host defense mechanism and
competitive pressure from other microorganisms. In biofilms, cells are aggregated in
communities embedded within a complex ECM, which limits the penetration of
substances hindering them to reach the cells, which is the case of antifungal
agents.(Silva et al., 2011) Biofilm formation ability of Candida species is dependent
upon several environmental factors including the available carbon or nitrogen source,
and respective concentration.(Hawser et al., 1994) In the oral environment, the
concentration of the glucose levels in saliva can vary greatly from values, in terms of
mass per volume, around 1.38% to values around 8%, in terms of weight per volume,
or higher depending on food intake, oral higiene, salivary flow and
diabetes.(Abikshyeet et al., 2012; Panchbhai, 2012) Thus, the aim of this work was to
sutdy the influence of glucose and glutamine in Candida species biofilm formation
ability.
4.1 - Assessment of the effect of glucose in Candida species biofilm forming ability
and cell viability
In this study, the biofilm formation ability of several Candida species (Table 2.1)
in media with different concentrations of glucose was evaluated and the results
(Figures 3.1, 3.2, 3.3 and 3.4) showed that all strains were able to form biofilm in all
studied conditions, although at different amounts depending on species, strain and
condition. These results are in accordance with previous studies that showed that the
ability of the Candida species and strains in forming biofilms in vitro is strain and
species dependent (Negri et al., 2012; Negri et al., 2011; Silva et al., 2012; Silva et al.,
2009; Silva et al., 2011).
As previously described by Silva et al. Candida parapsilosis AD, was the best
biofilm forming strain, which biofilms exhibited the greates ability to retain crystal
violet for all studied conditions (figure 3.2). Curiously, C. parapsilosis ATCC 22019, had

43
a very low capacity of forming biofilm, being almost equivalent to that of C. glabrata
(figure 3.3). Glucose percentage variation had little effect on the biofilm formation
ability for the reference strain; though a slight and not significant successive increase
in the amount of biofilm formed can be noticed as the glucose levels increase from
0.2% to 3% for the oral isolate (figure 3.2). Therefore, biofilm formation appears to be
glucose dependent only for the C. parapsilosis oral isolate, and considering the
decrease in the amount of biofilm biomass registered for glucose percentages above
5%, this seems to be the maximum peak concentration supported by this strain before
stress is induced. These results are in accordance with the previously reported
tendency of C. parapsilosis isolates being normally isolated from glucose-rich
environments such as parental nutrition devices, in clinical cases (Trofa et al., 2008).
In the case of C. albicans, the amount of biofilm formed by the reference strain
seemed to slightly vary across some conditions, although no direct relation can be
made with the amount of glucose present in the formation medium. The oral isolate,
on the other hand, formed more biofilm as the glucose percentage increased to 2%
and decreasing above that value. Thus, it seems that also for C. albicans, the oral
isolate biofilm formation capacity is more glucose dependent than the reference
strain. This is corroborated by earlier studies that showed a great preference of oral
isolates of C. albicans for glucose relatively to alternative carbon sources (Jin et al.,
2004), and also a strong dependence of biofilm formation to carbon source
concentration (Kuhn et al., 2002).
Regarding C. glabrata, these species formed the lowest amounts of biofilm
comparatively to other species, as showed by Silva, et al.(figure 3.3) (Silva et al., 2009).
The reference strain produced more biofilm in the medium as the concentration of
glucose increased (from 0.2 to 4%), while for the oral isolate, the amount of biofilm
produced decreased significantly above 1% until 10% of glucose. In opposition to what
was observed for C. albicans and C. parapsilosis, the C. glabrata reference strain
biofilm forming ability seems to be more glucose dependent than the oral isolate,
which in fact do not tolerates high glucose percentages. This results are in accordance
with previous reports in which C. glabrata isolates formed biofilm preferentially in
mediums with low concentrations of glucose over mediums with higher concentrations
of other carbon sources (Hawser et al., 1994).
44
Candida tropicalis oral isolate biofilm formation capacity presented the same
behavior as the C. glabrata oral isolate, for glucose percentages above 3% to 10% of
glucose. From 0.2 % to 2%, it remained relatively constant, being 1.5 times greater
than the values obtained for the reference strain. The peak of the glucose value seems
to be at 2% of glucose concentration in the medium. Before that start forming less
biofilms as the glucose percentage increases, but its biofilm formation capacity does
not seem to be glucose dependent. The amount of biofilm formed by the reference
strain was relatively homogeneous through all conditions and so, biofilm formation
capacity by this strain is not dependent on the amount of glucose present in the
medium.
The variation of glucose concentration in the biofilm formation medium was
also tested in terms of biofilm cell viability, after 24h. For all the conditions, there was
not a direct relation between the amount of biofilm formed and the number of viable
cells. In general, the differences in the amount of formed biofilm between strains of
the same species did not correspond to a similar difference in the number of CFUs, for
each condition. In figure 3.2, is possible to observe that the amount of CFUs is similar
between the two strains of C. parapsilosis, despite of the great difference registered in
terms of biofilm forming ability. The same is valid for several conditions in the other
species and strains under studied (figures 3.1, 3.3 and 3.4). Glucose variation effect in
biofilm also did not correspond in a similar variation in terms of number of viable cells
in case of C. albicans. While the oral isolate amount of formed biofilm increased when
glucose varies from 0.2% to 2%, the number of viable cells remained constant. In
contrast, the reference strain amount of formed biofilm remained constant through
that condition, but the number of viable cells significantly increased from 0.2% to 2%
of glucose (figure 3.1). Similar observations were made in the case of the other strains
(figures 3.3 and 3.4), and so, is reasonable to assume that the number of viable cells in
the medium does not correlate with the amount of biofilm biomass measured by
crystal violet. Indeed, crystal violet uptake on cell morphology and size and this stain
can also be entrapped in the biofilm matrix, therefore it cannot be used to access the
number of cells in the biofilm but, roughly, the amount of total biomass.
45
4.2 - Assessment of the effect of the glutamine on Candida albicans and Candida
parapsilosis biofilm formation and in cell viability
The aminoacid L-glutamine can act as a nitrogen source for Candida species
allowing them to survive through the production of essential proteins, in the absence
of a carbon source. However, due to the high amounts of carbohydrates present in the
biofilm, the question is raised about the capacity of biofilm formation by Candida in
mediums without glucose and the effect that glutamine has in the presence of glucose
(Holmes et al., 1989). Considering the previous results discussed in section 5.1, only for
C. parapsilosis and C. albicans oral isolate strains the total biofilm biomass values
increased, with the increase of the percentage of glucose in the growth medium. Thus,
is reasonable to say that this two species oral isolate strains were the most glucose
dependent in terms of biofilm formation ability, in regards to all the studied strains.
For that reason, the next described studies and results will focus only on these two
species.
From the results present in figure 3.5 for C. albicans, it seems that the
presence or absence of glutamine in mediums supplemented either with low or high
amounts of glucose is insignificant for biofilm formation or cell viability. The biofilm
formation capacity for this species for the medium supplemented only with 0.3% of
glutamine, was lower in the case of the reference strain and similarly in the case of the
oral isolate, when compared to the amount of formed biofilm for the medium with
0.2% of glucose and 0.3% of glutamine. In terms of CFUs, the same was observed,
being the number of viable cells of the reference strain also lower, for the medium
with only glutamine, when compared to those from the reference medium. Thus it
seems that the oral isolate can adapt well to the total absence of glucose from the
medium, while the reference strain cannot. These results are in opposition with
previous reports that revealed that glucose is the carbon source that allowed to C.
albicans to form biofilm (Hawser et al., 1994; Jin et al., 2004).
For C. parapsilosis (figure 3.6), the great difference between the two strains in
terms of biofilm formation are still valid for all the conditions. In the mediums with
only glucose and without glutamine, the oral isolate formed statistically less biofilm
when compared to the amount of biofilm formed for the medium with 0.2% of glucose
and 0.3% of glutamine. However, the difference was greater for the medium with only
46
glutamine. The oral isolate cell viability was not affected by the absence/presence of
glucose or glutamine in the medium. The same was observed for the reference strain
biofilm formation capacity and biofilm cell viability. Therefore, C. parapsilosis oral
isolate seems to be more affected by the alterations in terms of energy source in both
strains.
4.3 – Influence of glucose and glutamine in Candida albicans and Candida
parapsilosis biofilms structure.
SEM processing is a method that has an inherent destructive capacity , but can
provide useful information in both biofilm structure and cell morphology (Silva et al.,
2009). In the present work, SEM processing revealed structural differences in 24h
biofilms of C. albicans ATCC 90028, C. albicans 324 LA/94, C. parapsilosis ATCC 22019
and C. parapsilosis AD formed in RPMI mediums with 0.3% glutamine and without
glucose or with 0.2% or 10% of glucose without glutamine, depending on specie, strain
and condition.
Biofilm structure and cell morphology are dependent on several environmental
factors including growth conditions.(Hawser et al., 1994) Biofilms of Candida albicans
(figure 9 A and B) are composed by yeast and filamentous forms, in accordance with
earlier reports (Brown, 2002; Gow, 2002). The hyphal forms are larger as the glucose
percentage increases, as well as the biofilm overall structure complexity. In C. albicans
ATCC 90028 (figure 9 A) the biofilms grows structurally as the glucose concentration in
the medium increases, from 0.2% of glucose to 10% of glucose, with the appearance of
more interconnected and thick hyphal forms. The structure of C. albicans 324 LA/94
biofilms presents high amounts of ECM covering layers of yeast and filamentous forms.
The presence of glucose and its percentage increase in the medium leads to an
increase in the number of hyphal forms and respective size resulting in a more
complex structure.
Regarding C. parapsilosis, the reference strain biofilms showed (figure 9 C),
microcommunities of yeast cells anchored to the surface, which increased in size as the
percentage of glucose in the medium increased. The oral isolate biofilms consisted of
agglomerates of yeast cells in RPMI medium with only glutamine, and in the presence
47
of glucose not only the cells and clusters increased in size but also pseudohyphal
structures emerged.
In general, except for C. parapsilosis reference strain (figure 3.6), the results for
viable cells did not increased with the increase of glucose percentage, contradicting
the increase of biofilm density in observed through SEM. As this raised was followed
also for a rise in the number of filamentous forms for both species, this discrepancy
may be due to the nature of the cell viability assay method, that cannot access
correctly the number of clustered cells or hyphal forms.
4.4 - Assessment of the expression level of BCR1 and FSK1 gene in biofilm cells in
presence of glutamine or glucose
In order to access in more detail the effect on biofilm formation of the variation
of glucose percentage in the growth medium as well as the presence or absence of
glutamine, the expression levels of two Candida genes related with biofilm formation
were assessed. Before being able to form biofilms, Candida yeasts must first adhere to
the surface. Several cell wall glycoproteins and polysscharides are involved in this
process such as proteins encoded by aglutinin-like sequence gene family or Hyphal cell
wall-specific protein gene (Chauhan et al., 2002; Hoyer, 2001; Silva et al., 2011). The
expression of this genes are regulated by the BCR1 gene, a fungal transcriptional
factor. Studies have proved a direct relationship between the expression of this gene
and biofilm formation.(Ding et al., 2011) BCR1 expression for strains C.albicans was
higher in both strains for the medium with 10% of glucose, comparatively to the
medium with 0.2% of glucose, as well as in the medium supplemented only with 0.3%
of glutamine, especially in the case of the reference strain. Given that no statistical
differences were observed in terms of biofilm biomass values for those conditions
(figure 3.5), was surprising to observe such difference in terms of gene expression. In
case of C. parapsilosis, BCR1 expression was similar between the two strains, being
significantly lower in the medium without glucose and significantly higher in the
medium an increased glucose concentration (figure 3.10). Although the gene
expression obtained was expected for the RPMI medium with only glutamine, in which
both strains formed less biofilm, the increase in expression for the medium with 10%
of glucose and the similarity in the expression values between strains were

48
unexpected. (figure 3.6 and figure 3.7 C). Therefore, and given the CFUs results in
figure 3.6, it seems the great differences obtained in the absorbance values of crystal
violet between the two strains for all studied conditions was due to an higher capacity
in ECM production of the oral isolate.
An active element of the biofilm matrix, responsible for drugs capture is β-1,3
glucan, which is synthesized from UDP-D-glucose through the β-1,3 glucan synthase, a
membrane-bound enzyme, constituted by two subunits, one of them being genetically
encoded by the FKS1 gene. (Taff et al., 2012) In Candida albicans FSK1 gene expression
was significantly lower in the medium without glucose and significantly higher in the
medium with an increased glucose percentage, as expected. For C. parapsilosis the
gene expression was also higher lower in the mediums with 10% of glucose, being
similar between the other conditions. Overall, FKS1 expression values in C. albicans
were higher than the expression values in C. parapsilosis, through all conditions. These
results hint that C. albicans biofilms may have more β-1,3 glucan included in its cell
wall and biofilm matrix that C. parapsilosis, considering the fact that the oral isolate of
this species was the one that formed more biofilm, of all studied strains. These results
are in accordance with what was observed through SEM images of the biofilms. As
described in the previous section, C. albicans oral isolate presented more extracellular
matrix in its biofilm than any other strain.
49
5 – Concluding remarks
This chapter presents the major conclusion taken from the obtained results and posterior
discussion, addressing all aspects of the developed worked.
50
Oral candidosis is a common opportunistic infection of the oral cavity caused by
the overgrowth of Candida species that can develop into a deadly systemic infection
known as candidaemia. The high pathogenicity of Candida species is related to biofilm
formation. An high carbohydrate diet, an impaired salivary function, diabetes, are
some factors related to incidence of candidosis and can lead to a rise in the glucose
concentration in the mouth. Therefore, the aim of this study was to access the effect
of glucose and glutamine in biofilms formation by Candida species.
All the studied Candida strains formed biofilms in all the selected conditions,
and the glucose concentration variation as well as the presence/absence of glutamine
in the medium had different effects on the amount of biofilm formed, although
depending on specie and strain. Candida albicans and Candida parapsilosis oral
isolates were able to augment their biofilm formation abilities in the presence of
increasing concentrations of glucose until a maximum value level of glucose, above
which, the amount of produced biofilm started to decrease. The biofilm formation
ability of the reference strains of both species remained indifferent to the glucose
percentage variation in the medium. Both Candida glabrata strains were less able to
form biofilms in all conditions. Thus, although an increase was noticed in the amount
of biofilm produced for the reference strain, overall the amount of biofilm produced
was not significant when compared to the other strains The biofilm formation ability of
the Candida tropicalis reference strain was indifferent to glucose concentration
increase and the oral isolate formed more biofilm in lower glucose values, being less
able to do it when the glucose concentration increased. Therefore, only C. albicans and
C. parapsilosis strains were tested for the effect of glutamine in the growth medium.
Moreover, the huge differences observed in terms of biofilm forming ability did not
correlate with the values obtained for the number of cultivable cell, for different
conditions, strains and species, hinting at big differences in terms of ECM production
ability.
Glutamine absence in the growth medium, for mediums supplemented with
glucose, had a significant effect for Candida parapsilosis oral isolate, which formed less
biofilm. In regards to the other strains, their biofilm formation ability was not
disturbed by the lack or presence of glutamine when glucose was present. Substitution
of glucose by glutamine, led to a decrease in biofilm formation only for C. albicans

51
reference strain and C. parapsilosis oral isolate, hinting at physiological differences of
strains of the same species.
SEM images revealed structural differences between biofilms of strains and
species of C. albicans and C. parapsilosis. In general, C. albicans 324 LA/94 biofilms
presented a more extracellular matrix as well as bigger, thicker and more
interconnected hyphal forms. C. parapsilosis biofilms were composed solely by
aggregates cell and filamentous forms which increased in size as the glucose
concentration increased.
FKS1 gene expression increased for both C. albicans and C. parapsilosis strains
as the glucose level in the medium increased, being more expressed, in general, in the
first specie. Thus, these results support that FKS1 gene expression is glucose
dependent which suggest a high glucan content in the ECM of C. albicans. BCR1 gene
expression was not glucose dependent, being expressed similarly in the total absence
of glucose for both C. albicans and C. parapsilosis strains. Suggesting that cell adhesion
may be independent, to some level, of the glucose or glutamine present in the growth
medium. However, its expression did increase for all strain with the increase in
glucose, suggesting that an increase in the nutrient concentration can influence the
amount of surface adhered cells.
Briefly, this work highlights the heterogeneous susceptibility of different
Candida species and respective strains to glucose concentration variation and
glutamine presence/absence in the growth medium, in terms of biofilm formation
ability. It showed that, even when forming low amounts of biofilms, the number of
adhered live cells to the surface remains unaltered for most conditions, proving that an
increase in glucose from 0.2% to 10% does not affect cell viability negatively. The
presence of glutamine is not vital to the growing cells in RPMI medium, but the
absence of glucose can be, especially in the case of oral isolates. Further work is
necessary to exactly understand the mechanisms behind biofilm formation, in different
concentrations of glucose and the diverse nature of the structure of the formed
biofilms, in order to better understand the mechanisms that allow to Candida cells to
survive in such different conditions.
52
6 – Future perspectives
This chapter describes the further directions that can be taken in order to more completely
understand the effect of glucose variation and glutamine presence in the growth medium
53
This work provided a clear perspective of the diverse nature of several Candida
species, highlighting different susceptibilities and hitting at different metabolic
processes and physiologies. A few suggestions that could be taken into consideration
for further studies are:
a) Further exploration of biofilm forming ability by several Candida
species, in mediums with higher concentrations of glutamine,
comparatively to the biofilms formed in mediums with only an
equivalent amount of glucose;
b) Assessment of biofilm ECM and cell wall composition of several
Candida species in mediums with different glucose concentration
and in the absence/presence of glutamine for a better understanding
of the differences between the biofilms formed between the studied
species, by a proteomic approach;
c) Assessment of antifungical resistance of biofilms of several Candida
species formed in the studied conditions;
d) Evaluation of the effects of glucose variation in the browth medium
as well as its substitution by glutamine in the Zap1 alternative
pathway for glucan incorporation in biofilm matrix, by Real-time PCR
determination of the gene;
e) Assessment of the effect glucose and glutamine in the expression of
FKS1, BCR1 and ZAP1 genes, in mutant created strains of several
Candida species;
f) Assess the effect of glucose in colonization and invasion of
reconstituted human oral epithelium, , for several Candida species.

54
8 - Bibliography
55
Abikshyeet, P., Ramesh, V., et al. (2012). Glucose estimation in the salivary secretion of diabetes mellitus patients. Diabetes, Metabolic Syndrome and Obesity: Targets and Therapy, 5(1), 149-154.
Akpan, A., & Morgan, R. (2002). Oral candidiasis. Postgrad Med J, 78, 455-459. Al-Fattani, M.A., & Douglas, L.J. (2006). Biofilm matrix of Candida albicans and Candida
tropicalis: chemical composition and role in drug resistance. Journal of Medical Microbiology, 55, 999-1008.
Aledo, J.C. (2004). Glutamine breakdown in rapidly dividing cells: waste or investment? BioEssays, 26(7), 778-785.
Andrés, M.T., Díaz, M.V., et al. (2008). Human Lactoferrin Induces Apoptosis-Like Cell Death in
Candida albicans: Critical Role of K+-Channel-Mediated K+ Efflux. Antimicrobial Agents and Chemotherapy, 52(11), 4081-4088.
Arendrup, M. (2010). Epidemiology of invasive candidiasis. Current Opinion in Critical Care, 16,
445-446. Brachiesi, F., Poeta, M., et al. (1993). Turbidimetric and visual criteria for determining the in
vitro activity of six antifungal agents against Candida spp. and Cryptococcus neoformans. Mycopathia, 124(1), 19-25.
Brown, A.J.P. (2002). Expression of growth form-specific factors during morhpogenesis in
Candida albicans. In R. A. Calderone (Ed.), Candida and candidiasis (pp. 87-93). Washington DC: ASM Press.
Calderone, R. (2002). History and Introduction Candida and Candidiasis (pp. 15-27).
Washington, DC: ASM Press. Chandra, J., Kuhn, D.M., et al. (2001). Biofilm Formation by the Fungal Pathogen Candida
albicans: Development, Architecture, and Drug Resistance. J Bacteriol, 183(18), 5385-5394.
Chauhan, N., Li, D., et al. (2002). The Cell Wall of Candida spp. In R. A. Calderone (Ed.), Candida
an Candidiasis. Washington DC: ASM Press. Csank, C., & Haynes, K. (2000). Candida glabrata displays pseudohyphal growth. FEMS
Mibrobiol Lett, 189(1), 115-120. Ding, C., Vidanes, G.M., et al. (2011). Conserved and Divergent Roles of BCR1 and CFEM
Proteins in Candida parapsilosis and Candida albicans. 6(12). Ding, C., Vidanes, G.M., et al. (2011). Conserved and divergent roles of Bcr1 and CFEM proteins
in Candida parapsilosis and Candida albicans. PLoS Pathog, 6(12), 1-11. Donlan, R.M., & Costerton, J.W. (2002). Biofilms: survival mechanisms of clinically relevant
microorganisms. Clin Microbiol Review, 15(2), 167-193. Douglas, L.J. (2003). Candida biofilms and their role in infection. Trends in Microbiology, 11(1),
30-34.
56
Ellepola, A., & Saramranyake, L. (2001). Inhalational and topical steroids, and oral candidosis: a mini review. Oral Diseases, 7(4), 211 - 216.
Fanello, S., Bouchara, J.P., et al. (2001). Nosocomial Candida albicans acquisition in a geriatric
unit: epidemiology and evidence for person-to-person transmission. Journal of Hospital Infection, 47(1), 46-52.
Fanning, S., & Mitchell, P.A. (2012). Fungal Biofilms. PLoS Pathog, 8(4), 1-3. Fidel, P.L., Vazquez, J.A., et al. (1999). Candida glabrata: Review of Epidemiology,
Pathogenesis, and Clinical Disease with Comparison to C. albicans. Clin. Microbiol. Rev., 12(1), 80-96.
Gow, N.A.R. (2002). Cell biology and Cell cicle of Candida. In R. A. Calderone (Ed.), Candida and
Candidiasis (Vol. 145-158). Washington DC: ASM Press. Hawser, S.P., & Douglas, L.J. (1994). Biofilm formation by Candida species on the Surface of
Catheter Materials in vitro. Infection and Immunity, 62(3), 915-921. Hazen, K.C., Plotkin, B.J., et al. (1986). Influence of Growth conditions on Cell surface
Hydrohpobicity of Candida albicans and Candida glabrata. Infection and Immunity, 54(1), 296-271.
Henriques, M., Azeredo, J., et al. (2004). Adhesion of Candida albicans and Candida
dubliniensis to acrylic and hydroxypaptite. Colloids and Surfaces B: Biointerfaces, 33(4), 235-241.
Hill, L.V.H., & Pereira, L.H. (1989). Association of oral candidiasis with diabetic control. Journal
of Clinical Pathology, 42, 502-505. Hoeql, L., Thoma-Greber, E., et al. (1998). Persistent oral candidosis by non-Candida albicans
Candida strains including Candida glabrata in a human immunodeficiency virus-infected patient observed over a period of 6 years. Myoses, 41(7-8), 335-338.
Holmes, A.R., Collings, A., et al. (1989). Ammonium Assimilation by Candida albicans and Other
Yeasts:
Evidence for Activity of Glutamate Synthase. Journal of General Microbiology(135), 1423-1430. Hoyer, L.L. (2001). The ALS gene family of Candida albicans. Trends in Microbiology, 9(4), 176-
180. Jawed, M., Shahid, S.M., et al. (2011). Dental caries in diabetes mellitus: role of salivary flow
rate and minerals. Journal of Diabetes Complications, 25(3), 183-186. Jin, Y., Samaranayake, L.P., et al. (2004). Biofilm formation of Candida albicans is variably
affected by saliva and dietary sugars. Archives of Oral biology, 49(10), 789-798. Jurysta, C., Bulur, N., et al. (2009). Salivary Glucose Concentration and Excretion in Normal and
Diabetic Subjects. Journal of Biomedicine and Biotechnology, 1-6, 1-6.
Kaur, R., Domerque, R., et al. (2005). A yeast by any other name: Candida glabrata and its interaction with the host. Current Opinion in Microbiology, 8(4), 378-384.

57
Kikutani, H., & Makino, S. (1992). The Murine Autoimmune Diabetes Model: NOD and Related Strains. Adv Immunol, 51, 285-322.
Kojic, E.M., & Darouiche, R.O. (2004). Candida Infections of Medical Devices. Clincal
Microbiology Reviews, 17(2), 255-267. Konig, K.G. (2000). Diet and oral health. International Dental Journal, 50(3), 162-174. Kourkoumpetis, T., Manolakaki, D., et al. (2010). Candida infection and colonization among
non-trauma emergency surgery patients. Virulence Retrieved 5, 1 Kuhn, D.M., Chandra, J., et al. (2002). Comparison of Biofilms Formed by Candida albicans and
Candida parapsilosis on Bioprosthetic Surfaces. Infection and Immunity, 70(2), 878-888.
Laffey, S.F., & Butler, G. (2005). Phenotype switching affects biofilm formation by Candida
parapsilosis. Microbiology, 151(4), 1073-1081. Lass-Flörl, C. (2009). The changing face of epidemiology of invasive fungal disease in Europe.
Mycoses, 52, 197-205.
Lee, H.C., Lee, S.D., et al. (2003). One-pot Enzymatic Synthesis of UDP-D-glucose from UMP and Glucose-1-phosphate Using an ATP Regeneration System. Journal of Biochemistry and Molecular Biology, 37(4), 503-506.
Li, L., Redding, S., et al. (2007). Candida glabrata: an emerging oral opportunistic pathogen. J Dent Res, 86(3), 204-215.
Marcotte, H., & Lavoie, M.C. (1998). Oral Microbial Ecology and the Role of Salivary
Immunoglobulin A. Microbiology and Moecular Biology Reviews, 62(1), 71-109. Masiá, C.M.M., Gutiérrez, R., et al. (1999). Epidemiology of yeast colonization and
oropharyngeal infection other than Candida albicans in patients with HIV infection. Medicina Clinica, 20(112), 211-214.
Meurman, J.H., Siikala, E., et al. (2007). Non-Candida albicans Candida yeasts of the oral cavity.
Communicating Current Research and Educational Topics and Trends in Applied Microbiology, 1(1), 719-731.
Moralez, A.T.P., França, E.J.G., et al. (2013). Phenotypic switching in Candida tropicalis:
association with modification of putative virulence attributes and antifungal drug sensitivity. Medical Mycology, 1-9.
Murray, P.R. (1995). Medical Microbiology (2 ed.). London: Mosby. Negri, M., Silva, S., et al. (2012). Candida tropicalis biofilms: Effect on urinary epithelial cells.
Microbial Pathogenesis, 53, 95-99. Negri, M., Silva, S., et al. (2011). Candida tropicalis biofilms: artificial urine, urinary catheters
and flow model. Medical Mycology, 1-9.
58
Newsholme, P., Lima, M.M.R., et al. (2003). Glutamine and glutamate as vital metabolites. Brazilian Journal of Medical and Biological Research, 36(2), 153-163.
Odds, F. (1988). Candida and Candidosis: A review and Bibliography (2 nd ed.). London: Balliere
Tindall. Okawa, Y., & Goto, K. (2006). Antigenicity of Candida tropicalis strain cells cultured at 27 and
37 degrees C. FEMS Imuunol Med Microbiol., 46(3), 436-443. Panagoda, G.J., Ellepola, A.N.B., et al. (2001). Adhesion of Candida parapsilosis to epithelial
and acrylic surfaces correlates with cell surface hydrophobicity. Mycoses, 44(1-2), 29-35.
Panchbhai, A.S. (2012). Correlation of Salivary Glucose Level with Blood Glucose Level in
Diabetes Mellitus. Journal of Oral & Maxillofacial research, 3(3), 1-7.
Pfaller, M.A., & Diekema, D.J. (2007). Epidemiology of Invasive Candidiasis: A persistent Public Health Problem. Clincal Microbiology Reviews, 20(1), 133-163.
Samaranayake, L.P. (2006). Nutritional factors and oral candidosis. Journal Of Oral Pathology
and Medicine, 15(2), 61-65. Samaranayake, L.P., & MacFarlane, T.W. (1982). The effect of dietary carbohydrates on the in-
vitro adhesion of Candida albicans to epithelial cells. Journal of Medical Microbiology, 15(4), 511-517.
Santana, I.L., Gonçalves, L.M., et al. (2013). Dietary Carbohydrates Modulate Candida albicans
Biofilm Development on the Denture Surface. PLoS Pathog, 8(5), 1-7. Shimizu, C., Kuriyama, T., et al. (2007). Association of oral yeast carriage with specific host
factors and altered mouth sensation. Oral Surgery, Oral Medicine, Oral Pathology and Endodontology, 105(7), 445-451.
Silva, M.P., Junior, J.C., et al. (2012). Influence of artificial saliva in biofilm formation of Candida
albicans in vitro. Braz. Oral Ras, 26(1), 24-28. Silva, S., Henriques, M., et al. (2009). Biofilms of Non-Candida albicans Candida species:
quantification, structure and matrix composition. Medical Mycology(47), 681-689. Silva, S., Hooper, S.J., et al. (2010). The role o aspartyl proteases in Candida tropicalis invasion
and damage of oral mucosa. Clinical Microbiology and Infection, 17(2), 264-272. Silva, S., Negri, M., et al. (2011). Adherence and biofilm formationof Non-Candida albicans
Candida species. Trends inMicrobiology, 19(5), 241-247. Silveira, F.P., & Husain, S. (2007). Fungal infections in solid organ transplantation. Medical
Mycology, 46(4), 305-320. Sreebny, L.M., Yu, A., et al. (1992). Xerostomia in Diabetes Mellitus. Diabetes Care, 5(7), 900-
904.
59
Suzuki, S. (2002). Serological Differences among the patogenic Candida spp. In R. A. Calderone (Ed.), Candida and candidiasis (pp. 29-36). Washington DC: ASM Press.
Taff, H.T., Nett, J.E., et al. (2012). A candida biofilm-induced pathway for matrix glucan
delivery: implications for drug resistance. PLoS Pathog, 8(8), 1-13. Trofa, D., Gácser, A., et al. (2008). Candida parapsilosis, an Emerging Fungal Pathogen. Clin
Microbiol Review, 21(4), 606-625. Ventura, A.G., Pasqualotto, A.C., et al. (2004). Candidemia in a brazillian tertiary care hospital:
species destribution and Antifungal susceptibility patterns. Revi. Inst. Med. trop. S. Paulo, 46(5), 239-241.
Wisplinghoff, H., Bischoff, T., et al. (2004). Nosocomial bloodstream infections in US hospitals:
analysis of 24,179 cases from a prospective nationwide surveillance study. Clin Infect Dis, 39(3), 309-317.
Yanq, Y. (2003). Virulence factors of Candida species. Journal Microbiol Immunol Infect, 36(4),
223-228.
60
Science, my lad, is made up of mistakes, but they are mistakes which it is
useful to make, because they lead little by little to the truth.
In A journey to the center of the earth
Julius Verne, 1864