effect of farming system for nutrition m.venkata
TRANSCRIPT
WORKING PAPER 202/2020
Nithya DJ S Raju
R V Bhavani Akshaya Kumar Panda
Rupal D.Wagh Brinda Viswanathan
EFFECT OF FARMING SYSTEM FOR NUTRITION ON NUTRITIONAL INTAKES: A STUDY OF TWO
REGIONS IN INDIA
MADRAS SCHOOL OF ECONOMICS Gandhi Mandapam Road
Chennai 600 025 India
August 2020
MSE Working Papers
Recent Issues
* Working papers are downloadable from MSE website http://www.mse.ac.in $ Restricted circulation
* Working Paper 193/2020 Institutional Design and Credibility Jyotsana Kala and Naveen Srinivasan
* Working Paper 194/2020 A Constant Gain Learning Framework to understand the behaviour of US Inflation and Unemployment in the 2nd half of 20th century M.Venkata Raamasrinivas and Naveen Srinivasan
* Working Paper 195/2020 Information Theoretic Ranking of Extreme Value Returns Parthajit Kayal, Sumanjay Dutta, Vipul Khandelwal and Rakesh Nigam
* Working Paper 196/2020 Inflation Targeting in the United Kingdom: Is there evidence for Asymmetric Preferences? Pranjal Rawat, Naveen Srinivasan
* Working Paper 197/2020 The Oil Story: Is it Still the Same? Swati Singh and Naveen Srinivasan
* Working Paper 198/2020 Inventory Cycles and Business Cycles – Has the relationship lost its importance over the years: A Time-Varying Parameter Approach using U.S. Data Parijat Maitra and Naveen Srinivasan
* Working Paper 199/2020 From Income to Household Welfare : Lessons from Refrigerator Ownership in India Sowmya Dhanaraj, Vidya Mahambare and Poonam Munjal
* Working Paper 200/2020 Double Burden of Malnutrition in India : Decadal Changes among Adult Men and Women Brinda Viswanathan and Archana Agnihotri
* Working Paper 201/2020 Understanding the Water Crisis in India: Application of Causal Loop Modelling to Examine the Environment-Economy Interlinkage across Sectors Ashwin Ram Sridharan and Zareena Begum Irfan
i
Effect of Farming System for Nutrition on Nutritional Intakes: A Study of Two Regions in India
Nithya D. J.
M.S.Swaminathan Research Foundation, Chennai
S. Raju M.S.Swaminathan Research Foundation, Chennai
R. V. Bhavani M.S.Swaminathan Research Foundation, Chennai
Akshaya Kumar Panda M.S.Swaminathan Research Foundation, Chennai
Rupal D. Wagh M.S.Swaminathan Research Foundation, Chennai
and
Brinda Viswanathan (Corresponding author)
Madras School of Economics [email protected]

ii
WORKING PAPER 202/2020
August 2020
Price : Rs. 35
MADRAS SCHOOL OF ECONOMICS Gandhi Mandapam Road
Chennai 600 025
India
Phone: 2230 0304/2230 0307/2235 2157
Fax: 2235 4847/2235 2155
Email : [email protected]
Website: www.mse.ac.in

iii
Effect of Farming System for Nutrition on Nutritional Intakes: A Study of Two
Regions in India
Nithya D.J., S. Raju, R. V. Bhavani, Akshaya Kumar Panda,
Rupal D. Wagh and Brinda Viswanathan
Abstract
In nutrition insecure regions of rural India, farming system with focus on nutrition (or FSN) can prove effective in improving access and availability for nutrient intake. In 2017, a few villages in Koraput district, Odisha and Wardha district, Maharashtra were involved to increase their crop diversity, intercropping of pulses and cereals, promotion of seasonal fruits and vegetables and nutrition awareness. About 75-80 percent of households voluntarily agreed to involve, for whom the reported dietary habits were recorded in 2014, before the FSN interventions and in 2017, after the interventions. This study reports the findings from reported dietary changes for the two years. Household food consumption is converted into its nutrient content and normalized by the demographic composition of the households. The intake of micronutrients like vitamin A, vitamin C, iron and calcium show larger improvements compared to calories and proteins. This is partly because the intervention focused more on dietary quality than in improving energy dense food. The changes are more apparent in Wardha as their nutrient intakes and dietary diversity were low in 2014. Households in Koraput benefitted substantially from the newly introduced schemes for clean cooking fuel and sanitation thereby improving hygienic environment that would enable improved nutrient absorption. Key words: Rural, Household Survey, Crop Diversification, Home Garden,
Nutrition
JEL Codes: D13, I15, Q12, Q18, R11

iv
Acknowledgement This research is part of the data generated by the Leveraging Agriculture for Nutrition in South Asia Research (LANSA) research consortium, and is funded by UK Aid from the UK government. The views expressed do not necessarily reflect the UK Government‟s official policies. The results of the study were presented in the 3rd Agriculture, Nutrition and Health (ANH) Academy week from 25-29 June, 2018 at Accra, Ghana; Symposium on Leveraging Agriculture for Nutrition at Golden Jubilee Conference of Nutrition Society of India, November 2018 at National Institute of Nutrition, Hyderabad; Workshop on Agriculture and the Imperatives of Food and Nutrition Security organized by IIT Bombay, APAARI and NABARD 6-7 Dec 2018, Mumbai and International Consultation on Promoting Nutrition- Sensitive Approaches: Linking Agriculture, Health and Nutrition towards Malnutrition free Odisha organised by Dept. of Panchayati Raj and Drinking Water, Govt. of Odisha Supported by Azim Premji Philanthropic Initiatives (APPI) 18 Oct 2019, Bhubaneswar.
Nithya D.J. S. Raju
R. V. Bhavani Akshaya Kumar Panda
Rupal D. Wagh
Brinda Viswanathan
1
INTRODUCTION
Poor nutritional status affects the productivity of the adults and the
physical growth and cognitive abilities of the children impairing their
economic mobility as an adult and hence generates a vicious cycle of
poverty and undernutrition. Several production and consumption based
interventions that were implemented over the years to reduce nutrition
insecurity have been effective only in a limited manner. During the
decades of higher economic growth, the better skilled in the organized
services sector benefitted the most with least gains for those in the
agricultural sector. The period of high economic growth in India was not
able to absorb the surplus labour from rural areas. However, this period
saw the implementation of schemes like National Rural Employment
Guarantee Scheme and investment in rural roads through Pradhan Mantri
Gram Sadak Yojana resulting in increased wages and consumption
among the poorer sections of the rural population alongside a modest
decline in poverty rates. Thus, there had been a decline in undernutrition
rates during this period but the reduction was not commensurate with
the high economic growth and India still accounted for large numbers of
stunted and underweight children and neonatal mortality rates. The irony
is in the fact that those involved with food production system are among
the highly nutrition insecure.
One of the major limitations of many of the earlier interventions
in the Indian context has been its inability to connect farming activities
with the household member‟s nutritional security. The farming system for
nutrition (FSN) approach (Das et. al., 2014; Nagarajan et. al., 2014)
gives the scope to introduce location specific agricultural activities to
address food and nutrition security of small holder farmers. The systemic
approach emphasizes strongly on creating awareness (by the intervention
team) not only on farming and home gardens but also on diets, hygiene
and access to public programs that could subsidise cost of production, or
of basic commodities or of health care. Thus, FSN gives scope for
involvement of different stakeholders around a cluster of villages aiming

2
at sustainability of the agriculture-nutrition linkage and gives equal
priority to behavioural change among both food producers and food
consumers. This is different from nutrition-sensitive agriculture, where
food based approach to agriculture is at the core and other features
mentioned under FSN were included later (Ruel et. al., 2018).
A feasibility study on a Farming System for Nutrition (FSN)
approach to address the problem of undernutrition was undertaken in
India under a research consortium programme on „Leveraging Agriculture
for Nutrition in South Asia‟ (LANSA). LANSA was a multi country research
programme consortium funded by Department for International
Development, UK. The core research question underlying the study was:
How strong is the evidence that agricultural interventions can be pro-
nutrition? FSN as defined by Professor M S Swaminathan, envisages the
introduction of location-specific agricultural remedies for nutritional
maladies by mainstreaming nutritional criteria in the selection of farming
system components involving crops, animals and wherever feasible fish
(Nagarajan et. al., 2014). It is an interventional approach that includes a
combination of sustainable measures including advanced crop production
practices, bio-fortification, promotion of nutrition gardens of fruits and
vegetables, livestock and poultry development, and setting up of small-
scale fisheries, combined with nutrition awareness, as stimulant for
rendering consistent output of higher income and better nutrition. The
objective is to address malnutrition in all its forms, viz. calorie
deprivation, protein deficiency and hidden hunger (i.e. micronutrient
deficiencies).
This study documents the findings on changes in per consumer
unit energy and protein intake and intake of four micronutrients among
households that participated in FSN intervention in a few villages
belonging to two different agro-climatic regions of India. The findings are
based on a feasibility study and not an experimental study. The
interventions involved an increase in production of some of the existing
crops, as well as diversification and nutrition awareness, and thus have

3
four components. The crop based interventions focused not just on
increasing output of the existing ones but also on diversification so that
improving soil quality becomes an added feature. Home garden
intervention focused on increasing availability of fruit, leafy and other
vegetables, roots and tubers to specifically improve micronutrient intake.
Poultry and fisheries intervention focused on improving protein intakes.
Nutrition awareness interventions focused on generating awareness
about nutrient content in different foods and the importance of balanced
diet. Thus, in this study comparison is on the household nutrient intakes,
adjusted for age-sex composition of the household (i.e. intake of per
consumer unit of different nutrients), as reported by the households,
before and after the introduction of FSN interventions. The baseline
survey was conducted in 2014 and the endline survey was in 2017.
INTEGRATION OF FOOD AND NUTRITION SECURITY: AN
OVERVIEW
In 2017-18, about 50 percent of households are involved with agriculture
as the main activity with 56 percent of rural males and 73 percent of
rural women involved with agriculture as the main source of employment
(GoI, 2019). The share of agriculture in GDP declining to about 13
percent in 2019 and undernutrition rates among children less than five
years of age, for stunting (41 percent) and wasting (38 percent) being
ten percentage points higher in rural than in urban areas in 2015. Those
in rural areas and more likely to be involved with agriculture tend to
share burden of nutrition insecurity in India. Shetty (2009) discusses the
opportunity that agriculture and agricultural biotechnology offers for
increasing food and nutrition security. The increased availability of food
with higher nutrient content from biofortification as well as increased
crop yields and crop diversification ensure both food and nutrition
security. Since the non-availability of nutritious food has been one of the
important reasons for high undernutrition in several regions of the world,
interventions that increase the supply become imminent.

4
In most of the undernourished regions of the world, agriculture is
the main occupation of the people. Nutrition-sensitive agriculture (NSA)
that gives the scope to enhance production, productivity and crop
diversification is the food based approach to increase availability of
nutritionally rich food for overcoming undernutrition and micronutrient
deficiencies. The pathway for increased and a more smoothened
consumption is from either own produce (in the absence of markets) or
from market purchases or in some instances from both (Ruel et. al.,
2018). The monetized part of consumption arises from increase in
incomes due to sale of agricultural produce in the markets. This results in
improved accessibility and affordability towards purchase of more
diversified food items.
A smoothened consumption of diverse diets is only one aspect to
improve nutrition security. Supply of health care and clean environment
(which includes clean water, sanitation and clean cooking fuel) is also an
important input to maintain good health. In the absence of these, the
absorption of nutrients is weak and impairs cognitive development of
young children and hence affects their long term productivity as adults.
In the short run, timely intervention to health setbacks as well as a
disease free environment ensures lower morbidity and mortality of
children and adults. Infrequent illness of adults has positive implications
for smooth flow of incomes as well as the care time that mothers give
towards the upbringing of healthy children in-utero and beyond.
Education and women‟s empowerment are two key demand side factors
that strongly influence food and nutrition security as they play a strong
role in reducing the adverse influence of cultural factors like gender
discrimination, or adverse dietary and health practices. The inclusion of a
strong behavior change communication (BCC) component in any
intervention becomes imperative for enhancing the potential impacts of
agriculture on diets and other nutrition outcomes.
The role of the state in regulating the market that benefits both
net producers and net consumers of food and provision of services like

5
transportation, storage, health and education are very relevant. In order
to improve nutrition security, government intervention alone will not
succeed and the role of the community of individuals involved with
agriculture and related non-governmental organizations is very
important. As a country develops, it is now increasingly envisaged that
the state will be more of a regulator so that the synergies between
market and community (the other two stakeholders) will result in
minimizing the trade-off between efficiency and equity.
Clearly, a nutrition sensitive agriculture intervention should have
all these features and farming system for nutrition has been envisaged
keeping these aspects in mind and hence is unique to the nature of
interventions. As agriculture is primarily a rural activity, the studies focus
mainly on rural areas and that too among the farming households as
they possess the land and are the target for agricultural intervention.
However, this gives a partial assessment as agricultural labour
households are also a part of the farming system but as they do not
possess land hence get excluded from direct participation in the crop
intervention programs. However, such households can participate in FSN
interventions like poultry or home-garden interventions. Besides, farming
system interventions are expected to have an overall impact on the local
food systems. On the one hand there will be an increase in diversified
availability of food in the local market. On the other hand, in order that
net producers benefit from the surplus production the net consumers
should also have enhanced purchasing power to buy from the market.
This may be possible for instance, when agricultural labour households
could benefit through increased demand for labour due to the FSN
intervention and hence increased returns to labour which makes
diversified diets affordable. Studies rarely discuss this aspect of the entire
rural economy benefitting from crop diversification. Such features as well
as the effect on nutrient outcomes are not discussed in this study and
this study highlights only the impact of crop diversification on nutrient
intakes.

6
Agriculture and Nutrition Linkages
The overall objective of nutrition-sensitive agriculture as given by FAO
(2014) is to make the global food system better equipped to produce
good nutritional outcomes. FAO has reported that nutrition-sensitive
agricultural approach can be implemented by increasing agricultural
production which makes more food available and affordable and
improves both the health and the economic status of the community.
Family farming, home gardens and homestead food production can make
a wider variety of crops available at the local level.
Ruel et. al., (2018) reviewed the evidence from research on
nutrition–sensitive agriculture published since 2014 and reported that
agricultural development programs that promote production diversity,
micronutrient-rich crops (including biofortified crops), dairy, or
small animal rearing, can improve the production and consumption of
targeted commodities, and that such improvements lead to increase in
dietary diversity at the household level. Herforth (2010) found that crop
diversity in smallholder farmers‟ diet was significantly associated with
dietary diversity and was more closely related to home food consumption
than to purchased food consumption; farmers used many varieties of the
same crop for different purposes, and within-crop diversity was
correlated with increased consumption of that crop. Empirical results
from both the dynamic and linear models using panel data covering 41
countries from 1980-2009, showed that agricultural productivity have a
significant positive effect on all food security measures (Ogundari and
Awokuse, 2016).
Pellegrini and Tasciotti (2014) show based on nationally
representative data for early 2000s from eight developing countries, that
there is a positive association between the number of crops produced
and the number of foods consumed by the rural households. The study
also shows that ownership of livestock and ruminants are also associated
with increase in dietary diversity. The access channel seems to be the
key pathway. The landless households are not separately analysed but

7
the land area and crop diversification does not seem to show a strong
association. In the econometric specification, once crop diversification is
controlled for, land area is not statistically significant indicating that land
size and number of crops could be correlated. However, crop
specialization could be more prevalent in large farm area due to scale
economies and the higher income that this may fetch compared to small
farms where the scope for interspersed vegetables could improve crop
diversification. Smallholder farmers are likely to diversify in production
and they are also the ones at the lower end of dietary diversity.
A study by Hazel et. al. (2015) in Nepal showed that production
diversity is positively associated with maternal and child dietary diversity,
and WHZ; women‟s group membership, control over income, reduced
workload, and overall empowerment are positively associated with better
maternal nutrition. Control over income is positively associated with HAZ;
Women‟s empowerment mitigates the negative effect of low production
diversity on maternal and child dietary diversity and HAZ. Headey and
Hoddinott (2016) reported that rice yields predict the earlier introduction
of complementary foods to young children (most frequently rice) as well
as increases in their weight-for-height, but no improvements in their
dietary diversity or height-for-age. For improvement in an adult woman‟s
BMI, dietary diversity matters, and equal importance must be given to
environmental conditions like better quality of drinking water, good
sanitation, smoke-free cooking area and better access to healthcare
facilities (Viswanathan et. al., 2015).
STUDY LOCATION
The FSN study under LANSA was conducted in seven villages of Koraput
district in the state of Odisha and five villages of Wardha district in the
Vidarbha region of Maharashtra. These locations were purposively
selected due to the contrasting features with regard to agro-climatic and
socio-economic conditions, land holding status, agricultural practices and
food consumption pattern. The villages were chosen on the basis of their

8
contrasting agro-climatic and socio-economic characteristics, agricultural
practices and food consumption pattern. Both the locations, Wardha
district in Maharashtra and Koraput district in Odisha were districts
declared as high burden districts of malnutrition by government of India.
Though both sites are rain-fed farming areas, Koraput is characterised by
subsistence farming, while Wardha is dominated by commercial crop
cultivation (Das et. al., 2014). The harvested agriculture produce were
mostly sold in markets and very less or no produce was retained for
household consumption. The food consumption pattern was cereal based
as most of energy was from cereals. Agrarian crises and farmer suicide
has been extensively documented in Wardha while Koraput is an agro-
biodiversity hotspot, threatened by erosion of natural resources and food
insecurity (Bhaskar et. al., 2017).
The child (age 0-71 months) underweight rate in 2002-04 (IIPS,
2006) was 52.5 percent in Wardha and 43.5 percent in Koraput. In a
decade‟s time by 2015-16, this decreased to 36.1 percent in Wardha and
44.4 percent in Koraput, according to NFHS-4 (IIPS and ICF, 2017 and
2018). Further, the prevalence of anemia in Wardha district was 48.5
percent among 6-59 months children, 42.4 percent among 15-49 years
women and 43.4 percent among pregnant women in the same age
group; in Koraput district, 71.4 percent of 6-59 months children, 63.4
percent of 15-49 years women and 60.5 percent of pregnant women
were anaemic.
Majority of people in the selected villages belonged to scheduled
tribes and lived in kutcha houses. Wood was used as a major source of
cooking fuel. In Wardha, half of the population sourced water from piped
water while in Koraput, it was sourced from tube well. Open defecation
was practiced by majority of the households in both the locations. More
than half of the head of the households did not have formal education in
Koraput and in Wardha, 77 percent of the heads of households had
formal education. Majority of them were cultivators followed by
agricultural wage laborers with 80.7 percent as marginal farmers in
9
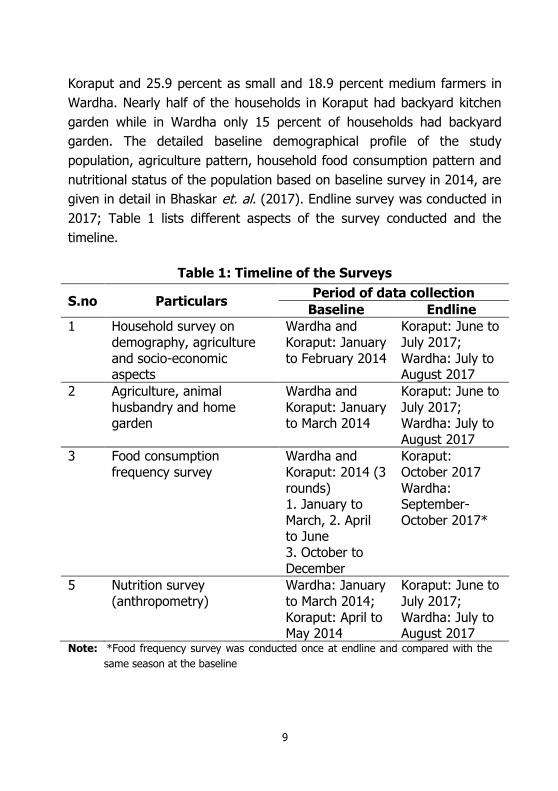
Koraput and 25.9 percent as small and 18.9 percent medium farmers in
Wardha. Nearly half of the households in Koraput had backyard kitchen
garden while in Wardha only 15 percent of households had backyard
garden. The detailed baseline demographical profile of the study
population, agriculture pattern, household food consumption pattern and
nutritional status of the population based on baseline survey in 2014, are
given in detail in Bhaskar et. al. (2017). Endline survey was conducted in
2017; Table 1 lists different aspects of the survey conducted and the
timeline.
Table 1: Timeline of the Surveys
S.no Particulars Period of data collection
Baseline Endline
1 Household survey on
demography, agriculture
and socio-economic aspects
Wardha and
Koraput: January
to February 2014
Koraput: June to
July 2017;
Wardha: July to August 2017
2 Agriculture, animal
husbandry and home garden
Wardha and
Koraput: January to March 2014
Koraput: June to
July 2017; Wardha: July to
August 2017
3 Food consumption
frequency survey
Wardha and
Koraput: 2014 (3
rounds) 1. January to
March, 2. April to June
3. October to
December
Koraput:
October 2017
Wardha: September-
October 2017*
5 Nutrition survey
(anthropometry)
Wardha: January
to March 2014;
Koraput: April to May 2014
Koraput: June to
July 2017;
Wardha: July to August 2017
Note: *Food frequency survey was conducted once at endline and compared with the
same season at the baseline

10
STUDY DESIGN
The FSN interventions were carried out in 2015 and 2016 with baseline
survey conducted in 2014 and endline survey conducted in 2017.
Baseline description of the villages is in Bhaskar et al (2017) and Nithya
et. al. (2018). Detailed information on FSN intervention in Koraput and
Wardha is reported elsewhere (Pradhan et. al., 2017a and b). Once the
villages were identified as discussed in Das et al (2014), baseline survey
and on farm demonstration of the farm based interventions were
conducted simultaneously (Nagarajan et. al., 2014; Pradhan et. al.,
2017a and b).
The core strategies of the farming system to address nutritional
concerns in the two locations were focused on increasing the availability
of cereals, millets and pulses for household food requirement by
enhancing production at the farm level, and of fruits and vegetables
through promotion of nutrition gardens. The main objectives of the
intervention and a broad summary of the improvements in farming
related outcomes are given below:
1. To improve the dietary diversity from home consumption through
widening the on-farm crop diversity. The farming intervention
were introduced to improve inter crop diversity as was suitable to
the local agro-climatic conditions (Pradhan et. al., 2017a and b).
2. Among the irrigated land of the villages of Wardha, zinc and iron
enriched wheat varieties were introduced for the first time in rabi
season (Pradhan et. al., 2017b). As shown in Table 2 (below) the
16 percent of the households who were earlier growing the
normal variety of wheat were given the biofortified seeds and
awareness about managing the crop was also introduced to
them. The production increased from 1500kg/ha in 2014 to 3200
kg/ha in 2017 and the standard deviation declined from 157 to
48.
11
3. Promotion of vegetable cultivation through household and
community level gardens with naturally bio-fortified fruits and
vegetables species and nutri-dense varieties especially green
leafy vegetables to address micronutrient malnutrition. The
households were given seeds and saplings for growing additional
varieties and also larger in numbers to better utilise the space
and the seasonal varieties. Papaya and drumstick trees were
given special emphasis for growing in the garden as they could
be maintained easily for a range vitamin and minerals that they
consume as vegetable, fruit, leaves and flowers (for drumstick).
More importantly, the adult member of the households and
middle school children were given special awareness session to
consume the fruits and vegetables. It was observed that in
Wardha even though drumstick was growing in that region, there
was no preference for consumption. Hence, special culinary
sessions were conducted to give the recipes for its consumption
and awareness about the nutrition aspects was emphasized. In
the endline survey it was observed that the households reported
consumption and hence seemed to have shown an acceptance to
the drumstick and its leaves (Pradhan et. al., 2018).
4. One of the crops for the nutrition garden, newly introduced was
orange fleshed sweet potato (OFSP) which is vitamin A enriched
(biofortified) sweet potato to be grown in the kharif season. In
Koraput however some households took to growing it on their
farmland also. Among the 22 percent of the households that
produced this crop there, the production was 6300kg/ha with
22kg as the standard deviation).
5. Promotion of animal based food interventions included fishery
(community and individual) in Koraput and backyard poultry in
Wardha.
6. In Koraput, with the help of district fishery department,
interventions like, renovation of the pond for greater water

12
retention, packages of practices involving pre and post stock
management to improve the fish harvest1. Due to the
intervention the number of ponds for fishery increased from 23 in
2014 in 4 villages to 64 ponds in 16 villages. As the irrigation of
the pond was from rainwater during the kharif season, the data
on output showed an increase from 142 kgs in 2015 to 1829 kgs
in 2017 during this season. As the output of fish increased, the
proportion sold to the market increased from 7 percent to 50
percent. Interestingly, as the number of ponds and hence the
output of fish increased, the home consumption share declined
from 68 percent to 32 percent as the storage and consumption of
a huge harvest would have been difficult in a very short span of
time. Thus, the availability of fish in the local market during this
production season had increased leading to a possible increase in
protein and calcium content of the food intake in Koraput.
7. In Wardha the backyard poultry intervention was given to
landless households. Improved quality of chick breeds was given
so that increased home consumption of eggs and later on for
meat would be possible. This intervention was assisted by the
Maharashtra Animal and Fishery Science University. Since these
were only 25 households a case study of these households is
reported describing their production and consumption pattern in
20162.
8. Nutrition awareness was focussed mainly on improving
household dietary diversity and promoting hygienic practices.
The awareness campaign was done with the help of “Community
Hunger Fighters (CHF)”. In this approach villagers are selected
by the intervention team and trained on nutrition security in
general and educating them about the FSN pathway to improve
nutrition (Narayanan and Rao, 2019). MSSRF has been practicing
1http://59.160.153.187/sites/default/files/Fishery%20Case%20study-Koraput.pdf
2http://59.160.153.187/sites/default/files/Poultry%20case%20study-Wardha%20-%20final.pdf
13
this methodology considered as sustainable as the selected CHFs
are from the village and hence will find it easy to communicate
and interact with the local population. Further, community level
awareness in schools was done by commemorating nutrition and
health related days (Narayanan et. al., 2018).
In order to understand the changes in the household‟s
production and consumption pattern after the FSN intervention, an
endline survey of 190 households each in Koraput and Wardha were
conducted. The inclusion criterion of the households was purposive with
focus on households that had at least one child below the age of five
years in 20143. Among the 190 sample households in each location, 34 in
Koraput and 32 in Wardha were those who did not partake in the
intervention out of their own choice. The remaining 156 and 158
households respectively in Koraput and Wardha had at least one
intervention. They are hereinafter referred to as FSN households. Two
FSN households in Koraput and four households in Wardha were not
taken for the analysis in the present paper as they were found to be
outliers with regard to reported food consumption.
Table 2 below shows the distribution of households across
different types of FSN intervention. The variation in the number and type
of interventions across households got determined by how the
households perceived their land holding pattern and household labour
availability.
3One of the aims of the intervention was to see improvements in children’s nutritional status after the
intervention. Hence households with at least one child below 5 years were considered. In Koraput
the sample households were about 190 that had such a demographic composition. In Wardha the number of such households were little lower than 190 so the next inclusion criterion was to
include household with an adolescent girl at the time of baseline survey. Between 2014 and 2017,
the demographic composition of Koraput changed with about 40 newborn babies and the age increased from less than five years to older age group. However, in Wardha the age specific
demographic composition remained more or less the same.

14
Table 2: Cropping Pattern by Households (percent) that
Participated in the Intervention
Koraput (N=156) Wardha (N=158)
Crops Baseline Endline Crops Baseline Endline
Finger millet 29 (45) 50 (78) Sorghum 6 (9) 26 (41)
Pigeon pea 0 21 (33) Pigeon pea 65 (103) 41 (65)
OFSP 0 22 (34) Green gram 0 25 (40)
Green gram 14 (22) 37(58) Black gram 0 19 (30)
Black gram 5 (7) 29 (45) Wheat 16 (25) 16 (25)
Fishery 0 13 (21) Bengal gram 11 (17) 21 (33)
Nutrition
garden
77 (120) 63 (98*) Poultry 0 15 (24)
Nutrition garden
20 (32) 88 (138)
Note: *remaining households followed traditional gardening; Figures in parenthesis
denotes number
RESULTS AND DISCUSSION
As indicated in the previous section, that FSN intervention was designed
as a feasibility study. In such studies the procedure for assessing the
impact is by associations and correlations between the intervention and
outcomes. In the broader literature this study is comparable to an
observation study (Ruel et al., 2018). In this study we use dietary
diversity as the focus and convert the intakes into the nutrient content
that may be derived from different types of intervention. Table 3 below
gives the socio-demographic profile and land holding pattern of the
households in the two regions. In Koraput the households are largely
from OBC or ST households and the education levels are lower while the
caste diversity is higher in Wardha. 80 percent of participating
households in Koraput owned land compared to 75 percent in Wardha.
15
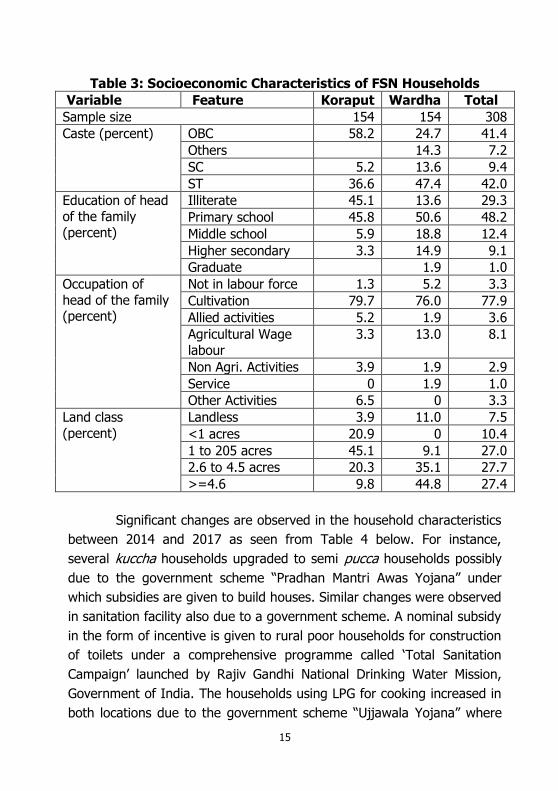
Table 3: Socioeconomic Characteristics of FSN Households
Variable Feature Koraput Wardha Total
Sample size 154 154 308
Caste (percent) OBC 58.2 24.7 41.4
Others 14.3 7.2
SC 5.2 13.6 9.4
ST 36.6 47.4 42.0
Education of head
of the family
(percent)
Illiterate 45.1 13.6 29.3
Primary school 45.8 50.6 48.2
Middle school 5.9 18.8 12.4
Higher secondary 3.3 14.9 9.1
Graduate 1.9 1.0
Occupation of
head of the family (percent)
Not in labour force 1.3 5.2 3.3
Cultivation 79.7 76.0 77.9
Allied activities 5.2 1.9 3.6
Agricultural Wage
labour
3.3 13.0 8.1
Non Agri. Activities 3.9 1.9 2.9
Service 0 1.9 1.0
Other Activities 6.5 0 3.3
Land class
(percent)
Landless 3.9 11.0 7.5
<1 acres 20.9 0 10.4
1 to 205 acres 45.1 9.1 27.0
2.6 to 4.5 acres 20.3 35.1 27.7
>=4.6 9.8 44.8 27.4
Significant changes are observed in the household characteristics
between 2014 and 2017 as seen from Table 4 below. For instance,
several kuccha households upgraded to semi pucca households possibly
due to the government scheme “Pradhan Mantri Awas Yojana” under
which subsidies are given to build houses. Similar changes were observed
in sanitation facility also due to a government scheme. A nominal subsidy
in the form of incentive is given to rural poor households for construction
of toilets under a comprehensive programme called „Total Sanitation
Campaign‟ launched by Rajiv Gandhi National Drinking Water Mission,
Government of India. The households using LPG for cooking increased in
both locations due to the government scheme “Ujjawala Yojana” where
16
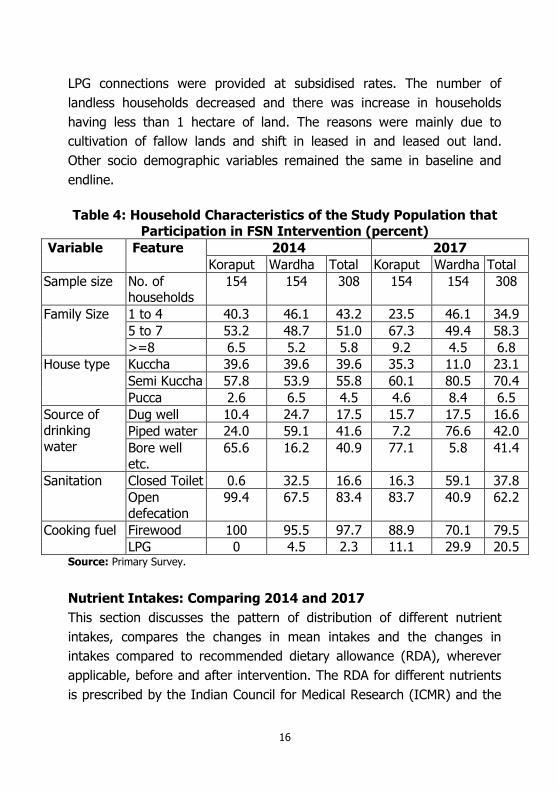
LPG connections were provided at subsidised rates. The number of
landless households decreased and there was increase in households
having less than 1 hectare of land. The reasons were mainly due to
cultivation of fallow lands and shift in leased in and leased out land.
Other socio demographic variables remained the same in baseline and
endline.
Table 4: Household Characteristics of the Study Population that
Participation in FSN Intervention (percent)
Variable Feature 2014 2017
Koraput Wardha Total Koraput Wardha Total
Sample size No. of households
154 154 308 154 154 308
Family Size 1 to 4 40.3 46.1 43.2 23.5 46.1 34.9
5 to 7 53.2 48.7 51.0 67.3 49.4 58.3
>=8 6.5 5.2 5.8 9.2 4.5 6.8
House type Kuccha 39.6 39.6 39.6 35.3 11.0 23.1
Semi Kuccha 57.8 53.9 55.8 60.1 80.5 70.4
Pucca 2.6 6.5 4.5 4.6 8.4 6.5
Source of drinking
water
Dug well 10.4 24.7 17.5 15.7 17.5 16.6
Piped water 24.0 59.1 41.6 7.2 76.6 42.0
Bore well
etc.
65.6 16.2 40.9 77.1 5.8 41.4
Sanitation Closed Toilet 0.6 32.5 16.6 16.3 59.1 37.8
Open
defecation
99.4 67.5 83.4 83.7 40.9 62.2
Cooking fuel Firewood 100 95.5 97.7 88.9 70.1 79.5
LPG 0 4.5 2.3 11.1 29.9 20.5 Source: Primary Survey.
Nutrient Intakes: Comparing 2014 and 2017
This section discusses the pattern of distribution of different nutrient
intakes, compares the changes in mean intakes and the changes in
intakes compared to recommended dietary allowance (RDA), wherever
applicable, before and after intervention. The RDA for different nutrients
is prescribed by the Indian Council for Medical Research (ICMR) and the

17
reference is given in Table 5. All these comparisons are analysed
separately for Koraput and Wardha.
Table 5: RDA for Nutrients for A Reference Man Doing Sedentary
Activity
Nutrients RDA/CU/day
Protein (g) 60
Energy (Kcal) 2320
Calcium (mg) 600
Iron (mg) 17
Vitamin A (µg) 600
Vitamin C (mg) 40
The total nutrient consumed per day by the household was
divided by the total household consumer unit (CU - values given for
different age group doing different type of physical activity and
physiological status in ICMR (2012) to arrive at per CU/day). CU for a
reference man is 1 and this varies for women (who requires lesser than
the reference man) and different age group. Detailed explanation is given
in ICMR (2012) page 9.
Energy Intakes
The average per CU per day (pcu-pd) energy intake was higher for
Koraput than Wardha in the year 2014, prior to the intervention (Table
6). The average cereal intakes have not changed in Koraput while in
Wardha it has increased on an average by about 33 percent. However in
Wardha, the changes are substantial as noted from Figure 1. The test for
equality of means shown in Table 6 confirms further that mean energy
intakes have not changed in Koraput while in Wardha it has gone up by
an average of 626 kcal per consumer unit per day. The dispersion in
energy intakes is also lower in Koraput as observed from the spread of
the density function in Figure 1 and also the lower variance as seen in
Table 6 compared to Wardha for both the years.

18
The improvements in energy intake in Wardha in 2017 have
ensured that 97 percent of the people now have intakes above 70
percent of RDA (Table 7). It is to be noted that to ensure average pcu-pd
intakes are closer to the ICMR norms, almost all the population should be
consuming more than 70 percent of RDA. For Koraput the average intake
values are closer to the ICMR norm in both the years. On the whole it
appears that in Koraput as the intakes were close to the RDA in 2014,
perhaps the households also did not feel the need to increase intakes.
However, in Wardha the increased consumption is very welcome but the
source of this change is not clear. Is it due to a better awareness
program given that average intakes were low? Or has there been a
demographic shift towards more adult population?
Table 6: Tests for Equality of Mean Per Consumer Unit Per Day
Energy (kcal) Intake, Prior to and Post Intervention in FSN Households
Koraput Wardha
2014 2017 Change 2014 2017 Change
Mean 2633.3 2734.1 100.9 1854.1 2480.5 626.3
Standard Error 58.61 58.72 82.96 36.11 46.08 58.54
Standard Deviation 727.36 726.30 448.06 571.81
Sample Size 154 154 154 154
t-statistics 1.22 10.69***
p-value 0.1125 0.0000 Note: *** indicates statistical significance at 1 percent.
Table 7: Distribution of FSN households by energy intake as per
RDA (percent)
2014 2017
RDA Koraput Wardha Koraput Wardha
<50 percent 1.90 1.90
50 percent- 70 percent 1.30 29.90 2.60 2.60
≥70 percent 96.80 68.20 97.40 97.40 Note: RDA-Recommended Dietary Allowance, based on table 5
19
The higher average intake and a lower variance among Koraput
households is a positive feature. The higher average intake could be
justified as the physical activity in a hilly terrain and in a tribal setting is
expected to be higher and to that extent there is access to adequate
calories on an average for these households. The variability in
consumption among households being lower shows that between
households it appears like a more equitable access and availability for
consumption but within household variability cannot be ascertained with
this information.
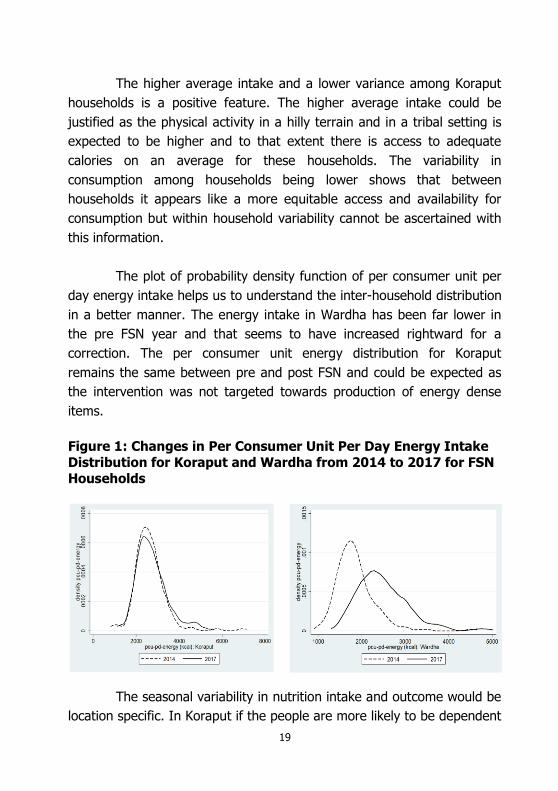
The plot of probability density function of per consumer unit per
day energy intake helps us to understand the inter-household distribution
in a better manner. The energy intake in Wardha has been far lower in
the pre FSN year and that seems to have increased rightward for a
correction. The per consumer unit energy distribution for Koraput
remains the same between pre and post FSN and could be expected as
the intervention was not targeted towards production of energy dense
items.
Figure 1: Changes in Per Consumer Unit Per Day Energy Intake
Distribution for Koraput and Wardha from 2014 to 2017 for FSN
Households
The seasonal variability in nutrition intake and outcome would be
location specific. In Koraput if the people are more likely to be dependent

20
on home consumption or neighbourhood markets then there is a
possibility that there may be seasonal variability in consumption and
physical activity due to seasonal variation in produce. In comparison
Wardha being situated closer to an urban center, the access to markets
may be easier provided affordability is not an issue. In this sense, the
households in Wardha may prefer to sell a larger part of their agricultural
produce in the market and use the cash income to buy food and non-
food items to their preference. However, here also there could be
seasonal variability in consumption if the cash flow of the income varies
with agricultural season. Another issue of concern with purchase on the
basis of one‟s choice is whether the income would be spent on nutritious
food items.
The seasonal variability in consumption would be an important
aspect to focus upon when there is seasonal variability both in physical
activity and availability/affordability of food. This raises two issues. First,
would be related to storage of surplus production so that consumption is
smoothened during lean season. The second would be the sale of the
produce in the market and the cash income should be sufficient to
purchase the commodity and equally importantly is the availability and
affordability of the commodity in the markets during all seasons. This
would require a more detailed and longitudinal study of the households
to understand the channels of supply of commodities, physical activity
patterns and an assessment of nutrition outcomes like BMI of the adults
and height and weight of the children (Rao and Raju, 2019). The
anthropometric measures are a net of intakes and energy expenditures
and hence useful in making these assessments.
The awareness program introduced the households to improved
storage and healthy eating habits. In Koraput, before intervention 83
percent of the energy was obtained from cereals and millet. In Wardha,
at baseline 63 percent of energy was obtained from cereals and millets
followed by fats and oils. Remaining energy was obtained from pulses
and legumes and other vegetables like cauliflower, brinjal, cowpea pods,

21
etc in Wardha and beans, ivy gourd, kankoda, bitter gourd etc in
Koraput. But at endline, energy from cereals and millets declined to 73
percent in Koraput while majority of energy in Wardha was supplied by
cereals and millets followed by pulses and legumes due to pulses
intervention.
The endline survey shows that the number of households that
increased finger millet cultivation increased from 29 percent to 50
percent in Koraput with yield increasing from 400 kg per hectare to 2500
kg per hectare. This increase in more households using this crop is from
using upland left fallow and that was part of intervention to educate
people on how to do so. This also increased consumption from home
produce from 21 percent to about 40 percent. In Wardha sorghum
cultivation was already low at about 6 percent in 2014 with 9 households
cultivating it. In 2017 this increased to about 40 households, accounting
for 26 percent of the households as shown in Table 2 above.
Once again here also if the demographic composition increased
towards adults then in both places the increased need for energy intakes
seem to have been satisfied either from home consumption or from
market. So even though iron fortified sorghum was a component of FSN
intervention in Wardha, its uptake for crop production has been lower
though the average yield per hectare has doubled from 1000 kg/ha to
2000 kg/ha. The report shows that pulses have been intercropped with
sorghum.
Protein Intake
Table 8 below gives comparison of mean and standard deviation of per
consumer unit protein values for FSN households before and after the
interventions. Koraput has a higher mean protein intake compared to
Wardha. Post intervention, the protein intakes increased by 10gms per
consumer unit per day in Koraput, while in Wardha the 25 gms average
increase was about 40 percent higher than the pre-intervention average
and thus, making the mean intake to be higher than in Koraput. The
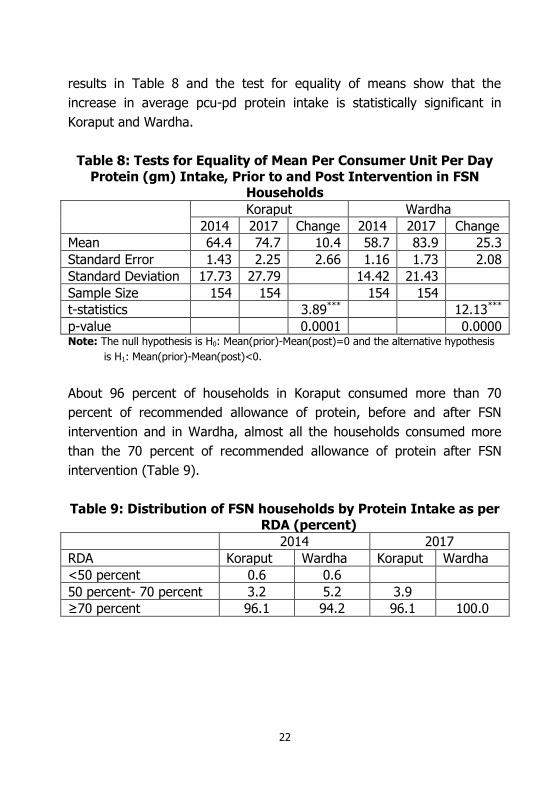
22
results in Table 8 and the test for equality of means show that the
increase in average pcu-pd protein intake is statistically significant in
Koraput and Wardha.
Table 8: Tests for Equality of Mean Per Consumer Unit Per Day
Protein (gm) Intake, Prior to and Post Intervention in FSN Households
Koraput Wardha
2014 2017 Change 2014 2017 Change
Mean 64.4 74.7 10.4 58.7 83.9 25.3
Standard Error 1.43 2.25 2.66 1.16 1.73 2.08
Standard Deviation 17.73 27.79 14.42 21.43
Sample Size 154 154 154 154
t-statistics 3.89*** 12.13***
p-value 0.0001 0.0000 Note: The null hypothesis is H0: Mean(prior)-Mean(post)=0 and the alternative hypothesis
is H1: Mean(prior)-Mean(post)<0.
About 96 percent of households in Koraput consumed more than 70
percent of recommended allowance of protein, before and after FSN
intervention and in Wardha, almost all the households consumed more
than the 70 percent of recommended allowance of protein after FSN
intervention (Table 9).
Table 9: Distribution of FSN households by Protein Intake as per
RDA (percent) 2014 2017
RDA Koraput Wardha Koraput Wardha
<50 percent 0.6 0.6
50 percent- 70 percent 3.2 5.2 3.9
≥70 percent 96.1 94.2 96.1 100.0

23
Figure 2: Changes in Per Consumer Unit Per Day Protein
Intake Distributions for Koraput and Wardha from 2014 to 2017 for FSN households
The protein intake is expected to have gone up from home
consumption based on the food sources like pulses in both locations and
meat and poultry in Wardha and fish in Koraput, that could largely be
from consumption from own production after FSN intervention. In
Koraput, the distribution of pcu-pd protein intake shows that the right tail
has increased after FSN shifting the density away from values around 60
gms to more than 100 gms (Figure 2). In Wardha there has been
substantial rightward shift of the distribution of pcu-pd protein intake
where initially the mode was at about 59 gms and average at 58 gms but
now the minimum intake starts at about 50 gms.
Compared to Koraput, the changes are more visible in Wardha as
the quantity and frequency of consumption of pulses was more in
Wardha than in Koraput, for the FSN households, where there is a
rightward shift in the entire distribution. Thus, with FSN intervention
those at the lower end of the distribution and all others seem to have
improved the intakes. Before intervention, 68 percent of protein was
obtained from cereals and millets followed by pulses and legumes (12.6
percent) which changed to 57 percent and 14.3 percent respectively due
to the pulse intervention. Protein obtained from fishes and sea foods
0
.01
.02
.03
.04
den
sity p
cu-p
d-p
rote
in
0 50 100 150 200pcu-pd-protein (gram): Wardha
2014 2017
24
increased from 3 percent to 7 percent after intervention in Koraput. In
Wardha, 63 percent of protein was obtained from cereals and millets at
baseline, decreased to 50 percent and the protein from pulses increased
from 20 percent to 25 percent. The percentage share of meat and
poultry (7 percent) remained the same while the share from fishes and
sea foods increased from 2 percent to 6 percent.
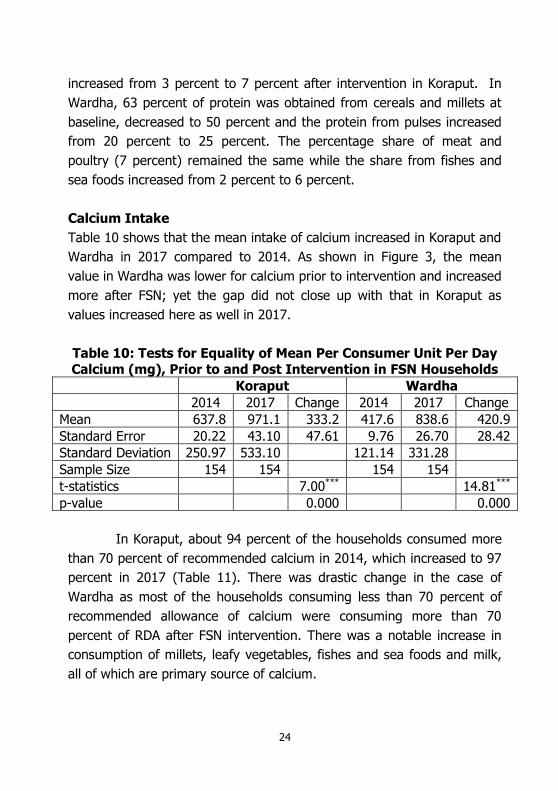
Calcium Intake
Table 10 shows that the mean intake of calcium increased in Koraput and
Wardha in 2017 compared to 2014. As shown in Figure 3, the mean
value in Wardha was lower for calcium prior to intervention and increased
more after FSN; yet the gap did not close up with that in Koraput as
values increased here as well in 2017.
Table 10: Tests for Equality of Mean Per Consumer Unit Per Day
Calcium (mg), Prior to and Post Intervention in FSN Households
Koraput Wardha
2014 2017 Change 2014 2017 Change
Mean 637.8 971.1 333.2 417.6 838.6 420.9
Standard Error 20.22 43.10 47.61 9.76 26.70 28.42
Standard Deviation 250.97 533.10 121.14 331.28
Sample Size 154 154 154 154
t-statistics 7.00*** 14.81***
p-value 0.000 0.000
In Koraput, about 94 percent of the households consumed more
than 70 percent of recommended calcium in 2014, which increased to 97
percent in 2017 (Table 11). There was drastic change in the case of
Wardha as most of the households consuming less than 70 percent of
recommended allowance of calcium were consuming more than 70
percent of RDA after FSN intervention. There was a notable increase in
consumption of millets, leafy vegetables, fishes and sea foods and milk,
all of which are primary source of calcium.

25
Table 11 Distribution of FSN households by calcium intake as per
RDA (percent) 2014 2017
RDA Koraput Wardha Koraput Wardha
<50 percent 0.6 11.7 0.7 0.0
50 percent- 70 percent 5.8 50.6 2.0 1.9
≥70 percent 93.5 37.7 97.4 98.1
The large rightward shift in the distribution of pcu-pd calcium
intake as shown in Figure 3 is expected given that mean intake increased
by 300 to 400 gms pcu-pd. In 2014 the lower intake shows low spread of
the distribution and is substantiated by the lower standard deviation in
Table 10 above. The increase in mean intakes in 2017 has resulted in a
large variance between households.
Figure 3: Changes in Per Consumer Unit Per Day Calcium Intakes Distributions for Koraput and Wardha from 2014 to
2017 for FSN Households
The calcium increase in Koraput may have been due to increased
consumption of ragi (finger millet) and green leafy vegetables sourced
from home production and fish from market. In Wardha, leafy vegetables
and fishes sourced from market are the likely sources. Majority of calcium
consumed in Koraput at baseline was from cereals and millets, mainly
from finger millet followed by leafy vegetables which remained the same

26
after intervention. But the calcium from fish and sea foods increased
from 9 percent to 25 percent. In Wardha, at baseline, majority of calcium
was obtained from cereals and millets followed by leafy vegetables and
milk and milk products, this changed after intervention, i.e., most of the
calcium consumed was from fish and seas foods followed by cereals and
millets, leafy vegetables and milk and milk products.
Iron Intake
The average pcu-pd iron intake in Koraput was seen to have been lower
among all households in 2014 compared to Wardha (Table 12). In 2017,
there has been an overall increase in intake but the gaps in intakes
between the two regions have been maintained. The increase in mean
intake results in a marginal increase in variance.
Table 12: Tests for Equality of Mean Per Consumer Unit Per Day
Iron intake (mg), Prior to and Post Intervention in FSN Households
Koraput Wardha
2014 2017 Change 2014 2017 Change
Mean 14.79 20.32 5.53 20.50 30.13 9.63
Standard Error 0.575 0.644 0.86 0.405 0.598 0.72
Standard Deviation 7.140 7.965 5.027 7.424
Sample Size 154 154 154 154
t-statistics 6.40*** 13.33***
p-value 0.0000 0.0000
The average consumption of iron in Wardha meets the
recommended level of iron and after intervention all households were
consuming more than 70 percent of recommended allowance (Table 13).
In Koraput, the percentage of households consuming more than 70
percent of recommended allowances increased from 71 percent to 92
percent. This could mainly be due to the increased consumption of
millets, pulses and other vegetables in both locations after FSN
intervention. Figure 4 shows the distributional change in iron intakes with
larger change in Wardha than Koraput.
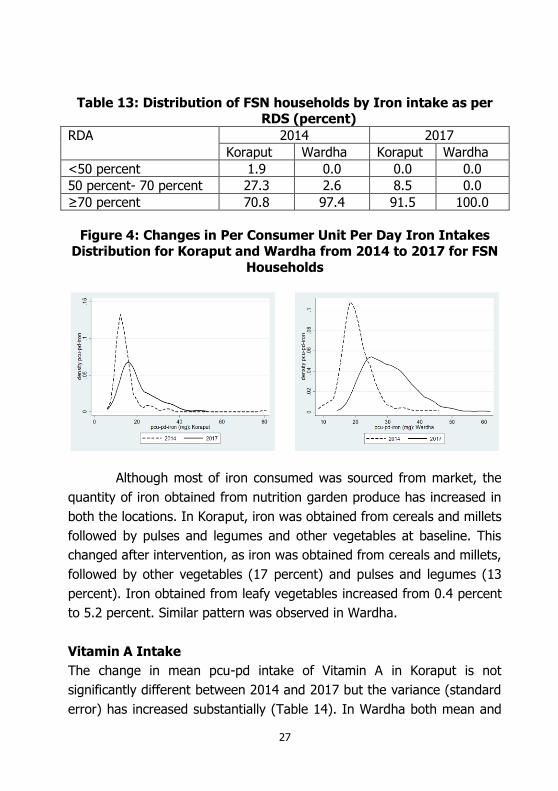
27
Table 13: Distribution of FSN households by Iron intake as per RDS (percent)
RDA 2014 2017
Koraput Wardha Koraput Wardha
<50 percent 1.9 0.0 0.0 0.0
50 percent- 70 percent 27.3 2.6 8.5 0.0
≥70 percent 70.8 97.4 91.5 100.0
Figure 4: Changes in Per Consumer Unit Per Day Iron Intakes Distribution for Koraput and Wardha from 2014 to 2017 for FSN
Households
Although most of iron consumed was sourced from market, the
quantity of iron obtained from nutrition garden produce has increased in
both the locations. In Koraput, iron was obtained from cereals and millets
followed by pulses and legumes and other vegetables at baseline. This
changed after intervention, as iron was obtained from cereals and millets,
followed by other vegetables (17 percent) and pulses and legumes (13
percent). Iron obtained from leafy vegetables increased from 0.4 percent
to 5.2 percent. Similar pattern was observed in Wardha.
Vitamin A Intake
The change in mean pcu-pd intake of Vitamin A in Koraput is not
significantly different between 2014 and 2017 but the variance (standard
error) has increased substantially (Table 14). In Wardha both mean and

28
variance in pcu-pd Vitamin A values have increased. The increased
average intake in Wardha in 2017 is statistically significant but the small
increase in mean intakes in Koraput is not statistically significant.
Table 14: Tests for Equality of Mean Per Consumer Unit Per Day Vitamin A (µg) intake Prior to and Post -Intervention in FSN
Households
Koraput Wardha
2014 2017 Change 2014 2017 Change
Mean 471.4 492.0 20.6 341.9 675.4 333.5
Standard Error 20.92 32.67 38.80 11.71 20.08 23.25
Standard Deviation 259.64 404.14 145.26 249.25
Sample Size 154 154 154 154
t-statistics 0.53 14.35***
p-value 0.2979 0.0000
In Koraput the increase in variance seems to have an adverse
effect when pcu-pd RDA values are considered in 2017. About 44 percent
have pcu-pd RDA values below 50 percent in 2017 in Wardha and
increased from about 20 percent of the households in 2014. Although
there was slight increase in the mean intake in Koraput 2017, the
percentage of households consuming less than 50 percent increased and
above 70 percent of RDA decreased (Table 15). Wardha shows a large
decline in <50 percent and 50-70 percent so that about 87 percent are in
>70 percent RDA values. In Wardha, due to the increase in the
consumption of vegetables, the percentage of households consuming
more than 70 percent of recommended allowance increased.
Table 15: Distribution of FSN Households by Vitamin A Intake as
per RDA (percent) RDA 2014 2017
Koraput Wardha Koraput Wardha
<50 percent 19.5 42.2 44.4 0.6
50 percent- 70 percent 33.0 39.6 19.6 12.3
≥70 percent 46.8 18.2 35.9 87.0

29
Given the change in pattern of distribution with respect to RDA,
the distribution in Koraput shows a leftward shift in 2017 compared to
2014 (Figure 5). The distributional shift for Vitamin A in Wardha is
substantial with a large proportion in the higher end values but with a
marked increase in variance when the mean is also high.
Figure 5: Changes in Per Consumer Unit Per Day Vitamin A
Intake Distribution for Koraput and Wardha from 2014 to 2017
for FSN Households
Vitamin A was obtained majorly from leafy vegetables followed
by fruits and other vegetables in 2014 in Koraput which remained the
same in 2017 also but the percentage share increased. In Wardha,
vitamin A was obtained from leafy vegetables (65 percent) followed by
meat and poultry (13 percent) at baseline while the percentage share of
vitamin A from leafy vegetables was 55 percent and 10 percent from
other vegetables and meat and poultry followed by fruits.
Vitamin C Intake
Intake of vitamin C estimated in 2014 have high average values and in
2017 the reported values more than doubled in Koraput and almost
doubled in Wardha. The large increase in mean values in Koraput has
also resulted in a large increase in variance (standard error) but such
large increase in variance is not noted in Wardha.

30
Table 16: Tests for Equality of Mean Per Consumer Unit Per Day
Vitamin C (mg) intake Prior to and Post Intervention in FSN Households
Koraput Wardha
2014 2017 Change 2014 2017 Change
Mean 63.2 170.2 107.0 61.2 107.0 45.8
Standard Error 2.82 11.71 12.05 2.25 2.57 3.42
Standard Deviation 34.95 144.91 27.95 31.94
Sample Size 154 154 154 154
t-statistics 8.89*** 13.40***
p-value 0.0000 0.0000
Before intervention, almost all the households in both locations
were consuming more than 70 percent of the recommended level of
vitamin C which remained the same after intervention as show in Table
17 below.
Table 17: Distribution of FSN Households by Vitamin C Intake as
per RDA (percent)
2014 2017
RDA Koraput Wardha Koraput Wardha
<50 percent 0.6 0.0 0.0 0.0
50 percent- 70 percent 4.5 1.9 0.7 0.0
≥70 percent 94.8 98.1 99.3 100.0
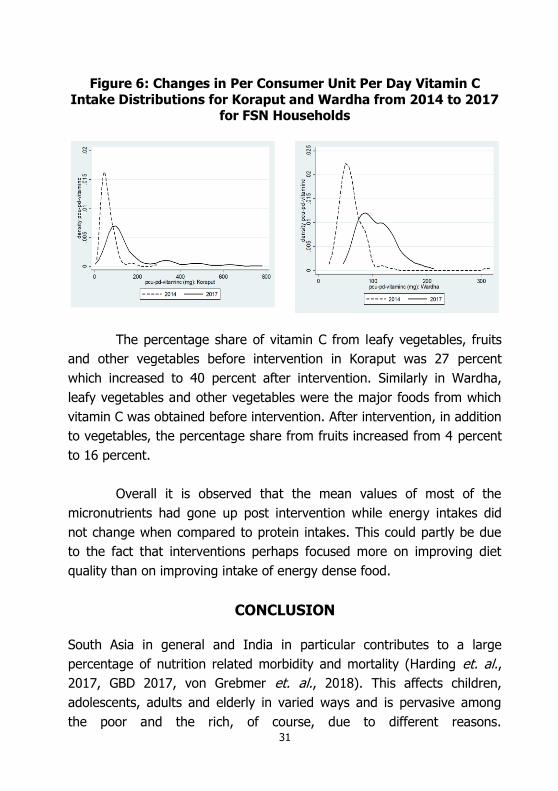
As the mean intakes, variances and RDA values show, the
distribution has shifted rightward for a large number of households
(Figure 6). The long right tail for Koraput is the reason for high variance
while in Wardha also we see the spread having increased with an
increase in modal value.
31
Figure 6: Changes in Per Consumer Unit Per Day Vitamin C
Intake Distributions for Koraput and Wardha from 2014 to 2017 for FSN Households
The percentage share of vitamin C from leafy vegetables, fruits
and other vegetables before intervention in Koraput was 27 percent
which increased to 40 percent after intervention. Similarly in Wardha,
leafy vegetables and other vegetables were the major foods from which
vitamin C was obtained before intervention. After intervention, in addition
to vegetables, the percentage share from fruits increased from 4 percent
to 16 percent.
Overall it is observed that the mean values of most of the
micronutrients had gone up post intervention while energy intakes did
not change when compared to protein intakes. This could partly be due
to the fact that interventions perhaps focused more on improving diet
quality than on improving intake of energy dense food.
CONCLUSION
South Asia in general and India in particular contributes to a large
percentage of nutrition related morbidity and mortality (Harding et. al.,
2017, GBD 2017, von Grebmer et. al., 2018). This affects children,
adolescents, adults and elderly in varied ways and is pervasive among
the poor and the rich, of course, due to different reasons.
32
Malnourishment among the better privileged arises from larger intake of
energy dense food and lower intake of fruits and vegetables alongside
rapid changes in lifestyles. The less privileged are undernourished due to
inadequate quantity and quality of diets. Consequently, countries like
India face triple burden of malnutrition across different segments of the
population: low intake of macronutrients and widespread inadequacy of
micronutrient intake among the lower income groups and micronutrient
deficiency and high intake of macronutrients specifically lipids among
higher income groups (Meenakshi, 2016; Agrawal, et. al., 2014). All this
adds to a huge burden of disease affecting the economic prosperity and
health of individuals and hence the nation.
In this context it is important that diverse diets are affordable
along with its sustainable availability for both rural and urban consumers
in India and along withnutrition awareness. This would not only improve
nutrition security for the undernourished but also among the richer
segments of the population whose diets are not healthy and who are
prone to overweight and obesity. This study focused on two less
developed rural regions of India, to improve nutrition security using the
FSN approach. The impact is analysed based on the change in mean per
consumer unit per day intakes of energy, protein, vitamin A, vitamin C,
iron and calcium. In most instances we find a statistically significant
increase in these values. In spite of a time gap of nearly three years
between 2014 (baseline) and 2017 (endline) measurements, the results
show a positive change indicating that the interventions are having a
sustained impact.
The method of assessment for household composition adjusted
nutrient intakes does not indicate seasonal patterns of consumption. This
may be very important to understand as agricultural harvests and
availability of fruits and vegetables are largely seasonal in nature. Surplus
output and good storage facilities for the semi-perishables and diversity
in different fruits and vegetables all through the year need to be ensured.
If it was possible to collect such data then understanding seasonal

33
fluctuations in nutrition insecurity if any is crucial to address through
some forms of intervention. Another limitation is that the dietary intake is
measured at the household level and reported as per consumer unit to
take into account the demographic composition of the household. This
may not be adequate to make any comment about changes in the
pattern of intra-household distribution arising from the FSN intervention.
Although reviewing these parameters periodically would also be
challenging unlike the anthropometric indicators which could be collected
more frequently particularly for children. However, while assessing
nutrition outcomes, morbidity patterns and hygienic conditions become
relevant given that absorption of nutrients and hence the anthropometry
would depend on an individual‟s health condition.
With a declining share of agriculture in GDP and volatile growth
rate of sub-sectors within agriculture and allied sectors, undernutrition
rates will decline only when public policies improve land and labour
productivity, access to clean water, sanitation and clean cooking fuel, and
primary health care. The slowing down of the Indian economy in the last
two years would mean that investment in infrastructure and such public
policies would decline with detrimental effects on nutrition security
among the vulnerable sections of the rural population. At the same time,
the discussion on what should be the extent of involvement of the
government and the community for nutrition security by improving
access, availability, affordability and awareness remains valid. This study
has demonstrated the role of a non-governmental organization in
demonstrating the feasibility of a farming system of nutrition approach by
providing inputs for farming activities as well as in creating awareness
and optimally using the public provisioning of services to the extent
accessible to the population in improving dietary diversity in two low
income regions of the country. The approach can be seen as a case for
nutrition sensitive agriculture interventions and programmes among
populations dependent on agriculture.

34
REFERENCES
Agrawal Sutapa, Christopher J Millett, Preet K Dhillon, SV Subramanian
and Shah Ebrahim (2014), “Type of Vegetarian Diet, Obesity and
Diabetes in Adult Indian Population”, Nutrition Journal, 13:89. http://www.nutritionj.com/content/13/1/89
[Accessed on 29-6-2017]
Bhaskar, A.V.V., D.J. Nithya, S. Raju, and R.V. Bhavani (2017),
“Establishing Integrated Agriculture-nutrition Programmes to Diversify Household Food and Diets in Rural India”, Food Security, 9:981-999.
Das, P. K., R.V. Bhavani and M.S. Swaminathan (2014), “A Farming
System Model to Leverage Agriculture for Nutritional Outcomes”, Agricultural Research, 3(3), 193–203.
FAO (Food and Agriculture Organization) (2014), “Nutrition-Sensitive
Agriculture, In: Better Nutrition Better Lives”, Rome, Italy;
2014.http://www.fao.org/3/a-as601e.pdf
GBD (2017), “Diet Collaborators: Health Effects of Dietary Risks in 195 Countries, 1990–2017: A Systematic Analysis for the Global
Burden of Disease Study 2017”. Lancet 2019, published online
April 3.http://dx.doi.org/10.1016/ S0140-6736(19)30041-8.
GoI (Government of India) (2019), “Annual Report: 2017-18, Periodic
Labour Force Survey: July, 2017-June 2018”, National Statistics Office, Ministry of Statistics and Program Implementation: New
Delhi.
Harding Kassandra, L., Víctor M Aguayo and Patrick Webb (2017),
“Hidden Hunger in South Asia: A Review of Recent Trends and Persistent Challenges”, Public Health Nutrition, 21(4), 785-795.
doi:10.1017/S1368980017003202 [Accessed on 12-6-2019]
Hazel Jean L. Malapit, Suneetha Kadiyala, Agnes R. Quisumbing, Kenda
Cunningham and Parul Tyagi (2015), “Women‟s Empowerment Mitigates the Negative Effects of Low Production Diversity on
Maternal and Child Nutrition in Nepal”, The Journal of Development Studies 51(8):1097-1123. DOI:
10.1080/00220388.2015.1018904. http://www.tandfonline.com/doi/pdf/10.1080/00220388.2015.10
18904

35
Headey D.D. and Hoddinott J (2016), “Agriculture, Nutrition and the
Green Revolution inBangladesh”, Agricultural Systems 149: 122-131. DOI:10.1016/j.agsy.2016.09.001
Herforth, A. (2010), “Promotion of Traditional African Vegetables in Kenya and Tanzania: A Case Study of an Intervention
Representing Emerging Imperatives in Global Nutrition”, PhD thesis, Cornell University, Ithaca, NY.
ICMR (Indian Council of Medical Research) (2012), “Nutritive Value for Indian Foods”, National Institute for Nutrition, Hyderabad, India
International Institute for Population Sciences (IIPS) (2006), “District
Level Household Survey (DLHS-2)”, 2002-04: India. Mumbai:
IIPS.
International Institute for Population Sciences (IIPS) and ICF (2018), “National Family Health Survey (NFHS-4)”, India, 2015-16:
Maharashtra. Mumbai: IIPS.
International Institute for Population Sciences (IIPS) and ICF (2017),
“National Family Health Survey (NFHS-4)”, India, 2015-16: Odisha. Mumbai: IIPS.
von Grebmer, K., J. Bernstein, L. Hammond, F. Patterson, A. Sonntag, L. Klaus, J. Fahlbusch, O. Towey, C. Foley, S. Gitter, K. Ekstrom,
and H. Fritschel (2018), “2018 Global Hunger Index: Forced Migration and Hunger”, Bonn and Dublin: Welthungerhilfe and
Concern Worldwide.
https://www.globalhungerindex.org/pdf/en/2018.pdf [Accessed on 15-1-2019]
Meenakshi, J.V. (2016), “Trends and Patterns in The Triple Burden of Malnutrition in India”, Agricultural Economics, 47: S1, 115-134.
Nagarajan, S., R.V. Bhavani and M.S. Swaminathan (2014), “Operationalizing the Concept of Farming System for Nutrition
Through the Promotion of Nutrition-sensitive Agriculture”, Current Science,107(6), 959–964.

36
Narayanan, R., D.J. Nithya, Akshaya Kumar Panda and Rupal D.Wagh
(2018), “Community Hunger Fighters: Action Research in Integrating Adult Nutrition Literacy in Farming System for
Nutrition”, MSSRF research report, MSSRF / RR / 18 / 51.
http://59.160.153.188/library/sites/default/files/Report percent20-Nutrition percent20Awareness-LANSA-26
percent20Dec percent2018_0.pdf
Narayanan, Rama and Nitya Rao (2019), “Adult Learning for Nutrition
Security: Challenging Dominant Values Through Participatory Action Research in Eastern India”, Studies in the Education of Adults, DOI: 10.1080/02660830.2019.1573782 https://doi.org/10.1080/02660830.2019.1573782
Nithya, D.J., S. Raju, Akshaya Kumar Panda, Mahesh, R. Maske, Rupal D.Wagh, Jasaswini Pandey and R.V. Bhavani (2018), “Baseline
Survey Report of Nineteen Villages from Two States of India”, MSSRF Research Report, MSSRF/RR/18/45.
http://lansasouthasia.org/sites/default/files/Baseline percent20Survey percent20Report-FSN percent20Study.pdf
Nitya Rao and S. Raju (2019), “Gendered Time, Seasonality, and Nutrition: Insights from Two Indian Districts”, Feminist
Economics. DOI: 10.1080/13545701.2019.1632470 https://doi.org/10.1080/13545701.2019.1632470
Ogundari, Kolawole and Awokuse, Titus (2016), "Assessing the Contribution of Agricultural Productivity to Food Security levels in
Sub-Saharan African countries", 2016 Annual Meeting, July 31-August 2, Boston, Massachusetts 235730, Agricultural and
Applied Economics Association.
Pellegrini, Lorenzo and Tasciotti, Luca (2014), “Crop Diversification,
Dietary Diversity and Agricultural Income: Empirical Evidence from Eight Developing Countries”, Canadian Journal of Development Studies, 35 (2), 211-227.
DOI:10.1080/02255189.2014.898580
37
Pradhan, A., A.V.V. Bhaskar, Mahesh R. Maske (2017a), “Crop based
Demonstrations and Trials under Farming System for Nutrition Study in Wardha (2013‐16)” MSSRF Research Report, MSSRF/RR
/17/42, Chennai: MSSRF, 35 pp.
http://59.160.153.188/library/sites/default/files/Crop percent20interventions percent20under percent20FSN-2013-16-
Wardha.pdf
Pradhan, A., Akshaya Kumar Panda and A.V.V. Bhaskar (2017b), “Crop Based Demonstrations and Trials under Farming System for
Nutrition Study in Koraput (2013‐16)”, MSSRF Research Report, MSSRF / RR / 17 / 43, Chennai: MSSRF, 44 pp.
http://59.160.153.188/library/sites/default/files/Crop percent20interventions percent20under percent20FSN-2013-16-
Koraput.pdf
Pradhan A., S. Raju, Akshaya Kumar Panda and Rupal D.Wagh (2018), “Improving Household Diet Diversity Through Promotion of
Nutrition Gardens in India”, American Journal of Food Science and Nutrition, 5(2): 2018, pp. 43-51.
https://www.aascit.org/journal/archive2?journalId=907andpaper
Id=6544
Ruel Marie, T., Harold Alderman and Child Nutrition Study Group (2013),
„Nutrition-sensitive Interventions and Programmes: How Can
They Help to Accelerate Progress in Improving Maternal and Child Nutrition?”, The Lancet: Maternal and Child Nutrition Series,
382 9891, 536-551.
https://www.thelancet.com/journals/lancet/article/PIIS0140-6736(13)60843-0/fulltext
Ruel Marie, T., Agnes R. Quisumbing and Mysbah Balagamwala (2018),
“Nutrition-sensitive Agriculture: What Have We Learned So Far?‟ Global Food Security, 17, 128-153.
https://doi.org/10.1016/j.gfs.2018.01.002
Shetty, P. (2009), “Incorporating Nutritional Considerations When
Addressing Food Insecurity”‟ Food Security, 1, 431–440.
Viswanathan, B., Getsie David, Swarna Vepa and Bhavani R.V., (2015),
“Dietary Diversity and Women‟s BMI Among Farm Households in
Rural India”, LANSA Working Paper Series, September, 2015 (3) https://assets.publishing.service.gov.uk/media/57a0899fe5274a3
1e00001a6/LANSA_Working_Paper_Series_No3.pdf
MSE Monographs
* Monograph 34/2015
Farm Production Diversity, Household Dietary Diversity and Women’s BMI: A Study of
Rural Indian Farm Households
Brinda Viswanathan
* Monograph 35/2016
Valuation of Coastal and Marine Ecosystem Services in India: Macro Assessment
K. S. Kavi Kumar, Lavanya Ravikanth Anneboina, Ramachandra Bhatta, P. Naren,
Megha Nath, Abhijit Sharan, Pranab Mukhopadhyay, Santadas Ghosh,
Vanessa da Costa and Sulochana Pednekar
* Monograph 36/2017
Underlying Drivers of India’s Potential Growth
C.Rangarajan and D.K. Srivastava
* Monograph 37/2018
India: The Need for Good Macro Policies (4th Dr. Raja J. Chelliah Memorial Lecture)
Ashok K. Lahiri
* Monograph 38/2018
Finances of Tamil Nadu Government
K R Shanmugam
* Monograph 39/2018
Growth Dynamics of Tamil Nadu Economy
K R Shanmugam
* Monograph 40/2018
Goods and Services Tax: Revenue Implications and RNR for Tamil Nadu
D.K. Srivastava, K.R. Shanmugam
* Monograph 41/2018
Medium Term Macro Econometric Model of the Indian Economy
D.K. Srivastava, K.R. Shanmugam
* Monograph 42/2018
A Macro-Econometric Model of the Indian Economy Based on Quarterly Data
D.K. Srivastava
* Monograph 43/2019
The Evolving GST
Indira Rajaraman

WORKING PAPER 202/2020
Nithya DJ S Raju
R V Bhavani Akshaya Kumar Panda
Rupal D.Wagh Brinda Viswanathan
EFFECT OF FARMING SYSTEM FOR NUTRITION ON NUTRITIONAL INTAKES: A STUDY OF TWO
REGIONS IN INDIA
MADRAS SCHOOL OF ECONOMICS Gandhi Mandapam Road
Chennai 600 025 India
August 2020
MSE Working Papers
Recent Issues
* Working papers are downloadable from MSE website http://www.mse.ac.in $ Restricted circulation
* Working Paper 193/2020 Institutional Design and Credibility Jyotsana Kala and Naveen Srinivasan
* Working Paper 194/2020 A Constant Gain Learning Framework to understand the behaviour of US Inflation and Unemployment in the 2nd half of 20th century M.Venkata Raamasrinivas and Naveen Srinivasan
* Working Paper 195/2020 Information Theoretic Ranking of Extreme Value Returns Parthajit Kayal, Sumanjay Dutta, Vipul Khandelwal and Rakesh Nigam
* Working Paper 196/2020 Inflation Targeting in the United Kingdom: Is there evidence for Asymmetric Preferences? Pranjal Rawat, Naveen Srinivasan
* Working Paper 197/2020 The Oil Story: Is it Still the Same? Swati Singh and Naveen Srinivasan
* Working Paper 198/2020 Inventory Cycles and Business Cycles – Has the relationship lost its importance over the years: A Time-Varying Parameter Approach using U.S. Data Parijat Maitra and Naveen Srinivasan
* Working Paper 199/2020 From Income to Household Welfare : Lessons from Refrigerator Ownership in India Sowmya Dhanaraj, Vidya Mahambare and Poonam Munjal
* Working Paper 200/2020 Double Burden of Malnutrition in India : Decadal Changes among Adult Men and Women Brinda Viswanathan and Archana Agnihotri
* Working Paper 201/2020 Understanding the Water Crisis in India: Application of Causal Loop Modelling to Examine the Environment-Economy Interlinkage across Sectors Ashwin Ram Sridharan and Zareena Begum Irfan