effect of dividend policy on financial performance of
TRANSCRIPT

EFFECT OF DIVIDEND POLICY ON FINANCIAL PERFORMANCE OF
COMMERCIAL BANKS LISTED AT THE NAIROBI SECURITIES EXCHANGE
BY
JUSTUS KIMUTAI KORIR
A RESEARCH PROJECT SUBMITTED IN PARTIAL FULFILLMENT OF THE
REQUIREMENTS FOR THE AWARD OF THE DEGREE OF MASTER OF BUSINESS
ADMINISTRATION, SCHOOL OF BUSINESS, UNIVERSITY OF NAIROBI
DECEMBER, 2018
ii
DECLARATION I declare this research project is my original work and has not been presented to any academic
institution for any academic reward.
Signature…………………………… Date ……………………….
Justus Kimutai Korir
D61/85819/2016
This research project has been submitted for examination with my approval as the university
Supervisor.
Signature…………………………… Date………………………………
Dr. Duncan Ochieng Elly (PhD, CIFA)
Lecturer, Department of Finance and Accounting
School of Business
University of Nairobi

iii
DEDICATION
I dedicate this research project to my father, Joel Kipkorir Rotich and my mother, Eunice
Chepkemoi Rotich.

iv
ACKNOWLEDGEMENT
This research was successful with the help, guidance and support of my lecturers, family and
friends. I heartily thank my helpful supervisor Dr. Duncan Ochieng Elly for his unwavering
support and unquantifiable guidance to make this research a reality. Special acknowledgement
goes to both my friends and family who provided me with educational resources and their
encouragement and family support. I wish to acknowledge my classmates for teamwork in
carrying out group assignment that resulted to completing the entire course successfully.

v
TABLE OF CONTENTS DECLARATION........................................................................................................................... ii
DEDICATION.............................................................................................................................. iii
ACKNOWLEDGEMENT ........................................................................................................... iv
LIST OF TABLES ...................................................................................................................... vii
LIST OF FIGURES ................................................................................................................... viii
LIST OF ABBREVIATIONS ..................................................................................................... ix
ABSTRACT ................................................................................................................................... x
CHAPTER ONE:INTRODUCTION .......................................................................................... 1
1.1 Background of the Study .......................................................................................................... 1
1.1.1 Dividend Policy .............................................................................................................. 2
1.1.2 Financial Performance .................................................................................................... 3
1.1.3 Dividend Policy and Financial Performance .................................................................. 4
1.1.4 Commercial Banks Listed at Nairobi Securities Exchange ............................................ 5
1.2 Research Problem ..................................................................................................................... 6
1.3 Research Objective ................................................................................................................... 7
1.4 Value of the Study .................................................................................................................... 7
CHAPTER TWO: LITERATURE REVIEW ............................................................................ 9
2.1 Introduction ............................................................................................................................... 9
2.2 Theoretical Review ................................................................................................................... 9
2.2.1 Dividend Irrelevance Theory .......................................................................................... 9
2.2.2 Signal Effect theory ...................................................................................................... 10
2.2.3 Bird in the Hand Theory ............................................................................................... 11
2.3 Determinants of Financial Performance of Commercial Banks ............................................. 12
2.3.1 Liquidity ....................................................................................................................... 12
2.3.2 Asset Quality ................................................................................................................ 13
2.3.3 Capital Adequacy ......................................................................................................... 13
2.3.4 Management Efficiency ............................................................................................... 14
2.3.5 Bank Size ...................................................................................................................... 14
2.4 Empirical Review.................................................................................................................... 14
2.5 Conceptual Framework ........................................................................................................... 17

vi
2.6 Summary of Literature Review ............................................................................................... 18
CHAPTER THREE: RESEARCH METHODOLOGY ......................................................... 21
3.1 Introduction ............................................................................................................................. 21
3.2 Research Design...................................................................................................................... 21
3.3 Population ............................................................................................................................... 21
3.4 Data Collection ....................................................................................................................... 21
3.5 Diagnostic Tests ...................................................................................................................... 22
3.6 Data Analysis .......................................................................................................................... 22
3.7 Test of significance ................................................................................................................. 23
CHAPTER FOUR: DATA ANALYSIS, FINDINGS AND INTERPRETATION ............... 24
4.1 Introduction ............................................................................................................................. 24
4.2 Descriptive Statistics ............................................................................................................... 24
4.3 Diagnostic Statistics ................................................................................................................ 26
4.4 Correlation Analysis ............................................................................................................... 27
4.4.1 Regression Analysis ....................................................................................................... 28
4.5 Interpretation of the Findings.................................................................................................. 30
CHAPTER FIVE: SUMMARY, CONCLUSIONS AND RECOMMENDATIONS ............ 33
5.1Introduction .............................................................................................................................. 33
5.2 Summary of the Findings ........................................................................................................ 33
5.3 Conclusions ............................................................................................................................. 35
5.4 Recommendations ................................................................................................................... 36
5.5 Limitations of the Study.......................................................................................................... 37
5.6 Suggestions for Further Research ........................................................................................... 38
REFERENCES ............................................................................................................................ 39
Appendix I: List of Commercial Banks Listed at NSE................................................................. 41
Appendix II: Analyzed Data ......................................................................................................... 42

vii
LIST OF TABLES
Table 2.1: Summary of the Literature ........................................................................................... 19
Table 4.1: Descriptive Statistics Analysis .................................................................................... 25
Table 4.2: Correlation Matrix ....................................................................................................... 27
Table 4.3: Model Summary .......................................................................................................... 28
Table 4.4: Summary of One Way ANOVA .................................................................................. 29
Table 4.5: Regression Coefficients ............................................................................................... 29

viii
LIST OF FIGURES
Figure 2.1: Conceptual Framework .............................................................................................. 18
Figure 4.1: Histogram ................................................................................................................... 26
ix
LIST OF ABBREVIATIONS
CBK Central bank of Kenya
CMA Capital markets Authority
KBA Kenya Bankers Association
NSE Nairobi Securities Exchange
ROA Return on Assets
SACCOs Savings and Credit Co-operative Societies
x
ABSTRACT Due to the Information Value of the dividends, dividends are considered significant in the firms.
Any change in dividend policy implies that it is as a result of the profitability of the company and
is expected to last for long in the future. When a company increases its dividend payout, it is a
good signal of the company’s expected increase in the earnings.The purpose of this research was
todetermine the effect of dividend policy on the financial performance ofthe commercial banks
listed at Nairobi securities exchange. The research used secondary data which was obtained from
the Capital Markets Authority (CMA) and from the financial statements in the websites of the
listed commercial banks due to its availability. Data was collected for a five year period from
2013 to 2017. Data collected included; total assets, net income, total capital, total loans, total
customer deposits, total liabilities, total dividends and total number of shares outstanding.
Dividend payout ratio, interest rates, leverage, liquidity, capital adequacy, firm size and return on
assets were the study variables. The research was a census study and it adopted a descriptive
design. This design fitted the study that aimed to determine the association between dividend
policy and financial performance variables (Dividend Payout ratio, interest rates, leverage,
liquidity, capital adequacy and firm size).Regression analysis was used to show the effect of
dividend payout ratio, interest rates, leverage, liquidity, capital adequacy and firm size on the
financial performance and correlation analysis was employed to determine the association of the
factors in the model. Data was analyzed on the basis of the mean and the F test statistic was
computed at 5% significance level and an Analysis of Variance (ANOVA).The study established
that thefive independent variables explained 17.2% of variability on the financial performance of
the listed commercial banks which was represented by adjusted R2. The study therefore
concluded that dividend policy affects the financial performance of the commercial banks listed
at the Nairobi securities exchange. The study findings further confirmed a positive relationship
between dividend payout ratio and financial performance. Increase in dividend payout ratio
encourages the investors in investing more assets due to the increased returns. A firm paying
high amount of dividends signifies high performance of the firm. Liquidity was confirmed to be
a major determinant of the profitability and performance; therefore it is recommended that
entities should maintain their liquidity since it was confirmed to be positively related to financial
performance.Finally, the study recommends for an investigation on dividend policies adopted by
local and foreign investment firms and how they affect their financial performance. This will
help in determining the differences in their performance over the years.

1
CHAPTER ONE
INTRODUCTION
1.1 Background of the Study
The payment of dividends in the corporate world is very critical. This is based on the fact that
they constitute a major cash outlay for most of the business entities and this is one of the ways
the investors gets a return from the companies they have invested in (Kim, 2013). In most
companies, the finance managers do not pay out all of the firm'scash flow as the dividends in the
real world. The monies are retained as capital gains and in the process this will act as a source of
internal financing which is less expensive as compared to the external financing (Ross,
1995).Rozeff (1982) argues that dividend policy is a tool used by managers to distribute wealth
to the shareholders than being used as a tool to create wealth for them. Theoretically, dividend
policy influences the financial performance of the business entities dependingonhow the
dividends are distributed to the shareholders.
Dividend irrelevance theory (Modigliani & Miller, 1961), Signal Effect Theory(Ross, 1980) and
Bird in the Hand Theory (Gordon, 1962) will be key in this study. According to the Signal Effect
Theory (Ross, 1980), the increase in the dividend payment is a good signal that the management
has projected the good times ahead which will show an increase in the earnings in the future.
According to the dividend irrelevance theory (Modigliani & Miller, 1961), the value of the firm
mostly is not affected by the dividend policy but rather depends on the company’s investment
policy and the Bird in the Hand Theory (Gordon, 1962) argues that a certain dividend is better
compared to what firms promise as future dividend or in some instances capital gains hence
dividend policy is relevant.

2
There has been the declaration and payment of the dividends by the commercial banks in Kenya.
However, the decision on dividends is critical since it relates to determining whether they should
distribute their earnings or retain them as another strategy for re-investment purposes. The
macroeconomic environment in Kenya, for example the capping of the interest rate has been the
basis in deciding the dividend policy by the commercial banks in Kenya. Interest rate capping
has led to declined profitability of commercial banks and hence poor financial performance
(KBA, 2018).
1.1.1 Dividend Policy
Dividend policy is the guideline the firms use in deciding how much money will be paid out of
their earnings to theshareholders.That proportion of net income that is not paid to the
shareholders is normally for reinvestment that will ensure the earnings grow in future dates. The
term dividend implies the cash which is paid to the shareholder of a business entity out of the
earnings within a certain period of time. The form of dividend payment varies across the
companies. It is normally paid in form of buyback of shares, bonus shares and cash
dividends(Okwar, 2011).
Dividends can also be paid in form of issue of bonus shares and in this scenario, shares are
distributed free of charge to the existing shareholders and this is commonly practiced when
business entities are faced with financial challenges. By the issue of shares in this arrangement,
the number of the outstanding shares of the company increases. This will ensure there is no
dilution in ownership of the company. In the buyback arrangement, the company repurchases its
own shares. In this arrangement, the bought up shares will be extinguished and will not be re-
issued in the process, the equity capital amount will reduce as well as the number of outstanding
3
shares. This is one of the reasons why companies cannot cut their dividend since this signals
inefficient company management. Ideally, the companies with long existence pay higher
dividends due to their financial stability. The newer companies prefer paying lower dividends so
as to save capital for future expansion of the company. Dividend payments can be supported by
the fact that dividends are cash at hand while capital gains are cash in the bush making capital
gains more risk than dividends (Gordon, 1963).
1.1.2 Financial Performance
Any business entity is in the world of business to prosper to greater heights. Prosperity of any
entity normally relates to its performance in monetary terms. Business entities can gauge the
survival of the businesses by analyzing their overall output in monetary terms to determine how
they have effectively and efficiently employed their resources to maximize the returns for the
shareholders. For the business entities to know their worth in terms of growth they can employ
either modern performance measures or traditional measures to measure the performance by
employing comparative methodologies or historical measures to ensure the returns for the
stakeholders are maximized. Therefore, the financial performance can be assessed through the
efficiency, effectiveness and adaptability (Ochieng, 2012).
Return on Equity can be termed as the average income divided by the equity of the stakeholders.
These can be derived from an organization’s financial statements and can beused as the financial
measures of performance. However, in order to fully measure financial performance, it proves
important to incorporate the non-financial measures of performance also. This includes the
efficiency in operations, flexibility in services offered and the dependability of the organization.
4
This enables a comprehensive determination of the performance in a particular organization at a
particular time (Kamar, 2013).
The financial performance can be measured by profitability ratios, liquidity ratios and gearing
measures. Majority of business entities have always used profit as the basis for business
prosperity. However, the real determinant of business growth show efficiently the business
entities have been in the employment of the capital in the business. Due to the shortcomings of
the traditional approaches, the experts in the finance field devised the profitability ratios to
measure the financial performance (Wood, 1998).
1.1.3 Dividend Policy and Financial Performance
The effect of dividend policy on financial performance has been widely researched with different
opinions. Some theorists strongly believe that the payment of dividends increases the values of
the firms involved; others however believe that increased dividend payouts don’t have any
significant effect on the financial performance of the business entities. According to Gordon and
Lintner (1963), the payment of high dividends will reduce risks and this has a direct effect on the
financial performance. Conversely, Litzenberger (1980) argued that low dividend payouts attract
reduced taxes which influence financial performance.
According to Miller and Modigliani (1961), the value of the firm depends only on its basic
earning power and its business risk. Dividend irrelevancy theory forms the basis for formulation
of additional theories that attempt to explain different imperfections in the real world. Bhattarya
(1979) hypothesized that changes in dividend payout are clear signals concerning the present and
future cash-flows, sent out consciously by management to shareholders.

5
Rozeff (1982) also suggested that firms declare dividends to deprive managers of the
unsupervised access to internal financing that can lead to decisions that are detrimental to
shareholders value. He found out that companies whose owners were separated from managers
and dispersed had the least abilities to closely monitor managers and therefore were able to pay
high dividends. Dividend policy has a direct influence on the financial performance of the
companies, consistent trend in the dividend payout ratio improves the share prices and this is an
indication of good performance.
1.1.4 Commercial Banks Listed at Nairobi Securities Exchange
The total number of commercial banks in Kenya as at June 2018 stood at 42. The commercial
bank of Kenya is the regulatory body of all the commercial banks but the Capital Markets
Authority also oversees the operations of the listed commercial banks which are eleven. All
banks areobligated to observe particular prudential guidelines for example the least
emergencycash andliquidity set by thecentral bank. The new developments in banking sector
include credit information sharing systems, agency banking, banc-assurance; mobile banking and
they have stirred improved efficiency in the banks and enhanced competition (CBK, 2017).
The banking industry in the recent past has continuously increased its assets, deposits,
productivity and the various products it offers. The banking industry collective financial
statement has grown to KES 3.60 trillion as at June 2017 (CBK, 2017).Innovations in the
banking sector have contributed to its growth and the increased market share. The growth has
also been necessitated bytheflexibilityby banks to cut their rates after the establishment of
interest capping rate. However, the payment of the dividends recently has not been consistent,
that has been attributed to the interest rate capping.
6
1.2 Research Problem
Due to the Information Value of the dividends, dividends are considered significant in the firms.
According to Jean (1965), in uncertainty world, the payment of dividends is a good signal that
the company is profitable and the company is financially strong in the market. Any change in
dividend policy implies that it is as a result of the profitability of the company and is expected to
last for long in the future. When a company increases its dividend payout, it is a good signal of
the company’s expected increase in the earnings. On the other hand, a decline in dividend payout
signals to the shareholders that the company is underperforming and that management don’t
believe the current dividend policy can be sustained by the company.
Commercial banks in Kenya have been declaring dividends and this is a good signal of improved
financial performance. After the declaration of the dividends, shareholders on the firm's share
register as at a given cut –off date become eligible to receive a dividend once it is paid out. Once
a dividend is declared, the share prices commence trading cum –dividend until the dividend
payment is made to shareholders. Shares trading cum dividend tend to sell at higher prices as
they are expected to factor the proposed dividend component (CMA, 2017).
Nash (2015) in his study in Indonesia between 2012 and 2013 found that dividend policy
positively affected the future earnings of the commercial banks. A study by Okwar (2015) found
out that the dividend payout ratio had no significant effect on the financial performance of the
listed companies at Karachi Stock Exchange. Kamar (2013)did a study on how dividend policy
affected the financial performance in Indian firms.The study findings were that there was
existence of a positive link between dividend policy and financial performance. According to the
results of the study, dividend payout ratio significantly affected the financial performance.
7
In Kenya, a study by Kamau (2013) concluded that dividend policy significantly affected
financial performance of insurance firms in Kenya. In a study by Ochieng (2015) concluded that
dividend payout ratio significantly affected the financial performance of the listed companies in
Kenya. Tarus (2015) confirmed that dividend policy had insignificant effect on the financial
performance of firms in Kenya. An important aspect of this study was the census methodology
whilst the studies by Nash (2014), Okwar (2015), Kamar (2013), Ochieng (2016) and Tarus
(2015) their sample was limited. Many study findings have confirmed mixed outcomes mainly
on the effects of dividend policy on the financial performance.Therefore, the current study
sought to answer this question; what is the effect of dividend policy on the financial performance
of the commercial banks listed at Nairobi Securities exchange?
1.3 Research Objective
The main objective of this research mainly was to investigate the effect of dividend policy on the
financial performance of commercial banks listed at Nairobi Securities Exchange.
1.4 Value of the Study
To the stock broker managers and other investment consultants it is useful when advising their
clients on investment decisions. This will ensure the correct investment decisions are made by
the investors. Investors are interested in return on their investment. This study provides
information on how dividend payouts affects value of their investment with a view to make
better investment choices that maximizes value.
Kenya government is able to make informed decisions as pertaining fiscal and monetary policies
as they impact payment of dividends by companies for example, the study provides more
information on implication of taxes on dividends payouts and capital gains.

8
To the scholars, it is of great use to conduct academic research. It acts as a source of empirical
literature and a ground in conducting further studies in dividend policy and financial
performance.
9
CHAPTER TWO
LITERATURE REVIEW
2.1Introduction
This chapter covered mainly the theoretical review, determinants of financial performance,
empirical review and conceptual framework. Also a brief summary of the literature review was
given at the end of the chapter.
2.2 Theoretical Review
The following theories are related to dividend policy and financial performance and they
include,Dividend Irrelevance Theory (Modigliani & Miller, 1961), Signal Effect Theory (Ross,
1980) and Bird in the Hand Theory (Gordon, 1962).
2.2.1 Dividend Irrelevance Theory
This theory originated from Modigliani and Miller (1961).According to this theory, the financial
performance is not affected by the payout ratio but rather depends on the company's investment
policy. It puts forward the argument that a company’s policy on dividend does not bother
investors because they can dispose a percentage of their equity holding in the portfolio incase
cash was needed essentially indicating that issuing out of dividends would have little or no effect
on price of stock and consequently financial performance.
This theory suggests that use of a dividend policy by a firm is of no significance as such a policy
has got no consequence on the organization’s cost of capital or the company’s financial
performance.The following assumptions forms the basis of the MM argument: corporate or
personal income taxes do not exist, stock transaction and flotation costs are not in existence and

10
managers and investors have similar information in regard to investment opportunities they need
to make in the future (Jensen &Meckling, 1976).
The ratio of the value of the firm assumed up by new investors is equal to the dividends paid out
and hence it does not change the firm’s value. It can therefore be concluded that firm’s value is
based on its investment policy rather than its dividend policy. In other words, it is the asset
investment policy, rather than the way earnings are given between dividends and retained profit,
that determines the value of the firm and consequently the return to an investor.
2.2.2 Signal Effect theory
This theory was put forth by Stephen Ross in 1980. The genesis of this theory was as a result of
the dividend changes in the companies. Stephen Ross hypothesized that the management’s view
on the future prospects of the firm and their earning power is reflected in the changes in the
dividend payout ratio. Ross (1980) confirmed from various studies that those firms that regularly
and significantly declared the dividends the share prices of the companies sharply declined.
According to Ross(1980), capital gains are referred to dividends by the investors of the firms.
The increase in the dividend payment is a good signal that the management has projected the
good times ahead which will show an increase in the earnings in the future.
The increase in the dividend payout by the firms act as a good positive signal that the
management of the firms is optimistic of higher future earnings to cater for the dividend payout
increase. On the contrary, the instances of dividend reduction is implies that the management is
interested in the future prospects of the company by doing reinvestment. According to Ross,
investor’s reaction to change following the actions on the dividend is a clear indication of some
crucial information regarding how the company has performed. Where high dividend implies the
11
firm was profitable at a particular financial period and no payment of dividends implies a
loss(Ross, 1980).
When management reduces the dividends, it is a sign of pessimism which implies that
management has lost hope on future earnings. As stated by Ezra (1963) dividends is pivotal in
giving conclusive support of the capacity of the company to generate more earnings and in the
process the dividend policy may affect the financial performance positively or negatively
depending on the earnings of the firm.
2.2.3 Bird in the Hand Theory
According to this theory, the payment of the dividends is relevant to the value of any firm
(Gordon, 1962). Investors are indifferent and the financial performance is affected as a result of
dividends or capital gains. The fundamental assumption of this argument was grounded on the
fact that equity holders are risk averse and favor dividend paid in current period. Where there is
information asymmetry, dividends values are different so as to retain the capital gains or
earnings.
Investors would rather have the cash dividend put as the bird in hand rather than future capital
gains. He further argued that investors favored current dividends compared to anticipated capital
gains due to their uncertainty resulting from information asymmetry. The Gordon model further
purports that dividend yield is significant in measuring what is expected from the equity than its
cost and that in determining the value of an organization, dividends are most appropriate. The
growth of any firm’s earnings is not guaranteed and as such capital gains in the future cannot be
estimated accurately(Gordon, 1962).
12
Business entities that don't pay dividends as perceived by the investors as non-performing and its
future value in the market cannot be estimated and therefore uncertain whether investors can get
the value on their investment. This is based on some assumptions for example the inaccessibility
of external funding which implies that the firm will rely on internal sources for financing. A
certain dividend is better compared to what firms promise as future dividend or in some
instances capital gains; hence dividend policy is relevant (Gordon, 1962).
2.3 Determinants of Financial Performance of Commercial Banks
Financial performance aims at assessing how well companies can prudently utilize their assets to
maximize on the profits within a given period of time. Financial performance is determined by;
liquidity, asset quality, capital adequacy and management efficiency.
2.3.1 Liquidity
Frank (1989) defined liquidity as the ability of the commercial banks to fulfill the short term
obligations when due. Commercial banks can be exposed to liquidity risks as a result of
bankrupt. Bank run is a scenario whereby a large number of customers withdraw cash from
deposit accounts at the same time and transferring such money into other assets on fear that the
bank might become insolvent. Bank runs can leave the commercial banks in serious financial
constrains which will eventually affect the day to day operations. Therefore, liquidity
management is a significant factor.
Commercial banks need to manage their own liquidity adequately; this will help them in times of
financial distress or any financial crisis. When banks hold more liquid assets, their liquidity risk
decrease and this is considered a liquidity cushion which will help them in times of increased
liquidity pressure to meet its obligation. A banks assets and liabilities are key to the management

13
of liquidity, adequate liquidity is positively related to bank financial performance. The common
measure of the banks liquidity is the customer deposits and the bank's assets. The more liquid the
bank is, the better is its financial performance (Frank, 1989).
2.3.2 Asset Quality
According to Myers (2005) assets are economic endowment by business entities and they
provide the benefits in the future. The future cash flows are the resultant benefits which arise
from the forecasted operations. On conversion of the asset into cash, positive future cash flows
will rise. Commercial bank assets include its current assets, fixed assets; long-term investments
loans which comprises short term and long term loans. Loans are the important assets of
commercial banks. Prudent management of loans will positively impact the financial
performance in terms of the profitability by ensuring lower default rates. The lower the default
rate, the higher the financial performance.
2.3.3 Capital Adequacy
Capital is what the owners of a business entity can claim (Wood, 1988). This is the total amount
individuals put into banks to support them during the times of financial crisis. Enough capital in
the banks will prevent the banks from financial distress. According to Altman (1954),financial
distress begins only when the firm is completely unable to meet schedule of payments or when
cash flow projection indicate that it will soon collapse. The firm is unable to pay its debt. Due to
the rise of the commercial banks going under receivership in Kenya, the Central Bank of Kenya
which is the regulator has set the minimum capital required for the banks to operate in so that
during the financial crisis, the depositors are protected against the loss of their money. Capital

14
adequacy evaluates how strong the commercial banks are internally. If the capital adequacy is
high, the financial performance is high and vice versa.
2.3.4 Management Efficiency
According to Johnson (2005), Management efficiency signifies a situation where by the
resources are prudently applied to maximize the output levels. Management efficiency aims at
the reduction of the use of available resources by maximizing the returns for example stock
waste to improve efficiency and sharing of duties for example chief executive officer can equally
act as the managing director. Operational efficiency deals with the management of the operating
expenses. The management should ensure resources are deployed efficiently, operating costs are
minimized and profit is maximized.
2.3.5 Bank Size
Commercial banks normally depend on interest income as the key source of the income based on
the loans advanced. The loan book will also determine the financial performance of the
commercial banks. It is the responsibility of the banks to control the deposits since they have
ultimate effect on the banks performance. Banks should ensure cost effective strategies are put in
place since they translate to improved performance. When banks are large in size, they are
advantageous since they can access large amounts of deposits unlike smaller banks hence good
financial performance (Myers, 2005).
2.4 Empirical Review
Kioko (2017) carried out a study on the effect of dividend policy on the financial performance of
the companies listed at the NSE. The period of the study was between 2010 and 2016 and the
sample of the study was 21 companies. He employed a casual research design in the study. The
15
study findings revealed that the, payment of constant dividend amounts for every share was the
most suitable policies for the firms under study.
Wafula (2016) analyzed how dividend policy affected financial performance basing his study on
firms listed at the NSE. According to the study results, investors favored stocks with stocks that
had higher dividend payouts. This study clearly demonstrated the understanding of the content of
the study. Further according to the study, increased trading volume of a company’s stock
affected the financial performance and investors who were in need of present investment income
had shares in firms with high dividend payouts. Further, the free cash flow led to a conflict
between shareholders and the management which led to an effect on the financial performance.
Nash (2015) did a study on how dividend policy affected the financial performance in Indian
firms. The study revelation was that there existed a link between dividend policy and wealth
creation for shareholders of Pharmaceutical firms in India.The study did not specify clearly the
methodology adopted. According to the results of the study, in the long run the shareholders
wealth increased for those shareholders who invested in firms that paid constant dividend in
comparison to shareholders who had invested in chemical companies that do not pay dividends.
This is a clear revelation of the effect of dividend policy on financial performance.
Similarly, Falope (2013) carried out a study to assess the effect of dividend payout on the
financial performance of the manufacturing companies in Pakistan. He used the sample size of
33 companies from a population of 84 manufacturing companies between 2007 to 2011.The
survey utilized the secondary data from the websites of the companies. The study also employed
the linear regression model in the analysis. The study was well structured from the start to the

16
end. From the analysis, he concluded that the payment of the dividends acted as an excellent
indicator for the improved financial performance of the companies.
In a survey carried out by Kamar (2013) on the effect of dividend policy on the stock returns of
non-listed commercial Banks in Indonesia between 2002 to 2012. The study used a sample of 30
non listed commercial banks in Indonesia out of 92 non listed commercial banks. The study also
employed a linear regression model in the survey. The study used the secondary data in the
analysis in determining cumulative abnormal returns from the day of the dividend
announcement. The criteria for firm selection were not elaborate in the study. His conclusion was
thatthe dividend policy had no much effect on the stock returns of commercial banks in
Indonesia.
Savvenet al. (2013) did an investigation on the effect of dividend announcement on the financial
performance of selected companies listed on the India securities market from 2009- 2012. A
sample of 8 selected companies was chosen specifically for the study. The study relied heavily
on secondary data as it was the only available source of data. The study also used the multiple
regression models in the analysis. The study also used a limited sample which cannot be
representative. The study concluded that, on average, the financial performance showed an
upward trend after the dividend announcement in the selected listed companies in Indian
securities market.
Similarly, Kamau (2013) carried out a study on the effect of dividend announcements on quoted
companies’ financial performance at the NSE. The study used the event study methodology. The
CMA was the main source of data collection.In the study however, a shorter period of study in
the analysis was used. The empirical results showed varied results with the overall results

17
suggesting that indeed an effect was evident on the financial performance on the announcement
of the dividends.
Similarly, Okwar (2011) did a study on the effect of dividend payout ratio on the financial
performance of the pharmaceutical companies in Nigeria from 2005 to 2008. A sample of 103
pharmaceutical firms was selected from 314 pharmaceutical firms. The study used the secondary
data to compute the price earnings ratio and the daily share prices were collected over a period of
60 days. The study also employed multiple regression models to show the link between the study
variables. He concluded that the financial performance declined as a result of the payment of the
dividends for the period under study.
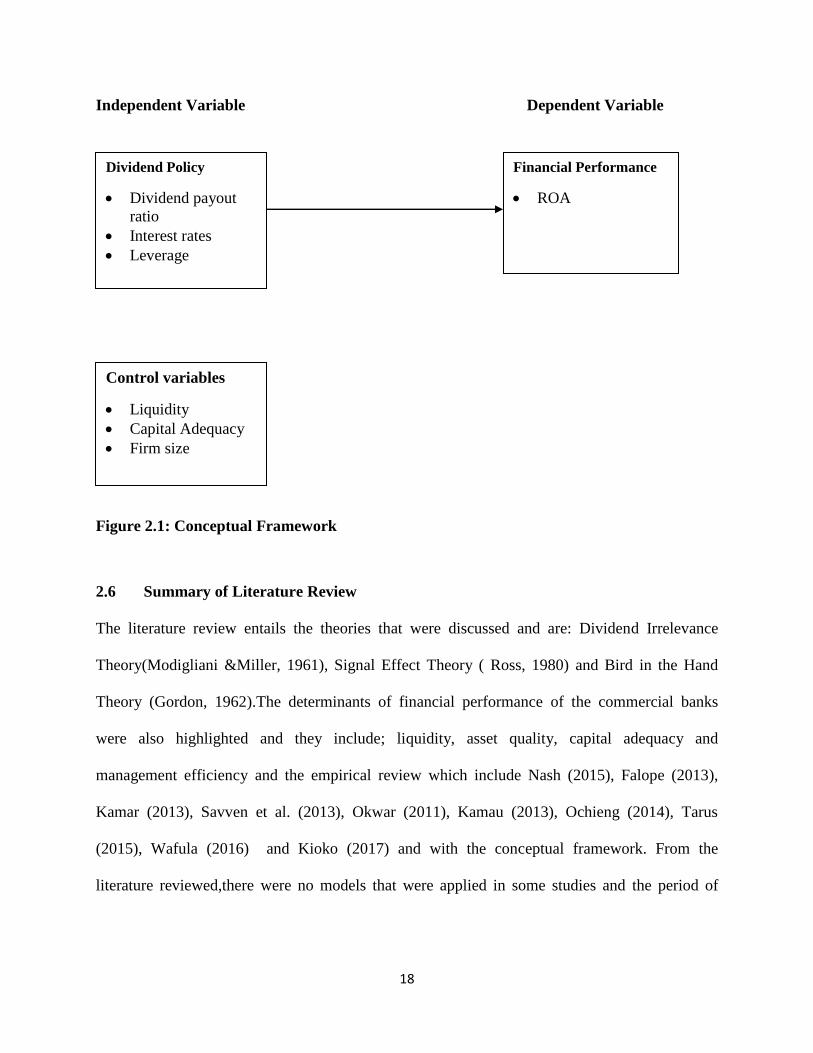
2.5 Conceptual Framework
The study sought to analyze the effect of dividend policy on the financial performance of the
commercial banks listed at the NSE. The Independent variable was the dividend policy that was
gauged by dividend payout ratio, leverage and interest rates, control variables were measured by
capital adequacy, firm size and liquidity while financial performance was the dependent variable
which was gauged by return of assets.
18
Independent Variable Dependent Variable
Figure 2.1: Conceptual Framework
2.6 Summary of Literature Review
The literature review entails the theories that were discussed and are: Dividend Irrelevance
Theory(Modigliani &Miller, 1961), Signal Effect Theory ( Ross, 1980) and Bird in the Hand
Theory (Gordon, 1962).The determinants of financial performance of the commercial banks
were also highlighted and they include; liquidity, asset quality, capital adequacy and
management efficiency and the empirical review which include Nash (2015), Falope (2013),
Kamar (2013), Savven et al. (2013), Okwar (2011), Kamau (2013), Ochieng (2014), Tarus
(2015), Wafula (2016) and Kioko (2017) and with the conceptual framework. From the
literature reviewed,there were no models that were applied in some studies and the period of
Dividend Policy
• Dividend payout
ratio
• Interest rates
• Leverage
Financial Performance
• ROA
Control variables
• Liquidity
• Capital Adequacy
• Firm size

19
study was short. Therefore, this research sought seeks to address the above research gaps in
conducting thisstudy.
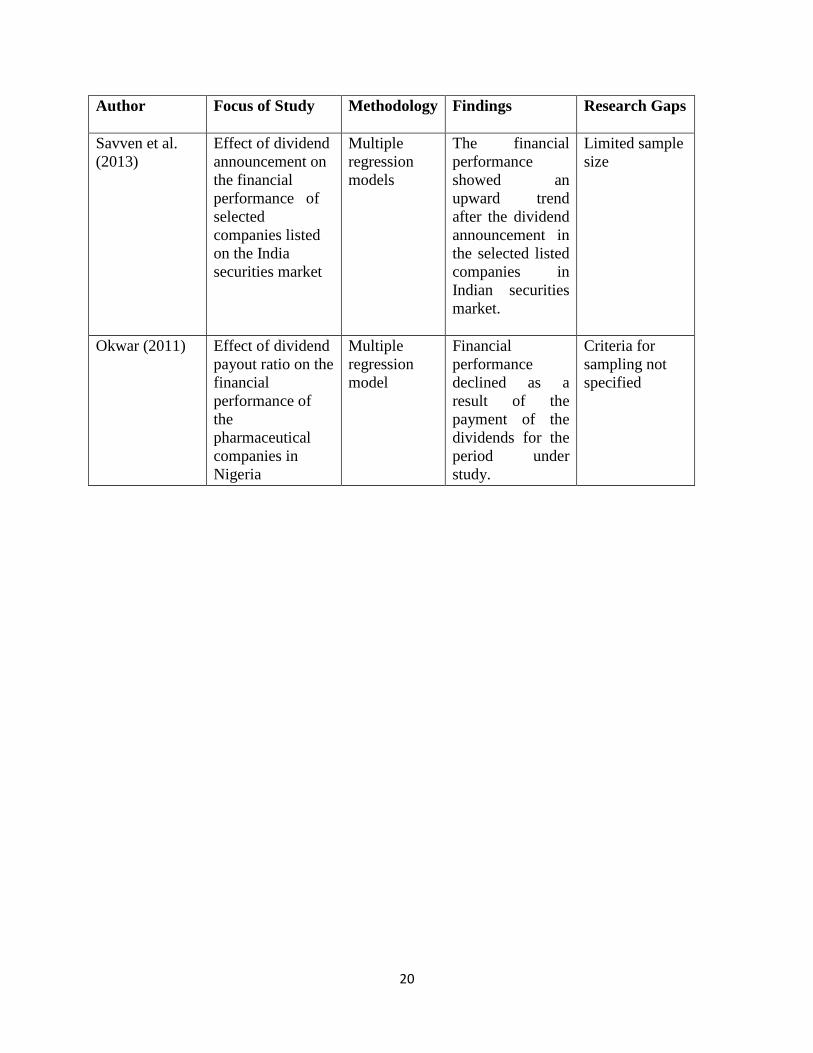
Table 2.1: Summary of the Literature
Author Focus of Study Methodology Findings Research Gaps
Kioko (2017) Effect of dividend
policy on the
financial
performance of
the companies
listed at the NSE
Casual
research
design
Dividend policy
significantly
affected the
financial
performance of
the listed firms.
Study period
was inadequate.
Wafula (2016) Dividend policy
effect on financial
performance on
firms listed at the
NSE.
Not specified Dividend policy
affected financial
performance
Methodology
not specified
Falope (2013) Effect of dividend
payout on the
financial
performance of
the manufacturing
companies in
Pakistan.
Linear
regression
model
Dividends
payments acted as
a good signal for
the improved
financial
performance of
the companies.
The research
design not
specified
Kamar (2013) Effect of dividend
policy on the
stock returns of
Non listed
commercial Banks
in Indonesia.
Linear
regression
model.
Dividend policy
was insignificant
on the stock
returns of
commercial banks
in Indonesia.
Criteria for firm
selection were
not elaborate.
Kamau (2013) Effect of dividend
announcements on
quoted
companies’
financial
performance at the
NSE.
Not specified Dividend
announcements
significantly
affected the
financial
performance.
shorter period
of study,
methodology
not specified
20
Author Focus of Study Methodology Findings Research Gaps
Savven et al.
(2013)
Effect of dividend
announcement on
the financial
performance of
selected
companies listed
on the India
securities market
Multiple
regression
models
The financial
performance
showed an
upward trend
after the dividend
announcement in
the selected listed
companies in
Indian securities
market.
Limited sample
size
Okwar (2011) Effect of dividend
payout ratio on the
financial
performance of
the
pharmaceutical
companies in
Nigeria
Multiple
regression
model
Financial
performance
declined as a
result of the
payment of the
dividends for the
period under
study.
Criteria for
sampling not
specified

21
CHAPTER THREE
RESEARCH METHODOLOGY
3.1 Introduction
This chapter clearly states the methods that were employed during the study to realize its set
goals. It starts with research design, a description of the population, data collection, its validity,
and analytics.
3.2Research Design
Research design means the methods used to conduct the research.Descriptive research design
was employed in this study. It also aided in obtaining information on the prevailing status of the
phenomenon in line with variables or conditions in a situation. It is inclusive of correlation and
regression analysis.
3.3Population
According to Mugenda (2005), population is defined as the entire group of individuals, events or
relevant things that the researcher wishes to explore. It is the entire collection of cases or units
about which the researcher will draw inferences. 11 commercial banks listed at the NSE as at
June 2018 formed the population.A census survey was undertaken. A census was ideal in this
study since the population of study was small.
3.4 Data Collection
In this study, secondary data was used and was obtained from the Capital Markets Authority
(CMA) and from the financial statements in the websites of the listed commercial banks in
Kenya due to its availability. The study collected data from the period between 2013 and 2017.
22
The data comprised of: total assets, net income, total capital, total loans, total customer deposits,
total liabilities, total dividends and total number of shares outstanding.
3.5 Diagnostic Tests
The diagnostic tests that were completed on the data to guarantee it suits the fundamental
assumptions of classical linear model include; Kurtosis and Skewness of the dispersion of data
tested for normality, multicollinearity tested by variance inflation factor and correlation
coefficient, heteroscedasticity was tested by the weighted generalized least square to establish
the relationship.
3.6 Data Analysis
The main analysis techniques used in the study were descriptive and inferential statistics.They
aided in the better understanding of the concepts (Mugenda, 2003).The following regression
model was used:
exxxxxxY +++++++= 6655443322110
Where Y is the financial performance= ROA
0 is the free term of the equation. 654321 ,,,, and are the coefficients of independent
variables and they measure the responsiveness of Y to unit change in variable x.
1x = Dividend payout ratio
2x = Leverage as measured by debt ratio
3x = Interest rates as measured by lending rates
4x = capital adequacy as measured by the ratio of total capital to total asset
5x = Liquidity as measured by the ratio of total loans to total consumer deposits

23
6x = Firm size as measured by natural logarithm of total assets
e = the error term
3.7 Test of significance
An F-test at 5% significance level was conducted to determine the strength of the model, and the
effect of dividend payout ratio on the financial performance of the commercial banks listed at the
Nairobi Securities Exchange.
24
CHAPTER FOUR
DATA ANALYSIS, FINDINGS AND INTERPRETATION
4.1 Introduction
This section covered a detailed analysis of secondary results. In section 4.2 data was analyzed in
terms of descriptive statistics and in section 4.3, data was analyzed in terms of inferential
statistics which included; Analysis of variance, regression analysis and correlation analysis and
section 4.4 presents discussions of the findings. Finally the chapter covered the discussions and
findings of the data analysis results in section 4.5.
4.2Descriptive Statistics
A number of variables were summarized here namely;dividend payout ratio, interest rates,
leverage, liquidity, capital adequacy, firm size and return on assets.Table 4.1 below presents the
descriptive statistics which include; means, standard deviations, the minimum values and the
maximum values of the variables under study.
25
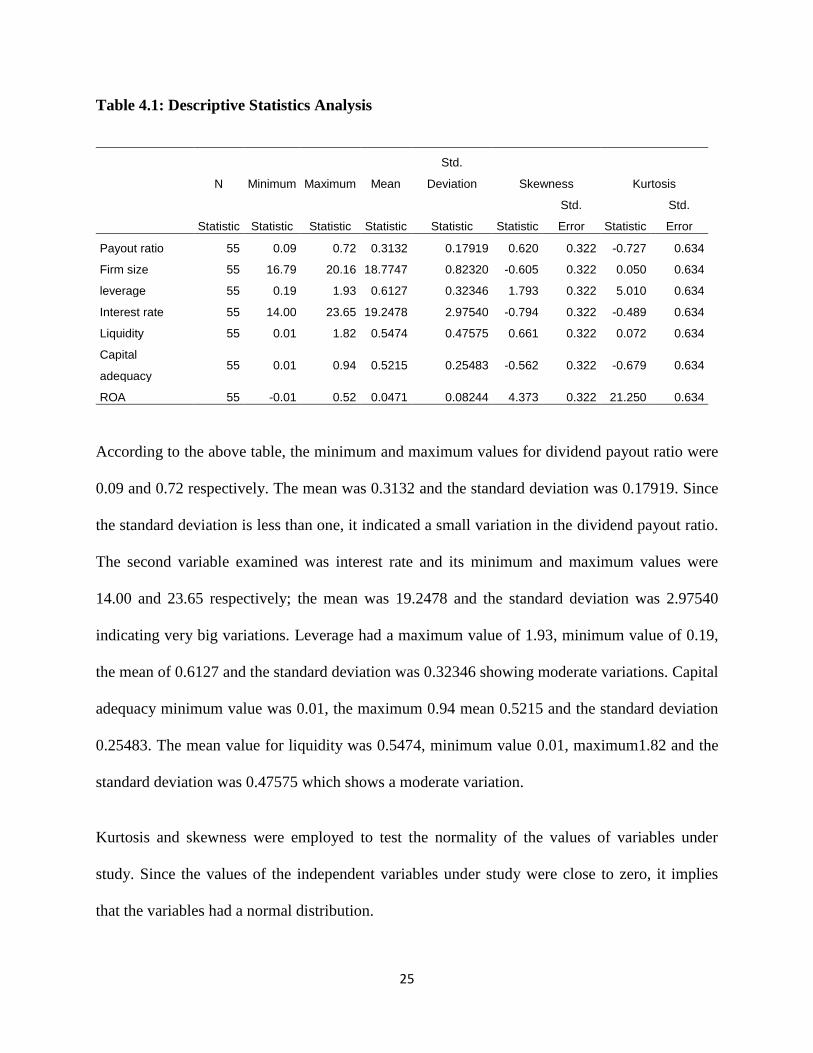
Table 4.1: Descriptive Statistics Analysis
N Minimum Maximum Mean
Std.
Deviation Skewness Kurtosis
Statistic Statistic Statistic Statistic Statistic Statistic
Std.
Error Statistic
Std.
Error
Payout ratio 55 0.09 0.72 0.3132 0.17919 0.620 0.322 -0.727 0.634
Firm size 55 16.79 20.16 18.7747 0.82320 -0.605 0.322 0.050 0.634
leverage 55 0.19 1.93 0.6127 0.32346 1.793 0.322 5.010 0.634
Interest rate 55 14.00 23.65 19.2478 2.97540 -0.794 0.322 -0.489 0.634
Liquidity 55 0.01 1.82 0.5474 0.47575 0.661 0.322 0.072 0.634
Capital
adequacy 55 0.01 0.94 0.5215 0.25483 -0.562 0.322 -0.679 0.634
ROA 55 -0.01 0.52 0.0471 0.08244 4.373 0.322 21.250 0.634
According to the above table, the minimum and maximum values for dividend payout ratio were
0.09 and 0.72 respectively. The mean was 0.3132 and the standard deviation was 0.17919. Since
the standard deviation is less than one, it indicated a small variation in the dividend payout ratio.
The second variable examined was interest rate and its minimum and maximum values were
14.00 and 23.65 respectively; the mean was 19.2478 and the standard deviation was 2.97540
indicating very big variations. Leverage had a maximum value of 1.93, minimum value of 0.19,
the mean of 0.6127 and the standard deviation was 0.32346 showing moderate variations. Capital
adequacy minimum value was 0.01, the maximum 0.94 mean 0.5215 and the standard deviation
0.25483. The mean value for liquidity was 0.5474, minimum value 0.01, maximum1.82 and the
standard deviation was 0.47575 which shows a moderate variation.
Kurtosis and skewness were employed to test the normality of the values of variables under
study. Since the values of the independent variables under study were close to zero, it implies
that the variables had a normal distribution.

26
4.3 Diagnostic Statistics
Figure 4.1: Histogram
27
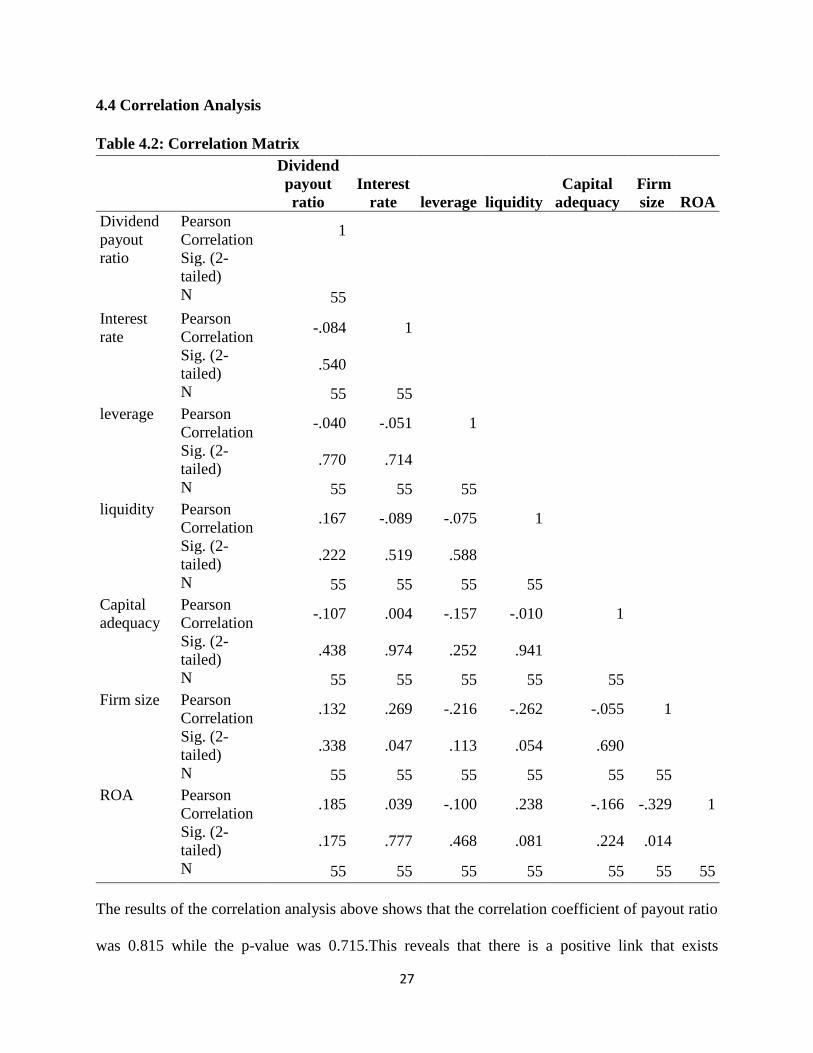
4.4 Correlation Analysis
Table 4.2: Correlation Matrix
Dividend
payout
ratio
Interest
rate leverage liquidity
Capital
adequacy
Firm
size ROA
Dividend
payout
ratio
Pearson
Correlation 1
Sig. (2-
tailed)
N 55
Interest
rate
Pearson
Correlation -.084 1
Sig. (2-
tailed) .540
N 55 55
leverage Pearson
Correlation -.040 -.051 1
Sig. (2-
tailed) .770 .714
N 55 55 55
liquidity Pearson
Correlation .167 -.089 -.075 1
Sig. (2-
tailed) .222 .519 .588
N 55 55 55 55
Capital
adequacy
Pearson
Correlation -.107 .004 -.157 -.010 1
Sig. (2-
tailed) .438 .974 .252 .941
N 55 55 55 55 55
Firm size Pearson
Correlation .132 .269 -.216 -.262 -.055 1
Sig. (2-
tailed) .338 .047 .113 .054 .690
N 55 55 55 55 55 55
ROA Pearson
Correlation .185 .039 -.100 .238 -.166 -.329 1
Sig. (2-
tailed) .175 .777 .468 .081 .224 .014
N 55 55 55 55 55 55 55
The results of the correlation analysis above shows that the correlation coefficient of payout ratio
was 0.815 while the p-value was 0.715.This reveals that there is a positive link that exists
28
between dividend payout ratio and the financial performance as measured by the return of assets
and the relationship was not statistically significant. Further, interest rate was positively related
to financial performance with correlation coefficient 0.039 and p-value 0.777 implying it was not
statistically significant since it was bigger than 0.05. Leverage was negatively related to financial
performance and the effect was not statistically significant since the correlation coefficient was -
0.100 and the p value was 0.468 which is greater than 0.05. Liquidity was positively related to
financial performance and the effect was not statistically significant since the correlation
coefficient was 0.238 and the p value was 0.081 which is greater than 0.05. Capital adequacy
was negatively related to financial performance and the effect was not statistically significant
since the correlation coefficient was -0.166 and the p value was 0.224 which is greater than 0.05.
Finally, firm size was negatively related to financial performance and the effect was significant
since the correlation coefficient was -0.329 and the p value was .014 which is less than 0.05.
4.4.1 Regression Analysis
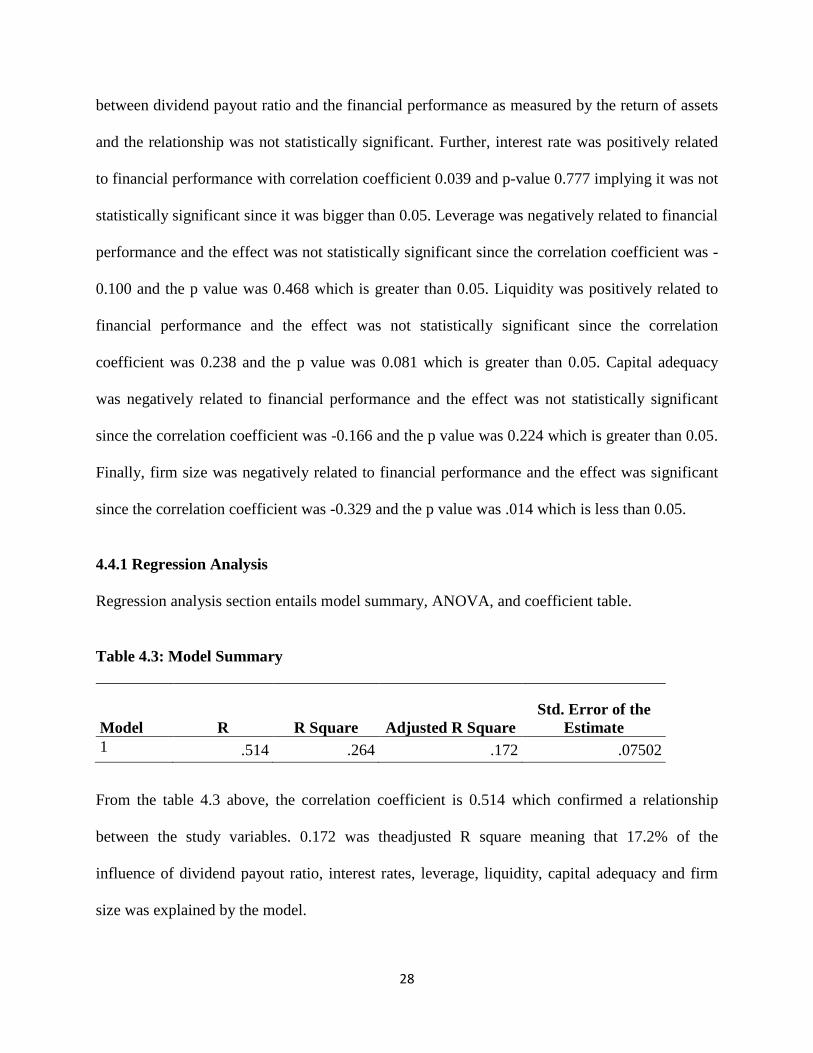
Regression analysis section entails model summary, ANOVA, and coefficient table.
Table 4.3: Model Summary
Model R R Square Adjusted R Square
Std. Error of the
Estimate
1 .514 .264 .172 .07502
From the table 4.3 above, the correlation coefficient is 0.514 which confirmed a relationship
between the study variables. 0.172 was theadjusted R square meaning that 17.2% of the
influence of dividend payout ratio, interest rates, leverage, liquidity, capital adequacy and firm
size was explained by the model.
29
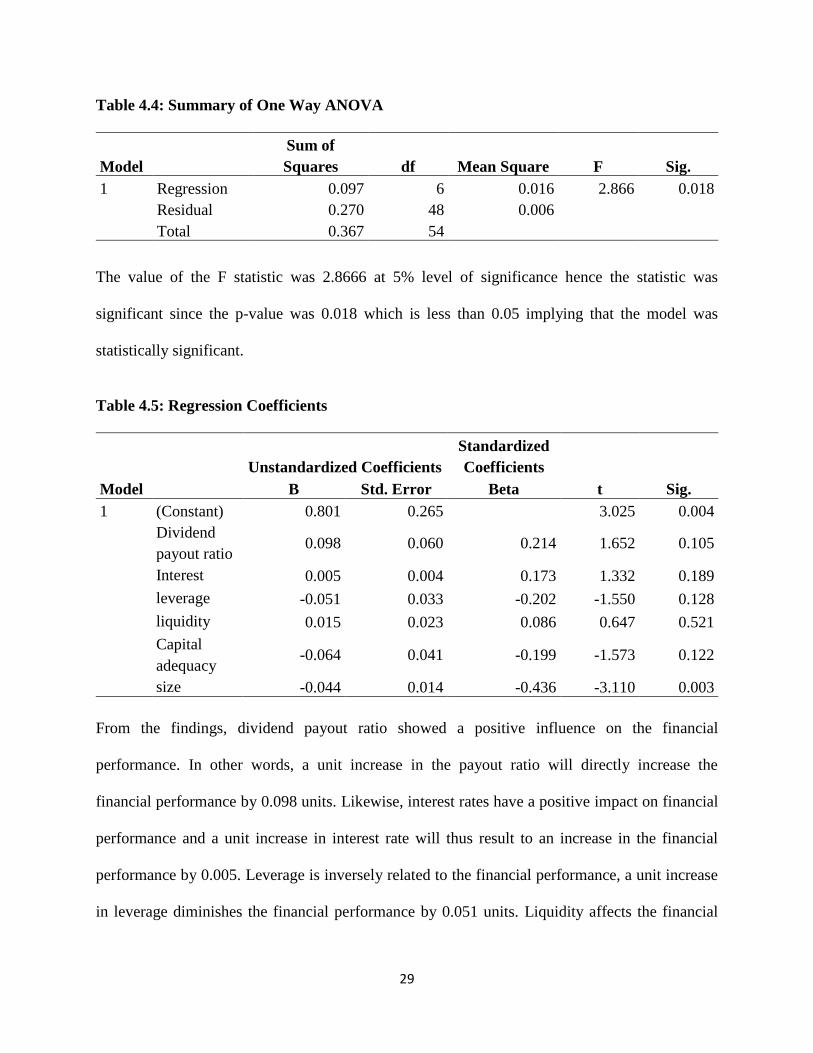
Table 4.4: Summary of One Way ANOVA
Model
Sum of
Squares df Mean Square F Sig.
1 Regression 0.097 6 0.016 2.866 0.018
Residual 0.270 48 0.006
Total 0.367 54
The value of the F statistic was 2.8666 at 5% level of significance hence the statistic was
significant since the p-value was 0.018 which is less than 0.05 implying that the model was
statistically significant.
Table 4.5: Regression Coefficients
Model
Unstandardized Coefficients
Standardized
Coefficients
t Sig. B Std. Error Beta
1 (Constant) 0.801 0.265 3.025 0.004
Dividend
payout ratio 0.098 0.060 0.214 1.652 0.105
Interest 0.005 0.004 0.173 1.332 0.189
leverage -0.051 0.033 -0.202 -1.550 0.128
liquidity 0.015 0.023 0.086 0.647 0.521
Capital
adequacy -0.064 0.041 -0.199 -1.573 0.122
size -0.044 0.014 -0.436 -3.110 0.003
From the findings, dividend payout ratio showed a positive influence on the financial
performance. In other words, a unit increase in the payout ratio will directly increase the
financial performance by 0.098 units. Likewise, interest rates have a positive impact on financial
performance and a unit increase in interest rate will thus result to an increase in the financial
performance by 0.005. Leverage is inversely related to the financial performance, a unit increase
in leverage diminishes the financial performance by 0.051 units. Liquidity affects the financial
30
performance positively with a coefficient of 0.015, capital adequacy negatively with a coefficient
of -0.064 and firm size negatively affected financial performance with a coefficient of -0.044.
The standardized beta coefficient of dividendpayout ratio, interest rate, and liquidity had a weak
effect on the financial performance since their standardized beta coefficients were positive. The
standardized beta coefficient of interest rate was 0.214, dividend payout ratio 0.173 and liquidity
0.086. The standardized beta coefficient of leverage was -0.202 meaning a strong effect of
leverage on the financial performance. The standardized beta coefficient of capital adequacy was
-0.199 and firm size was-0.436 meaning a strong effect of capital adequacy and firm size on the
financial performance.
4.5 Interpretation of the Findings
From the descriptive statistics, the minimum and maximum values of firm sizes were 16.79 and
20.16 and a relatively large variation was confirmed in terms of their firm size. The variations in
commercial banks sizes could be attributed to adoption of appropriate dividend policies. Over the
samestudy period, the financial performance of the commercial banks revealed a great variation
where some commercial banks reported losses while others reported high profits. Net loss of the
commercial banks can be as a result of poor dividend policies by the entities
It was further established that dividend policy variables affected the financial performance and
they included dividend payout ratio, interest rates, leverage, liquidity, capital adequacy and firm
size. From the model summary, the value of adjusted R square was 17. 2%. This implied that the
six independent variables inputs 17.12% on the financial performance changes and the remaining
82.8% is contributed by the factors not included in the study.
31
From the regression coefficient, the research found out that the coefficient of dividendpayout
ratio was 0.185 meaning that dividend payout ratio positively influences financial
performance.Thus, this clear implies that, when all other factors are held constant, a unit upturn
of dividend payout will result in an increase in financial performance by 0.185. The coefficient
of interest rates was 0.039 meaning holding dividend payout ratio, leverage, liquidity, capital
adequacy and firm size constant, a unit increase positively influences the financial performance
by 0.039. Moreover, leverage and capital adequacy were negatively related to the financial
performance since their coefficients were -0.100 and -0.166 respectively, and their effect was not
statistically significant because the p values were greater than 0.05. Liquidity showed a positive
relationship with financial performance since the coefficient 0.238 and the effect was
insignificant since p-value was greater than 0.05. The firm size had a negative relationship with
financial performance with a p-value of 0.014 which is less than 0.05 implying it was significant.
This implies that dividend policy affects the financial performance. In summary, firm size,
leverage and capital adequacy had a negativeimpact on financial performance, however only
firm size had a significant negative impact on financial performance. Dividends payout ratio,
interest rates and liquidity had a positive impact on financial performance. However, none was
significant at 5% significance.
Based on the correlation matrix, there was a revelation that the independent variables (dividend
payout ratio, interest rates and liquidity) had a positive correlation with the dependent variable,
financial performance gauged by returns on assets however all were not statistically significant.
This implies that increase in dividend payout ratio, interest rates and liquidity will not have a
significant increase in financial performance. The independent variable leverage, capital
adequacy and firm size had a negative correlation with financial performance. Only firm size
32
showed significant a significant negative link with the financial performance. This is a clear
indicator of an increase in firm size has an inverse relationship with financial performance.
The study conclusions agree with the conclusions made by Okwar (2011) study on the effect of
dividend payout ratio on the financial performance of the pharmaceutical companies in Nigeria
from 2005 to 2008.. He found that dividend policy affected the pharmaceutical companies in
Nigeria. Therefore the study findings support significant effect theory.

33
CHAPTER FIVE
SUMMARY, CONCLUSIONS AND RECOMMENDATIONS
5.1 Introduction
Majorly this chapter provides a summary of the data analysis results presented in chapter four.
The next section presents conclusion, recommendations for policyand limitations of the study
which involves the challenges the researcher faced during the study. Finally the study
recommends areas for further research study to add literature in this area of dividend decisions
and financial performance.
5.2 Summary of the Findings
The ultimate goal of the study was mainly to examine the effect of dividend policy on the
financial performance of the commercial banks listed at Nairobi Securities exchange. From the
analyzed results, indeed there is existence of a positive link between dividend payout ratio and
financial performance. High payout ratios signify high performance of a firm hence encouraging
the investors in investing more assets due to the increased returns. This can also be interpreted as
the firm having a big market share in the industry. Many firms adopt optimal dividend policy
which is aimed at increasing reputation hence firm value.
Dividend payout ratio had a positive effect on financial performance with a coefficient of 0.098.
Increase in dividend payout ratio increases the financial performance. The correlation coefficient
between dividend payout ratio and financial performance was 0.815 and a significance of 0.715
implying not statistically significant. Interest rates had a positive impact on financial
performance with a beta coefficient of 0.005.

34
The correlation coefficient betweeninterest rates and financial performance was 0.39 and
significance of 0.77indicates the relationship was not statistically significant.
In the measure of natural logarithm, the size of the firm is said to have an inverse link with the
financial performance, the size of the commercial bank can influence the financial performance
of the commercial bank negatively or positively. Large business entities can access most services
at reduced costs due to their purchasing power for example finance, production and distribution
compared to smaller commercial banks who cannot afford the bulkiness of services. According
to the results, liquidity also affected financial performance positively. Interest rates also
positively affected the financial performance. Increase in interest rates increases investments
since the investors expect more returns.
Liquidity entails the ability of the commercial banks to fulfill the short term obligations when
due. Commercial banks can be exposed to liquidity risks as a result of bankrun. Bank run is a
scenario whereby a large number of customers withdraw cash from deposit accounts at the same
time and transferring such money into other assets on fear that the bank might become insolvent.
Commercial banks need to manage their own liquidity adequately; this will help them in times of
financial distress or any financial crisis. When banks hold more liquid assets, their liquidity risk
decrease and this is considered a liquidity cushion which will help them in times of increased
liquidity pressure to meet its obligation.
In order to assess strength of the model, ANOVA was employed in the analysis. From the
ANOVA analysis of the regression statistics, the variables were able to explain their influence on
the financial performance up to 17.2% and the rest is contributed by other factors not considered
in this study meaning the model was significant. The six major factors which included dividend
35
payout ratio, interest rates, leverage, liquidity, capital adequacy and firm size had indeed an
impact on financial performance.
5.3 Conclusions
The study was in pursuit to establish the effect of dividend policy on financial performance. The
study sought to establish the effect of dividend policy on financial performance. Dividend payout
ratio, interest rates, leverage, liquidity, capital adequacy and firm size were used as the predictor
variables while the financial performance measured by returns on asset was the dependent
variable. The study found that liquidity, dividend payout ratio and interest rates showed a
positive effect on financial performance while leverage, capital adequacy and firm size
confirmed a negative impact on financial performance.
The correlation coefficient of dividend payout was 0.815 which was an indication of a moderate
relationship and the relationship was not statistically significant since the p value of 0.175which
was greater than 0.05. A very weak positive relationship was indeed found to have existed
between interest rates and the financial performance, correlation coefficient was confirmed to be
0.039 which was an indication of a very weak relationship. However, the relationship was not
statistically significant since the p value of 0. 777 was greater than 0.05. A positive relationship
was confirmed to exist between liquidity and financial performance.
The study highlighted factors considered which had positive and not statistically significant
impact on financial performance which included dividend payout ratio, interest rate and liquidity.
Therefore commercial banks listed at Nairobi Securities Exchange should consider increasing the
value of these factors since it has a positive impact on financial performance in the long run.

36
From the findings of this study, it was confirmed that dividend policy had a positive relationship
with the financial performance. This was supported from the research which confirmed that the
variables which were analyzed proved the existence of positive link between dividend policy and
financial performance and they includedpayout ratio, interest rates, leverage, liquidity, capital
adequacy and firm size. This study concludes the same findings with that of Okwar (2011) who
did a study on the effect of dividend payout ratio on the financial performance of the
pharmaceutical companies in Nigeria from 2005 to 2008 and concluded that dividend policy
affected the pharmaceutical companies in Nigeria.
5.4 Recommendations
From the findings, dividend payout ratio showed a direct relationship with the financial
performance of commercial banks. The study recommends that the management of the
commercial banks should be optimistic to maintain high levels of payout ratios because high
payout ratios signifies higher future earnings to cater for the dividend payout increase. On the
contrary, the instance of dividend reduction is an indicator that the firm’s management mainly
is focused on earnings in the near future and this might discourage investors.
Liquiditywas confirmed to be another major determinant of the profitability and performance
of the commercial banks. Therefore,the commercial banks should maintain high liquidity
levels due to its positive effect on financial performance. High liquidity leads to increase in
assets base and market share boosting the growth of firms to greater heights. If commercial
banks meet their liquidity limits, this will guarantee trust from the creditors and shareholders
ensure continued distribution of the services into the market. Failure to meet liquidity targets
by the commercial banks contributes to poor performance.

37
5.5 Limitation of the Study
Just like any other research, the researcher experienced some hurdles ranging from time
constraint and limited funds. On time constraint, the secondary data sources were wide such as;
Capital Markets Authority, the individual commercial banks and the Nairobi Securities
Exchange. Optimum allocations of the limited time to collect data, analyze, and interpret posed a
great challenge. However, the researcher managed to maximize the available time to ascertain if
the results of the study were significantly accurate and reliable.
Since the study entirely depended on the secondary data, qualitative data was not captured.
Qualitative data is critical in research since it gives a broader picture of the performance of the
firm in terms in reputation. The brand image and customer relations affects the market base of
the firms hence ought to be considered in studies. Qualitative data is able to capture aspects
which are not addressed by secondary data.
The sample for this study was limited. Only 11 commercial banks were surveyed which formed
the population of the study as the study objective mainly focused on the listed commercial banks
in Kenya. Hence, the link between the predictor variables and the dependent variables may give
different results for the unlisted commercial banks. This was informed by the fact that the
interest was in the listed banks.
The independent variables predicted only 17.2% of the variations in financial performance. This
implies that the researcher did not capture other key factors influencing financial performance of
commercial banks listed at Nairobi Securities Exchange. This clearly implies more variables
ought to have been included in this study. When more variables are used it means that the result
is more conclusive.

38
5.6 Suggestions for Further Research
Small and medium enterprises form a major economy sector in Kenya. A study effect of
dividend policy on performance of small and medium enterprise in Kenya ought to be carried
out. The study also recommends for an investigation of dividend policy and financial
performance using mixed research design. This will enable the researcher to capture both
secondary and primary data for analysis and interpretation. The primary data will aid in assessing
the attitudes of the financial managers which could not be captured through secondary data.
SACCOs in Kenya form a significant segment in the financial institution sector. A study
focusing on how their dividend policy affects their financial performance would add more
knowledge on the field of financial management. This will also enable comparison of the
financial performances of the commercial banks and SACCOs.
Finally, the study recommends for an investigation on dividend policies adopted by local and
foreign investment firms and how they affect their financial performance. This will help in
determining the differences in their performance over the years.
39
REFERENCES
Bhandari, G. W. (1988). Corporate Finance: Principles and Practice, Addison Wesley
Longman, First Edition.
Bhattacharya, S. (2014). Imperfect Information, Dividend Policy, and the ‘Bird in the Hand’
Fallacy, Bell Journal of Economics, 10, 259-270.
Falope, C. (2013). The effect of dividend payout on the financial performance of the
manufacturing companies in Pakistan. An Empirical Analysis, Journal of the Pakistan
Statistical Association, 1132-1161.
Fama, E., & French, K. (2003). The capital asset pricing model: Theory and evidence, Journal of
Economic Perspectives, 18, 25-46.
Gordon, M. and Lintner, J. (1963). Dividends, earnings and stock prices, Review of Economics
and Statistics, 99-105.
Gordon, M.J. (1962), Dividend, Earnings and Stock Prices, Review of Economics and Statistics,
pp 78-101.
Jensen, M. C. (1986). Agency Costs of Free Cash Flow, Corporate Finance, and Takeovers, The
American Economic Review, 76, 323-329.
Jensen, M.C. and Meckling, W.H. (1976).Theory of the firm: managerial behavior, agency costs
and ownership structure. Journal of Financial Economics, 3(4), 305-360.
Kamar, P. (2013). The effect of dividend policy on the stock returns of Non-listed commercial
Banks in Indonesia. An Empirical Investigation, Journal of Finance, 2, 128-287.
Kamau, C. (2013).The effect of dividend announcements on quoted companies’ financial
performance at the NSE. Unpublished MBA Thesis of the University of Nairobi.
Kioko (2017). The influence of dividend policies affect financial performance for companies
listed at the NSE. Unpublished MBA Thesis of the University of Nairobi.
Litzenberger, R. H. & Ramaswamy, K. (1980). The influence of personal taxes and dividends on
capital asset prices: Theory and empirical evidence. Journal of Financial Economics,
8(3), 145-174.
Litzenberger, R. H., &Ramaswamy, K. (1979). The Effects of Personal Taxes and Dividends on
Capital Asset Prices: Theory and Empirical Evidence, Journal of Financial Economics,
163 – 195.
Lumpkin, G. and Dess, G. (1999).Linking to Dimensions of Entrepreneurial orientation of firm
performance.The moderating role of environment, firm age and industry life cycle;
Journal of Business Venturing.
40
Mathur, S. and Kenyon A. (1997). Creating Value; Sharing Tomorrow’s Business.
Modigliani, F., & Miller, M. (1961).Dividend policy, growth and the valuation of shares.Journal
of Business, 34, 411-33.
Modigliani, F., & Miller, M. H. (1956). The Cost of Capital, Corporation Finance and the Theory
of Investment, American Economic Review, 48(3), 261-297-Retrieved from
http://www.his.se/PageFiles/17648/Modiglianiandmiller1958.pdf
Modigliani, F., & Miller, M. H. (1961). Dividend Policy, Growth, and the Valuation of Shares,
Journal of Business, 411-433.
Mugenda, O. M., &Mugenda, A. G. (2003).Research methods: quantitative and qualitative
approaches. Nairobi. Acts Press.
Nash, B. (2015). The effect of dividend policy on the share prices in Indian firms. An Empirical
Analysis, Journal of the Finance, 132-161.
Ochieng (2016).The effect of dividend payout ratio on the financial performance of commercial
banks in Kenya.Unpublished MBA Thesis of the University of Nairobi.
Ochieng E.D. (2012). Executive compensation and Firm financial performance: A critical
literature Review.
Okwar, Z. (2011). The effect of dividend payout ratio on the financial performance of the
pharmaceutical companies in Nigeria.Journal of Financial Research, 265-299.
Ross, S.A, Westerfield R. W., & Jordan B. D. (1995).Fundamentals of corporate finance, Tata
McGraw Hill, Eighth Edition.
Rozeff, M. (2012). Growth, Beta and Agency Costs as Determinants of Dividend Payout Ratios,
Journal of Financial Research, 249-259.
Savven, D., Yeung, Y. W., &Linet, K. N. (2013). The effect of dividend announcement on the
share prices of selected companies listed on the India securities market. An Empirical
Investigation, Journal of Finance, 3, 165-276.
Sorensen, A., Mukaila, A. and Stuart, T. (1999): “Corporate Governance Mechanisms and Firm
Financial Performance in Nigeria”, AERC Research Paper, No. 149.
Tarus, W. (2015). The effect of policy on dividend on financial performance for organizations at
the NSE. Unpublished MBA Thesis of the University of Nairobi.
Wafula, K. (2016). The effect of dividend policy on financial performance on firms listed at the
NSE. Unpublished MBA Thesis of the University of Nairobi.

41
APPENDIX I: LIST OF COMMERCIAL BANKS LISTED AT NSE
1 Co-operative Bank
2 Diamond Trust Bank
3 Barclays Bank limited
4 Equity Group Holdings
5 Stanbic Holdings limited
6 Housing Finance
7 I&M Holdings Limited
8 Kenya Commercial Bank
9 National Bank of Kenya limited
10 NIC Group limited
11 Standard Chartered Bank limited

42
APPENDIX II: ANALYZED DATA
Bank Year
Dividend Payout Ratio
Interest Rate Leverage Liquidity Firm Size
Capital Adequacy
ROA
NIC 2013 0.156 20.540 0.469 0.891 18.542 0.53 0.030
2014 0.172 19.870 0.530 1.002 18.736 0.24 0.029
2015 0.546 21.760 0.190 0.988 18.870 0.58 0.080
2016 0.129 19.860 0.620 0.088 18.902 0.60 0.073
2017 0.325 14.000 0.530 1.759 17.787 0.54 0.024
STANCHART 2013 0.490 20.740 1.140 0.852 19.211 0.55 0.043
2014 0.374 19.010 0.190 0.828 19.220 0.17 0.047
2015 0.623 22.560 0.550 0.786 19.271 0.58 0.027
2016 0.557 23.180 0.580 0.873 19.339 0.47 0.035
2017 0.564 14.000 0.680 0.984 18.235 0.76 0.240
EQUITY 2013 0.418 22.050 0.430 1.816 17.575 0.58 0.309
2014 0.375 20.180 0.570 0.872 17.355 0.09 0.516
2015 0.721 22.710 0.620 0.890 19.875 0.62 0.024
2016 0.235 23.650 0.270 0.079 19.976 0.83 0.037
2017 0.236 14.000 0.380 0.768 18.157 0.72 0.010
CO-OP 2013 0.230 19.390 0.780 0.059 19.249 0.06 0.040
2014 0.305 20.170 0.510 0.085 19.460 0.88 0.028
2015 0.334 19.040 0.640 0.073 19.643 0.01 0.034
2016 0.428 16.650 0.550 0.911 19.679 0.59 0.010
2017 0.325 14.000 0.390 0.141 19.564 0.54 0.016
BARCLAYS 2013 0.435 20.340 0.950 0.235 19.035 0.46 0.010
2014 0.356 23.540 0.650 0.016 19.147 0.60 0.020
2015 0.648 22.450 0.510 0.018 19.235 0.77 0.037
2016 0.517 19.230 0.790 0.170 19.300 0.21 0.020
2017 0.587 14.000 0.190 0.012 18.146 0.13 0.120
STANBIC 2013 0.450 20.120 0.550 0.020 18.780 0.79 0.021
2014 0.117 19.560 0.390 0.029 19.011 0.81 0.010
2015 0.212 22.450 0.610 0.029 18.018 0.72 0.054
2016 0.218 18.450 0.630 0.034 19.155 0.48 0.047
2017 0.311 14.000 0.850 0.040 19.185 0.69 0.021
I&M 2013 0.168 19.050 0.854 0.040 18.519 0.88 0.045
2014 0.237 21.670 0.860 0.045 18.738 0.01 0.038
2015 0.247 19.070 0.280 0.059 16.868 0.29 0.067
2016 0.123 21.560 0.418 1.250 17.988 0.94 0.040
2017 0.346 14.000 0.980 0.038 18.431 0.61 0.020
DTB 2013 0.088 20.420 0.390 0.500 18.931 0.73 0.031
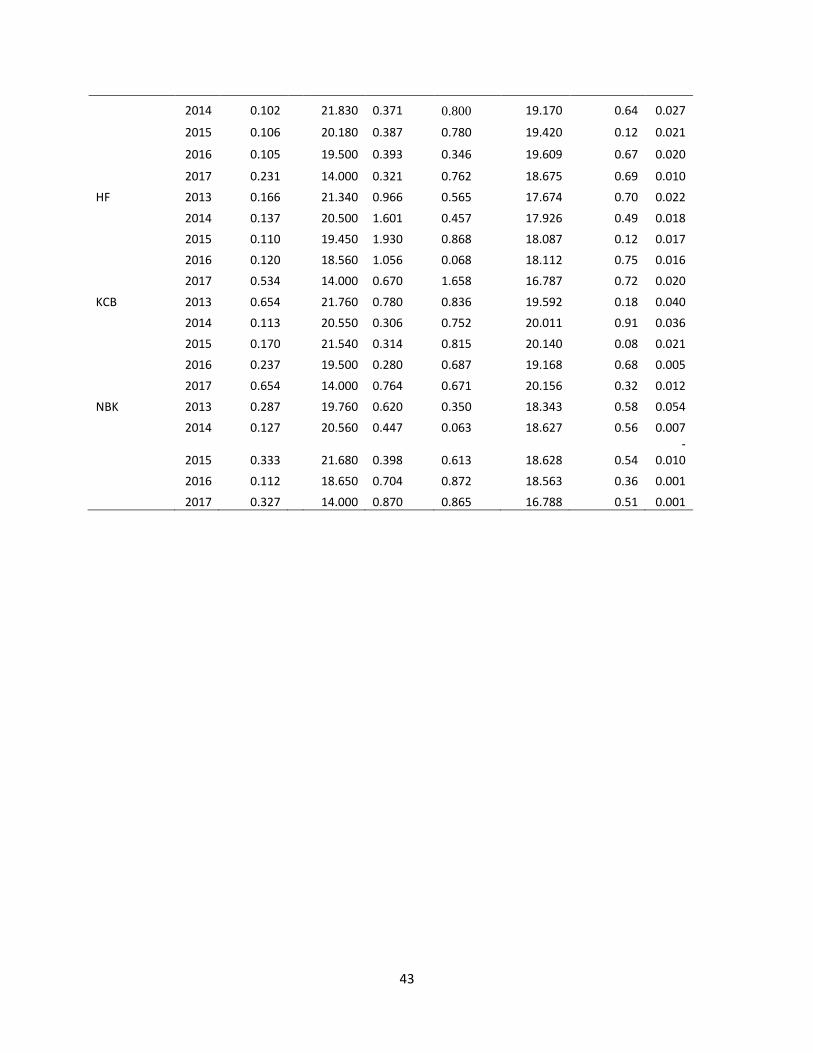
43
2014 0.102 21.830 0.371 0.800 19.170 0.64 0.027
2015 0.106 20.180 0.387 0.780 19.420 0.12 0.021
2016 0.105 19.500 0.393 0.346 19.609 0.67 0.020
2017 0.231 14.000 0.321 0.762 18.675 0.69 0.010
HF 2013 0.166 21.340 0.966 0.565 17.674 0.70 0.022
2014 0.137 20.500 1.601 0.457 17.926 0.49 0.018
2015 0.110 19.450 1.930 0.868 18.087 0.12 0.017
2016 0.120 18.560 1.056 0.068 18.112 0.75 0.016
2017 0.534 14.000 0.670 1.658 16.787 0.72 0.020
KCB 2013 0.654 21.760 0.780 0.836 19.592 0.18 0.040
2014 0.113 20.550 0.306 0.752 20.011 0.91 0.036
2015 0.170 21.540 0.314 0.815 20.140 0.08 0.021
2016 0.237 19.500 0.280 0.687 19.168 0.68 0.005
2017 0.654 14.000 0.764 0.671 20.156 0.32 0.012
NBK 2013 0.287 19.760 0.620 0.350 18.343 0.58 0.054
2014 0.127 20.560 0.447 0.063 18.627 0.56 0.007
2015 0.333
21.680 0.398 0.613 18.628 0.54 -
0.010
2016 0.112 18.650 0.704 0.872 18.563 0.36 0.001
2017 0.327 14.000 0.870 0.865 16.788 0.51 0.001