effect of leverage, growth, firm size, dividend policy
TRANSCRIPT

Volume 2, Issue 3, July 2021 E-ISSN : 2721-303X, P-ISSN : 2721-3021
Available Online: https://dinastipub.org/DIJEFA Page 288
DOI: https://doi.org/10.38035/dijefa.v2i3
Received: 28 July 2021, Revised: 10 August 2021, Publish: 20 August 2021
EFFECT OF LEVERAGE, GROWTH, FIRM SIZE, DIVIDEND POLICY,
AND INTEREST RATE ON COMPANY VALUE
Ivan Yudha Pradana
University of Mercubuana, Jakarta, Indonesia, [email protected]
Corresponding Author: Ivan Yudha Pradana
Abstract: The purpose of this study is to determine influence of Leverage, Growth, Firm Size,
Dividend Policy and Interest rate on the value of the company of construction and building
sub-sector companies listed on the Indonesia Stock Exchange during the observation
period 2014 - 2020. The research sample in this study consists of 7 companies determined by
conducting purposive sampling. In this study, uses secondary data from financial statements
were reported by construction and building sub-sector companies. Research methods uses
descriptive statistics and inferential statistics using the Random Effect Model. The results
showed that Leverage and Interest Rate have a significant positive effect, Firm Size has a
negative and significant effect. While the Growth and Dividend Policy has no effect on the
value of the company.
Keywords: Leverage, Growth, Firm Size, Dividend Policy, Interest Rate, Company Value
INTRODUCTION
A country that is experiencing a poor infrastructure condition, it can be interpreted as
inefficient economic conditions in the country, because the cost of national logistics becomes
expensive. Infrastructure development in Indonesia increases from year to year can be known by
Anggaran Pendapatan dan Belanja Negara Indonesia (APBN) for infrastructure that increases
every year. With Kerjasama Pemerintah dengan Badan Usaha dan Penyertaan Modal Negara
(KPBUPMN), the Government of the Republic of Indonesia is committed to accelerate
infrastructure development in 2019. Infrastructure development in various regions is a target that
must be completed by the government, such as toll roads, new national roads, dams, and
irrigation networks (Keuangan, 2019). Indonesia's infrastructure budget has experienced growth
in the last 5 years. In 2019 the budget increased in 2018 by 410.4 Trillion, to 420.5 Trillion in
2019. In 2017, the high increase from 269.1 trillion in 2016 to 379.4 trillion in 2017. Similar to
the increase in 2014 which was 157.4 Trillion to 256.1 Trillion in 2015. This budget increase,
particularly in the construction and building sub-sectors, is in line with government programs in
terms of national development, new employment, and equitable economic growth in Indonesia.
In this case the company experienced an increase in turnover or work to realize the Government's

Volume 2, Issue 3, July 2021 E-ISSN : 2721-303X, P-ISSN : 2721-3021
Available Online: https://dinastipub.org/DIJEFA Page 289
objectives in terms of infrastructure development. Increasing the country's infrastructure budget
is also in line with rising revenues.
Figure 1. Average Comparison Chart of Revenue with Price Book Value of
Construction and Building Sub-Sector for Period 2014 – 2019 Source: Indonesia Stock Exchange, 2019 (processed).
In 2014 - 2018 average - the company's average revenue consistently increased by 3.47
Trillion, 3.95 Trillion, 4.82 Trillion, 7.21 Trillion and 8.05 Trillion until in 2019 decreased to
6.75 Trillion. Agree with Husnan (2008) With the resources owned by the company can make
as much - the amount of profit is the short-term goal of the company, while maximizing the value
of the company to maintain the existence of the business is the long-term goal. While the average
Price Book Value in 2014-2019 tends to decline, this indicates that the public's valuation as
measured by the comparison of stock prices with book prices decreases.
LITERATURE REVIEW
Explained in signal theory that the signal or information received by the public against the
company is a published financial report. The basis of signal theory is information received by
the public and the management of different companies or asmentris information. Signal theory
explains how companies provide information or signals in financial statements to all parties who
have an interest in such information. Things that have been done by the company to achieve the
interests of its owner are contained in this signal. (Sinaga and Prasetiono, 2014).
Complete information about the condition of the company cannot be obtained simply. The
information is always withheld and informed by the agent (company management) in a timely
manner. While the description of the company information obtained by investors is considered
incomplete when compared to the information owned by the agent. Then there is the inequality
of information held by investors and agents. Inequality of investor and agent information is called
asymmetric information (Manurung, 2019).
Brigham and Houston (2014) argue that Trade-off Theory is an exchange of tax advantages
with the company's funding decisions in taking on potentially bankruptcy-indible debt. The main
idea of Trade-off Theory is to balance the profits and losses gained due to the use of debt. If the
loss in the use of debt is more than the profit earned from taxes, then additional debt is not
recommended because the potential for bankruptcy will be higher, whereas if the tax advantage
is greater eat additional debt is highly recommended.
The main idea of agent theory is when the purpose of the parties is different. Whereas the
obligation of the company's management is to increase shareholder profits by the amount. But

Volume 2, Issue 3, July 2021 E-ISSN : 2721-303X, P-ISSN : 2721-3021
Available Online: https://dinastipub.org/DIJEFA Page 290
the fact is that the agent or management of the company has other purposes that are different
from the objectives of the principal or investor. Differences in objectives or interests that become
potential triggers of conflict between agents and principals are called agency conflict (Djabid,
2009).
According to Brigham and Houston (2014) cash flow that can be distributed to investors
after investments are placed on all fixed assets, working capital and new products needed to
maintain ongoing operating activities is Free Cash Flow. But many companies have negative
cash flow as a result of investing in operating assets to accelerate growth, whereas those
companies have positive net operating profit after tax. In conclusion, Free Cash Flow is money
in cash after investments are placed in fixed assets, working capital and new products necessary
for the growth of the company and ready to be distributed to shareholders and debt owners.
Gordon and Lintner's opinion in Sartono (2001) is that investors on any dividend yield
reduction will expect a higher profit for each reduction because the risk of capital gains is greater
than dividend yield. Investor confidence reflected by the share price will increase if the dividend
given is large, a profit if applying the theory of bird in the hand. But investors on any high
dividends have to pay huge taxes.
Modigliani and Miller (1961) in Fuller and Goldstein (2011) explained that the value of the
company is not determined by the distribution of dividends or retained earnings but determined
by the company's ability to earn profit. So the cost of capital and share price are not influenced
by the dividend policy.
According to Harmono (2014) the form of public appreciation of the value of the company
is reflected in the share price formed from the demand and supply of the capital market. Price
Book Value (PBV) is the ratio of the market price compared to the price of the book, the ratio
used in this study. The more expensive the share price will be characterized by the higher the
value of PBV, and vice versa. (Anthanasius, 2012)
According to Brigham and Houston (2014) the main idea of Trade-off Theory is to balance
the profits and losses incurred due to the use of debt. If that balance occurs, the ratio of debt to
leverage (capital structure) will affect the high value of the company. This result is supported by
Nurcholik and Kurniasih (2021) with the results of their research that the balance between
benefits and costs of using debt will realize the optimal capital structure, so that leverage is
considered as a strong variable to increase the value of the company. Researchers taking the
research hypothesis for X1 are:
H1 = Leverage is suspected to have a positive effect on the Company's Value
The high growth ratio affects the Company's value because it reflects the high profit
earned by the company. The growing growth of assets will be desired by all parties, both
corporate management and investors. Perwira and Wiksuana (2018) in his research argue that
based on signal theory, a big influence on the value of the company is obtained from management
activity information in terms of investment expenditures that serve as signals about revenue
growth. Then the researchers taking the research hypothesis for X2 are:
H2 = Growth is thought to have a positive effect on the Company's Value.

Volume 2, Issue 3, July 2021 E-ISSN : 2721-303X, P-ISSN : 2721-3021
Available Online: https://dinastipub.org/DIJEFA Page 291
According to Ariyanto (2012) based on signal theory, the size of a large company will affect the
capital structure to be large, and vice versa. Large companies in making investments require
large funds. Similar to the research revealed by Umaiyah and Salim (2018) that capital in the
capital market will be easier to obtain in large companies that are already established compared
to small companies that have difficulty getting access because it has a small flexibility.
Researchers taking the hypothesis for X3 are:
H3 = Firm Size is suspected to have a positive effect on the Company's Value
According to Wijaya and Sedana (2015) based on bird in the hand that by giving high dividends,
the company will gain investor trust because the main purpose of investing is to benefit in the
form of large dividends. Then the researchers taking the hypothesis for the X4 study are:
H4 = Dividend Policy is suspected to have a positive effect on the Company's Value
According to Wijaya (2010) based on the theory of signals that high interest rates are a signal of
the decline in the value of the company because investors are more interested in saving than
investing. Then the researchers taking the hypothesis for the X5 study are:
H5 = Interest Rate is suspected to negatively affect the Company's Value
Figure 2. Frame Work
RESEARCH METHODS
Sample selection is done using purposive sampling with the following criteria:
Table 1. Population and Research Samples
No Sample Criteria Number of
Samples
1 Total Sub-Sector Construction &Building companies
in 2020 18
Volume 2, Issue 3, July 2021 E-ISSN : 2721-303X, P-ISSN : 2721-3021
Available Online: https://dinastipub.org/DIJEFA Page 292
2 Construction Sub Sector Companies were registered
with IDX in the period 2014 – 2020. 10
3 Construction Sub-Sector Companies & Listed on
Indonesia Stock Exchange that consistently report
financial statements for the period 2014-2020 are
available and accessible
10
4 Construction and building sub-sector companies
consistently pay dividends in 2014-2020 7
Number of Company Samples 7
FINDINGS AND DISCUSSION
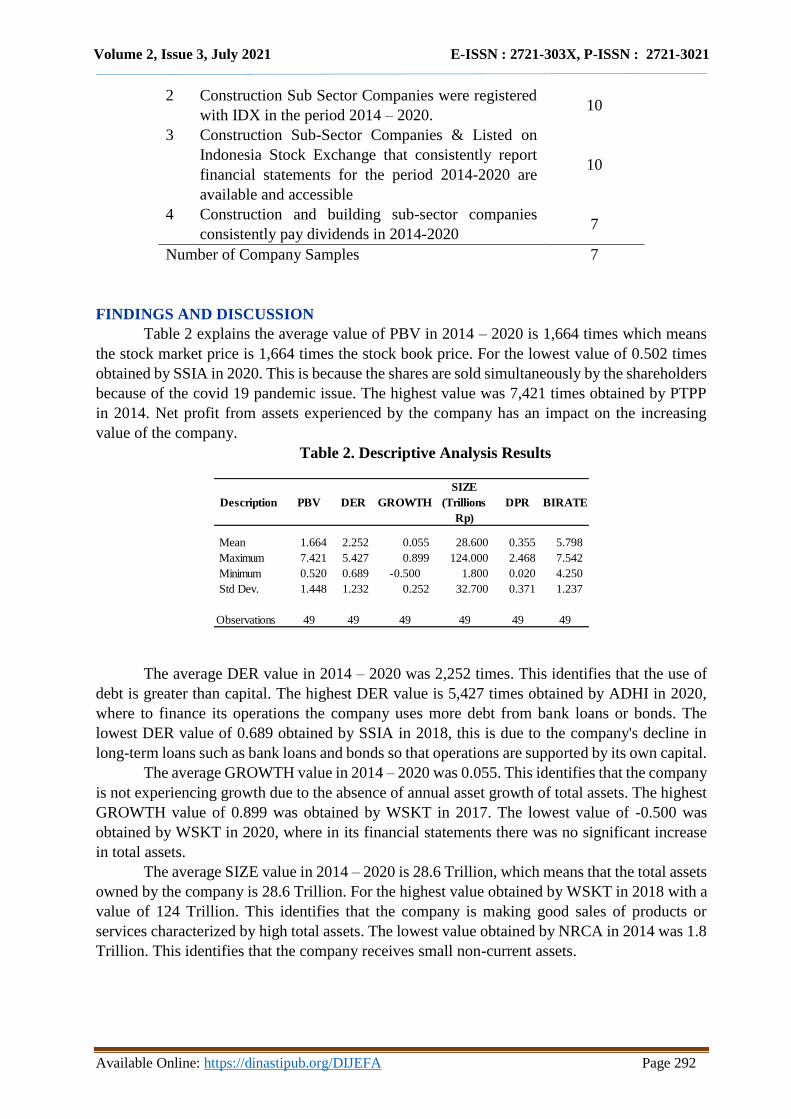
Table 2 explains the average value of PBV in 2014 – 2020 is 1,664 times which means
the stock market price is 1,664 times the stock book price. For the lowest value of 0.502 times
obtained by SSIA in 2020. This is because the shares are sold simultaneously by the shareholders
because of the covid 19 pandemic issue. The highest value was 7,421 times obtained by PTPP
in 2014. Net profit from assets experienced by the company has an impact on the increasing
value of the company.
Table 2. Descriptive Analysis Results
The average DER value in 2014 – 2020 was 2,252 times. This identifies that the use of
debt is greater than capital. The highest DER value is 5,427 times obtained by ADHI in 2020,
where to finance its operations the company uses more debt from bank loans or bonds. The
lowest DER value of 0.689 obtained by SSIA in 2018, this is due to the company's decline in
long-term loans such as bank loans and bonds so that operations are supported by its own capital.
The average GROWTH value in 2014 – 2020 was 0.055. This identifies that the company
is not experiencing growth due to the absence of annual asset growth of total assets. The highest
GROWTH value of 0.899 was obtained by WSKT in 2017. The lowest value of -0.500 was
obtained by WSKT in 2020, where in its financial statements there was no significant increase
in total assets.
The average SIZE value in 2014 – 2020 is 28.6 Trillion, which means that the total assets
owned by the company is 28.6 Trillion. For the highest value obtained by WSKT in 2018 with a
value of 124 Trillion. This identifies that the company is making good sales of products or
services characterized by high total assets. The lowest value obtained by NRCA in 2014 was 1.8
Trillion. This identifies that the company receives small non-current assets.
Description PBV DER GROWTH
SIZE
(Trillions
Rp)
DPR BIRATE
Mean 1.664 2.252 0.055 28.600 0.355 5.798
Maximum 7.421 5.427 0.899 124.000 2.468 7.542
Minimum 0.520 0.689 -0.500 1.800 0.020 4.250
Std Dev. 1.448 1.232 0.252 32.700 0.371 1.237
Observations 49 49 49 49 49 49

Volume 2, Issue 3, July 2021 E-ISSN : 2721-303X, P-ISSN : 2721-3021
Available Online: https://dinastipub.org/DIJEFA Page 293
The average value of DPR in 2014 – 2020 is 0.355. This identifies dividends given to
shareholders as smaller than their net income. With the highest score of 2,468 obtained by SSIA
in 2019. This identifies dividends paid greater than retained earnings. The lowest value of 0.020
obtained by PTPP in 2018. This identifies retained earnings paid greater than dividends paid to
shareholders due to small net income.
The average BI RATE in 2014 - 2020 was 5,798%. The lowest value of BI rate of 4,250%
is obtained in 2020. This is because in 2020, the government gradually lowered the BI Rate with
the aim of reducing production costs and encouraging export products. The highest score was
7,542% obtained in 2014. The government aims to absorb public funds and limit the circulation
of money. Therefore, the BI Rate is raised in the government's policy of reducing the rate of
inflation.
The following are the test results of the regression model that will be selected in this
study, among others:
Table 3. Common Effect Model (CEM)
CEM test result in table 3 is DER (X1) has positive Coefficient of 0.6398 while Prob
Value. < the α Value (0.0000 < 0.0500). GROWTH (X2) has a positive Coefficient of 0.6156
while the Prob. > Value α (0.3018 > 0.05). SIZE (X3) has a negative Coefficient of -0.3473 while
prob value. < the value of α (0.0203 < 0.0500). DPR (X4) has a positive Coefficient of 0.1258
while the Prob. value > the α value (0.7635 > 0.0500). The BI RATE (X5) has a positive
Coefficient of 0.6835 while the Prob Value. < α Value (0.000 < 0.0500). The F-statistic value is
14.06 while the Prob Value. (F-statistic) < the α Value (0.0000 < 0.05). R-Squared value: 0.6206
or 62.06%.
Table 4. Fixed Effect Model (FEM)
Variable Coefficient Prob.
C 6.6709 0.1521
DER 0.6399 0.0000
GROWTH 0.6157 0.3018
SIZE -0.3474 0.2030
DPR 0.1259 0.7635
BIRATE 0.6836 0.0000
R-Squared 0.6206
F-statistic 14.0691
Prob(F-statistic) 0.0000
Variable Coefficient Prob.
C 32.0888 0.0001
DER 1.0199 0.0000
GROWTH 0.3324 0.4469
SIZE -1.1682 0.0000
DPR 0.1323 0.6482
BIRATE 0.4390 0.0002
R-Squared 0.8569
F-statistic 20.1337
Prob(F-statistic) 0.0000

Volume 2, Issue 3, July 2021 E-ISSN : 2721-303X, P-ISSN : 2721-3021
Available Online: https://dinastipub.org/DIJEFA Page 294
The FEM test result in table 4 above is DER (X1) has a positive Coefficient of 1.0198
while the Prob Value. < the value of α (0.0000 < 0.0500). GROWTH (X2) has a positive
Coefficient of 0.3324 while the Prob Value: 0.4469 > α 0.05. SIZE (X3) has a negative
Coefficient of -1,168 while the Prob value < the α Value (0.0000 < 0.0500). DPR (X4) has a
positive Coefficient of 0.1322 while the Prob Value. > α Value (0.6482 > 0.0500). Bi RATE
(X5) has a positive Coefficient of 0.4390 while the Prob Value. <Α value (0.000 < 0.0500). The
F-statistic value is 20.13 while the Prob (F-statistic) value < the α Value (0.0000 < 0.0500). R-
Squared value: 0.8568 or 85.68%.
Table 5. Random Effect Model (REM)
REM test results in table 5. is DER (X1) has a positive Coefficient of 0.9590 with a Prob Value.
< the α Value (0.0000 < 0.0500). GROWTH (X2) has a positive Coefficient of 0.4985 while the Prob. >
Value α (0.2392 > 0.0500). SIZE (X3) has a negative Coefficient of -0.798 while the Prob Value. < the
value of α (0.0000 < 0.0500). Dpr (X4) has a positive Coefficient of 0.1539 while the Prob. > Value α
(0.5931 > 0.0500). Bi RATE (X5) has a positive Coefficient of 0.5559 while the Prob Value. < α Value
(0.000 < 0.0500). The F-statistic value is 31.09 while the Prob value. (F-statistic) < α Value (0.0000 <
0.0500). R-Squared value is 0.7833 or 78.33%
Based on the results of Table 6 in chow test produced Prob Value. < α Value (0.0000 < 0.0500).
The results showed that the right model for regression of panel data after chow test was CEM, which
means H0 was accepted.
Table 6. Result Chow Test
Based on the results of Table 7 in the Haussman test produced Prob Value > α Value (1.0000 >
0.0500). The results showed that the right model for regression of panel data after the haussman test was
REM, which means H0 was accepted.
Variable Coefficient Prob.
C 20.3357 0.0007
DER 0.9591 0.0000
GROWTH 0.4986 0.2392
SIZE -0.7985 0.0000
DPR 0.1539 0.5931
BIRATE 0.5559 0.0000
R-Squared 0.7834
F-statistic 31.0987
Prob(F-statistic) 0.0000
Effect Test Prob.
Cross-section F 0.0000

Volume 2, Issue 3, July 2021 E-ISSN : 2721-303X, P-ISSN : 2721-3021
Available Online: https://dinastipub.org/DIJEFA Page 295
Table 7. Result Haussman Test
In Table 8 in the Probability section brusch-pagan looks Prob Value. > the value of α (1,000 >
0.0500) then H1 is accepted, then the REM model is more appropriate compared to the CEM
model.
Table 8. Result Lagrange Multiplier Test
According to Gujarati et.al (2012), the Generalized Least Square (GLS) method is an equation
that meets classical assumptions. In data processing using software eviews model estimation
random effect model (REM) using GLS method, while Ordinary Least Square (OLS) is used by
fixed effect model (FEM) and common effect model (CEM). This indicates that classic
assumption testing in this study is not required.
Based on table 9, it is known for PBV as dependent variable has F-Statistic value: 31.09,
while Prob Value: 0.0000. F-table value: 2.59. Thus it can be seen that the F-Statistic value > the
F-table value (31.09 > 2.59) while the Prob Value. < the α value (0.0000 < 0.0500). Thus H0 is
rejected and Ha is accepted, in other words Leverage, Growth, Firm Size, Dividend Policy, and
Interest Rate simultaneously have a significant effect on the Company's Value.
Table 9. Result F Test
As the author explains the basis of this test decision making, based on the results of the Random
Effect Model test in the R-squared column obtained a value of 0.783368 (78.33%) which means
the magnitude of the influence of variable Leverage, Growth, Firm Size, Dividend Policy and
Interest Rate on the Company's Value of 78.33%, and 21.67% are other factors beyond the
influential research variables.
Table 10. Coefficient of Determination Test
Test Summary Prob.
Cross-section random1.0000
Null (no rand. Effect) Prob.
Breusch-Pagan0.0000
F-statistic 31.0987
Prob.(F-statistic) 0.0000
R-squared 0.783368

Volume 2, Issue 3, July 2021 E-ISSN : 2721-303X, P-ISSN : 2721-3021
Available Online: https://dinastipub.org/DIJEFA Page 296
Based on the equation of the data regression model panel that has been described, the decision
making for this test is in accordance with the description of the previous author. The result of der
variable is t-statistic > t-table (8.0115 > 2.014) with Prob Value. < the value of α (0.0000 <
0.0500) then Ha received, so that Leverage has a positive and significant influence on the
Company's Value. For GROWTH results are t-statistic < t-table (1.1934 < 2.014) with the
acquisition of Prob. > Value α Value (0.2392 > 0.0500) then Ho is accepted, so that growth
variable has no influence on the Company Value. The test result for SIZE is t-statistic < t-table
(-4.5487 < -2.014 with prob. < Value α (0.0000 < 0.0500) then Ho rejected, so that the variable
Firm Size has a negative and significant influence on the Company's Value. Dpr test results are
t-statistic < t-table (0.5383 < 2.014 with the acquisition of Prob Value. > value α (0.5931 >
0.0500) then Ho is accepted, so the Dividend Policy has no influence on the Company's Value.
Birate test results were t-statistic > t-table (6.0780 >2.014) with prob value. < the α Value (0.0000
< 0.0500) then Ho is rejected, so the Variable Interest Rate has a positive and significant
influence on the Company's Value.
Table 11. Result t-Test
The model chosen in this study is random effect model, then formed the equation of regression
of panel data as follows:
PBVit = 20.3357 + 0.9590 DER + 0.4985 GROWTH – 0.7985 SIZE + 0.1539 DPR + 0.5559
BIRATE
The results of the study obtained by Coefficient DER amounted to 0.9590, which means that
every leverage increase of 1 will increase the Company's Value by 0.9590 times. The results
show that Leverage has a positive and significant influence on the Company's Value. This
reinforces the Trade-off Theory outlined by Brigham and Houston (2014) that the high leverage
ratio when the balance of profits and losses gained due to the use of debt will affect the high
value of the company.
In contrast to the findings of al-Slehat research (2020) which states that Leverage does
not have a significant influence on the Company's Value, as well as Nasehah and Widyarti (2012)
with leverage results have a negative and significant effect. Research by Adenugba et. al (2016)
agrees with the results studied, that Leverage has a positive and significant influence on the
Company's Value. The results of this study explained that not always the use of debt is
considered negative even though a high debt ratio has an impact on high risk as well.
The results of the study obtained Coefficient GROWTH of 0.4985, which means Growth
does not have a significant influence on the Company's Value. This is contrary to the signal
theory that the high growth ratio that reflects the high profit of the company does not affect the
Variable t-Statistic Prob.
C 3.6349 0.0007
DER 8.0115 0.0000
GROWTH 1.1935 0.2392
SIZE -4.5488 0.0000
DPR 0.5383 0.5931
BIRATE 6.0781 0.0000

Volume 2, Issue 3, July 2021 E-ISSN : 2721-303X, P-ISSN : 2721-3021
Available Online: https://dinastipub.org/DIJEFA Page 297
Company's value. Investors argue that not all large assets will be used as operational costs of the
company but only silenced.
In contrast to the findings of the Officer and Wiksuana research (2018) which states that
Growth has a positive and significant effect on the Company's Value, research conducted by
Burhanuddin and Yusuf (2019) with growth results negatively and significantly affects the
Company's Value. Research by Dhani and Utama (2017) agrees with the results studied, that
Growth has no significant effect on the Company's Value. The results of this study showed that
the company's growth did not have a considerable impact on investor confidence in the
company's performance resulting in high low value of the company. The increasing number of
company assets is not a guarantee that investors will rate the company positively.
The results of the study obtained Coefficient SIZE of -0.7985, which means that any
decrease in Firm Size by 1 will decrease the Company's Value by -0.7985 Times, which means
firm size has a negative and significant influence on the Company's Value. This is contrary to
Ariyanto (2012) based on signal theory that states the size of a large company will affect the
capital structure to be large, and vice versa. Large companies in making investments require
large funds that affect the high value of the company.
Research conducted by Nguyen et. al (2020) which states that Firm Size has a positive
and significant effect on the Company's Value, as well as Chasanah (2018) with the results of
Firm Size research has no significant effect on the Company's Value. Furthermore, research
conducted by Tunggal (2018) agreed with the results studied, that Firm Size has a negative and
significant effect on the Company's Value. The results of this study explain that with a large total
assets, the company can not necessarily pay dividends that are the main objective of investors.
This affects the investor's valuation of the company's value.
The results of the study obtained coefficient dpr amounted to 0.1539, which means
dividend policy does not have a significant influence on the Company's Value. This is contrary
to the bird in the hand theory that high dividends will gain investor confidence in investing
because the main purpose of investing is to get a large dividend. Similarly, Sintyana and Artini
(2019) stated that dividend policy has a positive and significant effect on the Company's Value,
and Palupi and Hendiarto (2018) which states that dividend policy has a negative and significant
effect on the Company's Value.
Meanwhile, research conducted by Septariani (2017) found that Dividend Policy has no
influence on the Company's Value. The result supports the Dividend Irrelevant theory that the
company's value is not determined by the company's profit distributed in the form of dividends
and retained earnings but determined by the company's ability to earn profit. So the cost of capital
and share price are not influenced by the dividend policy. (Modigliani and Miller, 1961)
The results of the study obtained Coefficient Coefficient BI Rate of 0.5559, which means
that every increase in BI Rate by 1 will increase the Company's Value by 0.5559 Times, which
means that the Interest Rate has a positive and significant influence on the Company's Value.
This is contrary to Wijaya's opinion (2010) based on the signal theory that high interest rates are
a signal of a decline in the value of the company because investors are more interested in saving
than investing. And the results of research conducted by Pratamawati (2015) which states that
interest rate has a negative and significant effect on the Company's Value, as well as Putra et.
(2016) stating that the Interest Rate has no significant effect on the Company's Value. The results
showed that banks do not make changes to savings interest, deposits and credit interest. Of the
all independent variables already mentioned above, the variable with the greatest influence is

Volume 2, Issue 3, July 2021 E-ISSN : 2721-303X, P-ISSN : 2721-3021
Available Online: https://dinastipub.org/DIJEFA Page 298
Leverage with Coefficient of 0.9590. This means that construction and building sub-sector
companies have optimized their debt ratio by balancing the profits and losses incurred due to the
use of debt.
CONCLUSION AND SUGESTION
Based on the hypothesis testing conducted, it can be concluded that:
1. The results of this study explain that Leverage has a positive and significant influence
on the Company's Value.
2. The results of this study explain that Growth does not have a significant influence on the
Company's Value.
3. The results of this study explain that Firm Size has a negative and significant influence
on the Company's Value.
4. The results of this study explain that dividend policy does not have a significant influence
on the Company's Value.
5. The results of this study explain that the Interest Rate has a positive and significant
influence on the Company's Value
Based on the results of the data analysis and the limitations of the study, the authors try to
provide suggestions to improve the next research, namely:
1. For investors, the selection of shares for construction and building sub-sectors with
leverage ratios above 2.5 is highly recommended if the company has balanced the
profits and losses gained due to the use of debt. Because it affects the impact of firm
size and interest rate on the high value of the company.
2. For the management of the company, this research is expected in informing its activities
contained in the financial statements should provide actual information. And it is
advisable to determine the leverage variable by using debt at a certain level as its
funding.
3. For further researchers, it is expected to discuss more in the influence of other leverage
ratios such as WACC (Weighted Average Cost of Capital)
REFERENCE
Adenugba, A. A., Ige, A. A., & Kesinro, O. R. (2016). Financial leverage and firms’ value: A study of
selected firms in Nigeria. European Journal of Research and Reflection in Management
Sciences, 4(1).
Al-Slehat, Z. A. F. (2020). Impact of Financial Leverage, Size and Assets Structure on Firm Value:
Evidence from Industrial Sector, Jordan. International Business Research, 13(1), 109-120.
Ariyanto, A. (2020). Pengaruh Profitabilitas, Struktur Aktiva Dan Ukuran Perusahaan Terhadap
Struktur Modal Pada Perusahaan Properti Dan Real Estate Yang Terdaftar Di BEI 2013-
2017. Entrepreneurship Bisnis Manajemen Akuntansi (E-BISMA), 10-19.
Athanasius, T. (2012). Panduan Berinvestasi Saham. Jakarta: Elek Media Computindo.
Brigham, Eugene F dan J F. Houston. (2014). Fundamentals of Financial Management. 14th Edition.
Mason: South-Western Cengange Learning.
Burhanuddin, B., & Yusuf, D. (2019). Pengaruh Struktur Modal Dan Growth Opportunity Terhadap
Nilai Perusahaan. Jurnal Sinar Manajemen, 6(1), 1-11.
Chasanah, A. N. (2018). Pengaruh Rasio Likuiditas, Profitabilitas, Struktur Modal Dan Ukuran
Perusahaan Terhadap Nilai Perusahaan Pada Perusahaan Manufaktur Yang Terdaftar Di Bei
Tahun 2015-2017. Jurnal Penelitan Ekonomi dan Bisnis, 3(1), 39-47.

Volume 2, Issue 3, July 2021 E-ISSN : 2721-303X, P-ISSN : 2721-3021
Available Online: https://dinastipub.org/DIJEFA Page 299
Djabid, A. W. (2009). Kebijakan dividen dan struktur kepemilikan terhadap kebijakan utang: Sebuah
perspektif agency theory. Jurnal Keuangan dan Perbankan, 13(2), 249-259.
Fuller, K. P., & Goldstein, M. A. (2011). Do dividends matter more in declining markets? Journal of
Corporate Finance, 17(3), 457-473.
Gujarati, D. N., Porter, D. C., & Gunasekar, S. (2012). Basic econometrics. Tata McGraw-Hill Education.
Harmono (2014). Manajemen Keuangan. Edisi 1. Jakarta: PT. Bumi Aksara
Husnan, S. (2008). Manajemen Keuangan: Teori dan Penerapan Buku 1. Edisi ke-4. Yogyakarta: BPFEE.
Manurung, A. H. (2019). Teori Informasi Asimetris. Utilitas, 1(1), 5.
Nasehah, D., & Widyarti, E. T. (2012). Analisis Pengaruh ROE, DER, DPR, Growth, dan Firm Size
Terhadap Price to Book Value (PBV) (Studi Kasus Pada Perusahaan Manufaktur yang Listed di BEI
periode Tahun 2007-2010) (Doctoral dissertation, Fakultas Ekonomika dan Bisnis).
Nguyen, T. T., Nguyen, H. P., Nguyen, L. B., Vu, N. T., & Le, T. U. (2020). The Relationship Between
Capital Structure and Firm Value: Cases of Listed Companies in The Food and Beverages Industry
in Vietnam. Academy of Accounting and Financial Studies Journal, 24(1).
Nurcholik, A., & Kurniasih, A. (2021). Pengaruh Keputusan Investasi, Kebijakan Dividen, Keputusan
Pendanaan, Profitabilitas dan Likuiditas Terhadap Nilai Perusahaan. Warta Pendidikan e-Journal,
5(5).
Palupi, R. S., & Hendiarto, R. S. (2018). Kebijakan Hutang, Profitabilitas dan Kebijakan Dividen Pada
Nilai Perusahaan Properti & Real Estate. Jurnal Ecodemica: Jurnal Ekonomi, Manajemen, dan
Bisnis, 2(2).
Perwira, A. A. G. A. N., & Wiksuana, I. G. B. (2018). Pengaruh Profitabilitas dan Pertumbuhan Aset
Terhadap Kebijakan Dividen dan Nilai Perusahaan. E-Jurnal Manajemen, 7(7), 3767-3796.
Putra, E. M., Kepramerani, P., & Novitasari, N. L. G. (2016). Pengaruh Kinerja Keuangan, Inflasi dan
Tingkat Suku Bunga terhadap Nilai Perusahaan. Prosiding Semnas Hasil Penelitian.
Pratamawati, E., & Suwarno, A. E. (2015). Analisis Pengaruh Keputusan Investasi, Keputusan
Pendanaan, Kebijakan Dividen Dan Tingkat Suku Bunga Terhadap Nilai Perusahaan (Studi Empiris
pada Perusahaan Manufaktur yang Terdaftar di Bursa Efek Indonesia Periode 2008-2012).
Doctoral dissertation, Universitas Muhammadiyah Surakarta.
Sartono. (2001). Manajemen Keuangan Teori dan Aplikasi edisi ke empat. Yogyakarta: BEF.
Septariani, D. (2017). Pengaruh kebijakan dividen dan kebijakan hutang terhadap nilai perusahaan
(Studi Empiris Pada Perusahaan LQ45 di BEI Periode 2012-2015). JABE (Journal of Applied
Business and Economic), 3(3), 183-195.
Sinaga, N. S., & Prasetiono, P. (2014). Analisis Pengaruh Corporate Governance Terhadap Kinerja
Keuangan Perusahaan Dengan Variabel Kontrol Ukuran Perusahaan Dan Growth Opportunity
(Studi Pada Perusahaan Manufaktur Yang Terdaftar Di Bursa Efek Indonesia (BEI) Tahun 2009-
2013). Doctoral dissertation, Fakultas Ekonomika dan Bisnis.
Sintyana, I. P. H., & Artini, L. G. S. (2018). Pengaruh Profitabilitas, Struktur Modal, Ukuran Perusahaan
Dan Kebijakan Dividen Terhadap Nilai Perusahaan. E-Jurnal Manajemen, 8(2), 757-785.
Tunggal, C. A., & Ngatno, N. (2018). Pengaruh Struktur Modal Terhadap Nilai Perusahaan dengan
Ukuran dan Umur Perusahaan sebagai Variabel Moderator (Studi Kasus Tahun 2014-2016) pada
Perusahaan Sub-Sektor Makanan dan Minuman yang Terdaftar di BEI. Jurnal Ilmu Administrasi
Bisnis, 7(2), 141-157.
Umaiyah, E., & Salim, M. N. (2018). Rasio Keuangan, Ukuran Perusahaan, Struktur Modal Dan
Dampaknya Terhadap Nilai PerusahaanNon Perbankan Kategori LQ-45. Indikator. Jurnal Ilmiah
Manajemen & Bisnis, 2(3), 120-135.
Wijaya, B. I., & Sedana, I. B. (2015). Pengaruh Profitabilitas terhadap Nilai Perusahaan (Kebijakan
Dividen dan Kesempatan Investasi sebagai Variabel Mediasi). E-Jurnal Manajemen Unud, 4(12),
4477-4500.
Volume 2, Issue 3, July 2021 E-ISSN : 2721-303X, P-ISSN : 2721-3021
Available Online: https://dinastipub.org/DIJEFA Page 300
Wijaya, L. R. P. (2010). Implikasi keputusan investasi, keputusan pendanaan, dan kebijakan dividen
terhadap nilai perusahaan. Doctoral dissertation, UNS (Sebelas Maret University).