effect of chemical and environmental parameters on the
TRANSCRIPT

Effect of chemical and environmental parameters on the quantification of oil in produced water using EPA Method 1664 and confocal laser fluorescence microscopy (CLFM):
Accuracy as a function of stack number and optical sections
E. N. Sappington1, C. N. Wickramaratne1, H. S. Rifai1 1 University of Houston
Friday, January 27, 2017 1

Outline
• Background
• Part I • Representative sampling technique • Identify patterns among parameters
• Part II • Salinity • Particulates • Chemical additives • Various API gravities
• Conclusion and future work
Friday, January 27, 2017 2

Background: EPA 1664 and oil and grease (O&G)
Produced water (PW) constituents:
TDS, HCs, particulates, chemical additives, microbes, scales, organics, metals, NORM
Test to ensure compliance with discharge standards for O&G
• Governed by the Clean Water Act
• Daily max: 42 mg/L; monthly avg: 29 mg/L
• O&G defined as “hexane extractable material “ (HEM) • “materials extractable by n-hexane and not evaporated at 70˚C”
3 Friday, January 27, 2017
TDS, HCs, particulates, chemical additives, microbes, scales, organics, metals, NORM

Background: EPA 1664 and O&G
In offshore production, PW is:
1. Treated at surface
2. Tested using EPA 1664
3. Discharged to ocean
EPA 1664:
• Substantial handling
• Laboratory based method
• Not applicable for subsea
4 Friday, January 27, 2017
Goal: Identify alternative methods to test for compliance and quantify O&G in PW at the seabed

Background: CLFM
CLFM:
spatial filtering to render higher quality images
CLFM diagram: fluorescence mode
Optical sectioning and history of use
Friday, January 27, 2017 5

Background: transition from previous study
Proof of concept comparison study • Recovery: 87-89% EPA 1664; 85-89% CLFM • CLFM large standard deviation • Lack of a systematic method in retrieving CLFM
data resulted in inability to interpret relationship among parameters
Current objectives:
1) Establish representative sampling technique
2) Assess effect of various parameters on CLFM performance
Friday, January 27, 2017 6
0
20
40
60
80
100
120
clean medium dirty
Me
asu
red
C
on
cen
trat
ion
(m
g/L)
EPA 1664
Confocal
0
10
20
30
40
50
0 10 20 30 40 50
Oil
and
Gre
ase
R
eco
vere
d (
mg/
L)
Oil and Grease Added to Sample (mg/L)
EPA 1664
Confocal

Sample preparation: oil concentration
Analytical technique: “weight by difference”
1) weigh vial of crude oil + pipet
2) drop crude oil into bottle
3) weigh vial of crude oil + pipet
4) difference = mass of crude oil in bottle
Pasteur pipet
Drop crude oil into sample
bottle
Sample bottle Balance
Vial
Friday, January 27, 2017 7

Sample preparation: flow cell
Disperse 1 hour @ 12,000 RPM (IKA T 18 digital Ultra-Turrax) Pipet into 100 L flow cell (Ibidi -Slide 0.4 Luer ibiTreat #1.5 polymer coverslip, tissue culture treated, sterilized)
Friday, January 27, 2017 8

Representative sampling technique: grid cells, random sampling
Obtain stacks on CLFM (Leica DM2500B SPE confocal) Process stacks in MATLAB (Mathworks R2016a)
Friday, January 27, 2017 9

Methodology: confocal settings
Friday, January 27, 2017 10

11 Friday, January 27, 2017
Methodology: confocal settings

Methodology: MATLAB
Friday, January 27, 2017 12
image
• Import image
• Convert grayscale to binary using threshold
• Calculate concentration
threshold
• Repeat for all threshold values (0.05 – 0.95)
• Repeat for each grid cell
• Determine optimum threshold based on lowest error
volume
• Randomly select grid cells (3, 6, 9, 12)
• Calculate concentration
grayscale binary threshold = 0.3

Part I: patterns among parameters
Friday, January 27, 2017 13
3
6
9
12
0
20
40
60
80
100
120
2
4
6
8
10
Number stacks
% R
eco
ery
Z-step
25 ppm 100-120
80-100
60-80
40-60
20-40
0-20
3
6
9
12
0
10
20
30
40
50
60
70
80
90
100
2 4
6
8
10
Number stacks
%R
eco
very
Z-step
50ppm 90-100 80-90 70-80 60-70 50-60 40-50 30-40 20-30 10-20 0-10

Part I: crude oil
Friday, January 27, 2017 14
0%
10%
20%
30%
40%
50%
60%
70%
80%
90%
100%
110%
120%
130% P
erc
en
t R
eco
very
(%
)
Crude Oil Concentration (mg/L)
25 ppm 50 ppm
threshold = 0.3
EPA 1664 recoveries 87 – 88%; standard deviations 2 – 5%
CLFM recoveries 94 – 99%; standard deviations 19 – 31% heterogeneous flow channel
Density: 0.908 g/mL API gravity : 24.3˚
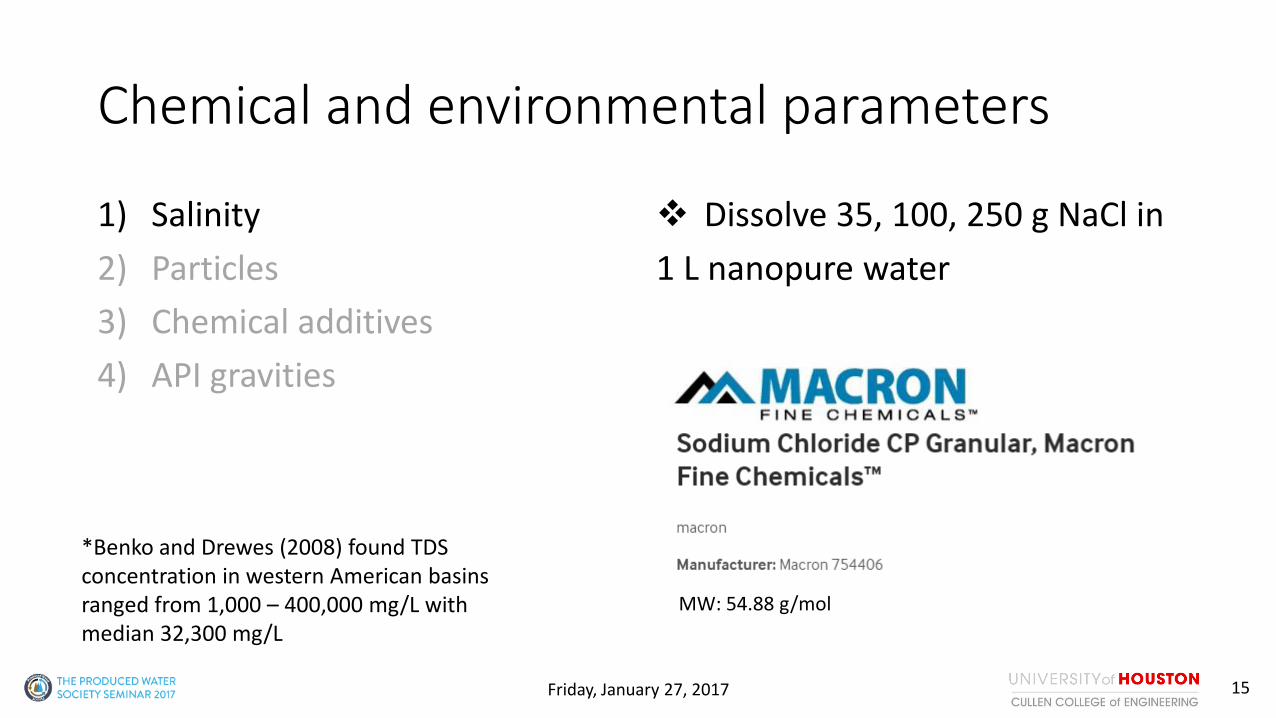
Chemical and environmental parameters
1) Salinity
2) Particles
3) Chemical additives
4) API gravities
Dissolve 35, 100, 250 g NaCl in
1 L nanopure water
15 Friday, January 27, 2017
MW: 54.88 g/mol
*Benko and Drewes (2008) found TDS concentration in western American basins ranged from 1,000 – 400,000 mg/L with median 32,300 mg/L

0%
10%
20%
30%
40%
50%
60%
70%
80%
90%
100%
Pe
rce
nt
Re
cove
ry (
%)
NaCl Concentration (mg/L)
25 ppm 50 ppm
Part II: salinity
Friday, January 27, 2017
16
35,000 100,000 250,000 35,000 100,000 250,000
EPA 1664 recoveries 83 – 96%; standard deviations 1 – 6%
CLFM recoveries 24 – 79%; standard deviations 5 – 40% small droplets, threshold too large? % recovery decreased with increasing salt concentration

Chemical and environmental parameters
1) Salinity
2) Particles
3) Chemical additives
4) API gravities
Add 10 and 50 mg SiO2 to each 1 L sample
17 Friday, January 27, 2017
MW: 60.08 g/mol

Part II: particles
Friday, January 27, 2017 18
0%
10%
20%
30%
40%
50%
60%
70%
80%
90%
100% P
erc
en
t R
eco
very
(%
)
SiO2 Concentration (mg/L)
25 ppm 50 ppm
10 50 10 50
EPA 1664 recoveries 88 – 92%; standard deviations 1 – 4%
CLFM recoveries 11 – 26%; 5 – 64% electrical and physical properties should be further investigated

Chemical and environmental parameters
1) Salinity
2) Particles
3) Chemical additives
4) API gravities
19 Friday, January 27, 2017
Chemical Deoiler Scale Inhibitor Hydrate Inhibitor
Corrosion Inhibitor
Density (g/mL)
1.1668 1.1542 0.8558 0.9195
Concentration (mg/L)
20 40 100 30
Use in field Neutralize
emulsifying agents
Prevent/ remove scale
build up
Interfere with hydrate crystal
growth
Control corrosion rates
Main ingredient(s) (provided in
MSDS)
NaCl Na2S
n/a methanol
Methanol NR4
+ organic sulfonic acid amine salt

Corrosion inhibitor interference with EPA 1664
20 Friday, January 27, 2017
Conventional emulsion breaking techniques unsuccessful physical means = loss of oil?
HEM contaminated redissolve in hexane re-distill crystal formation in HEM
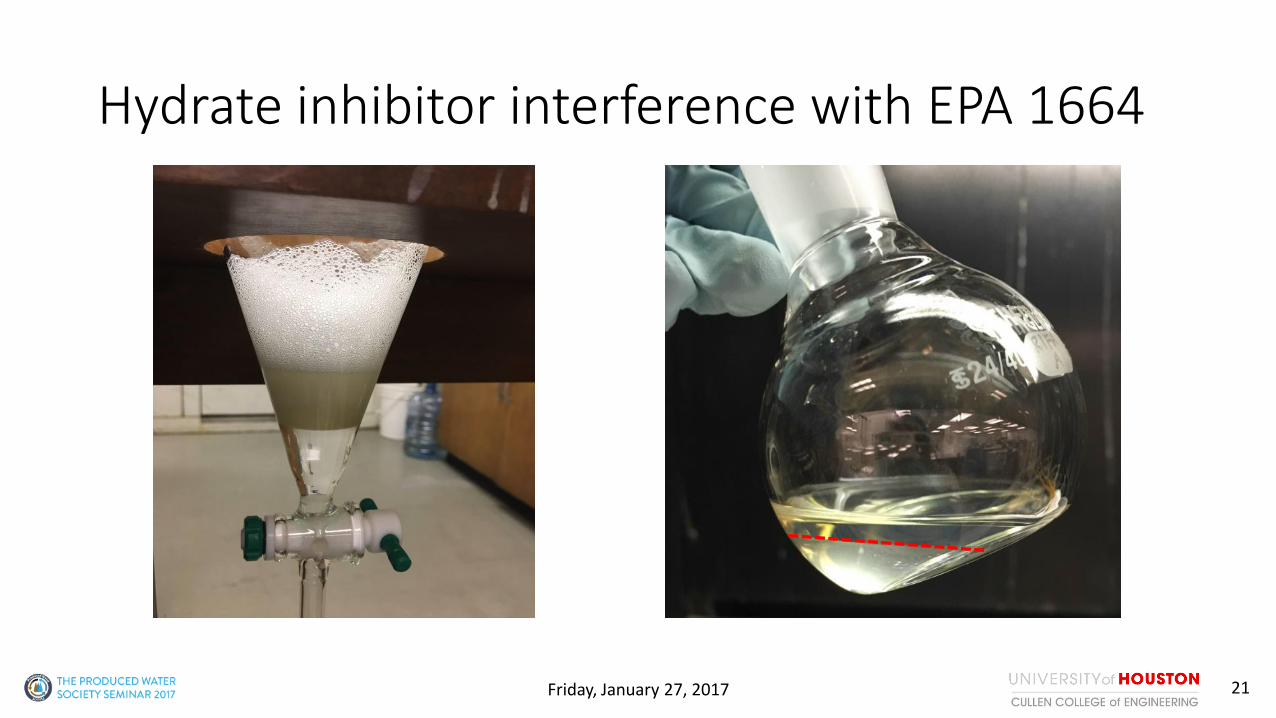
Hydrate inhibitor interference with EPA 1664
21 Friday, January 27, 2017

Hydrate inhibitor interference with CLFM
22 Friday, January 27, 2017

Deoiler effect on droplets
• Large (up to ~20-30 m)
• Non-spherical
• Expected to coalesce
23 Friday, January 27, 2017

0%
20%
40%
60%
80%
100%
120%
140%
Pe
rce
nt
Re
cove
ry (
%)
Chemical Additive
25 ppm 50 ppm
deoiler hydrate scale corrosion deoiler hydrate scale corrosion
Part II: chemical additives
Friday, January 27, 2017 24
EPA 1664 recoveries just under acceptable for deoiler and scale inhibitor
CLFM recoveries range 40 – 140%, large standard deviations
Chemical additives create regulatory issues?
Chemical analysis to identify (1) emulsion type
(2) emulsion breaking techniques (3) interaction between chemical, water, and oil to ensure compliance

Chemical and environmental parameters
1) Salinity
2) Particles
3) Chemical additives
4) API gravities
25 Friday, January 27, 2017
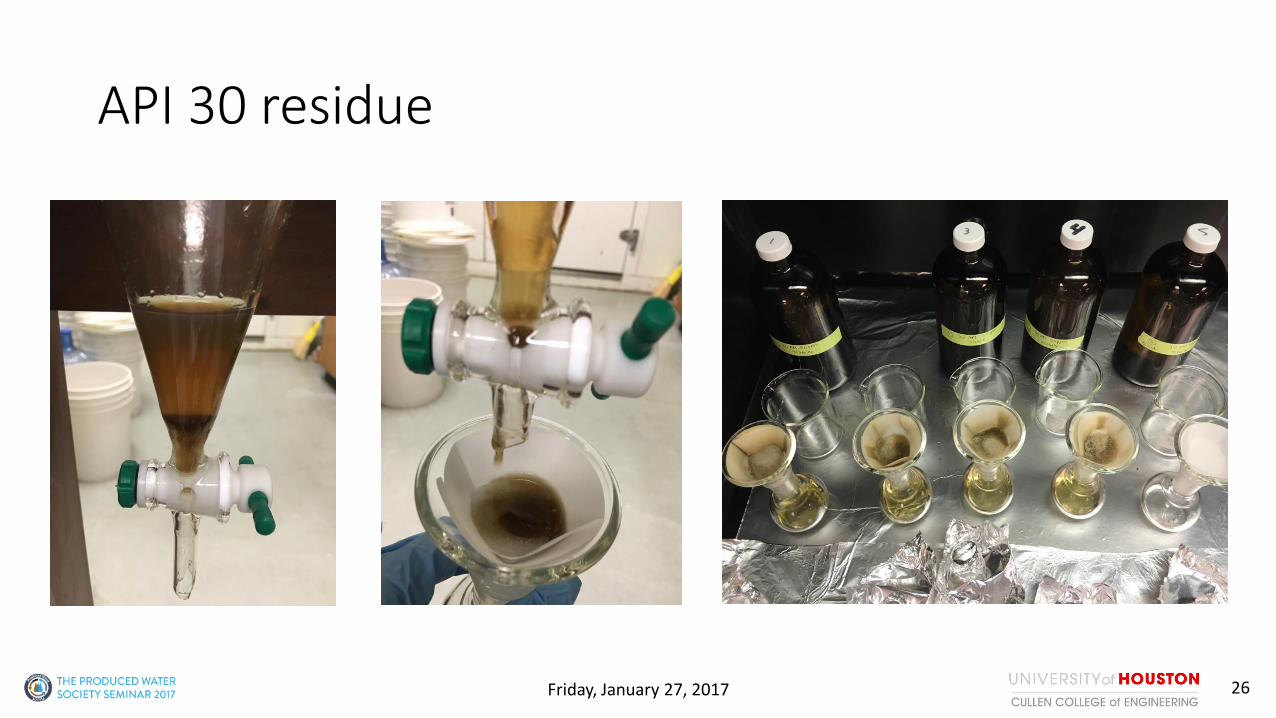
API 30 residue
26 Friday, January 27, 2017

0%
10%
20%
30%
40%
50%
60%
70%
80%
90%
100%
Pe
rce
nt
Re
cove
ry (
%)
API Gravity (˚API) 40 30 20 40 30 20
25 ppm 50 ppm
Part II: API gravities
Friday, January 27, 2017 27
API Gravity (˚API)
EPA 1664 recoveries 60 – 77% with one acceptable: heaviest oil, highest conc. 85% EPA 1664 standard deviations 0.9 – 4% with one acceptable: lightest oil, lowest conc. 13%
CLFM recoveries 28 – 58%
CLFM standard deviations 21-35% with two acceptable: API 40 25ppm and API 30 50ppm
May contain hydrocarbons not extractable by hexane, non-aromatic (paraffins?), or sediment particles

Conclusions
• Large standard deviations indicate non-homogeneity throughout flow channel
• Randomized sampling not ideal until homogenous channel concentration achieved
• Little effect on % recovery from varying Z-step
• CLFM % recovery decreased with increasing NaCl,
• EPA 1664 and CLFM % recovery increased with increasing oil density
• Chemical/oil analysis needed to further understand interactions and behaviors
Friday, January 27, 2017 28

Future Work
• Design and develop: • Flow loop system to control homogeneity within flow channel
• Grid structure containing more cells (stacks)
• Identify minimum number stacks and z-step needed to save time and $
• Identify appropriate threshold value based on oil type and concentration
• Chemical analyses to understand interaction between oil – water – chemicals
29 Friday, January 27, 2017
Acknowledgements
Clearview Subsea, LLC and RPSEA (Project No. 12121-6301-03) are acknowledged for funding this research. The NSF GK-12 program, TCEQ, and US EPA are acknowledged for financial support. Jeff Zhang, Debora Rodrigues, and Jingjing Fan are acknowledged for their guidance and helpful comments.
30 Friday, January 27, 2017
