educational systems in africa are increasingly offering ... · pdf fileoffering information...
TRANSCRIPT

Educational systems in Africa are increasingly offering information and communication technology in junior schools.

Part IIIAbridged Financial Management and Financial Statements
Part III presents an abridged version of the Bank Group’s Financial Statements. The full version, together with a more detailed analysis of developments during the review period, is available on a separate USB flash drive.

AfDB Treasury expert at work in the new HQ building, Côte d’Ivoire.

Chapter 6Managing Financial Performance in Turbulent Times
6.1. A Prudent Investment Strategy for a Challenging Financial Markets Context
In the face of continued turbulence in the financial markets in 2015, the Bank maintained a conservative investment strategy, which helped to limit interest rate and exchange rate sensitivity, thus reducing the negative impacts of the Bank’s exposure to the financial markets.
The Bank’s borrowing and investment activities in 2015 were undertaken in a challenging environment of significant volatility in the global financial markets. Events in Greece dominated the first half of 2015, as the newly elected Government sought to renegotiate the country’s bailout terms with its creditors. After months of protracted negotiation, following the near-collapse of the Greek financial system, and with the country’s exit from the Eurozone becoming a possibility, the Government accepted a further bailout under stringent terms. Market fears of a Greek default and concerns over the future of the Eurozone created substantial stress across financial markets. This led to the widening of credit spreads of European sovereign and supranational institutions, the latter representing the largest creditors to Greece following its debt restructuring in 2012.
In the second half of the year, as concerns over Greece abated, volatility was triggered by weak economic data in China and amplified by monetary tightening in the United States, rapidly declining oil prices, and the high private sector indebtedness in a number of emerging market economies. In particular, the perceived fragility of China’s economy had major implications for the global financial markets, triggering falls in global equity and commodity markets, as well as in emerging market currencies. In response, and in the light of persistently low
inflation, central banks across the world continued to employ extremely accommodative monetary policies, cutting interest rates to historically low (and in some cases negative) levels. A notable exception was the US Federal Reserve, which began tightening its monetary policy, increasing interest rates in December, for the first time since 2008.
The lower interest-rate environment reduced the returns on the Bank’s treasury investment portfolios. However, in the case of ADB’s liquidity portfolios, as these are funded by debt, the reduction in borrowing costs offsets the lower investment income. Given the global market volatility that has prevailed, the Bank continued to adopt a prudent investment strategy, prioritizing capital preservation and liquidity over attempting to generate higher income by taking on additional risks. As such, the Bank has continued to target high-quality liquid assets with short maturities, with a focus on secured investments where possible. As a result, the credit quality and liquidity profile of the Bank’s investments remains very strong, while volatility of returns is limited.
Bank RatingThe rating agencies—Standard and Poor’s, Fitch, Moody’s and Japan Credit Rating Agency—reaffirmed their AAA/Aaa and AA+/Aa1 ratings of the Bank’s senior and subordinated debts, respectively, with a stable outlook. The high ratings confirm the Bank’s efficient management, strong financial position, membership support, capital adequacy, and liquidity.
Risk Management PoliciesThe Bank’s risk management policies and procedures are discussed in Note D to the audited financial statements for the year ended 31 December 2015, available on a separate USB flash drive.
This chapter describes the challenging investment environment in 2015 and key measures taken by the Bank Group to preserve its financial soundness. It also presents the strategies adopted by the Bank Group in managing its investments and discusses the Bank’s financial performance. It concludes with a presentation of the abridged financial results of the African Development Bank (ADB), the African Development Fund (ADF), and the Nigeria Trust Fund (NTF).
Chapter 6Chapter 6 Managing Financial Performance in Turbulent Times
104

6.2. Financial Results
This section summarizes the financial performance of the three Bank Group entities. The 2015 total net income of Bank Group entities—ADB, ADF and NTF—is lower than 2014. This was largely attributable to lower interest rates, increased impairment on non-sovereign loans, and an unfavorable impact of fair valuation of borrowings and derivatives, which is typically volatile.
THE BANK GROUP
The total combined income of the Bank Group, before distributions approved by the Board of Governors for the year ended 31 December 2015, amounted to UA 11.30 million compared to UA 27.82 million for 2014. Investment income for the year ended 31 December 2015 decreased by 12.25 percent from UA 209.18 million in 2014 to UA 183.55 million in 2015, while loan income increased by 4.18 percent to UA 441.99 million. Total Bank Group expenses, including those relating to the return to Headquarters, for the year ended 31 December 2015, amounted to UA 323.3 million compared to UA 372.1 million for 2014.
The financial highlights of each of the entities within the Bank Group are discussed below.
THE AFRICAN DEVELOPMENT BANK
During the year, the Bank entered into Exposure Exchange Agreements (EEAs) with other Multilateral Development Banks (MDBs) with the objective of managing the risks in its loan portfolio to optimize its balance sheet, reduce sovereign concentration risk and increase lending headroom. The EEA involves a simultaneous exchange of equivalent credit risk on defined reference portfolios of sovereign exposures, subject to each participating MDB retaining a minimum of 50 percent of the total exposure to each country that is part of the EEA. Under the EEA, the MDB that originates the sovereign loans and buys protection, continues to be the lender of record. An exposure exchange does not affect the application of the normal sovereign sanctions policies by the buyer of protection. The EEA has final maturities in 2030 with linear annual reduction of the notional amounts starting from 2025. As at 31 December 2015, the total notional amount of credit protection purchased or sold on the relevant underlying single reference entities is
USD 4.47 billion (UA 3.22 billion). The participating MDBs have paid no credit protection fee (i.e. guarantee premium), as the amount of exposure exchanged—purchased and sold—is notionally the same at inception.
The highlights of the Bank’s financial performance in 2015 include the following:
●● Net interest margin (NIM) decreased in 2015, largely due to a 10.71 percent decline in interest income on investments from UA 169.87 million in 2014 to UA 151.68 million in 2015. Interest expense increased by UA 11.16 million because of higher average outstanding borrowings in the year. Interest income from loans increased by 2.51 percent to UA 338.51 million. Net interest income decreased by 6.06 percent in the year, while the gross earning assets increased by 6.8 percent.
●● In 2015, income before distributions approved by the Board of Governors decreased by 38.6 percent to UA 93.16 million compared with UA 151.69 million in 2014, due primarily to an increase in impairment on loans from UA 18.02 million in 2014, to UA 65.43 million in 2015. The fair valuation of borrowings and derivatives, which is typically volatile, amounted to a loss of UA 49.52 million in 2015 compared to a loss of UA 29.83 million in 2014. Adjusted for the effects of the fair valuation of borrowings and derivatives, income before allocation and distributions amounted to UA 142.68 million for 2015 compared to UA 181.52 million in 2014.
●● Total Bank Group administrative expenses decreased by 13.11 percent to UA 323.3 million, primarily due to lower expenses related to the Bank’s return to its Headquarters. Total manpower costs (excluding actuarial valuation effects of benefit plans) decreased by UA 33.07 million (12.58 percent) from UA 262.94 million in 2014, to UA 229.87 million in 2015. The Bank’s share of the total Bank Group’s administrative expenses amounted to UA 122 million for 2015 compared with UA 123.16 million in the previous year. Administrative expenses are shared between the Bank, the ADF, and the NTF, based on a predetermined cost-sharing formula, driven primarily by the relative levels of certain operational volume indicators and relative balance sheet size.
●● The Bank continues to maintain a strong capital position. Despite the ongoing challenges in its operating environment, the Bank continues to generate sufficient levels of income
Chapter 6Annual Report 2015
105

to facilitate contributions on behalf of its shareholders to other development initiatives in Africa. The Bank’s reserves, plus accumulated loan loss provisions, stood at UA 3.35 billion at the end of 2015 compared to UA 3.19 billion at the end of 2014.
Distributions Approved by the Board of GovernorsIn 2015, the Board of Governors approved distributions of UA 124 million from 2014 income to various development initiatives in Africa. The beneficiaries of these distributions are listed under Note N to the financial statements. In accordance with the Bank’s accounting policies, such distributions are reported as expenses in the year that they are approved by the Board of Governors. The Boards of Directors have agreed to recommend to the Board of Governors, at its Annual Meetings in May 2016, distributions totaling UA 95 million from the 2015 income to various development initiatives in RMCs. If approved by the Board of Governors, such distributions, and any others
that the Board of Governors may approve during 2016, will be reported as expenses in the 2016 financial statements.
Control of Administrative ExpensesIn order to maximize the resources available for development financing and technical assistance activities in its member countries, the Bank has a continuing responsibility and commitment to ensure maximum efficiency in the management of its administrative and capital expenditures. Accordingly, the Bank continues to focus on a high level of budgetary discipline, effective cost controls and proactive cost-recovery programs. For 2016, the Bank Group’s administrative expenditure is budgeted at UA 358.49 million. Management will continue to explore and implement effective and transparent cost management strategies to ensure that cost outcomes are effectively tracked against the Bank’s long-term strategic objectives.
A summary of the primary financial statements of the Bank for the year ended 31 December 2015 is shown below.
African Development Bank Abridged balance sheet as at 31 December 2015(UA million)
2015 2014
ASSETSCash 1,214.61 406.71Demand obligations 3.80 3.80Securities purchased under resale agreements - 34.51Treasury investments 8,392.26 7,341.62Derivative assets 1,454.63 1,143.68Non-negotiable instruments on account of capital 0.27 0.74Accounts receivable 489.54 640.16Development financing activities including loans and equity participations 13,698.08 13,300.15Other assets 93.55 79.46TOTAL ASSETS 25,346.74 22,950.83 LIABILITIES & EQUITYAccounts payable 1,332.38 1,211.81Securities sold under agreements to repurchase - 429.32Derivative liabilities 1,084.99 853.74Borrowings 16,449.27 14,375.95Equity 6,480.10 6,080.01TOTAL LIABILITIES & EQUITY 25,346.74 22,950.83
Chapter 6 Managing Financial Performance in Turbulent Times
106

African Development Bank Abridged income statement for the year ended 31 December 2015(UA million)
2015 2014
OPERATIONAL INCOME & EXPENSESIncome from loans and investments 491.20 484.73 Borrowing expenses (215.43) (184.58)Impairment charge on loans and investments (65.43) (18.02)Translation gains/(losses) 14.61 (4.07)Other income 4.70 4.13 Net operational income 229.65 282.19
OTHER EXPENSES (136.49) (130.50)
Income before distributions approved by the Board of Governors 93.16 151.69
Distributions of income approved by the Board of Governors (124.00) (120.00)NET (LOSS)/INCOME FOR THE YEAR (30.84) 31.69
African Development Bank Abridged statement of comprehensive income for the year ended 31 December 2015(UA million)
2015 2014
Net (loss)/income for the year (30.84) 31.69 Other comprehensive income 136.77 (73.25)TOTAL COMPREHENSIVE INCOME FOR THE YEAR 105.93 (41.56)
African Development Bank Abridged statement of cash flows for the year ended 31 December 2015(UA million)
2015 2014
Net cash provided by operating activities 69.68 762.53 Net cash used in investing, lending, and development activities (746.99) (2,472.32)Net cash provided by financing activities 2,466.50 1,116.99 Effect of exchange-rate changes on cash and cash equivalents (35.99) (24.04)Net increase/(decrease) in cash and cash equivalents 1,753.20 (616.84)Cash and cash equivalents at the beginning of the year 650.68 1,267.52 CASH AND CASH EQUIVALENTS AT THE END OF THE YEAR 2,403.88 650.68
Chapter 6Annual Report 2015
107
general decrease in the operational expenses of the Bank Group and the lower expenses relating to the return of the Bank to its Headquarters in Abidjan, Côte d’Ivoire. As noted earlier, the Fund’s share of administrative expenses is based on a predetermined cost-sharing formula, which is driven by the relative levels of certain operational volume indicators and relative balance sheet size. The Fund’s share of these expenses was 63.14 percent for 2015, compared to 67.32 percent for 2014.
●● Investment income decreased from UA 76.35 million in 2014 to UA 60.97 million in 2015. Loan income increased from UA 80.66 million in 2014 to UA 90.32 million in 2015, driven primarily by a higher average outstanding loan balance in 2015.
According to the Fund’s non-accrual policy, service charges on loans made to, or guaranteed by borrowers, are excluded from loan income. This remains the case if principal installments or service charges on any such loans are in arrears for six months or more, until such time that payment is received. As a result of this policy, UA 2.05 million of non-accrued loan income was excluded from 2015 income compared to UA 2.06 million in 2014. The number of borrowers in non-accrual status at 31 December 2015 remained three, the same as at end-December 2014.
The Fund continued to cancel qualifying debts under MDRI as the relevant countries reached their Heavily Indebted Poor Countries (HIPC) completion points. A summary of the cumulative loan cancelations under MDRI and HIPC is presented in Note F to the Special Purpose Financial Statements of the Fund.
A summary of the primary financial statements of the ADF for the year ended 31 December 2015 is shown below.
THE AFRICAN DEVELOPMENT FUND
The following are the highlights of the Fund’s financial performance in 2015.
●● The Fund reported a reduced deficit of UA 83.25 million in 2015, compared with a deficit of UA 125.35 million in 2014. The losses over recent years are principally due to certain structural changes to the Fund, including the cancelation of loans to certain beneficiaries under the Multilateral Debt Relief Initiative (MDRI) (described in Note F to the financial statements), and the increased grant element in the recent ADF methodology for resource allocation to RMCs. Although the changes related to loan cancelations do not contribute towards reported income, they do not adversely affect the commitment capacity or the financial sustainability of the Fund because the expectation remains that the Fund will be compensated through additional donor subscriptions, payable over the life of the cancelled loans. In addition, the higher amount of Fund resources allocated to grants over the last three replenishment periods has meant a reduced allocation to income-earning loans. The grant surcharge introduced to compensate for the income loss is retained in capital and does not flow through the Fund’s income statement.
●● Prevailing low market interest rates continued to have the dual effect of lowering the Fund’s investment income and increasing the impact of the accelerated encashment of promissory notes deposited towards the payment of subscriptions to the Fund. The discount on the accelerated encashment of promissory notes amounted to UA 27.21 million in 2015 compared to UA 34.33 million in 2014.
●● The Fund’s share of administrative expenses of the ADB Group decreased by UA 47.64 million from UA 248.57 million in 2014 to UA 200.93 million in 2015 due to the
Chapter 6 Managing Financial Performance in Turbulent Times
108
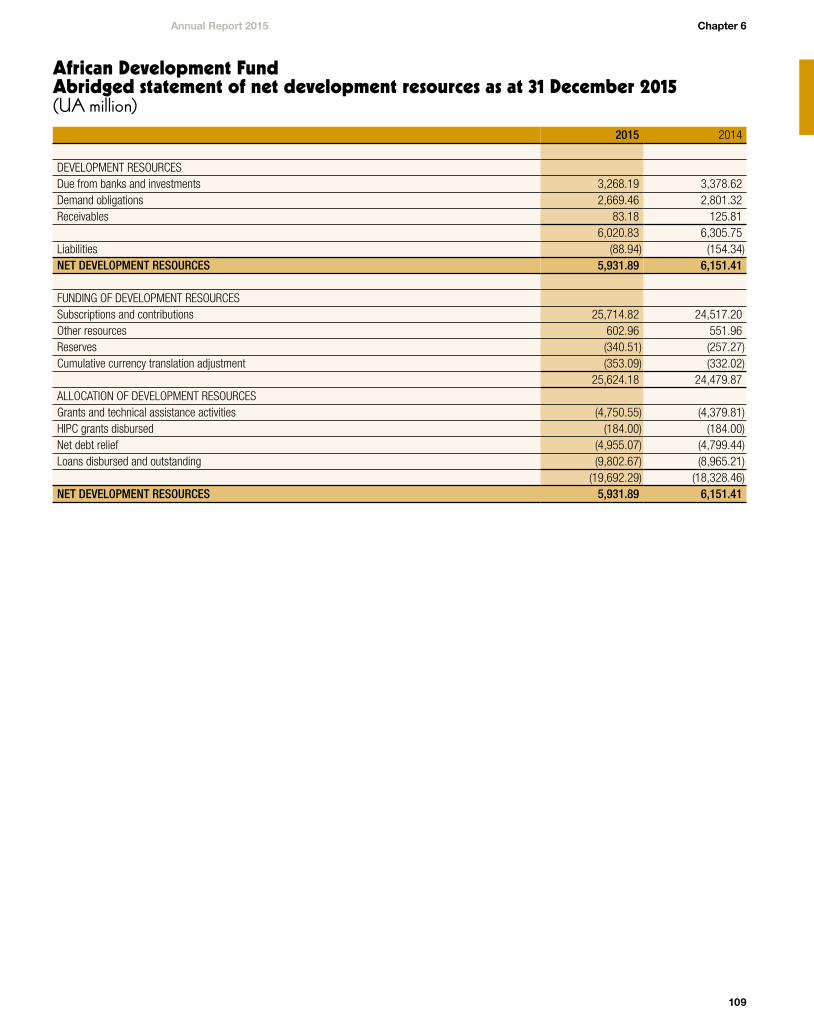
African Development Fund Abridged statement of net development resources as at 31 December 2015(UA million)
2015 2014
DEVELOPMENT RESOURCESDue from banks and investments 3,268.19 3,378.62 Demand obligations 2,669.46 2,801.32 Receivables 83.18 125.81
6,020.83 6,305.75 Liabilities (88.94) (154.34) NET DEVELOPMENT RESOURCES 5,931.89 6,151.41
FUNDING OF DEVELOPMENT RESOURCES Subscriptions and contributions 25,714.82 24,517.20 Other resources 602.96 551.96 Reserves (340.51) (257.27) Cumulative currency translation adjustment (353.09) (332.02)
25,624.18 24,479.87 ALLOCATION OF DEVELOPMENT RESOURCESGrants and technical assistance activities (4,750.55) (4,379.81) HIPC grants disbursed (184.00) (184.00) Net debt relief (4,955.07) (4,799.44) Loans disbursed and outstanding (9,802.67) (8,965.21)
(19,692.29) (18,328.46)NET DEVELOPMENT RESOURCES 5,931.89 6,151.41
Chapter 6Annual Report 2015
109
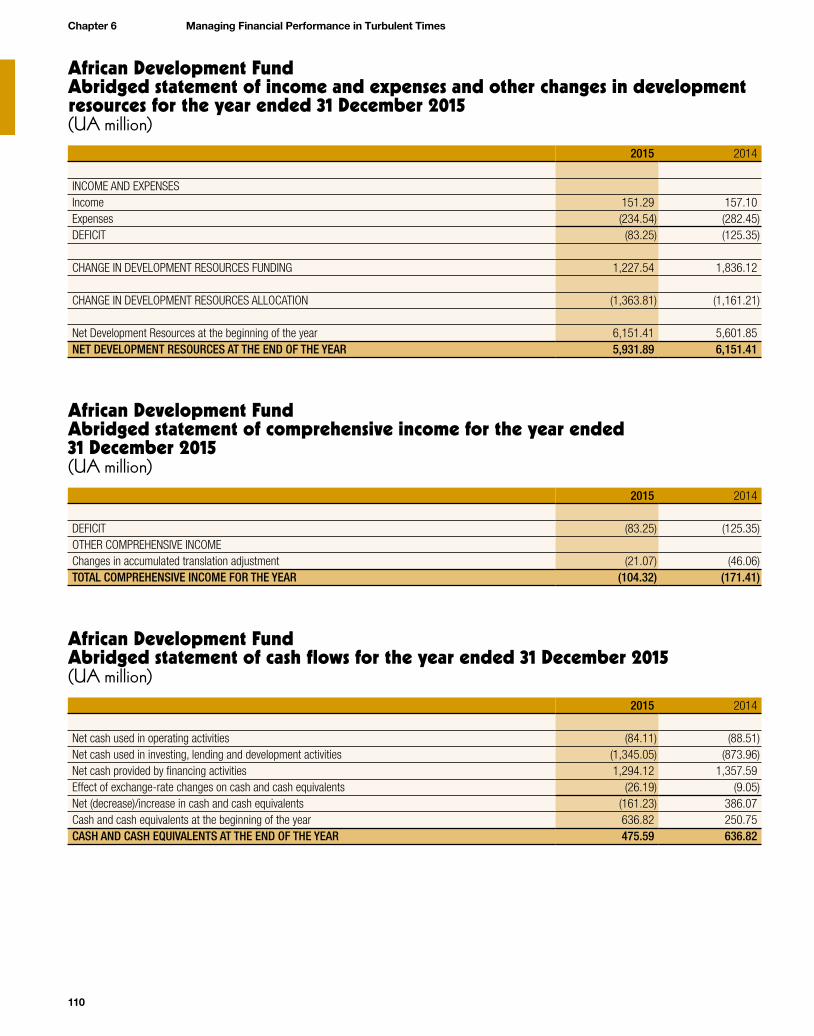
African Development Fund Abridged statement of income and expenses and other changes in development resources for the year ended 31 December 2015(UA million)
2015 2014
INCOME AND EXPENSESIncome 151.29 157.10 Expenses (234.54) (282.45) DEFICIT (83.25) (125.35)
CHANGE IN DEVELOPMENT RESOURCES FUNDING 1,227.54 1,836.12
CHANGE IN DEVELOPMENT RESOURCES ALLOCATION (1,363.81) (1,161.21)
Net Development Resources at the beginning of the year 6,151.41 5,601.85 NET DEVELOPMENT RESOURCES AT THE END OF THE YEAR 5,931.89 6,151.41
African Development Fund Abridged statement of comprehensive income for the year ended 31 December 2015(UA million)
2015 2014
DEFICIT (83.25) (125.35) OTHER COMPREHENSIVE INCOMEChanges in accumulated translation adjustment (21.07) (46.06) TOTAL COMPREHENSIVE INCOME FOR THE YEAR (104.32) (171.41)
African Development Fund Abridged statement of cash flows for the year ended 31 December 2015(UA million)
2015 2014
Net cash used in operating activities (84.11) (88.51)Net cash used in investing, lending and development activities (1,345.05) (873.96)Net cash provided by financing activities 1,294.12 1,357.59 Effect of exchange-rate changes on cash and cash equivalents (26.19) (9.05)Net (decrease)/increase in cash and cash equivalents (161.23) 386.07Cash and cash equivalents at the beginning of the year 636.82 250.75CASH AND CASH EQUIVALENTS AT THE END OF THE YEAR 475.59 636.82
Chapter 6 Managing Financial Performance in Turbulent Times
110
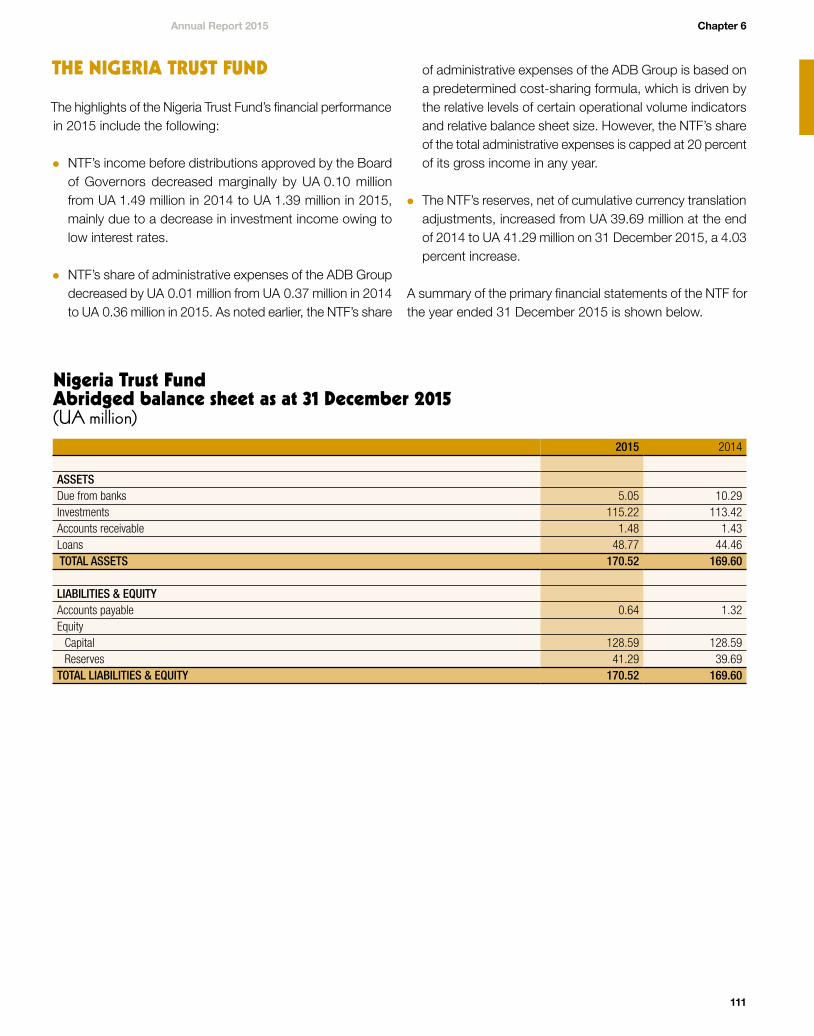
Nigeria Trust Fund Abridged balance sheet as at 31 December 2015(UA million)
2015 2014
ASSETSDue from banks 5.05 10.29Investments 115.22 113.42Accounts receivable 1.48 1.43Loans 48.77 44.46 TOTAL ASSETS 170.52 169.60 LIABILITIES & EQUITY Accounts payable 0.64 1.32Equity
Capital 128.59 128.59Reserves 41.29 39.69
TOTAL LIABILITIES & EQUITY 170.52 169.60
THE NIGERIA TRUST FUND
The highlights of the Nigeria Trust Fund’s financial performance in 2015 include the following:
●● NTF’s income before distributions approved by the Board of Governors decreased marginally by UA 0.10 million from UA 1.49 million in 2014 to UA 1.39 million in 2015, mainly due to a decrease in investment income owing to low interest rates.
●● NTF’s share of administrative expenses of the ADB Group decreased by UA 0.01 million from UA 0.37 million in 2014 to UA 0.36 million in 2015. As noted earlier, the NTF’s share
of administrative expenses of the ADB Group is based on a predetermined cost-sharing formula, which is driven by the relative levels of certain operational volume indicators and relative balance sheet size. However, the NTF’s share of the total administrative expenses is capped at 20 percent of its gross income in any year.
●● The NTF’s reserves, net of cumulative currency translation adjustments, increased from UA 39.69 million at the end of 2014 to UA 41.29 million on 31 December 2015, a 4.03 percent increase.
A summary of the primary financial statements of the NTF for the year ended 31 December 2015 is shown below.
Chapter 6Annual Report 2015
111
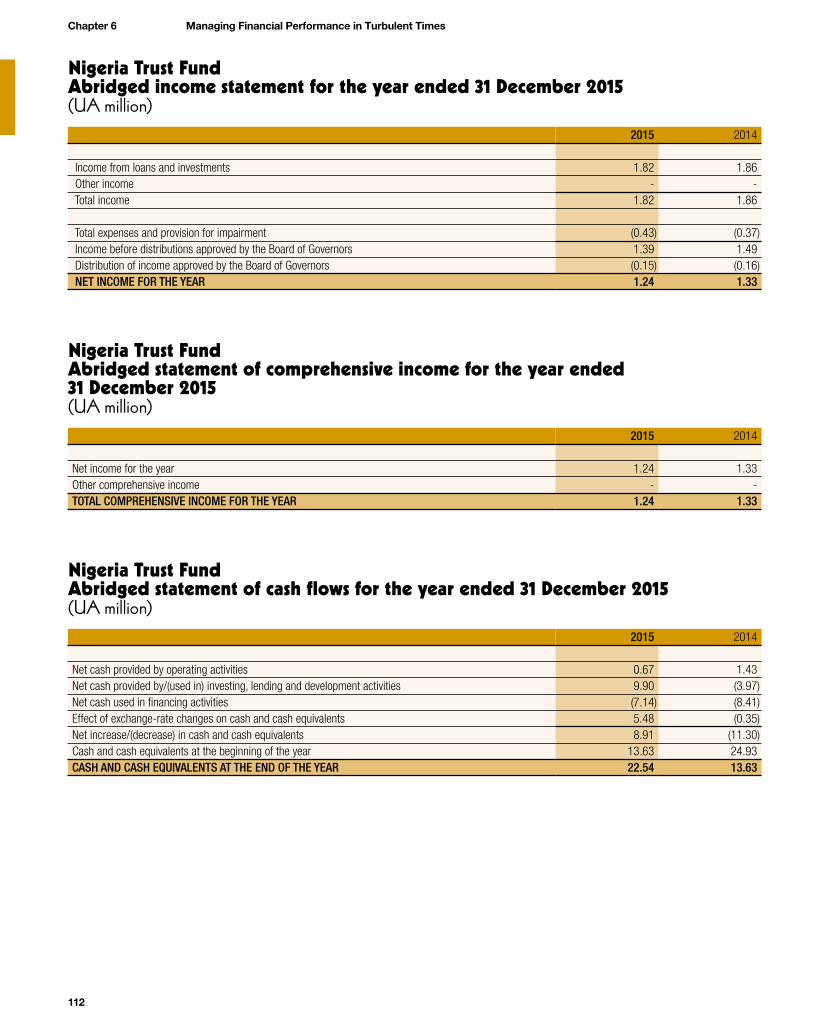
Nigeria Trust Fund Abridged income statement for the year ended 31 December 2015(UA million)
2015 2014
Income from loans and investments 1.82 1.86 Other income - - Total income 1.82 1.86
Total expenses and provision for impairment (0.43) (0.37) Income before distributions approved by the Board of Governors 1.39 1.49 Distribution of income approved by the Board of Governors (0.15) (0.16) NET INCOME FOR THE YEAR 1.24 1.33
Nigeria Trust Fund Abridged statement of comprehensive income for the year ended 31 December 2015(UA million)
2015 2014
Net income for the year 1.24 1.33Other comprehensive income - -TOTAL COMPREHENSIVE INCOME FOR THE YEAR 1.24 1.33
Nigeria Trust Fund Abridged statement of cash flows for the year ended 31 December 2015(UA million)
2015 2014
Net cash provided by operating activities 0.67 1.43 Net cash provided by/(used in) investing, lending and development activities 9.90 (3.97)Net cash used in financing activities (7.14) (8.41)Effect of exchange-rate changes on cash and cash equivalents 5.48 (0.35)Net increase/(decrease) in cash and cash equivalents 8.91 (11.30)Cash and cash equivalents at the beginning of the year 13.63 24.93 CASH AND CASH EQUIVALENTS AT THE END OF THE YEAR 22.54 13.63
Chapter 6 Managing Financial Performance in Turbulent Times
112
