education, occupational class and cognitive decline in...
TRANSCRIPT

Running head: COGNITIVE RESERVE AND COGNITIVE DECLINE 1
Education, occupational class and cognitive decline in
preclinical dementia
Dorina Cadar1, Andrea M. Piccinin
2, Scott M. Hofer
2, Boo Johansson
3 and Graciela
Muniz-Terrera1
1 MRC Unit for Lifelong Health and Ageing at University College London, UK
2 Department of Psychology, University of Victoria, Victoria, Canada
3 Department of Psychology, University of Gothenburg, Gothenburg, Sweden
*Requests for reprints should be addressed to Dr Dorina Cadar MRC Unit for Lifelong Health and
Ageing, London, 33 Bedford Place, LondonWC1B 5JU, UK, (e-mail: [email protected]).
Funding
This work was supported by the following funding agencies: Alzheimer’s Society [Grant number
144], the Medical Research Council [Unit Programme number MC_UU_12019/1], the US National
Institutes of Health National Institute of Aging [P01AG043362], the Swedish Research Council for
Health, Working Life and Welfare and by the National Institute on Aging of the National Institutes
of Health under award number P01AG043362 for the Integrative Analysis of Longitudinal Studies
of Aging (IALSA) research network. The content is solely the responsibility of the authors and
does not necessarily represent the official views of the National Institutes of Health or other funding
bodies mentioned above.

COGNITIVE RESERVE AND COGNITIVE DECLINE 2
Abstract
We investigated education and occupational influences, as markers of cognitive reserve, in relation
to cognitive performance and decline on multiple fluid and crystallized abilities in preclinical
dementia. From the total sample of 702 participants, from OCTO-Twin, Sweden, aged 80+ at
baseline in 1992-1993; only those who developed dementia during the study period (N=127) were
included in these analyses. Random effects models were used to examine the level of performance
at the time of dementia diagnosis and the rates of decline prior to diagnosis. Results demonstrated
that both fluid and crystallized abilities decline in preclinical stages and education and occupational
class have independent moderating roles on the cognitive performance at the time of diagnosis, but
not on the rates of decline.
Keywords: dementia, aging, preclinical, cognitive decline, fluid and crystallized abilities

COGNITIVE RESERVE AND COGNITIVE DECLINE 3
Introduction
Although most individuals are likely to experience decline in their cognitive abilities as they
age, greater cognitive impairment highlights the first signs of neuropathological damage and the
potential progression to neurodegenerative conditions such as dementia or Alzheimer’s disease.
Studies comparing the risk of developing late onset Alzheimer's disease in identical twins
compared with non-identical twins show a heritability of around 0.6, so the genetic component of
late onset Alzheimer's disease is around 60 per cent with the other 40 per cent coming from
environmental factors (Bergem, Engedal, & Kringlen, 1997). The concordance of Alzheimer’s
disease (AD) in monozygotic (MZ) twins is estimated to be 80%, suggesting high heritability
patterns. However, the genetic patterns seem to diverge as MZ twins become older, so the
significant heritability remains unexplained. In this context, environmental influences such as
education or lifestyle behaviors have been proposed to have a long term influence on genetic
alterations (Bjornsson, Fallin, & Feinberg, 2004; Sweatt, 2010).
A proposed explanation is that cognitive reserve may moderate the effects of neocortical and
limbic neuropathology (Stern, 2009). According to this hypothesis, complex mental activities
developed across the lifespan (through educational attainment, occupation or participation in leisure
activities), could allow compensatory cognitive mechanisms to be employed, when confronted with
underlying neurodegenerative dysfunction (Stern, 2002). Education and socioeconomic position are
often considered proxies for cognitive reserve since they are key markers for the environmental
experiences that have an effect on cognition (Albert, Jones, Savage, Berkman, Seeman, Blazer et
al., 1995), cognitive decline (Clouston, Kuh, Herd, Elliott, Richards, & Hofer, 2012; Hall, Derby,
LeValley, Katz, Verghese, & Lipton, 2007; Richards & Deary, 2005; Wilson, Li, Aggarwal, Barnes,
McCann, Gilley et al., 2004) and dementia incidence (Tervo, Kivipelto, Hanninen, Vanhanen,
Hallikainen, Mannermaa et al., 2004). Cognitive reserve theory has been supported by the results
of a systematic review, which emphasized that complex patterns of mental activity across life stages
are associated with a significant reduction in dementia incidence and less severe clinical or

COGNITIVE RESERVE AND COGNITIVE DECLINE 4
cognitive changes in the presence of age-related neurodegeneration (Valenzuela & Sachdev, 2006).
In addition, several prospective longitudinal studies have shown that a number of individuals with
no evidence of symptomatic cognitive impairment who meet clinicopathologic criteria for
Alzheimer’s disease can be identified (Mortimer, 1997).
Although, the existing evidence regarding a protection against faster cognitive decline in
healthy individuals is well documented, the evidence related to preclinical dementia remains
unclear. It is not inconceivable, that the difference in rate of neuropathological advancement
balances the difference in the association between cognitive ability and neuropathology, which
could lead to similar slopes in cognitive decline. According to the cognitive reserve hypothesis, a
person’s cognitive test score depends on both premorbid ability level and the amount of
neuropathology accumulated, which increases with age. However, after a certain inflection point or
accumulation stage, cognitive ability starts to decline and this decline could start later and proceed
more quickly for those with high cognitive reserve (Stern, 2012). This assumes that the rate of
neuropathology progression is constant regardless of level of cognitive reserve. When the rate of
neuropathological decline is slower in those with higher cognitive reserve, due to compensatory
mechanisms (Valenzuela & Sachdev, 2006), the effective rate could be slower with more cognitive
reserve. The discrepancy in findings could also be related to the methodology employed or to the
type of neuropsychological tests examined (Hofer & Piccinin, 2010; Piccinin, Muniz, Matthews, &
Johansson, 2011).
Regarding the latter, the aging process has a differential effect on cognitive functioning in
later life according to the different type of cognitive abilities (fluid or crystallized). In general, fluid
abilities such as processing speed, memory, visuospatial ability and attention are considered to be
age sensitive, while crystallized knowledge such as verbal abilities (to understand written and
spoken language), are less age sensitive and tend to remain stable into old age (Cattell, 1963;
Crawford, Deary, Starr, & Whalley, 2001; Horn & Cattell, 1967). Consequently, these mental
abilities tend to present different slopes of decline in relation to age (Anstey & Low, 2004). Several
COGNITIVE RESERVE AND COGNITIVE DECLINE 5
epidemiological studies showed that an accelerated decline was mostly observed with the fluid
cognitive abilities, and therefore a steeper decline in these functions was associated with an
increased risk of developing dementia (Fleisher, Sowell, Taylor, Gamst, Petersen, & Thal, 2007;
Petersen, 2004; Roberts, Karlawish, Uhlmann, Petersen, & Green, 2010). However, less is known
about the rate of decline between fluid and crystallized functions prior to dementia diagnosis, when
the process of neurodegeneration is considered to vary substantially from normal aging.
In this context, it is essential that population samples are well-defined and that cognitive
trajectories are investigated within samples of subpopulations (e.g., healthy individuals or dementia
cases). Process-based approaches to analyze longitudinal data represent unique opportunities to
evaluate theories of aging, such as by testing key predictions about the rates of cognitive decline in
the period prior to dementia diagnosis and how cognitive performance (one variable) changes in
relation to proximity to dementia (another variable) (Hofer & Piccinin, 2010; Sliwinski & Mogle,
2008). Modeling cognitive change in relation to the time prior to clinical diagnosis could provide a
more informative-descriptive and explanatory modeling process, compared to the age-based
models. It offers an improved indication of the rates of cognitive decline longitudinally, as there is
an important non-age-graded process driving the cognitive change in the years prior to dementia
diagnosis, reflecting the progression of the disease in older individuals.
The aim of this study was to evaluate the associations of different cognitive reserve
variables (e.g. education, occupational class) with fluid and crystallized abilities in the period prior
to dementia. With this purpose, we considered a process-based approach (Sliwinski & Mogle,
2008), in which we modeled the decline in all neuropsychological tests available in the
Octogenarian Twins Study (also known as the OCTO-Twin), using random effects mixed models,
where cognitive scores were aligned according to time to dementia diagnosis from study entry.
We hypothesized that both higher education (more years) and higher occupational levels
(intermediate or professional levels) may protect against the adverse effects of accumulating
neuropathology and could moderate the rate of cognitive decline measured in both fluid and

COGNITIVE RESERVE AND COGNITIVE DECLINE 6
crystallized abilities in the preclinical stages of dementia. We also hypothesized that those with
higher cognitive reserve will have better performance on both fluid and crystallized measures at the
time of diagnosis.
Method
Study population
Participants were drawn from the longitudinal Origins of Variance in the Old-Old:
Octogenarian Twins (OCTO-Twin Study), based on the oldest cohort of the Swedish Twin
Registry. The full sample includes 702 participants, with 351 complete twin pairs born in 1913 and
earlier, who became 80 years of age during the first wave of data collection (1991-1993).
Participants have been re-assessed every two years across the study period (1991-2001) on up to
five occasions. The average rate of attrition from one testing wave to the next was 20% (10% per
year), primarily due to death. Full details of the study population characteristics have been
published previously (McClearn, Johansson, Berg, Pedersen, Ahern, Petrill et al., 1997; Pedersen,
Lichtenstein, & Svedberg, 2002).
We analyzed data from the subsamples of individuals who developed dementia during the
course of the study and who were free of dementia at study entry. From the total sample of OCTO-
Twin Study, 225 individuals had dementia, representing 32% of the total sample. From these, 98
people had already been diagnosed with dementia at the study entry and were excluded from the
main analyses. The remaining127 participants who developed dementia during the study period
represent the subpopulation sample used for these analyses.
Procedure
Ethical approval was received from the Ethics committee at Karolinska Institute in
Stockholm and the Swedish Data Inspection Authority in Sweden. All participants signed informed
consent forms (Johansson & Zarit, 1995).
Dementia diagnosis was established by clinicians according to the revised third edition of
the Diagnostic and Statistical Manual of Mental Disorders (DSM-III). During the interviews across

COGNITIVE RESERVE AND COGNITIVE DECLINE 7
the study period, participants were asked for permission to review their medical records, ordered
from hospitals, outpatient clinics, district physicians and primary health care. A multi-disciplinary
team consisting of a physician and two neuropsychologists reviewed testing results and medical
records, including medicine use and self-reported information about diseases at each new wave (van
den Kommer, Bontempo, Comijs, Hofer, Dik, Piccinin et al., 2009).
Study variables
The OCTO-Twin Study encompasses a broad spectrum of cognitive and behavioral
measures, assessed at each of the five waves during the study period.
Neuropsychological Measurements consisted of multiple tests of fluid abilities and
crystallized abilities, as well as the Mini-Mental State Examination (MMSE) (Folstein, Folstein, &
McHugh, 1975). Fluid abilities including visuospatial ability inductive reasoning and memory were
measured by Block Design, Figure Logic, Swedish Clock, Digit-Symbol, Prose Recall, Memory
Recall, Memory Recognition and Memory Correspondence. Crystallized abilities such as
knowledge ability and verbal meaning were measured by Information and Synonym tests.
Participants were tested in their home by medical research nurses who were specially trained. A
summary of these cognitive tests is provided as online material.
Education was measured as the number of years the individual went to school.
Occupational class was measured during the home interview. The question asked was:
“What has been your main occupation for most of your working life (during the longest period)?”
and the responses were coded into low (manual occupations), medium (non-manual occupations)
and high (intermediate and professional occupations).
Data analyses and analytic approach
We evaluated the whole range of neuropsychological tests. Random effects mixed models
were fitted to each cognitive outcome as a function of time to dementia diagnosis, which was
calculated for each wave of data collection in relation to the time of dementia diagnosis, which was
set at zero to represent the intercept. Between-person differences in age and in time to dementia

COGNITIVE RESERVE AND COGNITIVE DECLINE 8
diagnosis were separated from within person changes by adjusting the level and rate of change by
age at study entry and by time to dementia diagnosis from study entry (Piccinin et al., 2011).
We examined education (years of formal education) and occupational class as markers of
cognitive reserve, and a number of common demographic covariates including sex, age at study
entry, and time to dementia diagnosis from study entry. Male and low occupational histories were
used as reference categories. Age and time to dementia diagnosis from study entry were mean
centred. Given this model specification, the intercept represents performance at the time of
dementia diagnosis for an individual with values of zero on all covariates (i.e., for an 83 years old
man of low occupational class and 7 years of education who entered the study 5 years before
dementia diagnosis) and the linear slopes represent annual rate of change (e.g., increase, decrease)
per year closer to the time of dementia diagnosis. All analyses were performed using Stata
software, Version 13 (StataCorp, 2013).
________________________________
Table 1 about here
________________________________
Results
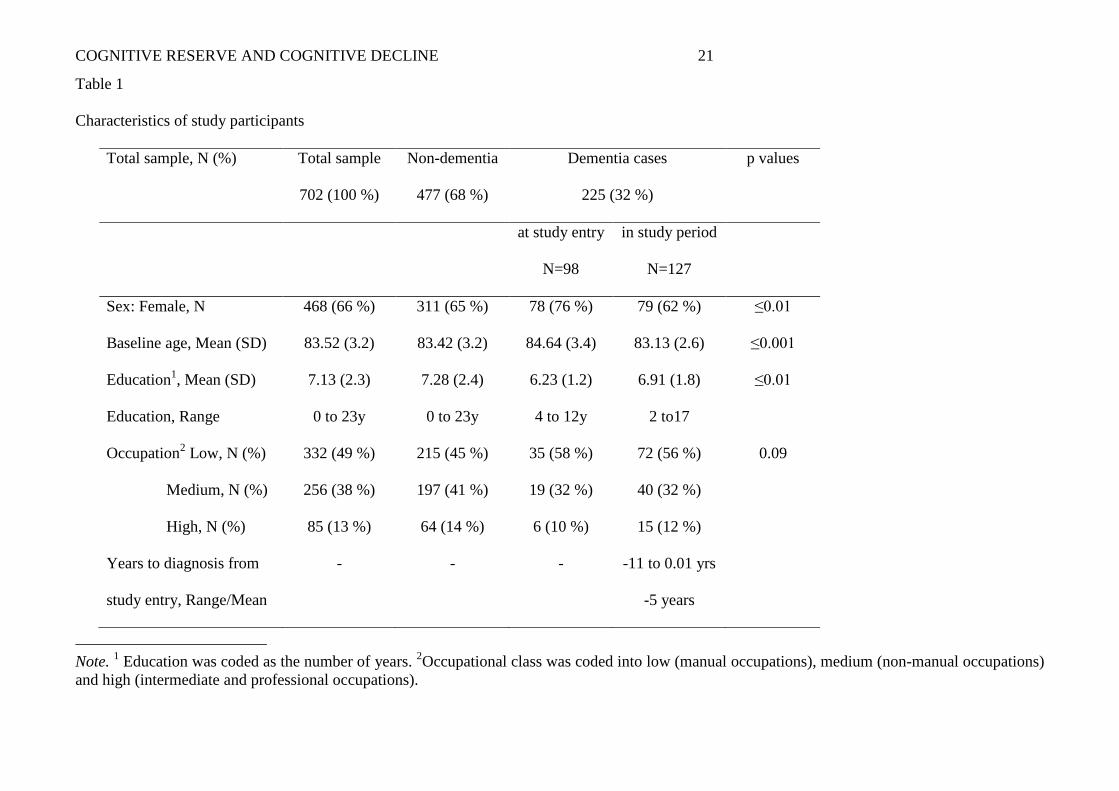
Table 1 provides a summary of participant characteristics. Information is provided for the
full sample as well as for the dementia-free, demented at study entry and incident case groups for
comparative purposes. Only 10% of those who had dementia at study entry and 12% of incident
cases during the study period had a higher occupational class. Occupation and dementia incidence
were found to be independent (X2
(2) = 8.01, p= 0.09). The relation between sex and dementia
incidence was significant (Chi-square with two degrees of freedom X2
(2) = 8.96, p ≤0.01) suggesting
that women were more likely to have already been diagnosed with dementia at baseline.
There were significant differences in years of education and baseline age by dementia status
(ANOVA, F(2,655) = 5.58, p = 0.003 and F(2,701) = 7.38, p ≤ 0.001 respectively). Post hoc
analyses using Tukey HSD pairwise comparisons for variable case studentized showed that the

COGNITIVE RESERVE AND COGNITIVE DECLINE 9
mean education was significantly lower in those with dementia at study entry (M = 6.23, SD = 1.22)
than in those who were free of dementia during the study period (M = 7.28, SD = 2.46), but not
significantly different from incident cases during the study period (M = 6.91, SD = 1.81). Baseline
age also differed significantly between groups.
Cognitive trajectories on fluid and crystallized abilities in preclinical dementia
Results from the multilevel analysis of the MMSE and fluid ability tests are displayed in
Table 2.
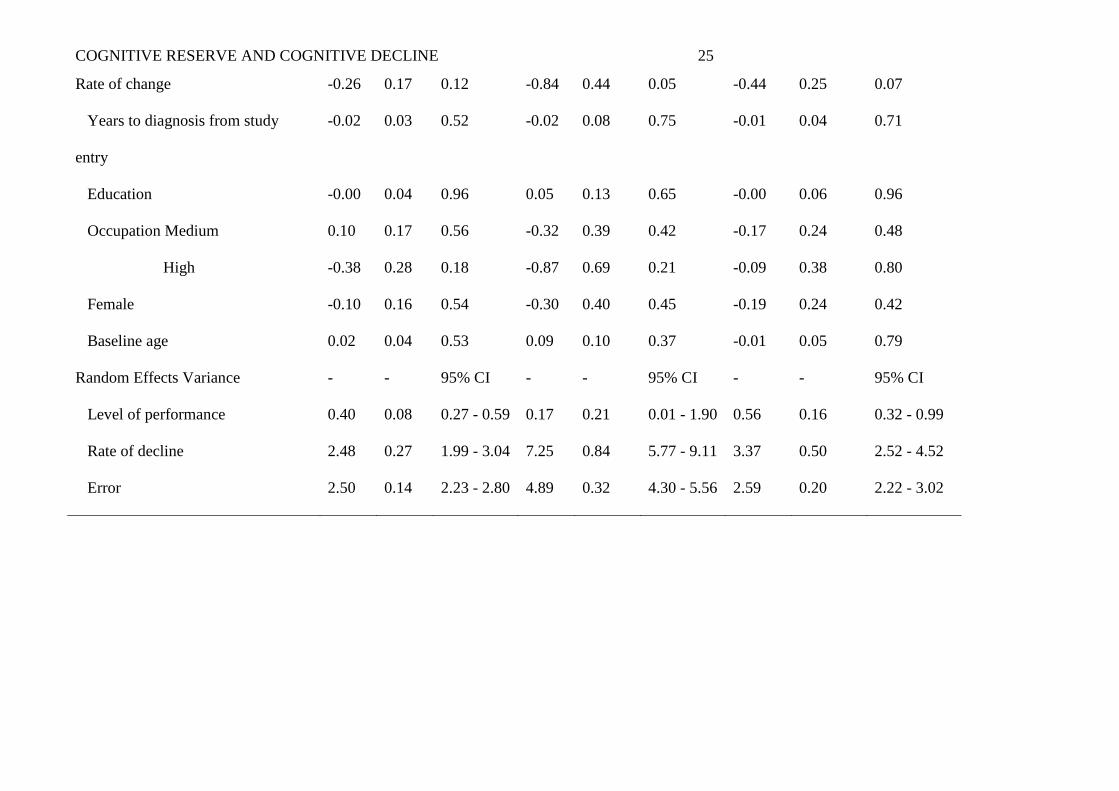
A significant rate of cognitive decline was observed in all tests, crystallized or fluid, except
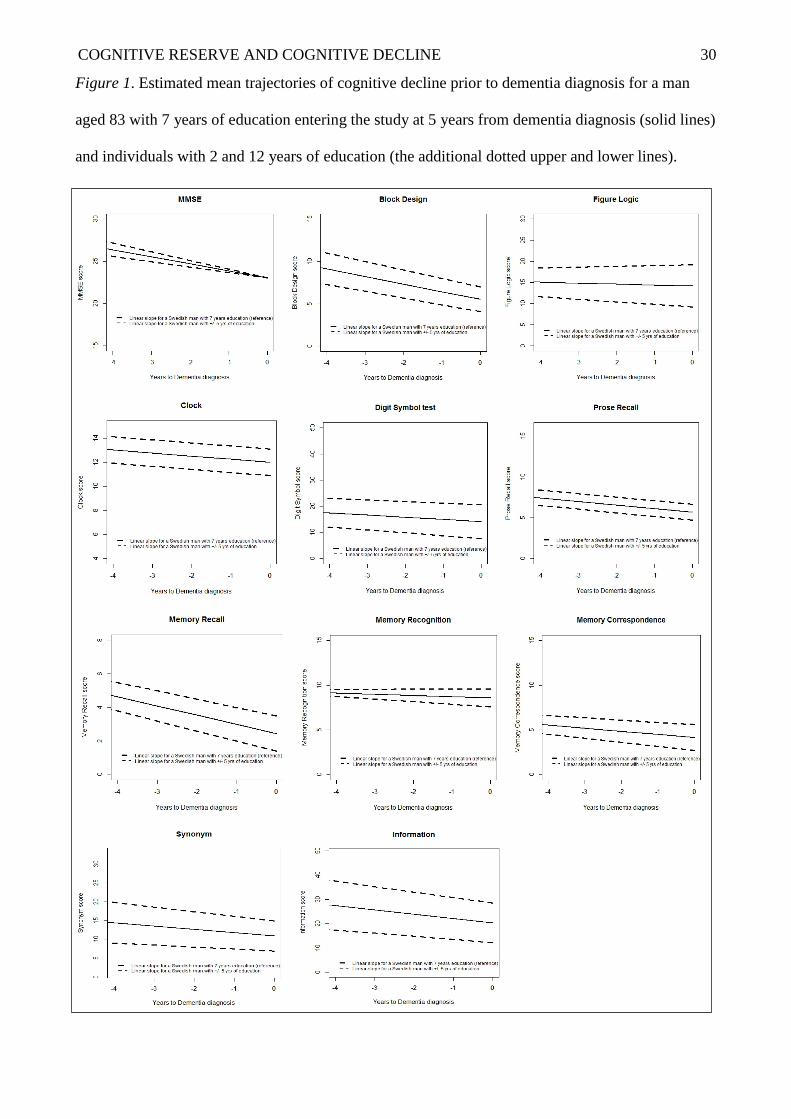
Clock test, Figure Logic, Prose Recall and MIR Recognition. Figure 1 illustrates the expected
trajectories of all neuropsychological tests investigated in these analyses from the time of study
entry until the time of dementia diagnosis with the additional upper and lower bands of 5 years
education.
_______________________________
Figure 1 about here
_______________________________
As illustrated in Figure 1 and listed in Table 2, mental status, measured with MMSE at the
time of dementia diagnosis for a male participant age 83, with 7 years of education (i.e., reference
values), enrolling in the study 5 years before dementia diagnosis was estimated at 23.04 (SE=0.90)
with annual rate of decline of -0.83 (SE=0.20) points.
The visuospatial ability and speed measured with Block Design and Digit Symbol at the
time of diagnosis were estimated at 5.53 (SE=1.29) and 14.13 (SE=2.05) correspondingly, while the
rates of decline were estimated at -0.89 (SE=0.25) and -0.84 (SE=0.44) points per year. A
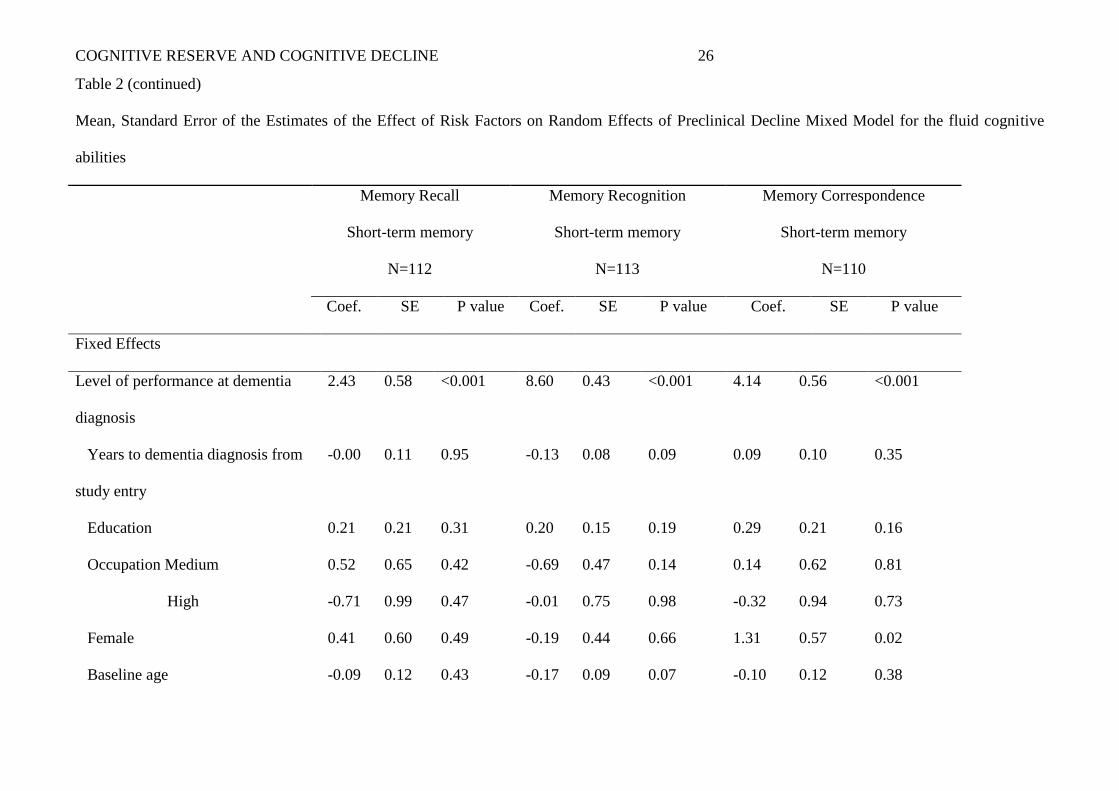
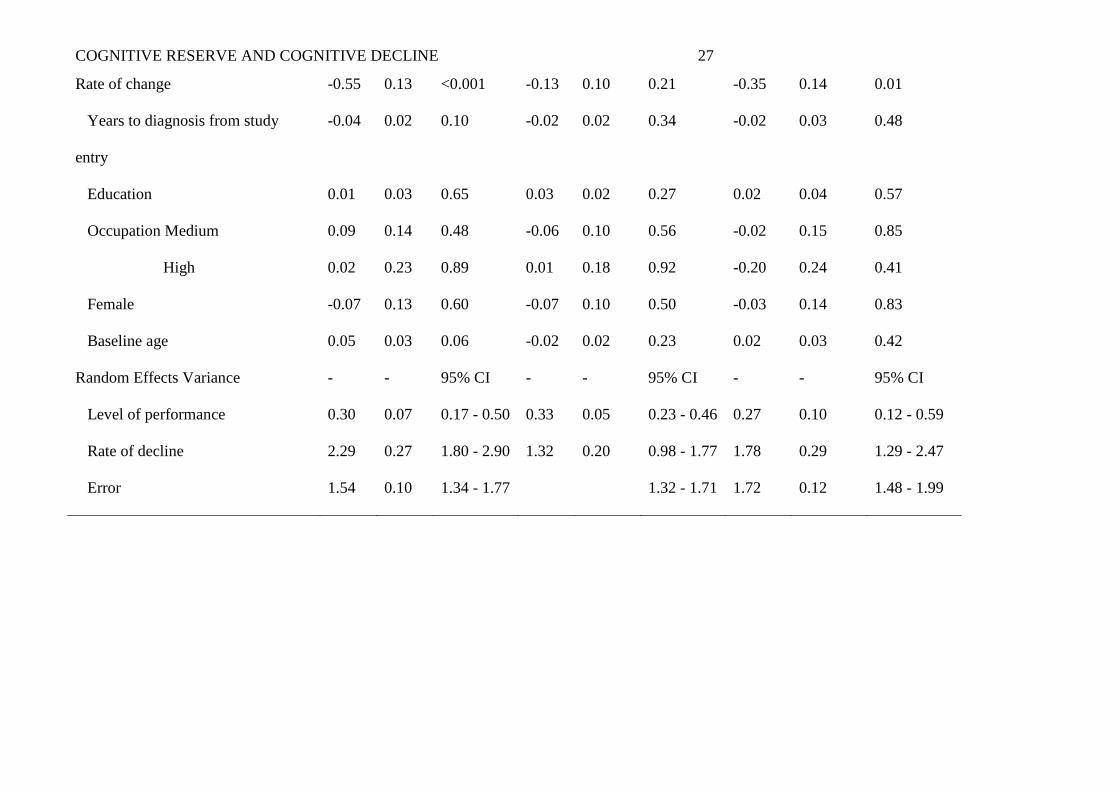
significant change was also observed in tests of memory recall and memory correspondence
(measured with the Memory in Reality Tests) with the corresponding linear slope estimates of -0.55
(SE=0.13) and -0.35 (SE=0.14) points per year, while the estimated mean intercepts were 2.43
(SE=0.58) and 4.14 (SE=0.56) respectively.

COGNITIVE RESERVE AND COGNITIVE DECLINE 10
_______________________________
Table 2 about here
_______________________________
Results from analysis of crystallized ability tests are displayed in Table 3. At dementia
diagnosis, performance on Synonym test was estimated at 10.88 (SE=0.90), while on the
Information test was estimated at 20.33 (SE=1.97). The corresponding rates of decline were
estimated at -0.87 (SE=0.26) and -1.78 (SE=0.31) points per year.
_______________________________
Table 3 about here
________________________________
Cognitive reserve: Education
Education was positively associated with performance at time of dementia diagnosis on both
crystallized measures (Synonym and Information Test, see Table 3). An increase in education from
the average of 7 years (per extra year), was associated with a better performance on the Synonyms
test with 0.80 (SE=0.35) and with 1.64 (SE=0.56) in the Information test.
In contrast, education did not have a significant association with the level of performance at
the time of dementia diagnosis or with rate of change for any of the fluid or crystallized cognitive
abilities examined, and this was not modified by excluding occupation from the existing models
(see Tables 2 and 3).
Cognitive reserve: Occupational class
At the time of dementia diagnosis, individuals with higher occupational class (medium and
high) had better performance on two measures of fluid abilities Figure Logic and Block Design
(high occupational class only) and on one crystallized measure Synonym tests (medium occupation
class only) compared to the estimated scores for individuals with lower occupational class,
independent of level of education. Regarding the rate of preclinical decline, individuals with a

COGNITIVE RESERVE AND COGNITIVE DECLINE 11
medium occupational class declined at a slower annual rate on only two measures: Block Design
and Synonym tests, compared to those with a lower occupational class.
Other covariates
Distance from baseline to the time of dementia diagnosis was associated only with rate of
change on the Information test, with individuals declining at a faster rate with -0.22 (SE=0.06)
points per year closer to the time of diagnosis.
Women performed better than men at the time of dementia diagnosis, on memory
correspondence 1.31 (SE=0.57), but worse on the Information test -6.30 (SE=2.10), and did not
change at a different rate compared to men with similar age, education and occupational levels.
Lastly, age at study entry was associated with performance at the time of dementia diagnosis
for both MMSE and Block Design tests. Older age at study entry (per extra year increase from the
age of 83 years) was associated with a lower performance on both MMSE and Block Design and a
slightly faster decline in the Block Design test with -0.15 (SE=0.06) points per year closer to
dementia diagnosis.
Discussion
In this study, we examined the association between different markers of cognitive reserve,
such as education and occupational class with preclinical cognitive decline in multiple tests of fluid
and crystallized abilities, using a process-based approach where cognitive scores were modeled as a
function of time to dementia diagnosis.
Firstly, we found no support for our hypothesis postulating that there will be a distinction
between the rates of decline with fluid and crystallized cognitive abilities prior to the time of
diagnosis, as seen in previous findings with normal aging (Horn & Cattell, 1967). A significant rate
of decline was observed for the MMSE and for both fluid and crystallized measures (Block Design,
Digit Symbol, Memory Recall and Correspondence, Synonym and Information tests), even though
the rates of decline varied by cognitive domain tapped by the various neuropsychological tests
investigated.

COGNITIVE RESERVE AND COGNITIVE DECLINE 12
Secondly, our results consistently identified associations of education and performance
among the crystallized abilities at the time of dementia diagnosis. However, education was not
found to be associated with performance on fluid abilities at the time of dementia diagnosis nor with
the rate of decline in either fluid or crystallized measures as we had originally hypothesized.
Thirdly, we found that occupational class did not mirror the effect of education in these
analyses, suggesting a slightly more independent pattern from education itself. Interestingly, our
results showed that higher levels of occupation (medium or high) were associated with better
performance at the time of dementia diagnosis and with slower decline on both measures of fluid
and crystallized abilities (e.g., Block Design and Synonym test). This could reflect the fact that
there are separate effects for higher education and occupational attainment within the cognitive
reserve hypothesis framework. According to cognitive reserve, the neuroprotective effect is
assumed to reflect increased neural networks and hemispheric activation, in those with a higher
number of years of education or higher occupation class, which tend to mask the dementia
pathology leading perhaps to a slower rate of decline on both fluid and crystallized functions.
Despite the fact that the majority of studies investigating the brain-reserve hypothesis have used
education as a single measure, there is no overall consensus on how to measure cognitive reserve,
and this remains a matter of ongoing debate. Only a limited number of studies have estimated
cognitive reserve from multiple autobiographical data such as occupational complexity and
frequency of mentally stimulating lifestyle pursuits along with education (Mortimer, 1997). As a
consequence, cognitive reserve advantage cannot be conveyed to education alone, as this could
continue to be affected by other circumstances such as socioeconomic circumstances unfolding
across the lifespan. This highlights a number of methodological issues related to the components
measured, when interpreting the role of cognitive reserve across different studies (Batterham,
Mackinnon, & Christensen, 2011; Carnero & Del, 2007).
Furthermore, understanding the individual differences in cognitive decline prior to dementia
diagnosis requires longer follow-up investigations, to be able to distinguish the severe

COGNITIVE RESERVE AND COGNITIVE DECLINE 13
neuropathological from the normal age-associated changes, which seem to be accelerated at least in
some cases in later life (Hall et al., 2007; Schaie, Caskie, Revell, Willis, Kaszniak, & Teri, 2005).
In addition, it is essential to understand which cognitive abilities start to deteriorate faster with
normal aging and which show further sensitivity in preclinical dementia. From a neurobiological
perspective, cognitive decline is thought to reflect the accumulation of degeneration lesions, which
could predict a faster process of mental deterioration associated with normal aging or
neurodegeneration (Stern, Albert, Tang, & Tsai, 1999; Wilson, Beck, Bienias, & Bennett, 2007).
However, only detailed longitudinal neuroimaging data could clarify the nature of
neuropathological changes, when only relatively small impairments are detected in
neuropsychological testing, particularly in individuals with high cognitive reserve that could have
the potential to maintain peak cognitive functioning levels for an extended period of time, when
confronted with brain neuropathology (Stern, 2012).
Strengths and limitations
In summary, the current findings provide rich and unique information regarding the rates of
cognitive decline prior to dementia diagnosis and how we can detect evidence of variance across a
wide range of cognitive abilities (both fluid and crystallized) within a sensitive time period in an
oldest-old population sample. The independent investigations of different markers of cognitive
reserve (education and occupational class) on specific measures of cognitive abilities and their
decline prior to dementia diagnosis have made salient contributions to the field of cognitive aging
and dementia research.
A strength of this paper is the adoption of a process based approach to model cognitive
decline documented as the optimal representation of intraindividual psychological change in
individuals experiencing a common process that drives their cognitive changes, compared to the
age-based models (Hall, Lipton, Sliwinski, & Stewart, 2000; Sliwinski, Hofer, & Hall, 2003).
Using chronological age as the time metric in modeling cognitive change in older individuals at risk
of dementia tends to obscure the true intra-individual trajectories and to produce misleading results,

COGNITIVE RESERVE AND COGNITIVE DECLINE 14
since participants of the same age are unlikely to be at the same stage in their disease progression.
This improved methodology tends to overcome the large heterogeneity seen in observational
studies, where cognition is modeled as a function of age (Sliwinski et al., 2003).
We are also aware of a number of limitations. The sample size available for these
independent investigations was relatively small. However, the methodology employed
compensated for the missing data aspect, since random effects mixed models handle naturally
uneven spacing of repeated measurements, whether intentional or unintentional. The power to
detect variance and covariance in rates of change was calculated for this study elsewhere and was
favorable for the sample size used here (Rast & Hofer, 2014).
Cognitive reserve was evaluated in this study with measures of education and occupational
class. However, these two measures alone may not be sufficient to fully capture an individual’s
cognitive reserve accumulated across the life course. Furthermore, the results need to be considered
within the historical context. This is a population sample born in 1913 and earlier in Sweden,
where the attendance in school was compulsory only for children between 7–13 years of age, until
1960 (Erikson & Jonsson, 1996). Therefore it can be considered a limitation of this study that the
current sample had rather a reduced number of years of education and not a great variability.
Lastly, we were not able to evaluate the cognitive changes within the monozygotic twins, since the
initial low number of cases at the study entry and the various rates of drop out within pairs. This
eliminated the possibility of examining the genetic effects and the genetic environment interaction
within this population across the entire study period. However, a previous investigation comparing
the OCTO-Twin Study with a population based sample of non-twins from the OCTO-Twin Study
has indicated that the older surviving twins were similar to a representative sample of non-twins,
based on health status, cognitive and behavioral functions (Simmons, Johansson, Zarit, Ljungquist,
Plomin, & McClearn, 1997), strengthening the case of generalizability of twin studies.
COGNITIVE RESERVE AND COGNITIVE DECLINE 15
Conclusions
We presented results from a longitudinal study with repeated measures of a wide range of
fluid and crystallized abilities in the preclinical stages of dementia in which we investigated the role
of different markers of cognitive reserve. We found that both fluid and crystallized cognitive
abilities tend to decline in the period prior to dementia diagnosis. Importantly, education was
positively associated with the level of performance on the crystallized measures even at the time of
dementia diagnosis, but did not protect against faster rates of preclinical decline. However,
occupational class did have a moderating role on the rate of decline in two of the fluid abilities
measured. Thus, whereas both abilities decline during the preclinical phase, different markers of
cognitive reserve have different moderating effects on the level of performance or on the rates of
decline prior to dementia diagnosis. Longer follow-up periods and closer intervals between
measurements are needed for more detailed characterizations of the transition from normal
cognitive aging to the time at which there is evidence for a clinical dementia diagnosis.
COGNITIVE RESERVE AND COGNITIVE DECLINE 16
References
Albert, M. S., Jones, K., Savage, C. R., Berkman, L., Seeman, T., Blazer, D. et al. (1995).
Predictors of cognitive change in older persons: MacArthur studies of successful aging.
Psychol.Aging, 10, 578-589.
Anstey, K. J. & Low, L. F. (2004). Normal cognitive changes in aging. Aust.Fam.Physician,
33, 783-787.
Batterham, P. J., Mackinnon, A. J., & Christensen, H. (2011). The effect of education on the
onset and rate of terminal decline. Psychol.Aging, 26, 339-350.
Bergem, A. L., Engedal, K., & Kringlen, E. (1997). The role of heredity in late-onset
Alzheimer disease and vascular dementia. A twin study. Arch.Gen Psychiatry, 54, 264-270.
Bjornsson, H. T., Fallin, M. D., & Feinberg, A. P. (2004). An integrated epigenetic and
genetic approach to common human disease. Trends Genet., 20, 350-358.
Carnero, P. C. & Del, S. T. (2007). Education provides cognitive reserve in cognitive
deterioration and dementia. Neurologia, 22, 78-85.
Cattell, R. B. (1963). Theory of fluid and crystallized intelligence: A critical experiment.
Journal of Educational Psychology, 54, 1-22.
Clouston, S. A., Kuh, D., Herd, P., Elliott, J., Richards, M., & Hofer, S. M. (2012). Benefits
of educational attainment on adult fluid cognition: international evidence from three birth cohorts.
Int.J Epidemiol., 41, 1729-1736.
Crawford, J. R., Deary, I. J., Starr, J., & Whalley, L. J. (2001). The NART as an index of
prior intellectual functioning: a retrospective validity study covering a 66-year interval.
Psychol.Med., 31, 451-458.
Dureman, I. & Salde, H. (1959). Psychometric and experimental methods for clinical use.
Uppsala: Almqvist & Wiskell.

COGNITIVE RESERVE AND COGNITIVE DECLINE 17
Erikson, R. & Jonsson, J. O. (1996). The Swedish context: educational reform and long term
change in educational inequality. In Can Education Be Equalized? The Swedish Case in
Comparative Perspective ( Boulder: Westview Press).
Fleisher, A. S., Sowell, B. B., Taylor, C., Gamst, A. C., Petersen, R. C., & Thal, L. J.
(2007). Clinical predictors of progression to Alzheimer disease in amnestic mild cognitive
impairment. Neurology, 68, 1588-1595.
Folstein, M. F., Folstein, S. E., & McHugh, P. R. (1975). "Mini-mental state". A practical
method for grading the cognitive state of patients for the clinician. J Psychiatr.Res., 12, 189-198.
Hall, C. B., Derby, C., LeValley, A., Katz, M. J., Verghese, J., & Lipton, R. B. (2007).
Education delays accelerated decline on a memory test in persons who develop dementia.
Neurology, 69, 1657-1664.
Hall, C. B., Lipton, R. B., Sliwinski, M., & Stewart, W. F. (2000). A change point model for
estimating the onset of cognitive decline in preclinical Alzheimer's disease. Stat.Med, 19, 1555-
1566.
Hofer, S. M. & Piccinin, A. M. (2010). Toward an integrative science of life-span
development and aging. J.Gerontol.B Psychol.Sci.Soc.Sci., 65B, 269-278.
Horn, J. L. & Cattell, R. B. (1967). Age differences in fluid and crystallized intelligence.
Acta Psychologica, 26, 107-129.
Johansson, B., Allen-Burge, R., & Zarit, S. H. (1997). Self-reports on memory functioning
in a longitudinal study of the oldest old: relation to current, prospective, and retrospective
performance. J.Gerontol.B Psychol.Sci.Soc.Sci., 52, 139-146.
Johansson, B. & Zarit, S. H. (1991). Dementia and cognitive impairment in the oldest old: a
comparison of two rating methods. Int.Psychogeriatr., 3, 29-38.
Johansson, B. & Zarit, S. H. (1995). Prevalence and incidence of dementia in the oldest old:
A longitudinal study of a population-based sample of 84-90-year-olds in sweden. International
Journal of Geriatric Psychiatry, 10, 359-366.

COGNITIVE RESERVE AND COGNITIVE DECLINE 18
Johansson, B., Zarit, S. H., & Berg, S. (1992). Changes in cognitive functioning of the
oldest old. Journal of Gerontology: Psychological Sciences, 75-80.
Jonsson, C. & Molander, L. (1964). Manual till CVB-skalan Psykologi Forlaget (Manual of
the CVB-Scales). Stockholm, Sweeden: Psykologi Forlaget.
McClearn, G. E., Johansson, B., Berg, S., Pedersen, N. L., Ahern, F., Petrill, S. A. et al.
(1997). Substantial genetic influence on cognitive abilities in twins 80 or more years old. Science,
276, 1560-1563.
Mortimer, J. A. (1997). Brain reserve and the clinical expression of Alzheimer's disease.
Geriatrics, 52 Suppl 2, S50-S53.
Pedersen, N. L., Lichtenstein, P., & Svedberg, P. (2002). The Swedish Twin Registry in the
third millennium. Twin.Res., 5, 427-432.
Petersen, R. C. (2004). Mild cognitive impairment as a diagnostic entity. Journal of Internal
Medicine, 256, 183-194.
Piccinin, A. M., Muniz, G., Matthews, F. E., & Johansson, B. (2011). Terminal decline from
within- and between-person perspectives, accounting for incident dementia. J.Gerontol.B
Psychol.Sci.Soc.Sci., 66, 391-401.
Rast, P. & Hofer, S. M. (2014). Longitudinal design considerations to optimize power to
detect variances and covariances among rates of change: simulation results based on actual
longitudinal studies. Psychol.Methods, 19, 133-154.
Richards, M. & Deary, I. J. (2005). A life course approach to cognitive reserve: A model for
cognitive aging and development? Annals of Neurology, 58, 617-622.
Roberts, J. S., Karlawish, J. H., Uhlmann, W. R., Petersen, R. C., & Green, R. C. (2010).
Mild cognitive impairment in clinical care: a survey of American Academy of Neurology members.
Neurology, 75, 425-431.
COGNITIVE RESERVE AND COGNITIVE DECLINE 19
Schaie, K. W., Caskie, G. I. L., Revell, A. U., Willis, S. L., Kaszniak, A. W., & Teri, L.
(2005). Extending neuropsychological assessments into the primary mental ability space. Aging
Neuropsychology and Cognition, 12, 245-277.
Simmons, S. F., Johansson, B., Zarit, S. H., Ljungquist, B., Plomin, R., & McClearn, G. E.
(1997). Selection bias in samples of older twins? A comparison between octogenarian twins and
singletons in Sweden. J Aging Health, 9, 553-567.
Sliwinski, M. J., Hofer, S. M., & Hall, C. (2003). Correlated and coupled cognitive change
in older adults with and without preclinical dementia. Psychol.Aging, 18, 672-683.
Sliwinski, M. J. & Mogle, J. (2008). Time-based and process-based approaches to analysis
of longitudinal data. In S.M.Hofer & D. F. Alwin (Eds.), Handbook on cognitve aging:
Interdisciplinary perspectives (pp. 477-491). Thousand Oaks: CA:Sage Publications.
Stern, Y. (2002). What is cognitive reserve? Theory and research application of the reserve
concept. J Int Neuropsychol.Soc., 8, 448-460.
Stern, Y. (2009). Cognitive reserve. Neuropsychologia, 47, 2015-2028.
Stern, Y. (2012). Cognitive reserve in ageing and Alzheimer's disease. Lancet Neurol., 11,
1006-1012.
Stern, Y., Albert, S., Tang, M. X., & Tsai, W. Y. (1999). Rate of memory decline in AD is
related to education and occupation: cognitive reserve? Neurology, 53, 1942-1947.
Sweatt, J. D. (2010). Neuroscience. Epigenetics and cognitive aging. Science, 328, 701-702.
Tervo, S., Kivipelto, M., Hanninen, T., Vanhanen, M., Hallikainen, M., Mannermaa, A. et
al. (2004). Incidence and risk factors for mild cognitive impairment: a population-based three-year
follow-up study of cognitively healthy elderly subjects. Dement.Geriatr.Cogn Disord., 17, 196-203.
Valenzuela, M. J. & Sachdev, P. (2006). Brain reserve and dementia: a systematic review.
Psychol.Med., 36, 441-454.
van den Kommer, T. N., Bontempo, D. E., Comijs, H. C., Hofer, S. M., Dik, M. G.,
Piccinin, A. M. et al. (2009). Classification models for early identification of persons at risk for

COGNITIVE RESERVE AND COGNITIVE DECLINE 20
dementia in primary care: an evaluation in a sample aged 80 years and older. Dement.Geriatr.Cogn
Disord., 28, 567.
Wechsler, S. (1981). WMS-R Wechsler adult intelligence scale-revised . San Antonio: The
Psychological Corporation.
Wilson, R. S., Beck, T. L., Bienias, J. L., & Bennett, D. A. (2007). Terminal cognitive
decline: accelerated loss of cognition in the last years of life. Psychosom.Med., 69, 131-137.
Wilson, R. S., Li, Y., Aggarwal, N. T., Barnes, L. L., McCann, J. J., Gilley, D. W. et al.
(2004). Education and the course of cognitive decline in Alzheimer disease. Neurology, 63, 1198-
1202.
COGNITIVE RESERVE AND COGNITIVE DECLINE 21
Table 1
Characteristics of study participants
Total sample, N (%) Total sample
702 (100 %)
Non-dementia
477 (68 %)
Dementia cases
225 (32 %)
p values
at study entry
N=98
in study period
N=127
Sex: Female, N 468 (66 %) 311 (65 %) 78 (76 %) 79 (62 %) ≤0.01
Baseline age, Mean (SD) 83.52 (3.2) 83.42 (3.2) 84.64 (3.4) 83.13 (2.6) ≤0.001
Education1, Mean (SD)
Education, Range
Occupation2 Low, N (%)
Medium, N (%)
High, N (%)
Years to diagnosis from
study entry, Range/Mean
7.13 (2.3)
0 to 23y
332 (49 %)
256 (38 %)
85 (13 %)
-
7.28 (2.4)
0 to 23y
215 (45 %)
197 (41 %)
64 (14 %)
-
6.23 (1.2)
4 to 12y
35 (58 %)
19 (32 %)
6 (10 %)
-
6.91 (1.8)
2 to17
72 (56 %)
40 (32 %)
15 (12 %)
-11 to 0.01 yrs
-5 years
≤0.01
0.09
Note. 1 Education was coded as the number of years.
2Occupational class was coded into low (manual occupations), medium (non-manual occupations)
and high (intermediate and professional occupations).

COGNITIVE RESERVE AND COGNITIVE DECLINE 22
Table 2
Mean, Standard Error of the Estimates of the Effect of Risk Factors on Random Effects of Preclinical Decline Mixed Model for the fluid cognitive
abilities
MMSE Block Design Figure Logic
Mental Status
N=126
Visuo-spatial ability
N=109
Inductive reasoning
N=91
Coef. SE P value Coef. SE P value Coef. SE P value
Fixed Effects
Level of performance at dementia
diagnosis
23.04 0.90 <0.001 5.53 1.29 <0.001 14.14 0.99 <0.001
Years to dementia diagnosis from
study entry
0.00 0.17 0.99 -0.36 0.24 0.13 -0.21 0.19 0.26
Education -0.00 0.25 0.99 -0.29 0.39 0.46 -0.50 0.34 0.14
Occupation Medium 0.46 1.01 0.64 5.66 1.42 <0.001 1.68 1.09 0.12
High -1.41 1.48 0.34 3.76 2.21 0.08 3.96 2.04 0.05
Female -0.47 0.95 0.61 -1.58 1.34 0.24 -0.32 1.05 0.75
Baseline age -0.40 0.19 0.03 -0.59 0.27 0.03 0.06 0.24 0.80

COGNITIVE RESERVE AND COGNITIVE DECLINE 23
Rate of change -0.83 0.20 <0.001 -0.89 0.25 <0.001 -0.23 0.25 0.35
Years to diagnosis from study
entry
-0.04 0.03 0.26 -0.03 0.05 0.57 0.01 0.05 0.85
Education -0.04 0.04 0.35 0.02 0.07 0.75 -0.04 0.09 0.65
Occupation Medium -0.06 0.20 0.76 0.55 0.24 0.02 0.29 0.25 0.24
High -0.32 0.32 0.31 0.51 0.47 0.27 0.13 0.48 0.77
Female -0.03 0.04 0.44 -0.16 0.24 0.49 0.14 0.24 0.55
Baseline age -0.03 0.04 0.44 -0.15 0.06 0.01 0.03 0.07 0.63
Random Effects Variance - - 95% CI - - 95% CI - - 95% CI
Level of performance 0.56 0.09 0.40 - 0.79 0.04 0.02 0.24 - 0.52 0.31 0.12 0.15 - 0.68
Rate of decline 3.84 0.40 3.12 - 4.72 5.15 0.43 4.37 - 6.07 2.73 0.40 2.04 - 3.63
Error 2.82 0.15 2.54 - 3.13 3.20 0.19 2.84 - 3.61 3.20 0.22 2.79 - 3.67

COGNITIVE RESERVE AND COGNITIVE DECLINE 24
Table 2 (continued)
Mean, Standard Error of the Estimates of the Effect of Risk Factors on Random Effects of Preclinical Decline Mixed Model for the fluid cognitive
abilities
Clock Digit Symbol Prose Recall
Visuo-constructive ability
N=120
Short-term memory
N=110
Verbal memory
N=110
Coef. SE P value Coef. SE P value Coef. SE P value
Fixed Effects
Level of performance at dementia
diagnosis
11.98 0.71 <0.001 14.13 2.05 <0.001 5.67 1.01 <0.001
Years to dementia diagnosis from
study entry
-0.04 0.13 0.75 -0.15 0.37 0.67 -0.06 0.18 0.72
Education -0.22 0.25 0.37 1.30 0.82 0.11 0.19 0.32 0.55
Occupation Medium 0.45 0.81 0.58 4.01 2.30 0.08 -0.29 1.06 0.78
High -0.45 1.19 0.70 -0.04 3.31 0.98 0.47 1.62 0.76
Female -0.53 0.73 0.46 -0.98 2.05 0.63 0.14 1.02 0.89
Baseline age -0.03 0.15 0.81 -0.43 0.47 0.36 -0.24 0.20 0.23
COGNITIVE RESERVE AND COGNITIVE DECLINE 25
Rate of change -0.26 0.17 0.12 -0.84 0.44 0.05 -0.44 0.25 0.07
Years to diagnosis from study
entry
-0.02 0.03 0.52 -0.02 0.08 0.75 -0.01 0.04 0.71
Education -0.00 0.04 0.96 0.05 0.13 0.65 -0.00 0.06 0.96
Occupation Medium 0.10 0.17 0.56 -0.32 0.39 0.42 -0.17 0.24 0.48
High -0.38 0.28 0.18 -0.87 0.69 0.21 -0.09 0.38 0.80
Female -0.10 0.16 0.54 -0.30 0.40 0.45 -0.19 0.24 0.42
Baseline age 0.02 0.04 0.53 0.09 0.10 0.37 -0.01 0.05 0.79
Random Effects Variance - - 95% CI - - 95% CI - - 95% CI
Level of performance 0.40 0.08 0.27 - 0.59 0.17 0.21 0.01 - 1.90 0.56 0.16 0.32 - 0.99
Rate of decline 2.48 0.27 1.99 - 3.04 7.25 0.84 5.77 - 9.11 3.37 0.50 2.52 - 4.52
Error 2.50 0.14 2.23 - 2.80 4.89 0.32 4.30 - 5.56 2.59 0.20 2.22 - 3.02
COGNITIVE RESERVE AND COGNITIVE DECLINE 26
Table 2 (continued)
Mean, Standard Error of the Estimates of the Effect of Risk Factors on Random Effects of Preclinical Decline Mixed Model for the fluid cognitive
abilities
Memory Recall Memory Recognition Memory Correspondence
Short-term memory
N=112
Short-term memory
N=113
Short-term memory
N=110
Coef. SE P value Coef. SE P value Coef. SE P value
Fixed Effects
Level of performance at dementia
diagnosis
2.43 0.58 <0.001 8.60 0.43 <0.001 4.14 0.56 <0.001
Years to dementia diagnosis from
study entry
-0.00 0.11 0.95 -0.13 0.08 0.09 0.09 0.10 0.35
Education 0.21 0.21 0.31 0.20 0.15 0.19 0.29 0.21 0.16
Occupation Medium 0.52 0.65 0.42 -0.69 0.47 0.14 0.14 0.62 0.81
High -0.71 0.99 0.47 -0.01 0.75 0.98 -0.32 0.94 0.73
Female 0.41 0.60 0.49 -0.19 0.44 0.66 1.31 0.57 0.02
Baseline age -0.09 0.12 0.43 -0.17 0.09 0.07 -0.10 0.12 0.38
COGNITIVE RESERVE AND COGNITIVE DECLINE 27
Rate of change -0.55 0.13 <0.001 -0.13 0.10 0.21 -0.35 0.14 0.01
Years to diagnosis from study
entry
-0.04 0.02 0.10 -0.02 0.02 0.34 -0.02 0.03 0.48
Education 0.01 0.03 0.65 0.03 0.02 0.27 0.02 0.04 0.57
Occupation Medium 0.09 0.14 0.48 -0.06 0.10 0.56 -0.02 0.15 0.85
High 0.02 0.23 0.89 0.01 0.18 0.92 -0.20 0.24 0.41
Female -0.07 0.13 0.60 -0.07 0.10 0.50 -0.03 0.14 0.83
Baseline age 0.05 0.03 0.06 -0.02 0.02 0.23 0.02 0.03 0.42
Random Effects Variance - - 95% CI - - 95% CI - - 95% CI
Level of performance 0.30 0.07 0.17 - 0.50 0.33 0.05 0.23 - 0.46 0.27 0.10 0.12 - 0.59
Rate of decline 2.29 0.27 1.80 - 2.90 1.32 0.20 0.98 - 1.77 1.78 0.29 1.29 - 2.47
Error 1.54 0.10 1.34 - 1.77 1.32 - 1.71 1.72 0.12 1.48 - 1.99

COGNITIVE RESERVE AND COGNITIVE DECLINE 28
Table 3
Mean, Standard Error of the Estimates of the Effect of Risk Factors on Random Effects of Preclinical Decline Mixed Model for the crystallized
cognitive abilities
Synonym Information
Verbal ability
N=117
Semantic knowledge
N=117
Coef. SE P value Coef. SE P value
Fixed Effects
Level of performance at dementia
diagnosis
10.88 1.15 <0.001 20.33 1.97 <0.001
Years to dementia diagnosis from
study entry
-0.10 0.22 0.63 -0.22 0.39 0.56
Education 0.80 0.35 0.02 1.64 0.56 0.004
Occupation Medium 3.12 1.28 0.01 3.57 2.25 0.11
High 3.09 2.17 0.15 1.95 3.24 0.55
Female 1.36 1.24 0.27 -6.30 2.10 0.003

COGNITIVE RESERVE AND COGNITIVE DECLINE 29
Baseline age 0.19 0.26 0.46 -0.75 0.43 0.08
Rate of change -0.87 0.26 <0.001 -1.78 0.31 <0.001
Years to diagnosis from study
entry
-0.07 0.05 0.18 -0.22 0.06 0.001
Education -0.07 0.07 0.32 -0.09 0.08 0.27
Occupation Medium 0.63 0.24 0.01 -0.03 0.30 0.91
High 0.64 0.47 0.18 -0.62 0.50 0.21
Female 0.27 0.25 0.27 0.27 0.29 0.35
Baseline age 0.06 0.06 0.35 -0.02 0.07 0.76
Random Effects Variance - - 95% CI - - 95% CI
Level of performance 0.34 0.19 0.11 - 1.06 0.23 0.49 0.00 - 15.05
Rate of decline 4.40 0.51 3.50 - 5.53 9.52 0.77 8.11 - 11.18
Error 2.36 0.21 1.98 - 2.82 3.81 0.28 3.29 - 4.42
COGNITIVE RESERVE AND COGNITIVE DECLINE 30
Figure 1. Estimated mean trajectories of cognitive decline prior to dementia diagnosis for a man
aged 83 with 7 years of education entering the study at 5 years from dementia diagnosis (solid lines)
and individuals with 2 and 12 years of education (the additional dotted upper and lower lines).