edrs 811: a comparative analysis of the effect of...
TRANSCRIPT

Running head: EFFECT OF SOCIOECONOMIC STATUS ON HEALTH BEHAVIOR 1
EDRS 811: A Comparative Analysis of the Effect of Socioeconomic Status on Healthy Behavior
and Academic Achievement in High School Students
Tiah E. McKinney
George Mason University
Dr. Charles Thomas
April 1, 2011

EFFECT OF SOCIOECONOMIC STATUS ON HEALTHY BEHAVIOR 2
Background Literature
Statement of the Problem
Today’s society is more complex than ever. Students’ are struggling with debilitating health
concerns and their psychological, social, emotional, and physical needs far exceed the
capabilities of what schools can provide to them. These facts have profound implications both in
the United States and abroad as schools are microcosms of the larger society in which we live.
Presently, school age children experience a multitude of barriers, which impede their learning
and prevent their success. Among these barriers are: poor nutrition, poverty, lack of access to
health care, communicable diseases, lack of physical exercise, substance abuse, and violence.
Education has long been touted as the great equalizer to “level the playing field”, yet in this
complex world, education alone cannot solve the myriad of problems. A growing body of
research provides strong evidence that education, health and social determinants are closely
interdependent. Equally, schools working in collaboration with strategic partners in health and
wellness are integral to increasing student learning and academic achievement. To effectively
support students’ learning and academic attainment in the 21st Century, schools must make it a
priority to create healthy learning environments for students, staff and the surrounding
community as outlined by the Coordinated School Health Program.
The term ‘social determinants of health’ was brought to public attention by The World
Health Organization (Commission on Social Determinants, 2005) and refers to avoidable health
inequalities that arise due to the conditions in which people grow, live, work, and age, and the
systems put in place to deal with illness. According to the report from the Commission on Social
Determinants titled, Closing the Health Gap in a Generation (2008), it cites a study by
EFFECT OF SOCIOECONOMIC STATUS ON HEALTHY BEHAVIOR 3
Grantham-McGregor et al (2007), which states “at least 200 million children globally are not
achieving their full development potential” (p. 3). Over two decades of findings from various
sources, including the Commission’s report, connect poverty, poor health and low academic
achievement. In particular, the Commission’s report states “social and economic policies have a
determining impact on whether a child can grow and develop to its full potential and live a
flourishing life” (p.3). Next, the Commission’s report finds that “low living standards are a
powerful determinant of health inequity…” (p. 26). According to another study conducted by
Maggi et al (2010), families’ living in poverty has long been implicated in diminished children’s
health, development and school performance and achievement as well as poor health in
adulthood.
In light of these grave issues, the Coordinated School Health Program is cited as a model for
school reform, it consists of eight interrelated components that traditionally function separately.
Eight Interrelated Components: Each component serves to compliment the other.
Family and Community Involvement with Health Education
Nutrition services
Health education
Physical Education
A Healthy School Environment
School Health Services
Counseling, Psychological, and Social Services
Staff Wellness

EFFECT OF SOCIOECONOMIC STATUS ON HEALTHY BEHAVIOR 4
Purpose
The purpose of this study is to examine the relationship, if any, between students’ socio-
economic status and self-reported student health behaviors as predictors for student learning and
academic achievement. It intends to investigate the effect to which a students’ socio-economic
status as determined by school records for ‘free and reduced lunch’ program impacts positively
or negatively on students’ health behavior as evidenced by data from a self-reported student
health survey and the effect on academic achievement. Also, this study investigates if there are
differences in student health behaviors across gender and race. Furthermore, an analysis of these
findings will determine if there is statistically significant data to support the need for a
Coordinated School Health Program (CSHP).
Research Questions
The study will explore the following research questions:
1. Does Socio-Economic Status and health behaviors as determined by scores on a Self-reported Health Survey in High School students effect achievement while controlling for schools?
2. Are there mean differences in student scores on a self-reported Health Survey across
gender? And Race?
3. If there are statistical differences among student scores on a self-reported Health Survey
across race and gender, to what degree does socio-economic status account for these
differences?
4. Do the findings support a need for a Coordinated School Health Program?

EFFECT OF SOCIOECONOMIC STATUS ON HEALTHY BEHAVIOR 5
Method
Setting
A combined total of 589 participants were selected from two different high schools for this
study. Both high schools are located within 25 miles of the other and within or near a
metropolitan city in the Midwest region of the United States.
High School A. The first of the two high schools, School A, is comprised of a student
population where 78% qualify for the free and/or reduced lunch program. High School A is
located within a large urban city and the school facility was built in the 1950’s. There are
frequent maintenance repairs that often go unaddressed. High School A, like other urban schools,
has limited resources, large class sizes and reduction and/or elimination of classes such as
physical education and art.
High School B. the second high school in the study, School B, is located in a suburban
area near the city limits, where 20% of its student population qualifies for the free and/or reduced
lunch program. School B is a new school facility that was built and completed in 2009, which
replaced the former building. This new facility is a state of the art complex with technology in
every classroom, a new gymnasium, a natatorium, a physical fitness center, a modern cafeteria
that provides meals from scratch and an outdoor track and field sports complex.
Participants
Both School A and School B. The participants in this study are high school students in
grades 9 and 10. A stratified random sample of 589 students from both high schools was selected
based on preference for ethnicity and gender. A total sample population of 589 taken from both
School A and School B consists of ninth and tenth graders, male and female students, and was

EFFECT OF SOCIOECONOMIC STATUS ON HEALTHY BEHAVIOR 6
comprised of students from diverse backgrounds, African-American, Hispanic and Caucasian. Of
the 589 participants, 290 were females, 299 were males. The demographics of the sample
population were: 36.7% Caucasian, 40.7% Hispanic and 22.6% African-American. All 589
participants selected were general education students. Of the 589 students participating in the
study, 295 were ninth grade students and 294 were tenth grade students.
Teachers. A combined total of twelve teachers were selected from both high schools,
School A and School B, to participate in the study, which consisted of six teachers from each
high school, three teachers each from grades 9 and 10, respectively. The demographics of the
teachers selected are 84% Caucasian, 10% African-American, and 6% Hispanic.
Research Design
A quasi-experimental design was employed for the purpose of this study, and pre-existing
data was used.
Materials
The Global School-based Student Health Survey (GSHS) was the instrument used for
assessment of student health behaviors. This data was self-reported by participating students in
the study. The GSHS is a school-based questionnaire conducted primarily among students aged
13–15 years-old. This survey uses a standardized scientific sample selection process; a common
school-based methodology; and core questionnaire modules that are combined to form a self-
administered questionnaire, which was administered during a 45-minute class period. According
to the Centers for Disease Control and Prevention (CDC) website, the GSHS was developed by
the World Health Organization (WHO) in collaboration with United Nations' UNICEF,

EFFECT OF SOCIOECONOMIC STATUS ON HEALTHY BEHAVIOR 7
UNESCO, and UNAIDS; and with technical assistance from CDC. The purpose of the GSHS is
to provide data on health behaviors and protective factors among students and to assist in
developing priorities, establish programs and advocate for resources for school health programs
and policies. The GSHS allows for comparisons to be made regarding the prevalence of health
behaviors and protective factors as well as to establish trends in prevalence of student health
behaviors and protective factors. The SPSS 18.0 software was used to calculate the data in this
study.
Of the eleven core GSHS questionnaire modules, six were selected for this study. The
following modules were used for the Student Health Survey: 1) Dietary behaviors, 2) Mental
health, 3) Physical activity, 4) Protective factors, 5) Violence and unintentional injury, and 6)
Sexual behaviors that contribute to HIV infection, other sexually-transmitted infections, and
unintended pregnancy.
Data Sources
There are three dependent measures: 1. Completion of entire GSHS Survey, 2. Scores on
GSHS, and 3. School-based Achievement assessment. Each measure is aligned with and
addresses a respective research question. For the purposes of this study, the dependent variable is
the students gain score on the Achievement assessment, and the independent variables are the
students’ scores on the GSHS survey, students’ Socio-Economic Status (SES), gender and race.
Completion of GSHS Questionnaire. The Student Health Survey was completed by all
589 participants in the study and was administered by a participating teacher. All participants
worked independently to complete entire survey.

EFFECT OF SOCIOECONOMIC STATUS ON HEALTHY BEHAVIOR 8
Scores on GSHS Survey. Student scores on the GSHS Survey were used to determine if
there were mean differences in students’ self-reported health behavior across gender and race.
Achievement Test. The students’ scores on the achievement test were used to determine
if high scores on the self-reported GSHS Survey had a positive impact on academic performance.
Data Collection
Data on free and reduced lunch program was collected from school records. The combined
total of 589 students comprised from School A and School B completed and submitted their
Student Health Survey during the 1st week of the spring semester. Additionally, Teachers
remarked that they received comments from students that they felt comfortable responding to
survey questions. Also, the scores from the Achievement assessment for each of the participating
students were retrieved from school records.
Procedures
Before the start of the study, the researcher obtained approval from the Human Subject
Review Board to conduct this research. Next, permission was obtained from the school district,
the school principals, students, parents and the participating teachers. A combined total sample
of 589 students was selected based on prevalence for ethnicity and gender from the two high
schools. For the study, 286 participants were selected from School A and 303 participants were
selected from School B. The sample population included 295 ninth and 294 tenth graders, 299
male and 290 female students. The demographics of the sample were 22.6 percent African-
American, 40.7 percent Hispanic, and 36.7 percent Caucasian students. A total of twelve teachers
were selected, six teachers from each school, which consisted of three ninth grade teachers and
three tenth grade teachers from both School A and School B.

EFFECT OF SOCIOECONOMIC STATUS ON HEALTHY BEHAVIOR 9
Prior to the beginning of school, the twelve participating teachers attended a 45-minute
workshop which provided them with an overview and purpose of the GSHS survey, instructed
the teachers on how to properly administer the GSHS survey and provided guidance for
addressing questions pertaining to the GSHS survey. Each of the two high schools, School A and
School B, operate on 60-minute block schedules. The GSHS survey procedures as outlined in the
workshop were followed with integrity by the participating teachers and were administered to the
participants at the start of spring semester within the first week. The GSHS survey consisted of
45 questions and took approximately 45 minutes to complete, the surveys were completed during
the 2nd period class. Once participants completed their surveys, the surveys were collected by
the participating teachers and put into sealed envelopes, which were given to the researcher for
scoring and analysis.
Fidelity of Treatment
The participating teachers attended a workshop and were trained on how to administer the
GSHS surveys to the participating students. The teachers administered the GSHS surveys and
allowed the proper time for students to complete them. Upon completion of the GSHS surveys
each teacher then collected the surveys and put them in sealed envelopes to give to researcher.
The researcher and four hired assistances were present to observe students during randomly
selected classes and for collection of the completed surveys.
Scoring Procedures and Reliability of Scoring
The researcher hired and trained four graduate students to assist with scoring and to ensure that scoring procedures were standardized. Two graduate assistants cross-checked the
EFFECT OF SOCIOECONOMIC STATUS ON HEALTHY BEHAVIOR 10
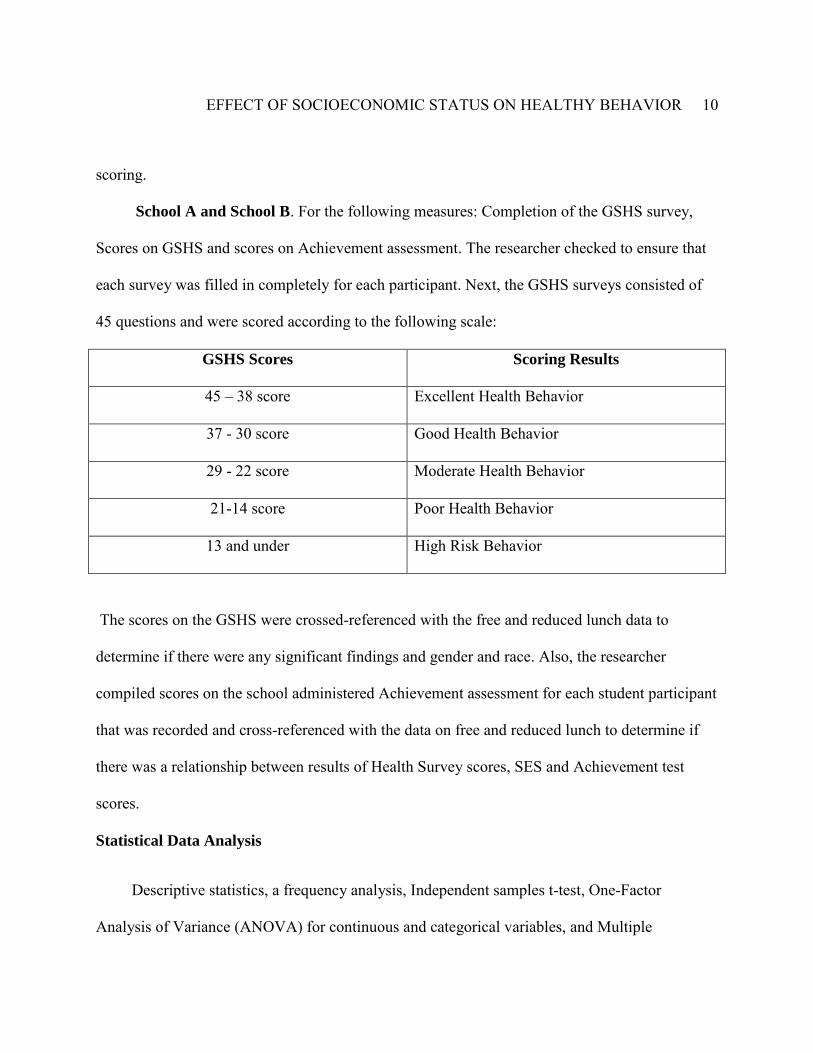
scoring. School A and School B. For the following measures: Completion of the GSHS survey,
Scores on GSHS and scores on Achievement assessment. The researcher checked to ensure that
each survey was filled in completely for each participant. Next, the GSHS surveys consisted of
45 questions and were scored according to the following scale:
GSHS Scores Scoring Results
45 – 38 score Excellent Health Behavior
37 - 30 score Good Health Behavior
29 - 22 score Moderate Health Behavior
21-14 score Poor Health Behavior
13 and under High Risk Behavior
The scores on the GSHS were crossed-referenced with the free and reduced lunch data to
determine if there were any significant findings and gender and race. Also, the researcher
compiled scores on the school administered Achievement assessment for each student participant
that was recorded and cross-referenced with the data on free and reduced lunch to determine if
there was a relationship between results of Health Survey scores, SES and Achievement test
scores.
Statistical Data Analysis
Descriptive statistics, a frequency analysis, Independent samples t-test, One-Factor
Analysis of Variance (ANOVA) for continuous and categorical variables, and Multiple

EFFECT OF SOCIOECONOMIC STATUS ON HEALTHY BEHAVIOR 11
Regression were used to determine whether there were statistically significant differences
between the predictors and independent variables compared to the dependent variables. The
alpha was set at .05, and the p-value was compared after the tests were generated. The SPSS
18.0 software was used to conduct the tests for each research question. In order to answer the
first research question about whether SES and health behaviors as determined by scores on Self-
reported Health Survey in high school students effect achievement while controlling for schools,
a Multiple Regression was used to test this null hypothesis. The second research question was
meant to determine if there are mean differences in student scores on self-reported Health Survey
across gender and race. To address this question an ANOVA test was used. The third research
question was similar to the second, but its purpose is to assess the degree that SES account for
differences in student scores on self-reported Health Survey. Based upon the findings, this will
be further discussed. The fourth research question serves to analyze whether the statistical data
supports a need for a Coordinated School Health Program. To address this question, the
researcher draws from the strength of the findings and makes a recommendation for future
education policies.
Results
To answer the first research question, a Multiple Regression was used to test the null
hypothesis, and the means and standard deviation for the relevant variables (SES, Health scores
and Schools) are provided in Table 1. In Figure 1, the results from the Multiple Regression
indicate the predictors account for a statistically significant proportion of the variance. Therefore,
the coefficient of determination for the population, R2pop does not equal zero and the null
hypothesis, H0: R2pop = 0, is rejected. The F-statistic is statistically significant, F(3, 585) =

EFFECT OF SOCIOECONOMIC STATUS ON HEALTHY BEHAVIOR 12
193.574, p < .0001. The coefficient of determination, R2= .496, indicates that 49.6% of the
students’ differences in scores on Achievement assessment are accounted for by their differences
in SES and Health scores. The regression coefficients for the predictors are statistically
significant, Health scores, b1 = 0.445 (p < .0001), SES, b2 = .521(p < .0001), whereas School, b3
= -1.119 (p =.027) is not significant. Further, indicating that two predictors contribute to R2, each
predictor has their own unique contribution to the prediction of Achievement scores, which
explains the variance in the dependent variable. Specifically, the part correlation for Health
scores, ry (1.2) = .333, and the part correlation for SES, ry (1.2) = .266. Thus, it shows that 11.08% of
the variance in scores on Achievement assessment is accounted for by Health scores. Likewise,
7% of the variance in Achievement scores is accounted for by SES. The regression equation for
the prediction of Achievement scores from Health score, SES and School is Achievement =
.445(HS) + .521(SES) – 1.119(School) + 10.80. The examination of the regression co-efficient
shows that a one unit increase in Health score, controlling for SES and School, will result in an
increase in Achievement score by .445.
To answer the second research question an ANOVA test was used to determine if there
were mean differences in student scores on self-reported Health Survey across gender and race.
The means and standard deviation of Health scores for gender are provided in Table 2 and the
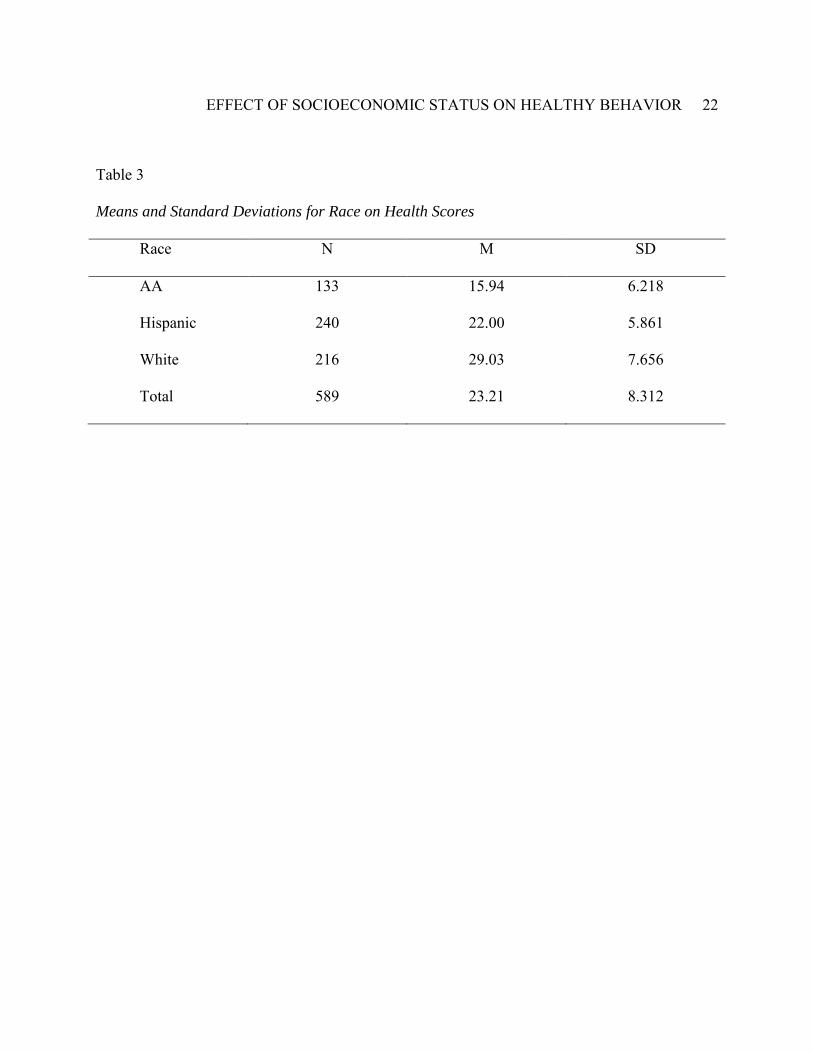
means and standard deviation of Health scores for race are provided in Table 3. In Figure 2, the
omnibus F-test in the ANOVA shows that there are statistically significant differences in Health
scores between genders. Specifically, the test statistic for gender is F = 4.332, which exceeds the
Fcv = 3.87, thus we reject the null hypothesis, H0: µ1 = µ2 = µ3. Likewise, the omnibus F-test in
EFFECT OF SOCIOECONOMIC STATUS ON HEALTHY BEHAVIOR 13
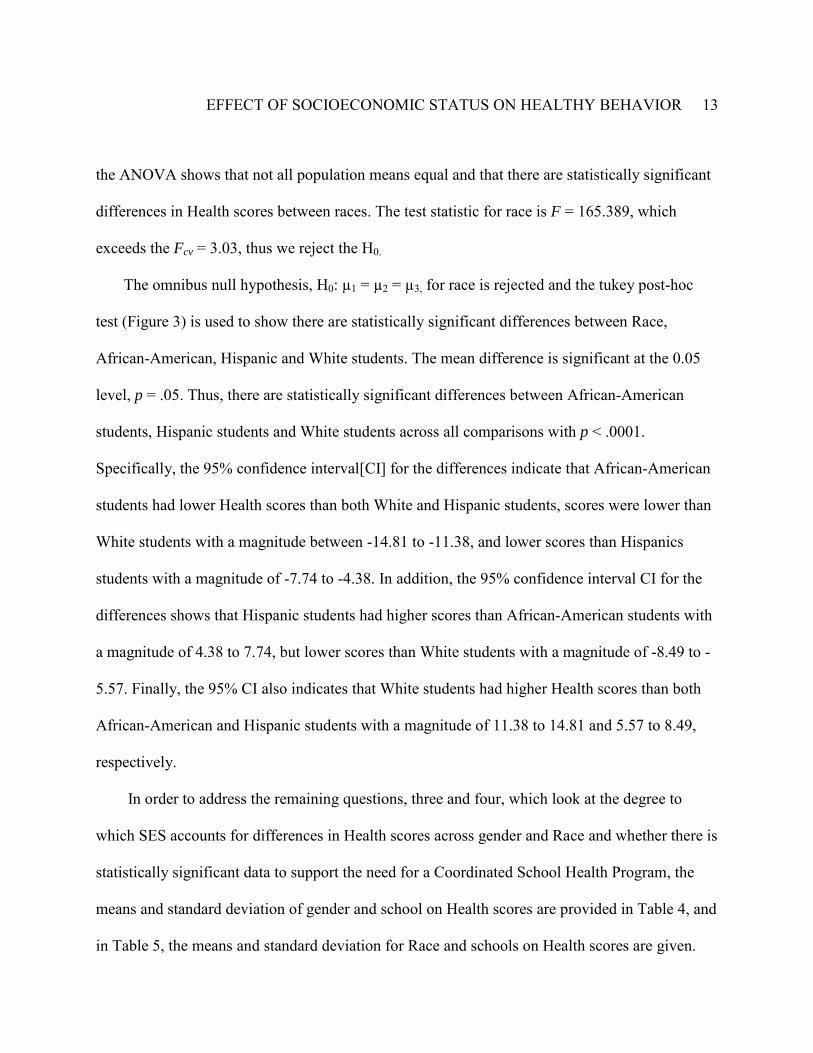
the ANOVA shows that not all population means equal and that there are statistically significant
differences in Health scores between races. The test statistic for race is F = 165.389, which
exceeds the Fcv = 3.03, thus we reject the H0.
The omnibus null hypothesis, H0: µ1 = µ2 = µ3, for race is rejected and the tukey post-hoc
test (Figure 3) is used to show there are statistically significant differences between Race,
African-American, Hispanic and White students. The mean difference is significant at the 0.05
level, p = .05. Thus, there are statistically significant differences between African-American
students, Hispanic students and White students across all comparisons with p < .0001.
Specifically, the 95% confidence interval[CI] for the differences indicate that African-American
students had lower Health scores than both White and Hispanic students, scores were lower than
White students with a magnitude between -14.81 to -11.38, and lower scores than Hispanics
students with a magnitude of -7.74 to -4.38. In addition, the 95% confidence interval CI for the
differences shows that Hispanic students had higher scores than African-American students with
a magnitude of 4.38 to 7.74, but lower scores than White students with a magnitude of -8.49 to -
5.57. Finally, the 95% CI also indicates that White students had higher Health scores than both
African-American and Hispanic students with a magnitude of 11.38 to 14.81 and 5.57 to 8.49,
respectively.
In order to address the remaining questions, three and four, which look at the degree to
which SES accounts for differences in Health scores across gender and Race and whether there is
statistically significant data to support the need for a Coordinated School Health Program, the
means and standard deviation of gender and school on Health scores are provided in Table 4, and
in Table 5, the means and standard deviation for Race and schools on Health scores are given.

EFFECT OF SOCIOECONOMIC STATUS ON HEALTHY BEHAVIOR 14
Additionally, descriptive statistics and frequency analysis are provided and discussed further in
the next section. In addition, in Figure 4, a Frequency analysis for Gender, Race and School are
provided. In Figure 5, Descriptive statistics table for Achievement, Health Scores and SES is
given with corresponding histograms for Achievement, Health Scores and SES, Figures 6-8, and
in Figure 9, a Scatter plot Achievement and SES.
Discussion
In this study, the impact of students’ self-reported health behavior and socio-economic status
was examined to determine the effects on achievement. Particular interest was in whether there
were mean differences in student scores on a self-reported Health Survey across gender and Race
and whether socio-economic status has an impact in the difference. Here the findings will be
discussed as well as the implications for practice and future policy, limitations of the study, and
recommendations for future research.
Overall, this research found that predictors for Health scores and SES account for statistically
significant differences in the scores on the school-based Achievement assessment. Further, the
examination of the regression co-efficient shows that a one unit increase in Health score,
controlling for SES and School, will result in an increase in Achievement score by .445, which
shows a strong interconnection between a students’ health status, poverty and achievement
The results illustrate there are statistically significant mean differences among students’
Health scores across Race and gender. However, the differences in Health scores between race,
African-American, Hispanic and White students increased dramatically when low socio-
economic status was an added factor. Thus, demonstrating that poverty amplifies health
disparities among race and gender, with children of color disproportionately at risk. Among the

EFFECT OF SOCIOECONOMIC STATUS ON HEALTHY BEHAVIOR 15
racial categories, White students scored the highest on the Health survey, Hispanic students
scores the next highest and African-American students scored the lowest on the self-reported
Health survey. These findings have profound implication for student learning and academic
achievement as the study suggests that as students’ health status improves so will student
academic achievement. However, there are many other factors that could be at play as well such
as parental education level and employment, parent school involvement, students’ beliefs and
perceptions of health and educational attainment, and absenteeism/tardiness.
The findings are statistically significant and do provide evidence that a more coordinated
health initiative is needed in schools, such as the Coordinated School Health Program shows
promise to offer. It is clear from the results that more school-based health and wellness services
must be provided to students to mitigate the health disparities evidenced in this study. Thus,
school leaders, policy-makers and classroom practitioners should strive to create healthier
learning environments for students that will facilitate and support academic achievement and
lifelong learning.
Limitations
This was a preliminary study and the results can only be generalized to the school
populations at which this study was conducted. Further, the students self-reported GSHS survey
was only measured once, not over a period of time and it cannot be determine if the data from
students was accurate. Also, aside from the single survey administered to participants no
additional contact with students was made. The researcher acknowledges that it would be
beneficial to use more than one measure, the GSHS survey, in order to increase the validity.
Therefore, the results from this study should be interpreted with caution.

EFFECT OF SOCIOECONOMIC STATUS ON HEALTHY BEHAVIOR 16
Recommendations for Future Research
As was mentioned previously, school age children come to school with unmet health needs
that if left unaddressed can impact their academic success and future development. Thus, it is the
leading challenge of schools in the 21st Century to promote and support the learning needs of all
students, which must consider students’ health integral to learning and academic achievement.
With that said, recommendations for future research are to continue conducting research to
explore connections between socioeconomic status, health and learning in schools and to study
the impacts over time with respect to student self-reporting health behaviors, socio-economic
status, grades and standardized tests. Also, conduct research that incorporates focus groups
comprised of adolescent students to provide a deeper analysis into students’ beliefs and
perspectives of the connections between health and education attainment. Finally, further
research should be conducted to evaluate a full-scale Coordinated School Health Program
(CSHP) that has been successfully implemented and monitor the long-term outcomes and
impacts on students, teachers, parents and the community. Lastly, future research should
identify how to implement an effective CSHP and identify best practice to inform effective
policy adoption and implementation.
Reflections
This study provides meaningful analysis and explanations for the results of self-reported
health behavior among high school students with diverse backgrounds as well as provides a
connection to students’ socio-economic status, self-reported health behaviors and academic
achievement. Furthermore, this study provides useful research to schools, educational leaders
and policy-makers to assist with critical decision-making, in particular, regarding development

EFFECT OF SOCIOECONOMIC STATUS ON HEALTHY BEHAVIOR 17
of future education policies centered on integrating relevant and effective education and health
policies such as implementing a Coordinated School Health Program to address current student
health concerns and to support student learning and academic achievement.

EFFECT OF SOCIOECONOMIC STATUS ON HEALTHY BEHAVIOR 18
References Association of State and Territorial Health Officials and the Society of State Directors of Health, Physical Education and Recreation. (2002). Making the Connection: Health and Student Achievement. Centers for Disease Control and Prevention. (1991-2009). High School Youth Risk Behavior Survey Data. Retrieved from http://apps.nccd.cdc.gov/youthonline/App/Default.aspx?SID=HS Council of Chief State School Officers. (1991). Beyond the health room. Washington, DC:
Author.
Fetro, J.V., Givens, C. & Carroll, K. (January 2010). Coordinated school health: Getting it all
together. Educational Leadership, volume 67 (number 4), 32-37.
http://www.rhat.org/documents/Coordinated
International Union for Health Promotion and Education. (2009). Achieving Health Promoting
Schools: Guidelines for Promoting Health in Schools.
Maggi, S, Irwin, L., Siddiqi, A. & Hertzman, C. (2010). The social determinants of early child
development: An overview. Journal of Pediatrics and Child Health. Doi: 10.1111/j.1440-
1754.2010.01817.x
Marmot, M. (2005). Social determinants of health inequalities; Lancet 2005; 365: 1099–104.
Murray, N.G. et al (2007). Coordinated school health programs and academic achievement: a
systemic review of the literature. Journal of School Health; November 77(9):589-60.
Pearce J, Dorling D, 2009, "Tackling global health inequalities: closing the health gap in a
generation" Environment and Planning; 41(1) 1 – 6.
EFFECT OF SOCIOECONOMIC STATUS ON HEALTHY BEHAVIOR 19
Postiglione, G.A. (2006). Education and social change in China: Inequality in a market
economy. East Gate Book; N.Y.
Preamble to the Constitution of the World Health Organization as adopted by the International
Health Conference, New York, 19 June - 22 July 1946.
World Health Organization. (2008). Closing the gap in a generation: Health equity through
action on the social determinants of health. Commission on Social Determinants of
Health.

EFFECT OF SOCIOECONOMIC STATUS ON HEALTHY BEHAVIOR 20
Table 1
Means and Standard Deviations of Student Achievement, Health Scores, SES and School
Variables N M SD
Achievement
Health Scores
SES
School
589
589
589
589
29.15
23.21
16.45
.49
8.574
8.312
5.663
.500

EFFECT OF SOCIOECONOMIC STATUS ON HEALTHY BEHAVIOR 21
Table 2
Means and Standard Deviations for Gender on Health Scores
Gender N M SD
Male
Female
Total
299
290
589
23.34
23.08
23.21
8.459
8.169
8.312
EFFECT OF SOCIOECONOMIC STATUS ON HEALTHY BEHAVIOR 22
Table 3
Means and Standard Deviations for Race on Health Scores
Race N M SD
AA
Hispanic
White
Total
133
240
216
589
15.94
22.00
29.03
23.21
6.218
5.861
7.656
8.312

EFFECT OF SOCIOECONOMIC STATUS ON HEALTHY BEHAVIOR 23
Table 4
Means and Standard Deviation for Gender on Health Scores
Gender School N M SD
Male School B
School A
Total
143
156
299
24.34
22.42
23.34
8.781
8.071
8.459
Female School B
School A
Total
160
130
290
22.96
23.22
23.08
8.027
8.369
8.169
Total School B
School A
Total
303
286
589
23.61
22.78
23.21
8.406
8.203
8.312

EFFECT OF SOCIOECONOMIC STATUS ON HEALTHY BEHAVIOR 24
Table 5
Means and Standard Deviation for Race on Health Scores
Race School N M SD
AA School B
School A
Total
63
70
133
16.32
15.60
15.94
6.505
5.974
6.218
Hispanic School B
School A
Total
121
119
240
22.19
21.81
22.00
6.027
5.706
5.861
White School B
School A
Total
119
97
216
28.92
29.16
29.03
7.920
7.358
7.656
Total School B
School A
Total
303
286
589
23.61
22.78
23.21
8.406
8.203
8.312

EFFECT OF SOCIOECONOMIC STATUS ON HEALTHY BEHAVIOR 25
Figure 1. Multiple Regression with Achievement Score Predicted by the Health Score, SES and Schools.
Variables Entered/Removedb
Model Variables Entered Variables Removed Method
dimension0
1 School, SES,
Health_Scoresa
. Enter
a. All requested variables entered.
b. Dependent Variable: Achievement
Model Summary
b
Model
R R Square Adjusted R Square
Std. Error of the
Estimate
Change Statistics
R Square Change
F
Change df1 df2
Sig. F
Change
dimension0
1 .706a .498 .496 6.090 .498 193.574 3 585 .000
a. Predictors: (Constant), School, SES, Health_Scores
b. Dependent Variable: Achievement
ANOVAb
Model Sum of Squares df Mean Square F Sig.
1 Regression 21535.158 3 7178.386 193.574 .000a
Residual 21693.783 585 37.083
Total 43228.941 588
a. Predictors: (Constant), School, SES, Health_Scores
b. Dependent Variable: Achievement
Coefficientsa
Model Unstandardized
Coefficients
Standardized
Coefficients
t Sig.
95.0% Confidence
Interval for B Correlations
Collinearity
Statistics
B Std. Error Beta
Lower
Bound
Upper
Bound
Zero-
order Partial Part Tolerance VIF
1 (Constant) 10.795 .869 12.419 .000 9.088 12.502
Health_Scores .445 .039 .431 11.375 .000 .368 .522 .652 .426 .333 .597 1.676
SES .521 .057 .344 9.087 .000 .409 .634 .615 .352 .266 .598 1.673
School -1.119 .504 -.065 -2.220 .027 -2.108 -.129 -.079 -.091 -
.065
.992 1.008
a. Dependent Variable: Achievement

EFFECT OF SOCIOECONOMIC STATUS ON HEALTHY BEHAVIOR 26
Figure 2. One-Factor ANOVA for Gender and Race on Health Scores
Between-Subjects Factors
Value Label N
Gender 0 Male 299
1 Female 290
Race 1 AA 133
2 Hispanic 240
3 White 216
Tests of Between-Subjects Effects
Dependent Variable:Health_Scores
Source Type III Sum of
Squares df Mean Square F Sig.
Corrected Model 15058.898a 5 3011.780 68.693 .000
Intercept 268564.807 1 268564.807 6125.476 .000
Gender 189.915 1 189.915 4.332 .038
Race 14493.848 2 7246.924 165.289 .000
Gender * Race 75.133 2 37.566 .857 .425
Error 25560.997 583 43.844 Total 357931.000 589 Corrected Total 40619.895 588
a. R Squared = .371 (Adjusted R Squared = .365)

EFFECT OF SOCIOECONOMIC STATUS ON HEALTHY BEHAVIOR 27
Figure 3. Post-Hoc Test from One-Factor ANOVA for Race on Health Scores
Multiple Comparisons
Health_Scores
Tukey HSD
(I) Race (J) Race Mean
Difference (I-J) Std. Error Sig.
95% Confidence Interval
Lower Bound Upper Bound
AA Hispanic -6.06* .716 .000 -7.74 -4.38
White -13.09* .730 .000 -14.81 -11.38
Hispanic AA 6.06* .716 .000 4.38 7.74
White -7.03* .621 .000 -8.49 -5.57
White AA 13.09* .730 .000 11.38 14.81
Hispanic 7.03* .621 .000 5.57 8.49
Based on observed means.
The error term is Mean Square(Error) = 43.844.
*. The mean difference is significant at the 0.05 level.
Health_Scores
Tukey HSDa,b,c
Race
N
Subset
1 2 3
AA 133 15.94 Hispanic 240 22.00 White 216 29.03
Sig. 1.000 1.000 1.000
Means for groups in homogeneous subsets are displayed.
Based on observed means.
The error term is Mean Square(Error) = 43.844.
a. Uses Harmonic Mean Sample Size = 183.879.
b. The group sizes are unequal. The harmonic mean of the
group sizes is used. Type I error levels are not guaranteed.
c. Alpha = 0.05.

EFFECT OF SOCIOECONOMIC STATUS ON HEALTHY BEHAVIOR 28
Figure 4. Frequency Analysis for Gender, Race, and Schools
Gender
Frequency Percent Valid Percent
Cumulative
Percent
Valid Male 299 50.8 50.8 50.8
Female 290 49.2 49.2 100.0
Total 589 100.0 100.0
Race
Frequency Percent Valid Percent
Cumulative
Percent
Valid AA 133 22.6 22.6 22.6
Hispanic 240 40.7 40.7 63.3
White 216 36.7 36.7 100.0
Total 589 100.0 100.0
School
Frequency Percent Valid Percent
Cumulative
Percent
Valid School B 303 51.4 51.4 51.4
School A 286 48.6 48.6 100.0
Total 589 100.0 100.0

EFFECT OF SOCIOECONOMIC STATUS ON HEALTHY BEHAVIOR 29
Figure 5. Descriptive Statistics for Achievement, Health Scores and Socio-economic Status
Descriptive Statistics
N Minimum Maximum Mean Std. Deviation
Achievement 589 2 46 29.15 8.574
Health_Scores 589 5 45 23.21 8.312
SES 589 3 35 16.45 5.663
Valid N (listwise) 589

EFFECT OF SOCIOECONOMIC STATUS ON HEALTHY BEHAVIOR 30
Figure 6. Descriptive Statistics for Achievement

EFFECT OF SOCIOECONOMIC STATUS ON HEALTHY BEHAVIOR 31
Figure 7. Descriptive Statistics for Health Scores

EFFECT OF SOCIOECONOMIC STATUS ON HEALTHY BEHAVIOR 32
Figure 8. Descriptive Statistics for Socio-economic Status (SES)

EFFECT OF SOCIOECONOMIC STATUS ON HEALTHY BEHAVIOR 33
Figure 9. Scatter Plot, Achievement and Socio-economic Status