socioeconomic fertility differentials in a late … · socioeconomic fertility differentials in a...
TRANSCRIPT
DEMOGRAPHIC RESEARCH VOLUME 30, ARTICLE 38, PAGES 1097-1128 PUBLISHED 8 APRIL 2014 http://www.demographic-research.org/Volumes/Vol30/38/ DOI: 10.4054/DemRes.2014.30.38 Research Article
Socioeconomic fertility differentials in a late transition setting: A micro-level analysis of the Saguenay region in Quebec
Hélène Vézina
Danielle Gauvreau
Alain Gagnon This publication is part of the Special Collection on “Socioeconomic status and fertility before, during and after the demographic transition”, organized by Guest Editors Martin Dribe, Michel Oris, and Lucia Pozzi.
© 2014 Hélène Vézina, Danielle Gauvreau & Alain Gagnon. This open-access work is published under the terms of the Creative Commons Attribution NonCommercial License 2.0 Germany, which permits use, reproduction & distribution in any medium for non-commercial purposes, provided the original author(s) and source are given credit. See http:// creativecommons.org/licenses/by-nc/2.0/de/
Table of Contents
1 Introduction 1098 2 Data sources and methods 1102 3 Main indicators of reproduction and socioeconomic differentials 1108 4 Event history analysis of birth intervals 1116 5 Discussion 1123 6 Acknowledgements 1125 References 1126
Demographic Research: Volume 30, Article 38 Research Article
http://www.demographic-research.org 1097
Socioeconomic fertility differentials in a late transition setting: A micro-level analysis of the Saguenay region in Quebec
Hélène Vézina1
Danielle Gauvreau2
Alain Gagnon3
Abstract
BACKGROUND Historically, the French Canadian population of Quebec, Canada, is known for its high fertility, which lasted well into the 20th century, and for its late fertility transition. Within Quebec, regions such as Saguenay are known for having experienced an even more delayed fertility transition.
OBJECTIVE In Quebec, as elsewhere, various factors modulated the transition, and differential behaviors and timing can be observed across socioeconomic groups. These factors are studied here in the context of the Saguenay region, where particularly rich data are available. The region was mostly rural at first, but industrialization and urbanization occurring since the beginning of the 20th century allow us to study socioeconomic reproductive differentials before and during the transition.
METHODS To do so, we rely on the BALSAC database, which contains all church and civil records from the onset of colonization around 1840 up to 1971. In addition to the usual descriptive statistics, we use Cox models to analyze the probability of having a first birth and higher order births among four socioeconomic groups defined with HISCLASS coding.
1 BALSAC Project, Université du Québec à Chicoutimi, Chicoutimi, Quebec, Canada. E-mail: [email protected]. 2 Department of Sociology and Anthropology, Concordia University, Montreal, Quebec, Canada. 3 Department of Demography, Université de Montréal, Montreal, Quebec, Canada.
Vézina, Gauvreau & Gagnon: Fertility differentials in a late transition setting
1098 http://www.demographic-research.org
RESULTS The results demonstrate the late timing of the transition and a clear progression from the non-manual and skilled workers, who show the first signs of declining fertility during the 1930s, to the farmers, who do the same only at the end of the 1950s. As a result, socioeconomic fertility differentials widened during the transition period.
CONCLUSION Even in a context where the transition was significantly delayed compared to most other regions studied in this issue, some socioeconomic differentials were observed prior to the transition, and they widened during the transition due to the differential progression of contraceptive practices among couples.
1. Introduction
The study of socioeconomic stratification and fertility before, during and after the transition has raised various issues that are discussed in the vast literature about the relationship between socioeconomic factors and fertility behavior. Three of these issues are of particular interest to us: first, the role of socioeconomic explanations in understanding the fertility transition; second, the existence of socioeconomic stratification before the transition; and, third, the evolution of socioeconomic differentials during the fertility transition. The Saguenay region being studied was on the verge of reaching its “after the transition” phase in 1971, which means we cannot consider this last phase with the data used in this paper.
After many decades of competing theories placing emphasis on economic or cultural explanations for the fertility transition in Western societies, in which the works of Thompson (1929), Notestein (1945), Coale (1973), Easterlin (1978), Caldwell (1982), Coale and Watkins (1986), Lesthaeghe and Wilson (1982), and Lesthaeghe and Surkyn (1988) occupy a prominent place, one can say that some consensus has been reached about the importance of both types of explanation and about the specificity of their combined effect in various contexts. Some even argued that socioeconomic factors underpinned the fertility transition, while cultural determinants largely conditioned its pace in various contexts (for example, Lesthaeghe and Wilson 1982). Despite the unique features of the fertility (and demographic) transition in each society, it is also acknowledged that using comparative approaches can further enhance our understanding of crucial aspects of the fertility transition, and this certainly includes the need for a careful examination of the role of socioeconomic factors in various settings.
The question of whether a socioeconomic stratification of fertility behavior existed prior to the transition has been fueled recently by the very detailed work undertaken by
Demographic Research: Volume 30, Article 38
http://www.demographic-research.org 1099
Tsuya et al. (2010) in various parts of Europe (Sweden, Belgium, Italy) and Asia (Japan, China) using sophisticated techniques applied to detailed micro-level data. Interestingly, these studies demonstrate the existence of socioeconomic fertility differentials and differentiated mechanisms allowing for adjustments to exceptional economic conditions even before the transition. These results have great relevance for questions about socioeconomic differentials prior to the transition that can be asked in other contexts using similar techniques, which is one of the goals of this special issue.
The third issue raised concerns the socioeconomic differentials in reproductive behavior during and after the transition period, which is directly linked to the differential experience of the fertility transition by various socioeconomic groups. This issue has been widely studied in various national or regional settings, although not always with micro-level data allowing for the direct observation of individual experiences of declining fertility; these studies usually demonstrate that the fertility transition was socioeconomically differentiated. A few other studies have also directly addressed this specific issue (see, for example, Westoff 1954; Wrong 1958): according to these, socioeconomic differentials tended to widen during the transition, as the upper classes were often at the forefront of the transition, and to narrow afterwards, when the “norm” favoring two children became more generalized.
What do we know about these issues in the context of the Canadian and Quebec experience of the fertility transition? The fertility transition literature in Canada emphasizes the significant differences between English-speaking provinces, especially Ontario, and the largely French Catholic population of Quebec, a province known for its high fertility levels and its delayed fertility transition (Charles 1948; Henripin 1968; McInnis 2000; Beaujot 2000; Gauvreau, Gervais, and Gossage 2007). In this province, the decline was small before the 1920s and mostly due to the minority of British Protestants, followed by British Catholics; it was also concentrated in urban areas. The importance of the cultural differences has somewhat hidden the socioeconomic differentials that have nonetheless been acknowledged by some authors (see above). We know, for example, that socioeconomic differentials in fertility existed in Quebec prior to the fertility transition, and that they widened during the demographic transition, a result which also holds true when analyses are performed separately on the French Catholic population only (Gauvreau, Gervais, and Gossage 2007). These occur mostly between urban and rural families, and between literate and illiterate mothers.
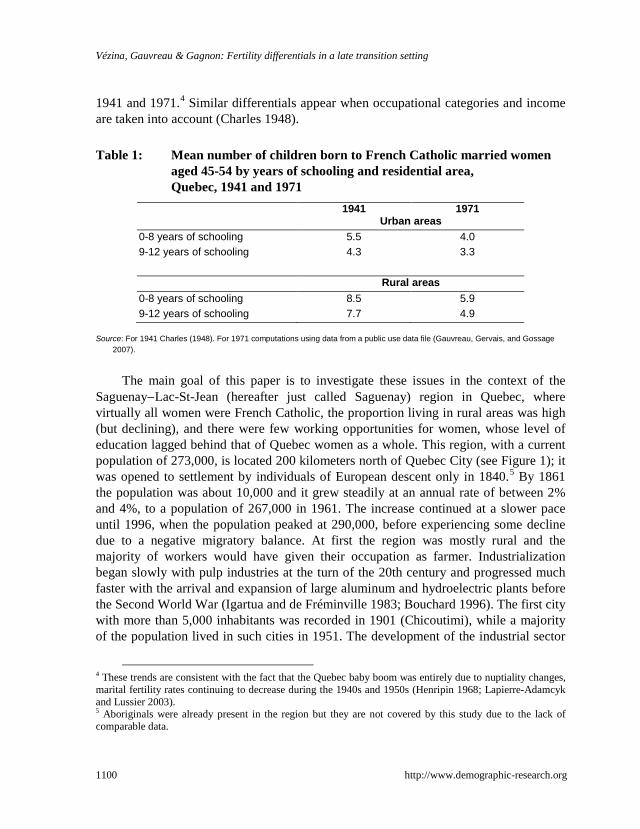
Table 1 gives an overview of the situation for this specific population a few decades after the beginning of its fertility transition. The mean numbers of children born to married women who have completed their reproductive life are high by Western standards, both in 1941 and in 1971, but they vary according to the area in which the women lived and their level of schooling; they also decreased significantly between
Vézina, Gauvreau & Gagnon: Fertility differentials in a late transition setting
1100 http://www.demographic-research.org
1941 and 1971.4 Similar differentials appear when occupational categories and income are taken into account (Charles 1948). Table 1: Mean number of children born to French Catholic married women
aged 45-54 by years of schooling and residential area, Quebec, 1941 and 1971
1941 1971 Urban areas 0-8 years of schooling 5.5 4.0 9-12 years of schooling 4.3 3.3 Rural areas 0-8 years of schooling 8.5 5.9 9-12 years of schooling 7.7 4.9
Source: For 1941 Charles (1948). For 1971 computations using data from a public use data file (Gauvreau, Gervais, and Gossage
2007).
The main goal of this paper is to investigate these issues in the context of the
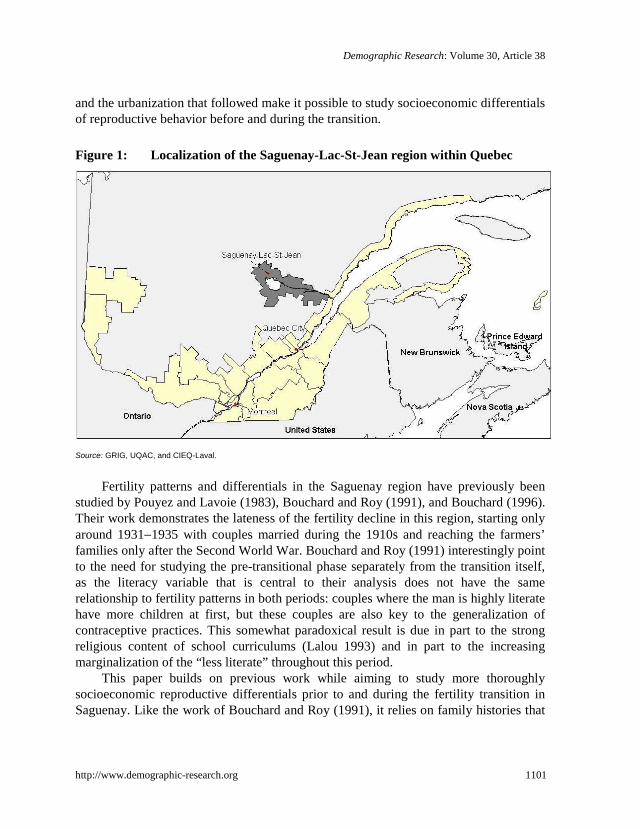
Saguenay−Lac-St-Jean (hereafter just called Saguenay) region in Quebec, where virtually all women were French Catholic, the proportion living in rural areas was high (but declining), and there were few working opportunities for women, whose level of education lagged behind that of Quebec women as a whole. This region, with a current population of 273,000, is located 200 kilometers north of Quebec City (see Figure 1); it was opened to settlement by individuals of European descent only in 1840.5 By 1861 the population was about 10,000 and it grew steadily at an annual rate of between 2% and 4%, to a population of 267,000 in 1961. The increase continued at a slower pace until 1996, when the population peaked at 290,000, before experiencing some decline due to a negative migratory balance. At first the region was mostly rural and the majority of workers would have given their occupation as farmer. Industrialization began slowly with pulp industries at the turn of the 20th century and progressed much faster with the arrival and expansion of large aluminum and hydroelectric plants before the Second World War (Igartua and de Fréminville 1983; Bouchard 1996). The first city with more than 5,000 inhabitants was recorded in 1901 (Chicoutimi), while a majority of the population lived in such cities in 1951. The development of the industrial sector
4 These trends are consistent with the fact that the Quebec baby boom was entirely due to nuptiality changes, marital fertility rates continuing to decrease during the 1940s and 1950s (Henripin 1968; Lapierre-Adamcyk and Lussier 2003). 5 Aboriginals were already present in the region but they are not covered by this study due to the lack of comparable data.
Demographic Research: Volume 30, Article 38
http://www.demographic-research.org 1101
and the urbanization that followed make it possible to study socioeconomic differentials of reproductive behavior before and during the transition.
Figure 1: Localization of the Saguenay-Lac-St-Jean region within Quebec
Source: GRIG, UQAC, and CIEQ-Laval.
Fertility patterns and differentials in the Saguenay region have previously been
studied by Pouyez and Lavoie (1983), Bouchard and Roy (1991), and Bouchard (1996). Their work demonstrates the lateness of the fertility decline in this region, starting only around 1931−1935 with couples married during the 1910s and reaching the farmers’ families only after the Second World War. Bouchard and Roy (1991) interestingly point to the need for studying the pre-transitional phase separately from the transition itself, as the literacy variable that is central to their analysis does not have the same relationship to fertility patterns in both periods: couples where the man is highly literate have more children at first, but these couples are also key to the generalization of contraceptive practices. This somewhat paradoxical result is due in part to the strong religious content of school curriculums (Lalou 1993) and in part to the increasing marginalization of the “less literate” throughout this period.
This paper builds on previous work while aiming to study more thoroughly socioeconomic reproductive differentials prior to and during the fertility transition in Saguenay. Like the work of Bouchard and Roy (1991), it relies on family histories that
Vézina, Gauvreau & Gagnon: Fertility differentials in a late transition setting
1102 http://www.demographic-research.org
have been reconstituted using complete parish register data from the opening of the Saguenay region in 1840 until 1971 (BALSAC database). However, the results presented here are based on multivariate analyses using event history analyses techniques (Cox models), which allow us to take more cases into account until the date of censoring and to disentangle more precisely the impact of a number of variables. The next section of the paper provides information about the data sources and the methods used to build the working model, including our strategy when some of the information is missing. Descriptive analyses of reproductive patterns among socioeconomic groups and their transformation through time are presented in the third section, while multivariate analyses of first and higher order birth intervals are presented in the fourth section of the paper.
2. Data sources and methods
Data for this study comes from the BALSAC database, which contains all church and civil records for the Saguenay region from the onset of colonization at the end of the 1830s up to 1971: that is 432,000 births, 91,000 marriages, and 122,500 death records (BALSAC Project 2013).6 These records have been linked using family reconstitution methods and the resulting data set carries information on 536,484 individuals.
To conduct the present study, we retrieved information on the reproductive history of all women married in the Saguenay region from the beginning of the settlement (first marriage recorded in 1842) up to 1971; only women’s first marriages were selected (N=87,838). In 67.6% of these families all the children were born in the region, while in 11.9% of them at least one child is known about by a marriage or death record only, most likely due to temporary migration. The remaining 20.5% are childless families, many of which were not observed for long enough to have had a child.7 To avoid most instances of temporary migration, only the first and third categories of family are included in our analyses, with a censoring date for the last category. Among those, only the ones where the wife’s birth date is known have been retained,8 which provides information on the age of the woman at every event and at the time of censoring.
6 About 4,500 death records between 1972 and 1986 were also entered in the database and were used in the present study. 7 The percentage is 11% for couples married before 1960, which is more in line with what is usually expected, although some cases of temporary migration probably contribute to inflating this proportion. Consistent with this interpretation, the percentage of childless couples increases to 42.3% for couples married between 1960 and 1971. 8 The birth date is known exactly through the birth record or approximately when calculated from the age at death in the death record.
Demographic Research: Volume 30, Article 38
http://www.demographic-research.org 1103
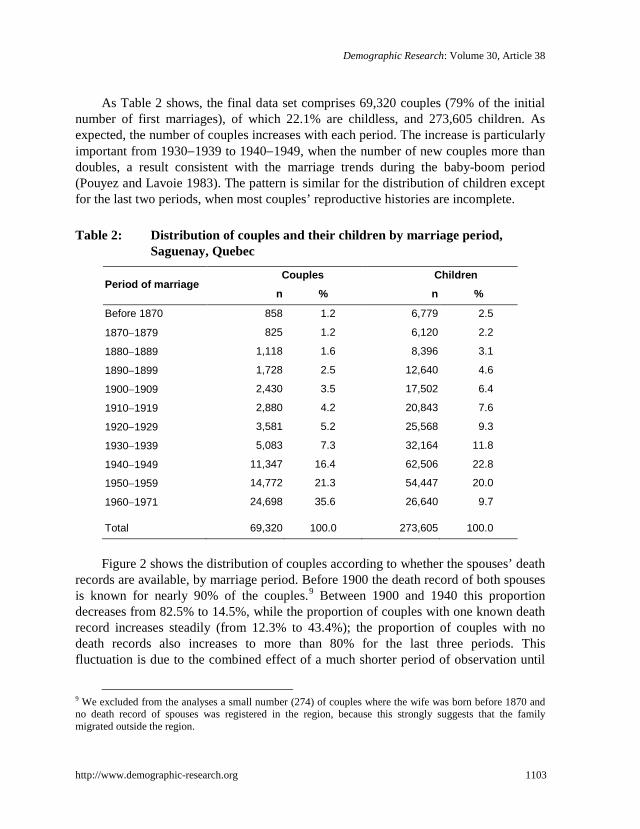
As Table 2 shows, the final data set comprises 69,320 couples (79% of the initial number of first marriages), of which 22.1% are childless, and 273,605 children. As expected, the number of couples increases with each period. The increase is particularly important from 1930−1939 to 1940−1949, when the number of new couples more than doubles, a result consistent with the marriage trends during the baby-boom period (Pouyez and Lavoie 1983). The pattern is similar for the distribution of children except for the last two periods, when most couples’ reproductive histories are incomplete.
Table 2: Distribution of couples and their children by marriage period,
Saguenay, Quebec
Period of marriage Couples Children
n % n %
Before 1870 858 1.2 6,779 2.5
1870−1879 825 1.2 6,120 2.2
1880−1889 1,118 1.6 8,396 3.1
1890−1899 1,728 2.5 12,640 4.6
1900−1909 2,430 3.5 17,502 6.4
1910−1919 2,880 4.2 20,843 7.6
1920−1929 3,581 5.2 25,568 9.3
1930−1939 5,083 7.3 32,164 11.8
1940−1949 11,347 16.4 62,506 22.8
1950−1959 14,772 21.3 54,447 20.0
1960−1971 24,698 35.6 26,640 9.7
Total 69,320 100.0 273,605 100.0
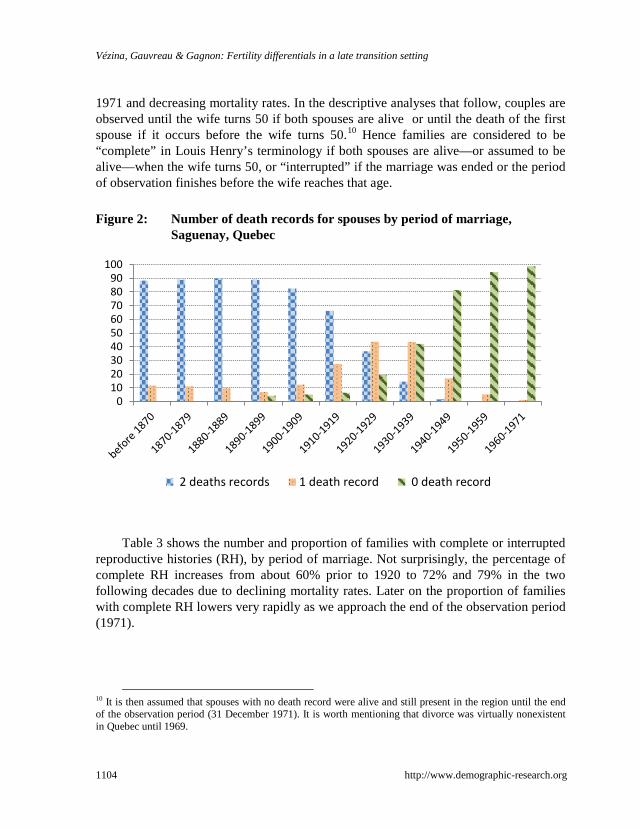
Figure 2 shows the distribution of couples according to whether the spouses’ death
records are available, by marriage period. Before 1900 the death record of both spouses is known for nearly 90% of the couples.9 Between 1900 and 1940 this proportion decreases from 82.5% to 14.5%, while the proportion of couples with one known death record increases steadily (from 12.3% to 43.4%); the proportion of couples with no death records also increases to more than 80% for the last three periods. This fluctuation is due to the combined effect of a much shorter period of observation until
9 We excluded from the analyses a small number (274) of couples where the wife was born before 1870 and no death record of spouses was registered in the region, because this strongly suggests that the family migrated outside the region.
Vézina, Gauvreau & Gagnon: Fertility differentials in a late transition setting
1104 http://www.demographic-research.org
1971 and decreasing mortality rates. In the descriptive analyses that follow, couples are observed until the wife turns 50 if both spouses are alive or until the death of the first spouse if it occurs before the wife turns 50.10 Hence families are considered to be “complete” in Louis Henry’s terminology if both spouses are alive—or assumed to be alive—when the wife turns 50, or “interrupted” if the marriage was ended or the period of observation finishes before the wife reaches that age.
Figure 2: Number of death records for spouses by period of marriage,
Saguenay, Quebec
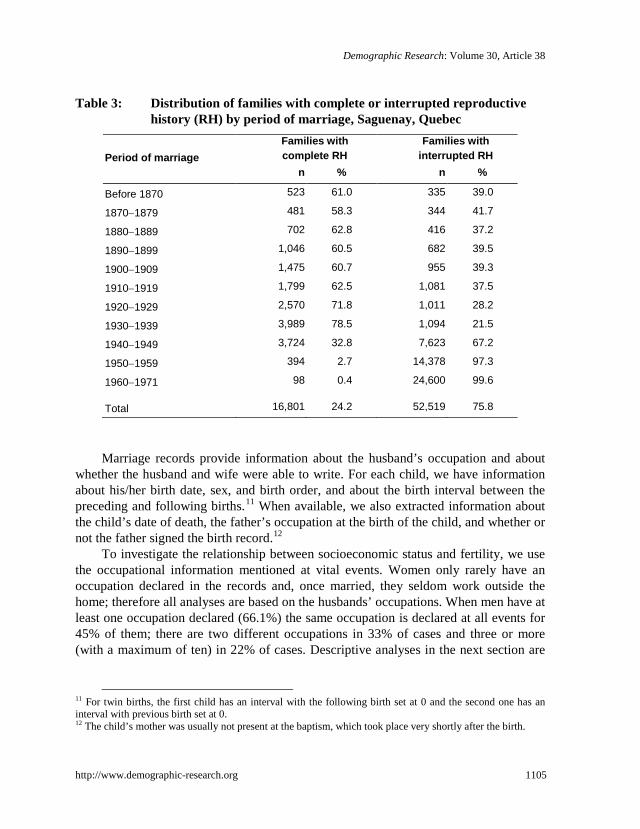
Table 3 shows the number and proportion of families with complete or interrupted
reproductive histories (RH), by period of marriage. Not surprisingly, the percentage of complete RH increases from about 60% prior to 1920 to 72% and 79% in the two following decades due to declining mortality rates. Later on the proportion of families with complete RH lowers very rapidly as we approach the end of the observation period (1971).
10 It is then assumed that spouses with no death record were alive and still present in the region until the end of the observation period (31 December 1971). It is worth mentioning that divorce was virtually nonexistent in Quebec until 1969.
0102030405060708090
100
2 deaths records 1 death record 0 death record
Demographic Research: Volume 30, Article 38
http://www.demographic-research.org 1105
Table 3: Distribution of families with complete or interrupted reproductive history (RH) by period of marriage, Saguenay, Quebec
Period of marriage Families with complete RH
Families with interrupted RH
n % n %
Before 1870 523 61.0 335 39.0
1870−1879 481 58.3 344 41.7
1880−1889 702 62.8 416 37.2
1890−1899 1,046 60.5 682 39.5
1900−1909 1,475 60.7 955 39.3
1910−1919 1,799 62.5 1,081 37.5
1920−1929 2,570 71.8 1,011 28.2
1930−1939 3,989 78.5 1,094 21.5
1940−1949 3,724 32.8 7,623 67.2
1950−1959 394 2.7 14,378 97.3
1960−1971 98 0.4 24,600 99.6
Total 16,801 24.2 52,519 75.8
Marriage records provide information about the husband’s occupation and about
whether the husband and wife were able to write. For each child, we have information about his/her birth date, sex, and birth order, and about the birth interval between the preceding and following births.11 When available, we also extracted information about the child’s date of death, the father’s occupation at the birth of the child, and whether or not the father signed the birth record.12
To investigate the relationship between socioeconomic status and fertility, we use the occupational information mentioned at vital events. Women only rarely have an occupation declared in the records and, once married, they seldom work outside the home; therefore all analyses are based on the husbands’ occupations. When men have at least one occupation declared (66.1%) the same occupation is declared at all events for 45% of them; there are two different occupations in 33% of cases and three or more (with a maximum of ten) in 22% of cases. Descriptive analyses in the next section are
11 For twin births, the first child has an interval with the following birth set at 0 and the second one has an interval with previous birth set at 0. 12 The child’s mother was usually not present at the baptism, which took place very shortly after the birth.
Vézina, Gauvreau & Gagnon: Fertility differentials in a late transition setting
1106 http://www.demographic-research.org
based on the modal occupation of the father at the child’s baptism.13 Multivariate analyses are based on the occupation at the time of the event or, if not available, at the time of the previous event. All occupations are HISCO-coded (van Leeuwen, Maas, and Miles 2002) and grouped according to the HISCLASS scheme (van Leeuwen and Maas 2011). Due to small numbers in some of the 12 HISCLASS categories, these were grouped into four classes: non-manual workers (HISCLASS 1−5), skilled workers (HISCLASS 6-7), lower and unskilled workers (HISCLASS 9, 11), and farmers (HISCLASS 8, 10, 12).
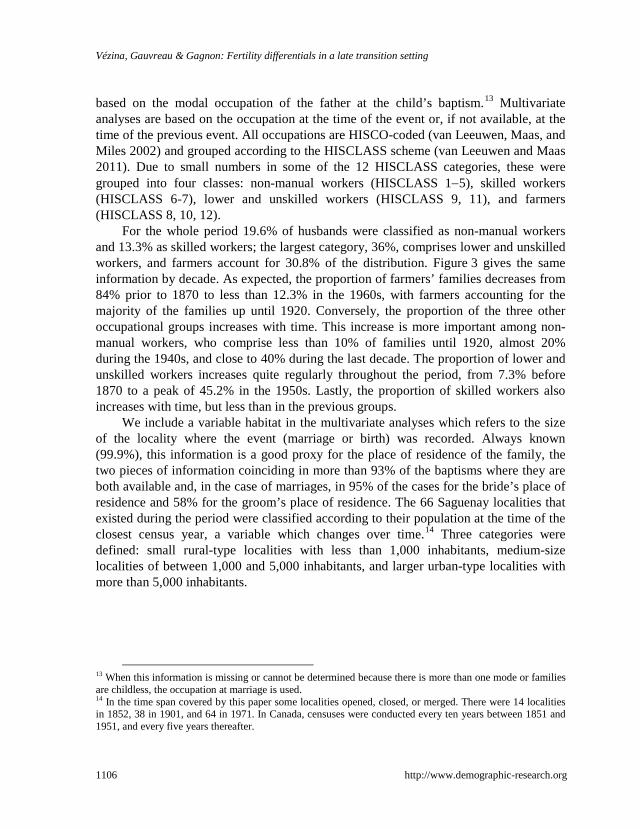
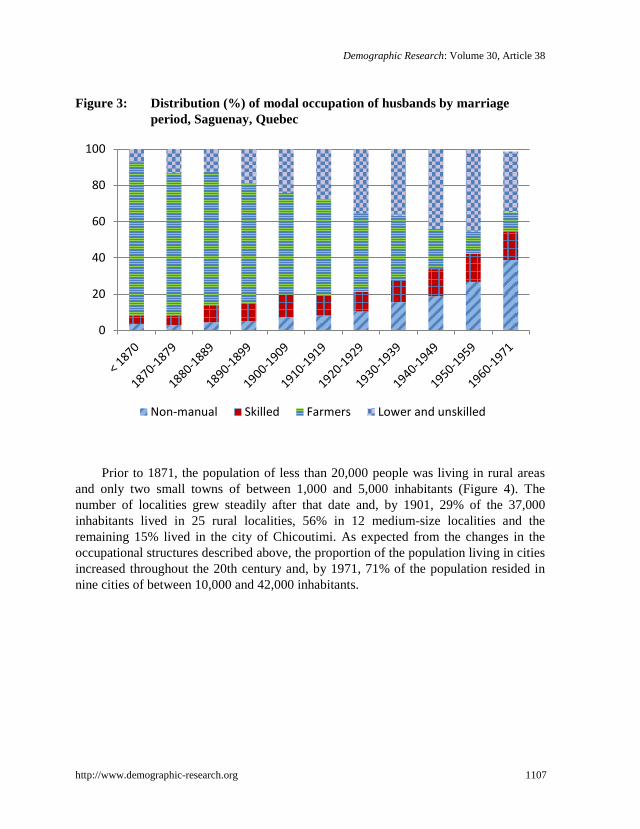
For the whole period 19.6% of husbands were classified as non-manual workers and 13.3% as skilled workers; the largest category, 36%, comprises lower and unskilled workers, and farmers account for 30.8% of the distribution. Figure 3 gives the same information by decade. As expected, the proportion of farmers’ families decreases from 84% prior to 1870 to less than 12.3% in the 1960s, with farmers accounting for the majority of the families up until 1920. Conversely, the proportion of the three other occupational groups increases with time. This increase is more important among non-manual workers, who comprise less than 10% of families until 1920, almost 20% during the 1940s, and close to 40% during the last decade. The proportion of lower and unskilled workers increases quite regularly throughout the period, from 7.3% before 1870 to a peak of 45.2% in the 1950s. Lastly, the proportion of skilled workers also increases with time, but less than in the previous groups.
We include a variable habitat in the multivariate analyses which refers to the size of the locality where the event (marriage or birth) was recorded. Always known (99.9%), this information is a good proxy for the place of residence of the family, the two pieces of information coinciding in more than 93% of the baptisms where they are both available and, in the case of marriages, in 95% of the cases for the bride’s place of residence and 58% for the groom’s place of residence. The 66 Saguenay localities that existed during the period were classified according to their population at the time of the closest census year, a variable which changes over time.14 Three categories were defined: small rural-type localities with less than 1,000 inhabitants, medium-size localities of between 1,000 and 5,000 inhabitants, and larger urban-type localities with more than 5,000 inhabitants.
13 When this information is missing or cannot be determined because there is more than one mode or families are childless, the occupation at marriage is used. 14 In the time span covered by this paper some localities opened, closed, or merged. There were 14 localities in 1852, 38 in 1901, and 64 in 1971. In Canada, censuses were conducted every ten years between 1851 and 1951, and every five years thereafter.
Demographic Research: Volume 30, Article 38
http://www.demographic-research.org 1107
Figure 3: Distribution (%) of modal occupation of husbands by marriage period, Saguenay, Quebec
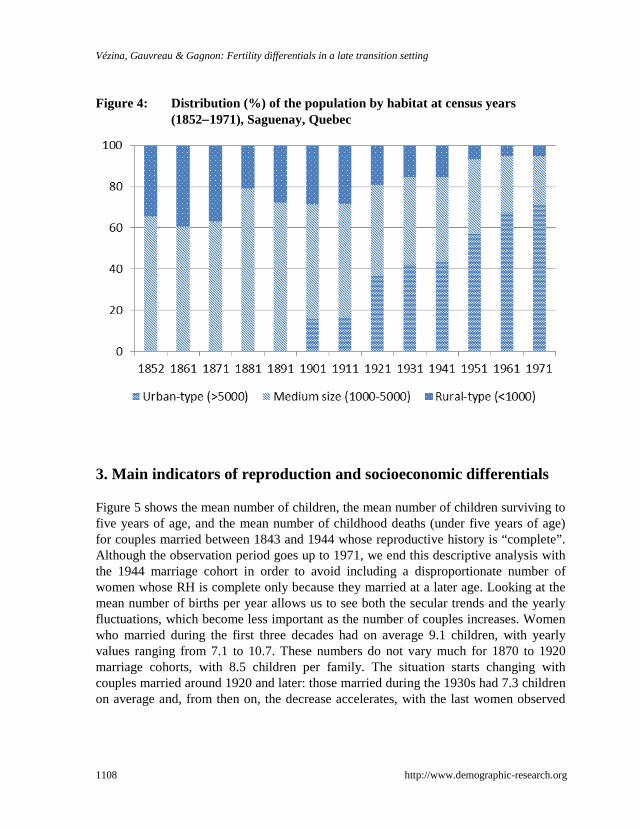
Prior to 1871, the population of less than 20,000 people was living in rural areas
and only two small towns of between 1,000 and 5,000 inhabitants (Figure 4). The number of localities grew steadily after that date and, by 1901, 29% of the 37,000 inhabitants lived in 25 rural localities, 56% in 12 medium-size localities and the remaining 15% lived in the city of Chicoutimi. As expected from the changes in the occupational structures described above, the proportion of the population living in cities increased throughout the 20th century and, by 1971, 71% of the population resided in nine cities of between 10,000 and 42,000 inhabitants.
0
20
40
60
80
100
Non-manual Skilled Farmers Lower and unskilled
Vézina, Gauvreau & Gagnon: Fertility differentials in a late transition setting
1108 http://www.demographic-research.org
Figure 4: Distribution (%) of the population by habitat at census years (1852−1971), Saguenay, Quebec
3. Main indicators of reproduction and socioeconomic differentials
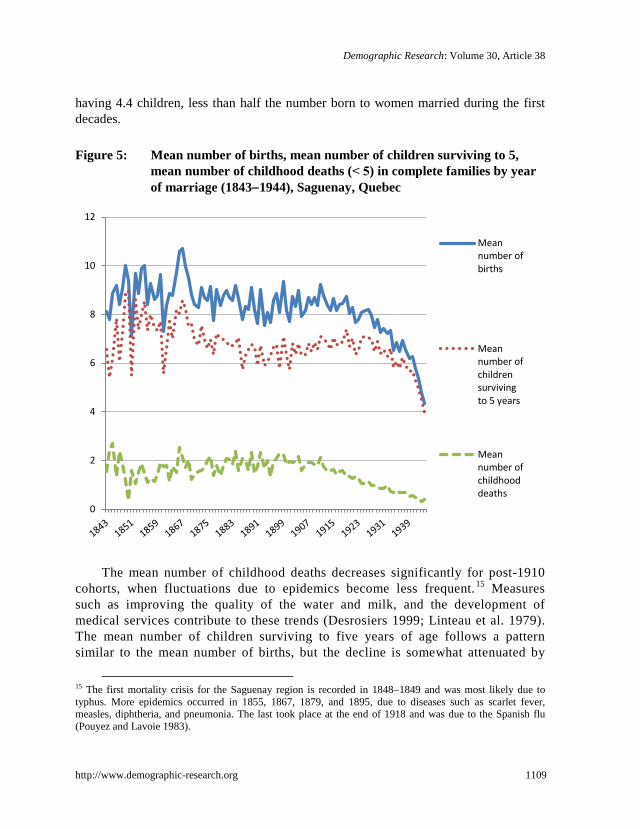
Figure 5 shows the mean number of children, the mean number of children surviving to five years of age, and the mean number of childhood deaths (under five years of age) for couples married between 1843 and 1944 whose reproductive history is “complete”. Although the observation period goes up to 1971, we end this descriptive analysis with the 1944 marriage cohort in order to avoid including a disproportionate number of women whose RH is complete only because they married at a later age. Looking at the mean number of births per year allows us to see both the secular trends and the yearly fluctuations, which become less important as the number of couples increases. Women who married during the first three decades had on average 9.1 children, with yearly values ranging from 7.1 to 10.7. These numbers do not vary much for 1870 to 1920 marriage cohorts, with 8.5 children per family. The situation starts changing with couples married around 1920 and later: those married during the 1930s had 7.3 children on average and, from then on, the decrease accelerates, with the last women observed
Demographic Research: Volume 30, Article 38
http://www.demographic-research.org 1109
having 4.4 children, less than half the number born to women married during the first decades.
Figure 5: Mean number of births, mean number of children surviving to 5,
mean number of childhood deaths (˂ 5) in complete families by year of marriage (1843−1944), Saguenay, Quebec
The mean number of childhood deaths decreases significantly for post-1910 cohorts, when fluctuations due to epidemics become less frequent.15 Measures such as improving the quality of the water and milk, and the development of medical services contribute to these trends (Desrosiers 1999; Linteau et al. 1979). The mean number of children surviving to five years of age follows a pattern similar to the mean number of births, but the decline is somewhat attenuated by
15 The first mortality crisis for the Saguenay region is recorded in 1848−1849 and was most likely due to typhus. More epidemics occurred in 1855, 1867, 1879, and 1895, due to diseases such as scarlet fever, measles, diphtheria, and pneumonia. The last took place at the end of 1918 and was due to the Spanish flu (Pouyez and Lavoie 1983).
0
2
4
6
8
10
12
Meannumber ofbirths
Meannumber ofchildrensurvivingto 5 years
Meannumber ofchildhooddeaths
Vézina, Gauvreau & Gagnon: Fertility differentials in a late transition setting
1110 http://www.demographic-research.org
increased survival rates. As predicted by the transition model, the gap between these two indicators narrows as the mean number of childhood deaths diminishes. For a short period of time (1910−1925 cohorts), this decrease leads to an increase in the number of surviving children from 6.5 to 6.9; but as the number of births decreases, the number of surviving children eventually also follows a downward trend. Couples married before 1880 experienced the death before the age of five of 1.6 children on average, a value which increases to 1.9 for the 1880-1909 cohorts,16 before getting progressively much lower.
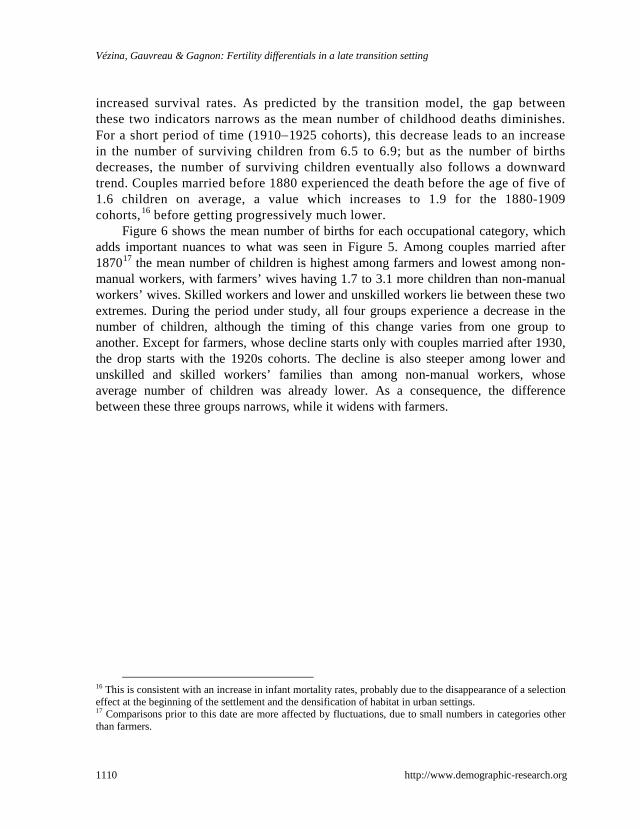
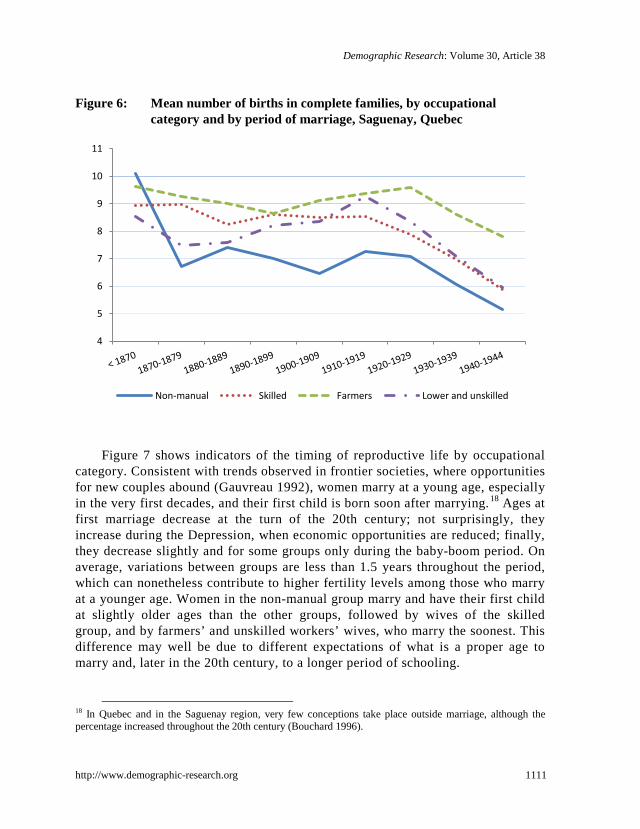
Figure 6 shows the mean number of births for each occupational category, which adds important nuances to what was seen in Figure 5. Among couples married after 187017 the mean number of children is highest among farmers and lowest among non-manual workers, with farmers’ wives having 1.7 to 3.1 more children than non-manual workers’ wives. Skilled workers and lower and unskilled workers lie between these two extremes. During the period under study, all four groups experience a decrease in the number of children, although the timing of this change varies from one group to another. Except for farmers, whose decline starts only with couples married after 1930, the drop starts with the 1920s cohorts. The decline is also steeper among lower and unskilled and skilled workers’ families than among non-manual workers, whose average number of children was already lower. As a consequence, the difference between these three groups narrows, while it widens with farmers.
16 This is consistent with an increase in infant mortality rates, probably due to the disappearance of a selection effect at the beginning of the settlement and the densification of habitat in urban settings. 17 Comparisons prior to this date are more affected by fluctuations, due to small numbers in categories other than farmers.
Demographic Research: Volume 30, Article 38
http://www.demographic-research.org 1111
Figure 6: Mean number of births in complete families, by occupational category and by period of marriage, Saguenay, Quebec
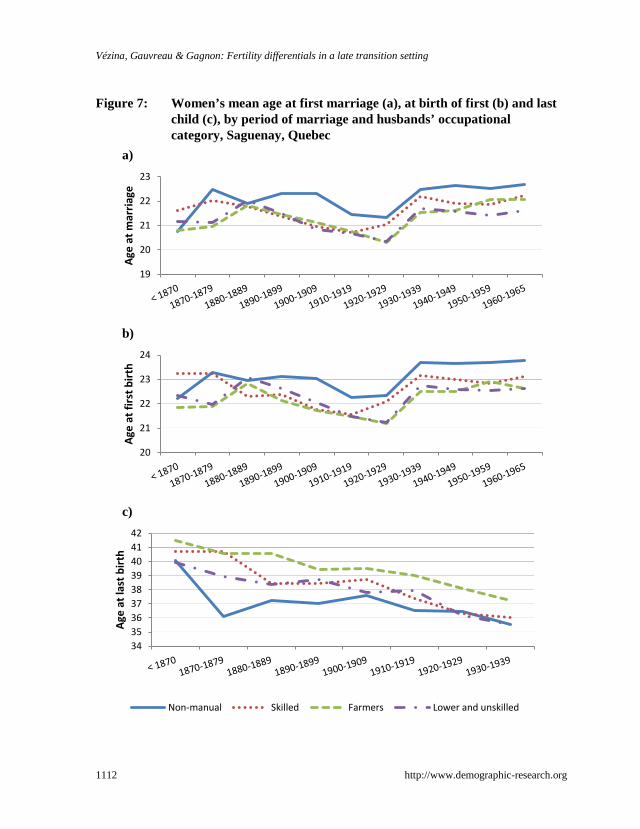
Figure 7 shows indicators of the timing of reproductive life by occupational
category. Consistent with trends observed in frontier societies, where opportunities for new couples abound (Gauvreau 1992), women marry at a young age, especially in the very first decades, and their first child is born soon after marrying.18 Ages at first marriage decrease at the turn of the 20th century; not surprisingly, they increase during the Depression, when economic opportunities are reduced; finally, they decrease slightly and for some groups only during the baby-boom period. On average, variations between groups are less than 1.5 years throughout the period, which can nonetheless contribute to higher fertility levels among those who marry at a younger age. Women in the non-manual group marry and have their first child at slightly older ages than the other groups, followed by wives of the skilled group, and by farmers’ and unskilled workers’ wives, who marry the soonest. This difference may well be due to different expectations of what is a proper age to marry and, later in the 20th century, to a longer period of schooling.
18 In Quebec and in the Saguenay region, very few conceptions take place outside marriage, although the percentage increased throughout the 20th century (Bouchard 1996).
4
5
6
7
8
9
10
11
Non-manual Skilled Farmers Lower and unskilled
Vézina, Gauvreau & Gagnon: Fertility differentials in a late transition setting
1112 http://www.demographic-research.org
Figure 7: Women’s mean age at first marriage (a), at birth of first (b) and last child (c), by period of marriage and husbands’ occupational category, Saguenay, Quebec
a)
b)
c)
19
20
21
22
23
Age
at m
arria
ge
20
21
22
23
24
Age
at fi
rst b
irth
343536373839404142
Age
at la
st b
irth
Non-manual Skilled Farmers Lower and unskilled
Demographic Research: Volume 30, Article 38
http://www.demographic-research.org 1113
Ages at last birth show a four-year decline between couples married at the beginning and at the end of the period (Figure 7c). These trends vary somewhat by occupational category, suggesting differential stopping behavior once a “proper” size of family is attained. In the non-manual group, age at last birth fluctuates slightly until the 1900−1909 decade, which could be attributed to the small size of this group,19 at which point it starts decreasing steadily. Among skilled and lower and unskilled workers’ families, age at last birth also fluctuates until the beginning of the 20th century but is consistently higher than in the non-manual workers’ families during this period. These differences disappear progressively, as couples that married in the 1920s and the 1930s display very similar patterns. Age at last birth in farmers’ families is the highest of all groups, but the decrease, which occurs later, is of about the same magnitude.
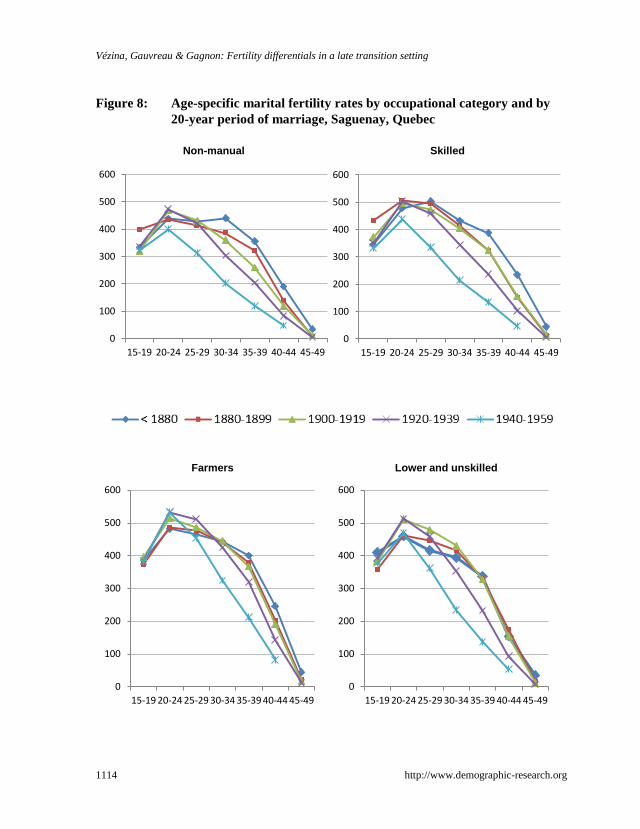
Age-specific marital fertility rates by occupational category (Figure 8) provide a more detailed picture of the progressive decline within families, which starts with the non-manual families, followed by the families of the skilled and the lower and unskilled workers, and then the farmers’ families. Following a well-known pattern of fertility transition, older married women (over 30) are the first to experience a significant fertility decline. The progression from one 20-year marriage cohort to the next is steady for non-manual workers’ wives, and very similar for skilled workers’ wives, with the exception of one cohort (1900−1919). The decline in low-skilled workers’ families becomes visible only with marriages between 1920 and 1940, while farmers stand out with a later decline and even higher rates. There is no sign of any significant decrease prior to the age of 30 until the last cohort of marriages (1940−1959) and the farmers’ wives do not participate at all in that trend. As a matter of fact, a slight increase in marital fertility rates at ages 20−24 and 25−29 can even be observed among farmers’ wives up to the 1920−1939 cohort of marriages, and among low-skilled workers’ wives up to the 1910−1929 cohort.
19 Except for farmers, the size of the groups is below 100 for the three first decades.
Vézina, Gauvreau & Gagnon: Fertility differentials in a late transition setting
1114 http://www.demographic-research.org
Figure 8: Age-specific marital fertility rates by occupational category and by 20-year period of marriage, Saguenay, Quebec
0
100
200
300
400
500
600
15-19 20-24 25-29 30-34 35-39 40-44 45-49
Non-manual
0
100
200
300
400
500
600
15-19 20-24 25-29 30-34 35-39 40-44 45-49
Skilled
0
100
200
300
400
500
600
15-19 20-24 25-29 30-34 35-39 40-44 45-49
Farmers
0
100
200
300
400
500
600
15-19 20-24 25-29 30-34 35-39 40-44 45-49
Lower and unskilled
Demographic Research: Volume 30, Article 38
http://www.demographic-research.org 1115
Looking back at Figures 6 and 7a, it seems that the increase observed in the mean number of children for farmers’ and lower and unskilled workers’ wives married (roughly) between 1890 and 1930 (Figure 6) is the outcome of a lower age at marriage (Figure 7a) and higher marital fertility rates at early ages. Among skilled workers’ wives, the age at marriage also lowers, but so do the marital fertility rates, which is consistent with the relative stability of their family size prior to the 1920s cohort. No systematic pattern of this kind emerges for non-manual workers’ wives, whose higher age at marriage and declining fertility rates combine to produce smaller family sizes (Figure 6). Occupational differentials in women’s age at first marriage and the pace of marital fertility decline most often reinforce each other to produce a widening of socioeconomic differentials in the number of children.
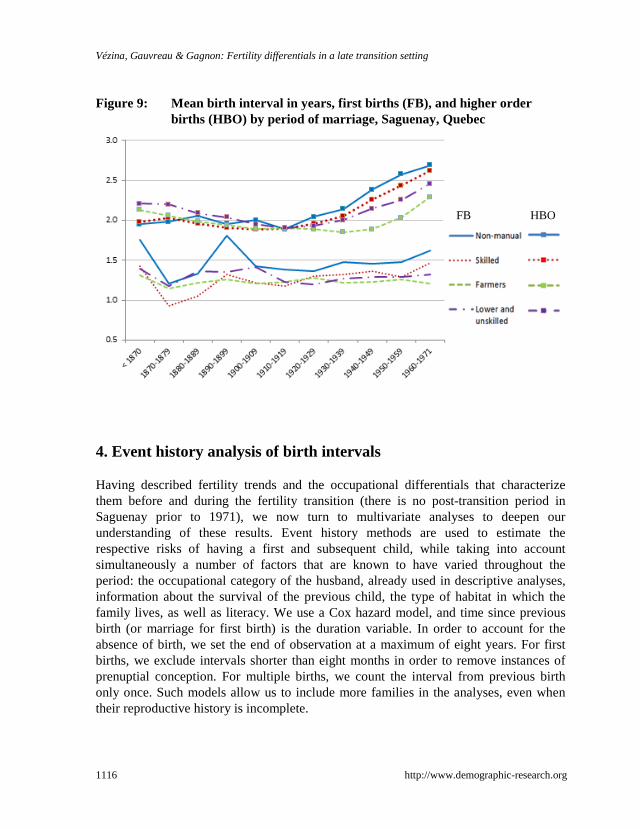
Finally, Figure 9 shows the trends in first and higher order birth intervals, by occupational category. Consistent with the trends observed for age-specific fertility rates, changes are most obvious for higher order birth intervals. Among non-manual and skilled workers, and to a lesser extent among lower and unskilled workers, an increase in higher order birth intervals is observed for couples married after 1920; a similar change for farmers takes place only much later for couples married in 1950−1959. Higher order birth intervals include all intervals except the first one. Given that there is hardly any lengthening of low parity intervals (see marital fertility rates below the age of 30 in Figure 8), longer intervals at higher parities can be detected only when the fertility decrease has reached a certain stage. Very few changes affect first birth intervals, although the slight increase for the last cohorts may signal the beginning of a waiting period between marriage and first birth, made possible by the availability of the contraceptive pill. Intervals are slightly longer for non-manual workers’ families.
Vézina, Gauvreau & Gagnon: Fertility differentials in a late transition setting
1116 http://www.demographic-research.org
Figure 9: Mean birth interval in years, first births (FB), and higher order births (HBO) by period of marriage, Saguenay, Quebec
4. Event history analysis of birth intervals
Having described fertility trends and the occupational differentials that characterize them before and during the fertility transition (there is no post-transition period in Saguenay prior to 1971), we now turn to multivariate analyses to deepen our understanding of these results. Event history methods are used to estimate the respective risks of having a first and subsequent child, while taking into account simultaneously a number of factors that are known to have varied throughout the period: the occupational category of the husband, already used in descriptive analyses, information about the survival of the previous child, the type of habitat in which the family lives, as well as literacy. We use a Cox hazard model, and time since previous birth (or marriage for first birth) is the duration variable. In order to account for the absence of birth, we set the end of observation at a maximum of eight years. For first births, we exclude intervals shorter than eight months in order to remove instances of prenuptial conception. For multiple births, we count the interval from previous birth only once. Such models allow us to include more families in the analyses, even when their reproductive history is incomplete.
FB HBO
Demographic Research: Volume 30, Article 38
http://www.demographic-research.org 1117
Both series of intervals were estimated separately for three periods (<1900, 1900−1939, and 1940−1971), which can roughly be seen as pre-transition, onset of transition, and transition periods. In order to account for fertility variation within each of these periods, we entered separate decades in the models, the reference category being the earliest. The age of the mother at birth of the previous child (or at marriage for first births), occupational category, literacy (based on whether the father signed or did not sign the birth record for higher birth intervals and whether husband and wife signed the marriage record for first birth intervals), size of the locality where the birth was recorded—small (<1,000), medium (1,000−5,000) or large (>5,000)—and the survival status of the previous child were also included as covariates. For both types of intervals, another set of analyses was conducted, considering each occupational category separately and using the same covariates.
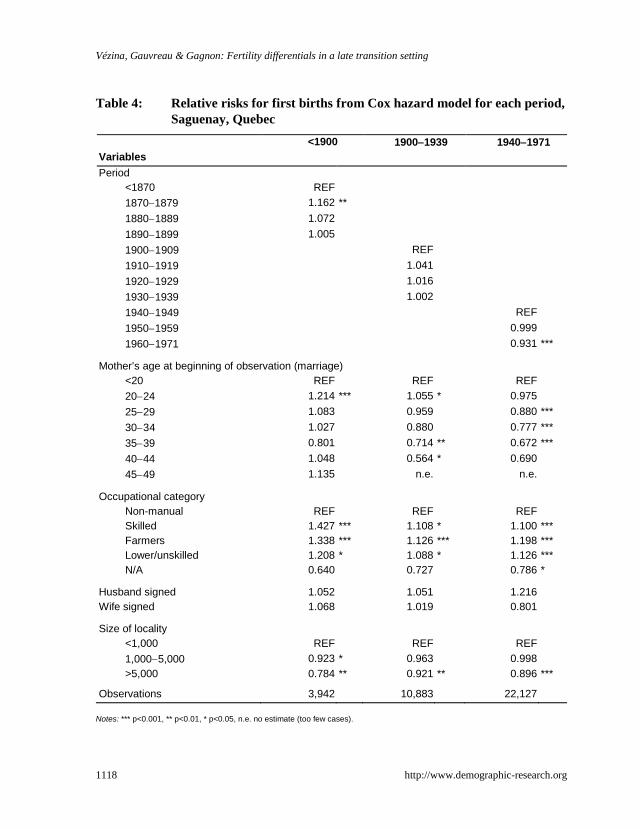
Table 4 shows relative risks for intervals between marriage and first birth for each period. As expected, older women are less likely to bear a first child in a short period of time and this result is quite consistent in the last two periods, where all significant results are below 1 except for ages 20−24. For occupational categories, the reference group is non-manual workers and the risks are systematically higher for the three other groups in all three periods. Prior to 1900, the risks are 21% to 43% higher; in the two other periods, the gap narrows, especially for skilled workers, but the relative risks remain 9% to 20% higher. Women living in more populated areas have significantly lower risks of giving birth to a first child when compared to women living in rural settings. The difference in relative risks is about 22% before 1900 and goes down to about 10% in the two other periods. There is almost no difference between women living in the intermediate category of localities and those living in rural settings. The literacy variable does not yield any significant result when all the other variables are taken into account. Finally, the models for the three periods suggest that only during the very last decade, in comparison with the1940−1949 decade, do some couples start delaying the birth of their first child, possibly after the contraceptive pill has become available. In comparison with the 1940−1949 decade, the risk is reduced by 7%.
Vézina, Gauvreau & Gagnon: Fertility differentials in a late transition setting
1118 http://www.demographic-research.org
Table 4: Relative risks for first births from Cox hazard model for each period, Saguenay, Quebec
<1900 1900−1939 1940−1971 Variables Period <1870 REF 1870−1879 1.162 ** 1880−1889 1.072 1890−1899 1.005 1900−1909 REF 1910−1919 1.041 1920−1929 1.016 1930−1939 1.002 1940−1949 REF 1950−1959 0.999 1960−1971 0.931 ***
Mother’s age at beginning of observation (marriage) <20 REF REF REF 20−24 1.214 *** 1.055 * 0.975 25−29 1.083 0.959 0.880 *** 30−34 1.027 0.880 0.777 *** 35−39 0.801 0.714 ** 0.672 *** 40−44 1.048 0.564 * 0.690 45−49 1.135 n.e. n.e.
Occupational category Non-manual REF REF REF Skilled 1.427 *** 1.108 * 1.100 *** Farmers 1.338 *** 1.126 *** 1.198 *** Lower/unskilled 1.208 * 1.088 * 1.126 *** N/A 0.640 0.727 0.786 *
Husband signed 1.052 1.051 1.216 Wife signed 1.068 1.019 0.801
Size of locality <1,000 REF REF REF 1,000−5,000 0.923 * 0.963 0.998 >5,000 0.784 ** 0.921 ** 0.896 ***
Observations 3,942 10,883 22,127 Notes: *** p<0.001, ** p<0.01, * p<0.05, n.e. no estimate (too few cases).
Demographic Research: Volume 30, Article 38
http://www.demographic-research.org 1119
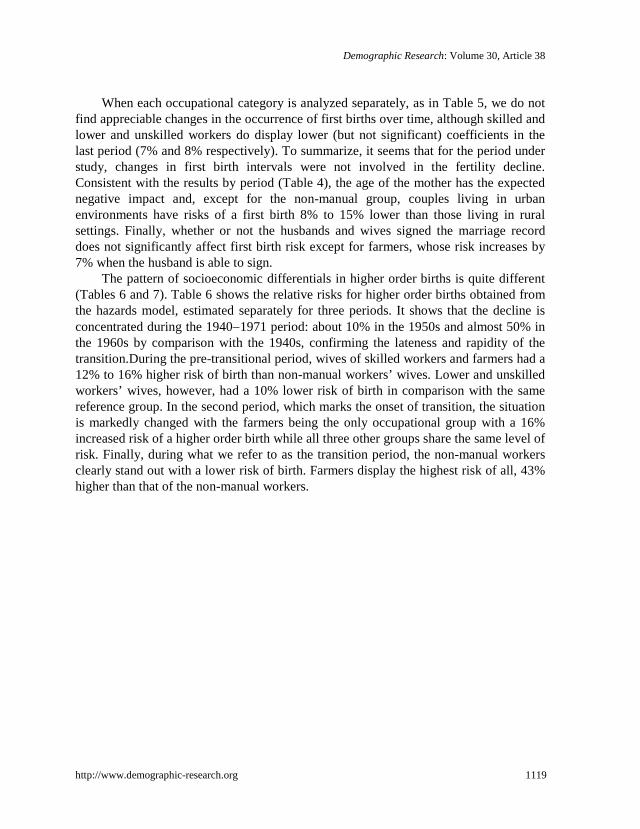
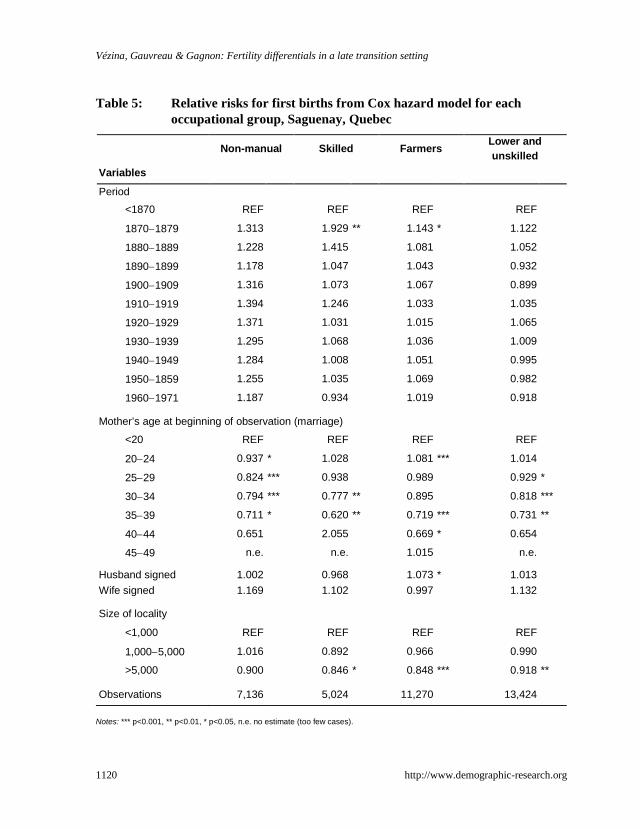
When each occupational category is analyzed separately, as in Table 5, we do not find appreciable changes in the occurrence of first births over time, although skilled and lower and unskilled workers do display lower (but not significant) coefficients in the last period (7% and 8% respectively). To summarize, it seems that for the period under study, changes in first birth intervals were not involved in the fertility decline. Consistent with the results by period (Table 4), the age of the mother has the expected negative impact and, except for the non-manual group, couples living in urban environments have risks of a first birth 8% to 15% lower than those living in rural settings. Finally, whether or not the husbands and wives signed the marriage record does not significantly affect first birth risk except for farmers, whose risk increases by 7% when the husband is able to sign.
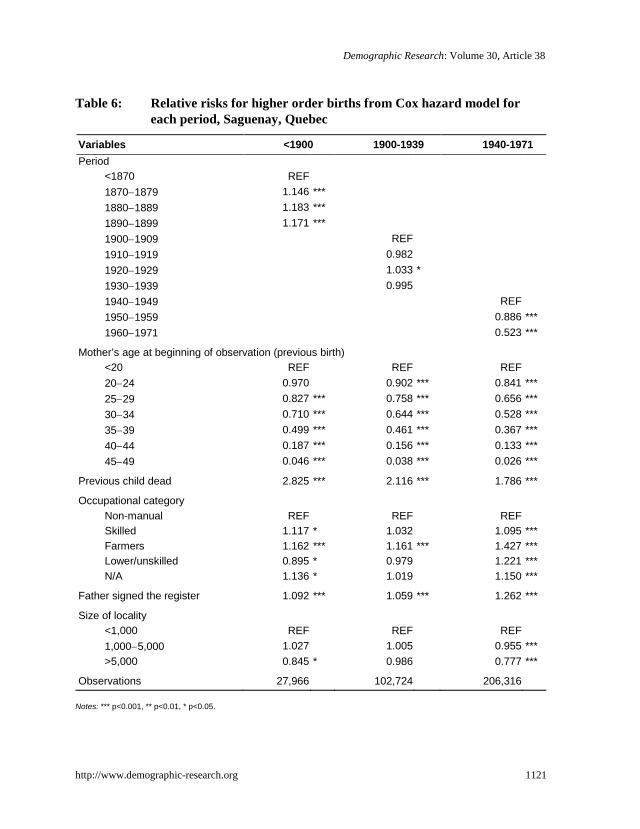
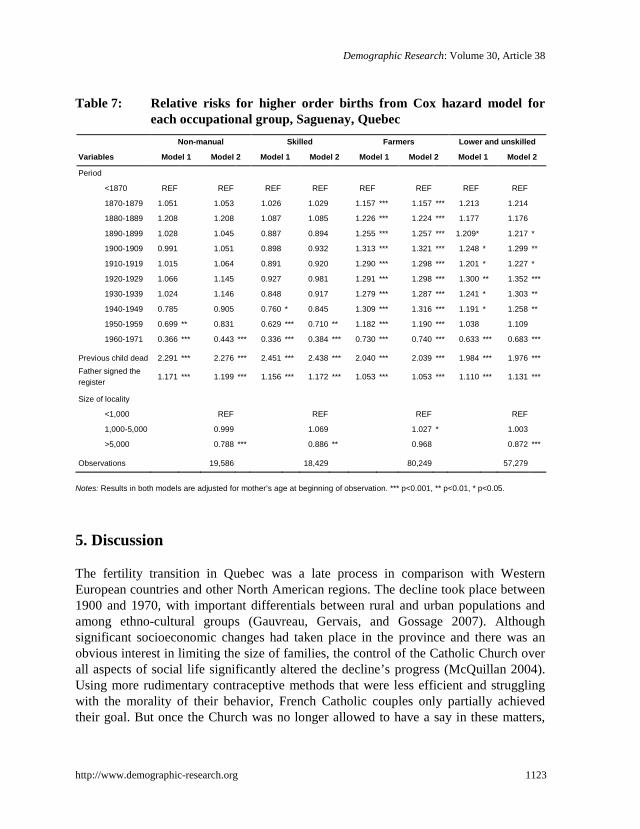
The pattern of socioeconomic differentials in higher order births is quite different (Tables 6 and 7). Table 6 shows the relative risks for higher order births obtained from the hazards model, estimated separately for three periods. It shows that the decline is concentrated during the 1940−1971 period: about 10% in the 1950s and almost 50% in the 1960s by comparison with the 1940s, confirming the lateness and rapidity of the transition.During the pre-transitional period, wives of skilled workers and farmers had a 12% to 16% higher risk of birth than non-manual workers’ wives. Lower and unskilled workers’ wives, however, had a 10% lower risk of birth in comparison with the same reference group. In the second period, which marks the onset of transition, the situation is markedly changed with the farmers being the only occupational group with a 16% increased risk of a higher order birth while all three other groups share the same level of risk. Finally, during what we refer to as the transition period, the non-manual workers clearly stand out with a lower risk of birth. Farmers display the highest risk of all, 43% higher than that of the non-manual workers.
Vézina, Gauvreau & Gagnon: Fertility differentials in a late transition setting
1120 http://www.demographic-research.org
Table 5: Relative risks for first births from Cox hazard model for each occupational group, Saguenay, Quebec
Non-manual Skilled Farmers Lower and unskilled
Variables
Period <1870 REF REF REF REF
1870−1879 1.313 1.929 ** 1.143 * 1.122
1880−1889 1.228 1.415 1.081 1.052
1890−1899 1.178 1.047 1.043 0.932
1900−1909 1.316 1.073 1.067 0.899
1910−1919 1.394 1.246 1.033 1.035
1920−1929 1.371 1.031 1.015 1.065
1930−1939 1.295 1.068 1.036 1.009
1940−1949 1.284 1.008 1.051 0.995
1950−1859 1.255 1.035 1.069 0.982
1960−1971 1.187 0.934 1.019 0.918
Mother’s age at beginning of observation (marriage)
<20 REF REF REF REF
20−24 0.937 * 1.028 1.081 *** 1.014
25−29 0.824 *** 0.938 0.989 0.929 *
30−34 0.794 *** 0.777 ** 0.895 0.818 ***
35−39 0.711 * 0.620 ** 0.719 *** 0.731 **
40−44 0.651 2.055 0.669 * 0.654
45−49 n.e. n.e. 1.015 n.e.
Husband signed 1.002 0.968 1.073 * 1.013 Wife signed 1.169 1.102 0.997 1.132
Size of locality
<1,000 REF REF REF REF
1,000−5,000 1.016 0.892 0.966 0.990
>5,000 0.900 0.846 * 0.848 *** 0.918 **
Observations 7,136 5,024 11,270 13,424 Notes: *** p<0.001, ** p<0.01, * p<0.05, n.e. no estimate (too few cases).
Demographic Research: Volume 30, Article 38
http://www.demographic-research.org 1121
Table 6: Relative risks for higher order births from Cox hazard model for each period, Saguenay, Quebec
Variables <1900 1900-1939 1940-1971 Period <1870 REF 1870−1879 1.146 *** 1880−1889 1.183 *** 1890−1899 1.171 *** 1900−1909 REF 1910−1919 0.982 1920−1929 1.033 * 1930−1939 0.995 1940−1949 REF 1950−1959 0.886 *** 1960−1971 0.523 ***
Mother’s age at beginning of observation (previous birth) <20 REF REF REF 20−24 0.970 0.902 *** 0.841 *** 25−29 0.827 *** 0.758 *** 0.656 *** 30−34 0.710 *** 0.644 *** 0.528 *** 35−39 0.499 *** 0.461 *** 0.367 *** 40−44 0.187 *** 0.156 *** 0.133 *** 45−49 0.046 *** 0.038 *** 0.026 ***
Previous child dead 2.825 *** 2.116 *** 1.786 ***
Occupational category Non-manual REF REF REF Skilled 1.117 * 1.032 1.095 *** Farmers 1.162 *** 1.161 *** 1.427 *** Lower/unskilled 0.895 * 0.979 1.221 *** N/A 1.136 * 1.019 1.150 ***
Father signed the register 1.092 *** 1.059 *** 1.262 ***
Size of locality <1,000 REF REF REF 1,000−5,000 1.027 1.005 0.955 *** >5,000 0.845 * 0.986 0.777 ***
Observations 27,966 102,724 206,316 Notes: *** p<0.001, ** p<0.01, * p<0.05.
Vézina, Gauvreau & Gagnon: Fertility differentials in a late transition setting
1122 http://www.demographic-research.org
For all three periods, the age of the mother has the expected negative impact on risks, while the death of the previous child has the expected positive impact. In the latter case, however, the effect decreases with time: before 1900 the risk of a subsequent birth is almost three times higher when the previous child is dead and after 1940 the excess in risk is down to 80%. Whether the father signed the register at the child’s baptism is positively associated with the risk of birth and this effect is more important in the last period, when only a tiny proportion of the population was unable to sign an official document. Living in larger urban localities tends to decrease the risk of higher order birth in the first and last periods, but not during the onset of the transition, when only the farmers (most of them living in rural areas) experience higher risks.
The two models in Table 7 point to some interesting results involving the variables “occupational category” and “size of the locality”. When the latter is not taken into account, non-manual workers and skilled workers are at the forefront of the decline, with significantly lower risks of a higher order birth starting in the 1940−1949 period (significant for skilled workers only), in comparison with the period prior to 1870. But when the size of the locality is also taken into account, the decrease becomes significant only in the following decade, although some decline is also visible in 1940−1949. This could indicate that the reduction of fertility among these groups partly operates through the urbanization process; as more and more non-manual and skilled workers lived in urban areas, more of them would have adopted the novel “ideas” about fertility control. The decline for lower and unskilled workers is apparent in 1950-1959 but becomes significant only in the following decade, at least in comparison with the 1870 period. Farmers seem to have experienced a particularly abrupt decline, going from a significantly higher risk in 1950−1959 (+19%) to a significantly lower risk of a higher order birth in the following period (-26%). Increased probabilities of a higher order birth through time during the first period (identified in Table 6) holds only for farmers and lower and unskilled workers to a lesser extent (Table 7). Finally, the death of the previous child and whether the father signed the register have similar positive impacts in all four occupational categories.
Demographic Research: Volume 30, Article 38
http://www.demographic-research.org 1123
Table 7: Relative risks for higher order births from Cox hazard model for each occupational group, Saguenay, Quebec
Non-manual Skilled Farmers Lower and unskilled
Variables Model 1 Model 2 Model 1 Model 2 Model 1 Model 2 Model 1 Model 2
Period
<1870 REF REF REF REF REF REF REF REF
1870-1879 1.051 1.053 1.026 1.029 1.157 *** 1.157 *** 1.213 1.214
1880-1889 1.208 1.208 1.087 1.085 1.226 *** 1.224 *** 1.177 1.176
1890-1899 1.028 1.045 0.887 0.894 1.255 *** 1.257 *** 1.209* 1.217 *
1900-1909 0.991 1.051 0.898 0.932 1.313 *** 1.321 *** 1.248 * 1.299 **
1910-1919 1.015 1.064 0.891 0.920 1.290 *** 1.298 *** 1.201 * 1.227 *
1920-1929 1.066 1.145 0.927 0.981 1.291 *** 1.298 *** 1.300 ** 1.352 ***
1930-1939 1.024 1.146 0.848 0.917 1.279 *** 1.287 *** 1.241 * 1.303 **
1940-1949 0.785 0.905 0.760 * 0.845 1.309 *** 1.316 *** 1.191 * 1.258 **
1950-1959 0.699 ** 0.831 0.629 *** 0.710 ** 1.182 *** 1.190 *** 1.038 1.109
1960-1971 0.366 *** 0.443 *** 0.336 *** 0.384 *** 0.730 *** 0.740 *** 0.633 *** 0.683 ***
Previous child dead 2.291 *** 2.276 *** 2.451 *** 2.438 *** 2.040 *** 2.039 *** 1.984 *** 1.976 *** Father signed the register
1.171 *** 1.199 *** 1.156 *** 1.172 *** 1.053 *** 1.053 *** 1.110 *** 1.131 ***
Size of locality
<1,000 REF REF REF REF
1,000-5,000 0.999 1.069 1.027 * 1.003
>5,000 0.788 *** 0.886 ** 0.968 0.872 ***
Observations 19,586 18,429 80,249 57,279
Notes: Results in both models are adjusted for mother’s age at beginning of observation. *** p<0.001, ** p<0.01, * p<0.05.
5. Discussion
The fertility transition in Quebec was a late process in comparison with Western European countries and other North American regions. The decline took place between 1900 and 1970, with important differentials between rural and urban populations and among ethno-cultural groups (Gauvreau, Gervais, and Gossage 2007). Although significant socioeconomic changes had taken place in the province and there was an obvious interest in limiting the size of families, the control of the Catholic Church over all aspects of social life significantly altered the decline’s progress (McQuillan 2004). Using more rudimentary contraceptive methods that were less efficient and struggling with the morality of their behavior, French Catholic couples only partially achieved their goal. But once the Church was no longer allowed to have a say in these matters,
Vézina, Gauvreau & Gagnon: Fertility differentials in a late transition setting
1124 http://www.demographic-research.org
the progression of the decline was as spectacular as the excessive fertility had previously been.
In Saguenay, as in other similar regions, the fertility transition was even more delayed than in more urbanized parts of Quebec and can be dated to as late as 1940-1949 for couples married in the 1920−1929 period. There are various reasons for this: the region was quite remote from the main cities of Montreal and Quebec; its rural sector remained very important until the 1930s; its population was almost exclusively French Catholic and less-educated than the Quebec average. Yet the development of the industrial sector in the first decades of the 20th century and the rapid urban growth that this triggered allow us to explore socioeconomic fertility differentials before and during the fertility transition in that region.
Descriptive analyses of fertility indicators clearly demonstrate that the fertility transition in the Saguenay region had nothing to do with postponing marriage or first births but was concentrated at the end of reproductive life. In this frontier region colonized in the mid-19th century, women married in their early 20s, and only under the harsh conditions of the Depression in the 1930s did they marry somewhat later. Fertility rates decreased at older ages, following a clear socioeconomic gradient from non-manual to skilled workers, to lower and unskilled workers, and then to farmers. What we know from the decline among the Catholic population in Quebec suggests that most couples adopted stopping practices once the family size was considered satisfactory, which often transformed into what looks like spacing practices given the rudimentary methods allowed by the Church during this period.
Multivariate analyses of the risk of a first birth and higher order births confirm the late timing of the transition and the occupational differentials that characterized it, as well as the quasi-absence of any change in the timing of first births, except in the very late period, where the availability of the pill may have led some couples to delay the first birth. Such analyses allow us to disentangle the role of the different factors that were expected to have an impact on the risk of a birth. Before and during the transition, the usual demographic factors—namely the age of the mother and the death of the previous child in the case of higher order birth intervals—had the expected impact on the risk of a birth. Despite a significant decline in infant and child mortality after 1915, the death of the previous child continued to significantly increase the risk of the next birth; this impact decreased with time, though, a possible consequence of shorter breastfeeding durations, no matter the destiny of the child. Most other variables also had a significant impact on the risk of a higher order birth, net of the effect of the others. The period has mixed effects, with increased risks at first for lower and unskilled workers and farmers, consistent with the increase apparent in the marital fertility rates at ages 20−24 and 25−29 (second, third, and even fourth births), and decreased risks in all occupational categories toward the end of the period under study.
Demographic Research: Volume 30, Article 38
http://www.demographic-research.org 1125
The former may be linked to harsher living conditions for these groups at the beginning of the settlement, while the latter simply reflects the fertility decline. Couples living in urban settings always had lower birth risks, while literate husbands displayed significantly higher birth risks. This last result is consistent with what Bouchard and Roy (1991) found for the period prior to the transition, which might be due to the religious involvement of the elites at the time, but not with their findings for the rest of the period; our simultaneous control for other factors may explain the discrepancy, but we will have to look further into this result for a more thorough interpretation, including the fact that there are fewer and fewer illiterate men as we move through the 20th century.
Going back to the main questions laid out in the introduction, we can now offer a few conclusions. First, socioeconomic differentials prior to the transition delineated two main groups, the non-manual workers on one side and the other three categories on the other, while couples living in urban areas also displayed lower risks of first and higher order births. This result is similar to what has been found in other Quebec regions (Gauvreau, Gervais, and Gossage 2007) and may be linked to differential cultural practices in the two groups which cannot easily be revealed using the data available here. Second, socioeconomic factors were clearly at play during the transition, with the decline progressing from the upper classes to the lower, and then to the farmers. As a consequence, these trends led to a widening of the socioeconomic differentials during the transition, which started to narrow at the end of the period, when all groups had joined the movement.
6. Acknowledgments
We would like to thank Jean-Sébastien Bournival and Ève-Marie-Lavoie, research professionals at the BALSAC Project, for their contribution to data processing and analyses; and also to thank Hilary Collier Duquette, research assistant at Concordia University, who assisted us in preparing the first version of this text. We acknowledge the financial support of the Université du Québec à Chicoutimi (Programme d’aide institutionnelle à la recherche).
A preliminary version of this paper was presented at the seminar ‘Socioeconomic Stratification and Fertility before, during and after the Demographic Transition’, organized by the IUSSP Scientific Panel on Historical Demography in Alghero, Italy, 27−29 September 2012, and at the Annual Meeting of the Social Science History Association in Vancouver, 1−4 November 2012.
Vézina, Gauvreau & Gagnon: Fertility differentials in a late transition setting
1126 http://www.demographic-research.org
References
BALSAC Project (2013). BALSAC[electronic resource].http://balsac.uqac.ca/
Beaujot, R. (2000). Les deux transitions démographiques du Québec, 1860−1996. Cahiers québécois de démographie 29(2): 201−230.doi:10.7202/010286ar
Bouchard G. (1996). Quelques Arpents d'Amérique. Population, économie, famille au Saguenay, 1838−1971. Montréal: Boréal.
Bouchard, G. and Roy, R. (1991). Annales de démographie historique (XIXe et XXe siècles). Annales de démographiehistorique1991: 173−201.
Caldwell, J.C. (1982). The Theory of Fertility Decline. New York: Academic Press.
Charles, E. (1948). The Changing Size of the Family in Canada. Ottawa: Federal Bureau of Statistics.
Coale, A.J. (1973). The demographic transition. Paper presented at the International Population Conference, Liège.
Coale, A.J. and Watkins, S.C. (1986). The Decline of Fertility in Europe : The Revised Proceedings of a Conference on the Princeton European Fertility Project. Princeton: Princeton UniversityPress.
Desrosiers, G. (1999). Le système de santé au Québec : bilan historique et perspective d’avenir. Revue d’histoire de l’Amérique française 53(1) : 3−18doi:10.7202/ 005395ar
Easterlin, R.A. (1978). The Economics and Sociology of Fertility. In: Tilly, C. (ed.). Historical Studies of Changing Fertility. Princeton: Princeton University press: 57−133.
Gauvreau, D. (1992). Nuptialité et industrialisation: éléments de comparaison entre l'Ancien et le Nouveau Monde. In: Bonnain, R., Bouchard, G., and Goy, J. (eds.). Transmettre, hériter, succéder. La reproduction familiale en milieu rural, France-Québec, XVIIIe-XXe siècles. Lyon: Presses Universitaires de Lyon: 27−41.
Gauvreau, D., Gervais, D., and Gossage, P. (2007). La fécondité des Québécoises, 1870−1970. D'une exception à l'autre. Montréal: Boréal.
Henripin, J. (1968). Tendances et facteurs de la fécondité au Canada. Ottawa: Bureau fédéral de la statistique.
Demographic Research: Volume 30, Article 38
http://www.demographic-research.org 1127
Igartua, J.E. and de Fréminville, M. (1983). Les origines des travailleurs de l'Alcan au Saguenay, 1925–1939. Revue d'histoire de l'Amérique française 37(2): 291–308.doi:10.7202/304158ar
Lalou, R. (1993). Quand l'école des femmes était une école des mères. Influence de l'instruction sur la fécondité des Québécoises (1850-1940). Cahiers québécois de démographie 22(2): 229−262.doi:10.7202/010147ar
Lapierre-Adamcyk, E. and Lussier, M.-H. (2003). De la forte fécondité à la fécondité désirée. In: Piché V. and LeBourdaisC. (eds.). La démographie québécoise. Enjeux du XXIe siècle.Montréal : Les Presses de l’Université de Montréal : 66−109.
Lesthaeghe, R. and Surkyn, J. (1988). Cultural Dynamics and Economic Theories of Fertility Change. Population and Development Review 14(1): 1−45.doi:10.2307/ 1972499
Lesthaeghe, R. and Wilson, C.(1982). Les modes de production, la laïcisation et le rythme de baisse de la fécondité en Europe de l'Ouest de 1870 à 1930. Population 37(3): 623−647.doi:10.2307/1532175
Linteau, P.-A., Durocher, R., and Robert, J.-C. (1979). Histoire du Québec contemporain: de la Confédération à la crise (1867−1929).Montréal :Boréal.
McInnis, M. (2000). The Population of Canada in the Twentieth Century. In: Haines, M.R. and Steckel, R.H. (eds.). A Population History of North America. Cambridge: Cambridge University Press: 529−599.
McQuillan, K. (2004). When Does Religion Influence Fertility? Population and Development Review 30(1): 25−56.doi:10.1111/j.1728-4457.2004.00002.x
Notestein, F. (1945). Population: The long view. In: Schultz, T.W. (ed.). Food for the World. Chicago: Chicago University Press: 36−57.
Pouyez, C., and Lavoie, Y. (1983). Les Saguenayens. Introduction à l'histoire des populations du Saguenay XVIe-XXe siècles. Sillery: Presses de l'Université du Québec.
Thompson, W.S. (1929). Population. American Journal of Sociology, 34(6): 959−975.doi:10.1086/214874
Tsuya, N.O., Feng, W., Alter, G., and Lee, J.(2010). Prudence and Pressure. Reproduction and Human Agency in Europe and Asia, 1700-1900. Cambridge MIT Press.
Vézina, Gauvreau & Gagnon: Fertility differentials in a late transition setting
1128 http://www.demographic-research.org
van Leeuwen, M. and Maas, I. (2010). HISCLASS: A Historical International Social Class Scheme. Leuven: Leuven University Press.
van Leeuwen M., Maas, I., and Miles, A. (2002). HISCO: Historical International Standard Classification of Occupations. Leuven: Leuven University Press.
Westoff, C.E. (1954). Differential Fertility in the United States: 1900 to 1952. American Sociological Review 19(5): 549−561.doi:10.2307/2087793
Wrong, D.H. (1958). Trends in class fertility in western nations. The Canadian Journal of Economics and Political Science 24(2): 216−229.doi:10.2307/138769