edible oil - pacra research - jan'21
TRANSCRIPT

Edible OilAn Overview
February 2021© The Pakistan Credit Rating Agency Limited1
TABLE OF CONTENTS
Contents Page No.
Snapshot 1
Process Flow 2
Global Oil Seed 3
Edible Oil |Global 5
Global Price Dynamics 7
Domestic Overview 8
Domestic | Supply Side 9
Domestic |Demand Side 11
Domestic | Price Dynamics 12
Business Risk 13
Financial Risk 15
Duty Structure 16
Contents Page No.Rating Curve 17
SWOT Analysis 18
Conclusion / Outlook 19

Snapshot
EDIBLE OIL | OVERVIEW
Source: USDA, WB
Edible Oil is one of the essential items for cooking and food preparation. The product is being consumed by almost all classes of society, although per capita consumption patterns vary across the globe.
Edible oil can be obtained from a number of vegetables. The most commonly used edible oil products are soybean oil, palm oil,sunflower oil and rapeseed oil.
USA is the largest producer of soybean seeds in the world whereas Malaysia and Indonesia are largest exporter of Palm oil whereas India is the largest importer of edible oil.
Parameters FY19 FY20Turnover – Global (USD bln) 150 163
Turnover – Domestic (PKR bln) 1,025 1,229
Turnover per Capita – Global (USD) 19.7 21.2
Turnover per Capita‐ Domestic (PKR) 4,726 5,586
Share in GDP‐ Global 0.17% 0.19%
Share to GDP‐ Domestic (Nominal) 2.6% 2.9%
Growth Rate (Annual) – Global 1% 9%
Growth Rate (Annual) – Domestic 12% 22%
1

EDIBLE OIL| PROCESS FLOW
Refined Bulk Edible Oil
Seed Extraction Oil Refinery
Branded Oil
Oil Seeds
Process Flow
Source: PACRA Internal Database 2
Consumer
Packing UnitPoultry Feed

Production of Oil seeds
EDIBLE OIL | GLOBAL
Source: USDA, PACRA Internal Database
Global Oil seeds production was recorded at 576mln MTs during FY20 down by 3% YoY (FY19: 597mln MTs). A decline of almost ~18%YoY in USA crops led to drop in global production in FY20. This decline was majorly owed to supply chain disruptions being caused bythe Covid‐19 lockdown and high opening inventory levels in the USA.
During FY21, global oil seed production is estimated to be 596mln MTs, YoY growth of 3%. USA production is expected to reach 124mlnMTs from a historical low production of 107mln MTs in FY20, expecting a growth of 16% YoY.
3
0
20
40
60
80
100
120
140
160
180
200
FY16 FY17 FY18 FY19 FY20
Country wise Production (MMT)
United States Brazil Argentina China India Other
0
50
100
150
200
250
300
350
400
FY16 FY17 FY18 FY19 FY20
Oil Seed Production (MMT)
Soybean Seed Rapeseed Sunflower Seed Cottonseed Palm Kernel Others
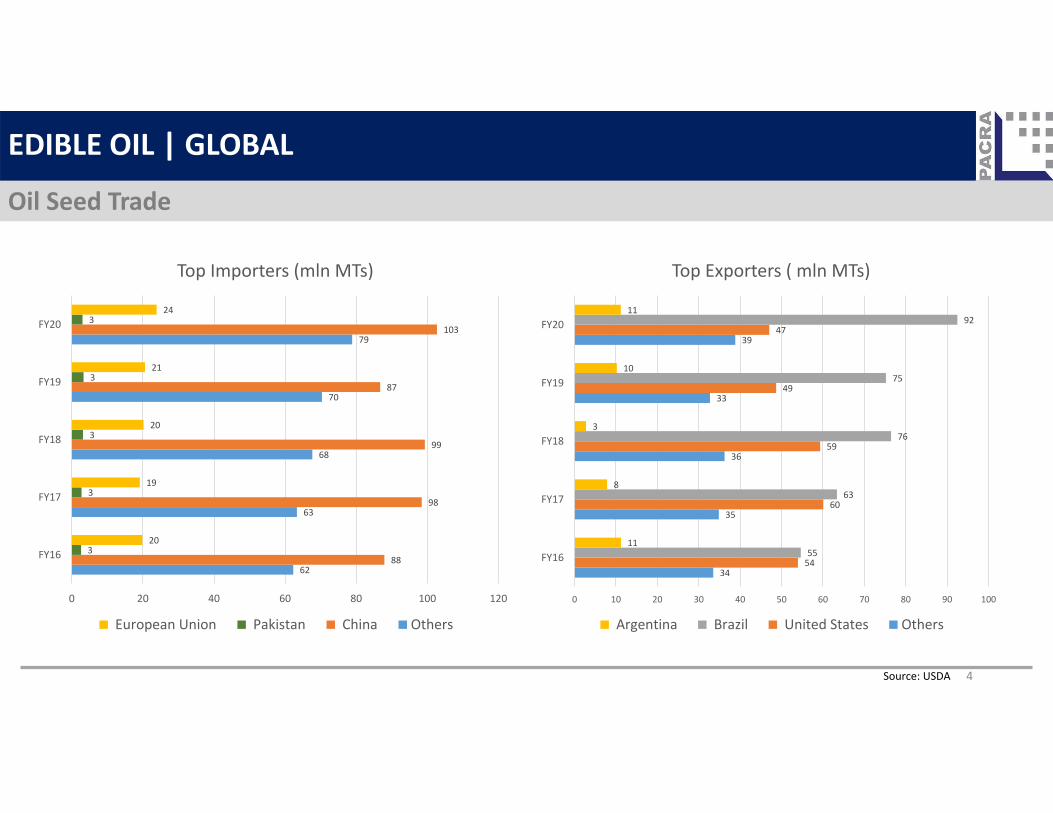
Oil Seed Trade
EDIBLE OIL | GLOBAL
Source: USDA 4
62
63
68
70
79
88
98
99
87
103
3
3
3
3
3
20
19
20
21
24
0 20 40 60 80 100 120
FY16
FY17
FY18
FY19
FY20
Top Importers (mln MTs)
European Union Pakistan China Others
34
35
36
33
39
54
60
59
49
47
55
63
76
75
92
11
8
3
10
11
0 10 20 30 40 50 60 70 80 90 100
FY16
FY17
FY18
FY19
FY20
Top Exporters ( mln MTs)
Argentina Brazil United States Others

Global Oil Production
EDIBLE OIL | GLOBAL
Global oil production was recorded at 207mln MTs during FY20 – a YoY growth of 2% (FY19: 203mln MTs).
Palm oil has the largest share in global oil production.
Growth in global oil production is expect to remain flat, going forward.
Source: USDA 5
0
10
20
30
40
50
60
70
80
FY17 FY18 FY19 FY20
Variant wise Oil Production (MMT)
Palm Oil Soybean Oil Rapeseed Oil Others
0
20
40
60
80
100
120
FY17 FY18 FY19 FY20
Country wise Oil Production (MMT)
China United States Malaysia Indonesia Others

Oil Trade
EDIBLE OIL | GLOBAL
Source: USDA 6
35
38
38
40
38
15
15
14
16
14
10
11
11
12
12
3
3
3
3
3
0 5 10 15 20 25 30 35 40 45
FY16
FY17
FY18
FY19
FY20
Top Importer (mln MTs)
Pakistan European Union China India Others
26
28
27
28
32
25
30
29
32
29
18
17
18
20
19
5
6
6
7
7
0 5 10 15 20 25 30 35
FY16
FY17
FY18
FY19
FY20
Top Exporters ( mln MTs)
Ukraine Malaysia Indonesia Others

Price Dynamics
EDIBLE OIL | GLOBAL
Prices of edible oil during FY19 were at their lowest in several years, a reflection of the slowdown in global demand for oils and proteinmeals, as well as the uncertainties stemming from US‐China trade disputes.
Since Dec‐2020 the price of Soyabean oil increased by 12%. Prices continued to rise post covid‐19 lockdown amid supply uncertaintiesand historically low global inventory levels.
7
22
2323
23
20
18
19
20
21
22
23
24
FY16 FY17 FY18 FY19 FY20
Closing Inventory Oil (mln MTs)
Source: USDA, PACRA Internal database
‐ 200 400 600 800
1,000 1,200 1,400
FY16 FY17 FY18 FY19 FY20
Price Trend (US$/MT)
Soybean Oil Sunseed Oil Palm Oil Rapeseed Oil

An Overview
EDIBLE OIL | DOMESTIC
• Pakistan’s edible oil market was recorded at PKR 1,161 million in FY20 registering a YoY growth of 22% (FY19: PKR~950 million).
• Local consumption was recorded at ~4.9mln MTs in FY20 up ~3% YoY, as (FY19: ~4.7mln MTs). This reflects that the growth in revenue was majorly contributed by a spike in prices. Average price of edible oil during FY20 was recorded at PKR~238/kg as compared to PKR~201/kg during FY19 (YoY Growth: 19%).
• With a per capita consumption of 22kg, Pakistan is the world’s 8th largest consumer of edible oil.
• The sector is highly dependent on imported oil seeds and refined palm oil to meet the local demand. Hence the exposure to exchange rate and International price fluctuations is high.
Source: USDA, WB, IMF 8
FY18 FY19 FY20
Turnover ( PKR bln)
845 950 1,161
Growth Rate 1.91% 12.47% 22.13%
Turnover Per Capita (PKR) 3,985 4,379 5,275
Share to GDP 2.46% 2.46% 2.78%

Supply Side
EDIBLE OIL | DOMESTIC
Source: Ministry of National Food Security & Research, PBS, USDA
Local edible oil demand is met through both crushing of oil seeds and import of cooking oil.
Local industry relies entirely on imports to meet its demand of soybean seed whereas cottonseed demand is met through localproduce only. Meanwhile, rapeseed and sunflower seeds are both produced locally as well as imported.
9
3,31
8
3,55
2
3,29
2
2,90
0
200
225
346
410
75
90
144
145
2 2 2 2
FY17 FY18 FY19 FY20
PRODUCTION (000MT)
Cottonseed Rapeseed Sunflower seed Soybean seed
1,60
0
2,17
9
1,99
7
1,70
4
1,18
0
821 907
781
102
41
‐ ‐
FY17 FY18 FY19 FY20
IMPORT (000MT)
Soybean seed Rapeseed Sunflower seed
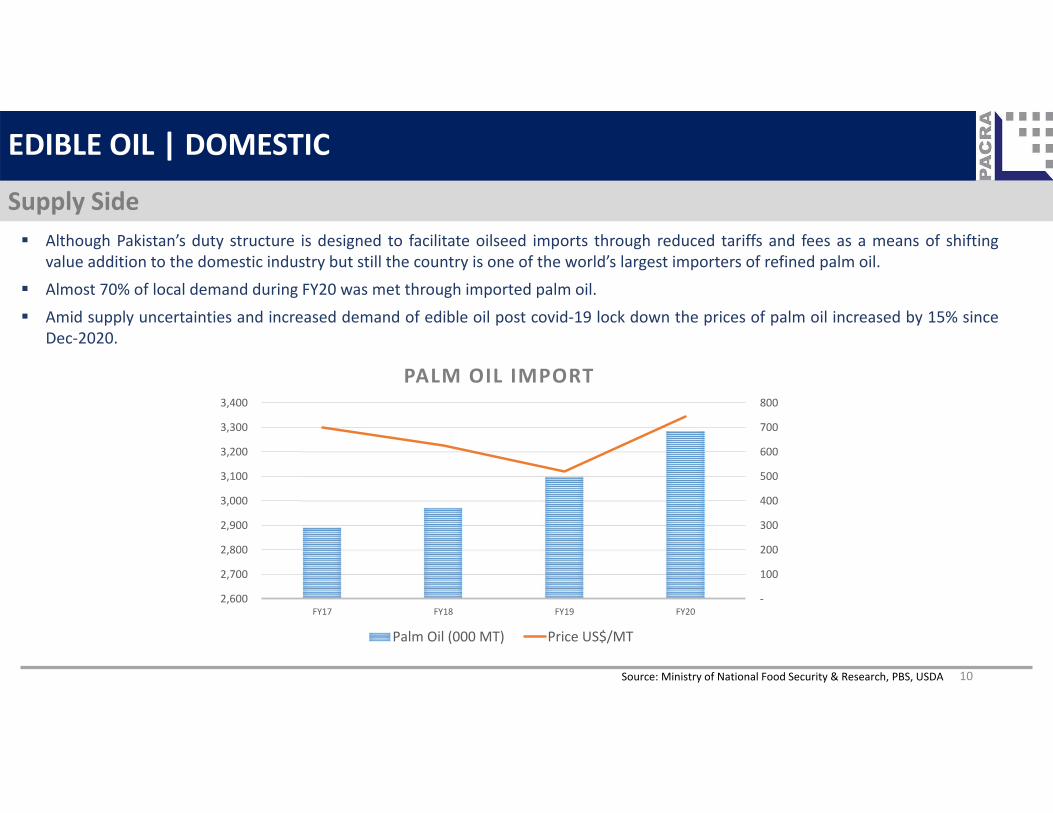
Supply Side
EDIBLE OIL | DOMESTIC
Source: Ministry of National Food Security & Research, PBS, USDA
Although Pakistan’s duty structure is designed to facilitate oilseed imports through reduced tariffs and fees as a means of shiftingvalue addition to the domestic industry but still the country is one of the world’s largest importers of refined palm oil.
Almost 70% of local demand during FY20 was met through imported palm oil.
Amid supply uncertainties and increased demand of edible oil post covid‐19 lock down the prices of palm oil increased by 15% sinceDec‐2020.
10
‐
100
200
300
400
500
600
700
800
2,600
2,700
2,800
2,900
3,000
3,100
3,200
3,300
3,400
FY17 FY18 FY19 FY20
PALM OIL IMPORT
Palm Oil (000 MT) Price US$/MT

Demand Side
EDIBLE OIL | DOMESTIC
Being the essential food item the demand of edible oil always remains robust.
During FY20 the local consumption of edible oil was recorded at 4.871 MMT up 3% YOY. Palm oil has largest share in overall edible oilconsumption followed by soybean oil, rapeseed oil and sunflower oil.
The demand of the edible oil is expected to remain robust and expected to increase more in coming Ramzan month.
11
3,070 3,095 3,245 3,390
470 485 490 480
471 374 472 491 445 480 470 450
‐ 500
1,000 1,500 2,000 2,500 3,000 3,500 4,000
FY17 FY18 FY19 FY20
Edible Oil Consumption (000 MT)
Palm Oil Soybean Oil Canola Oil Cottonseed Oil Sunflower Oil
Source: Ministry of National Food Security & Research, PBS, USDA

Price Dynamics
EDIBLE OIL | DOMESTIC
Source: USDA, PBS.
Pakistan is heavily dependent on import of oil seed and edibleoil to meet local consumption.
Further the exposure to exchange rate movement is also high.
It is the market norm to pass in entirety the impact of increasedcost of purchase to end consumers.
International stock of edible oil and oil seed is at historically lowlevel. Amid tight supplies, the prices of imported edible oil arealso expected to increase further and hence the local prices ofthe products.
Further, demand side push to prices is expected from anincrease in demand due to eased lockdown and upcomingmonth of Ramazan.
12
189201
238 258
2%
7%
19%
8%
0%
2%
4%
6%
8%
10%
12%
14%
16%
18%
20%
0
50
100
150
200
250
300
FY18 FY19 FY20 6MFY21
Price Dynamics
Price (PKR/kg) Change

EDIBLE OIL | DOMESTIC
Business Risk | Demand Side
Source: PACRA Internal database
The business risk of edible oil sector can be divided into operating risk and sales risk.
Operating Risk: This risk particularly refers to the difficulties relating to the operations of the edible oil playerswhich can hamper the profitability and performance of the sector. Major inputs include both local inputs andimported inputs although the proportion of local input is significantly low. The sector’s costs are therefore subjectto Exchange Rate volatility and International prices of oil seed and refined oil. Although tariff structure of thecountry is designed in way to promote local production of edible oil but still the major portion of demand is metthrough import of refined oil.
. Sales Risk: This risk is focused on the demand side of edible oil. Being the essential food item demand of edible oil
remains robust. But the slight variation in demand is related to price movement as well. As the customer switchedfrom branded edible oil to low cost products.
13
EDIBLE OIL | DOMESTIC
14
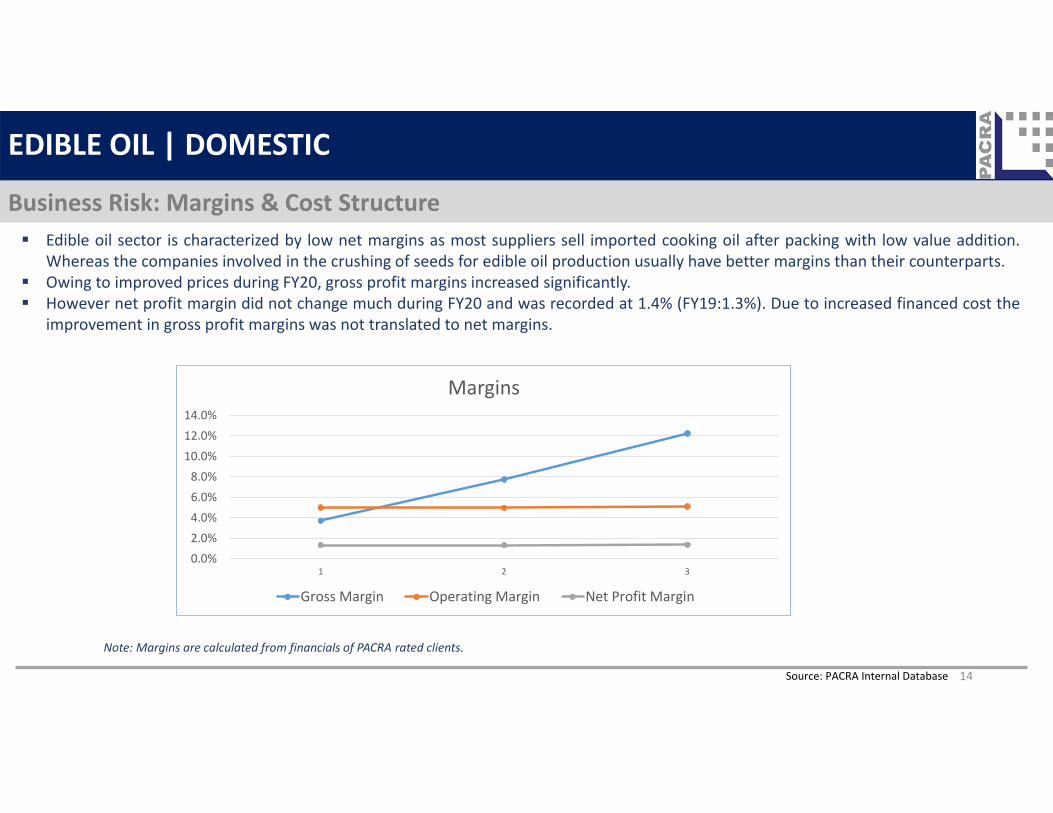
Business Risk: Margins & Cost Structure
Source: PACRA Internal Database
Edible oil sector is characterized by low net margins as most suppliers sell imported cooking oil after packing with low value addition.Whereas the companies involved in the crushing of seeds for edible oil production usually have better margins than their counterparts.
Owing to improved prices during FY20, gross profit margins increased significantly. However net profit margin did not change much during FY20 and was recorded at 1.4% (FY19:1.3%). Due to increased financed cost the
improvement in gross profit margins was not translated to net margins.
Note: Margins are calculated from financials of PACRA rated clients.
0.0%2.0%4.0%6.0%8.0%
10.0%12.0%14.0%
1 2 3
Margins
Gross Margin Operating Margin Net Profit Margin

EDIBLE OIL | DOMESTIC
Financial Risk Net working capital days of the sector increased due to increase in inventory days. The suppliers keeps considerable inventory levels to
support demand during lead time required to import inputs. The need to maintain back up stock increased during FY20 owing to supplychain destructions caused by covid‐19 lockdown. As mentioned in below graph the working capital need of the sector are high owing tolow payable days.
To finance the working capital needs, the companies resorts to short term borrowing as the short term borrowing constitute 98% of thetotal outstanding debt. High reliance on short term financing is a depiction of aggressive working capital policy which increases therepayment risk. Gearing ratio of the sector was recorded at 54% during FY20 (FY19:64%).
Source: PACRA Internal Database 15
‐
50.00
100.00
150.00
200.00
FY18 FY19 FY20
Working Capital
Inventory Days Trade Receivable Days
Trade Payable Days Net Working Capital Days
95% 96% 98%5% 4% 2%
50%
60%
70%
80%
90%
100%
FY18 FY19 FY20
Debt Structure
Short Term Borrowing Long Term Borrowing
Note: Margins are calculated from financials of PACRA rated clients.
EDIBLE OIL | DOMESTIC
DUTY & SALES TAX STRUCTURE
Source: Federal Board of Revenue 16
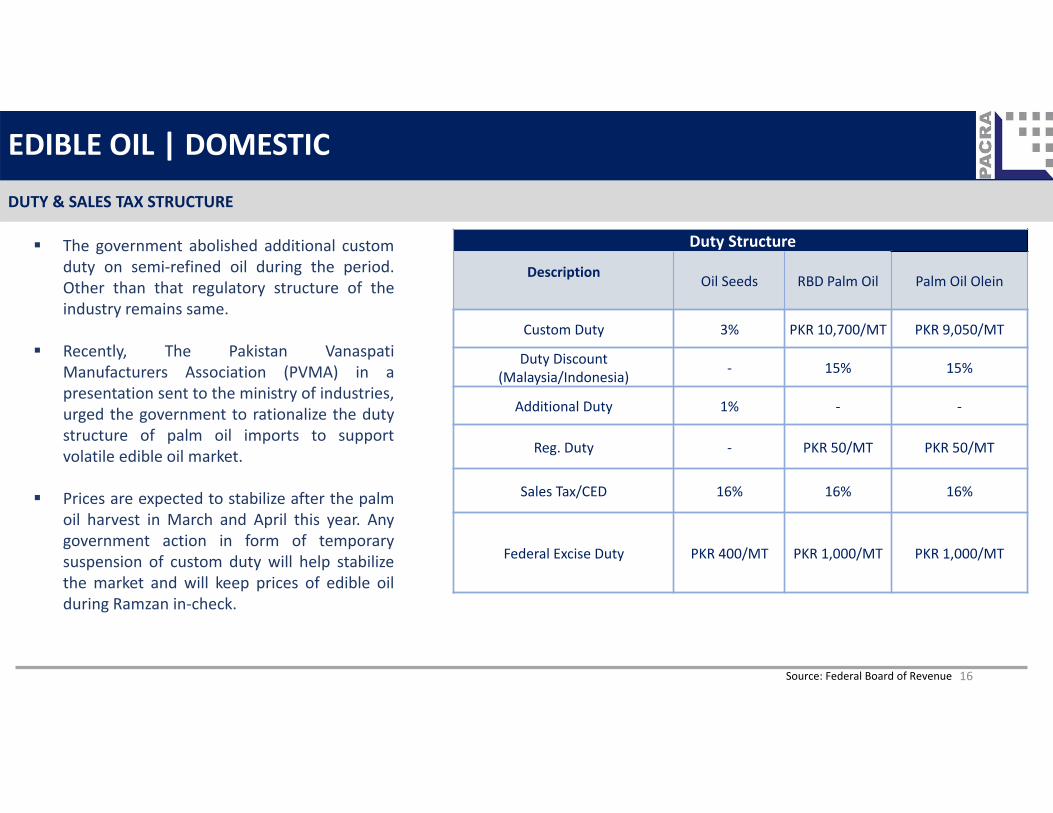
Duty Structure
Description Oil Seeds RBD Palm Oil Palm Oil Olein
Custom Duty 3% PKR 10,700/MT PKR 9,050/MT
Duty Discount (Malaysia/Indonesia) ‐ 15% 15%
Additional Duty 1% ‐ ‐
Reg. Duty ‐ PKR 50/MT PKR 50/MT
Sales Tax/CED 16% 16% 16%
Federal Excise Duty PKR 400/MT PKR 1,000/MT PKR 1,000/MT
The government abolished additional customduty on semi‐refined oil during the period.Other than that regulatory structure of theindustry remains same.
Recently, The Pakistan VanaspatiManufacturers Association (PVMA) in apresentation sent to the ministry of industries,urged the government to rationalize the dutystructure of palm oil imports to supportvolatile edible oil market.
Prices are expected to stabilize after the palmoil harvest in March and April this year. Anygovernment action in form of temporarysuspension of custom duty will help stabilizethe market and will keep prices of edible oilduring Ramzan in‐check.

EDIBLE OIL | RATING CURVE
Source: PACRA Internal data
0
1
BBB+ BBB BBB‐
Ratings ‐ PACRA
PACRA rates two of the players ofpoultry sector ‐ Sadiq Poultry &Islamabad Farms.
No change has occurred in the ratingsof both of the players.
17

POULTRY | SWOT ANALYSIS
Increased research and development Economic recovery Increase income per capita Evolving consumer taste palette Change in eating habits No brand loyalty Vast distribution
Artificial breeding of broilers Lack of research and development
initiatives Outdated technology used for hatchery
and breeding Highly fragmented sector Perishable Items Prevailing uncertainty due to COVID‐19•High raw material costs• Low contribution margins•High waste production levels
Continuous availability of raw material and labor Reduction of policy rate Stability of exchange rate for raw material Simple to operate controlled shed Available capacity Government incentives and ease policies Increasing income levels and restaurants Wide range of target market•Approx.40% market occupied by unorganized sector
Strengths Weaknesses
Threats Opportunities
Fluctuations in economic conditions Lack of Required Regulation by the
Government of Pakistan Poor Infrastructure High competition Virus and disease in Parent stocks i.e. Bird
Flu Accessibility of inputs
18

Sector Outlook: Negative
POULTRY | CONCLUSION
The first wave of Covid‐19 had hit hard on poultry prices, due to lockdown situation creating a supply glut as marriage halls andrestaurants were closed across the country. Prices of day‐old chick (DOP), eggs and broiler posted a dip (down by over 20%) duringMar’20‐June’20 period.
However, in 1HFY21, poultry prices have spiked rapidly due to recovered demand, supply dip (many farmers who suffered losses inthe previous three months, did not replenish their sheds) and increase in input prices.
Maize prices are expected to rise further due to hoarding of maize by farmers. International soybean and soybean meal prices arealso expected to continue growth due to lower USA stocks and increasing demand from China.
The Sector is highly leveraged, while average net margins of the sector are around ~4% in normal circumstances. Therefore, thecredit risk of sector players is expected to remain on the higher side on the backdrop of declining inventories and cash flows amidincreasing prices and demand uncertainty. On the contrary, an interest rate cut by 625bps is expected to provide relief to the Sector’sbottom‐line margins through reduction in finance cost.
In the absence of any reforms or package scheme, the increasing input prices of poultry feed with the current duty and tax regimemay continue to pressure the margins of the Sector players, particularly of the small farmers whose buying power is limited.
Despite the prevailing challenges, Pakistan’s overall economic position is on a trajectory to improvement. Overall industrial activityhas started to recover to pre‐COVID levels with the output of Large Scale Manufacturing Industries (LSMI) increasing by ~7.41%during July to November’21 as compared to same period last year. Moreover, the target GDP growth given by SBP for FY21 is ~2.1%.
19

POULTRY| BIBLIOGRAPHY
Research Team
Saniya TauseefTeam [email protected]
Noor ZiaAssociate [email protected]
Contact Number: +92 42 35869504
DISCLAIMERPACRA has used due care in preparation of this document. Our information has been obtained from sources we consider to be reliable but its accuracy or completeness is notguaranteed. The information in this document may be copied or otherwise reproduced, in whole or in part, provided the source is duly acknowledged. The presentation should not berelied upon as professional advice.
20
Pakistan Poultry Association DEFRA Sciencedirect PACRA Database The Big Book Project RaboBank 2020 AGBRO Group Indexmandi The Poultry World State Bank of Pakistan Federal Internal Board of Revenue Punjab Board Investment and Trade Ministry of National Food Security & Research The Economic Survey of Pakistan Food and Agriculture Organization of United Nations US Department of Agriculture