edhec european real estate investment and risk management survey
TRANSCRIPT

EDHEC European Real Estate Investment and
Risk Management Survey November 2007
An EDHEC Risk and Asset Management Research Centre Publication
Sponsored by:

Foreword ............................................................................................................................................. 3
Executive Summary .......................................................................................................................... 5
1. Real Estate as an Asset Class ..................................................................................................13
1.1. From building to asset class ............................................................................................................. 14
1.2. The main real estate investments .................................................................................................. 17
1.3. Allocation to real estate in a multi-class portfolio ................................................................ 28
2. Real Estate Portfolio Management .......................................................................................37
2.1. Portfolio management process and portfolio construction ............................................... 38
2.2. Performance measurement and analysis .................................................................................... 45
2.3. Allocation adjustment ........................................................................................................................ 49
2.4. Risk measurement and management ...........................................................................................51
3. Property Derivatives ..................................................................................................................59
3.1. The property derivatives market ..................................................................................................... 60
3.2. Standard contracts and transactions ........................................................................................... 64
3.3. Uses of property derivatives and their limits............................................................................ 66
4. Survey Results .............................................................................................................................75
4.1. Description of sample ......................................................................................................................... 76
4.2. Perception of real estate as an asset class................................................................................. 78
4.3. Real estate investment policy ......................................................................................................... 80
4.4. Real estate equity investments ....................................................................................................... 84
4.5. Property derivatives ............................................................................................................................. 89
Conclusion ...................................................................................................................................................... 101
Appendices .....................................................................................................................................................105
References ...................................................................................................................................................... 115
About the EDHEC Risk and Asset Management Research Centre ..........................................123
About Groupe UFG ......................................................................................................................................126
About Aberdeen ...........................................................................................................................................127
Table of Contents
Published in France, November 2007. Copyright© EDHEC 2007.The opinions expressed in this survey are those of the author and do not necessarily reflect those of EDHEC Business School, Aberdeen or Groupe UFG.

3An EDHEC Risk and Asset Management Research Centre Publ icat ion
EDHEC European Real Estate Investment and Risk Management Survey - November 2007
The survey it is our pleasure to present here is part of the EDHEC Risk and Asset Management Research Centre’s research programme in asset allocation and alternative diversification.
This programme has led to extensive research on the benefits, risks, and integration methods of alternative classes and instruments in asset allocation. After winning plaudits for its study of hedge fund strategies, EDHEC has started to explore other alternative assets.
Real estate, probably the most traditional of alternative classes, is enjoying renewed favour as institutional investors search for diversification benefits and competitive yields. Institutional demand for real estate exposure has brought about improvements in market transparency and the development of new indirect and synthetic investment tools.
With target allocations to real estate increasing, research into real estate as an asset class must enable industry participants to refine traditional approaches and to consider real estate within the bounds of asset management and asset-liability management. It is in this way that research can help real estate take its place in multi-style, multi-class portfolios, contribute to the design of integration methods that optimise its risk/return trade-off, and, finally, enable the class to deliver on its full potential.
The EDHEC European Real Estate Investment and Risk Management Survey, the first phase of this research, takes stock of developments in the real estate investment market, reviews academic evidence on allocation to and management of real estate, and analyses the results of a large-scale, pan-European survey of institutional practices.
Chapters 1 to 3 provide background as well as a framework for an analysis in light of the greatest academic and practical challenges. These chapters contain an overview of real estate as an asset allocation class, a discussion of real estate portfolio management, and an appraisal of property derivatives. In addition to presenting the results of the survey, chapter 4 analyses institutional investors’ perceptions of and practices in these three areas.
We would particularly like to thank our partners at Aberdeen Property Investors and Groupe UFG, whose support made this Survey possible. We are also grateful to Frédéric Ducoulombier, the author of the Survey, to Tao Ye, for her help in collecting the data, and to the technical team led by Peter O’Kelly and Laurent Ringelstein.
Foreword
Noël AmencProfessor of FinanceDirector of the EDHEC Risk and Asset Management Research Centre

4
About the author
An EDHEC Risk and Asset Management Research Centre Publ icat ion
EDHEC European Real Estate Investment and Risk Management Survey - November 2007
Frédéric Ducoulombier has been a full-time faculty member of EDHEC Business School
since 2002. He currently serves as deputy to the school’s Director of Research and heads
EDHEC Asset Management Education. Over the last ten years, he has held positions in
programme design, management, and internationalisation, and has taught finance in
France and China. At EDHEC, he has unified the operations of the various MSc courses and
now helps implement the school’s innovative research policy. He joined the EDHEC Risk
and Asset Management Research Centre in late 2004 to launch its executive education
operation which now serves hundreds of organisations throughout Europe. As head of
the centre’s real estate research initiative, he has written in trade publications about real
estate indices and derivatives and presented at various industry conferences. He holds
an MSc in Management from Iéseg School of Management and a graduate certificate in
East Asian Studies from Université de Montréal/McGill University as well as the Chartered
Alternative Investment AnalystSM designation.

Executive Summary
5An EDHEC Risk and Asset Management Research Centre Publ icat ion
6
This summary of the EDHEC European Real Estate
Investment and Risk Management Survey provides
an overview of real estate as an asset class, of the
management of a real estate portfolio, and of real
estate derivatives; it then synthesises the main
findings of a pan-European survey of real estate
investors.
Markets, practices, and academic resultsReal estate as an asset classFrom buildings to allocation classAt the heart of the real estate asset class is fixed
property, real physical assets inseparable from
specific locations, highly heterogeneous, and
exchanged at high unit values; they are divisible
with difficulty and require the close attention
of property managers. It is on account of these
features that they are traded on direct-search or
brokered decentralised markets where transaction
costs are high, liquidity is low, and transparency
limited; it is for the same reasons that they
generate both high management costs and value-
adding opportunities unique to direct ownership;
that their specific risk is high and diversifiable
with difficulty.
The direct acquisition of property and mortgage
lending are the two traditional sides of real estate
investment. The securitisation of debt and the
creation of collective investment vehicles separate
management and ownership. These more recent
developments offer investors modes of exposure
with reduced lumpiness, greater diversification,
and—when there are active secondary markets
for these media—improved liquidity. The quadrant
model depicts the wealth of possible real estate
investments along equity vs. debt and private vs.
public axes; all these investments are candidates
for inclusion in the real estate asset class.
The specifics of the underlier and its markets
and the ability to make a homogeneous group
of assets—representative of a sufficiently large
investment universe—with its own return features
make it possible to view all equity investment
media as an individual asset class; mortgage
debt and its derivatives, by contrast, are included
in the traditional bond class. In this view, held
by most investors and academics today, listed
property companies are considered integral to the
asset class, whereas more traditionally they are
excluded. A new minority considers the products
from all the quadrants part of the asset class.
Importance of real estate in a multi-class portfolioThe most frequently mentioned advantages of
real estate are its low volatility, its high adjusted
returns, its superiority as a hedge for inflation
risk, its high and stable rent component, and
its excellent decorrelation characteristics; only
the two latter advantages have been clearly
documented by academic research. The usefulness
of real estate for hedging inflation risk has been
confirmed in the specific context of long-term
studies and residential real estate.
The limited availability and the biases of direct
investment indices make it difficult to set
optimal allocation levels. The use of indices that
are smoothed and lagged and/or fail to make
allowances for liquidity fluctuations not apparent
in prices leads to underestimation of real estate
volatility and of its co-moments with other asset
classes, and thus to overestimation of its benefits
to a diversified portfolio. The mean-variance
asset management models that correct for these
biases recommend that a balanced portfolio have
allocations to real estate of between 15% and
25%; studies using asymmetric and extreme risk
measures recommend lower allocations. The first
asset-liability management studies to include real
estate conclude that lower allocations are in order
as a result of the low correlation of the asset class
and liabilities; as this situation is linked in part to
the biases pointed out above, additional work is
necessary.
Executive Summary
An EDHEC Risk and Asset Management Research Centre Publ icat ion
EDHEC European Real Estate Investment and Risk Management Survey - November 2007
7An EDHEC Risk and Asset Management Research Centre Publ icat ion
EDHEC European Real Estate Investment and Risk Management Survey - November 2007
Real estate portfolio managementSources of value and riskStrategic and tactical asset allocation linked to
forecasting abilities and done within the limits
of the investor’s objectives and constraints, asset
selection, and the management of directly held
properties are the three spheres of activity in a
real estate portfolio where value can be created.
Conventional real estate management focuses
on asset selection and property management,
whereas modern management works in all three
spheres. Allocation strategies imply the creation
of representative, well diversified portfolios and
lead to rebalancing transactions. Because of
the problems with diversifying direct portfolios
and because of the costs and delays of physical
transactions, it is difficult to use top-down
strategies, and the rational investor may well
prefer a bottom-up approach that emphasises
conventional sources of value and respects an
overall risk or allocation constraint.
The performance of a real estate investment is
linked to factors specific to the property and to
the terms under which it is leased as well as to
systematic factors. The sources of systematic
risk are real growth, employment, interest rates,
and unexpected inflation. These macroeconomic
factors affect returns on property with a swiftness
and intensity that vary depending on the type
of property (office, retail, industrial, residential)
and on continental, domestic, regional, and local
conditions.
Modes and limits of diversificationDomestic portfolio diversification by property
type results in a reduction of risk clearly higher
than that achieved by geographic diversification
even when economic rather than political regions
are used. International diversification leads to
significant risk reduction, all the more so when the
syncopation of domestic real estate or economic
cycles is exploited. In addition, once international
Executive Summary
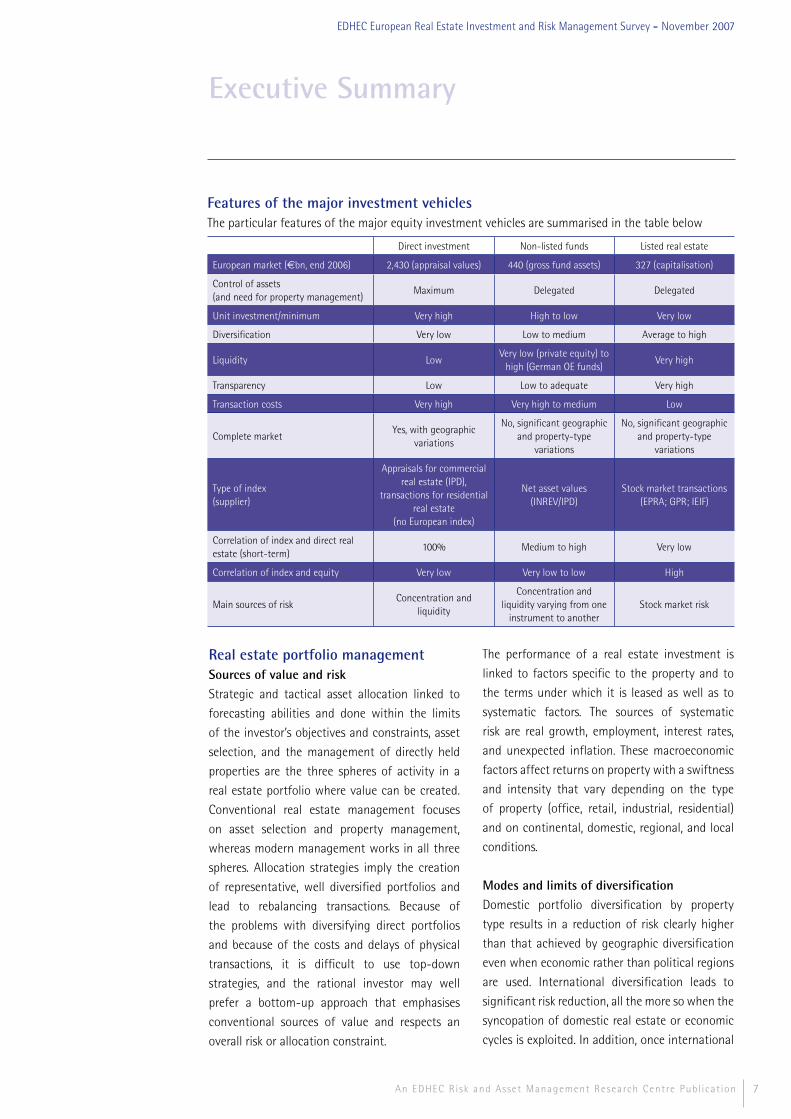
Direct investment Non-listed funds Listed real estate
European market ((bn, end 2006) 2,430 (appraisal values) 440 (gross fund assets) 327 (capitalisation)
Control of assets (and need for property management)
Maximum Delegated Delegated
Unit investment/minimum Very high High to low Very low
Diversification Very low Low to medium Average to high
Liquidity LowVery low (private equity) to
high (German OE funds)Very high
Transparency Low Low to adequate Very high
Transaction costs Very high Very high to medium Low
Complete marketYes, with geographic
variations
No, significant geographic and property-type
variations
No, significant geographic and property-type
variations
Type of index(supplier)
Appraisals for commercial real estate (IPD),
transactions for residential real estate
(no European index)
Net asset values (INREV/IPD)
Stock market transactions (EPRA; GPR; IEIF)
Correlation of index and direct real estate (short-term)
100% Medium to high Very low
Correlation of index and equity Very low Very low to low High
Main sources of riskConcentration and
liquidity
Concentration and liquidity varying from one
instrument to anotherStock market risk
Features of the major investment vehiclesThe particular features of the major equity investment vehicles are summarised in the table below

8
diversification has been achieved, the marginal
benefits of diversification by property type are
largely insignificant. The efficiency of international
diversification is lessened when the tenants of
properties in different domestic markets belong
to the same global industry or when institutional
money flows to real estate in only a few markets.
In practice, international diversification is subject
to currency risk, as the volatility of exchange
rates is, on average, significantly higher than
that of real estate yields. The other obstacles to
international diversification are the need for local
expertise, political risk and restrictions on foreign
investment, fiscal problems, and the lack of depth
and the illiquidity of some markets, emerging
markets, in particular—obstacles that can also be
viewed as opportunities.
Diversification of specific risk appears impossible
through direct investment: if normal return
distributions are assumed, an equally weighted
portfolio of 30 to 40 properties may on average
be 95% diversified, but the reality of returns and
property indivisibility would require investment in
several hundred properties for the same average
result, and an even higher number would be
necessary to limit the risk of portfolios deviating
from this average. This finding supports a vision
of direct investment centred on the selection
and management of a portfolio of relatively
few properties or, for strategies involving
diversification, heavy reliance on intermediation.
Difficulty of dynamic management in non-listed real estateAllocation changes in a portfolio of direct real
estate holdings are difficult and costly. Changes in
exposure through non-listed funds are hindered
by the very low levels of liquidity of many vehicles
and by the limited availability of domestic funds
that specialise in single property types. The
dynamic management of a portfolio of listed
real estate poses no problems, but options are
limited by levels of market development that vary
from one European country to another. Effecting
changes in a portfolio of non-listed real estate
with the help of a synthetic approach that uses
listed property companies—an approach made
undeniably tempting by high liquidity and low
costs—is infeasible on account of the limited
short-term substitutability of these two modes of
exposure.
Performance analysis and assessmentFor direct real estate investments, the benefits of
portfolio performance analysis are limited by the
impossibility of index-based management and
by the difficulty of making allocation changes;
performance can, however, be analysed at the
property level. Indirect investments, either listed
or frequently priced, lend themselves more easily
to performance and style analyses as long as
appropriate indices are available. The use of the
Sharpe and Sortino ratios presupposes corrections
for the biases linked to the frequency and the
nature of the data.
Assessment, analysis, and management of riskReal estate returns are subject to auto-correlation
and non-normality, a possibility that justifies,
for measures of performance and for allocation
models, the use of tests, possible correctives, and
gauges of asymmetric and extreme risk. All the
same, when it comes to non-listed real estate,
the limited availability and the low frequency of
data make it difficult to put these approaches into
practice.
Linking measures and sources of risk at both asset
and portfolio level could lead not only to better
allocation decisions but also to initiatives not
requiring allocation changes. In addition, the usual
techniques can be used to manage the exposure
of a real estate portfolio to exchange rate risk,
interest rate risk, and inflation risk.
Executive Summary
An EDHEC Risk and Asset Management Research Centre Publ icat ion
EDHEC European Real Estate Investment and Risk Management Survey - November 2007

9An EDHEC Risk and Asset Management Research Centre Publ icat ion
EDHEC European Real Estate Investment and Risk Management Survey - November 2007
Real estate derivativesReal estate derivatives marketsIn 2004, an over-the-counter market for swaps
on IPD UK commercial real estate indices—now
remarkably active—was created; it provided the
inspiration for a comparable market in the United
States and is now being exported to continental
Europe. An over-the-counter derivatives and
structured products market has sprung up
around the UK Halifax house price index, but at
the Chicago Mercantile Exchange derivatives
contracts on Case-Shiller home price indices are
still struggling to find takers. More recently, the
Chicago Board of Trade and Liffe have launched
derivatives on indices of listed American and
European property companies.
Main products and usesFor the moment, the real estate derivatives market
is largely a market for total return swaps on direct
real estate indices founded on appraisal data—on
the IPD UK indices, in particular. The most common
of these is a medium-term swap of the return on
the annual all-property index for the three-month
inter-bank rate plus (or minus) a premium; a few
swaps of sector or sub-sector for all-property
have been recorded.
In terms of liquidity, cost, granularity, swiftness,
and flexibility, real estate derivatives allow
exposure to market risk to be established or
changed with potentially greater efficiency
than in the underlying market; they are thus
particularly advantageous for direct real estate.
Real estate derivatives can be used for investment
and diversification, to take advantage of price
differentials between markets and segments, to
bet on falling markets, for leverage, and, possibly,
for hedging and synthetic portfolio management.
Limits of direct real estate index derivativesThe efficiency of real estate index derivatives as
a hedge and for synthetic management requires
high correlation of the portfolio the manager is
seeking to protect or rebalance and the index. In
direct real estate, such a situation is an exception,
as the reference indices, unlike portfolios, are
highly diversified; the efficiency of these
techniques will thus be less than ideal.
Because it is difficult to replicate appraisals-
based indices, it is likewise difficult to hedge the
derivatives they are the underliers for; as a result,
market liquidity is limited and doubt is cast on
derivatives prices, as pricing by arbitrage, in the
stricter sense, is not possible. Further work on
synthetic and cash hedging methods is necessary.
Indices based on the net asset values of real
estate funds of funds are a partial solution to
the hedging problem, as there is an investable
underlier. Derivatives based on indices of listed
property companies avoid this problem, given the
investability of the underlier and the possibility of
short-selling.
Findings of the surveyBetween November 2006 and May 2007 three
types of European institutional investor were
surveyed: end investors (pension funds and
insurance companies), diversified asset managers,
and real estate specialists (managers of real
estate investments and property companies). The
survey produced responses from 143 investors
in nineteen countries, with a total of more than
33 trillion of assets under management and more
than €400 billion in real estate assets. 86% of our
respondents have investments in real estate and
an average experience of the class of 24.5 years.
Real estate as an asset classReal estate is perceived as an asset class of its own that encompasses direct as well as indirect investment Nearly 100% of our respondents acknowledge
that real estate is an asset class of its own. By and
large, investors include in this class vehicles for
indirect real estate equity investment but have
mixed views of real estate debt. The proponents
Executive Summary
10
of a restrictive view of real estate investment are
in the minority: 4.2% of those who responded to
our survey equate the real estate asset class to
directly acquired properties and 14.7% believe
that non-listed investments alone (through direct
acquisition or funds) count as real estate. 72%
of respondents acknowledge simultaneously the
three modes of exposure to equity investments:
direct acquisition of property, purchase of a
share in an non-listed fund, and investment in
listed property companies. Structured real estate
products, investable indices, and real estate
derivatives are given a favourable reception, as
67.8% of respondents accept these innovations
as part of the asset class. Overall, 38.5% of
respondents view real estate debt as belonging
to the class, but this average is misleading: 63.2%
of real estate specialists are of this opinion, as
opposed to 29.5% of other investors.
Real estate investment policyObjectives: diversification, performance, hedgingFor non-specialist investors, the three main
reasons for allocation to real estate are for overall
portfolio diversification (27.2%), attractive risk-
adjusted performance (20.5%), and as a hedge
for inflation (11.3%). Overall, the various reasons
linked to diversification are predominant; the
search for alpha is secondary. The excellent
performance of real estate over the last few years
may account for this situation; in less favourable
circumstances, investors may no longer be satisfied
with market returns (beta) and may instead take a
more discriminating approach (alpha).
Strategic allocation: 10%74.5% of respondents (excluding real estate
specialists) view their investments in real estate
as investments in a class of its own, while 23.5%
invest opportunistically; the latter are generally
smaller investors. The average target allocation is
9.9% and the average range 5.7% to 13.5%.
Conventional pecking order among vehicles for equity exposure, marginal role for debt, and modest allocation to new productsThe study of the vehicles used by investors for
their allocation to real estate shows the limited
role of pure debt products (3%), the respect
for conventions of long standing among the
vehicles for exposure to equity investment (direct
investment: 50%; non-listed funds: 24%; listed
real estate: 17%), and the still minimal importance
of recent offers for structured products (2%),
index-linked products (3%), and derivatives (1%).
The equal shares of direct and intermediated
investment mask notable differences, as real
estate specialists make direct investments with
75% of their funds—that is, twice as much as
other investors do. Diversified asset managers put
listed real estate ahead of non-listed funds and
are more open to new vehicles for exposure.
The study reveals a positive correlation of
portfolio size and direct real estate allocation that
highlights the problems of directly invested real
estate portfolios and identifies non-listed funds
as the closest proxy for direct investment.
Real estate portfolio managementPerformance measurement: an absolute return orientation prevails, but relative return measures are often used80.6% of specialists and 52.1% of other
investors report that they first set nominal or
real absolute return objectives. More than half
of pension funds (56%) resorted primarily to
relative return measures—the only category of
investor in our survey in which a majority did
so. However, 46.7% of the investors who take
a mainly absolute approach to performance
measurement also use relative return measures.
Overall, 68.5% of survey respondents use
relative return benchmarks as a primary or
secondary gauge of the performance of their
real estate investments, a finding that suggests
Executive Summary
An EDHEC Risk and Asset Management Research Centre Publ icat ion
EDHEC European Real Estate Investment and Risk Management Survey - November 2007

11An EDHEC Risk and Asset Management Research Centre Publ icat ion
EDHEC European Real Estate Investment and Risk Management Survey - November 2007
that allocation to index-based vehicles could
increase significantly about current levels.
Detailed analysis of responses shows the
appropriateness of benchmark choices: direct
indices are used to track the performance of
direct investments, property company indices are
used to track the performance of investment in
property companies, geographic indices are used
to track the performance of investment along
geographic lines, and so on. The IPD and NCREIF
direct property indices enjoy monopolies in the
regions they cover. The EPRA family of indices is
by far the most popular for the assessment of
investments in listed real estate—its only serious
challengers are the indices supplied by GPR.
Sources of risk and performance: primacy of specific risk, importance of sector and geographic risksInvestors view idiosyncratic risks as the main
factors behind the performance of real estate
investments: for specialists as well as for non-
specialists, the factor most frequently mentioned
first, and the most frequently mentioned of
the three main risk factors, is that which refers
explicitly to the specific features of the property
(location, use, size, age, architecture, and so on).
For real estate specialists, the other key factor that
is made apparent is also specific—lease terms and
tenant creditworthiness. These responses reveal a
conventional approach to real estate investment,
in the context of which specialists largely view
the leverage for added value at the property level.
Non-specialists identify sector and geographic
exposures as significant dimensions of risk.
Risk management: diversification, both by property type and by geography, is the sole appropriate approach; a pan-European index would be invaluableDiversification emerges as the sole suitable
approach for real estate specialists and the
most useful for other investors. Of the other
possibilities, only limits on allocation to real estate
find favour among non-specialists; principal-
protected structured real estate products are
deemed not very useful and derivatives get a
wary welcome. Real estate specialists, who are
unable to cap the share of real estate in their
portfolios, consider derivatives and structured
products even less useful.
Investors identify diversification by property type
and diversification by geography as the two main
approaches to diversification. For specialists, a
third approach is grounded on financial analysis;
style considerations (growth vs. value, core vs.
value added or opportunistic) are important as
well. For other investors, the third approach to
diversification is by instrument or by manager, an
approach that reveals the particular concerns of
those investing indirectly in real estate.
65.6% of investors view an investable European
real estate index or a derivative of that index as the
best means to diversify the real estate portfolio of
an institutional investor with a strong home bias.
Property derivatives81% of the investors have no immediate plans to use property derivatives; their investment policies, a lack of training, and the unsuitability of the products account for this figure81% of our respondents have no immediate plans
to use real estate derivatives, 5% currently use
them, and 16% plan to do so in the short term. Real
estate specialists are less interested in derivatives,
but their interest increases as the size of their
portfolios increases. 50% of real estate specialists
consider existing products unsuited to their needs.
The other reasons for the failure of specialists to
resort to derivatives are the investment rules in
force in the respondent’s organisation (for 42.9% of
those responding) and, to a lesser degree, a lack of
familiarity with the products (32.1%). For pension
funds and insurers, the lack of familiarity with real
estate derivatives is the primary obstacle to the
Executive Summary

12
use of these products (55.3% of 38 respondents),
followed by their unsuitability (34.2%) and by
regulatory restrictions (31.6%). For diversified
asset managers, internal investment policies are
the main obstacle (42.9%), ahead of a lack of
familiarity with the products (35.7%) and their
unsuitability (28.6%).
Key success factors for property derivatives: index quality, contract liquidityThe transparency of the index underlying the
contracts is the primary requirement. Investors
also deem its representativity very important—
somewhat more so than its breadth. The liquidity/
investability of the index is a noteworthy criterion
as well, particularly among non-specialists. The
main investor demand of the market—far ahead
of demand for effective hedges, for cost-reduction
capacities, and for a central counterparty to
reduce risk—is for contract liquidity.
Investors are unanimous in their rejection of
indices based on the opinions of real estate agents
and report an overall preference for constant-
quality transactions-based indices.
The ideal property derivative: a medium-term, highly liquid forward contract on the total return of a country or international commercial real estate index of all property or of a single property typeOverall, investors prefer futures contracts, but it
is swaps that account for nearly all of current
market volumes. They are content with total
return derivatives and there is little demand for
disaggregating rents and capital values.
Real estate specialists have a neutral view of all-
property index derivatives as long as residential
properties are excluded, consider sector and
sub-sector index derivatives somewhat useful,
and have no interest whatsoever in derivatives
linked to housing price indices. The pension
funds, insurance companies, and diversified asset
managers with significant real estate investments
focus on property-type indices of commercial
real estate and are also interested in all-property
indices; smaller diversified asset managers, by
contrast, are drawn first to derivatives of all-
property indices, then to property-types.
The bulk of demand is for derivatives for
investment at the country level, but there is also
a significant interest in continental derivatives;
at best, investors are indifferent to the idea of a
global real estate derivative.
All investors report high liquidity requirements with
respect to derivatives contracts: the three most
frequently mentioned periodicities are monthly,
weekly, and daily. Diversified asset managers may
report the highest liquidity requirements, but—for
their modes and horizons of investment—other
investors have surprisingly high requirements.
The one-year maturity garners the most votes
from all three types of investors. For real estate
specialists, the next two most frequently
mentioned are the five-year maturity and the
three-year maturity. For pension funds and
insurance companies, it is the two- and three-
year maturities. Diversified asset managers have
a short-term outlook, as their maturities of choice
extend to at most one year.
Executive Summary
An EDHEC Risk and Asset Management Research Centre Publ icat ion
EDHEC European Real Estate Investment and Risk Management Survey - November 2007

1. Real Estate as an Asset Class
13An EDHEC Risk and Asset Management Research Centre Publ icat ion

14
1.1. From building to asset class1.1.1. The characteristics of the underlyingLand and buildings are physical assets that are
directly involved in production, whereas the
financial assets linked to real estate confer
ownership rights (contingent for debt) to the
real assets as well as to the income and benefits
they produce.
The main distinctive features of the real estate
underlying are its high unit value, its indivisibility,
its great heterogeneity, its fixed nature, and the
considerable amount of day-to-day management
it requires.
High unit value and indivisibilityIn late 2006, the average value of a property in
the pan-European commercial real estate index
published by Investment Property Databank was
€16 million. Average values were as much as five
times higher (appendix 1) for some countries than
for others and around twice as high for office or
retail properties as for industrial or residential
properties.
Carving up buildings is not easy, and commercial
buildings usually have single owners. It is possible,
of course—and not uncommon—for institutional
investors to work out club deals or create joint-
ventures to acquire particular buildings, but
experiments with the securitisation of property
have, in Europe at any rate, resulted in failure.
By preventing the direct participation of many
investors and making the market less granular,
these characteristics reduce market liquidity.
Heterogeneity and real nature of propertyEach building is unique as a result of its location,
its architecture, its structure, its size, its age, its
condition, the use to which it is currently being
put, and so on. In addition, a single building can
be rented under different conditions (length of
lease, indexation policies, and so on) and to very
different tenants (in terms of their number, their
diversity, their creditworthiness).
Because of the important role property development
and management play in the economy and in
public welfare, they are closely watched over by
all levels of government. National, regional, and
municipal regulations on the construction and
use of buildings reinforce their location-specific
nature. In a context of growing international tax
competition, the fixed nature of property is a
drawback with respect to more mobile forms of
capital, and specific taxes or duties on real estate
transactions—in addition to those on rental income
and on capital gains—remain high.
This heterogeneity and this location-specific
character mean that buildings are traded fitfully
on decentralised direct-search or brokered markets.
The price of a real estate transaction is the result
of a private negotiation between the seller of a
particular property in a particular location and a
buyer; it is not an equilibrium price determined
through the centralised-market participation of
multiple buyers and sellers in the continuous-time
auction of a fungible asset.
High information costs (search, appraisal, inspection)
and other high transaction costs are associated
with market structures of this sort. The private
and asymmetric nature of information in the real
estate markets, on the other hand, usually leads
to the assumption that the likelihood of abnormal
returns is greater.
Property management requiredThe owner of a building has substantial management
responsibilities with respect to both tenants and
government authorities. These responsibilities
require a degree of fieldwork that depends on the
type of building, the passive holding of which is
impossible. They demand diverse skills and generate
substantial costs. They can be sourced to so-
called asset managers or property managers. The
1. Real Estate as an Asset Class
An EDHEC Risk and Asset Management Research Centre Publ icat ion
EDHEC European Real Estate Investment and Risk Management Survey - November 2007

15An EDHEC Risk and Asset Management Research Centre Publ icat ion
EDHEC European Real Estate Investment and Risk Management Survey - November 2007
institutional investors most active in real estate
may take on these responsibilities themselves by
creating specialised affiliates, but the local nature of
buildings reduces economies of scale or encourages
a potentially dangerous geographic concentration
of investment.
Direct control of property may also be a source
of value creation: the investor can renovate or
reposition the building, and manage the portfolio
of leases in such a way as to maximise rental
income—these value-adding strategies undertaken
at property level may be timed to accompany
market-wide changes for maximum impact.
As a result of the greater heterogeneity of buildings,
specific risk accounts for a larger share of total
risk for real estate than it does for conventional
assets. Low granularity and heterogeneity lead to
illiquidity and to diversification challenges. For
these reasons, direct real estate investment has
traditionally been long-term, active, and focused
on individual properties or—for want of sufficient
human and monetary resources—rejected outright.
The validity of this proposition has been called into
question by the emergence of vehicles for indirect
investment in real estate.
1.1.2. Classification of vehicles for real estate exposureGiven the high unit values of properties and
the interest tax shelter, investors and owner-
occupiers have traditionally borrowed from financial
institutions to finance a significant share of the
purchase price. With some exceptions, the loan is a
mortgage: the property acquired with the aid of the
loan is used as collateral against borrower default,
and the lender can foreclose. This sort of collateral
allows high levels of debt and, at the same time,
ensures relatively low interest rates.
In the past, these mortgage loans remained on the
books of the financial intermediaries that granted
them until they were paid off; on rare occasions
they could be transferred in their entirety to other
financial institutions. Like other loans, real estate
debt was used in securitisation deals first in the
US, then in Europe, and now there are markets for
securities—backed by mortgage loans—that allow
investors to acquire exposure to real estate debt
without acting as lenders.
The need for equity-capital financing and risk-
sharing has also led investors to seek partners—some
more active than others—or to create vehicles
for collective investment schemes. Raising large
amounts of funds makes it possible to build a
portfolio of properties and reduce risk through
diversification.
The separation of management and ownership
enables investors who have neither the resources
nor the expertise to acquire and manage real estate
portfolios directly to participate in the market.
Joint ventures and collective investment schemes
allow greater investor participation and reduce
market granularity; they do not necessarily lead
to greater liquidity.
Public markets are additional long-term sources
of capital for real estate funds and property
companies. Low denomination instruments for
indirect investment in real estate, for which there
is an active secondary market, offer superior
liquidity and may appeal to both institutional and
retail investors.
1. Real Estate as an Asset Class
Privately placed Publicly traded
Equity • Direct investment• Private property companies
• Private collective instruments
• Public property companies• Publicly traded collective schemes
Debt • Direct lending• Private collective investments in mortgage debt
• Mortgage-backed securities
Exhibit 1: The quadrant model of real estate investment

16
1. Real Estate as an Asset Class
An EDHEC Risk and Asset Management Research Centre Publ icat ion
EDHEC European Real Estate Investment and Risk Management Survey - November 2007
Exhibit 2: The Chen and Mills argument for real estate equity as an asset class (2004)
Sufficient size
• Real estate comprises 10% to 20% of the total capitalisation of stocks, bonds and real estate in developed countries.• The market is deep enough to support a 10% or greater real estate allocation in an efficient mixed-asset portfolio.
Competitive returns compared to stocks and bonds
• Real estate has historically provided 4% to 6% average annual real rates of return.• The low volatility of real estate returns leads to competitive risk-adjusted performance over time.
Unique return characteristics
• Its low correlation to other major asset classes provides diversification benefits to a mixed-asset portfolio. It exhibits inflation hedging capabilities over time.• Current income generally comprises the largest component of total returns.
Box 1: Main criteria for the constitution of asset classes
• distinctive features with respect to the nature of and markets for the primary underlying assets
• intra-group conceptual similarity
• subject to the same laws and regulations
• substantial size of investment universe and sufficient number of representative investment
opportunities
• distinctive and relatively stable risk and return profiles
• distinctive within group correlations
• dependence upon common identifiable economic factors that can be quantified and used for
forecasting
• availability of information on the characteristics and prices of investments
• possibility of passive investment at published prices and for sufficient amounts
Real estate investment was conventionally limited
to private market equity and debt investments. The
development of publicly traded real estate securities
has brought about an expansion of these modes
and a quadrant approach to real estate investment
has emerged with one private/public axis and one
debt/equity axis (exhibit 1).
1.1.3. The real estate asset class: its existence and its boundariesIn defence of real estate as an asset classThe existence of a real estate asset class as such has
direct consequences on asset allocation policies, but
there is no standard definition for what constitutes
an asset class. Among the criteria used to determine
whether a group of investments is an asset class are
(box 1) fundamental classification criteria, criteria
linked to investment restrictions, as well as those
used in asset allocation and the modelling of asset
allocation.
Observers such as DeLisle (1995, 2002) or Chen
and Mills (2004) use these criteria to justify putting
both direct and indirect real estate equity investment
into a class of its own. Exhibit 2 summarises the
arguments put forward by Chen and Mills.
Thrashing out the boundaries of the real estate asset class Traditionally, non-listed equity investments alone—
the northwest quadrant—were considered genuine
investments in real estate. Listed property companies
were considered a sector of the stock market and
debt linked to real estate was merely another fixed-
income product.
Now, convention has it that equity investments,
whether listed or not—in other words, the two
northern quadrants—are to be placed together
in the real estate asset class. Differences in the
nature, composition, and calculation of indices are

17An EDHEC Risk and Asset Management Research Centre Publ icat ion
EDHEC European Real Estate Investment and Risk Management Survey - November 2007
largely responsible for the significant differences in
performance, as has been shown by many market
observers in the wake of the trailblazing work of
Pagliari, Scherer, and Monopoli (2003).1 In addition,
as has been shown by Booth and Marcato (2004a,
2004b), the correlation of listed and non-listed
investment vehicles is greater in the long term.
Other authors use a composite index of the four
quadrants to study the benefits of real estate in
a diversified portfolio.2 Although the quadrant
model is increasingly favoured when it comes to
illustrating the wealth of products linked to real
estate, the use of composite indices for strategic
allocation remains uncommon. Our fear is that, as a
result of its preponderance, real estate debt—whose
behaviour is much like that of other fixed-income
products3—will dilute the qualities specific to real
estate equity and distort multi-class allocation.
1.2. The main real estate investments1.2.1. Equity investmentDirect investmentDirect equity investment in property has historically
been the dominant form of institutional investment
in real estate. It allows the greatest control over asset
selection, over the financial and fiscal organisation
of the acquisition, over the management of the
property, and over its transfer.
Acquisition of a property or acquisition of a
company
Investment in the underlying physical asset can take
the form of a direct acquisition of the property or of
an acquisition (at 100% or as part of a joint-venture)
of a company in possession of the underlying.
Transactions in the physical real estate market are
subject to numerous taxes and fees. These costs can
be lower when the purchase is made by acquiring
a company.4 Acquisition through a company can
allow investors who are not authorised to use debt
to benefit from leverage.
To limit leakage linked to double taxation or to the
payment of taxes, which may never be recovered, by
investors not subject to taxation, it is important to
study the fiscal impact of the chosen vehicle.
Obstacles
Direct investment is a slow process that requires
multiple sorts of expertise (commercial, technical,
legal, fiscal). Direct acquisition or acquisition
through a company requires identification of the
property, appraisal of the property, negotiation with
the seller, the signature of preliminary contracts
full of conditions precedent, a complete audit5 of
the properties as well as of the contracts for the
fulfilment of conditions precedent, the closing of
the sale. If the acquisition is debt-financed, loans
and collateral must also be considered, and lender
may become a third party to the contract.
Property categories
In spite of their heterogeneity, direct investments
are usually categorised by property type or sector
and by geographical region. Property types differ
from country to country, but the categories at
the core of traditional institutional investments
are clear: office, industrial, retail, and—in most
countries—residential.
Nonetheless, appendix 2 shows that there are
significant variations from country to country in
the supply of properties by sector. Differences in the
economic structure and the maturity of the markets
for real estate investment, as well as differences
in the proportion of owner-occupiers—for both
residential and commercial properties—account
for these variations.
As a result of features that are, in principle,
substantially different, sub-sectors may also be
created. In the retail category, it may be useful,
for example, to distinguish between small shops
and larger shopping centres.
1. Real Estate as an Asset Class
1 - For example, Feldman (2003) or Riddiough, Moriarty and Yeatman (2005).2 - Hudson-Wilson, Fabozzi, and Gordon (2003), Hudson-Wilson, Gordon, Fabozzi, Anson, and Giliberto (2005). 3 - With the exception of hybrid products such as convertible bonds, mezzanine debt, or the equity tranches of securities backed by mortgage loans, all of which are grouped with stocks by informed investors.4 - If, for example, taxes on share transfers are lower and no exception applies to real estate firms or if corporate debt reduces the tax base. 5 - The audit will examine the sources of risk in the proposed acquisition and should analyse multiple dimensions (leases, service and maintenance contracts, potential litigation, title deeds, encumbrances, technical inspection of buildings, and so on). If a company is acquired, an audit of the company structure will be added to the audit of the properties.

18
In addition to the core sectors of real estate
investment, there are the so-called alternative
sectors: timberland, farmland, hospitals and health
facilities, nursing homes, student dormitories,
parking facilities, and infrastructure.
Real estate styles
There are at least three styles for real estate
along the risk-return axis: core, value-added, and
opportunistic. The style is largely a result of the
risk (linked to the amount of leverage) and of
the relative significance of the rental income and
the potential capital gain. In the United States,
the National Council of Real Estate Investment
Fiduciaries (NCREIF) has adopted a classification
for these styles (box 2).
Size and liquidity of the European market
In late 2006, RREEF (2007) put the total value of
European real estate at $9.2 trillion, of which $6.1
trillion is potentially available for institutional-
quality investment (38% of all such real estate in
1. Real Estate as an Asset Class
An EDHEC Risk and Asset Management Research Centre Publ icat ion
6 - The size of the market for real estate investment grows as properties appreciate, as owner-occuped properties are outsourced through sale and leaseback, and, less significantly, through property development.
EDHEC European Real Estate Investment and Risk Management Survey - November 2007
Box 2: Real estate styles according to the NCREIF (2003)
• CORE ASSETS
“Assets that achieve relatively high percentage of return from income and that are expected to
exhibit low volatility.“ In addition, they should belong to one of the property types considered “core”
for institutional investment (for the United States, office, retail, industrial (and logistics), and multi-
family dwellings, and increasingly hotels).
• VALUE-ADDED ASSETS
“Assets that exhibit one of more of the following attributes—achieve a significant portion of return
from appreciation, exhibit moderate volatility and/or are not currently considered core property types.
However, if the overall risk level is excessive, the asset should be classified as Opportunistic.”
• OPPORTUNISTIC ASSETS
“An asset that is expected to derive most of the return from appreciation or which may exhibit
significant volatility in returns. This may be due to a variety of characteristics such as exposure to
development, significant leasing risk, or high leverage, but may also result from a combination of
moderate risk factors that in total create a more volatile return profile.”
Analysis of the distinctive feature of these three styles sheds light on the sources of risk identified by
the NCREIF: the sector (core or alternative), the point on the life cycle (operating property, property
being marketed prior to completion or development and renovation), the occupancy rate, the rollover
concentration, the importance of near-term rollover, the leverage, the quality of the properties and
markets, and the control provided by the investment structure.
the world) and $3.2 trillion (33% of global supply) is
in fact available; that is, not held by owner-occupiers.
90% of the potentially investable supply is in Western
Europe, five countries of which are among the ten
largest institutional-quality real estate markets in the
world: Germany (3), the United Kingdom (4), France
(5), Italy (6), and Spain (9). For invested stock, the
major markets are the United Kingdom, Germany,
and France, followed by Switzerland, the Netherlands,
Sweden, and Italy (appendix 3).6
According to Jones Lang LaSalle (2007), direct
investment into real estate in Europe reached the
record sum of $242 billion in 2006. When the value
of the supply estimated above is divided by this
transaction volume, an average tenure of thirteen
years is implied, a result that shows very feeble
liquidity of the market in spite of a particularly
dynamic economic context.

19An EDHEC Risk and Asset Management Research Centre Publ icat ion
EDHEC European Real Estate Investment and Risk Management Survey - November 2007
Indices
The volume of transactions in the markets for
residential real estate has historically allowed the
computation of transactions-based indices by the
participants in the various phases of the acquisitions
process. The low number of transactions and the
lack of qualitative data on the properties justify
the use of appraisals—much more frequent than
transactions—in the market for commercial real
estate.
The private nature of real estate markets, as well
as their decentralisation, hinders information-
gathering, and the emergence of index providers
is a very recent phenomenon in most countries.
In Europe, IPD has a near-monopoly on this
business.
Appraisal-based indices are computed using the
totals of estimated market values, rents, and
capital expenses supplied at regular intervals by
a base of contributors. The composition of the
index changes with any changes in participating
contributors and with any sale or acquisition they
make. Computations are generally value-weighted.
The indices reveal overall performance trends. In
general, they provide figures for total return, rental
income, and estimated return on capital (net of
investment). These indices are computed for the
entire set of assets—that is, all-property and for
the main property-types. They can then be broken
down into sub-sectors, regions, and so on.
In Europe, IPD offers annual indices for all the
countries it covers but Ireland, quarterly indices
for Ireland and the United Kingdom, and monthly
indices for the United Kingdom; quarterly estimates
are available for Norway, the Netherlands, and
Sweden. There should soon be a half-yearly
estimated index for France. The extensive reach of
IPD’s databases makes its indices the benchmark
for tracking the performance of direct institutional
investment in real estate.
Several methods exist for the construction of
price indices for residential property based on
samples of transactions involving heterogeneous
properties, samples whose composition does not
necessarily reflect that of the market (sample bias)
and changes over each observation period. The
most common method—using so-called hedonic
regression—systematically corrects for quality
changes by taking into account information on the
attributes of these properties.
Non-listed collective investment vehiclesAdvantages and disadvantages
Indirect modes of real estate investment allow
investment at unit prices lower than those demanded
by the physical market, access to portfolios of
properties for which direct investment may be
unavailable or infeasible, and a semi-passive
management approach—once the vehicle is chosen,
investment and management are the responsibility
of outside specialists whose interests can be aligned
with those of the investors.
The advantages characteristic of non-listed private
vehicles are light regulation, access to financial
leverage, flexibility (which decreases as the number
of investors grows), and, for some, fiscal transparency.
In addition, they are appraised in the same way as
the underlying buildings and some can be traded at
prices approaching thenet asset value (NAV); as a
result, they are largely protected from stock market
fluctuations.
The primary disadvantages of these vehicles are their
limited liquidity, the smallness of their portfolios,
and their low level of transparency.7 In secondary
markets, fractional interests may command rational
discounts to NAV. Delegating investment decisions
involves a total or partial loss of control over
strategy implementation. The private nature of most
vehicles means substantial research, information, and
transaction costs for the investor, costs which must
be added to those borne by the vehicle as part of its
investment in the underlying physical market.
1. Real Estate as an Asset Class
7 - German open funds, public but non-listed, are, in this respect, entirely different.

20
In addition, choosing a non-listed investment
vehicle does not necessarily exempt the investor
from performing an initial audit of the portfolio of
buildings (when it has already been assembled), an
audit of the counterparty, or regular monitoring of
compliance with contractual requirements.
Great diversity
The non-listed investment vehicles8 landscape in
Europe is highly diverse, as each country has several
forms of business organisation. A 2001 IPF report
suggests a classification—in which there are four
common forms—by legal form of organisation:
corporations, partnerships, trusts, and contractual
agreements (appendix 4).
According to OPC (2004), partnerships are clearly
the most common form, followed by contractual
agreements, corporations, and trusts. When it
comes to gross assets, the order (after exclusion
of German funds, which are mainly owned by
individual investors) remains the same.
These vehicles may be open-end or closed. An
open-end fund allows both new subscriptions and
withdrawals, transactions that lead to fluctuations
in the amount of capital managed and thus to the
need to invest new funds or to liquidate assets
to cope with redemptions. Closed-end funds do
not offer this degree of liquidity: their capital
fluctuates only during new subscription periods.
Typically, open-end funds have no set lifespan,
greater amounts of assets under management,
and investments in less risky assets than do
closed funds. Closed-end funds usually have a life
cycle—determined at the outset but subject to
possible extensions—of a few years.
Size and characteristics of the market
According to figures from the European Association
for Investors in Non-listed Real Estate Vehicles
(INREV), the non-listed real estate fund market
has more than tripled over the last ten years. In
late 2006, the association’s database included 446
European vehicles managing a total of €224 billion
of assets, in addition to 32 open-end German funds
with €105 billion of assets under management.9
This growth is linked to an increase in the number
of conventional or “core” funds—as well as to
an increase in the amounts managed by these
funds—and to the emergence and development
of value-added and opportunistic funds.10 “Core”
funds manage approximately two-thirds of assets,
value-added funds approximately one-fifth, and
opportunistic funds approximately one-tenth. There
has been fast growth in pan-European products
in recent years, and 2006 saw the emergence of
funds of funds.
The average size of the funds is small: less than
€700 million—or €500 million not including
German open-end funds, which, with an average
size of more than €3 billion, are among the largest
European investors; the average varies considerably
from country to country (appendix 5).
Most vehicles are closed-end, with an initial
lifespan of between seven and ten years (Brounen,
Op’t Veld, and Raitio (2007)); if German open-end
funds are excluded, some 60% of assets are parked
in limited-life vehicles (otherwise, the figure is
40%). By volume, the bulk of the “core” funds
(and all open-end German funds, 92% of which
are “core”) has no maturity; riskier strategies, by
contrast, do.
Most funds invest in several property types (71%
with German open-end funds, 59% without) or
are specialists in the retail (12% or, excluding
German open-end funds, 18%), office (9% or 11%),
residential (3% or 5%), and industrial and logistics
sectors (3% or 4%). Specialist funds are essentially
multinational and the United Kingdom alone can
boast of depth in domestic sector funds.
1. Real Estate as an Asset Class
An EDHEC Risk and Asset Management Research Centre Publ icat ion
8 - For regulatory reasons, some of these vehicles—corporations and contractual funds—may be subject to technical trading on the stock market. 9 - Based on the overall figures provided by OPC (2005), we estimate that the INREV database covers approximately three quarters of the market. Brounen, Op’t Veld, and Raitio (2007) note that France is underrepresented, whereas the United Kingdom, Germany, and the Netherlands are overrepresented. The priority of the database is funds for institutional investors, but it also includes those aimed at retail clients.10 - INREV has attempted to produce standardised style definitions. These definitions have added a degree of transparency to certain fund attributes, but they remain vague and are as yet of only relative usefulness when it comes to asset allocation and risk management.
EDHEC European Real Estate Investment and Risk Management Survey - November 2007

21An EDHEC Risk and Asset Management Research Centre Publ icat ion
EDHEC European Real Estate Investment and Risk Management Survey - November 2007
Country funds (the United Kingdom, in particular,
but the Netherlands as well) predominate (more
than €150 billion), followed by funds for all of
Europe (more than €100 billion), Western Europe
(less than €25 billion), the Euro-zone and the UK,
the Euro-zone by itself, Central and Eastern Europe,
Southern Europe, and the Nordic countries.
The notion of investment style—reflecting the
diversity of styles used by institutional investors—
has taken hold in real estate. Several style palettes
are used to describe investment vehicles; as with
buildings themselves, the opposing poles along the
risk-return axis are the “core” and “opportunistic”
styles.
Indices
In Europe, as elsewhere, there is little information
on the performance of non-listed real estate
funds aimed at institutional investors. IPD markets
information in the context of its portfolio analysis
service. INREV has partnered with IPD to provide an
index of non-listed pan-European vehicles. It brings
together retail and institutional vehicles and in late
2006 it was based on 206 funds with net assets of
€153 billion. The INREV index is broken down into
sub-indices by amount of leverage and life-cycle
phase (investment, maturity, liquidation). In the UK,
the HSBC/AREF/IPD indices track the performance
of PUTs (property unit trusts open to the public
or only to institutional investors), their insurance-
company equivalents, managed pension funds, and,
lately, limited partnerships. Performance is a direct
reflection of return on NAV. In Germany, an index
of core funds can be computed daily using the NAV
of public open-end funds. In France, the institute
for real estate and land investment (IEIF) uses NAV
to produce an annual index of sociétés civiles de placement immobilier (SCPI), mostly closed-end
publicly traded but non-listed vehicles held at more
than 70% by individual investors.
Correlation with direct markets
Baum and Struempell (2006) report the results of
a 2005 OPC study on the correlation of non-listed
vehicles and the direct markets in Germany, the
Netherlands, and the UK. Exhibit 3 shows high levels
of correlation. Likewise, for France, the correlation
of the IPD index and IEIF SCPI index stands at 82%
for the period from 1986 to 2006.
Despite differences on the asset side (liquid assets
held by open funds, riskier assets by value-added
and opportunistic funds) and on the liability side
(leverage), non-listed vehicles retain in part the
statistical characteristics of direct real estate. Some
offer, in addition, liquidity superior to that of the
underlying, although there remain questions about
their ability to cope with the redemptions that often
accompany falling markets, as the recent open-
funds crisis in Germany has shown (appendix 6).
1. Real Estate as an Asset Class
Exhibit 3: Statistical characteristics of indices of non-listed funds compared to those of direct real estate indices
United Kingdom Base HSBC/APUT
1990-2004(Trusts/managed funds)
United Kingdom PVD index (IPD)
1999-2003(Limited Partnerships)
Germany1998-2003
Netherlands1999-2003
Correlation to local direct real estate index (IPD)
0.98 0.73 0.99 0.99
Sharpe ratio [direct index]
1.09 [1.08] 2.89 [3.78] 3.90 [3.86] 2.85 [2.92]
Tracking Error 1.68% 2.65% 0.48% 0.42%
Comments
Limited sampleJ-curve effect
contributing to volatilityLeverage
Limited sampleOpen-end funds
dominate the two indices
Limited sample
Source: OPC (2005) quoted by Baum and Struempell (2006)

22
Listed real estateAdvantages and disadvantages
A listing on a stock exchange allows the investor
to benefit from liquidity (whose degree depends on
the market float of and on the volume of trading
in the vehicle) without requiring that the vehicle
manager perform maturity intermediation, which
necessitates particular skills and may dilute the
real estate characteristics of the returns offered by
the vehicle. The largest stocks are also the object
of securities lending and borrowing and are thus
open to short selling.
The liquidity of listed property companies is far
greater than that of non-listed vehicles or of
buildings and their transaction costs, those of mid-
caps, are significantly lower. In addition, investment
in a property company gives the investor access to
a relatively diverse portfolio of usually excellent
quality, with leveraged returns. Management is
delegated to professionals and is tracked by the
community of analysts.
All the same, liquidity comes at a cost to the investor.
On the stock market, the value of the vehicle will
reflect microeconomic expectations as well as views
on attributes common to the listed real estate
sector or to the market as a whole.11 Continuous
trading on markets under the sway of expectations
naturally results in levels of volatility higher than
those in the markets for the underlying assets, to
the extent that volatility in these markets reflects
conservative, infrequent appraisals that attach
relatively little importance to expectations. Finally,
public offerings and listings lead to substantial
costs and in the absence of investor oversight the
separation of ownership and management can
worsen agency problems.
In early 2007, the listed property company markets
were still very narrow in some European countries
(Germany, in particular); total capitalisation,
liquidity, and specialisation will have to increase
before they become true institutional markets.
Correlation with non-listed real estate
Since expectations considerably influence the prices
of listed shares, while the appraisals used to compute
the NAVs of non-listed vehicles are (somewhat)
backward looking, a low contemporaneous
correlation between the indicators of these markets
is to be expected. Reworking indices to reduce
the smoothing caused by stale appraisal values
or—alternatively—the use of transactions-based
indices should result in an upward adjustment to
contemporaneous correlation.
By failing to take into account differences in risk,
other indicator problems will also cause optical
illusions: the comparison of the share price of
indebted companies and the value of debt-free
buildings, the comparison of composite indices
with different property-type mixes, and so on.
It is nonetheless clear that there are real divergences
to be exploited in the short term, to the extent that
transactions can be executed on the two markets at
levels approaching those of the indicators12 and that
these markets diverge along such axes as liquidity,
transparency, governance, and oversight.
Size and characteristics of the market
In 2005, Europe had a listed real estate sector that
was underdeveloped compared to that of North
America and Asia, but in 2006 its relative size more
than doubled (exhibit 4).13
In late 2006, the total capitalisation of European
property companies amounted to €327 billion,
23.2% of global capitalisation (EPRA (2007)). In
Europe, the UK is by far the largest market in
terms of total capitalisation (28%), followed by
France (19%), Spain (15%), the Netherlands (8%),
Austria (6%), Germany (6%), and Sweden (5%).14
The largest listed markets relative to the size of the
domestic underlying real estate markets are Austria
(20%), Spain (13%), Sweden (12%), the Netherlands
(12%), the United Kingdom (10%), Luxembourg
(9%), France (8%), and Poland (8%).
1. Real Estate as an Asset Class
An EDHEC Risk and Asset Management Research Centre Publ icat ion
11 - Listed property companies are thus advance indicators of developments in the physical market that appraisals pick up on late. As indicators, however, they are subject to the usual ebb and flow of the stock markets—the signal-to-noise ratio depends both on the maturity of the listed property company sector as a specific section of the equity market and on the economic situation.12 - Whatever the biases of appraisal may be, products traded with reference to NAV allow the investor to benefit from them; likewise, the yield on a listed investment is determined directly by its sale and purchase price on the exchange and by distributions. 13 - Generalisation of the real estate investment trust status and the advantages associated with the transfer of assets to these companies make it likely that owner-occupiers will increasingly resort to outsourcing their real estate holdings and that the share of investments held by these listed companies will grow. In fact, for property companies 2006 was a record year for listings and increases in equity capital, and it saw a marked revaluation of property company stock prices (reduction or reversal of the discount on NAV). New accounting standards, which require the presentation of the real value of buildings in the balance sheet and are thus responsible for volatility in the books, may also contribute to this trend.14 - The criteria used to determine the eligibility and weighting of the components of the indices bolster the lead of the UK and send Spain tumbling down the charts. 15 - These numbers were obtained from information in the EPRA/NAREIT ranking published in Europe Real Estate Yearbook 2007.
EDHEC European Real Estate Investment and Risk Management Survey - November 2007

23An EDHEC Risk and Asset Management Research Centre Publ icat ion
EDHEC European Real Estate Investment and Risk Management Survey - November 2007
Countries with larger economies are under
represented, while others with much smaller
economies are overrepresented, a circumstance
that owes much to differences in the share
of owner-occupiers in the physical real estate
market, to the relative importance of direct and
indirect investment, to the existence of non-listed
competing indirect media, and to tax regimes.
In early 2007, the average (median) assets controlled
by the 100 largest European property companies
amounted to €3.3 billion (€1.6 billion) and
capitalisation stood at €2.2 billion (€1.3 billion).
While over 90% of listed property companies in the
US are sector specialists, the majority of European
companies are diversified. Of the largest European
property companies, forty-two were specialists with
over 75% of total investment in a single sector
(office or retail for three quarters of them) and
twenty-three of these sector specialists were also
country specialists. So it is not easy for an investor
to use property companies to implement precise
strategies by property type; even more difficult is
doing so both by property type and by country.15
Real Estate Investment Trusts (REITs)
REITs, created in 1960, are a modern structure
for investing in real estate and, with their
favourable tax status, they contributed greatly to
the expansion of listed real estate in the United
States (appendix 7) before spreading to the rest
of the world at the beginning of the millennium.
In late 2006, seven European countries had a
national brand of REITs: the Netherlands, Belgium,
France, Greece, Bulgaria, Turkey, and the United
Kingdom (launched on 1 January 2007). In the
first six months of 2007 they were joined by
Germany and Italy.
Several reasons have been mentioned for the
use of this vehicle throughout Europe: to fall
into line with the competition and to combat
offshore financial centres, to strengthen the
long-term financing of property corporations,
to diversify investment choices for institutional
investors, to foster transparent and liquid real
estate investments, to spur economic progress
through the outsourcing of real estate holdings,
to improve the information efficiency of the real
estate market, to prevent a crisis in the underlying
market linked to mass liquidations of closed-end
funds upon maturity, to create an underlying for
a derivatives market, and even for a one-time
injection of tax revenues as a result of taxes
levied as companies and assets migrate toward
the REIT status.
Among the twenty or so countries throughout the
world with such arrangements in place, there is a
great variety of authorised activities and of capital
structures or of governance and taxation—as real
estate is a key sector, the characteristics of these
arrangements are continuously amended under
pressure from interest groups and in the name of
international competitiveness. The chances of a
uniform status throughout the European Union
are still very remote.
1. Real Estate as an Asset Class
Exhibit 4: Listed real estate in the major regions of the world
RegionShare of commercial real estate 2006
(2005)Share of the stock market 2006
(2005)
Asia-Pacific 14.57% (9.25%) 4.46% (3.35%)
Latin America 0.27% (0.33%) 0.12% (0.17%)
North America 8.97% (9.67%) 2.90% (3.27%)
Europe 6.30% (2.83%) 2.73% (1.54%)
WORLD 8.80% (6.59%) 3.16% (2.70%)
Source: Figures based on information from EPRA reports and from the FTSE EPRA/NAREIT Global Real Estate Index—Monthly Bulletin 30/12/2005; 29/12/2006, and 30/04/2007.

24
Broadly, REITs offer fiscal transparency for
real estate earnings, deduction of dividend
payments from corporate income tax, or elimination
of corporate income tax—however, obligations must
be met with respect to:
• the nature of the assets and of the activities
authorised so that long-term investment
predominates—property development activities
are limited or restricted to subsidiaries subject to
taxation.
• the nature of profits, a large proportion of which
must come from rent, capital gains on real estate
disposals, and other similar sources.
• the distribution of almost all of their income.
• governance, capital distribution, and negotiability
of shares.
Appendix 8 lists the main features of REIT regimes
in Europe.
The fiscal transparency of REITs makes listed real
estate more attractive to institutional investors, but
for international investment in particular there are
still problems linked to the withholding of taxes at
source and to limits on holdings.16
Real estate funds and ETFs
The dynamism of the physical market for real
estate and of alternative investment has led asset
management firms to launch specialised funds: the
development of the listed real estate sector allows
them to use their expertise to offer the greater
public new tools for diversification in both active
and passive asset management. A count done by
AME Capital and quoted in Emerging Trends in
Real Estate—Europe 2007 shows that there are now
more than 100 global funds specialised in listed
real estate, of which some fifty focus exclusively
on Europe. These funds had a total of $39bn of
assets under management.
Indices
Institutional investors can count on two major
families of indices covering Europe: one linked to
the FTSE EPRA/NAREIT alliance and the other to
Global Property Research; there are index funds,
ETFs, and derivatives for some of the indices in
these families. In 2007, IEIF and Euronext created an
index of European REITs in the hopes that it would
become the benchmark for ETFs, certificates, and
other derivatives. The S&P/Citigroup and the Dow
Jones Wilshire indices for global listed real estate
are not available for Europe alone.
Because of their selection criteria based on listing,
capitalisation, and liquidity, international property
indices cannot be considered representative of
institutional investment in real estate. And because
listed real estate markets in some countries are
at more advanced stages of development than
in others, these indices are not representative in
terms of geography.17 In addition, even in the most
developed markets, domestic indices are still prone
to insufficient economic diversification.18
Correlation with the stock market and direct real
estate
The correlation of daily returns of property indices
and broad stock market indices is significant. Indeed,
from 2003 to late August 2007, the correlation
of the Euronext IEIF REIT Europe index and the
Dow Jones Euro Stoxx 50 (large caps) is around
40% and its correlation with the Dow Jones Euro
Stoxx Small is around 60%. This correlation has
fallen over time19 but, as exhibit 5 shows, prices
for listed real estate remain much more closely
correlated to the stock market than do sale prices
for buildings. This observation is commonly relied
on in arguments for the superiority of direct real
estate when it comes to the diversification of a
multi-class portfolio. The correlation of direct real
estate indices and property corporation indices is
usually low and unstable.20
1. Real Estate as an Asset Class
An EDHEC Risk and Asset Management Research Centre Publ icat ion
16 - In many cases, investment through a non-listed vehicle offers competitive tax advantages; for sophisticated institutional investors, the appeal of REITs for tax purposes may not be so great.17 - In late 2006, and with respect to IPD’s country estimates for real estate available for investment, Spain was underrepresented by a factor of 12.5 and Austria was overrepresented by a factor of 4.4 in the FTSE EPRA/NAREIT Europe index. In addition, Denmark (7.3), Germany (4.1), Norway (2.9), Switzerland (2.5), Italy (2), and Finland (1.9) are plainly underrepresented, whereas the UK (1.3) and the Netherlands (2.2) are plainly overrepresented. 18 - In late August 2007, the leading French property company accounted for nearly 30% of the market value of the index and the five largest companies for more than 70%. This problem is quickly being resolved at the European level, the largest capitalisation in the IEIF Europe index nonetheless accounted for nearly 9% of the market value of the index and the weight of the top five was still greater than 30%.19 - This fall is generally ascribed to the maturation of the market, but it is also linked to “regulatory shocks” that have affected listed real estate. Plans for favorable tax designations, for example, led to one-time reevaluations of the sector.20 - For example, the rolling correlation over ten (five) years of the IEIF Foncières index and the IPD Bureaux France index is on average 11% (-31%) between 2000 and 2006, with extremes -12% and +34% (-75% and +83%).
EDHEC European Real Estate Investment and Risk Management Survey - November 2007

25An EDHEC Risk and Asset Management Research Centre Publ icat ion
EDHEC European Real Estate Investment and Risk Management Survey - November 2007
1. Real Estate as an Asset Class
Exhibit 5: Correlation of stock market indices and indices for listed and non-listed real estate in France (1990-2006)
Historical Correlation (10-year rolling correlation)
Annual dataIPD Offices France
IEIF Property Companies(real estate investment only)
IEIF Real Estate France(includes investment,
development and associated services)
SBF2500.10
(0.06)0.38
(0.36)0.48
(0.50)
CAC400.11
(0.06) 0.30
(0.32)0.40
(0.46)
1.2.2. Debt investmentMortgage loansIn the mortgage a company extends a long-term
loan to a borrower whose collateral is the property
that is the object of the loan. It is one of the
traditional forms of institutional investment in real
estate, but it is rarely labelled as such.
Two indicators are used by so-called originators to
monitor the risks of default: the loan-to-value ratio
and the debt coverage ratio—the critical levels of
these ratios change with business cycle changes and
with competition. The benchmark value used for the
loan is determined by a prudent appraisal of the
future saleability of the property—speculative sources
of value should not be taken into account.
The nature of the originator depends on local laws
and usages; in some countries, it is a credit institution
such as a bank, a savings and loan institution, or a
non-depository institution specialised in real estate
loans, while in other countries—the UK and the
Netherlands, for example—insurance companies are
major lenders, in some cases—as in the US—pension
funds are active in this market.
The transfer of a loan, a non-standardised contract
between two parties in a commercial relationship,
is not easy. Traditionally, the lender keeps the loan
on its books until it is paid off in full. However,
securitisation allows lenders to transfer all or part
of the risk of a loan or group of loans to a third
party and thus to free capital for the origination
business, which can be looked on as a distinctive
area of expertise. Securitised instruments can be
traded on private or public markets.
Securitised debtMortgage-backed securities are securitisation
instruments that represent an interest in, or are
backed by and payable on, the cash flows generated
by a pool of real estate assets. These assets are
typically held by “bankruptcy-remote” special
purpose vehicles or entities (SPV/SPE), entities
with a separate legal existence whose investors are
protected if the parent company goes bankrupt.
These securities, listed in box 3, allow investors to
gain access passively to large-ticket markets and to
do so with greater liquidity and diversification.
Following the example of the RMBS market, which
expanded greatly in the 1980s, the CMBS market
experienced strong growth in the US starting in
the early 1990s. Its takeoff in Europe took place
in 1999. At first, the market was essentially for
the securitisation of single-borrower large-loan
transactions, but it has since become more diverse.
Most issues are rated AAA, but the proportion
of non-investment grade tranches, which offer
higher expected returns at the cost of greater risk,
has increased; growing demand from insurance
companies, hedge funds, and banks was narrowing
the return spread until crisis in the markets for
subprime residential mortgages spread to the debt
markets as a whole.
In Europe there are numerous so-called conduit
programmes that lend with a view to immediate
securitisation—competition with conventional
lenders has led to lower profit margins and greater
volume.

26
Just before the crisis in the subprime American
housing markets spread to credit markets as a
whole, risk premia on European CMBS had fallen
to historical lows.21
According to HVB (2007), €280.5 billion of RMBS
and €68.4 billion of CMBS were issued in Europe
in 2006. RMBS are the largest single component
of the European securitisation market, but their
share is shrinking as a result of the dynamism of
CMBS and CDOs22 (some of which are founded on
the subordinate tranches in CMBS or on bundles
of lower quality mortgage loans). The UK has the
most developed market by far, but the Continent
is the leading issuer.
1. Real Estate as an Asset Class
An EDHEC Risk and Asset Management Research Centre Publ icat ion
21 - Before the summer 2007 crisis, risk premia on AAA-rated securities were at 14 basis points and as low as 90 basis points for BBB-rated securities. By the beginning of autumn, the flight to quality had sent all risk premia on CMBS upward and the gap between senior and junior tranches widened considerably: premia were then at 28 basis points on AAA-rated tranches and from 120 to 170 basis points on BBB-rated tranches. At the same time, new issues dried up and landmark operations were postponed—HSBC’s €1.2 billion securitisation of a loan awarded to Metrovesca for the acquisition of the bank’s headquarters on Canary Wharf and a Lehman Brothers CMBS of approximately €1.5 billion backed by the Cœur Défense building.22 - Collateralised Debt Obligations are vehicles for the securitisation of portfolios of bonds or debt. Asset-Backed Securities CDOs hold portfolios of these assets and the yield to the holder comes from the income flows generated by these assets. Since 1999 some of these securities have specialised in commercial real estate debt (Commercial Real Estate CDOs)—in their portfolios there are usually subordinate tranches of CMBS and property company bonds with similar ratings. Nearly two-thirds of investors in CDOs are financial institutions and asset managers—insurance companies and hedge funds are also active in this market.
EDHEC European Real Estate Investment and Risk Management Survey - November 2007
Box 3: Types of mortgage-backed securities
Brueggeman and Fisher (2005) identify four kinds of mortgage-backed securities (MBS). These
securities can be backed by residential mortgages (RMBS) or by commercial mortgages (CMBS).
• Mortgage-backed bonds (MBBs) are a general obligation of the issuing entity and payments are
collateralised by a pool of mortgages of which the issuer retains ownership. The market value of the
mortgages must be maintained to keep default risk to stipulated levels.
• Mortgage pass-through securities (MPTs): issued by mortgage originators; holders have ownership
interests in mortgage pools and receive principal and interest from the pool. These securities are
commonly used for the securitisation of residential mortgages.
• Mortgage pay-through bonds (MPTs) can be viewed as a combination of the instruments above:
cash flows from mortgage pools are passed through to investors, but the issuer retains ownership of
these pools.
• Collateral Mortgage Obligations (CMOs) are organised along the same lines but issued in
multiple tranches. Amortisation and prepayments pass through to the holders of different tranches
in a pre-defined order of priority. The difference between the amount of debt issued against the
pool—liabilities—and the assets pledged as security constitutes the equity of the issuer. Multiple
tranches allow the issuer to offer investors multiple return profiles (maturity period, nature,
volatility); some provide greater predictability with respect to cash flows than do the two preceding
instruments. Investors in the highest-quality tranches are paid first, followed by those in intermediate
or mezzanine tranches, with residual flows reaching the most speculative tranches. Tranches are
generally rated either investment grade or intermediate grade; tranches beneath intermediate grade
are lowest in the order of priority and are usually unrated.
Multiple tranches appeal to more investor groups, and as a result the value of the instrument is
generally greater than that of the pool of mortgages, thus allowing lenders using securitisation to
award loans on more aggressive terms.
Commercial mortgage-backed securities have maturities shorter than those for residential mortgages,
but pools of commercial mortgages are amortised at term, which extends their duration. For CMBS
this CMO model is dominant.

27An EDHEC Risk and Asset Management Research Centre Publ icat ion
EDHEC European Real Estate Investment and Risk Management Survey - November 2007
1. Real Estate as an Asset Class
Exhibit 6: Alpha and beta exposure, risks, advantages and drawbacks of various modes of real estate exposure
Mode Beta Alpha Main risks Advantages and disadvantages
Direct acquisition of building
Beta of asset Alpha of assetSpecific risk of asset
⇑ Opportunities awarded by direct control⇑ Tailor-made investment strategy⇓ High specific risk⇓ Expertise required for property management⇓ High minimum investment⇓ Low liquidity⇓ High direct and indirect transaction costs⇓ Long lead times
Listed property companies
Beta of shareAlpha of the property company
Specific risk of the company, specific risk of its portfolio; equity market risk
⇑ Transparency of a listed investment⇑ Simplicity of investment in shares⇑ Liquidity (of mid caps)⇑ Low minimum investment⇒ Diversification of property portfolio⇓ Equity market risk⇓ Specific company risk⇓ Limited supply: unequally developed markets across Europe, limited number of sector specialists at the country level⇓ Securities taxation⇓ Costs of being listed
Index of listed property companies
Beta of listed real estate sector
None
Systematic risk of equity market; listed real estate sector risk; systematic real estate risk
⇑ High diversification⇑ Partial exposure to real estate risk (in the long term)⇓ High exposure to equity market risk⇓ Securities taxation
Non-listed collective investment vehicle
Beta of vehicle
Alpha produced by manager
Risks specific to the vehicle and its portfolio; some systematic real estate risk
⇒ Diversification (extent limited by the size of the vehicle)⇒ Delegated active management⇒ Variable liquidity (sometimes lower than that of direct investment, possibly good for open-end vehicles)⇒ Medium to low minimum size of investment⇒ Variable transparency ⇒ Leverage⇓ High costs⇓ Limited supply: unequally developed market across countries and sectors, few sector specialists at the country level⇓ Specific risk (vehicle, portfolio, asset manager)
Direct real estate index
Beta of market or sector
NoneSystematic risk (at market or sector level)
⇑ Pure exposure to market or property type risk ⇒ Some liquidity through nascent derivatives markets⇓ Transparency⇒ Variable index quality
Mortgage loan Beta of loan Alpha of loan
Interest rate risk; possible prepayment risk; and specific borrower default risk
⇑ Opportunities awarded by direct control⇓ Expertise required for lending activity⇓ Specific borrower and collateral risk⇓ High minimum investment⇓ Indirect exposure to real estate⇓ Low liquidity
Mortgage-backed security
Beta of security
Alpha of security
Interest rate risk; possible prepayment risk; and credit risk specific to portfolio
⇑ Diversification⇒ Medium size of minimum investment⇒ Liquidity⇓ Indirect exposure to real estate
1.2.3. Real estate vehicles compared

28
1.3. Allocation to real estate in a multi-class portfolio“A man should divide his capital into three parts, and invest one-third in land, employ one-third in merchandise, and reserve one-third in ready money” Baba Metzia, fol. 42, col. 1.
As the Talmud shows, real property has been
a natural part of asset allocation since time
immemorial. Long present in the books of European
institutional investors, real estate began to gain
acceptance in the US in the inflationary 1970s; in
the wake of the early 2000s stock-market crash
and facing low yields on the fixed-income markets,
investors worldwide have turned en masse towards
real estate as a source of alternative beta (risk
premia) and alpha (abnormal performance) and
are now seeking to increase their allocations to
this asset class.
1.3.1. Ideal allocation modelHere we describe an approach to ideal allocation
that first takes into account the investor’s liabilities
and determines the strategic allocation to real
estate accordingly; it then manages the allocation
optimally from an asset-management point of
view. This approach sheds light on the presentation
in academic studies of the role of real estate in
mixed-asset portfolios and it provides a basis for
comparison to the practices described in chapters
2 and 4.
Real estate in asset liability managementWhile real estate has unique and appealing
characteristics for asset allocation, some of its
particularities make working it into an Asset Liability
Management (ALM) framework a challenge.
Any allocation exercise first requires precise
demarcation of the asset class—while most investors
now approach real estate as an asset class, there is
as yet no consensus on what instruments belong to
it: at one end of the spectrum there is the risk of
focusing too closely on the idiosyncrasies of each
property and failing to recognise the potential
of real estate as a class; at the other, there is the
danger of using an all-encompassing quadrant
model that dilutes the unique characteristics of
1. Real Estate as an Asset Class
An EDHEC Risk and Asset Management Research Centre Publ icat ion
EDHEC European Real Estate Investment and Risk Management Survey - November 2007
Exhibit 7: Modes of real estate exposure on a risk-return spectrum, drawing on Rottke (2005)
SeniorDebt
Direct Core Assets
Direct CoreFunds (OE)
Direct CoreFunds (CE)
MezzanineDebt
AddedValue funds
Opportunityfunds (PE)
Developmentfunds
VC funds
Retu
rn
Risk
Core Core Plus Value-Added Opportunistic
Economic risk
Leverage Risk
Listed realEstate

29An EDHEC Risk and Asset Management Research Centre Publ icat ion
EDHEC European Real Estate Investment and Risk Management Survey - November 2007
real estate equity assets and turns the portfolio into
a composite of public and private, debt, and equity
investments. Nor has the notion that listed property
securities are real estate won unanimous backing.
But squabbles over the bounds of real estate should
not obscure the fact that real estate is no less of
an ALM class than are bonds and equities. And,
as with the bonds and equities, diversity within
the real estate class lends itself to analyses based
on sectors and styles- and should be of great
relevance at the asset management (AM) stage.
Once the bounds of real estate have been more
clearly defined, it is necessary to come up with a
model of long-term returns for the class and to
calibrate it. Complex multivariate approaches may
be required to optimise AM, but stochastic models
for ALM demand parsimony and stability.
Extracting model parameters is, of course, never
easy, but real estate data pose specific challenges,
as they are both scarce and noisy. Two decades of
academic research have documented the issues
associated with the structure of the private and
public property markets, as well as the biases of
the various index construction methodologies.
Remedial procedures have been developed and
data challenges are no longer major impediments
to the stochastic modelling of long-term real estate
returns required for ALM.
After the stochastic models for assets and liabilities
have been defined and calibrated, the strategic
allocation to real estate and other classes is the
output of the optimisation that corresponds to
the investor’s overall objective—for example, to
minimise shortfall risk, or to optimise surplus for
a pension fund.
Because of the cyclical nature of real estate markets
and the lack of normality of property returns,
dynamic asset allocation strategies for ALM and
ALM tools incorporating the impact of parameter
and model risk are recommended.
Real estate probably deserves a role in liability-
driven investment (LDI). With its (disputed) inflation-
hedging characteristics and its links to demographic
factors, real estate may have a natural place in
liability-matching portfolios used to immunise
defined benefit pension schemes against inflation
or longevity risks. Nor would real estate—with its
attractive risk/return characteristics and relatively
low correlation to other asset classes—be out of
place in performance portfolios.
Real estate in asset managementOnce the ALM exercise has produced a strategic
allocation to real estate, asset management
practices attempt to optimise its contribution
to the portfolio. At the heart of AM is portfolio-
construction, a process that aims for asset allocation
for maximum diversification benefits. Both real
estate holdings themselves and overall portfolios
can be optimally diversified.
Real estate portfolio diversification
In the real estate portfolio, diversification includes
the elimination of unwanted asset/property specific
risk—a task made difficult by the heterogeneity,
large minimum commitments, non-divisibility, and
high transaction costs of property investments. But
it is crucial, as real estate risk is overwhelmingly
idiosyncratic.
A scientific approach to diversification presupposes
the ability to identify and quantify the miscellaneous
sources of risk affecting real estate assets across
vehicles, sectors, and regions. Risk factors, risk
premia, and betas must be specified for AM models
to become operative.
For the formulation and implementation of
investment strategy, heterogeneous real estate
assets have historically been bundled into ad hoc
groupings based on location and property sector.
More recently, there have been classifications
by economic rather than geographic region and
by investment style. These classifications must
1. Real Estate as an Asset Class

30
be examined to determine to what extent they
correspond to different fundamentals and can be
used as a basis for diversification. Once investment-
relevant classifications have been established based
on risk factors, diversification can be optimised
within real estate holdings as well as at the global
portfolio level.
Real estate in a multi-class multi-style portfolio
In a multi-class multi-style framework, there are two
options: (1) construct optimal portfolios for each
class and then optimally combine them; (2) conduct
one-step portfolio-wide optimisation based on the
relevant styles identified across all classes.
When AM follows ALM, the multi-class portfolio
of the first approach combines the optimised class
portfolios according to ALM-generated optimal
weightings, while the alternative one-step multi-
style optimisation procedure is carried out subject
to the same weighting constraints. While the
first approach may be theoretically suboptimal, it
facilitates both active management by in-house or
outsourced class specialists and passive approaches
using class benchmarks.
Data issuesUnlike ALM, AM exercises are less affected by
the lack of availability of long time-series, but
the quality and frequency of data are of primary
importance, as estimates of return, beta moments,
and co-moments are crucial to the success of the
model.
As private real estate is illiquid and as it has been
made clear that returns in the property markets are
skewed and leptokurtic, standard mean-variance
analysis should not be used. Tools developed to
deal with the illiquidity and non-normality of
other assets such as hedge funds are needed to
optimise the risk/return characteristics of real estate
investment programmes and mixed portfolios.
When managing portfolios that include real estate,
one must deal with ‘classic’ but exacerbated sample
problems, as well as tackle specific data challenges.
Resampling and Bayesian approaches should be used
to improve estimates from small size and dubious
quality samples. Tools should be refined to include
dimensions of real estate risk whether reflected in
prices or not. One aspect of liquidity risk specific to
real estate and not reflected in prices (or appraisals)
is that in bear markets transaction volumes dwindle
and time on the market lengthens.
1.3.2. Arguments for real estate investmentBox 4 summarises traditional and modern
arguments for the inclusion of real estate in
institutional portfolios.
Box 4: Arguments for the inclusion or real
estate in institutional portfolios
Traditional arguments• attractive total returns
• low volatility23
• high risk-adjusted returns
• potential hedge against inflation or deflation
• large and stable rent component
• excellent diversifier for mixed-asset
portfolios
Modern arguments• significant component of investment
universe (market portfolio approach)
• inefficiency of the real estate market:
potential for alpha through selection and
tactical allocation
• broader field of application for the tools of
modern finance
1.3.3. Empirical studiesFew conclusions but recommendations for significant allocation to real estateThe only traditional arguments for real estate
to have been solidly backed by the literature
are the low correlation of real estate and other
asset classes and its large rent component. Many
studies, largely of the asset management type,
1. Real Estate as an Asset Class
An EDHEC Risk and Asset Management Research Centre Publ icat ion
23 - Index construction methods may contribute to the underestimation of real estate volatility, but the microstructure of the market, the stability of revenue streams, and the capital intensiveness of the sector may also be responsible for relatively low volatility.
EDHEC European Real Estate Investment and Risk Management Survey - November 2007

31An EDHEC Risk and Asset Management Research Centre Publ icat ion
EDHEC European Real Estate Investment and Risk Management Survey - November 2007
may justify significant allocation to real estate in
a multi-class portfolio, but the optimal allocation
recommended varies greatly from one study to
another. In addition, opinions differ as to whether
real estate is superior to stocks as a hedge for
inflation; the effectiveness of real estate in this
role depends heavily on the type of inflation
studied (total, expected, unexpected), on the
property type, on the country, on the observation
horizon, and on the period studied.
Several reasons have been put forward for the clear
gap between the large allocations recommended
by studies and the very small role played by real
estate in institutional portfolios; these reasons are
summarised in exhibit 8.
1. Real Estate as an Asset Class
24 - From 1978 to 2006 the average fourth-quarter yield is 2.7% and the volatility 2.6%, as opposed to ranges from 2.3% to 2.4% and from 1.2% to 1.4% for the other quarters. The fourth-quarter variance is statistically different from the variance of the other quarters, which suggests that appraisals are clustered at year end.
Exhibit 8: Possible reasons for gap between real and theoretical real estate allocations
Data problems• Smoothing and lags• Low frequency of data• Excessively short data series• Use of a time-weighted rate of return rather than a value-weighted rate of return, the latter being closer to actual returns • Sample includes an unrepresentative period
Real estate characteristics• Illiquidity (use of appraisal-based or transaction-based indices with no control for variable liquidity resulting in artificial lowering of real estate risk)• Management and transaction costs (higher than those in other classes but not included in analysis)• Heterogeneity of properties (conclusions drawn on non-investable and hard to replicate indices)• Information asymmetry• Stock insufficient to act on recommendations
Method • High statistical uncertainty of parameter estimates resulting in limited reliability of results (fuzzy efficient frontier) • Ex post approach (assumes stability)• Simplistic multi-class portfolio (alternative classes not taken into account)• Single-period approach• Short-term approach• Use of total return whereas breakdown into rent and capital returns would be more relevant• Failure to take into account liabilities• Failure to take into account restrictions with respect to international investment
Model• Refutation of hypotheses of normality (alternative approaches: conditional models, use of asymmetric indicators of risk and partial co-moments)
The first shortcoming: the use of smoothed and lagging indicesThe earliest studies of real estate in institutional
portfolios were strict applications of the capital
asset pricing model and their aim was to evaluate
the benefit of adding real estate holdings to a
conventional mixed portfolio of stocks and bonds.
Standard indices were used; for real estate, then,
they were appraisal-based indices.
Appraisals, however, are not without their problems;
first, they are costly and time-consuming and may
be done infrequently—contributors may revalue
their properties at wide intervals or when they feel
that value has been altered significantly. When the
intervals between such updates are greater than the
intervals between reporting periods, the database
contains stale appraisals. The presence of stale
appraisals will result in lagged and auto-correlated
index returns and artificially lowered index volatility
and correlations with other assets—in other words,
smoothing.
If many contributors choose to adjust their valuations
marginally or to leave them unchanged for several
reporting periods before doing an in-depth appraisal,
and if these thorough reappraisals are clustered in
the same periods, there might then be discernible
“seasonality” in the index, on top of the smoothing
and lagging. This “seasonal” bias would artificially
increase volatility in the affected periods and lower
multi-period compounded returns. The NCREIF
Property Index series, for example, is subject to
severe fourth-quarter seasonality.24

32
Second, any appraiser has to work with the
information that is available–in direct real estate
markets, very little information is contemporaneous
and therefore appraisers must rely on lagged
market indicators and on recent and not-so-recent
information about transactions and appraisals
of comparable properties.25 Appraisers may
also update values conservatively and wait for
confirmation of early market signals. In short,
appraisal-based indices will trail market prices in
up-and-down markets.
Third, aggregation of property appraisals which take
place over the full course of the observation period
will lead to additional smoothing of the index.
The use of smoothed and lagged data results in
artificially lowering not only the standard deviation
of real estate but also the contemporaneous
correlation with the other asset classes. Real
estate in isolation will appear to offer a higher
reward per unit of risk than it really does, and,
more importantly, the diversification potential
will be overstated. The use of raw data skews the
covariance/variance matrix towards an allocation
to direct real estate. In fact, many studies based
on uncorrected data recommend senselessly
high allocations to real estate. Note too that the
resulting auto-correlation will produce non-normal
returns—returns incompatible with the hypotheses
of modern portfolio theory’s mainstream models.
These problems have prompted academics to design
procedures to unsmooth and de-seasonalise the
returns of appraisal-based indices. Unsmoothing
procedures are rooted in the assumption
that appraisals represent moving averages of
contemporaneous and lagged information. The
extent to which contemporaneous information
is impounded into appraisals and the level of
seasonality are either posited or estimated
empirically. The unsmoothed contemporaneous
component can thus be extracted from reported
index values. Unsmoothed and de-seasonalised
indicators appear to lead raw indices and exhibit
higher volatility.
After unsmoothing the data for the period from
1987 to 2001, Hoesli, Lekander, and Witkiewicz
(2003) justify allocations to all kinds of real estate
of between 15% and 25%. Direct real estate is
king and there is little room for listed vehicles.
The optimal proportion of direct real estate in
minimum-variance portfolios ranges from 5% to
15% for domestic investment and stands at 15%
for international investment; reduction of risk
ranges from 5% to 10% in the first case and from
10% to 20% in the second.
For France (from 1987 to 2004), Hoesli and Lekander
(2006) find a risk reduction of 8% for a 10%
allocation to French direct real estate and twice that
for a combination of a 6% allocation to domestic
real estate and an 8% allocation to international
real estate. In either case, the maximum allocation
to real estate is 22% and is composed solely of
direct holdings.
The second shortcoming: failure to control for variable liquidityAn alternative to correcting the biases of appraisal-
based indices is to try to develop indices based on
recorded transactions. This presents a number of
challenges linked to the limited and time-varying
liquidity of the heterogeneous commercial real
estate markets.
One problem with transactions-based indices is the
possibility that properties that are transacted more
often differ systematically from the population
supposedly tracked by the index. Another problem
is that the characteristics of the properties for
which deals are consummated may differ from one
period of time to the next and that the type and
motivations of buyers and sellers may change at
different stages of the cycle. These biases have been
confirmed empirically, but studies suggest that their
impact on indices is limited. Finally, liquidity will
1. Real Estate as an Asset Class
An EDHEC Risk and Asset Management Research Centre Publ icat ion
25 - Fisher (2003) observes that in the search for comparables, there is a trade-off between homogeneity and timeliness and that to minimise overall noise appraisers need to find the balance between comparable sample error (not-so-comparable comparables) and comparable lag error (not-so-recent comparables).
EDHEC European Real Estate Investment and Risk Management Survey - November 2007
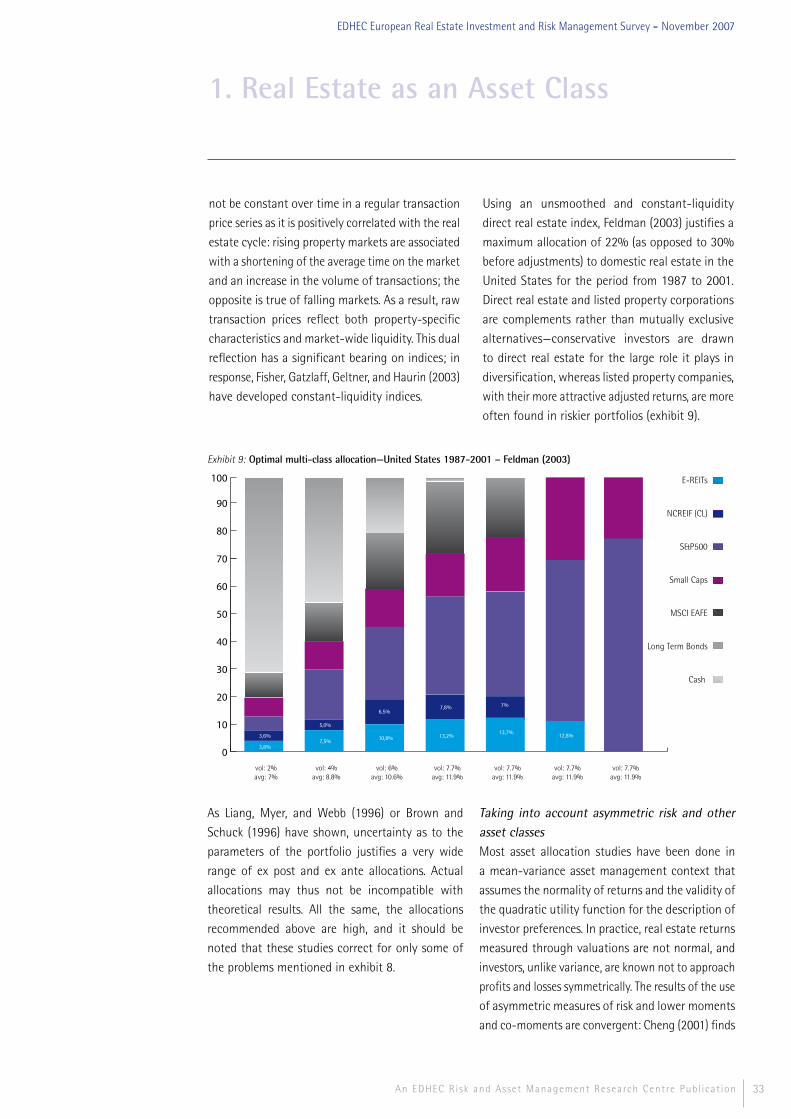
33An EDHEC Risk and Asset Management Research Centre Publ icat ion
EDHEC European Real Estate Investment and Risk Management Survey - November 2007
not be constant over time in a regular transaction
price series as it is positively correlated with the real
estate cycle: rising property markets are associated
with a shortening of the average time on the market
and an increase in the volume of transactions; the
opposite is true of falling markets. As a result, raw
transaction prices reflect both property-specific
characteristics and market-wide liquidity. This dual
reflection has a significant bearing on indices; in
response, Fisher, Gatzlaff, Geltner, and Haurin (2003)
have developed constant-liquidity indices.
Using an unsmoothed and constant-liquidity
direct real estate index, Feldman (2003) justifies a
maximum allocation of 22% (as opposed to 30%
before adjustments) to domestic real estate in the
United States for the period from 1987 to 2001.
Direct real estate and listed property corporations
are complements rather than mutually exclusive
alternatives—conservative investors are drawn
to direct real estate for the large role it plays in
diversification, whereas listed property companies,
with their more attractive adjusted returns, are more
often found in riskier portfolios (exhibit 9).
1. Real Estate as an Asset Class
Exhibit 9: Optimal multi-class allocation—United States 1987-2001 – Feldman (2003)
0
10
20
30
40
50
60
70
80
90
100 E-REITs
NCREIF (CL)
S&P500
Small Caps
MSCI EAFE
Long Term Bonds
Cash
vol: 2%avg: 7%
3,8%
3,6%
vol: 4%avg: 8.8%
7,5%
5,0%
vol: 6%avg: 10.6%
10,8%
6,5%
vol: 7.7%avg: 11.9%
vol: 7.7%avg: 11.9%
7,8%
13,2%
7%
13,7%
vol: 7.7%avg: 11.9%
12,8%
vol: 7.7%avg: 11.9%
As Liang, Myer, and Webb (1996) or Brown and
Schuck (1996) have shown, uncertainty as to the
parameters of the portfolio justifies a very wide
range of ex post and ex ante allocations. Actual
allocations may thus not be incompatible with
theoretical results. All the same, the allocations
recommended above are high, and it should be
noted that these studies correct for only some of
the problems mentioned in exhibit 8.
Taking into account asymmetric risk and other asset classesMost asset allocation studies have been done in
a mean-variance asset management context that
assumes the normality of returns and the validity of
the quadratic utility function for the description of
investor preferences. In practice, real estate returns
measured through valuations are not normal, and
investors, unlike variance, are known not to approach
profits and losses symmetrically. The results of the use
of asymmetric measures of risk and lower moments
and co-moments are convergent: Cheng (2001) finds

34
that the model based on downside risk allocates
much less to real estate; allocations increase as
the return target increases but remain below 15%
for a targeted return of 12%. Hamelink and Hoesli
(2004a) find that allocations are “much more in
line” with observed allocations when maximum
drawdown is used a measure of risk.
The few studies that expand the study of multi-
class allocation to take in traditional and alternative
investments as a group come up with contrasting
results: Georgiev, Gupta, and Kunkel (2003) find that
real estate could be superfluous in the presence of
commodities and hedge funds, whereas Terhaar,
Staub, and Singer (2003) assert that among the
possible alternative investments real estate could
justifiably receive the highest allocations.
Taking into account liabilitiesMost studies use an asset-management type
optimal allocation model and fail to take into
account liabilities. This approach is inappropriate for
the major institutional investors. The obvious next
step is to study asset-liability management models,
but as yet little work on them has been done.
Chun, Ciochetti, and Shilling (2000) maximise the
utility of the risk-adjusted surplus and find that
because of the low correlation between listed real
estate and liabilities, the allocations recommended
by mean-variance studies—from 10% to 20% or
more to real estate—generate risk from an ALM
point of view; they recommend allocations of
between 6% and 10% for the most conservative
portfolios and these allocations decrease quickly
as tolerance for risk increases.
Craft (2001 and 2005) as well as Chun, Sa-Aadu,
and Shilling (2004) use a model to minimise the
surplus variance of a pension fund subject to a
minimum return requirement.
For the average United States pension fund, Craft
(2001) recommends a maximum allocation of 16.2%
to domestic real estate (1979-1998). Total allocation
to the class and the share of direct vs. indirect
real estate decrease as the fund’s appetite for risk
increases. For a conservative portfolio, Chun, Sa-
Aadu, and Shilling (2004) recommend an allocation
of 12.1% to direct real estate to highly risk-averse
investors and find that real estate disappears quickly
from riskier portfolios.
Craft (2005) shows that the larger the deficit of the
pension fund, the smaller the investment in direct
real estate. From 1978 to 2002 and for a fund with
a surplus or with no deficit, maximum allocations
are 12.6% to direct real estate plus 7% to listed
real estate for a minimum-variance portfolio and
0% plus 11%-12% for medium-risk portfolios. A
fund with a surplus of 5% and a low-risk policy
can invest up to 14.8% and 6.9%.
American ALM studies allot less room to real estate
than do asset management studies, largely because
of its low correlation to liabilities as modelled by the
study authors: excessive allocation would increase
the volatility of the surplus or of the shortfall.
With its negative correlation to liabilities, direct
real estate can be found in more conservative
portfolios as a result of its low risk. With their
slight positive correlation to liabilities, REITs are
less heavily penalised. Unfortunately, these studies
neither unsmooth the returns from direct real estate
indices nor neutralise liquidity fluctuations.
Booth (2002) studies the impact of liability structure
on allocations by English pension funds and
evaluates the benefits of domestic direct real estate
for the period from 1984 to 2000. He recommends
an optimal level of 10% for closed pension funds and
of 5% to 10% for newly created funds. Booth and
Matysiak (2004) show that the use of unsmoothed
data reduces real estate risk in an ALM context;
their work sheds new light on previous results and
suggests that optimal allocation may be higher.
These early studies show that because the
correlation of real estate and liabilities is lower than
1. Real Estate as an Asset Class
An EDHEC Risk and Asset Management Research Centre Publ icat ion
EDHEC European Real Estate Investment and Risk Management Survey - November 2007

35An EDHEC Risk and Asset Management Research Centre Publ icat ion
EDHEC European Real Estate Investment and Risk Management Survey - November 2007
that of other asset classes allocations are scaled
down in ALM. These studies are largely exploratory,
however, and after unsmoothing the data the scale
of the downward adjustment should be reduced.
Significant correlation with inflation, demographic
risks, and long-term interest rates could justify the
use of real estate as a liability hedge.
That real estate is a good hedge against inflation is
no longer a unanimously held belief, but research
results are highly susceptible to the methods and
samples used: studies of the residential real estate
markets and studies done over the long term
confirm the usefulness of direct real estate when
it comes to hedging against inflation.26 Morell,
Jones, Blundell, Walker, Waites, Cumberworth,
Matysiak, and Winter (2004) show that correlation
varies significantly, depending on whether the rent
or the capital component of total real estate yield is
taken into account—rent trends and income growth,
a key indicator of pension fund liability trends, are
closely correlated. Putting this finding into practice
requires the utmost care in the composition of
the portfolio or the use of financial engineering
to create media for disaggregate exposure.27 It
should be noted too that a large rent component
may be of use to pension funds that are currently
meeting commitments, while capital gains may
be more attractive to funds whose commitments
are for the future.
We should mention as well that buildings have
relatively long durations, making them potentially
useful when immunising long-term liabilities—shares
may have longer durations, but their volatility can
reduce the effectiveness of the immunisation.
In short, the advantages of including real estate
in a multi-class ALM portfolio merit further
study. Corrected data, robust models, and realistic
assumptions as to available asset classes and
expected returns will go a long way towards
elucidating ideal allocations.
1. Real Estate as an Asset Class
26 - Bond and Seiler (1998), Quan and Titman (1999), Goetzmann and Valaitis (2006).27 - Note, however, that Barber, Robertson, and Scott (1997) conclude for their part that between 1967 and 1994 real estate’s (limited) usefulness as a hedge against inflation stems largely from the capital-gains component.

36 An EDHEC Risk and Asset Management Research Centre Publ icat ion
EDHEC European Real Estate Investment and Risk Management Survey - November 2007

2. Real Estate Portfolio Management
37An EDHEC Risk and Asset Management Research Centre Publ icat ion

38
2.1. Portfolio management process and portfolio construction2.1.1. Sources of performance, management strategiesSources of performanceIt should be kept in mind that the quality of
the legal, fiscal, and financial structuring of
the investment vehicle is key to its ultimate
performance. There are then three branches of
potentially value-adding activity in active real
estate portfolio management:
1. Asset allocation, the quality of which depends
on the quality of long- (strategic) and medium
to short-term (tactical) forecasts. Professional
standards required that the allocation be defined
in accordance with the constraints and objectives
of the investor.
2. Asset selection, the quality of which depends
on the ability to spot real estate assets that are
over- and underpriced with respect to current
or planned use—the usual role of the property
appraiser—and on the quality of negotiations for
purchase and sale—the usual role of the acquisition
and disposal team.
3. Asset/property management, the quality of which
is shown by the ability to increase the net income
generated by the portfolio or to enhance the value
of the assets through physical changes (renovation,
redevelopment, or repositioning), financial decisions
(capital structure), and day-to-day management
(optimisation of occupancy rates, lease portfolios,
and so on).
This last source of value is accessible to the end
investor or to the intermediary in charge of
management, whereas with traditional assets,
investors can hope to have a say in corporate
decisions only through shareholder engagement
or activism.28
Skills, diversification, and strategiesHoesli and MacGregor (2000) propose a matrix
of strategies for each skill. They emphasise the
difficulty of index-based passive management in
direct real estate: it is impossible to be in possession
of the same buildings as the index, hard to diversify
the specific risk of the buildings, and necessary to
take charge of property management.
2. Real Estate Portfolio Management
An EDHEC Risk and Asset Management Research Centre Publ icat ion
28 - When compared with investment in widely-held companies, direct private equity investments may give the investor more influence on corporate decisions; however such investments will not grant direct control of assets.
EDHEC European Real Estate Investment and Risk Management Survey - November 2007
Exhibit 10: Property portfolio management strategies based on manager’s skills—Hoesli and McGregor (2000)
Manager’s ability at setting structure
Good Bad
Manager’s ability at
stock selection
Good
Modern management• Take positions based on forecasts• Use pricing models to identify buildings to buy and sell
Traditional management• Take benchmark positions• Use pricing models to identify buildings to buy and sell
BadLarge funds• Take positions based on forecasts• Diversifiy by buying a lot of properties
Passive management• Take benchmark positions• Diversifiy by buying a lot of properties
With Brealey (1983) as their point of departure, Brown
and Matysiak (2000) note that the type of strategy
viable is necessarily linked to the diversification of
the portfolio. A diversified portfolio should limit
asset turnover to minimise costs; a passive strategy
is then “consistent”. A poorly diversified portfolio,
by contrast, calls for active management aiming for
outperformance.
Management processHoesli and MacGregor recommend an active approach
that corresponds to current industry practices. This
approach is summarised in exhibit 11.
The authors note that diversification allows major
investors to pay greater attention to allocation, but
that unfortunately any allocation modifications
are difficult for them given the amounts at stake.

39An EDHEC Risk and Asset Management Research Centre Publ icat ion
EDHEC European Real Estate Investment and Risk Management Survey - November 2007
For smaller investors, allocation and selection are
closely bound and for that reasons the strategy is
deemed an iterative process.
Unlike Hoesli and MacGregor, Brown, and Matysiak
give a very limited role in the management process
to allocation by property type or by region—for
them, a bottom-up approach with limits on
overall levels of risk is more appropriate, as it is
difficult to construct highly diversified real estate
portfolios; they also highlight the importance
of asset selection.29 They point out that the
conventional indicators for making real estate
investment decisions (equivalent yields and internal
rates of return) make incorrect allowances for risk
and for risk premia and encourage the use of net
present value with a discount rate linked to the
systematic risk of the building and the expected
market premium—the management of specific risk
is altogether ignored.
2.1.2. Sources of risk and lines of diversificationSources of risk in real estateLike any investment, an investment in real estate is
subject to business risk, financial risk linked to its level
of debt, inflation risk, interest rate risk, management
risk, legislative risk, and environmental risk; in
addition, it is particularly vulnerable to liquidity
risk. Exhibit 12 lists the possible sources of specific
risk—diversifiable, in theory—and of systematic risk,
which can be managed or hedged.
2. Real Estate Portfolio Management
29 - They conclude: “Although a broad indication of the allocation to sectors is likely to be useful in terms of identifying a general risk class most decisions will be made at the individual property level. Identifying whether an individual property is under- or overpriced is likely to be more important than ensuring that the commitment of funds fits in with the output of an allocation model.”
Exhibit 11: Phases of active real estate portfolio management (Hoesli and MacGregor (2000))
Statement of objectives
• Choice of benchmark. • Definition of objective for return over benchmark.• Definition of relative risk tolerance (in terms of tracking error, for example).• Definition of investment horizon for the achievement of the objectives and assessment of performance.
Analysis of existing portfolio• Comparison of existing allocation and of benchmark allocation, analysis of recent performance.
Assessment of ability to reach objectives without allocation or selection changes
• For allocation, forecast of relative performance, of tracking error of portfolio (with respect to benchmark). Computation of the contribution of selection to performance and to tracking error. • Computation of the likelihood of reaching objectives without allocation or selection changes (with the help of total relative return and tracking error).
Allowances for restrictions on restructuring
• It may be necessary to keep certain buildings on which work to increase value is in progress or imminent. • High lot size and non-divisibility lead to discontinuities in possible allocations. The difficulty of diversifying specific risk makes it wise to set a maximum investment amount for any one building—an amount linked to the size of the real estate portfolio. The incremental cost of managing an additional unit, by contrast, makes a minimum necessary.• Need to evaluate returns beyond the usual one year horizon, given illiquidity and transaction costs.
Allowances for other practical considerations
• Need to consider timing of modifications (tactical consideration).• Need to allow for cash inflows/outflows: is the capital devoted to real estate increasing or must a part of the portfolio be sold to deal with outflows (redemptions or reductions in allocation)?• Market conditions: in bearish markets, sales are difficult, acquisitions possibly advantageous.• Transaction costs: high, must be taken into account.• Implementation capacity (qualified available human resources, for example) and the need to adapt it to changing environments.
Definition of new strategy
• New allocation.• Buildings to sell.• Types and location of buildings to acquire.• Identification of property management needs.

40
2. Real Estate Portfolio Management
An EDHEC Risk and Asset Management Research Centre Publ icat ion
30 - The market portfolio, risk premium, slope of the term structure, industrial production growth, unexpected inflation, and changes in inflation forecasts. 31 - For a fixed-beta and fixed-premia model, only the first two factors are significant; for a variable-beta and variable-premia model, the last two are also statistically significant.
EDHEC European Real Estate Investment and Risk Management Survey - November 2007
Exhibit 12: Sources of risk in real estate
Ling and Naranjo (1997) examine the systematic
factors of the performance of listed and non-listed
real estate from 1978 to 1994. They add the rate
of growth of real per capita consumption and the
real T-bill rate to the factors noted by Chen, Roll,
and Ross (1986).30 The growth of real per capita
consumption, the real T-bill rate, the term structure,
and unexpected inflation are found to be systematic
factors for real estate.31
In an international study of the economic growth
and supply/demand factors affecting returns in the
office markets, De Wit and Van Dijk (2003) find that
GDP/GMP positively influences real estate prices,
while changes in unemployment and vacancy rate
negatively influence prices. Rents are found to
be positively linked to changes in GDP/GMP and
negatively related to increases in stock, vacancy rate,
and unemployment. Total returns are inversely related
to the vacancy rate and positively linked to growth
in GDP/GMP and to inflation. Overall, they conclude
that changes in vacancy rates and unemployment
rates are the most important indicators.
Lines of diversificationThe different sources of building heterogeneity
suggest lines of diversification—those investors
resort to most heavily, property-type and geographic
diversification, have been the object of the greatest
number of academic studies.
Property-type and geographic diversification
(domestic)
The assumption in property-type diversification
is that classifications by type correspond to real
differences in exposure to systematic risks, either on
average or during different phases of the business
cycle. A portfolio diversified by property type will
thus be exposed to limited specific risk and to levels
of systematic risk lower than that of the riskiest
property type.
The assumption justifying geographic diversification
is that buildings are bought and sold on local
markets affected by supply and demand patterns
that depend on specific factors as well as local
exposure, whether structural or cyclical, to
systematic risks.
The studies testify to the reality of the phenomenon
but also to its relative power: the marginal gain
from geographic diversification falls quickly, and
portfolios of realistic size retain a significant share of
diversifiable risk. The results for one property type are
different from those for another: Cheng and Roulac
(2007) find that for the United States geographic
diversification is very efficient for residential real
estate, advantageous for retail properties but less
so for industrial properties, and not at all useful
for offices.
Since Miles and McCue (1982), the vast majority of
the many studies of various countries confirm the
superiority of property-type diversification without
calling into question the marginal advantages of
geographic diversification. In the United Kingdom,
the work of Andrew, Devaney, and Lee (2003), a
twenty-year study of more than 12,000 buildings,
strengthens these conclusions.
Hartzell, Shulman, and Wurtzebach (1987) suggest
using economic regions rather than administrative
Risk specific to asset Sector or geographic risk Systematic risk
• Structure, condition of building, obsolescence• Location• Tenants (creditworthiness, concentration)• Leases and occupancy rates (structure, terms, and expiries)
• Property type• Local economic situation• Local supply and demand
• State of real estate markets • State of capital markets• International and domestic economic situation• Term structure of interest rates and availability of credit• Taxation• Inflation

41An EDHEC Risk and Asset Management Research Centre Publ icat ion
EDHEC European Real Estate Investment and Risk Management Survey - November 2007
divisions in studies of geographic diversification.
Work on clustering geographic regions into
homogenous economic regions has shown that this
practice has greater potential for diversification.
Papers such as those by Mueller and Ziering (1992)
and Mueller (1993) have taken the approach even
farther, discarding the notion of region altogether
and relying directly on a base of local economic
factors for greater diversification.
The use of economic rather than administrative
regions increases the diversification potential of
the geographic approach. This potential increases
even more when diversification is by city but does
not match the performance of diversification by
property type. Indeed, cluster analyses of assets,
such as those by Hamelink, Hoesli, Lizieri, and
MacGregor (2000), reveal strong property-type
dimensions to the clusters.
International diversification
Sirmans and Worzala (2003a; 2003b) survey
the last twenty years of studies of international
diversification—through both direct real estate
and property companies—of mixed-asset and real
estate portfolios. Nearly all of these studies reach
the conclusion that international diversification
is appropriate.
Common sense suggests that direct real estate
markets are by nature less well integrated than
financial markets, and papers such as those by
McAllister (1999) and Chua (1999) confirm the
higher costs of international real estate strategies,
costs that act as brakes on international investment.
Nonetheless, a study of twenty-one countries
between 1987 and 1999 (Case, Goetzmann, and
Rouwenhorst (1999)) documents a surprising
correlation—largely a result of shared dependence
on global economic changes—of domestic direct real
estate markets; retail and office properties offer
less potential for international diversification than
do equities! Studying listed property companies
in twenty-eight countries, Ling and Naranjo
(2002) come to similar conclusions about this
shared dependence. These results suggest that
decorrelations of domestic economic cycles
could guide a first approach to international
diversification.
For listed property companies, Eichholtz, Huisman,
Koedijk, and Schuin (1998) point to the existence of
a continental factor that adds to the advantages of
intercontinental diversification for North America
and Europe. For direct real estate, Bond, Karolyi,
and Sanders (2003) do likewise.
The benefits of international diversification
are widely acknowledged but achieving this
diversification requires taking into account
property-type and geographic variations.
The few studies of the country and property-type
components of international diversification suggest
that the country effect is predominant. For 1990-
1996, D’Arcy and Lee (1998) show that returns
for 159 European cities are essentially accounted
for by the country factor (31%); the addition of
property-type (3%) and regional factors (1%)
has, at best, a marginally positive effect on the
model. In a study of more than 25,000 buildings
between 1996 and 2002, Lee and Devaney (2004)
reach similar conclusions: the explanatory power
is limited to 2.8% for the country; 1.4% for the
property type; and 1.4% for distinctions between
primary and secondary cities.32
Hamelink and Hoesli (2004b) show that between
1990 and 2003 specific factors account for
approximately half of property company
performance. Toward the end of the period—and
for non-specific factors—the country accounts for
more than half of performance and the type of
property for more than a quarter; other relevant
factors were size and style. Likewise, Glascock
and Kelly (2005) look at the property indices of
seventeen countries between 1990 and 2002 and
confirm the predominance of the country effect.
2. Real Estate Portfolio Management
32 - These low explanatory powers reveal the predominance, for individual assets, of specific risk.

42
Domestic diversification across property types
reduces variance to 20% of that of the average
property company. International diversification
within a single property type reduces it to 8%.
International diversification across property types
achieves an additional reduction to 7%.
Traditionally, real estate investment has been
domestic and the vast majority of institutional
real estate portfolios have a very strong home
bias. In an international setting, the heterogeneity,
real nature, and need for physical management of
the underlying translate into additional obstacles
for the direct investor. Among them are the need
for local knowledge and expertise, restrictions on
foreign investment and political risk, taxation issues,
the small scale and illiquidity of markets—especially
in emerging economies. While these hurdles mean
added costs and risks, they may also provide
opportunities for higher returns. Relaxation of
limits on foreign investment in real estate and the
development of public and private indirect vehicles
for international investment have brought about
a boom in cross-border investment.
It should be noted that cross-border flows are
concentrated on a small number of markets that
are considered politically stable, economically
mature, and large enough to support investment.
Chen and Mills (2006) consider that only 27
countries worldwide are suitable for core real
estate investment by institutional investors.
Investor concentration on the most liquid markets
can lead to flow-of-funds effects increasing
country correlations and reducing the benefits of
international diversification. Diversification benefits
can likewise be subdued when buildings in different
countries are leased to tenants that belong to the
same globally integrated economic sectors. Looking
at New York and London offices as examples of
prime locations for international investment with
comparable economic specialisations, Jackson,
Stevenson, and Watkins (2005) document strong
inter-linkages. Since links between total returns
are stronger than they are between rental values,
they conclude that the interrelation originates
mostly in the capital markets through investor
behaviour motivated by the size and liquidity of
these two markets.
Foreign exchange risk is a major hindrance for
international diversification outside of the home
currency zone. As currency volatility is much
higher than that of real estate, the returns on
foreign-currency denominated investments will be
largely dependent upon currency fluctuations. The
predictability of currency movements is limited at
best, so a hedging strategy is advisable. International
allocation decisions must make allowances either
for the high volatility of unhedged returns or for
the cost of hedging. While a number of studies of
international diversification conveniently assume
currency risk away, Hoesli, Lekander, and Witkiewicz
(2004) conduct hedged and unhedged analyses
of the diversification benefits of real estate. They
confirm the interest of real estate for portfolio risk
reduction but emphasise that “allocation between
domestic and non-domestic assets, however,
varies substantially across countries, depending
on whether returns are hedged or not.”
Diversification by size and style
Since Roulac (1976), it has usually been
acknowledged that there is a positive association
between the size of a building (measured physically
or by its value) and the return. The explanations
for this association mention the liquidity premium
of properties for which the market is very narrow,
economies of scale, and lease diversification.
The styles proposed for the description of buildings
and funds could, at the very least, constitute
another dimension of the management of exposure
to systematic factors, if not of diversification. For the
present, these styles have been studied only from a
perspective of performance measurement.
2. Real Estate Portfolio Management
An EDHEC Risk and Asset Management Research Centre Publ icat ion
EDHEC European Real Estate Investment and Risk Management Survey - November 2007

43An EDHEC Risk and Asset Management Research Centre Publ icat ion
EDHEC European Real Estate Investment and Risk Management Survey - November 2007
The predominance of specific risk, non-normality,
and their impact on diversification
Brown and Matysiak (2000) find that the stock
market factor accounts for about 30% of the
variation of an individual stock and that it takes on
average 44 stocks to diversify 95% of the specific
risk. They observe strikingly different results for
real estate, where the real estate market factor
accounts for only 9% of the risk of the average
monthly valued property. Assuming that returns
are normally distributed and that equal weighting
of investments is possible, it takes an equally
weighted portfolio of 171 properties to achieve 95%
diversification. Using monthly valued properties
is likely to introduce smoothing and downwardly
bias the correlation between properties. Brown
and Matysiak find significant increases in the
average correlation between properties when they
look at quarterly and annual returns, although
coefficients remain low when compared with
those prevailing in traditional asset classes. The
intra-class diversification potential of real estate
is lower than suggested by the above figures but
it is easier to establish diversified portfolios: equal
investment in thirty to forty buildings with normally
distributed returns would suffice to achieve 95%
diversification on average.
Unfortunately, it is not possible for an investor to
hold the average portfolio, which means that the
effective diversification of any portfolio of 30-40
properties could be significantly higher or lower than
95%. So, 95% diversification—with little margin for
error—of an individual real-estate portfolio could
require equal investment in hundreds of properties.
Since properties are not divisible, equal-weighting
is not an option and larger portfolios of value-
weighed properties will be required to obtain the
same level of diversification.
Finally, real estate returns have skewed and
leptokurtic non-normal distributions that make
them less diversifiable. Studying annual IPD property
returns from 1981 to 2003, Young, Lee, and Devaney
(2006) find that a ten-fold reduction in risk requires
equal investment in 1,698 properties; under the
assumption of normality, by contrast, this reduction
requires investment in only 100 properties. .
Several observations are in order:
1. High diversification of a portfolio of direct real
estate will be impractical for most investors—in
the high transaction cost, high management cost
environment of real estate, the marginal benefits of
diversification will be weighed against its marginal
costs and actual direct portfolios, even those of the
largest investors, will not be 95% diversified.
2. Confronted with the impossibility of passive direct
real estate investment through a highly diversified
portfolio, investors will focus on active management
and try to optimise portfolio returns instead of
merely picking up the real estate market premium
associated with a diversified property exposure. It
then makes sense for the traditional real estate
investor to try to optimise the alpha generated by
property selection and management, since timing
the markets requires dealing with high transaction
costs, execution delays, and the diversification
necessary for pure property-type/country bets.
OPC (2006) determined the capital required for
direct portfolios replicating the performance of
various segments of the British market depending
on the average lot size and on the heterogeneity
of each segment. The requirements (exhibit 13)
show that, in practice, the difficulty of diversifying
a specialised portfolio varies significantly from one
segment to another.
It is extremely difficult to build and manage a
conventional diversified real estate portfolio directly;
the investor may opt then for an active direct
strategy, if he has the means and the knowledge
to do so, for intermediated diversification, or for a
mixture dictated by the investor’s means and skills
and by the relative difficulty of the diversification.
If the investor opts for the mixture, he may use
vehicles diversified across property types or, if he
2. Real Estate Portfolio Management
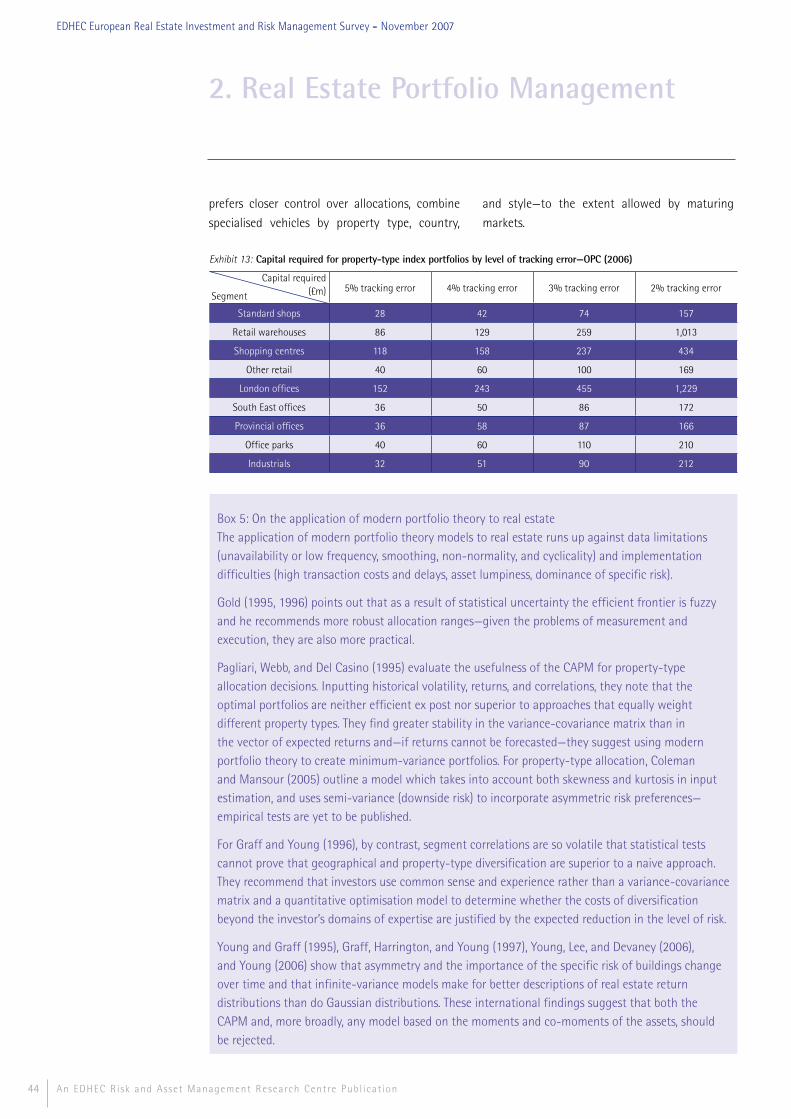
44
prefers closer control over allocations, combine
specialised vehicles by property type, country,
and style—to the extent allowed by maturing
markets.
2. Real Estate Portfolio Management
An EDHEC Risk and Asset Management Research Centre Publ icat ion
EDHEC European Real Estate Investment and Risk Management Survey - November 2007
Exhibit 13: Capital required for property-type index portfolios by level of tracking error—OPC (2006)
5% tracking error 4% tracking error 3% tracking error 2% tracking error
Standard shops 28 42 74 157
Retail warehouses 86 129 259 1,013
Shopping centres 118 158 237 434
Other retail 40 60 100 169
London offices 152 243 455 1,229
South East offices 36 50 86 172
Provincial offices 36 58 87 166
Office parks 40 60 110 210
Industrials 32 51 90 212
Segment
Capital required (£m)
Box 5: On the application of modern portfolio theory to real estateThe application of modern portfolio theory models to real estate runs up against data limitations (unavailability or low frequency, smoothing, non-normality, and cyclicality) and implementation difficulties (high transaction costs and delays, asset lumpiness, dominance of specific risk).
Gold (1995, 1996) points out that as a result of statistical uncertainty the efficient frontier is fuzzy and he recommends more robust allocation ranges—given the problems of measurement and execution, they are also more practical.
Pagliari, Webb, and Del Casino (1995) evaluate the usefulness of the CAPM for property-type allocation decisions. Inputting historical volatility, returns, and correlations, they note that the optimal portfolios are neither efficient ex post nor superior to approaches that equally weight different property types. They find greater stability in the variance-covariance matrix than in the vector of expected returns and—if returns cannot be forecasted—they suggest using modern portfolio theory to create minimum-variance portfolios. For property-type allocation, Coleman and Mansour (2005) outline a model which takes into account both skewness and kurtosis in input estimation, and uses semi-variance (downside risk) to incorporate asymmetric risk preferences—empirical tests are yet to be published.
For Graff and Young (1996), by contrast, segment correlations are so volatile that statistical tests cannot prove that geographical and property-type diversification are superior to a naive approach. They recommend that investors use common sense and experience rather than a variance-covariance matrix and a quantitative optimisation model to determine whether the costs of diversification beyond the investor’s domains of expertise are justified by the expected reduction in the level of risk.
Young and Graff (1995), Graff, Harrington, and Young (1997), Young, Lee, and Devaney (2006), and Young (2006) show that asymmetry and the importance of the specific risk of buildings change over time and that infinite-variance models make for better descriptions of real estate return distributions than do Gaussian distributions. These international findings suggest that both the CAPM and, more broadly, any model based on the moments and co-moments of the assets, should be rejected.

45An EDHEC Risk and Asset Management Research Centre Publ icat ion
EDHEC European Real Estate Investment and Risk Management Survey - November 2007
2.2. Performance measurement and analysisPerformance assessment should establish whether
or not investment management has progressed
toward or achieved its objectives during the
period of observation. It is not simply a matter
of communicating with the investor or aligning
interests, but also of the information requirements
of the portfolio management process. The
contributions to management performance of
allocation and selection are generally analysed:
the aim is to assess where value was created
or destroyed and to light the way for future
choices.
Performance objectives are usually expressed either
in terms of absolute return (real or nominal) or
in terms of relative return (comparison to a peer
group index, an individual benchmark, or a market
index). Even if an absolute return is used as an
objective, it can be interesting to work out ex post
how performance was achieved.
2.2.1. Time-weighting and value-weightingThe monitoring of performance implies the
assessment of returns. Two methods of calculating
returns are commonly used: time-weighting and
value-weighting. Time weighting compounds the
returns observed over successive periods while
ignoring the possible differences in the amounts
invested in each period. Value-weighting takes into
account variations in amounts invested and thus
permits a measure of actual returns.
For a portfolio, the comparison of a time-weighted
rate of return and a value-weighted rate of return
provides an indicator of the manager’s ability to
make appropriate choices about the timing of
allocations—on condition that he has been given
the leeway to make these choices.
Time-weighting is the standard practice in core
direct real estate investment and liquid real
estate funds, the internal rate of return, the
most frequently used value-weighted measure, is
standard at the building level and is also commonly
used for private equity funds.
When comparing investment choices it is crucial
to avoid relying on incomparable bases for
comparison—for example, an internal rate of return
(IRR) computed from actual cash flows and a time-
weighted rate based partly on capital variations
appraised at regular intervals.
The computations require knowledge of asset
values at each cash inflow or outflow; exact
computations for non-listed real estate would
require very frequent appraisals and be very costly.
In this case, it is preferable to obtain approximate
results with the help of sub-periods aligned with
the normal frequency of appraisals—although in
some countries or for some market participants
this frequency may be low.
Performance assessments, during which
assumptions about cash flows over the course of
the year are made, are usually done annually; it
is assumed, for example, that net income inflows
and capital improvement outflows will take place
at mid-year. If the composition of the portfolio
is modified by the acquisition or sale of assets,
it is advisable to work with exact dates. For all
its indices, IPD computes monthly returns on the
assumption that all posted flows take place at
the beginning of the month; for assets that are
not appraised monthly, IPD interpolates a capital
value; monthly results are compounded to create
quarterly or yearly indices.
2.2.2. Indices, benchmarks, and performance analysisThe measurement of relative performance or of
overperformance implies the existence of a point
of reference, usually known as a benchmark. The
construction of a customised benchmark or of
a “normal” portfolio is a major component of
performance assessment.
2. Real Estate Portfolio Management

46
When a manager is tracking a published index, the
index is the benchmark and should represent the
neutral composition of the manager’s portfolio. This
tracking does not exclude market timing or asset
selection but over multiple periods the manager
should, on average, respect index weights. If the
strategic allocation of the portfolio—in terms of
systematic factors—differs from that of the index,
the index is unsuitable as a benchmark.
If the manager does not track a market index, then
he should build a customised benchmark that is
representative of his strategy; these benchmarks
may be obtained by mixing available market indices
so that collectively they can map the manager’s
strategy. Property-type indices and private portfolio
analysis services are appropriate sources for the
construction of a customised benchmark.
2. Real Estate Portfolio Management
An EDHEC Risk and Asset Management Research Centre Publ icat ion
EDHEC European Real Estate Investment and Risk Management Survey - November 2007
Box 6: Can real estate indices be used as benchmarks?
Bailey (1992) explained that a valid benchmark should be:
1) Unambiguous (known components, known weights)
2) Investable (purchasable or replicable)
3) Measurable (computable by investor)
4) Appropriate (consistent manager’s investment style and assumed risks)
5) Reflective of current investment opinions (manager has current investment knowledge of the
assets that make up the benchmark)
6) Specified in advance (settable before the start of the evaluation period)
It is clear that the indices commonly used to measure the performance of direct real estate
investment, whether they are appraisal-based indices or peer-group indices, do not fully comply
with any of these conditions. The IPD market indices, for example, are ambiguous, not measurable,
not reflective of investment opinions, and not specified in advance, as the underlying buildings are
not identified. Because of the nature and number of their components, they are not investable.
Finally, they will be appropriate only for some investors. That the breakdowns by property type and
by geography are known and relatively stable over time mitigates the criticism but does not alter
the verdict. As IPD (2007b) states, the use of one of these indices “as a benchmark for portfolio or
manager performance” is inappropriate. By contrast, the use of an index of listed property companies
as a benchmark is valid as long as the index is appropriate.
How the customised benchmark is built derives
from defined objectives and constraints—the
performance of a given period is then compared to
the performance that would have been generated
by allocation to passive media, with the deviations
from the “neutral” or “normal” allocation serving
to evaluate the value creation or destruction
attributable to allocation and that attributable to
selection. At its simplest, the performance analysis
model takes the form:
Contribution of allocation:
bP , j RI N D E X , jj
∑ − bB E N C H M AR K , jj
∑ RI N D E X , j
Contribution of selection:
RP − bP , j RI N D E X , jj
∑
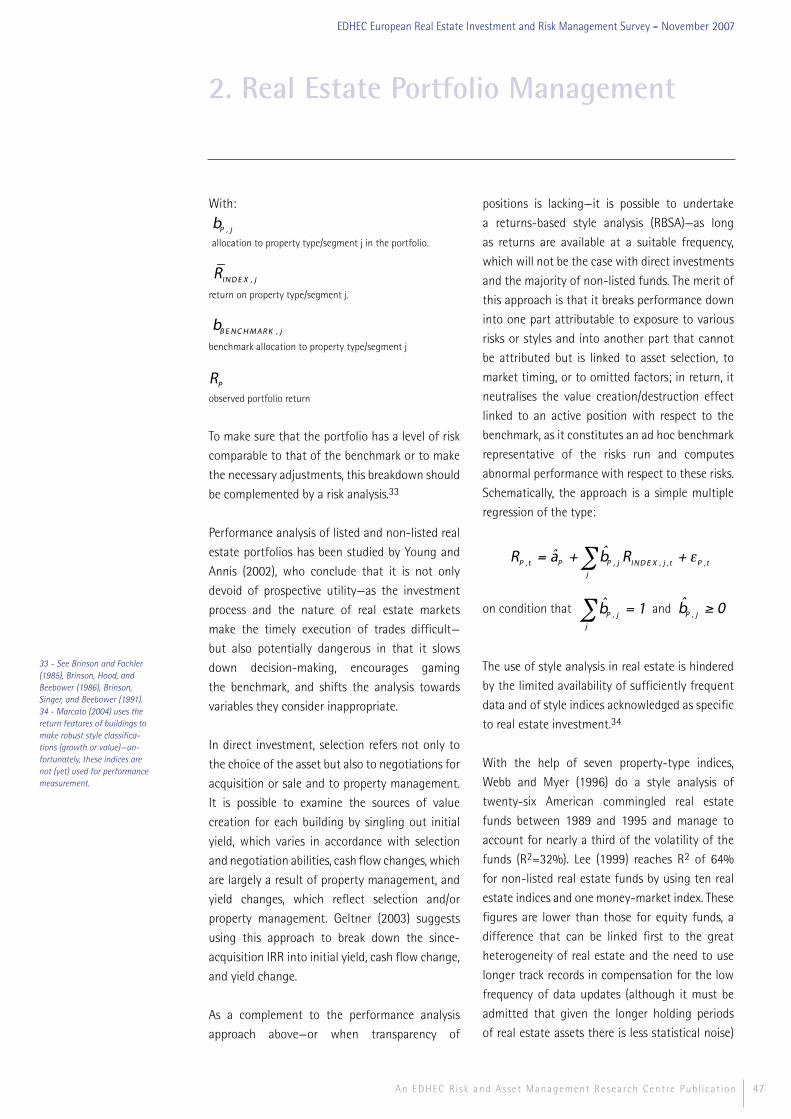
47An EDHEC Risk and Asset Management Research Centre Publ icat ion
EDHEC European Real Estate Investment and Risk Management Survey - November 2007
With:
bP , j
allocation to property type/segment j in the portfolio.
RI N D E X , j
return on property type/segment j.
bB E N C H M AR K , j
benchmark allocation to property type/segment j
RP
observed portfolio return
To make sure that the portfolio has a level of risk
comparable to that of the benchmark or to make
the necessary adjustments, this breakdown should
be complemented by a risk analysis.33
Performance analysis of listed and non-listed real
estate portfolios has been studied by Young and
Annis (2002), who conclude that it is not only
devoid of prospective utility—as the investment
process and the nature of real estate markets
make the timely execution of trades difficult—
but also potentially dangerous in that it slows
down decision-making, encourages gaming
the benchmark, and shifts the analysis towards
variables they consider inappropriate.
In direct investment, selection refers not only to
the choice of the asset but also to negotiations for
acquisition or sale and to property management.
It is possible to examine the sources of value
creation for each building by singling out initial
yield, which varies in accordance with selection
and negotiation abilities, cash flow changes, which
are largely a result of property management, and
yield changes, which reflect selection and/or
property management. Geltner (2003) suggests
using this approach to break down the since-
acquisition IRR into initial yield, cash flow change,
and yield change.
As a complement to the performance analysis
approach above—or when transparency of
positions is lacking—it is possible to undertake
a returns-based style analysis (RBSA)—as long
as returns are available at a suitable frequency,
which will not be the case with direct investments
and the majority of non-listed funds. The merit of
this approach is that it breaks performance down
into one part attributable to exposure to various
risks or styles and into another part that cannot
be attributed but is linked to asset selection, to
market timing, or to omitted factors; in return, it
neutralises the value creation/destruction effect
linked to an active position with respect to the
benchmark, as it constitutes an ad hoc benchmark
representative of the risks run and computes
abnormal performance with respect to these risks.
Schematically, the approach is a simple multiple
regression of the type:
on condition that bP , jj
∑ = 1 and bP , j ≥ 0
The use of style analysis in real estate is hindered
by the limited availability of sufficiently frequent
data and of style indices acknowledged as specific
to real estate investment.34
With the help of seven property-type indices,
Webb and Myer (1996) do a style analysis of
twenty-six American commingled real estate
funds between 1989 and 1995 and manage to
account for nearly a third of the volatility of the
funds (R2=32%). Lee (1999) reaches R2 of 64%
for non-listed real estate funds by using ten real
estate indices and one money-market index. These
figures are lower than those for equity funds, a
difference that can be linked first to the great
heterogeneity of real estate and the need to use
longer track records in compensation for the low
frequency of data updates (although it must be
admitted that given the longer holding periods
of real estate assets there is less statistical noise)
2. Real Estate Portfolio Management
33 - See Brinson and Fachler (1985), Brinson, Hood, and Beebower (1986), Brinson, Singer, and Beebower (1991).34 - Marcato (2004) uses the return features of buildings to make robust style classifica-tions (growth or value)—un-fortunately, these indices are not (yet) used for performance measurement.
RP ,t = aP + bP , jj
∑ RI N D E X , j ,t + εP ,t
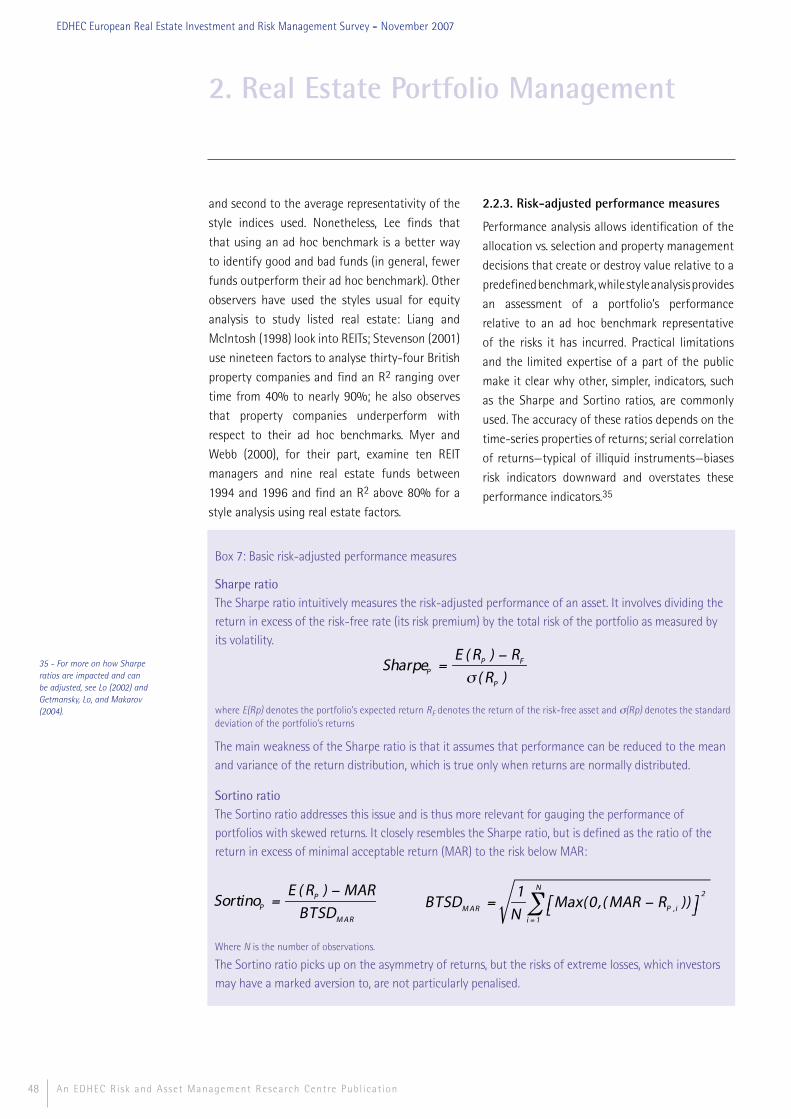
48
and second to the average representativity of the
style indices used. Nonetheless, Lee finds that
that using an ad hoc benchmark is a better way
to identify good and bad funds (in general, fewer
funds outperform their ad hoc benchmark). Other
observers have used the styles usual for equity
analysis to study listed real estate: Liang and
McIntosh (1998) look into REITs; Stevenson (2001)
use nineteen factors to analyse thirty-four British
property companies and find an R2 ranging over
time from 40% to nearly 90%; he also observes
that property companies underperform with
respect to their ad hoc benchmarks. Myer and
Webb (2000), for their part, examine ten REIT
managers and nine real estate funds between
1994 and 1996 and find an R2 above 80% for a
style analysis using real estate factors.
2.2.3. Risk-adjusted performance measures
Performance analysis allows identification of the
allocation vs. selection and property management
decisions that create or destroy value relative to a
predefined benchmark, while style analysis provides
an assessment of a portfolio’s performance
relative to an ad hoc benchmark representative
of the risks it has incurred. Practical limitations
and the limited expertise of a part of the public
make it clear why other, simpler, indicators, such
as the Sharpe and Sortino ratios, are commonly
used. The accuracy of these ratios depends on the
time-series properties of returns; serial correlation
of returns—typical of illiquid instruments—biases
risk indicators downward and overstates these
performance indicators.35
2. Real Estate Portfolio Management
An EDHEC Risk and Asset Management Research Centre Publ icat ion
35 - For more on how Sharpe ratios are impacted and can be adjusted, see Lo (2002) and Getmansky, Lo, and Makarov (2004).
EDHEC European Real Estate Investment and Risk Management Survey - November 2007
Box 7: Basic risk-adjusted performance measures
Sharpe ratioThe Sharpe ratio intuitively measures the risk-adjusted performance of an asset. It involves dividing the return in excess of the risk-free rate (its risk premium) by the total risk of the portfolio as measured by its volatility.
SharpeP =E ( RP ) − RF
σ ( RP ) where E(Rp) denotes the portfolio’s expected return RF denotes the return of the risk-free asset and σ(Rp) denotes the standard deviation of the portfolio’s returns The main weakness of the Sharpe ratio is that it assumes that performance can be reduced to the mean and variance of the return distribution, which is true only when returns are normally distributed.
Sortino ratioThe Sortino ratio addresses this issue and is thus more relevant for gauging the performance of portfolios with skewed returns. It closely resembles the Sharpe ratio, but is defined as the ratio of the return in excess of minimal acceptable return (MAR) to the risk below MAR:
Where N is the number of observations.
The Sortino ratio picks up on the asymmetry of returns, but the risks of extreme losses, which investors may have a marked aversion to, are not particularly penalised.
SortinoP =E ( RP ) − MAR
BTSDM AR
BTSDM AR =1
NMax(0,( MAR − RP ,i ))⎡⎣ ⎤⎦
2
i = 1
N
∑

49An EDHEC Risk and Asset Management Research Centre Publ icat ion
EDHEC European Real Estate Investment and Risk Management Survey - November 2007
2.3. Allocation adjustmentPerformance analysis and forecasting models
may encourage the investor to make strategic
(benchmark changes) or tactical (changes in
weighting with respect to the benchmark)
allocation changes or to change his selection
of assets to take advantage of opportunities to
sell assets considered overpriced and to acquire
those considered under priced. We will now take
a look at the problems of actually making these
adjustments which, in theory, are altogether
desirable.
2.3.1. Adjustment on direct marketsDelaysOnce the decision to sell a directly held building has
been made, the search for a buyer, the negotiation
of a price acceptable to both parties, and due
diligences delay the sale for several months.
Acquisitions are an equally lengthy process and
development is longer still.
These delays are affected by the liquidity of the
market segment (property type/geographical)
and by features specific to the property (price,
uniqueness). Liquidity is linked to conditions in
the local market as well as to macroeconomic
and financial factors affecting expectations and
financing domestically and abroad. So the liquidity
of property—entirely relative—varies significantly
over time. Rising markets see increasing numbers
of transactions, while falling markets see volumes
drop sharply. Some types of properties are more
sensitive to these variations than others, and the
properties transacted during recessions are, on
the whole, different from those exchanged in
rising markets; for some properties, transactions
at acceptable prices will be almost impossible for
long periods of time.
High transaction costsAs a result of the organisation of the market
and of formalities unique to buildings, the cost
of a round trip is far higher in real estate than
in the financial markets. In addition to broker
commissions and fees due to other participants in
the transaction, there are various duties and fees;
among these fees, traditionally, is a high stamp or
registration duty, not capped, based on the value
of the transaction.36
ProhibitionsInvestors enjoying advantageous tax provisions
may find that their right to sell buildings is limited
if they want to keep their advantages—for REITs,
for example, short- and medium-term transactions
or real estate development activities are limited.
Lack of stockA significant share of institutional-quality
buildings is in the hands of owner-occupiers
and availability on the investment market varies
considerably from one country to another and
from one property type to another (appendix 2).
For some property types and in certain segments,
the investable stock may be extremely limited.
Where rental space is in short supply, development
or the acquisition of property to develop may be
a solution. Finally, in consideration of the local
nature of real estate markets, institutional investors
may tend to focus on particular segments. The
imbalance between available funds and available
stock may make acquisitions very difficult and
lead to excesses and cycles.
Market weight, capacity, and depthWhen an investor is large, decisions to make
allocation changes must make allowances for
possible limits on market capacity and liquidity.
The in-house availability of the necessary human
resources must also be verified.
Transfer of fractional interestsWhen buildings are held in common with other
investors, the transfer of interests requires
negotiation with these investors. A fractional
interest in a building is generally less liquid than
the building itself.
2. Real Estate Portfolio Management
36 - Of course, the transfer of a building may also result in a capital gain or loss that may or may not be subject to taxation and assignable to real estate or non-real estate sources of profit, and at a rate that can vary in accordance with the duration for which the building is held.

50
Allocation decisions must thus be made with full
knowledge of the direct and indirect costs and
of the delays involved in the execution of the
decision; the limited availability and quality of
information will, in addition, require allowances
for large margins of error—in the end, it will
take particularly clear signals to justify portfolio
modifications.
2.3.2. Adjustment of investment in non-listed vehiclesVariable liquidityIn 2001, an IPF study showed that, on the whole,
financial advisers, investors, and asset managers
considered non-listed collective vehicles less
liquid than the buildings themselves. This view
may be less clear-cut today, but investment in
closed funds generally takes place in the primary
market and secondary markets are very illiquid.
Some open-ended funds provide greater
allocation flexibility, but maturity intermediation
is a risky activity that gives the manager an
incentive to hold liquid assets that can dilute
the real estate characteristics of the investment
and to require notice for redemptions or even
to suspend them altogether in the event of a
liquidity crisis. As is the case on the underlying
market, the liquidity of non-listed vehicles
is subject to inter-temporal variations and is
reduced in falling markets.
Potentially high transaction costsTransaction costs are variable, but in general
they are comparable to those in the underlying
market: the transfer of shares in non-listed
vehicles may be subject to taxes comparable to
those on the transfer of buildings; fees on the
front-end (at subscription) and on the back-end
(at redemption), the bid-ask spread, and the
difference to NAV for funds traded in secondary
markets must be taken into account as well.
Allocation to a fund may, finally, require a two-
phase due diligence—one phase to ascertain the
quality and risks of the portfolio, the other to
ascertain the quality of the manager.
Lack of stock and purityThe non-listed vehicles market is not complete
and it may be difficult to find a product that
corresponds to a specific segment. In the past, most
vehicles were of the core type and were diversified,
but there are more and more specialised and/or
more aggressive funds; they do not, nonetheless,
cover all segments and styles.
In addition to the absence of consensus on the
notion of style, it should be noted that with
the loss of control over assets, the institutional
investor may find the manager drifting from
the allocation objectives stated by the fund (for
example, risky buildings added to a core fund for
seemingly better performance).
Their insufficient size may mean that most of them
are far from being perfectly diversified, but non-
listed vehicles facilitate the diversification of a real
estate portfolio, allow delegation to specialists, and
provide access to otherwise inaccessible segments.
As such, they are useful strategic allocation tools
for small- and medium-size institutional investors
as well as for larger ones, although imprecision
and possible style drift can result in complications.
Their liquidity, however, fluctuates greatly and
transaction costs are substantial—they are not a
satisfactory solution for tactical allocation.
2.3.3. Adjustment using listed vehiclesClear liquidity and cost advantages but an underdeveloped marketFrom the allocation point of view, listed real
estate holds out the promise of rapid low-cost
transactions.
However, it is underdeveloped in most countries,
which results in limited overall capitalisation;
in an incomplete market (lack of property-type
specialists); and in securities with variable levels
2. Real Estate Portfolio Management
An EDHEC Risk and Asset Management Research Centre Publ icat ion
EDHEC European Real Estate Investment and Risk Management Survey - November 2007

51An EDHEC Risk and Asset Management Research Centre Publ icat ion
EDHEC European Real Estate Investment and Risk Management Survey - November 2007
of capitalisation and liquidity—few property
companies can match the features of large caps
in the stock markets. Within these limits, listed
real estate vehicles allow the implementation of
dynamic allocation strategies.
Limited substitutability Using listed real estate to alter the exposure
of illiquid direct and non-listed real estate
investments synthetically is thus very appealing.
However, listed real estate is evaluated altogether
differently from direct investments and non-listed
vehicles. In the short term, its statistical properties
are radically different; this makes managing
overall exposure of direct investments and non-
listed funds using listed vehicles highly complex
at best.37
2.4. Measuring and managing riskRisk should of course be approached with respect
to the portfolio as a whole, a broad view that
implies making allowances for its interaction with
other assets and with liabilities. In practice, it is
in the context of strategic allocation that these
allowances are made, and risk is then usually
managed in each asset class without considering
other classes or liabilities.
2.4.1. Risk measuresWe will now review the main indicators used by
academics and professionals to gauge the risk of
real estate investments.
It should be noted that the linked problems of
data (limited availability, low quality, and lack of
transparency) and illiquid direct real estate markets
can make it hard to calculate accurate measures
and lessen their usefulness when it comes to risk
management through dynamic asset allocation.
Central moments and normalityThe analysis of the distribution function should
never be limited to the first order (mean) and
second order (standard deviation) moments,
especially with a class whose returns are typically
not normally distributed. Normality should be
tested and if it cannot be confirmed, particular
attention should be given to the third (skewness)
and fourth (kurtosis) central moments (box 8).
Cheng (2005), who has attempted to validate
measures of systematic asymmetric risk in
real estate, notes the existence of a premium
associated with skewness whatever the property
type may be.
Dealing with auto-correlation
Given that the underlying real estate market
is illiquid and that the appraisal process is
conservative, investment returns are liable to be
auto-correlated. In that case, it becomes difficult
to measure the real exposure of the portfolio to
the different risk factors. We thus recommend
testing for autocorrelation and implementing
remedial procedures before calculating the
different performance and risk indicators (box 9).
Asymmetric risk measuresThere are two reasons for using asymmetric risk
measures: the non-neutrality of investors with
respect to the direction of risk—bad surprises are
resented more than good ones are appreciated—
and the asymmetry of returns, which makes it
inappropriate to use a symmetric distribution such
as the normal law which is fully characterised
by its mean and variance. Generalised co-lower
partial moments may be used to derive more
realistic models (box 10).
2. Real Estate Portfolio Management
37 - Seiler, Webb, and Myer (2001) study the substitutability of long and short positions in listed and non-listed real estate and the possibility of shorting an equity REIT index instead of directly selling private real estate holdings. They construct efficient frontiers based on five years of expected returns and compare the frontiers constructed solely with direct property-type indices and those where an equity REIT index has been substituted—the frontiers are very different and those constructed solely with direct real estate are dominant. The results for mixed-asset portfolios are more promising: property-type weights may vary, but allocation to real estate remains stable. The results from the short positions are disappointing: weights are unstable and the synthetically rebalanced portfolios have levels of risk far higher than those that are rebalanced physically. These results are probably due in part to the use of direct indices that were not unsmoothed and indirect indices that were not deleveraged. An attempt to replicate these results that controls for these factors and takes a long-term perspective would be worthwhile.

52
2. Real Estate Portfolio Management
An EDHEC Risk and Asset Management Research Centre Publ icat ion
EDHEC European Real Estate Investment and Risk Management Survey - November 2007
Box 8: Standard deviation, skewness, kurtosis and test for normality
Standard deviationThe variance of portfolio returns is defined as:
σP
2 = E RP ,i − E ( RP ,i )⎡⎣ ⎤⎦2=
RP ,i − E ( RP ,i )( )N
2
i
∑
where RP,i corresponds to the ith return of the observed series of N returns
Since return differences are squared, the units of variance differ from the units of return. This is why one
usually works with the square root of the variance i.e. the standard deviation or volatility of returns.
SkewnessThe skewness indicator measures the return distribution function’s asymmetry coefficient. For an
exhaustive series of N returns, the skewness is equal to:
SP =RP ,i − E ( RP ,i )( )
N.σP3
3
i
∑
where RP,i corresponds to the ith return of the observed series of N returns, and σP is the standard deviation.
Applied to a normal distribution, the skewness would be equal to 0. Investers should value positive
skewness in long positions as it implies that the probability of above average returns is higher than
that of below average returns.
KurtosisKurtosis allows the fatness of the distribution tails to be assessed. A high level of kurtosis therefore
means that there are extreme returns (outliers). The kurtosis is calculated as follows:
K P =RP ,i − E ( RP ,i )( )
N.σP4
4
i
∑
where RP,i corresponds to the ith return of the observed series of N returns, and σP is the standard deviation.
Applied to a normal distribution, the kurtosis would be equal to 3. That is why we more commonly use
the excess kurtosis, i.e. the differential obtained compared to a normal distribution (K-3).
Detecting non-normalityThe Bera Jarque indicator tests the normality of a distribution function. It presents the advantage of
simultaneously analysing the third and fourth order moments of the distribution function.
BJ P = NSP
2
6+
( K P − 3) 2
24⎡
⎣⎢
⎤
⎦⎥
where N is the number of observations.
Under the assumption of normality, the BJ statistic follows a Chi-squared distribution with 2 degrees
of freedom. When the value of statistic computed from a large sample is higher than a critical value
(typically 6 for a level of significance of 5%), the assumption of normality is rejected.

53An EDHEC Risk and Asset Management Research Centre Publ icat ion
EDHEC European Real Estate Investment and Risk Management Survey - November 2007
Extreme risk measuresExtreme risks can have catastrophic consequences
for investors (reputation risk, temporary inability
to meet obligations, bankruptcy). For this reason
it is important not only to weigh the average
risks reflected in the central moments of the
distributions but also to examine the extreme
events located in the tails.
Maximum drawdown
The simplest measure of extreme risk involves
calculating the maximum loss recorded by the
portfolio during the period of analysis or the
maximum drawdown, i.e., the biggest loss recorded
in comparison with the highest level reached by
the portfolio during the period.
2. Real Estate Portfolio Management
Box 10: Downside risk measures
An IPF (2002) report devoted to risk measurement and management concludes that if a single
measure of risk in real estate has to be recommended, it should be semi-deviation, as it captures
non-normality and produces fund rankings that are the least dissimilar to the rankings generated
from other statistics studied.
(Below mean) semi-deviation measures the volatility of returns below the average return, while
below-target semi-deviation captures the variability of returns below a moving benchmark--e.g.,
risk-free rate, market index.
Semi − deviation = LPM 2 ( E ( RP ), RP ) =1
NMax(0,( E ( RP ) − RP ,i ))⎡⎣ ⎤⎦
2
i = 1
N
∑
BTSD
R * = LPM 2 ( R * , RP ) =1
NMax(0,( Ri
* − RP ,i ))⎡⎣ ⎤⎦2
i = 1
N
∑ where R* is a moving benchmark
These are nested in the general co-lower partial moment formula:
CLPM n ( R * , RX , RY ) =1
NMax(0,( Ri
* − RX ,i ))⎡⎣ ⎤⎦n − 1
( Ri* − RY ,i
i = 1
N
∑ )
Letting n=2 yields semi-variance and semi-covariance measures which can be used in a Markowitz-
like framework to derive a downside risk efficient frontier that takes better account of investor
preferences (as in Coleman and Mansour (2005)).
Box 9: Testing and remedying autocorrelation
The Ljung-Box (1978) test statistic can be used to assess the level of auto-correlation:
QP = N ( N + 2)θk
2
N − kk = 1
m
∑
where N is the number of observations and θk the kth order autocorrelation coefficient.
Under the assumption that the auto-correlation coefficients of order 1 to m are null, the Q statistic
follows a Chi-squared distribution with m degrees of freedom.
Numerous methods have been proposed to solve the problem of the auto-correlation of real estate
returns; in appendix 9 we apply the Geltner (1993) model to unsmooth NPI data between 1978 and
2006 and find a 58% upward revision in volatility.

54
This measure is generally accompanied by the
number of months for which the loss was realised
and the number of months required to compensate
for the loss.
Value-at-Risk (VaR)
The maximum drawdown does not, however,
allow the average extreme risks of a fund to be
characterised. In order to measure the extreme risks
more accurately, it is essential to use instruments
such as the value at risk (box 11).
2. Real Estate Portfolio Management
An EDHEC Risk and Asset Management Research Centre Publ icat ion
EDHEC European Real Estate Investment and Risk Management Survey - November 2007
Box 11: Approaches to VaR calculation
The so-called parametric approach to VaR calculation involves explicitly assuming that the returns follow a known distribution. Such an assumption introduces model risk which may be more or less severe. Assuming normally distributed returns–as is most often done–is not appropriate for the alternative universe. If the Gaussian assumption is nevertheless made, the VaR can be calculated explicitly by using the following formula:
P ( dW ≤ −VaR ) = 1 − α
VaR = nσWdt 1 / 2
where n is the number of standard deviations at (1-α), σ is the standard deviation, W is the present value of the portfolio, dt is a year fraction, and dW is the variation in the value of the portfolio.
The VaR measures potential losses that arise habitually or regularly; it does not mention the
consequences of exceptional events. Taking exceptional events into account exacerbates the
problem of statistical estimation.
In the case of a VaR that is calculated from the distribution of past returns, a historical VaR, it is
necessary to have a very large amount of data to obtain a significant sample of events. This sample
risk problem, which already exists in the traditional universe, is exacerbated in the real estate
universe because of the low frequency of the data.
Favre and Galeano (2002) suggest using the Cornish-Fisher VaR as a pragmatic solution to the VaR
calculation in a fat-tail distribution environment. This method is a compromise that balances model
risk and sample risk. It consists of calculating a VaR using a normal distribution formula and then
using a Cornish-Fisher expansion to take the skewness and excess kurtosis into account:
z = Zc +
16
( Zc2 − 1)S +
124
( Zc3 − 3Zc )K −
136
( 2Zc3 − 5Zc )S 2
where Zc is the critical value of the Gaussian law at probability (1-α), S the skewness, and K the excess kurtosis.
The adjusted VaR is therefore equal to:
VaR = −W ( μ + zσ )
where μ is the mean.
It should be noted that if the distribution is normal, S and K are equal to zero and consequently,
z=Zc, and we come back to the Gaussian VaR. Further interesting extensions of the VaR such as
marginal or incremental VaR are presented in EDHEC (2005).
Maximum Drawdown = min0 ≤ t ≤ T
NAVt
max0 ≤ i ≤ t
( NAVi )− 1
⎡
⎣⎢⎢
⎤
⎦⎥⎥

55An EDHEC Risk and Asset Management Research Centre Publ icat ion
EDHEC European Real Estate Investment and Risk Management Survey - November 2007
2.4.2. Breakdown of riskThe measures above are the consequences of risks
taken—identifying these risks is interesting and can
be done with the help of factor decomposition. Ex
post analysis of risk may be informative, but good
risk management implies ex ante risk control and
thus analysis of the portfolio as it is, analysis of
the impact of possible changes, and the use of
various methods to reduce risk or to transfer it.
Asset riskBlundell (2003) states that Jones Lang LaSalle
deems statistical approaches to the analysis of
volatility of little use because the measure of
historical volatility is generated in part by buildings
that are no longer in the portfolio, because they
rely on smoothed appraisal data, because they
have no diagnostic value, and, finally, because
the traditional rebalancing approach of portfolio
management is much more costly than are other
methods of managing risk. Blundell proposes a
model for the decomposition of volatility into
twelve risk indicators affecting capital values and
income (exhibit 14).
Scores presented on a radar chart allow the
identification—with respect to an absolute
objective or to a peer-group average—of danger
zones, zones that result in complementary
analyses and signposts for a possible rebalancing
through acquisitions, disposals, and property
management.
2. Real Estate Portfolio Management
Exhibit 14: Blundell’s breakdown of the volatility of a real estate portfolio (2003)
Factors affecting capital values Factors affecting income
• Size• Property-type concentration • Segment concentration• Geographic concentration• Weight of central London• Expected income growth• Development exposure
• Tenant creditworthiness (value-weighted) • Void rate• Lease-expiry concentration (value-weighted mean)• Tenant concentration• Current yield
The correlation of four of the above factors and
measures of return as well as of absolute and
relative risk was evaluated ex post for 130 portfolios
between 1993 and 2002. Neither development
exposure and risk nor development exposure and
return appear correlated; there is a significantly
positive correlation of size and risk but not of
size and return; unsurprisingly, deviations from
property-type weights i.e. active bets and risk as
well as return are significantly positively correlated;
current yield and absolute risk are negatively
correlated. An additional factor, average property-
type beta, is more closely correlated to both return
and tracking error. The evaluation of the other
factors was done with measures of risk-taking
unique to 2002; this less stringent evaluation
indicates that both geographic concentration and
tenant concentration are correlated positively
to tracking error but there does not appear to be
any reward for tenant concentration. Blundell,
Fairchild, and Goodchild (2005) attempt to predict
tracking error over three years from current
portfolio characteristics and find optimal results
(R2 of 0.45) with a five-factor model of the previous
variables. They are: weighted beta (strong positive
relationship to risk, weaker positive correlation
with returns), difference in sector balance (with a
relationship to risk and returns identical to that of
weighted beta), income yield (high income return
reduces tracking error and has a positive impact
on returns), exposure to development (positive
relationship to risk with no compensating impact
on returns), lot size (relationship to risk and return
identical to that of exposure to development).
Leverage riskAs a potential magnifier of outcomes, leverage is
a significant risk which, along with the volatility
of the underlying asset generating the cash flows
necessary to service the debt, is one of the two

56
main causes of default. Gordon and Tse (2003)
recommend using VaR to gauge leverage risk in
real estate portfolios.
Exchange rate riskCurrency volatility is markedly higher than the
volatility of real estate returns, so the returns on
investment in currency zones beyond those of the
investor’s benchmark currency will be considerably
affected by currency movements.
2.4.3. Risk managementDiversificationThe objective of the techniques of risk management
is to ensure that—at given levels of return and
keeping in mind other obligations—portfolio risks
are minimised, or, at the very least, that they remain
below critical levels. Diversification is usually
the most important technique. Its aim, strictly
speaking, is to reduce the idiosyncratic risk of the
portfolio. More broadly, it refers to a spreading of
investments around various segments resulting in
an average exposure to systematic risks.
Dynamic allocationDynamic allocation consists of changing the
structure of the portfolio in response to market
changes. The use of this risk-management
technique in non-listed real estate runs up
against substantial delays, costs, and execution
risks. This technique is feasible with the most
liquid instruments, but it must be kept in mind
that some open funds reserve the right to suspend
redemptions and that mid-caps are subject to
significant liquidity fluctuations.
Guaranteed productsOne possibility for the draconian reduction of risk
is to give up any investment other than that in
principal-protected products. These products are
available in some countries, such as the United
Kingdom, but are mainly aimed at retail investors.
The guarantee of the principal comes at the cost
of possible caps or reductions on returns, or of
seizure or withholding of current yield. These
passive solutions must be held until maturity and
have no developed secondary market.
Use of derivativesInterest rate risk that arises from leverage may
be managed with standard derivatives. Options
can protect the portfolio from unfavourable
movements; forward/future contracts and swaps
can guarantee a rate of exchange. In indirect
investments, credit protection could conceivably
be purchased to serve as a shield from the
consequences of leverage gone awry.
The partial or total hedging of exchange rate
risk can be done “naturally”—in other words, by
borrowing in foreign currency—or by resorting to
derivatives. While cash-flows from rents are highly
predictable, there is considerable uncertainty
surrounding the final sale price of an investment
that is held for several years; rents should thus
prove easier to hedge than capital values. Another
issue is that derivatives are mostly short-term
contracts and as such cumbersome hedges
for long-term real estate investments. Further
information on hedging techniques appropriate
for long-term assets could be gleaned in corporate
finance texts.
Property derivatives hold great promise for real
estate investment and risk management, as they
could allow investors to take on, reduce, and hedge
exposure to the overall direct market or specific
property sectors in a time-efficient and cost-
effective way. From a risk management perspective,
derivatives allow hedging of the systematic
component of real estate risk, thereby enabling
managers to insulate their portfolios from wider
market movements. Another possibility is to use
property derivatives to implement dynamic asset
allocation strategies synthetically. Note, however,
that these techniques will prove effective only for
highly diversified portfolios.
2. Real Estate Portfolio Management
An EDHEC Risk and Asset Management Research Centre Publ icat ion
EDHEC European Real Estate Investment and Risk Management Survey - November 2007

57An EDHEC Risk and Asset Management Research Centre Publ icat ion
EDHEC European Real Estate Investment and Risk Management Survey - November 2007
Tenanting and property managementDirect control of assets allows the investor to use
preventive and/or corrective measures to limit
risk. For example, attention to tenant and business
sector diversification could reduce economic risk
without requiring portfolio reallocation while, at
the property level, initial due diligence and ongoing
monitoring of tenants’ creditworthiness and/or
contract guarantees could reduce tenant default
risk and/or its impact. Likewise, pre-acquisition
due diligence and good property management will
help identify risks to avoid, control, or transfer.
2. Real Estate Portfolio Management

58 An EDHEC Risk and Asset Management Research Centre Publ icat ion
EDHEC European Real Estate Investment and Risk Management Survey - November 2007

3. Property Derivatives
59An EDHEC Risk and Asset Management Research Centre Publ icat ion
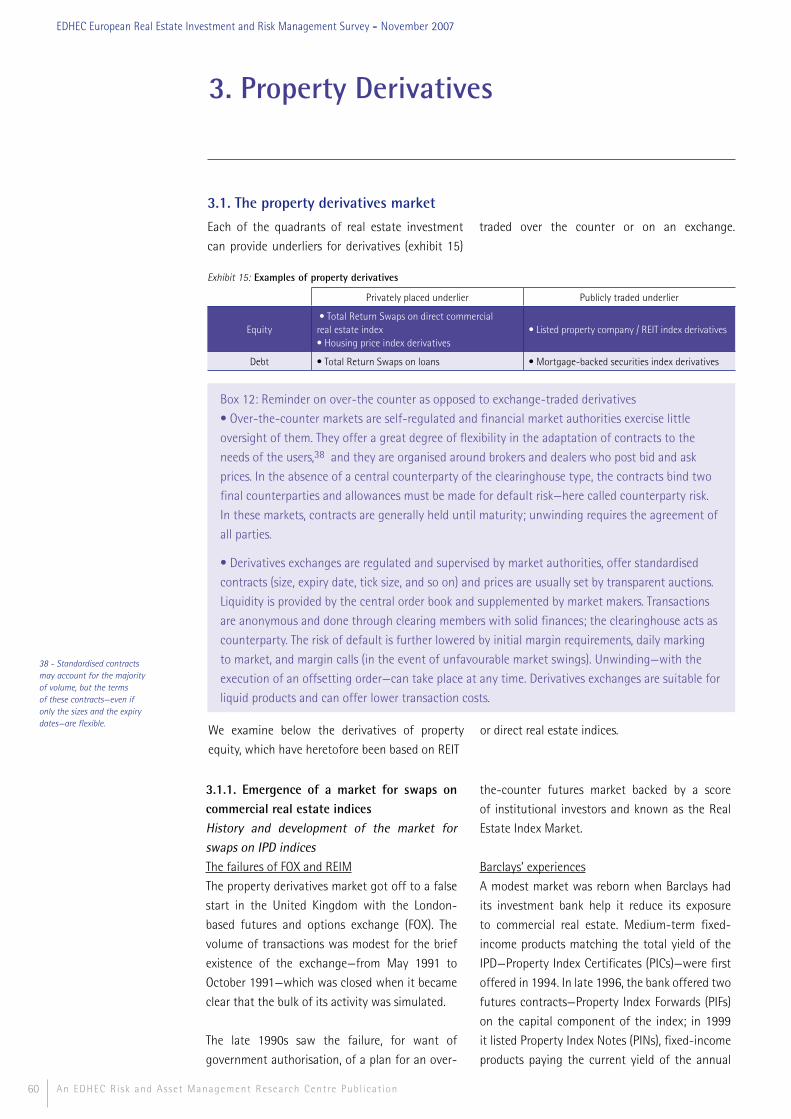
60
3.1.1. Emergence of a market for swaps on commercial real estate indicesHistory and development of the market for swaps on IPD indicesThe failures of FOX and REIM
The property derivatives market got off to a false
start in the United Kingdom with the London-
based futures and options exchange (FOX). The
volume of transactions was modest for the brief
existence of the exchange—from May 1991 to
October 1991—which was closed when it became
clear that the bulk of its activity was simulated.
The late 1990s saw the failure, for want of
government authorisation, of a plan for an over-
the-counter futures market backed by a score
of institutional investors and known as the Real
Estate Index Market.
Barclays’ experiences
A modest market was reborn when Barclays had
its investment bank help it reduce its exposure
to commercial real estate. Medium-term fixed-
income products matching the total yield of the
IPD—Property Index Certificates (PICs)—were first
offered in 1994. In late 1996, the bank offered two
futures contracts—Property Index Forwards (PIFs)
on the capital component of the index; in 1999
it listed Property Index Notes (PINs), fixed-income
products paying the current yield of the annual
3. Property Derivatives
An EDHEC Risk and Asset Management Research Centre Publ icat ion
38 - Standardised contracts may account for the majority of volume, but the terms of these contracts—even if only the sizes and the expiry dates—are flexible.
EDHEC European Real Estate Investment and Risk Management Survey - November 2007
Exhibit 15: Examples of property derivatives
Privately placed underlier Publicly traded underlier
Equity • Total Return Swaps on direct commercial real estate index• Housing price index derivatives
• Listed property company / REIT index derivatives
Debt • Total Return Swaps on loans • Mortgage-backed securities index derivatives
Box 12: Reminder on over-the counter as opposed to exchange-traded derivatives
• Over-the-counter markets are self-regulated and financial market authorities exercise little
oversight of them. They offer a great degree of flexibility in the adaptation of contracts to the
needs of the users,38 and they are organised around brokers and dealers who post bid and ask
prices. In the absence of a central counterparty of the clearinghouse type, the contracts bind two
final counterparties and allowances must be made for default risk—here called counterparty risk.
In these markets, contracts are generally held until maturity; unwinding requires the agreement of
all parties.
• Derivatives exchanges are regulated and supervised by market authorities, offer standardised
contracts (size, expiry date, tick size, and so on) and prices are usually set by transparent auctions.
Liquidity is provided by the central order book and supplemented by market makers. Transactions
are anonymous and done through clearing members with solid finances; the clearinghouse acts as
counterparty. The risk of default is further lowered by initial margin requirements, daily marking
to market, and margin calls (in the event of unfavourable market swings). Unwinding—with the
execution of an offsetting order—can take place at any time. Derivatives exchanges are suitable for
liquid products and can offer lower transaction costs.
3.1. The property derivatives market
Each of the quadrants of real estate investment
can provide underliers for derivatives (exhibit 15)
traded over the counter or on an exchange.
We examine below the derivatives of property
equity, which have heretofore been based on REIT
or direct real estate indices.
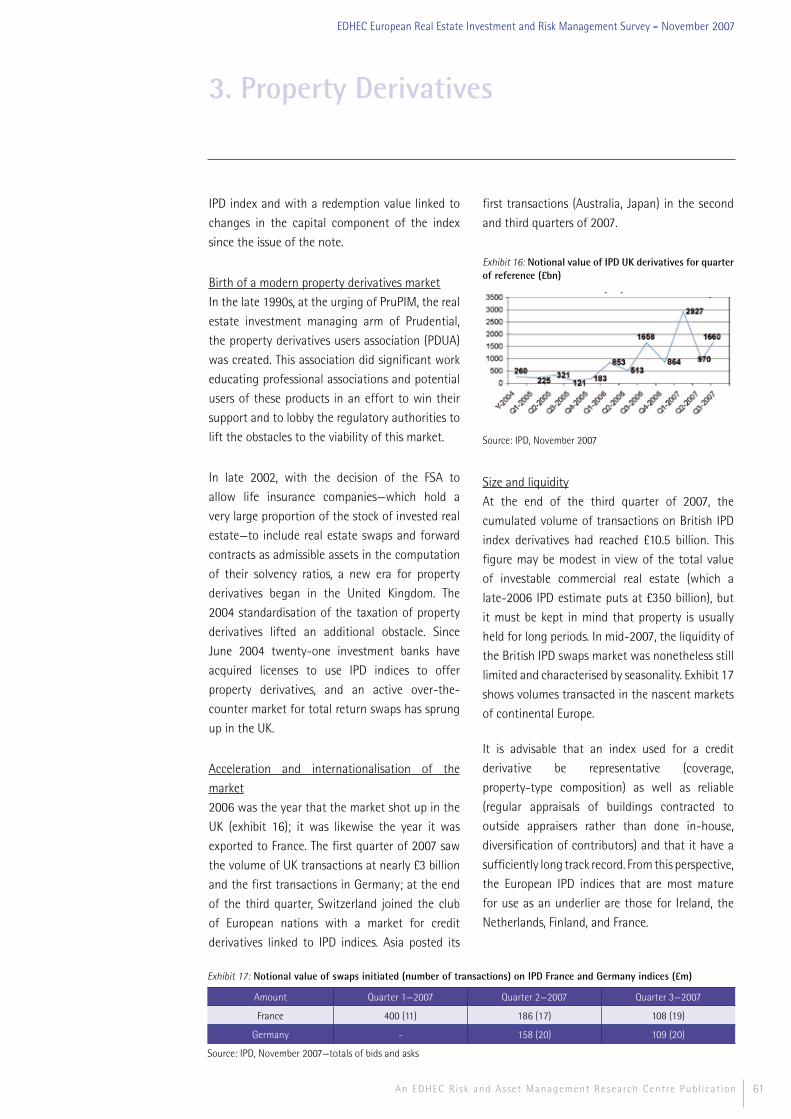
61An EDHEC Risk and Asset Management Research Centre Publ icat ion
EDHEC European Real Estate Investment and Risk Management Survey - November 2007
IPD index and with a redemption value linked to
changes in the capital component of the index
since the issue of the note.
Birth of a modern property derivatives market
In the late 1990s, at the urging of PruPIM, the real
estate investment managing arm of Prudential,
the property derivatives users association (PDUA)
was created. This association did significant work
educating professional associations and potential
users of these products in an effort to win their
support and to lobby the regulatory authorities to
lift the obstacles to the viability of this market.
In late 2002, with the decision of the FSA to
allow life insurance companies—which hold a
very large proportion of the stock of invested real
estate—to include real estate swaps and forward
contracts as admissible assets in the computation
of their solvency ratios, a new era for property
derivatives began in the United Kingdom. The
2004 standardisation of the taxation of property
derivatives lifted an additional obstacle. Since
June 2004 twenty-one investment banks have
acquired licenses to use IPD indices to offer
property derivatives, and an active over-the-
counter market for total return swaps has sprung
up in the UK.
Acceleration and internationalisation of the
market
2006 was the year that the market shot up in the
UK (exhibit 16); it was likewise the year it was
exported to France. The first quarter of 2007 saw
the volume of UK transactions at nearly £3 billion
and the first transactions in Germany; at the end
of the third quarter, Switzerland joined the club
of European nations with a market for credit
derivatives linked to IPD indices. Asia posted its
first transactions (Australia, Japan) in the second
and third quarters of 2007.
Exhibit 16: Notional value of IPD UK derivatives for quarter of reference (£bn)
Source: IPD, November 2007
Size and liquidity
At the end of the third quarter of 2007, the
cumulated volume of transactions on British IPD
index derivatives had reached £10.5 billion. This
figure may be modest in view of the total value
of investable commercial real estate (which a
late-2006 IPD estimate puts at £350 billion), but
it must be kept in mind that property is usually
held for long periods. In mid-2007, the liquidity of
the British IPD swaps market was nonetheless still
limited and characterised by seasonality. Exhibit 17
shows volumes transacted in the nascent markets
of continental Europe.
It is advisable that an index used for a credit
derivative be representative (coverage,
property-type composition) as well as reliable
(regular appraisals of buildings contracted to
outside appraisers rather than done in-house,
diversification of contributors) and that it have a
sufficiently long track record. From this perspective,
the European IPD indices that are most mature
for use as an underlier are those for Ireland, the
Netherlands, Finland, and France.
3. Property Derivatives
Exhibit 17: Notional value of swaps initiated (number of transactions) on IPD France and Germany indices (£m)
Amount Quarter 1—2007 Quarter 2—2007 Quarter 3—2007
France 400 (11) 186 (17) 108 (19)
Germany - 158 (20) 109 (20)
Source: IPD, November 2007—totals of bids and asks
62
United States—behind Europe The two starts of NPI swaps
Following in the footsteps of IPD, CSFB and
NCREIF partnered in mid-2005 to create an over-
the-counter market for real estate swaps on the
appraisal-based quarterly NCREIF Property Index
(NPI); CSFB obtained an exclusive license to
use the index through April 2007. With only six
months to go to this expiry date only two small
transactions had been reported.
Some may argue that these lags in the US
are linked to the fact that the NPI cannot be
considered a representative index of direct real
estate as (i) it tracks the investments of only one
class of investors—tax-exempt institutions—(ii)
its coverage of the universe is limited—$247bn
worth of properties or circa 10% of the investable
investment grade stock—and (iii) its property mix,
with a concentration in core prime properties, is
peculiar when compared to the underlying stock
of real estate. However, whether or not the NPI
is representative of the commercial real estate
universe, it is the oldest index available and is
established as a benchmark for direct real estate
investments by institutional investors.
A likelier explanation for the lack of transactions
may be the business model adopted by NCREIF,
which, by awarding a monopoly to CSFB, did not
favour goodwill on the part of the investment banks
that could have fostered market development
through marketing and liquidity provision.
Reluctant to enter an uneven playing field,
other investment banks apparently forced CSFB
to renounce its exclusivity in the fall of 2006
and NCREIF announced new licenses had been
awarded in March and April 2007. Transaction
volumes have increased with the arrival of these
new market participants, but the market is still in
its infancy; these volumes, after all, have reached
$300 million over the semester following this
second start to the market.
Beyond NPI: direct real estate indices competing
to serve as underlier for derivatives
Appendix 10 lists the new US commercial real
estate indices created to bolster the derivatives
markets. Their shared goal is to provide a more
faithful and more current image of changes in
the property markets than does the NPI, which is
subject to lag, smoothing, and seasonality. They
differ in their methods for treating (or not treating)
the quality and liquidity fluctuations observable in
the market. S&P/GRA offers transactions indices
based on the moving averages of prices per square
foot, MIT/RCA (Moody’s/REAL) uses the repeat-
sales method to produce constant quality indices,
and Rexx provides indices for the offices market
from local market data and from macroeconomic
analyses—it positions itself as a local specialist.
In September 2006, the Chicago Mercantile
Exchange (CME) and Global Real Analytics (GRA)
announced a first-quarter 2007 launch of real
estate futures and options on GRA Commercial
Real Estate Indices. The CME was endeavouring
to create exchange-based derivatives markets
in commercial real estate just as it had created
an organised market for housing derivatives. In
November 2006, Standard & Poor’s partnered
with GRA to publish the re-branded indices and
in January 2007 Charles Schwab took over GRA.
S&P/GRA re-launched their indices in August 2007
with the CME blaming the delay on the merger
and organising a late-October 2007 launch.
According to MIT/RCA, a consortium has been
working on developing a forward market on their
indices. Early estimates referred tentatively to Q1-
2007 for a launch. At the end of September 2007,
Real Estate Analytics—one of the three original
partners of the MIT/RCA index—announced it
had reached an agreement with Moody’s. The
rating agency will compute the index in place of
MIT and will provide analyses, while Real Estate
Analytics, proprietor of the computation method
and holder of the rights to use the RCA database,
3. Property Derivatives
An EDHEC Risk and Asset Management Research Centre Publ icat ion
EDHEC European Real Estate Investment and Risk Management Survey - November 2007

63An EDHEC Risk and Asset Management Research Centre Publ icat ion
EDHEC European Real Estate Investment and Risk Management Survey - November 2007
will be in charge of developing and structuring—
in association with the intermediaries—the
derivatives based on these indices, now renamed
Moody’s/REAL Commercial Property Price Indices.
Rexx is present both on the OTC market, where it
is courting intermediaries, and on the organised
market since the International Securities Exchange
announced at the end of April 2007 that it was
launching Rexx derivatives.
Attempting a forecastHaving a diversity of indices vying to underlie
property derivatives poses difficulties and creates
opportunities. Brokers may find pitching property
derivatives challenging as the number and
heterogeneity of underlying indices could puzzle
investors and reinforce a wait-and-see attitude.
The US market is liable to fragmentation and could
be stillborn if deals are distributed among indices
in a way that prevents the emergence of a pool
of liquidity large enough to support a sustainable
market. On the other hand, and provided scale
could be achieved in multiple derivatives markets,
diversity would provide investors with a range of
options and create opportunities for arbitrage
between indices as highlighted by Clayton (2007).
Nevertheless, we consider this flurry of indices
detrimental to market development. Faced with
a brokers’ alliance to develop NPI derivatives and
lacking the status of benchmark in a crowded
marketplace, the various non-NPI transaction-
based indices are likely to be hard-sells. At this very
early stage of the US property derivatives market,
the prospects may be better for niche players than
for head-on challengers to the NPI.
3.1.2. Housing derivativesHalifax index derivativesResidential real estate is not a core sector for
institutional investment in the United Kingdom,
and for this reason it is absent from IPD indices
of commercial real estate. An over-the-counter
market for options and futures on the hedonic
Halifax (HBOS) housing price index—with a
cumulative notional volume of as much as £2
billion by mid-2007, according to Reuters—has
developed concurrently with the IPD index-linked
swaps markets.
Derivatives based on S&P/Case-Shiller indicesThe S&P/Case-Shiller indices are single-family
US home-price indices that use the repeat sale
pricing method to measure housing markets. In
September 2007 the twenty metropolitan region
indices were supplemented by two composite
indices (aggregates of ten and twenty regions)
and one national index.
In May 2006, the CME created housing options
and futures contracts39 based on a version of
the S&P/Case-Shiller indices calculated monthly
on a rolling sample of two months. Initially, the
contracts—settled to a composite index and to
markets in ten major cities—were offered for one
year and on a quarterly cycle. Trading volume
has remained modest: a few dozen transactions
per day and, according to the CME, a cumulative
notional volume of approximately $350 million
as of midpoint of the year (2007). In September
2007, in response to demand from investors for
longer terms, the CME began offering contracts
extending to eighteen months on a quarterly
cycle; to thirty-six months on a biannual cycle;
and to sixty months on an annual cycle.
Derivatives based on RPX indicesThe Residential Property Indices (RPX) created by
Radar Logic use transaction prices in an attempt
to measure daily changes40 in the price per
square foot of residential real estate. Twenty-five
metropolitan area indexes and a composite are
offered. An over-the-counter market for RPX index
derivatives, centred around six broker-dealers
and three inter-dealer brokers, was launched in
September 2007; the first transaction was a total
return swap.
3. Property Derivatives
39 - The advantages highlighted by the CME are: exposure to real estate values without direct ownership of properties, lower transaction costs than incurred in buying and selling individual homes, opportunities for hedging, portfolio diversification, access to a unique asset class, a way to make trading real estate a liquid and short-term investment, and an opportunity to benefit from down markets.40 - The transactions serve to estimate the parameters of the power laws found to be characteristic of price distributions; the indices are extracted using a proprietary formula.
64
3.1.3. Equity REIT index derivativesDow Jones U.S. Real Estate Index futures from the Chicago Board of TradeIn February 2007, CBOT launched a futures
contract based on the Dow Jones U.S. Real Estate
Index, an index comprised primarily of REITs.
The contract has a quarterly expiry, a multiple of
$100 and a tick size of $10; it is typically settled
in cash.41 It is traded on the CBOT electronic
trading platform and benefits from market maker
and liquidity provision programmes. This contract
has so far attracted little interest; in an effort to
boost participation the exchange has extended its
waiver of trading fees—as of the beginning of Q4-
2007 open interest was extremely low and volume
extremely thin.
FTSE EPRA/NAREIT Indices derivativesFor several years, investment banks have been
offering options based on the EPRA Euro Zone
index.
In October 2007, Liffe launched on the Paris market
two futures contracts based on the FTSE EPRA/
NAREIT Europe and on the FTSE EPRA/NAREIT
Euro Zone indices. The FTSE EPRA/NAREIT Europe
Index covers approximately 100 listed property
companies in fifteen countries. The FTSE EPRA/
NAREIT Euro Zone Index covers approximately
fifty property companies in nine countries. These
contracts have a trading unit of €10 per index
point and a tick size of €5. They are offered with
quarterly expiry dates and contracts are available
for the three nearest quarterly maturities; they
are settled in cash and benefit from market maker
contracts.
3.2. Standard contracts and transactionsTotal return swaps (TRSs), property linked notes
based on IPD UK indices, and Halifax housing-
price index derivatives account for the bulk of real
estate derivatives traded in Europe—and thus in
the world.
3.2.1. Total return swapsGlobal real estate index swaps against LIBOR (or EURIBOR) + premiumThe most common swap has a buyer (seller) of real
estate exposure make (receive) periodic payments
of the LIBOR or EURIBOR plus a designated
premium and receive (pay) the total return on
the IPD All Property index (exhibit 18). For swaps
on IPD indices, payments on the property leg on
the contract are typically made annually, while
payments linked to the inter-bank market are
made quarterly (exhibit 19); this mismatch is an
impediment that legitimises the growing use of
quarterly indices.42
All payments are based on the notional amount
agreed to by the parties. This notional principal
never changes hands; the impact of a default
is thus greatly curtailed. The use of a financial
intermediary with an excellent credit rating as a
counterparty to all transactions reduces credit risk
even more (exhibits 18-19).
For the buyer, this transaction is economically
equivalent to the borrowing of the notional
amount at the floating inter-bank rate plus the
spread and the subsequent investment of this
principal in the assets underlying the index.
Derivatives promoters emphasise this similarity
with the physical market and the advantages of
derivatives over bricks-and-mortar transactions:
stamp duty and other legal and agent fees can be
avoided, operations can be executed and unwound
swiftly, there is no need for parties to exchange
principal or upfront cash flows or for a buyer to
deal with property management of the underlying
assets, and a covered seller can retain ownership
and operational management of its properties.
Other swaps on IPD indicesSector for all-property swaps appeared in the
third quarter of 2005, in an attempt to meet
the readjustment needs of real estate portfolios.
Sub-sector for all-property swaps appeared in the
3. Property Derivatives
An EDHEC Risk and Asset Management Research Centre Publ icat ion
41 - CBOT accepts exchanges for physical transactions against securities for which price dynamics are “reasonably” correlated with price dynamics in the DJUSRE index. Such securities might include portfolios of stocks or ETFs such as the iShares Dow Jones U.S. Real Estate Sector Index fund and the streetTRACKS DJ Wilshire REIT fund. 42 - A high-quality quarterly index implies a high frequency of outside appraisals of capital values.
EDHEC European Real Estate Investment and Risk Management Survey - November 2007
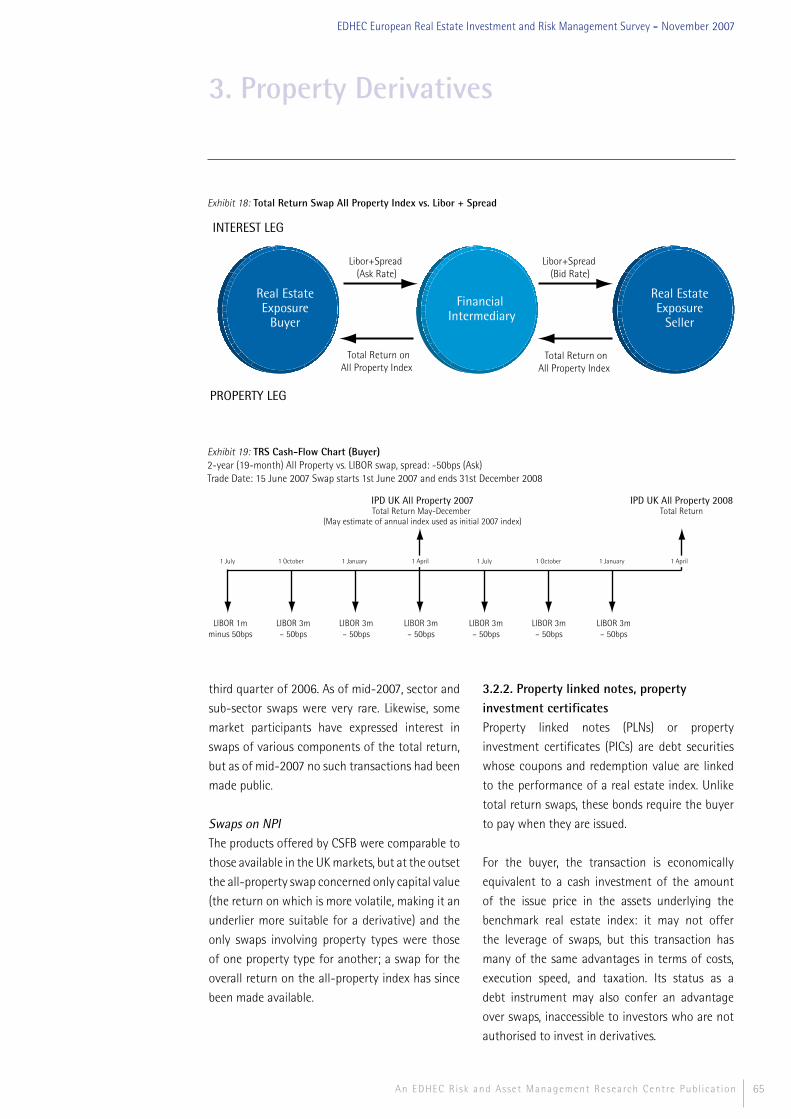
65An EDHEC Risk and Asset Management Research Centre Publ icat ion
EDHEC European Real Estate Investment and Risk Management Survey - November 2007
third quarter of 2006. As of mid-2007, sector and
sub-sector swaps were very rare. Likewise, some
market participants have expressed interest in
swaps of various components of the total return,
but as of mid-2007 no such transactions had been
made public.
Swaps on NPIThe products offered by CSFB were comparable to
those available in the UK markets, but at the outset
the all-property swap concerned only capital value
(the return on which is more volatile, making it an
underlier more suitable for a derivative) and the
only swaps involving property types were those
of one property type for another; a swap for the
overall return on the all-property index has since
been made available.
3.2.2. Property linked notes, property investment certificatesProperty linked notes (PLNs) or property
investment certificates (PICs) are debt securities
whose coupons and redemption value are linked
to the performance of a real estate index. Unlike
total return swaps, these bonds require the buyer
to pay when they are issued.
For the buyer, the transaction is economically
equivalent to a cash investment of the amount
of the issue price in the assets underlying the
benchmark real estate index: it may not offer
the leverage of swaps, but this transaction has
many of the same advantages in terms of costs,
execution speed, and taxation. Its status as a
debt instrument may also confer an advantage
over swaps, inaccessible to investors who are not
authorised to invest in derivatives.
3. Property Derivatives
Exhibit 18: Total Return Swap All Property Index vs. Libor + Spread
Exhibit 19: TRS Cash-Flow Chart (Buyer)2-year (19-month) All Property vs. LIBOR swap, spread: -50bps (Ask)Trade Date: 15 June 2007 Swap starts 1st June 2007 and ends 31st December 2008
Libor+Spread (Ask Rate)
Libor+Spread (Bid Rate)
Real EstateExposure
Buyer
INTEREST LEG
PROPERTY LEG
FinancialIntermediary
Real EstateExposure
Seller
Total Return on All Property Index
Total Return on All Property Index
IPD UK All Property 2007Total Return May-December
(May estimate of annual index used as initial 2007 index)
IPD UK All Property 2008Total Return
LIBOR 3m– 50bps
LIBOR 3m– 50bps
LIBOR 3m– 50bps
LIBOR 3m– 50bps
LIBOR 3m– 50bps
LIBOR 3m– 50bps
LIBOR 1mminus 50bps
1 July 1 October 1 January 1 July 1 October 1 January1 April 1 April
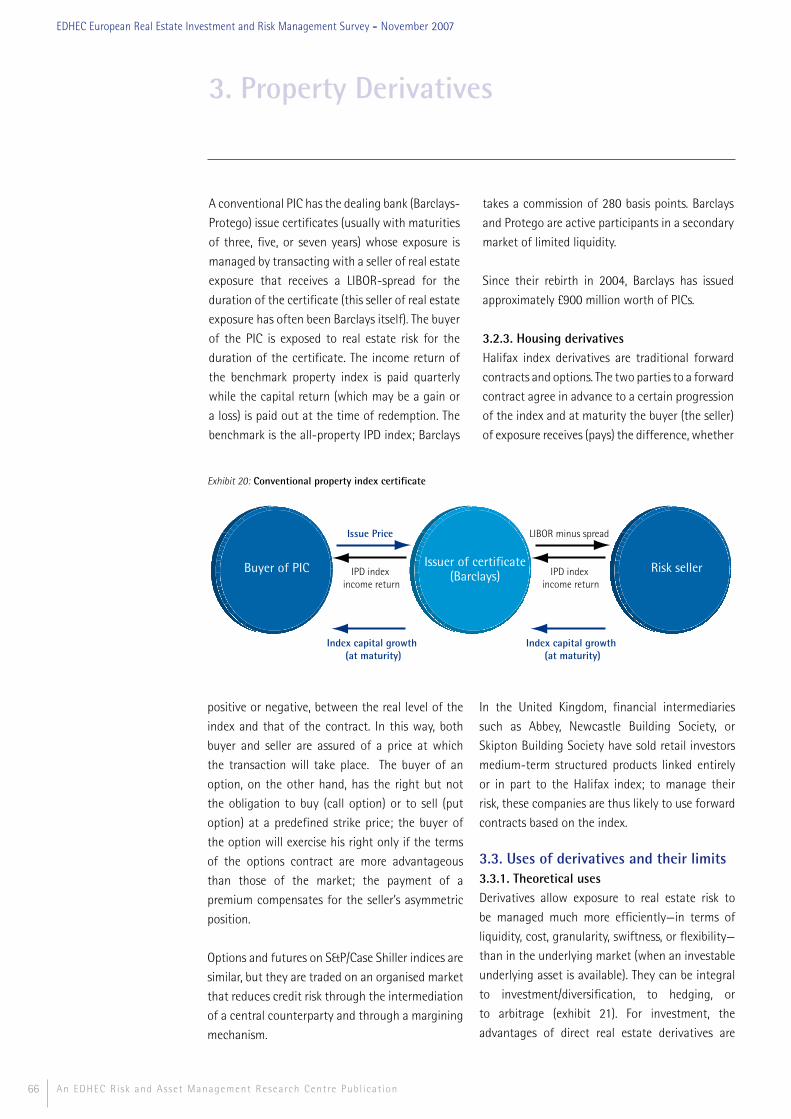
66
A conventional PIC has the dealing bank (Barclays-
Protego) issue certificates (usually with maturities
of three, five, or seven years) whose exposure is
managed by transacting with a seller of real estate
exposure that receives a LIBOR-spread for the
duration of the certificate (this seller of real estate
exposure has often been Barclays itself). The buyer
of the PIC is exposed to real estate risk for the
duration of the certificate. The income return of
the benchmark property index is paid quarterly
while the capital return (which may be a gain or
a loss) is paid out at the time of redemption. The
benchmark is the all-property IPD index; Barclays
takes a commission of 280 basis points. Barclays
and Protego are active participants in a secondary
market of limited liquidity.
Since their rebirth in 2004, Barclays has issued
approximately £900 million worth of PICs.
3.2.3. Housing derivativesHalifax index derivatives are traditional forward
contracts and options. The two parties to a forward
contract agree in advance to a certain progression
of the index and at maturity the buyer (the seller)
of exposure receives (pays) the difference, whether
3. Property Derivatives
An EDHEC Risk and Asset Management Research Centre Publ icat ion
EDHEC European Real Estate Investment and Risk Management Survey - November 2007
Exhibit 20: Conventional property index certificate
Issue Price
Index capital growth (at maturity)
Buyer of PIC Issuer of certificate(Barclays)
Risk sellerIPD index income return
LIBOR minus spread
Index capital growth (at maturity)
IPD index income return
positive or negative, between the real level of the
index and that of the contract. In this way, both
buyer and seller are assured of a price at which
the transaction will take place. The buyer of an
option, on the other hand, has the right but not
the obligation to buy (call option) or to sell (put
option) at a predefined strike price; the buyer of
the option will exercise his right only if the terms
of the options contract are more advantageous
than those of the market; the payment of a
premium compensates for the seller’s asymmetric
position.
Options and futures on S&P/Case Shiller indices are
similar, but they are traded on an organised market
that reduces credit risk through the intermediation
of a central counterparty and through a margining
mechanism.
In the United Kingdom, financial intermediaries
such as Abbey, Newcastle Building Society, or
Skipton Building Society have sold retail investors
medium-term structured products linked entirely
or in part to the Halifax index; to manage their
risk, these companies are thus likely to use forward
contracts based on the index.
3.3. Uses of derivatives and their limits3.3.1. Theoretical usesDerivatives allow exposure to real estate risk to
be managed much more efficiently—in terms of
liquidity, cost, granularity, swiftness, or flexibility—
than in the underlying market (when an investable
underlying asset is available). They can be integral
to investment/diversification, to hedging, or
to arbitrage (exhibit 21). For investment, the
advantages of direct real estate derivatives are
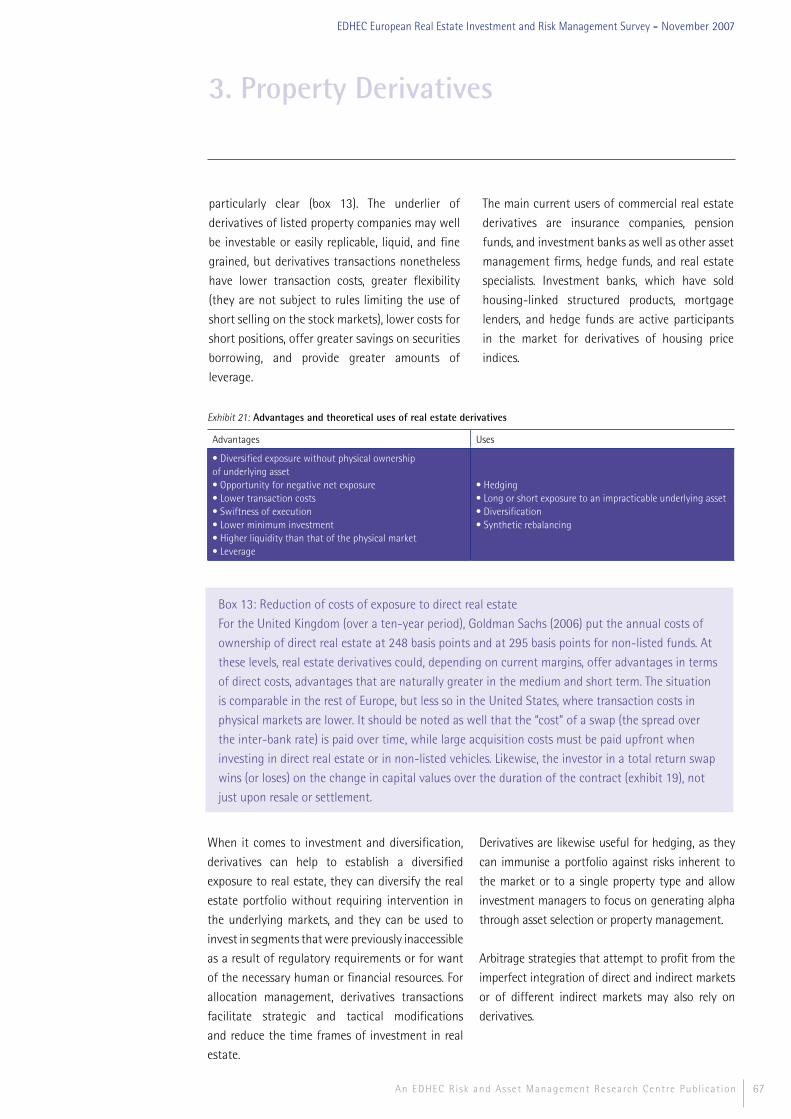
67An EDHEC Risk and Asset Management Research Centre Publ icat ion
EDHEC European Real Estate Investment and Risk Management Survey - November 2007
particularly clear (box 13). The underlier of
derivatives of listed property companies may well
be investable or easily replicable, liquid, and fine
grained, but derivatives transactions nonetheless
have lower transaction costs, greater flexibility
(they are not subject to rules limiting the use of
short selling on the stock markets), lower costs for
short positions, offer greater savings on securities
borrowing, and provide greater amounts of
leverage.
The main current users of commercial real estate
derivatives are insurance companies, pension
funds, and investment banks as well as other asset
management firms, hedge funds, and real estate
specialists. Investment banks, which have sold
housing-linked structured products, mortgage
lenders, and hedge funds are active participants
in the market for derivatives of housing price
indices.
3. Property Derivatives
Exhibit 21: Advantages and theoretical uses of real estate derivatives
Advantages Uses
• Diversified exposure without physical ownership of underlying asset• Opportunity for negative net exposure• Lower transaction costs• Swiftness of execution• Lower minimum investment• Higher liquidity than that of the physical market• Leverage
• Hedging• Long or short exposure to an impracticable underlying asset• Diversification • Synthetic rebalancing
Box 13: Reduction of costs of exposure to direct real estate
For the United Kingdom (over a ten-year period), Goldman Sachs (2006) put the annual costs of
ownership of direct real estate at 248 basis points and at 295 basis points for non-listed funds. At
these levels, real estate derivatives could, depending on current margins, offer advantages in terms
of direct costs, advantages that are naturally greater in the medium and short term. The situation
is comparable in the rest of Europe, but less so in the United States, where transaction costs in
physical markets are lower. It should be noted as well that the “cost” of a swap (the spread over
the inter-bank rate) is paid over time, while large acquisition costs must be paid upfront when
investing in direct real estate or in non-listed vehicles. Likewise, the investor in a total return swap
wins (or loses) on the change in capital values over the duration of the contract (exhibit 19), not
just upon resale or settlement.
When it comes to investment and diversification,
derivatives can help to establish a diversified
exposure to real estate, they can diversify the real
estate portfolio without requiring intervention in
the underlying markets, and they can be used to
invest in segments that were previously inaccessible
as a result of regulatory requirements or for want
of the necessary human or financial resources. For
allocation management, derivatives transactions
facilitate strategic and tactical modifications
and reduce the time frames of investment in real
estate.
Derivatives are likewise useful for hedging, as they
can immunise a portfolio against risks inherent to
the market or to a single property type and allow
investment managers to focus on generating alpha
through asset selection or property management.
Arbitrage strategies that attempt to profit from the
imperfect integration of direct and indirect markets
or of different indirect markets may also rely on
derivatives.
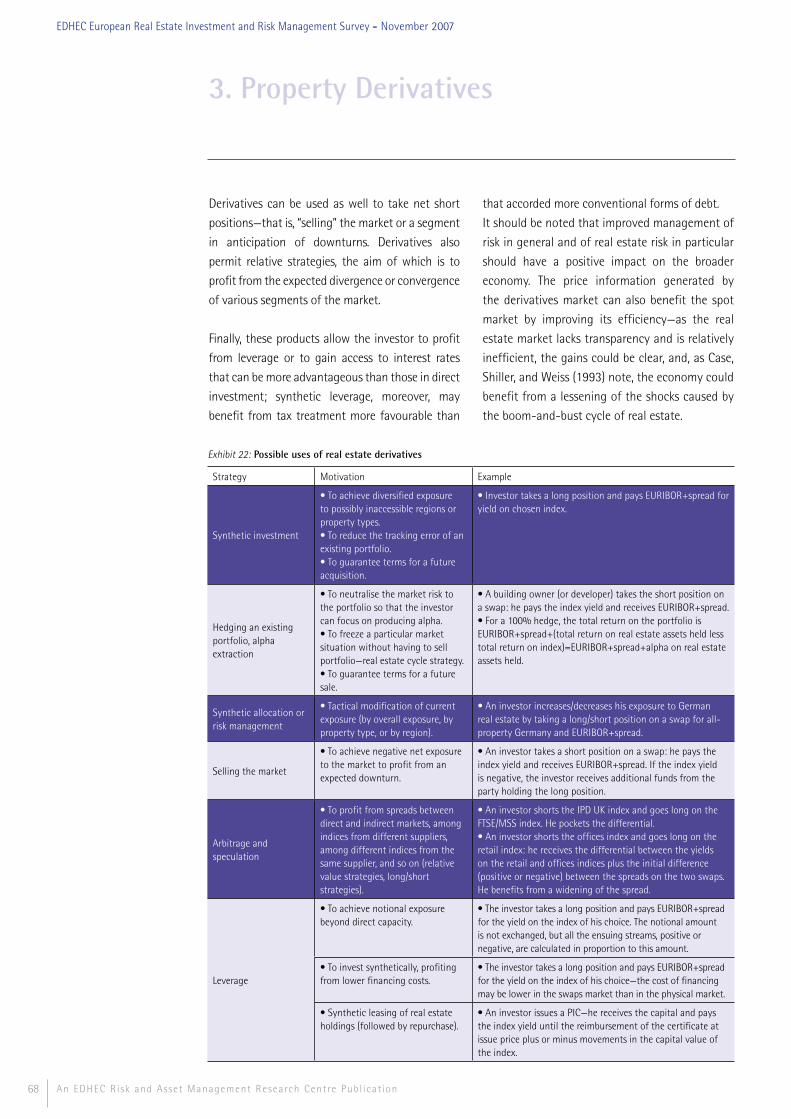
68
Derivatives can be used as well to take net short
positions—that is, “selling” the market or a segment
in anticipation of downturns. Derivatives also
permit relative strategies, the aim of which is to
profit from the expected divergence or convergence
of various segments of the market.
Finally, these products allow the investor to profit
from leverage or to gain access to interest rates
that can be more advantageous than those in direct
investment; synthetic leverage, moreover, may
benefit from tax treatment more favourable than
that accorded more conventional forms of debt.
It should be noted that improved management of
risk in general and of real estate risk in particular
should have a positive impact on the broader
economy. The price information generated by
the derivatives market can also benefit the spot
market by improving its efficiency—as the real
estate market lacks transparency and is relatively
inefficient, the gains could be clear, and, as Case,
Shiller, and Weiss (1993) note, the economy could
benefit from a lessening of the shocks caused by
the boom-and-bust cycle of real estate.
3. Property Derivatives
An EDHEC Risk and Asset Management Research Centre Publ icat ion
EDHEC European Real Estate Investment and Risk Management Survey - November 2007
Exhibit 22: Possible uses of real estate derivatives
Strategy Motivation Example
Synthetic investment
• To achieve diversified exposure to possibly inaccessible regions or property types. • To reduce the tracking error of an existing portfolio.• To guarantee terms for a future acquisition.
• Investor takes a long position and pays EURIBOR+spread for yield on chosen index.
Hedging an existing portfolio, alpha extraction
• To neutralise the market risk to the portfolio so that the investor can focus on producing alpha. • To freeze a particular market situation without having to sell portfolio—real estate cycle strategy.• To guarantee terms for a future sale.
• A building owner (or developer) takes the short position on a swap: he pays the index yield and receives EURIBOR+spread. • For a 100% hedge, the total return on the portfolio is EURIBOR+spread+(total return on real estate assets held less total return on index)=EURIBOR+spread+alpha on real estate assets held.
Synthetic allocation or risk management
• Tactical modification of current exposure (by overall exposure, by property type, or by region).
• An investor increases/decreases his exposure to German real estate by taking a long/short position on a swap for all-property Germany and EURIBOR+spread.
Selling the market
• To achieve negative net exposure to the market to profit from an expected downturn.
• An investor takes a short position on a swap: he pays the index yield and receives EURIBOR+spread. If the index yield is negative, the investor receives additional funds from the party holding the long position.
Arbitrage and speculation
• To profit from spreads between direct and indirect markets, among indices from different suppliers, among different indices from the same supplier, and so on (relative value strategies, long/short strategies).
• An investor shorts the IPD UK index and goes long on the FTSE/MSS index. He pockets the differential. • An investor shorts the offices index and goes long on the retail index: he receives the differential between the yields on the retail and offices indices plus the initial difference (positive or negative) between the spreads on the two swaps. He benefits from a widening of the spread.
Leverage
• To achieve notional exposure beyond direct capacity.
• The investor takes a long position and pays EURIBOR+spread for the yield on the index of his choice. The notional amount is not exchanged, but all the ensuing streams, positive or negative, are calculated in proportion to this amount.
• To invest synthetically, profiting from lower financing costs.
• The investor takes a long position and pays EURIBOR+spread for the yield on the index of his choice—the cost of financing may be lower in the swaps market than in the physical market.
• Synthetic leasing of real estate holdings (followed by repurchase).
• An investor issues a PIC—he receives the capital and pays the index yield until the reimbursement of the certificate at issue price plus or minus movements in the capital value of the index.
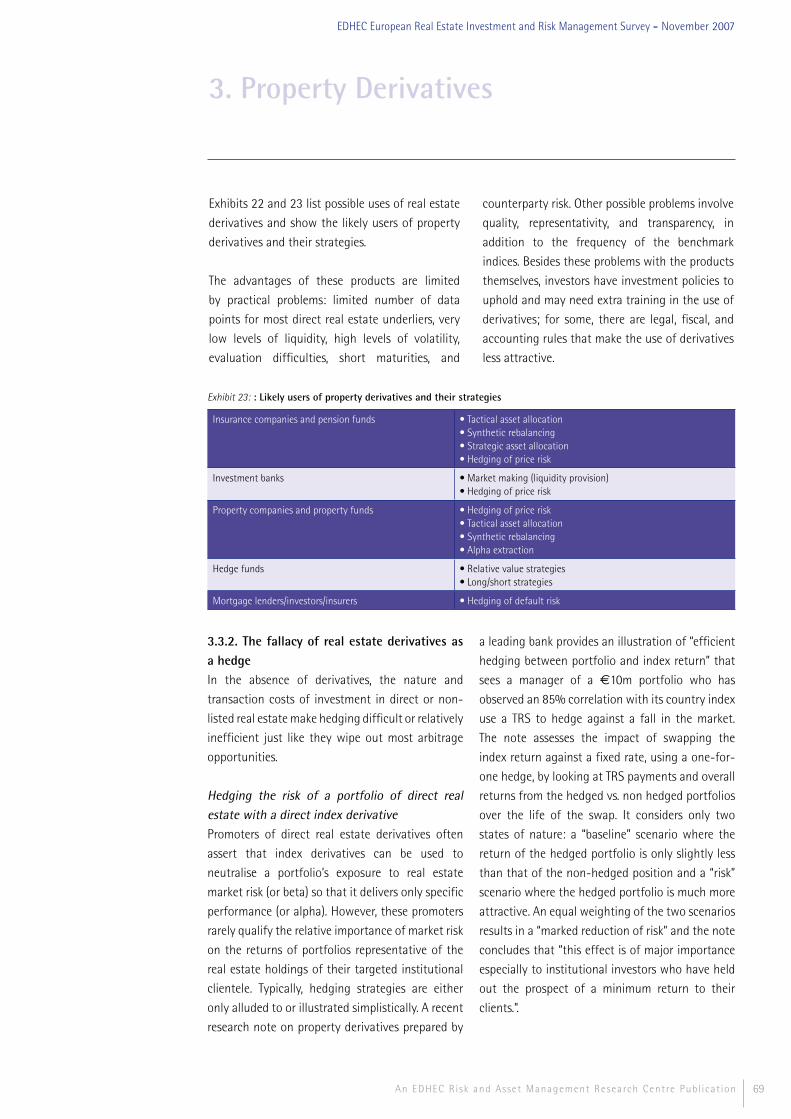
69An EDHEC Risk and Asset Management Research Centre Publ icat ion
EDHEC European Real Estate Investment and Risk Management Survey - November 2007
Exhibits 22 and 23 list possible uses of real estate
derivatives and show the likely users of property
derivatives and their strategies.
The advantages of these products are limited
by practical problems: limited number of data
points for most direct real estate underliers, very
low levels of liquidity, high levels of volatility,
evaluation difficulties, short maturities, and
counterparty risk. Other possible problems involve
quality, representativity, and transparency, in
addition to the frequency of the benchmark
indices. Besides these problems with the products
themselves, investors have investment policies to
uphold and may need extra training in the use of
derivatives; for some, there are legal, fiscal, and
accounting rules that make the use of derivatives
less attractive.
3. Property Derivatives
Exhibit 23: : Likely users of property derivatives and their strategies
Insurance companies and pension funds • Tactical asset allocation• Synthetic rebalancing• Strategic asset allocation• Hedging of price risk
Investment banks • Market making (liquidity provision)• Hedging of price risk
Property companies and property funds • Hedging of price risk• Tactical asset allocation• Synthetic rebalancing• Alpha extraction
Hedge funds • Relative value strategies• Long/short strategies
Mortgage lenders/investors/insurers • Hedging of default risk
3.3.2. The fallacy of real estate derivatives as a hedgeIn the absence of derivatives, the nature and
transaction costs of investment in direct or non-
listed real estate make hedging difficult or relatively
inefficient just like they wipe out most arbitrage
opportunities.
Hedging the risk of a portfolio of direct real estate with a direct index derivativePromoters of direct real estate derivatives often
assert that index derivatives can be used to
neutralise a portfolio’s exposure to real estate
market risk (or beta) so that it delivers only specific
performance (or alpha). However, these promoters
rarely qualify the relative importance of market risk
on the returns of portfolios representative of the
real estate holdings of their targeted institutional
clientele. Typically, hedging strategies are either
only alluded to or illustrated simplistically. A recent
research note on property derivatives prepared by
a leading bank provides an illustration of “efficient
hedging between portfolio and index return” that
sees a manager of a €10m portfolio who has
observed an 85% correlation with its country index
use a TRS to hedge against a fall in the market.
The note assesses the impact of swapping the
index return against a fixed rate, using a one-for-
one hedge, by looking at TRS payments and overall
returns from the hedged vs. non hedged portfolios
over the life of the swap. It considers only two
states of nature: a “baseline” scenario where the
return of the hedged portfolio is only slightly less
than that of the non-hedged position and a “risk”
scenario where the hedged portfolio is much more
attractive. An equal weighting of the two scenarios
results in a “marked reduction of risk” and the note
concludes that “this effect is of major importance
especially to institutional investors who have held
out the prospect of a minimum return to their
clients.”.

70
When the asset whose price fluctuations are to be
hedged is not exactly the same as the underlying
of the derivatives contract or when the contract
expiry date does not coincide with the execution
date of the spot transaction to be hedged, basis
risk—cross-hedge basis risk and time-basis risk—
reduces hedging effectiveness. Analysing the
correlation between the values of the position
to be hedged and the prices of the available
derivatives can help determine the contract(s) to
be used for hedging. When there is uncertainty
about the timing of the transaction, time-basis risk
can be reduced by using combinations of contracts
surrounding the expected transaction date.
The match with the underlying of the derivatives
contract may be perfect for major currencies and
large capitalisation stocks on which contracts exist
and near perfect for key commodities. However,
derivatives markets are far from complete and
managing the price risk of a given asset on which
no contract is available will require cross-hedges
involving close or not-so-close substitutes.
Instead of identifying a substitute with a high
correlation to the asset, the investment manager
could identify the fundamental risks driving asset
returns and then hedge price risk with derivatives
proxying for each of them. Risk not accounted for
by fundamental factors—if not a result of factor
omission or model misspecification—is specific to
the asset and cannot be hedged; in a portfolio,
however, it is diversifiable.
To hedge the market risk of a portfolio with index
futures contracts—which we will assume are
perfectly positively correlated with the underlying
index—the optimal position to hold so as to
minimise the volatility of the hedged position can
be shown to be:
whereMP RR ,ρ (σP,M) is the coefficient of correlation
(covariance) between portfolio and index returns, σP (σM) is the standard deviation of portfolio (index) returns, R2 is the
coefficient of determination of the regression of portfolio returns against market returns, and βP is the slope of the regression line.
The number of contracts to hold to offset the
market risk in the portfolio is then given by h or βP
times the ratio of the value of the portfolio to the
nominal amount of the contract. Note that the
naive one-for-one hedge is obtained only when
the correlation between the portfolio and the
index is equal to σM / σP or, equivalently, when
the slope of the regression of the portfolio returns
against the index returns is one.
The hedge ratio is directly positively linked to the
importance of the market factor as an explanatory
variable of portfolio variability or, in other words,
to the correlation between the index used to proxy
the market and the portfolio. A 2007 IPF report
looked at the possibility of replicating the IPD UK
index through direct investments using a sample
of 1,700 properties from the IPD UK universe
over the period from 1994 to 2004. Using IPD
properties, the study upwardly biases correlations
with the IPD index, resulting in an upward bias
of the importance of the market factor and in
a downward bias of the average tracking error:
tracking the IPD index with properties that are not
part of it will be harder.
The figures reported in exhibit 24 suggest that
most portfolios will be poorly correlated with the
index–taking the average value of the commercial
property in the IPD UK database (€23m at the
end of 2006) and assuming equal-weighting to be
possible, it would take approximately (1.15bn of
IPD properties to establish, on average, a portfolio
which could be effectively hedged with an IPD
derivative (an R2 of 80% is traditionally considered
the threshold for hedging effectiveness). At this
level and assuming a normal distribution for the
tracking error (not a conservative assumption),
a 2% deviation of the portfolio vis-à-vis its
benchmark would still occur at least once every
three years, and a 1% deviation almost two
3. Property Derivatives
An EDHEC Risk and Asset Management Research Centre Publ icat ion
EDHEC European Real Estate Investment and Risk Management Survey - November 2007
h = ρRP , R MσP / σM = R 2σP / σM = σP , M / σM
2 = βP
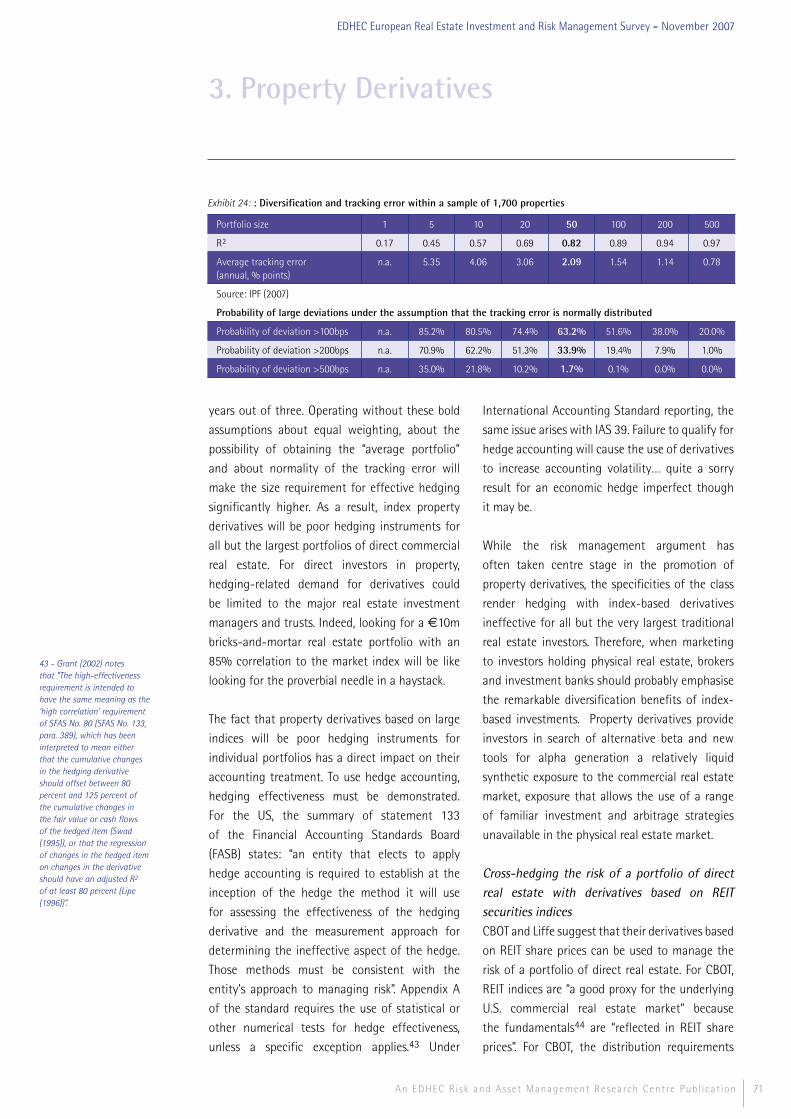
71An EDHEC Risk and Asset Management Research Centre Publ icat ion
EDHEC European Real Estate Investment and Risk Management Survey - November 2007
years out of three. Operating without these bold
assumptions about equal weighting, about the
possibility of obtaining the “average portfolio”
and about normality of the tracking error will
make the size requirement for effective hedging
significantly higher. As a result, index property
derivatives will be poor hedging instruments for
all but the largest portfolios of direct commercial
real estate. For direct investors in property,
hedging-related demand for derivatives could
be limited to the major real estate investment
managers and trusts. Indeed, looking for a (10m
bricks-and-mortar real estate portfolio with an
85% correlation to the market index will be like
looking for the proverbial needle in a haystack.
The fact that property derivatives based on large
indices will be poor hedging instruments for
individual portfolios has a direct impact on their
accounting treatment. To use hedge accounting,
hedging effectiveness must be demonstrated.
For the US, the summary of statement 133
of the Financial Accounting Standards Board
(FASB) states: “an entity that elects to apply
hedge accounting is required to establish at the
inception of the hedge the method it will use
for assessing the effectiveness of the hedging
derivative and the measurement approach for
determining the ineffective aspect of the hedge.
Those methods must be consistent with the
entity's approach to managing risk”. Appendix A
of the standard requires the use of statistical or
other numerical tests for hedge effectiveness,
unless a specific exception applies.43 Under
International Accounting Standard reporting, the
same issue arises with IAS 39. Failure to qualify for
hedge accounting will cause the use of derivatives
to increase accounting volatility… quite a sorry
result for an economic hedge imperfect though
it may be.
While the risk management argument has
often taken centre stage in the promotion of
property derivatives, the specificities of the class
render hedging with index-based derivatives
ineffective for all but the very largest traditional
real estate investors. Therefore, when marketing
to investors holding physical real estate, brokers
and investment banks should probably emphasise
the remarkable diversification benefits of index-
based investments. Property derivatives provide
investors in search of alternative beta and new
tools for alpha generation a relatively liquid
synthetic exposure to the commercial real estate
market, exposure that allows the use of a range
of familiar investment and arbitrage strategies
unavailable in the physical real estate market.
Cross-hedging the risk of a portfolio of direct real estate with derivatives based on REIT securities indicesCBOT and Liffe suggest that their derivatives based
on REIT share prices can be used to manage the
risk of a portfolio of direct real estate. For CBOT,
REIT indices are “a good proxy for the underlying
U.S. commercial real estate market” because
the fundamentals44 are “reflected in REIT share
prices”. For CBOT, the distribution requirements
3. Property Derivatives
43 - Grant (2002) notes that “The high-effectiveness requirement is intended to have the same meaning as the ‘high correlation’ requirement of SFAS No. 80 (SFAS No. 133, para. 389), which has been interpreted to mean either that the cumulative changes in the hedging derivative should offset between 80 percent and 125 percent of the cumulative changes in the fair value or cash flows of the hedged item (Swad (1995)), or that the regression of changes in the hedged item on changes in the derivative should have an adjusted R2 of at least 80 percent (Lipe (1996))”.
Exhibit 24: : Diversification and tracking error within a sample of 1,700 properties
Portfolio size 1 5 10 20 50 100 200 500
R2 0.17 0.45 0.57 0.69 0.82 0.89 0.94 0.97
Average tracking error (annual, % points)
n.a. 5.35 4.06 3.06 2.09 1.54 1.14 0.78
Source: IPF (2007)
Probability of large deviations under the assumption that the tracking error is normally distributed
Probability of deviation >100bps n.a. 85.2% 80.5% 74.4% 63.2% 51.6% 38.0% 20.0%
Probability of deviation >200bps n.a. 70.9% 62.2% 51.3% 33.9% 19.4% 7.9% 1.0%
Probability of deviation >500bps n.a. 35.0% 21.8% 10.2% 1.7% 0.1% 0.0% 0.0%

72
REITs are subject to as well as their tax status are
the causes of a “direct and clear” link between the
underlying market and the share prices of these
trusts. Likewise, Liffe writes that REIT securities
indices “are a good proxy for direct real estate
investments”.
CBOT fails to mention that REITs are not limited to
tax-exempt activities and that—despite the effect
of distribution requirements on net income—the
importance of amortisation in real estate leaves
plenty of room for manoeuvres that can weaken
the link mentioned above. It should be noted as
well that the leverage of the REIT and its public
trading are fundamental elements that will distort
signals from the underlier. CBOT makes no mention
of studies that would back up its stance, which
might appear to make good sense to a newcomer
to real estate but is anathema to more experienced
professionals. Our survey has documented the
low contemporary correlation of REIT securities
indices and direct property indices, the reasons
for this low correlation, and possible directions for
future research into the substitutability of these
two modes of access to real estate. In the absence
of derivatives based on direct indices, those based
on REIT securities indices could in the short term
be used—no less than interest rate derivatives45—
for cross-hedging, and long-term benefits may be
greater still; the study of these subjects has yet
to begin.
Hedging the risk of a portfolio of REITs with a REIT securities index derivativeThe creation of a highly diversified portfolio of
REITs is within the means of all institutional
investors; it follows that a REIT securities index
derivative—though it may not fill a vacuum in
terms of access to the market—can serve as a
hedging instrument for a portfolio of REIT shares.
3.3.3. The challenge of hedging real estate derivativesHedging of direct property index derivativesDevelopment of the IPD and the NPI swap markets
is hampered by the fact that the underlying
indices, as appraisal-based measures of private
commercial real estate performance, are not
tradable. Consequently, these hedging instruments
are hard to hedge in a reliable, easy, swift, and
cost-efficient manner. As a result, intermediaries
may shy away from liquidity provision and be
tempted to settle for matching up buyers and
sellers (any mismatch creates gap risk, which must
be managed by the intermediary and requires
compensation under the form of a higher cost of
derivatives to the buyer).
Because the underlying is unavailable for dynamic
replication strategies, the pricing and hedging
of direct property derivatives is challenging. To
convince financial institutions to accept the risk
of derivatives underwriting and provide more
liquidity to investors, advances in the hedging of
property derivatives are required.
The merits, feasibility, and implementation
methods of both cash and synthetic hedging of
derivatives must be addressed. Cash hedging of
derivatives written on non-investable indices
would rely on direct property and real estate fund
investments to manage the derivatives exposure of
the underwriters, while synthetic hedging would
use risk-factor replication to create portfolios of
assets with high correlation to property. Whatever
the route chosen, reducing the cross-hedge basis
risk of the derivatives underwriter is the guiding
light. It is perfectly feasible to establish general
results on the nature of the optimal trading
strategy involving the hedging proxy as well as an
estimation of the tracking error caused by relying
on an imperfect substitute for the underlying—
this tracking error is reminiscent of that caused by
using discrete hedging with tradable underliers.
3. Property Derivatives
An EDHEC Risk and Asset Management Research Centre Publ icat ion
44 - For CBOT, lease rates, vacancies, development costs, and property transaction values.45 - Between 1990 and 2005, according to the CISDM (2006), the correlation of the MIT/CRE transaction-based index and the FTSE/NAREIT was 0.06%; correlation of the MIT/CRE index and the S&P500 was likewise 0.06%; the correlation of this index and the Lehman Aggregate Bond index was -0.07%. The benefits of REITs securities index derivatives for hedging a direct real estate portfolio are not apparent, as there are stock or bond derivatives that, although equally ineffective, are much more liquid.
EDHEC European Real Estate Investment and Risk Management Survey - November 2007
73An EDHEC Risk and Asset Management Research Centre Publ icat ion
EDHEC European Real Estate Investment and Risk Management Survey - November 2007
The difficulty in replicating a non-investable index
like the IPD All Property—which we emphasised
above by computing the probability of large
deviations at the various portfolio sizes—not only
makes cash hedging very difficult but also casts
doubt on the validity of prices at which derivatives
are transacted; this is because arbitrage between
the physical property market and the derivatives
market is challenging, making pricing by arbitrage
unrealistic.
FTSE and MSS may have provided additional
possibilities in the second half of 2006 by offering
an index and sub-indices which they claim are
representative of direct property investments
and investable through fund and sub-funds
with daily NAVs. These index providers hope to
attract investors interested in a (largely) passive
exposure to the U.K. commercial property market,
but more importantly, to position themselves as
the platform of choice for investment banks that
wish to offer property derivatives and real estate
structured products. This is a new development and
it remains to be seen whether this hybrid product
is sufficiently representative and transparent to
constitute an attractive alternative to the wider-
based and more well-established IPD indices.
Theoretically, investments in the fund can be used
for cash hedging of derivatives underwritten on
the associated index. Cash hedging of this sort is
attractive as it minimises tracking variance/basis
risk; however, it does not eliminate the need for
other hedging techniques unless an active market
for short-selling the underlying emerges. In
practice, it will be fascinating to find out how a
property fund established with a base of £100m
will handle massive inflows and outflows of
capital.
Hedging of REIT index derivativesThe underlying of REIT index derivatives can be
invested in directly (ETFs, index funds) or indirectly
(the index constituents are known and have been
chosen for their market float and their liquidity).
Short-selling the underlying is also possible. In
these conditions, the hedging of derivatives by
the issuer poses no problems. Note too that for
listed derivatives a part of the liquidity is provided
by the market and does not require risk-taking
on the part of the market makers and that the
standardisation of derivatives contracts should
allow the market maker quickly to offset the risks
of one position by serving as counterparty to the
opposing position.
3. Property Derivatives

74
3. Property Derivatives
An EDHEC Risk and Asset Management Research Centre Publ icat ion
EDHEC European Real Estate Investment and Risk Management Survey - November 2007
Box 14: Pricing real estate derivatives
The body of literature on real estate derivatives pricing is very slight and, as Lim and Zhang (2006) note,
it studies above all the pricing of total return swaps. Buttimer, Kau, and Slawson (1997) create a two-
state model to price derivatives on a real estate index and on an interest rate. The model assumes that
the index follows a Brownian motion. Björk and Clapham (2002) generalise the previous model to semi-
martingales and show that the arbitrage-free price is equal to zero. Patel and Pereira (2006) show that
this model is not sound in the presence of counterparty risk. Lim and Zhang study pricing by arbitrage
analysis and by equilibrium analysis; we present their findings and comment on them below.
The simpler approach to pricing the swap is to use the spot-forward parity theorem: this approach
requires making the assumption that replicating the real estate index is possible and that there is
neither counterparty risk nor transaction costs. We may know what to think of these assumptions,
but arbitrage analysis is worthwhile all the same. If it is possible to create a portfolio whose return
characteristics match those of the index, a risk-free hedge can be created with the portfolio and the
swap. The holder of the long position in a total return swap receives the yield on the real estate index in
exchange for a fixed spread F over the inter-bank rate. The swap is priced through this spread, for which
it is possible to demonstrate that:
where rn is the return on a zero-coupon bond with a maturity of n years.
It is the same spread as for fixed-for-floating rate swaps. By combining a total return swap on a real
estate index and an interest-rate swap, the fixed spreads cancel each other out; the price of the swap is
the inter-bank rate. It is, of course, a theoretical price that assumes the possibility of perfect arbitrage.
As arbitrage analysis requires untenable assumptions, equilibrium analysis may be more realistic.
The point of departure for this analysis is the principle that the expected risk premium should be
constant across markets. If investors use swaps to adjust their exposure to real estate, then for the
investor who goes short on the index as a hedge for a real estate portfolio from which he expects a
return E(r), the spread F should fulfil the following condition:
E ( r ) + F + E A( rindex ) ≥ rf where EA(rindex) is his estimation of the total return on the index and rf the risk-free rate.
For the buyer of real estate risk, whose funds were hitherto returning the risk-free rate, the relation is:
E B ( rindex ) − F + rf ≥ rf + E (π index )
where EB(rindex) is his expectation of the total return on the index and E[πindex] the expectation of the risk premium of the return on the index.
Noting that E(r)=E(πportfolio)+rf where πportfolio is the risk premium, it follows that:
E A( rindex ) − E (π portfolio ) ≤ F ≤ E B ( rindex ) − E (π index )
Assuming that the risk premium on the portfolio is the same as that on the index, the spread over the
risk premium is straddled by the expectations of the total return on the index of both buyer and seller
of risk. If both buyer and seller have the same expectations, then F=E(rindex)-E(πindex). At equilibrium
E(rindex)=rf+E(πindex). Therefore, F=rf. The unrealistic conditions here depend on identical risk premia
and on the existence of a consensus, but it is interesting to note that once again the price of the
swap is the inter-bank rate.
F = 1 −1
1 + rn( )n
⎡
⎣⎢⎢
⎤
⎦⎥⎥
1
1 + ri( )ii = 1
n
∑

4. Survey Results
75An EDHEC Risk and Asset Management Research Centre Publ icat ion
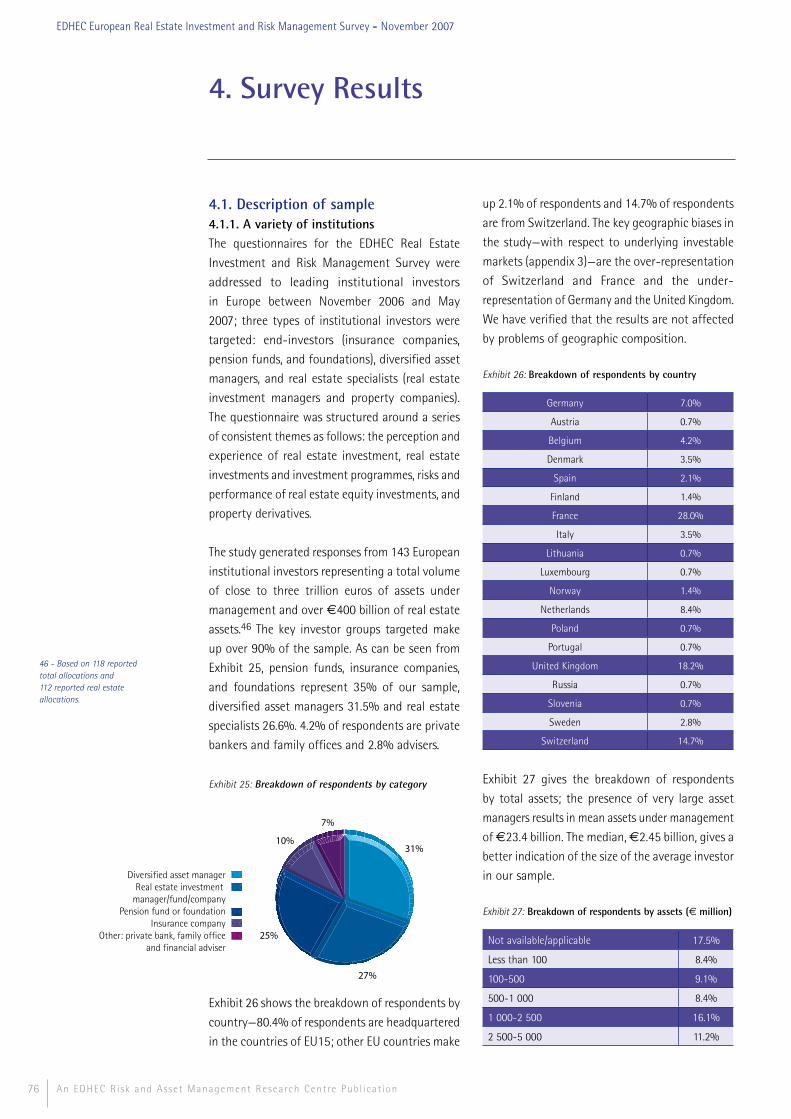
76
4.1. Description of sample 4.1.1. A variety of institutions The questionnaires for the EDHEC Real Estate
Investment and Risk Management Survey were
addressed to leading institutional investors
in Europe between November 2006 and May
2007; three types of institutional investors were
targeted: end-investors (insurance companies,
pension funds, and foundations), diversified asset
managers, and real estate specialists (real estate
investment managers and property companies).
The questionnaire was structured around a series
of consistent themes as follows: the perception and
experience of real estate investment, real estate
investments and investment programmes, risks and
performance of real estate equity investments, and
property derivatives.
The study generated responses from 143 European
institutional investors representing a total volume
of close to three trillion euros of assets under
management and over €400 billion of real estate
assets.46 The key investor groups targeted make
up over 90% of the sample. As can be seen from
Exhibit 25, pension funds, insurance companies,
and foundations represent 35% of our sample,
diversified asset managers 31.5% and real estate
specialists 26.6%. 4.2% of respondents are private
bankers and family offices and 2.8% advisers.
Exhibit 25: Breakdown of respondents by category
Exhibit 26 shows the breakdown of respondents by
country—80.4% of respondents are headquartered
in the countries of EU15; other EU countries make
up 2.1% of respondents and 14.7% of respondents
are from Switzerland. The key geographic biases in
the study—with respect to underlying investable
markets (appendix 3)—are the over-representation
of Switzerland and France and the under-
representation of Germany and the United Kingdom.
We have verified that the results are not affected
by problems of geographic composition.
Exhibit 26: Breakdown of respondents by country
Germany 7.0%
Austria 0.7%
Belgium 4.2%
Denmark 3.5%
Spain 2.1%
Finland 1.4%
France 28.0%
Italy 3.5%
Lithuania 0.7%
Luxembourg 0.7%
Norway 1.4%
Netherlands 8.4%
Poland 0.7%
Portugal 0.7%
United Kingdom 18.2%
Russia 0.7%
Slovenia 0.7%
Sweden 2.8%
Switzerland 14.7%
Exhibit 27 gives the breakdown of respondents
by total assets; the presence of very large asset
managers results in mean assets under management
of €23.4 billion. The median, €2.45 billion, gives a
better indication of the size of the average investor
in our sample.
Exhibit 27: Breakdown of respondents by assets (€ million)
Not available/applicable 17.5%
Less than 100 8.4%
100-500 9.1%
500-1 000 8.4%
1 000-2 500 16.1%
2 500-5 000 11.2%
4. Survey Results
An EDHEC Risk and Asset Management Research Centre Publ icat ion
46 - Based on 118 reported total allocations and 112 reported real estate allocations.
EDHEC European Real Estate Investment and Risk Management Survey - November 2007
25%
27%
31%
7%
10%
Diversified asset managerReal estate investment
manager/fund/companyPension fund or foundation
Insurance companyOther: private bank, family office
and financial adviser
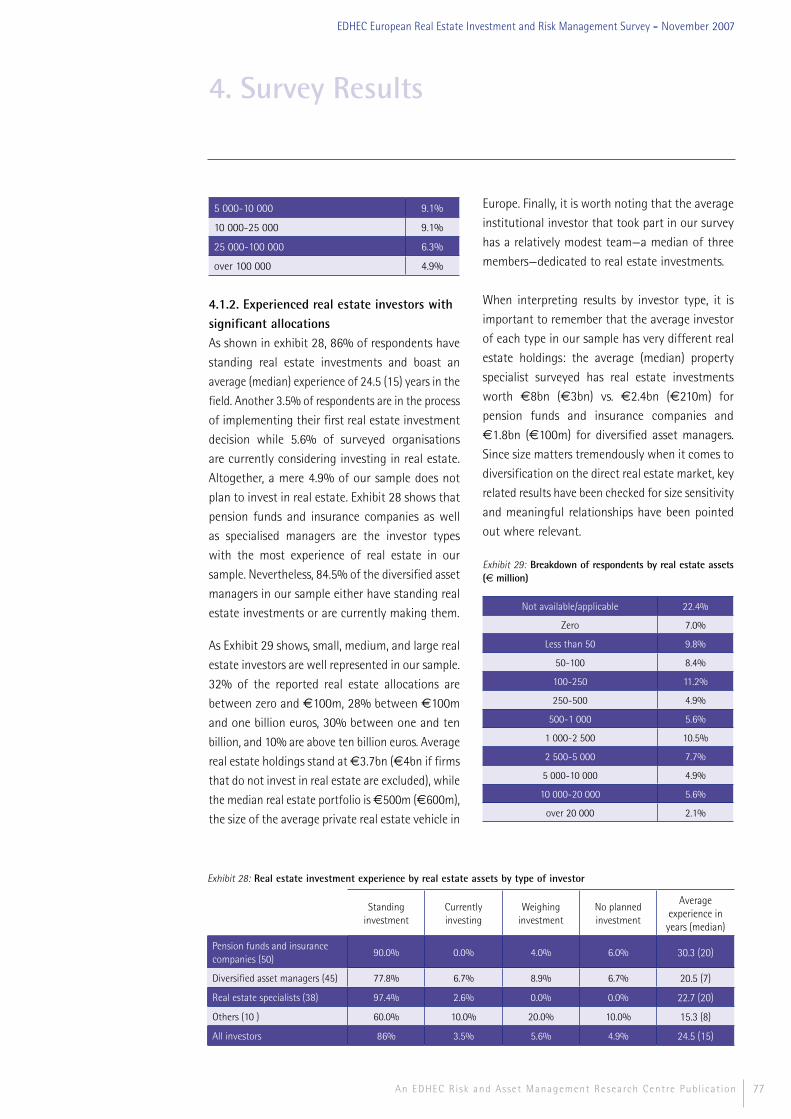
77An EDHEC Risk and Asset Management Research Centre Publ icat ion
EDHEC European Real Estate Investment and Risk Management Survey - November 2007
5 000-10 000 9.1%
10 000-25 000 9.1%
25 000-100 000 6.3%
over 100 000 4.9%
4.1.2. Experienced real estate investors with significant allocationsAs shown in exhibit 28, 86% of respondents have
standing real estate investments and boast an
average (median) experience of 24.5 (15) years in the
field. Another 3.5% of respondents are in the process
of implementing their first real estate investment
decision while 5.6% of surveyed organisations
are currently considering investing in real estate.
Altogether, a mere 4.9% of our sample does not
plan to invest in real estate. Exhibit 28 shows that
pension funds and insurance companies as well
as specialised managers are the investor types
with the most experience of real estate in our
sample. Nevertheless, 84.5% of the diversified asset
managers in our sample either have standing real
estate investments or are currently making them.
As Exhibit 29 shows, small, medium, and large real
estate investors are well represented in our sample.
32% of the reported real estate allocations are
between zero and €100m, 28% between €100m
and one billion euros, 30% between one and ten
billion, and 10% are above ten billion euros. Average
real estate holdings stand at €3.7bn (€4bn if firms
that do not invest in real estate are excluded), while
the median real estate portfolio is €500m (€600m),
the size of the average private real estate vehicle in
Europe. Finally, it is worth noting that the average
institutional investor that took part in our survey
has a relatively modest team—a median of three
members—dedicated to real estate investments.
When interpreting results by investor type, it is
important to remember that the average investor
of each type in our sample has very different real
estate holdings: the average (median) property
specialist surveyed has real estate investments
worth €8bn (€3bn) vs. €2.4bn (€210m) for
pension funds and insurance companies and
€1.8bn (€100m) for diversified asset managers.
Since size matters tremendously when it comes to
diversification on the direct real estate market, key
related results have been checked for size sensitivity
and meaningful relationships have been pointed
out where relevant.
Exhibit 29: Breakdown of respondents by real estate assets (€ million)
Not available/applicable 22.4%
Zero 7.0%
Less than 50 9.8%
50-100 8.4%
100-250 11.2%
250-500 4.9%
500-1 000 5.6%
1 000-2 500 10.5%
2 500-5 000 7.7%
5 000-10 000 4.9%
10 000-20 000 5.6%
over 20 000 2.1%
4. Survey Results
Standing investment
Currently investing
Weighing investment
No planned investment
Average experience in
years (median)
Pension funds and insurance companies (50)
90.0% 0.0% 4.0% 6.0% 30.3 (20)
Diversified asset managers (45) 77.8% 6.7% 8.9% 6.7% 20.5 (7)
Real estate specialists (38) 97.4% 2.6% 0.0% 0.0% 22.7 (20)
Others (10 ) 60.0% 10.0% 20.0% 10.0% 15.3 (8)
All investors 86% 3.5% 5.6% 4.9% 24.5 (15)
Exhibit 28: Real estate investment experience by real estate assets by type of investor
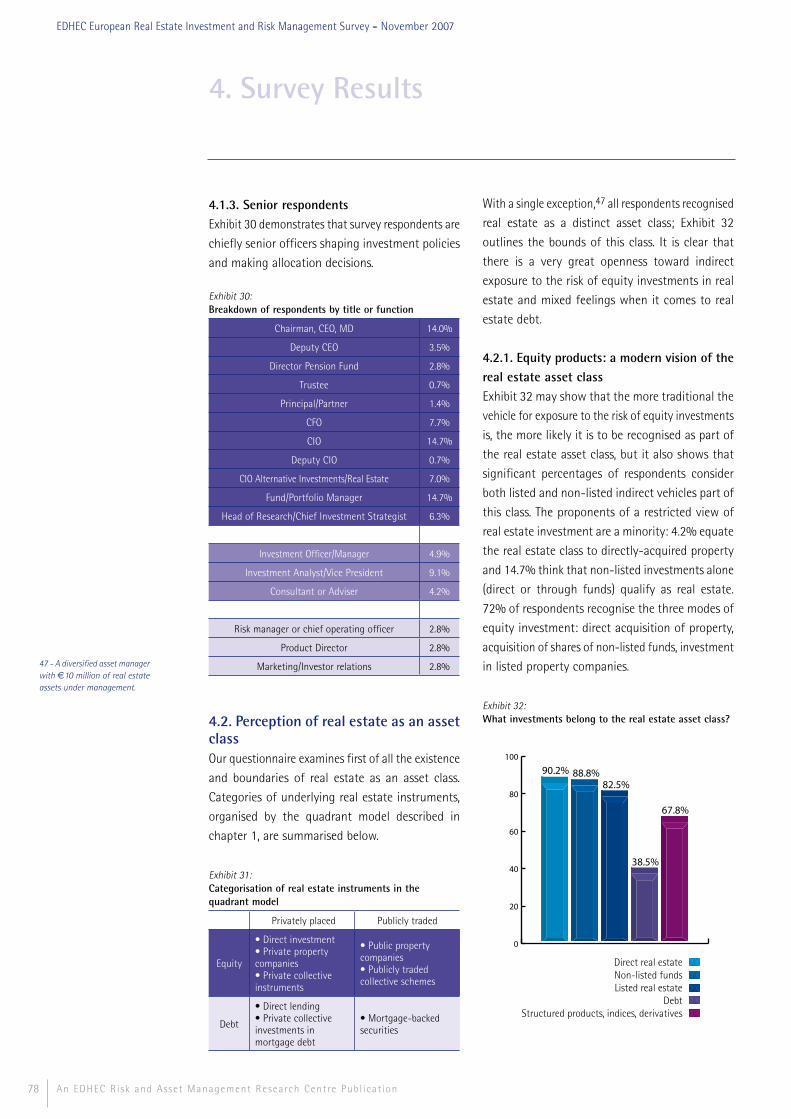
78
4.1.3. Senior respondentsExhibit 30 demonstrates that survey respondents are
chiefly senior officers shaping investment policies
and making allocation decisions.
Exhibit 30:Breakdown of respondents by title or function
Chairman, CEO, MD 14.0%
Deputy CEO 3.5%
Director Pension Fund 2.8%
Trustee 0.7%
Principal/Partner 1.4%
CFO 7.7%
CIO 14.7%
Deputy CIO 0.7%
CIO Alternative Investments/Real Estate 7.0%
Fund/Portfolio Manager 14.7%
Head of Research/Chief Investment Strategist 6.3%
Investment Officer/Manager 4.9%
Investment Analyst/Vice President 9.1%
Consultant or Adviser 4.2%
Risk manager or chief operating officer 2.8%
Product Director 2.8%
Marketing/Investor relations 2.8%
4.2. Perception of real estate as an asset classOur questionnaire examines first of all the existence
and boundaries of real estate as an asset class.
Categories of underlying real estate instruments,
organised by the quadrant model described in
chapter 1, are summarised below.
Exhibit 31:Categorisation of real estate instruments in the quadrant model
Privately placed Publicly traded
Equity
• Direct investment• Private property companies• Private collective instruments
• Public property companies• Publicly traded collective schemes
Debt
• Direct lending• Private collective investments in mortgage debt
• Mortgage-backed securities
With a single exception,47 all respondents recognised
real estate as a distinct asset class; Exhibit 32
outlines the bounds of this class. It is clear that
there is a very great openness toward indirect
exposure to the risk of equity investments in real
estate and mixed feelings when it comes to real
estate debt.
4.2.1. Equity products: a modern vision of the real estate asset classExhibit 32 may show that the more traditional the
vehicle for exposure to the risk of equity investments
is, the more likely it is to be recognised as part of
the real estate asset class, but it also shows that
significant percentages of respondents consider
both listed and non-listed indirect vehicles part of
this class. The proponents of a restricted view of
real estate investment are a minority: 4.2% equate
the real estate class to directly-acquired property
and 14.7% think that non-listed investments alone
(direct or through funds) qualify as real estate.
72% of respondents recognise the three modes of
equity investment: direct acquisition of property,
acquisition of shares of non-listed funds, investment
in listed property companies.
Exhibit 32:What investments belong to the real estate asset class?
0
20
40
60
80
100
90.2% 88.8%82.5%
38.5%
67.8%
Direct real estateNon-listed fundsListed real estate
DebtStructured products, indices, derivatives
4. Survey Results
An EDHEC Risk and Asset Management Research Centre Publ icat ion
47 - A diversified asset manager with €10 million of real estate assets under management.
EDHEC European Real Estate Investment and Risk Management Survey - November 2007
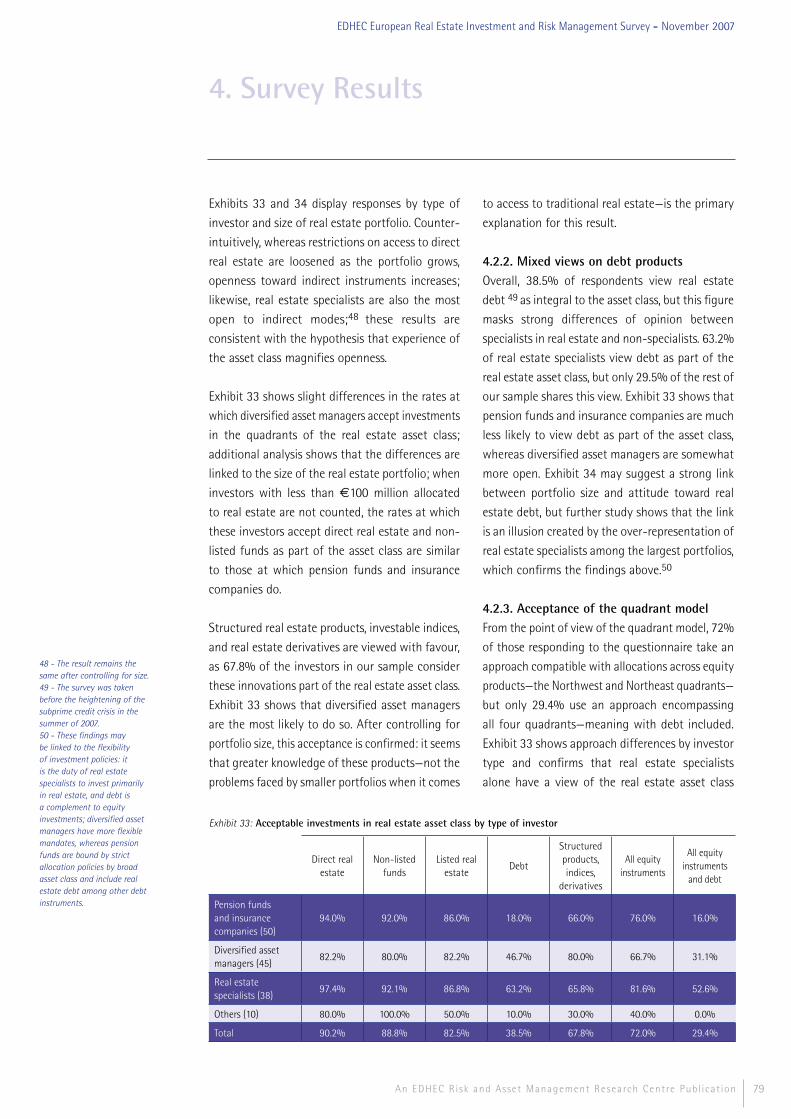
79An EDHEC Risk and Asset Management Research Centre Publ icat ion
EDHEC European Real Estate Investment and Risk Management Survey - November 2007
Exhibits 33 and 34 display responses by type of
investor and size of real estate portfolio. Counter-
intuitively, whereas restrictions on access to direct
real estate are loosened as the portfolio grows,
openness toward indirect instruments increases;
likewise, real estate specialists are also the most
open to indirect modes;48 these results are
consistent with the hypothesis that experience of
the asset class magnifies openness.
Exhibit 33 shows slight differences in the rates at
which diversified asset managers accept investments
in the quadrants of the real estate asset class;
additional analysis shows that the differences are
linked to the size of the real estate portfolio; when
investors with less than €100 million allocated
to real estate are not counted, the rates at which
these investors accept direct real estate and non-
listed funds as part of the asset class are similar
to those at which pension funds and insurance
companies do.
Structured real estate products, investable indices,
and real estate derivatives are viewed with favour,
as 67.8% of the investors in our sample consider
these innovations part of the real estate asset class.
Exhibit 33 shows that diversified asset managers
are the most likely to do so. After controlling for
portfolio size, this acceptance is confirmed: it seems
that greater knowledge of these products—not the
problems faced by smaller portfolios when it comes
to access to traditional real estate—is the primary
explanation for this result.
4.2.2. Mixed views on debt productsOverall, 38.5% of respondents view real estate
debt 49 as integral to the asset class, but this figure
masks strong differences of opinion between
specialists in real estate and non-specialists. 63.2%
of real estate specialists view debt as part of the
real estate asset class, but only 29.5% of the rest of
our sample shares this view. Exhibit 33 shows that
pension funds and insurance companies are much
less likely to view debt as part of the asset class,
whereas diversified asset managers are somewhat
more open. Exhibit 34 may suggest a strong link
between portfolio size and attitude toward real
estate debt, but further study shows that the link
is an illusion created by the over-representation of
real estate specialists among the largest portfolios,
which confirms the findings above.50
4.2.3. Acceptance of the quadrant modelFrom the point of view of the quadrant model, 72%
of those responding to the questionnaire take an
approach compatible with allocations across equity
products—the Northwest and Northeast quadrants—
but only 29.4% use an approach encompassing
all four quadrants—meaning with debt included.
Exhibit 33 shows approach differences by investor
type and confirms that real estate specialists
alone have a view of the real estate asset class
4. Survey Results
48 - The result remains the same after controlling for size.49 - The survey was taken before the heightening of the subprime credit crisis in the summer of 2007.50 - These findings may be linked to the flexibility of investment policies: it is the duty of real estate specialists to invest primarily in real estate, and debt is a complement to equity investments; diversified asset managers have more flexible mandates, whereas pension funds are bound by strict allocation policies by broad asset class and include real estate debt among other debt instruments.
Exhibit 33: Acceptable investments in real estate asset class by type of investor
Direct real estate
Non-listed funds
Listed real estate
Debt
Structured products, indices,
derivatives
All equity instruments
All equity instruments
and debt
Pension funds and insurance companies (50)
94.0% 92.0% 86.0% 18.0% 66.0% 76.0% 16.0%
Diversified asset managers (45)
82.2% 80.0% 82.2% 46.7% 80.0% 66.7% 31.1%
Real estate specialists (38)
97.4% 92.1% 86.8% 63.2% 65.8% 81.6% 52.6%
Others (10) 80.0% 100.0% 50.0% 10.0% 30.0% 40.0% 0.0%
Total 90.2% 88.8% 82.5% 38.5% 67.8% 72.0% 29.4%
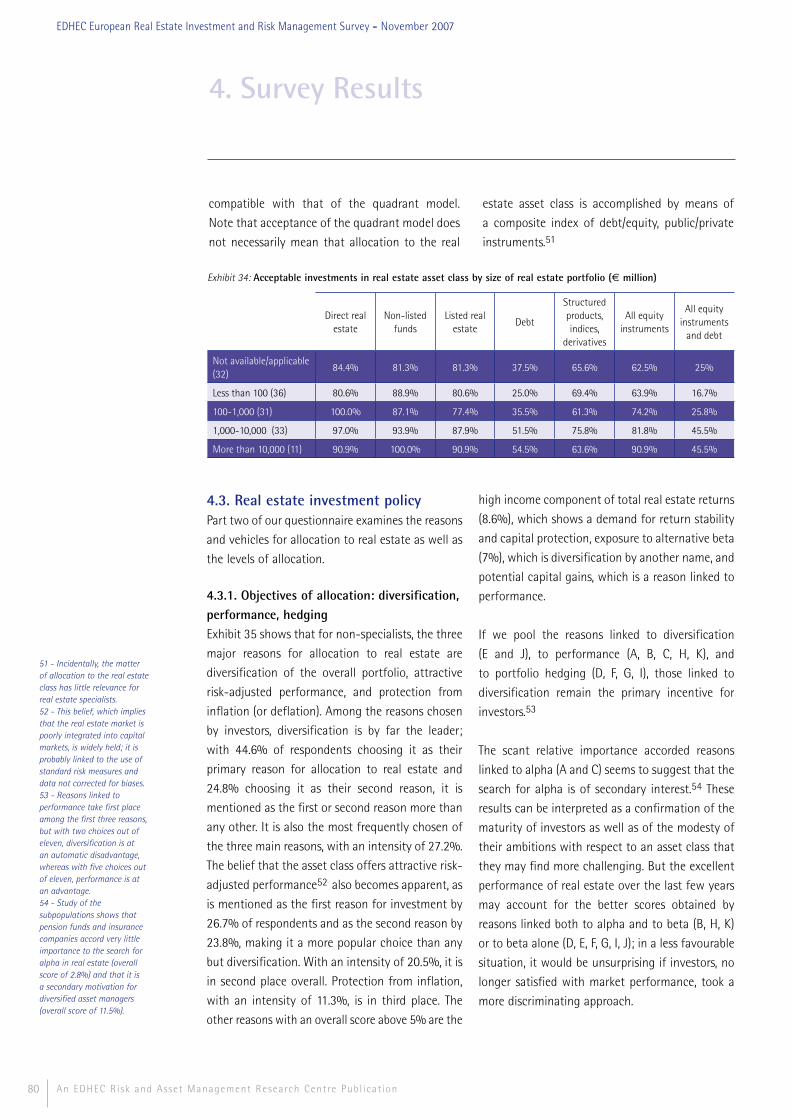
80
compatible with that of the quadrant model.
Note that acceptance of the quadrant model does
not necessarily mean that allocation to the real
estate asset class is accomplished by means of
a composite index of debt/equity, public/private
instruments.51
4. Survey Results
An EDHEC Risk and Asset Management Research Centre Publ icat ion
51 - Incidentally, the matter of allocation to the real estate class has little relevance for real estate specialists.52 - This belief, which implies that the real estate market is poorly integrated into capital markets, is widely held; it is probably linked to the use of standard risk measures and data not corrected for biases. 53 - Reasons linked to performance take first place among the first three reasons, but with two choices out of eleven, diversification is at an automatic disadvantage, whereas with five choices out of eleven, performance is at an advantage. 54 - Study of the subpopulations shows that pension funds and insurance companies accord very little importance to the search for alpha in real estate (overall score of 2.8%) and that it is a secondary motivation for diversified asset managers (overall score of 11.5%).
EDHEC European Real Estate Investment and Risk Management Survey - November 2007
4.3. Real estate investment policy Part two of our questionnaire examines the reasons
and vehicles for allocation to real estate as well as
the levels of allocation.
4.3.1. Objectives of allocation: diversification, performance, hedgingExhibit 35 shows that for non-specialists, the three
major reasons for allocation to real estate are
diversification of the overall portfolio, attractive
risk-adjusted performance, and protection from
inflation (or deflation). Among the reasons chosen
by investors, diversification is by far the leader;
with 44.6% of respondents choosing it as their
primary reason for allocation to real estate and
24.8% choosing it as their second reason, it is
mentioned as the first or second reason more than
any other. It is also the most frequently chosen of
the three main reasons, with an intensity of 27.2%.
The belief that the asset class offers attractive risk-
adjusted performance52 also becomes apparent, as
is mentioned as the first reason for investment by
26.7% of respondents and as the second reason by
23.8%, making it a more popular choice than any
but diversification. With an intensity of 20.5%, it is
in second place overall. Protection from inflation,
with an intensity of 11.3%, is in third place. The
other reasons with an overall score above 5% are the
high income component of total real estate returns
(8.6%), which shows a demand for return stability
and capital protection, exposure to alternative beta
(7%), which is diversification by another name, and
potential capital gains, which is a reason linked to
performance.
If we pool the reasons linked to diversification
(E and J), to performance (A, B, C, H, K), and
to portfolio hedging (D, F, G, I), those linked to
diversification remain the primary incentive for
investors.53
The scant relative importance accorded reasons
linked to alpha (A and C) seems to suggest that the
search for alpha is of secondary interest.54 These
results can be interpreted as a confirmation of the
maturity of investors as well as of the modesty of
their ambitions with respect to an asset class that
they may find more challenging. But the excellent
performance of real estate over the last few years
may account for the better scores obtained by
reasons linked both to alpha and to beta (B, H, K)
or to beta alone (D, E, F, G, I, J); in a less favourable
situation, it would be unsurprising if investors, no
longer satisfied with market performance, took a
more discriminating approach.
Exhibit 34: Acceptable investments in real estate asset class by size of real estate portfolio (€ million)
Direct real estate
Non-listed funds
Listed real estate
Debt
Structured products, indices,
derivatives
All equity instruments
All equity instruments
and debt
Not available/applicable (32)
84.4% 81.3% 81.3% 37.5% 65.6% 62.5% 25%
Less than 100 (36) 80.6% 88.9% 80.6% 25.0% 69.4% 63.9% 16.7%
100-1,000 (31) 100.0% 87.1% 77.4% 35.5% 61.3% 74.2% 25.8%
1,000-10,000 (33) 97.0% 93.9% 87.9% 51.5% 75.8% 81.8% 45.5%
More than 10,000 (11) 90.9% 100.0% 90.9% 54.5% 63.6% 90.9% 45.5%
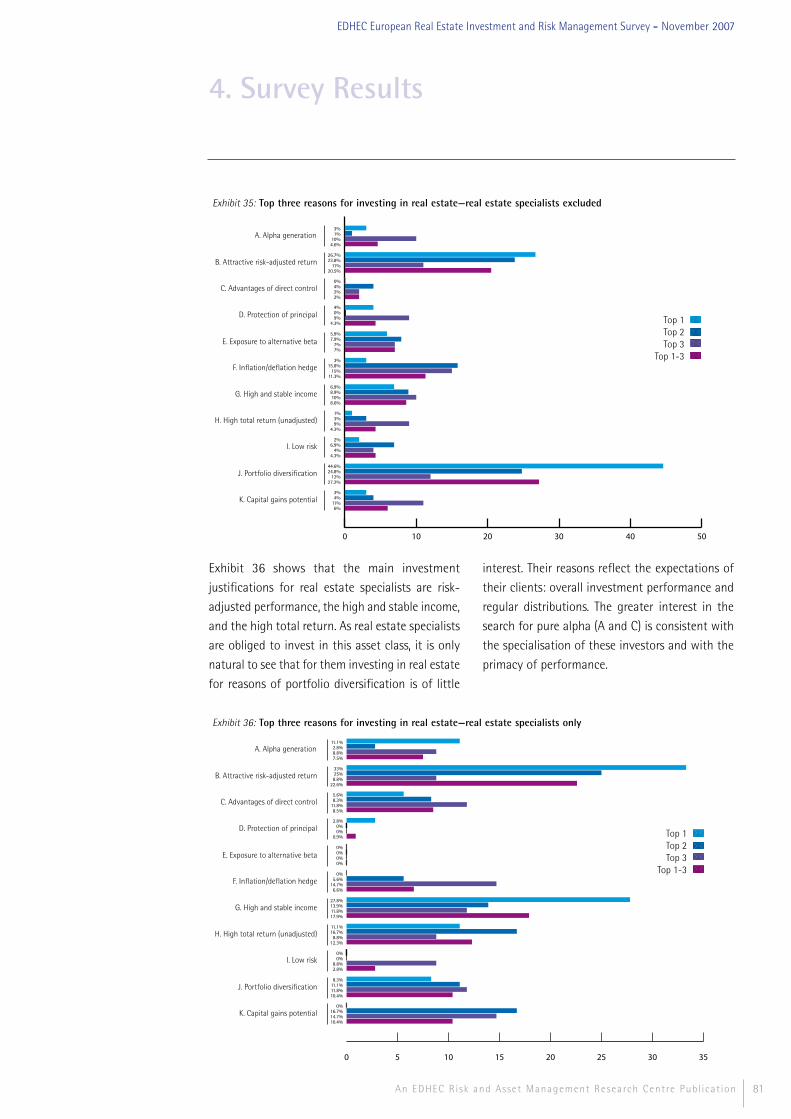
81An EDHEC Risk and Asset Management Research Centre Publ icat ion
EDHEC European Real Estate Investment and Risk Management Survey - November 2007
Exhibit 36 shows that the main investment
justifications for real estate specialists are risk-
adjusted performance, the high and stable income,
and the high total return. As real estate specialists
are obliged to invest in this asset class, it is only
natural to see that for them investing in real estate
for reasons of portfolio diversification is of little
interest. Their reasons reflect the expectations of
their clients: overall investment performance and
regular distributions. The greater interest in the
search for pure alpha (A and C) is consistent with
the specialisation of these investors and with the
primacy of performance.
4. Survey Results
Exhibit 35: Top three reasons for investing in real estate—real estate specialists excluded
Top 1Top 2Top 3
Top 1-3
A. Alpha generation
B. Attractive risk-adjusted return
C. Advantages of direct control
D. Protection of principal
E. Exposure to alternative beta
F. Inflation/deflation hedge
G. High and stable income
H. High total return (unadjusted)
I. Low risk
J. Portfolio diversification
K. Capital gains potential
3%1%
10%4.6%
26.7%23.8%
11%20.5%
0%4%2%2%
4%0%9%
4.3%
5.9%7.9%
7%7%
3%15.8%
15%11.3%
6.9%8.9%10%8.6%
1%3%9%
4.3%
2%6.9%
4%4.3%
44.6%24.8%
12%27.2%
3%4%
11%6%
0 10 20 30 40 50
Exhibit 36: Top three reasons for investing in real estate—real estate specialists only
Top 1Top 2Top 3
Top 1-3
11.1%2.8%8.8%7.5%
33%25%8.8%
22.6%
5.6%8.3%
11.8%8.5%
2.8%0%0%
0.9%
0%0%0%0%
0%5.6%
14.7%6.6%
27.8%13.9%11.8%17.9%
11.1%16.7%8.8%
12.3%
0%0%
8.8%2.8%
8.3%11.1%11.8%10.4%
0%16.7%14.7%10.4%
0 5 10 15 20 25 30 35
A. Alpha generation
B. Attractive risk-adjusted return
C. Advantages of direct control
D. Protection of principal
E. Exposure to alternative beta
F. Inflation/deflation hedge
G. High and stable income
H. High total return (unadjusted)
I. Low risk
J. Portfolio diversification
K. Capital gains potential
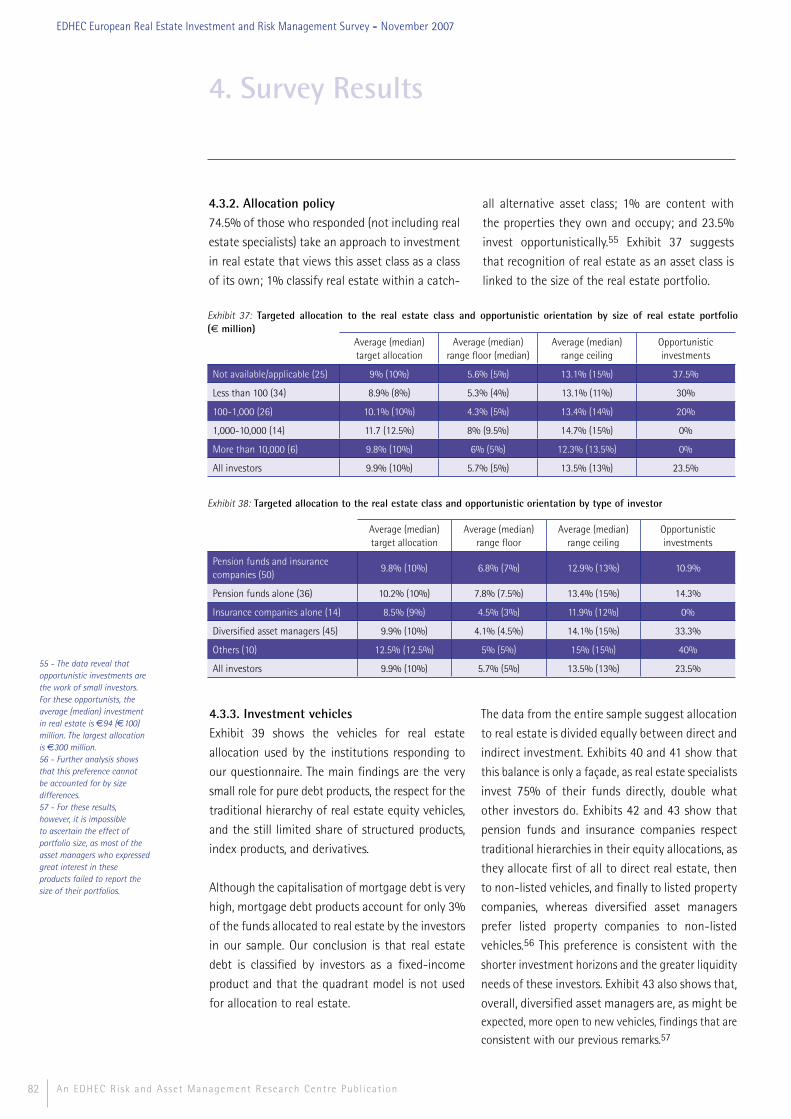
82
4.3.2. Allocation policy74.5% of those who responded (not including real
estate specialists) take an approach to investment
in real estate that views this asset class as a class
of its own; 1% classify real estate within a catch-
all alternative asset class; 1% are content with
the properties they own and occupy; and 23.5%
invest opportunistically.55 Exhibit 37 suggests
that recognition of real estate as an asset class is
linked to the size of the real estate portfolio.
4. Survey Results
An EDHEC Risk and Asset Management Research Centre Publ icat ion
55 - The data reveal that opportunistic investments are the work of small investors. For these opportunists, the average (median) investment in real estate is €94 (€100) million. The largest allocation is €300 million.56 - Further analysis shows that this preference cannot be accounted for by size differences.57 - For these results, however, it is impossible to ascertain the effect of portfolio size, as most of the asset managers who expressed great interest in these products failed to report the size of their portfolios.
EDHEC European Real Estate Investment and Risk Management Survey - November 2007
4.3.3. Investment vehiclesExhibit 39 shows the vehicles for real estate
allocation used by the institutions responding to
our questionnaire. The main findings are the very
small role for pure debt products, the respect for the
traditional hierarchy of real estate equity vehicles,
and the still limited share of structured products,
index products, and derivatives.
Although the capitalisation of mortgage debt is very
high, mortgage debt products account for only 3%
of the funds allocated to real estate by the investors
in our sample. Our conclusion is that real estate
debt is classified by investors as a fixed-income
product and that the quadrant model is not used
for allocation to real estate.
The data from the entire sample suggest allocation
to real estate is divided equally between direct and
indirect investment. Exhibits 40 and 41 show that
this balance is only a façade, as real estate specialists
invest 75% of their funds directly, double what
other investors do. Exhibits 42 and 43 show that
pension funds and insurance companies respect
traditional hierarchies in their equity allocations, as
they allocate first of all to direct real estate, then
to non-listed vehicles, and finally to listed property
companies, whereas diversified asset managers
prefer listed property companies to non-listed
vehicles.56 This preference is consistent with the
shorter investment horizons and the greater liquidity
needs of these investors. Exhibit 43 also shows that,
overall, diversified asset managers are, as might be expected, more open to new vehicles, findings that are
consistent with our previous remarks.57
Exhibit 37: Targeted allocation to the real estate class and opportunistic orientation by size of real estate portfolio (€ million)
Average (median) target allocation
Average (median) range floor (median)
Average (median) range ceiling
Opportunistic investments
Not available/applicable (25) 9% (10%) 5.6% (5%) 13.1% (15%) 37.5%
Less than 100 (34) 8.9% (8%) 5.3% (4%) 13.1% (11%) 30%
100-1,000 (26) 10.1% (10%) 4.3% (5%) 13.4% (14%) 20%
1,000-10,000 (14) 11.7 (12.5%) 8% (9.5%) 14.7% (15%) 0%
More than 10,000 (6) 9.8% (10%) 6% (5%) 12.3% (13.5%) 0%
All investors 9.9% (10%) 5.7% (5%) 13.5% (13%) 23.5%
Exhibit 38: Targeted allocation to the real estate class and opportunistic orientation by type of investor
Average (median) target allocation
Average (median) range floor
Average (median) range ceiling
Opportunistic investments
Pension funds and insurance companies (50)
9.8% (10%) 6.8% (7%) 12.9% (13%) 10.9%
Pension funds alone (36) 10.2% (10%) 7.8% (7.5%) 13.4% (15%) 14.3%
Insurance companies alone (14) 8.5% (9%) 4.5% (3%) 11.9% (12%) 0%
Diversified asset managers (45) 9.9% (10%) 4.1% (4.5%) 14.1% (15%) 33.3%
Others (10) 12.5% (12.5%) 5% (5%) 15% (15%) 40%
All investors 9.9% (10%) 5.7% (5%) 13.5% (13%) 23.5%
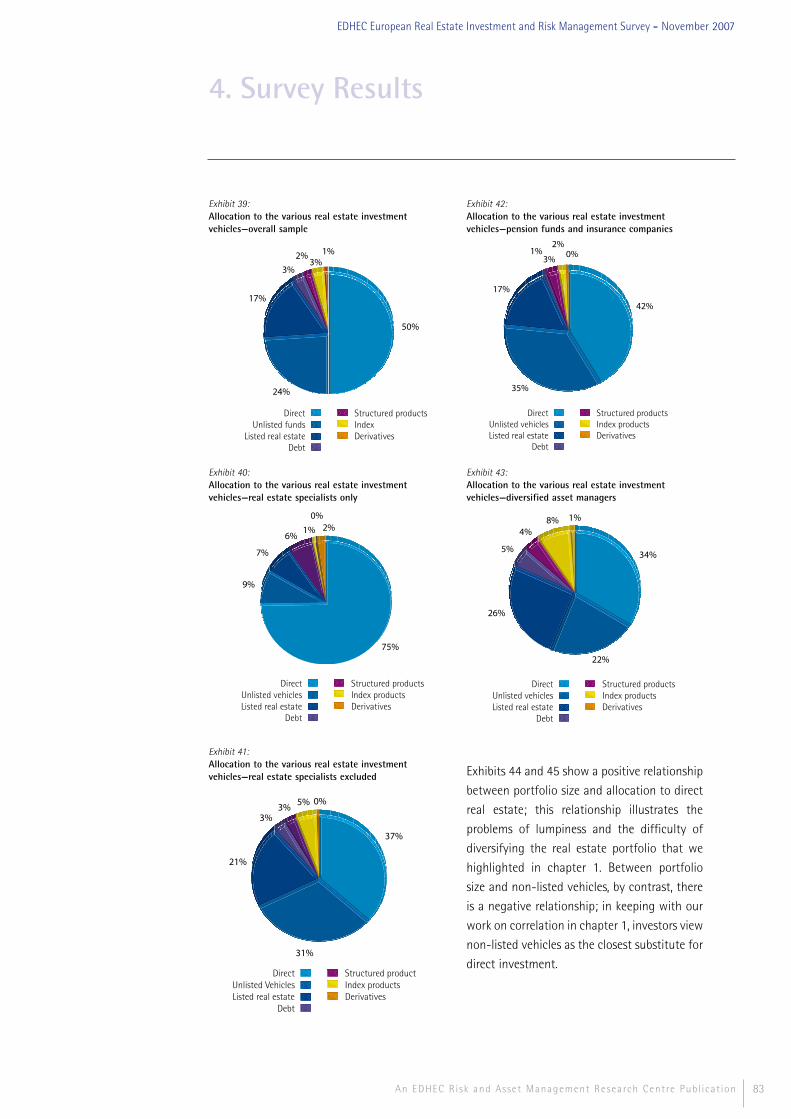
83An EDHEC Risk and Asset Management Research Centre Publ icat ion
EDHEC European Real Estate Investment and Risk Management Survey - November 2007
Exhibit 39:Allocation to the various real estate investment vehicles—overall sample
50%
24%
17%
3%
2%3%
1%
DirectUnlisted funds
Listed real estateDebt
Structured productsIndexDerivatives
Exhibit 40:Allocation to the various real estate investment vehicles—real estate specialists only
75%
9%
7%
6%1% 2%
0%
DirectUnlisted vehiclesListed real estate
Debt
Structured productsIndex productsDerivatives
Exhibit 41:Allocation to the various real estate investment vehicles—real estate specialists excluded
37%
31%
21%
3%3%
5% 0%
DirectUnlisted VehiclesListed real estate
Debt
Structured productsIndex productsDerivatives
Exhibit 42:Allocation to the various real estate investment vehicles—pension funds and insurance companies
42%
35%
17%
1%3%
2%0%
DirectUnlisted vehiclesListed real estate
Debt
Structured productsIndex productsDerivatives
Exhibit 43:Allocation to the various real estate investment vehicles—diversified asset managers
34%
22%
26%
5%
4%8% 1%
DirectUnlisted vehiclesListed real estate
Debt
Structured productsIndex productsDerivatives
Exhibits 44 and 45 show a positive relationship
between portfolio size and allocation to direct
real estate; this relationship illustrates the
problems of lumpiness and the difficulty of
diversifying the real estate portfolio that we
highlighted in chapter 1. Between portfolio
size and non-listed vehicles, by contrast, there
is a negative relationship; in keeping with our
work on correlation in chapter 1, investors view
non-listed vehicles as the closest substitute for
direct investment.
4. Survey Results

84
4.4. Real estate equity investments4.4.1. Performance measurementThe first question in this part of the questionnaire
forces respondents to choose a single benchmark for
performance measurement. In so doing, it is possible
to ascertain whether the real estate asset class is
approached as an absolute or relative return class.
Exhibit 46 shows that absolute return measures
predominate. 80.6% of real estate specialists and
52.1% of other investors report that they first set
nominal or real absolute return objectives. More
than half of pension funds (56%) resorted to relative
return measures—the only category in which a
majority of investors in our questionnaire did so.
The specialists who use a relative return measure
almost invariably choose a direct property index, a
choice in keeping with their choice of investment
vehicles (exhibit 40). Other investors rely on
direct and indirect indices—much preferred to
composite indices,58 peer group indices, and other
benchmarks—in equal measure. It is noteworthy that
pension funds alone—they report using composites
and peer group indices—wield the full complement
of benchmarks.
Analysis of the indices mentioned by the investors
who take a relative return approach shows that for
direct real estate benchmarks in Europe IPD indices
have a monopoly; when it comes to indirect indices,
there is more competition. For listed European
real estate, EPRA indices have a clear lead over
GPR indices and the use of IEIF indices is an
exception; domestic indices are mentioned as well.
Respondents note few benchmarks for non-listed
indirect real estate, a reflection of the shortage
mentioned in chapter 1; those mentioned include
the INREV international indices, the HSBC/AREF/IPD
PPF for the United Kingdom, and the values of
German open funds.
4. Survey Results
An EDHEC Risk and Asset Management Research Centre Publ icat ion
58 - Three of these composite indices encompass both direct and indirect real estate; the fourth is a 100% listed real estate composite.
EDHEC European Real Estate Investment and Risk Management Survey - November 2007
DirectNon-listed
vehiclesListed Debt
Structured products
Indices Derivatives
Not available/applicable (32)
42.91% 19.60% 11.77% 5.68% 9.20% 8.44% 2.40%
Less than 100 (36) 29.41% 41.99% 23.06% 0.61% 0.71% 3.68% 0.54%
100-1,000 (31) 46.51% 23.48% 22.04% 3.04% 0.80% 4.13% 0.00%
1,000-10,000 (33) 71.10% 12.54% 13.89% 1.35% 1.05% 0.03% 0.03%
More than 10,000 (11) 54.55% 25.18% 5.27% 13.64% 0.00% 0.00% 1.36%
All investors 49.16% 24.08% 16.68% 3.50% 2.41% 3.46% 0.71%
Exhibit 44: Allocation to the various real estate investment vehicles by size of real estate portfolio (€ million)
Exhibit 45: Allocation to the various real estate investment vehicles by size of real estate portfolio—real estate specialists excluded (€ million)
DirectNon-listed
vehiclesListed Debt
Structured products
Indices Derivatives
Non available/applicable (25)
28.49% 25.00% 13.56% 7.89% 12.78% 11.72% 0.56%
Less than 100 (34) 24.83% 44.64% 24.64% 0.58% 0.77% 3.96% 0.58%
100-1,000 (26) 38.53% 27.91% 26.37% 1.33% 0.95% 4.91% 0.00%
1,000-10,000 (14) 60.67% 18.60% 19.66% 0.71% 0.35% 0.00% 0.00%
More than 10,000 (6) 63.00% 25.40% 5.60% 5.00% 0.00% 0.00% 1.00%
All investors 37.41% 30.60% 21.02% 2.54% 3.14% 4.96% 0.34%
In our sample, the real estate asset class essentially
spans the various modes of equity investment; in
the next section of our questionnaire, we examine
performance assessment tools and the perceived risks
of these investments.
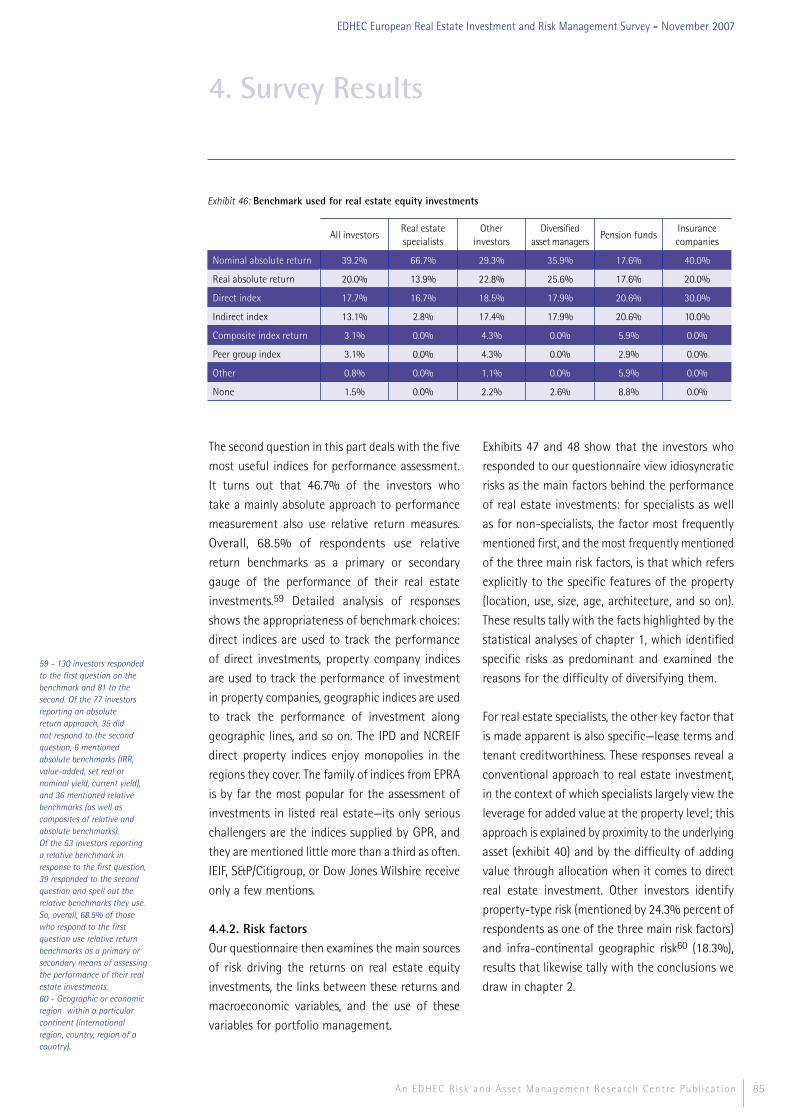
85An EDHEC Risk and Asset Management Research Centre Publ icat ion
EDHEC European Real Estate Investment and Risk Management Survey - November 2007
The second question in this part deals with the five
most useful indices for performance assessment.
It turns out that 46.7% of the investors who
take a mainly absolute approach to performance
measurement also use relative return measures.
Overall, 68.5% of respondents use relative
return benchmarks as a primary or secondary
gauge of the performance of their real estate
investments.59 Detailed analysis of responses
shows the appropriateness of benchmark choices:
direct indices are used to track the performance
of direct investments, property company indices
are used to track the performance of investment
in property companies, geographic indices are used
to track the performance of investment along
geographic lines, and so on. The IPD and NCREIF
direct property indices enjoy monopolies in the
regions they cover. The family of indices from EPRA
is by far the most popular for the assessment of
investments in listed real estate—its only serious
challengers are the indices supplied by GPR, and
they are mentioned little more than a third as often.
IEIF, S&P/Citigroup, or Dow Jones Wilshire receive
only a few mentions.
4.4.2. Risk factorsOur questionnaire then examines the main sources
of risk driving the returns on real estate equity
investments, the links between these returns and
macroeconomic variables, and the use of these
variables for portfolio management.
Exhibits 47 and 48 show that the investors who
responded to our questionnaire view idiosyncratic
risks as the main factors behind the performance
of real estate investments: for specialists as well
as for non-specialists, the factor most frequently
mentioned first, and the most frequently mentioned
of the three main risk factors, is that which refers
explicitly to the specific features of the property
(location, use, size, age, architecture, and so on).
These results tally with the facts highlighted by the
statistical analyses of chapter 1, which identified
specific risks as predominant and examined the
reasons for the difficulty of diversifying them.
For real estate specialists, the other key factor that
is made apparent is also specific—lease terms and
tenant creditworthiness. These responses reveal a
conventional approach to real estate investment,
in the context of which specialists largely view the
leverage for added value at the property level; this
approach is explained by proximity to the underlying
asset (exhibit 40) and by the difficulty of adding
value through allocation when it comes to direct
real estate investment. Other investors identify
property-type risk (mentioned by 24.3% percent of
respondents as one of the three main risk factors)
and infra-continental geographic risk60 (18.3%),
results that likewise tally with the conclusions we
draw in chapter 2.
4. Survey Results
59 - 130 investors responded to the first question on the benchmark and 81 to the second. Of the 77 investors reporting an absolute return approach, 35 did not respond to the second question, 6 mentioned absolute benchmarks (IRR, value-added, set real or nominal yield, current yield), and 36 mentioned relative benchmarks (as well as composites of relative and absolute benchmarks). Of the 53 investors reporting a relative benchmark in response to the first question, 39 responded to the second question and spell out the relative benchmarks they use. So, overall, 68.5% of those who respond to the first question use relative return benchmarks as a primary or secondary means of assessing the performance of their real estate investments. 60 - Geographic or economic region within a particular continent (international region, country, region of a country).
Exhibit 46: Benchmark used for real estate equity investments
All investorsReal estate specialists
Other investors
Diversified asset managers
Pension funds Insurance companies
Nominal absolute return 39.2% 66.7% 29.3% 35.9% 17.6% 40.0%
Real absolute return 20.0% 13.9% 22.8% 25.6% 17.6% 20.0%
Direct index 17.7% 16.7% 18.5% 17.9% 20.6% 30.0%
Indirect index 13.1% 2.8% 17.4% 17.9% 20.6% 10.0%
Composite index return 3.1% 0.0% 4.3% 0.0% 5.9% 0.0%
Peer group index 3.1% 0.0% 4.3% 0.0% 2.9% 0.0%
Other 0.8% 0.0% 1.1% 0.0% 5.9% 0.0%
None 1.5% 0.0% 2.2% 2.6% 8.8% 0.0%

86
Exhibit 49 shows the estimated correlation of several
macroeconomic variables and the returns on real
estate equity in the absence of leverage. Investors
believe that there is a marked positive correlation
of real estate returns and GDP growth, a positive
correlation with employment and with inflation61
and—less clearly—a negative correlation with
treasury rates.62 A quarter of the investors surveyed
chose not to comment on the links between real
estate returns and credit or stock market risk
premia, and among those who did opinions are very
divided.63 The convictions of these investors justify
diversification or international allocation strategies
driven by economic fundamentals.
4. Survey Results
An EDHEC Risk and Asset Management Research Centre Publ icat ion
61 - A finding consistent with the use of real estate investments as a hedge against inflation.62 - The first three correlations are consistent with the findings of Ling and Naranjo (1997).63 - Real estate specialists see a slightly positive correlation with the credit risk premium and a slightly negative correlation with the stock market risk premium, but for other investors it is the other way around.
EDHEC European Real Estate Investment and Risk Management Survey - November 2007
Exhibit 47: Top three sources of risks driving real estate performance—real estate specialists only
Top 1Top 2Top 3
Top 1-3
Continent-wide real estate market risk
Features specific to investments
Lease terms, tenant creditworthiness
Property manager
Property type (offices, retail, etc.)
Country or country region risk
26.3%8.1%4.2%
14.1%
36.8%27%25%
30.3%
15.8%18.9%33.3%21.2%
0%13.5%16.7%9.1%
7.9%21.6%8.3%
13.1%
13.2%10.8%12.5%12.1%
0 5 10 15 20 25 30 35 40
Exhibit 48: Top three sources of risks driving real estate performance—real estate specialists excluded
Top 1Top 2Top 3
Top 1-3
14.7%8.4%6.8%
10.3%
38.9%20%
20.5%27%
5.3%15.8%17.8%12.5%
1.1%8.4%
15.1%7.6%
20%32.6%19.2%24.3%
20%14.7%20.5%18.3%
0 5 10 15 20 25 30 35 40
Continent-wide real estate market risk
Features specific to investments
Lease terms, tenant creditworthiness
Property manager
Property type (offices, retail, etc.)
Country or country region risk
Exhibit 49: Estimated strength and direction of correlation of unleveraged real estate equity returns and various economic variables
GDP growth Employment Inflation Treasury ratesCredit risk premium
Stock market risk premium
High negative correlation (-2)
1 0.8% 3 2.5% 4 3.2% 29 24.6% 12 11.5% 5 4.9%
Low negative correlation (-1)
4 3.2% 7 5.7% 10 8.1% 43 36.4% 39 37.5% 29 28.2%
Absence of correlation
1 0.8% 8 6.6% 8 6.5% 5 4.2% 17 16.3% 28 27.2%
Low positive correlation (+1)
46 36.8% 64 52.5% 51 41.1% 26 22.0% 26 25.0% 31 30.1%
High positive correlation (+2)
73 58.4% 40 32.8% 51 41.1% 15 12.7% 10 9.6% 10 9.7%
No response 18 21 19 25 39 38
Average 1.49 1.07 1.09 -0.38 -0.17 0.12

87An EDHEC Risk and Asset Management Research Centre Publ icat ion
EDHEC European Real Estate Investment and Risk Management Survey - November 2007
Exhibit 50 identifies the variables tracked by
investors as they make real estate investments; it
shows that real estate specialists rely heavily—more
so than other investors—on macroeconomic data
when making investment decisions.64
4. Survey Results
64 - This contrast is less sharp after controls for real estate portfolio size.65 - Allocation limits are an unsophisticated approach that can be rationalised as a good-sense rule in the presence of uncertainty stemming from information of suspect quality or insufficient quantity, flaws characteristic of some of the real estate markets in which the participants in our survey invest.
Exhibit 51 shows the geographic divisions for which
economic data are analysed in the context of real
estate investment. It shows that specialists have a
much more local view than do other investors. As a
result, countries (83.3%), major cities (69.4%), and
regions (66.6%) are most important to specialists,
whereas other investors are interested above all in
countries (55.8%) and continents (53.5%). These
findings are consistent with the greater proximity
of specialists to the underlying asset and with the
top-down, intermediated allocation approach of
other investors.
Exhibit 50: Economic variables tracked in the context of real estate investments
GDP growth Employment Inflation Treasury ratesCredit risk premium
Stock market risk premium
Real estate specialists
32 86.5% 30 81.1% 34 91.9% 32 86.5% 20 54.1% 10 27%
Other investors 61 75.3% 42 51.9% 57 70.4% 61 75.3% 23 28.4% 23 28.4%
World Continent CountryPolitical region
Economic region
Major city Not used
Real estate specialists
22.2% 50.0% 83.3% 22.2% 44.4% 69.4% 11.1%
Other investors 19.8% 53.5% 55.8% 8.1% 19.8% 29.1% 15.1%
Exhibit 51: Geographic level at which economic variables are tracked in the context of real estate investments
4.4.3. Risk management techniquesAfter identifying the sources of risk affecting
real estate returns, our questionnaire attempts to
identify common risk management practices.
Exhibits 52 and 53 show how useful investors
think various approaches to risk management are.
Diversification emerges as the sole suitable approach
for real estate specialists and the most useful for
other investors. Of the other possibilities, only limits
on allocation to real estate find favour among
non-specialists; principal-protected structured
real estate products are deemed not very useful
and derivatives get a wary welcome.65 Real estate
specialists, who are unable to cap the share of
real estate in their portfolios, consider derivatives
and structured products even less useful as risk
management tools.
Exhibit 52: Usefulness of various risk management approaches—real estate specialists
Not useful(-2)
Not very useful (-1)
Somewhat useful (+1)
Very useful(+2)
Average weighted score
Capping allocations to real estate 50.0% 11.8% 20.6% 17.6% -0.56
Diversifying the real estate portfolio 5.7% 5.7% 25.7% 62.9% 1.34
Investing in principal-protected products
54.8% 29.0% 12.9% 3.2% -1.19
Using property derivatives 43.3% 23.3% 33.3% 0.0% -0.77

88
4. Survey Results
An EDHEC Risk and Asset Management Research Centre Publ icat ion
EDHEC European Real Estate Investment and Risk Management Survey - November 2007
Exhibits 54 and 55 show the diversification
approaches deemed most appropriate by the
investors responding to our questionnaire. In keeping
with the findings of part one of our survey, and
entirely consistent with the risk factors identified
above, investors identify diversification by property
type and diversification by geography as the two
main approaches to diversification. For specialists,
a third approach is grounded on financial analysis;
style considerations (growth vs. value, core vs. value
added or opportunistic) are important as well. For
other investors, the third approach to diversification
is by type of instrument or by manager, an
approach that shows the specific concerns of those
investing indirectly in real estate. That investors
fail to distinguish between listed and non-listed
instruments is noteworthy.
Exhibit 53: Usefulness of various risk management approaches—real estate specialists excluded
Not useful(-2)
Not very useful (-1)
Somewhat useful (+1)
Very useful(+2)
Average weighted score
Capping allocations to real estate 2.2% 11% 33% 53.8% 1.25
Diversifying the real estate portfolio 0% 2.2% 23.3% 74.4% 1.70
Investing in principal-protected products
43.2% 36.4% 15.9% 4.5% -0.98
Using property derivatives 28.7% 33.3% 29.9% 8% -0.45
Exhibit 54: Usefulness of various diversification approaches—real estate specialists only
Top 1Top 2Top 3
Top 1-3
Property type
Geographic
By investment amount
Core/non core
Listed/unlisted
Growth/value
36.1%20%20%
25.5%
25%42.9%8.6%
25.5%
2.8%2.9%5.7%3.8%
8.3%5.7%8.6%7.5%
0%2.9%2.9%1.9%
5.6%5.7%
17.1%9.4%
By instrument type/manager 0%2.9%2.9%1.9%
Grounded on fundamental/financial analysis 19.4%11.4%17.1%
16%
Grounded on physical analysis 2.8%2.9%
11.4%5.7%
Other 0%2.9%5.7%2.8%
0 10 20 30 40 50
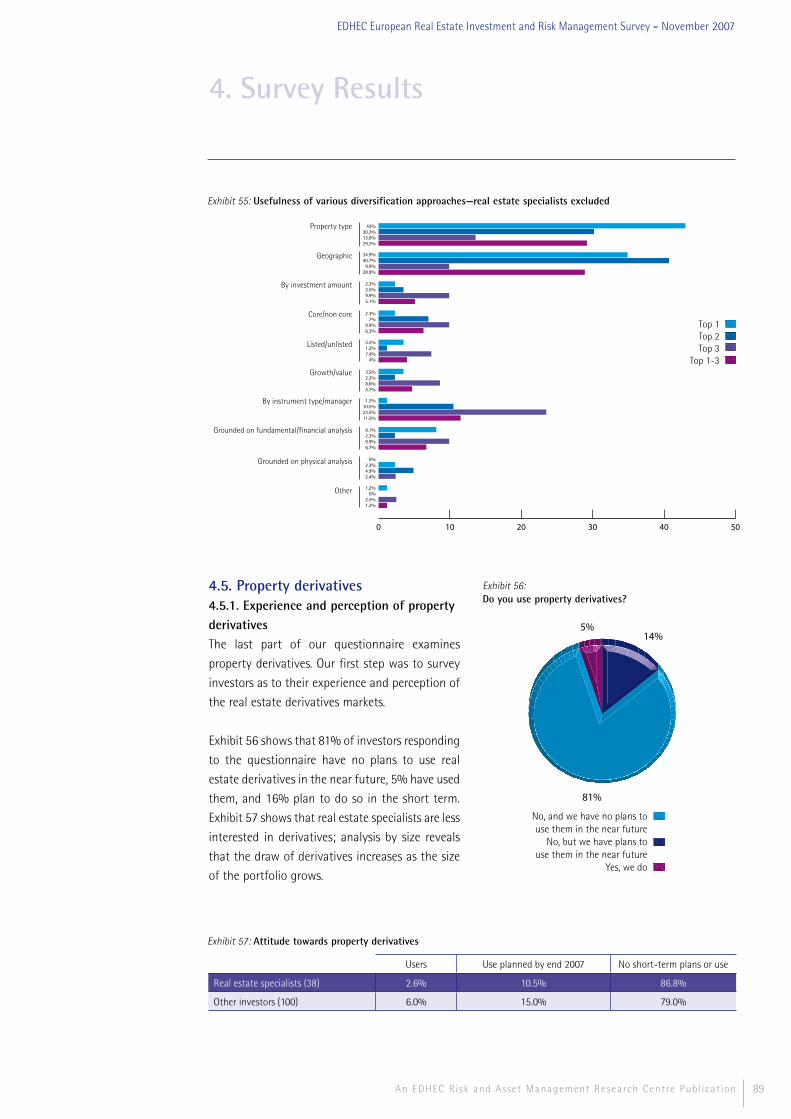
89An EDHEC Risk and Asset Management Research Centre Publ icat ion
EDHEC European Real Estate Investment and Risk Management Survey - November 2007
4.5. Property derivatives4.5.1. Experience and perception of property derivatives The last part of our questionnaire examines
property derivatives. Our first step was to survey
investors as to their experience and perception of
the real estate derivatives markets.
Exhibit 56 shows that 81% of investors responding
to the questionnaire have no plans to use real
estate derivatives in the near future, 5% have used
them, and 16% plan to do so in the short term.
Exhibit 57 shows that real estate specialists are less
interested in derivatives; analysis by size reveals
that the draw of derivatives increases as the size
of the portfolio grows.
Exhibit 56: Do you use property derivatives?
81%
14%5%
No, and we have no plans to use them in the near future
No, but we have plans to use them in the near future
Yes, we do
4. Survey Results
Exhibit 55: Usefulness of various diversification approaches—real estate specialists excluded
Top 1Top 2Top 3
Top 1-3
0 10 20 30 40 50
Property type
Geographic
By investment amount
Core/non core
Listed/unlisted
Growth/value
43%30.2%13.6%29.2%
34.9%40.7%9.9%
28.9%
2.3%3.5%9.9%5.1%
2.3%7%
9.9%6.3%
3.5%1.2%7.4%
4%
3.5%2.3%8.6%4.7%
By instrument type/manager 1.2%10.5%23.5%11.5%
Grounded on fundamental/financial analysis 8.1%2.3%9.9%6.7%
Grounded on physical analysis 0%2.3%4.9%2.4%
Other 1.2%0%
2.5%1.2%
Users Use planned by end 2007 No short-term plans or use
Real estate specialists (38) 2.6% 10.5% 86.8%
Other investors (100) 6.0% 15.0% 79.0%
Exhibit 57: Attitude towards property derivatives

90
Exhibit 58 lists the reasons for this rejection of real
estate derivatives.66 50% of real estate specialists
consider existing products unsuited to their
needs. The difficulty of hedging risk with existing
index derivatives (a difficulty arising from the
preponderance of specific risk in direct real estate
portfolios), a problem we examine in chapter 3, is
a possible reason for these results. Their limited
geographic reach (when our questionnaire was
administered, only the United Kingdom had a
developed derivatives market) is another; geographic
analysis of the data—of limited reliability, given
the small sample—suggests, by contrast, that two-
thirds of UK-based specialists deem these products
inappropriate: rejection of these products appears
closer to unanimous among the specialists who
are more likely to be familiar with them. The other
reasons for the failure of specialists to resort to
derivatives are the investment rules in force in
the respondent’s organisation (for 42.9% of those
responding) and, to a lesser degree, a lack of
familiarity with the products (32.1%).
For pension funds and insurers, the lack of familiarity
with real estate derivatives67 is the primary
obstacle to the use of these products (55.3% of 38
respondents), followed by their unsuitability (34.2%)
and by regulatory restrictions (31.6%).
For diversified asset managers, internal investment
policies are the main obstacle (42.9%), ahead of a
lack of familiarity with the products (35.7%) and
their unsuitability (28.6%).68
4. Survey Results
An EDHEC Risk and Asset Management Research Centre Publ icat ion
66 - As many as five responses were possible; on average, 1.5 were provided.67 - Familiarity with real estate derivatives is apt to be greater among the managers of larger real estate portfolios. 68 - There is a size effect: for asset managers with a real estate portfolio of €100m or less, the lack of familiarity, followed by investment polices, is the main problem; for the others, investment policies, product unsuitability, and regulatory issues are all major impediments. 69 - 94.4% of the investors who answer the question.
EDHEC European Real Estate Investment and Risk Management Survey - November 2007
4.5.2. Awareness of product and usesThe derivatives market is, for most investors,
synonymous with the market based on IPD indices:
half of the investors who returned our questionnaire
responded to this question and 61.1% of them are
familiar only with the derivatives linked to IPD
indices and only 5.6% of those who are familiar
with a real estate derivative69 are unaware of the
IPD indices derivatives market. Exhibit 59 shows
that total return swaps on IPD indices are far and
Exhibit 58: Reasons for rejecting derivatives
Regulatoryrestrictions
Investment policy
Lack of familiarity
Product unsuitability
Other
0
10
20
30
40
50
60
Total Diversified asset managers Real estate specialists Pension funds and insurers
24.3% 43.7% 10.7%
33% 36.9%
21.43% 35.71% 3.57%
42.86% 28.57%
25% 32.14% 7.14%
42.86% 50%
31.58% 55.26% 15.79%
23.68% 34.21%
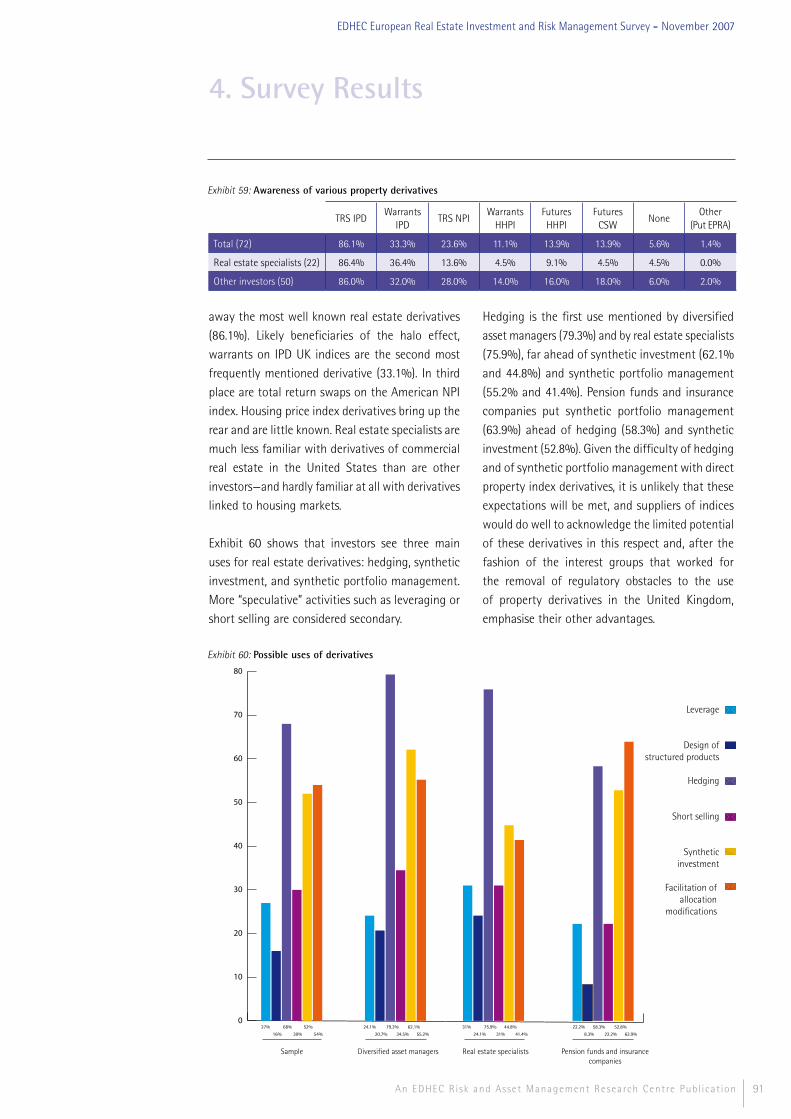
91An EDHEC Risk and Asset Management Research Centre Publ icat ion
EDHEC European Real Estate Investment and Risk Management Survey - November 2007
4. Survey Results
Exhibit 59: Awareness of various property derivatives
TRS IPDWarrants
IPDTRS NPI
Warrants HHPI
Futures HHPI
Futures CSW
NoneOther
(Put EPRA)
Total (72) 86.1% 33.3% 23.6% 11.1% 13.9% 13.9% 5.6% 1.4%
Real estate specialists (22) 86.4% 36.4% 13.6% 4.5% 9.1% 4.5% 4.5% 0.0%
Other investors (50) 86.0% 32.0% 28.0% 14.0% 16.0% 18.0% 6.0% 2.0%
away the most well known real estate derivatives
(86.1%). Likely beneficiaries of the halo effect,
warrants on IPD UK indices are the second most
frequently mentioned derivative (33.1%). In third
place are total return swaps on the American NPI
index. Housing price index derivatives bring up the
rear and are little known. Real estate specialists are
much less familiar with derivatives of commercial
real estate in the United States than are other
investors—and hardly familiar at all with derivatives
linked to housing markets.
Exhibit 60 shows that investors see three main
uses for real estate derivatives: hedging, synthetic
investment, and synthetic portfolio management.
More “speculative” activities such as leveraging or
short selling are considered secondary.
Hedging is the first use mentioned by diversified
asset managers (79.3%) and by real estate specialists
(75.9%), far ahead of synthetic investment (62.1%
and 44.8%) and synthetic portfolio management
(55.2% and 41.4%). Pension funds and insurance
companies put synthetic portfolio management
(63.9%) ahead of hedging (58.3%) and synthetic
investment (52.8%). Given the difficulty of hedging
and of synthetic portfolio management with direct
property index derivatives, it is unlikely that these
expectations will be met, and suppliers of indices
would do well to acknowledge the limited potential
of these derivatives in this respect and, after the
fashion of the interest groups that worked for
the removal of regulatory obstacles to the use
of property derivatives in the United Kingdom,
emphasise their other advantages.
Exhibit 60: Possible uses of derivatives
Leverage
Design ofstructured products
Hedging
Short selling
Syntheticinvestment
Facilitation of allocation
modifications
Sample Diversified asset managers Real estate specialists Pension funds and insurancecompanies
27% 68% 52%
16% 30% 54%
24.1% 79.3% 62.1%
20.7% 34.5% 55.2%
31% 75.9% 44.8%
24.1% 31% 41.4%
22.2% 58.3% 52.8%
8.3% 22.2% 63.9%
0
10
20
30
40
50
60
70
80
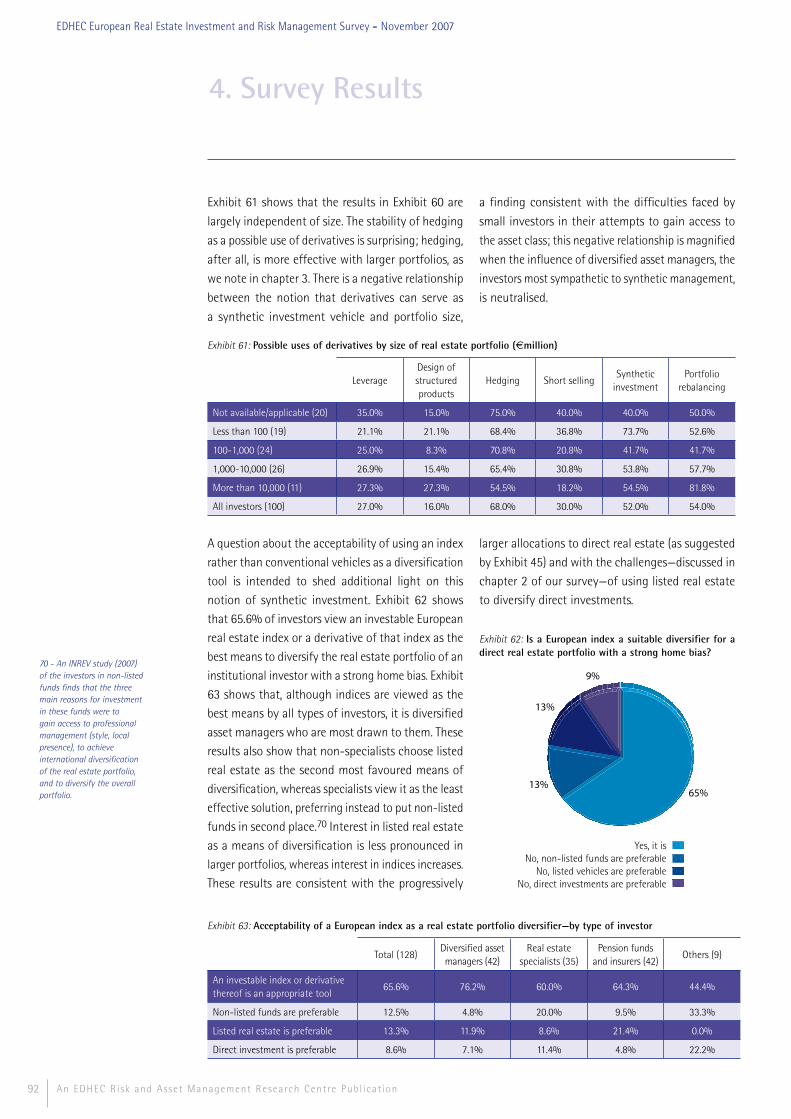
92
4. Survey Results
An EDHEC Risk and Asset Management Research Centre Publ icat ion
70 - An INREV study (2007) of the investors in non-listed funds finds that the three main reasons for investment in these funds were to gain access to professional management (style, local presence), to achieve international diversification of the real estate portfolio, and to diversify the overall portfolio.
EDHEC European Real Estate Investment and Risk Management Survey - November 2007
Exhibit 61 shows that the results in Exhibit 60 are
largely independent of size. The stability of hedging
as a possible use of derivatives is surprising; hedging,
after all, is more effective with larger portfolios, as
we note in chapter 3. There is a negative relationship
between the notion that derivatives can serve as
a synthetic investment vehicle and portfolio size,
a finding consistent with the difficulties faced by
small investors in their attempts to gain access to
the asset class; this negative relationship is magnified
when the influence of diversified asset managers, the
investors most sympathetic to synthetic management,
is neutralised.
Exhibit 61: Possible uses of derivatives by size of real estate portfolio (€million)
LeverageDesign of structured products
Hedging Short sellingSynthetic
investmentPortfolio
rebalancing
Not available/applicable (20) 35.0% 15.0% 75.0% 40.0% 40.0% 50.0%
Less than 100 (19) 21.1% 21.1% 68.4% 36.8% 73.7% 52.6%
100-1,000 (24) 25.0% 8.3% 70.8% 20.8% 41.7% 41.7%
1,000-10,000 (26) 26.9% 15.4% 65.4% 30.8% 53.8% 57.7%
More than 10,000 (11) 27.3% 27.3% 54.5% 18.2% 54.5% 81.8%
All investors (100) 27.0% 16.0% 68.0% 30.0% 52.0% 54.0%
A question about the acceptability of using an index
rather than conventional vehicles as a diversification
tool is intended to shed additional light on this
notion of synthetic investment. Exhibit 62 shows
that 65.6% of investors view an investable European
real estate index or a derivative of that index as the
best means to diversify the real estate portfolio of an
institutional investor with a strong home bias. Exhibit
63 shows that, although indices are viewed as the
best means by all types of investors, it is diversified
asset managers who are most drawn to them. These
results also show that non-specialists choose listed
real estate as the second most favoured means of
diversification, whereas specialists view it as the least
effective solution, preferring instead to put non-listed
funds in second place.70 Interest in listed real estate
as a means of diversification is less pronounced in
larger portfolios, whereas interest in indices increases.
These results are consistent with the progressively
larger allocations to direct real estate (as suggested
by Exhibit 45) and with the challenges—discussed in
chapter 2 of our survey—of using listed real estate
to diversify direct investments.
Exhibit 62: Is a European index a suitable diversifier for a direct real estate portfolio with a strong home bias?
13%65%
9%
13%
Yes, it isNo, non-listed funds are preferable
No, listed vehicles are preferableNo, direct investments are preferable
Exhibit 63: Acceptability of a European index as a real estate portfolio diversifier—by type of investor
Total (128)Diversified asset managers (42)
Real estate specialists (35)
Pension funds and insurers (42)
Others (9)
An investable index or derivative thereof is an appropriate tool
65.6% 76.2% 60.0% 64.3% 44.4%
Non-listed funds are preferable 12.5% 4.8% 20.0% 9.5% 33.3%
Listed real estate is preferable 13.3% 11.9% 8.6% 21.4% 0.0%
Direct investment is preferable 8.6% 7.1% 11.4% 4.8% 22.2%

93An EDHEC Risk and Asset Management Research Centre Publ icat ion
EDHEC European Real Estate Investment and Risk Management Survey - November 2007
4. Survey Results
71 - Studies of American and European data show that correlation with stock markets has a tendency to decline over time but remains high nonetheless. It is not at all our aim to deny the utility of listed property companies as a means to diversify a securities portfolio, but the diversification potential of direct real estate is far higher and it cannot be achieved through listed property companies.
Box 15: On the utility of real estate indices as
vehicles for investment and diversification
Access to real estate indices makes it possible
to attain a level of diversification that would
be unattainable through direct real estate
investments. Indices allow investors to take
passive positions representative of a country
or property type that may not be accessible to
direct investment. These indices may be used
dynamically to generate alpha, but intrinsically
they are pure beta products.
Exhibit 64 lists the main reasons, as identified
by our questionnaire, for investment in real
estate, and it assesses the relevance of real
estate indices as a response to these reasons;
it shows that indices have definite potential as
vehicles for passive investment in real estate.
Exhibit 64: Relevance of real estate index as an investment vehicle in relation to real estate investment motivations—real estate specialists excluded
Exhibit 65: Relevance of real estate index as a diversifier with respect to key sources of risk
Exhibit 65 examines the relevance of indices
as diversifiers with respect to the management
of the risks of real estate portfolios as
identified by the investors who responded to
our questionnaire. It shows that indices are
an excellent means of real estate portfolio
diversification.
Exposure to two types of indices is available to
investors: listed property companies and REITs
indices and direct real estate indices.
Equity REIT indices can be replicated easily
and are investable through index funds, ETFs,
and, more recently, derivatives; they are liquid,
transparent, and relatively inexpensive. As we
saw in chapter 1, the listed real estate section
is still incomplete and somewhat narrow in
most European countries, a situation that
creates problems of index diversification and
representativity. With the generalisation of
listed real estate investment trusts, this section
is growing quickly, and it is now possible to
construct a European index with an acceptable
level of concentration. To be representative of
the European listed property company market,
current commercial indices are nonetheless
constructed on capitalisation weightings; they
do not attempt to provide a true picture of
(and are not representative of) the geographic
or property-type dimensions of the underlying
market. The development of listed real estate in
Europe could eventually allow the construction
of alternative indices aiming for composition
representative of the stock of commercial real
estate. The high correlation to the stock market
and its weak short-term correlation to the
underlying market, by contrast, are unlikely
to disappear as the market grows, as they are
intrinsic to listed real estate.71
In the short term, investment in listed property
companies does not generate risks and returns
representative of those of direct real estate.
For this reason, it is hard to use an equity REIT
index to diversify or manage synthetically a
portfolio of direct holdings.
Reason for investment ExpectationRelevance of
indices
Diversification Beta Complete
High risk-adjusted performance
Alpha + Beta High
Inflation hedging Beta Complete
Source of risk RequirementRelevance of
indices
• Specific risk- Characteristics specific to assets- Lease terms and tenant creditworthiness- Property manager
Diversification Complete
• Geographic risk- Country- or region-wide- Continent-wide
Diversification Complete
• Property-type risk Diversification Complete

94
4. Survey Results
An EDHEC Risk and Asset Management Research Centre Publ icat ion
72 - On its launch, and according to its promoters, the underlying fund had an exposure to more than 2,500 properties representing €10 billion of category one commercial real estate—by comparison, the IPD UK index included 11,010 properties with a total value of €220 billion. With an initial €150 million in assets, the fund will have to manage problems of capacity and liquidity provision.
EDHEC European Real Estate Investment and Risk Management Survey - November 2007
Direct real estate indices, based on appraisals
of buildings already held by investors or on
transactions, are by nature non-investable;
derivatives must be used to take a synthetic
position on these indices. A hybrid was created
in June 2006 by FTSE and MSS, which launched
the first investable direct real estate “index”. The
value of this index is determined by the daily
pricing of a fund invested in various funds
as well as directly—the index thus becomes
directly investable via the fund. In addition
to offering liquidity and investability, the
FTSE/MSS UK commercial property index lays
claim to representativity through its indirect
exposure to a large amount of property, the
types of which are monitored to match those
of the underlying market.72 The index was also
built around components selected for their
likelihood of delivering outperformance; as a
result, it is not a pure beta product.
Direct indices are guarantors of maximum
diversification, as their wide bases allow the
diversification of risk specific to properties and
they are not directly exposed to stock market
risk. They are pure beta products, with yields
on a property type or on a region, and serve
as a hedge against selection risk (alpha stable
at zero). They curtail style drift (composite
indices) or eliminate it altogether (property-
type indices) and reduce operational risk (or
its impact) significantly. Instruments based
on direct real estate indices greatly facilitate
access to the underlying market and allow
investors to remove themselves from the
usual difficulties of the direct market (high
information and transaction costs, long lead
times and minimal liquidity, the predominance
of specific risk, substantial property
management requirements). The limits of these
instruments are the limits of the indices they
are based on (transparency, representativity,
frequency, direct investability, and liquidity) and
their synthetic or hybrid nature.
Exhibit 66 compares current allocations to
index-based solutions and the upper limit of
their medium-term potential, as reckoned
by investors who report using relative return
measures as a primary approach to gauging
performance. As investors report that they are
open to using index vehicles as a means of
international diversification, this comparison
indicates the great potential of offers built
around passive exposure to real estate. 81% of
investors have no plans to invest in derivatives
in the near future (exhibit 46), so index funds
and funds of funds seem to be the most
promising medium-term alternatives.
Exhibit 66: Current and potential market share of index-based solutions in real estate investmentMarket share of index-based solutions: 4-6%
50%
24%
17%
3%
2%3%
1%
DirectUnlisted funds
Listed real estateDebt
Structured productsIndex fundsDerivatives
Potential of index-based solutions: 31-37%
40%
20%
18%
13%
3%
3%1%
2%
Absolute nominal returnReal absolute return
Direct indexIndirect index
Return on compositePeer group indexOther benchmarkNone
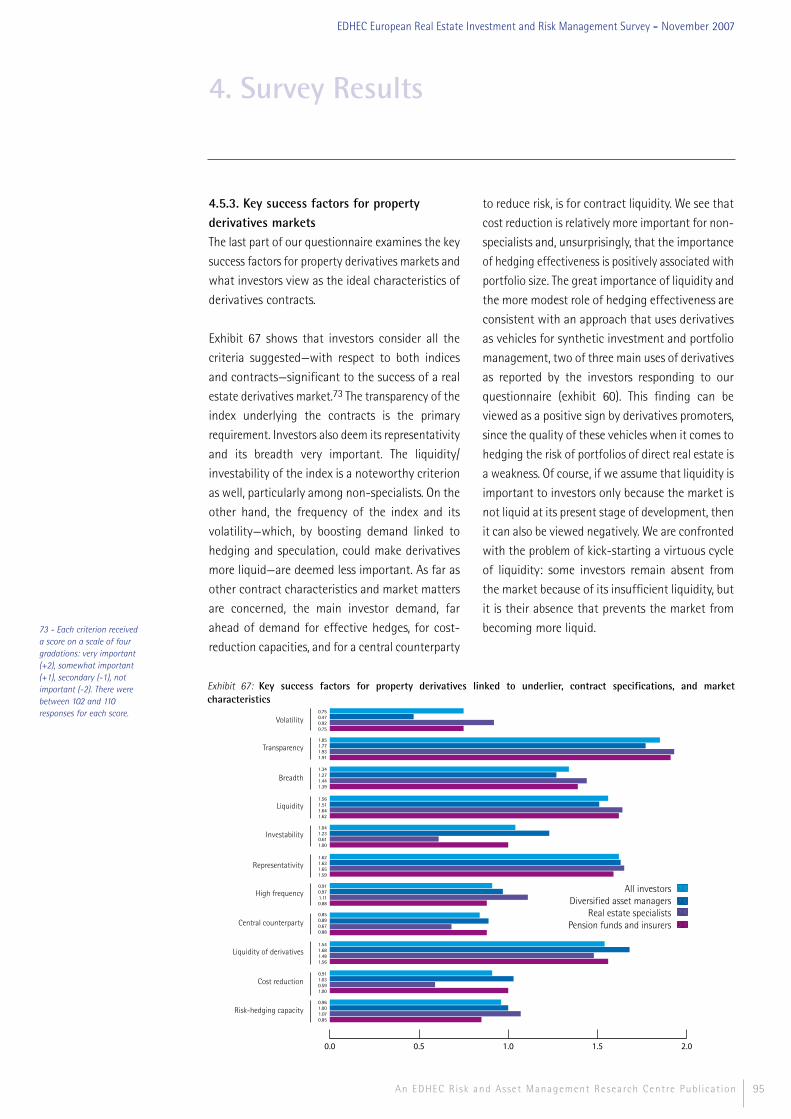
95An EDHEC Risk and Asset Management Research Centre Publ icat ion
EDHEC European Real Estate Investment and Risk Management Survey - November 2007
4. Survey Results
73 - Each criterion received a score on a scale of four gradations: very important (+2), somewhat important (+1), secondary (-1), not important (-2). There were between 102 and 110 responses for each score.
4.5.3. Key success factors for property derivatives marketsThe last part of our questionnaire examines the key
success factors for property derivatives markets and
what investors view as the ideal characteristics of
derivatives contracts.
Exhibit 67 shows that investors consider all the
criteria suggested—with respect to both indices
and contracts—significant to the success of a real
estate derivatives market.73 The transparency of the
index underlying the contracts is the primary
requirement. Investors also deem its representativity
and its breadth very important. The liquidity/
investability of the index is a noteworthy criterion
as well, particularly among non-specialists. On the
other hand, the frequency of the index and its
volatility—which, by boosting demand linked to
hedging and speculation, could make derivatives
more liquid—are deemed less important. As far as
other contract characteristics and market matters
are concerned, the main investor demand, far
ahead of demand for effective hedges, for cost-
reduction capacities, and for a central counterparty
to reduce risk, is for contract liquidity. We see that
cost reduction is relatively more important for non-
specialists and, unsurprisingly, that the importance
of hedging effectiveness is positively associated with
portfolio size. The great importance of liquidity and
the more modest role of hedging effectiveness are
consistent with an approach that uses derivatives
as vehicles for synthetic investment and portfolio
management, two of three main uses of derivatives
as reported by the investors responding to our
questionnaire (exhibit 60). This finding can be
viewed as a positive sign by derivatives promoters,
since the quality of these vehicles when it comes to
hedging the risk of portfolios of direct real estate is
a weakness. Of course, if we assume that liquidity is
important to investors only because the market is
not liquid at its present stage of development, then
it can also be viewed negatively. We are confronted
with the problem of kick-starting a virtuous cycle
of liquidity: some investors remain absent from
the market because of its insufficient liquidity, but
it is their absence that prevents the market from
becoming more liquid.
Exhibit 67: Key success factors for property derivatives linked to underlier, contract specifications, and market characteristics
All investorsDiversified asset managers
Real estate specialistsPension funds and insurers
Volatility
Transparency
Breadth
Liquidity
Investability
Representativity
0.750.470.920.75
1.851.771.931.91
1.341.271.441.39
1.561.511.641.62
1.041.230.611.00
1.621.631.651.59
High frequency0.910.971.110.88
Liquidity of derivatives1.541.681.481.56
0.850.890.670.88
Cost reduction0.911.030.591.00
Risk-hedging capacity0.961.001.070.85
0.0 0.5 1.0 1.5 2.0
Central counterparty
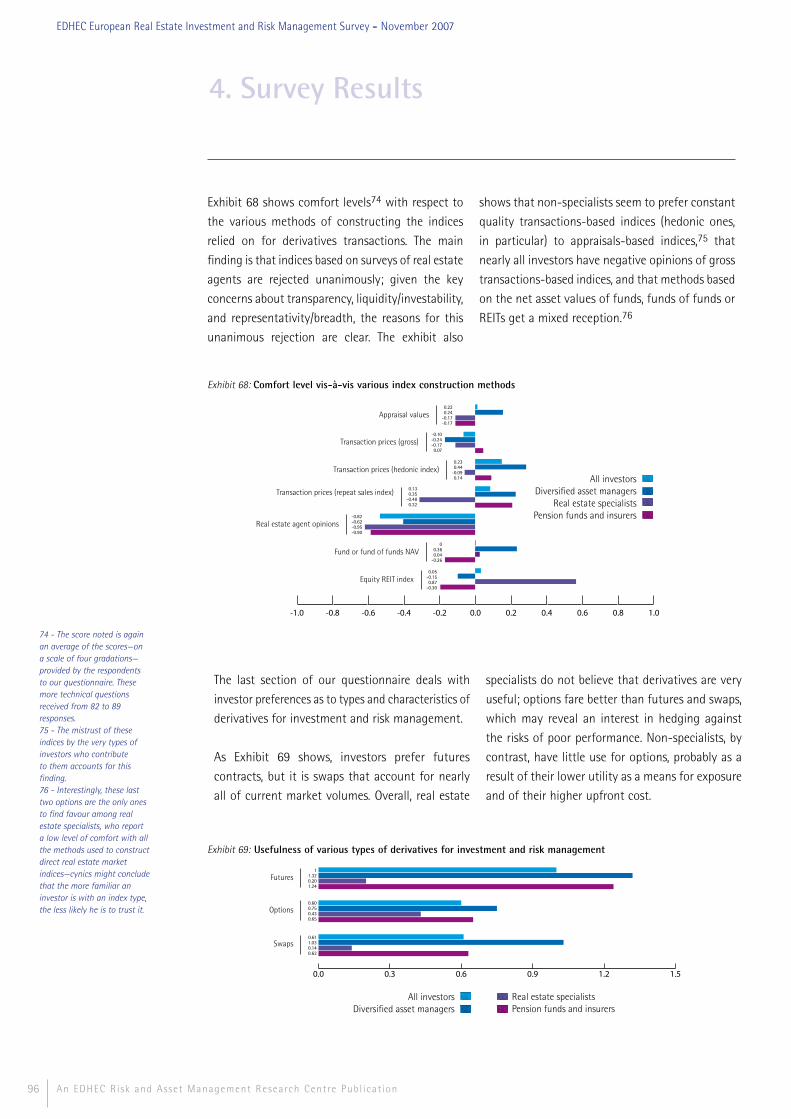
96
4. Survey Results
An EDHEC Risk and Asset Management Research Centre Publ icat ion
74 - The score noted is again an average of the scores—on a scale of four gradations—provided by the respondents to our questionnaire. These more technical questions received from 82 to 89 responses. 75 - The mistrust of these indices by the very types of investors who contribute to them accounts for this finding. 76 - Interestingly, these last two options are the only ones to find favour among real estate specialists, who report a low level of comfort with all the methods used to construct direct real estate market indices—cynics might conclude that the more familiar an investor is with an index type, the less likely he is to trust it.
EDHEC European Real Estate Investment and Risk Management Survey - November 2007
Exhibit 68 shows comfort levels74 with respect to
the various methods of constructing the indices
relied on for derivatives transactions. The main
finding is that indices based on surveys of real estate
agents are rejected unanimously; given the key
concerns about transparency, liquidity/investability,
and representativity/breadth, the reasons for this
unanimous rejection are clear. The exhibit also
shows that non-specialists seem to prefer constant
quality transactions-based indices (hedonic ones,
in particular) to appraisals-based indices,75 that
nearly all investors have negative opinions of gross
transactions-based indices, and that methods based
on the net asset values of funds, funds of funds or
REITs get a mixed reception.76
Exhibit 68: Comfort level vis-à-vis various index construction methods
All investorsDiversified asset managers
Real estate specialistsPension funds and insurers
-1.0 -0.8 -0.6 -0.4 -0.2 0.0 0.2 0.4 0.6 0.8 1.0
Appraisal values0.220.24
-0.17-0.17
Transaction prices (gross)-0.10-0.24-0.170.07
Transaction prices (hedonic index)0.230.44
-0.090.14
Transaction prices (repeat sales index) 0.130.35
-0.480.32
Real estate agent opinions-0.82-0.62-0.95-0.90
Fund or fund of funds NAV0
0.360.04
-0.26
Equity REIT index0.05
-0.150.87
-0.30
The last section of our questionnaire deals with
investor preferences as to types and characteristics of
derivatives for investment and risk management.
As Exhibit 69 shows, investors prefer futures
contracts, but it is swaps that account for nearly
all of current market volumes. Overall, real estate
specialists do not believe that derivatives are very
useful; options fare better than futures and swaps,
which may reveal an interest in hedging against
the risks of poor performance. Non-specialists, by
contrast, have little use for options, probably as a
result of their lower utility as a means for exposure
and of their higher upfront cost.
Exhibit 69: Usefulness of various types of derivatives for investment and risk management
All investorsDiversified asset managers
Futures
Options
Swaps
11.320.201.24
0.600.750.430.65
0.611.030.140.63
0.0 0.3 0.6 0.9 1.2 1.5
Real estate specialistsPension funds and insurers
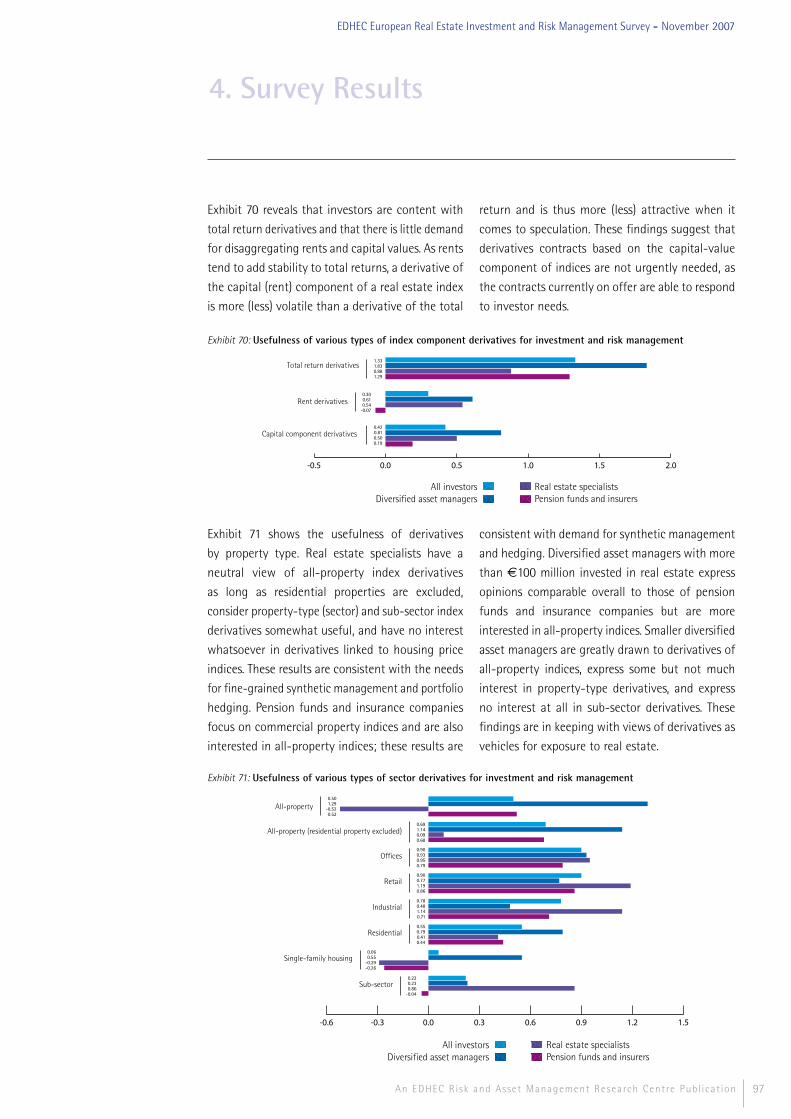
97An EDHEC Risk and Asset Management Research Centre Publ icat ion
EDHEC European Real Estate Investment and Risk Management Survey - November 2007
4. Survey Results
Exhibit 70 reveals that investors are content with
total return derivatives and that there is little demand
for disaggregating rents and capital values. As rents
tend to add stability to total returns, a derivative of
the capital (rent) component of a real estate index
is more (less) volatile than a derivative of the total
return and is thus more (less) attractive when it
comes to speculation. These findings suggest that
derivatives contracts based on the capital-value
component of indices are not urgently needed, as
the contracts currently on offer are able to respond
to investor needs.
Exhibit 70: Usefulness of various types of index component derivatives for investment and risk management
All investorsDiversified asset managers
Real estate specialistsPension funds and insurers
-0.5 0.0 0.5 1.0 1.5 2.0
Total return derivatives1.331.830.881.29
Capital component derivatives0.420.810.500.19
Rent derivatives0.300.610.54
-0.07
Exhibit 71 shows the usefulness of derivatives
by property type. Real estate specialists have a
neutral view of all-property index derivatives
as long as residential properties are excluded,
consider property-type (sector) and sub-sector index
derivatives somewhat useful, and have no interest
whatsoever in derivatives linked to housing price
indices. These results are consistent with the needs
for fine-grained synthetic management and portfolio
hedging. Pension funds and insurance companies
focus on commercial property indices and are also
interested in all-property indices; these results are
consistent with demand for synthetic management
and hedging. Diversified asset managers with more
than €100 million invested in real estate express
opinions comparable overall to those of pension
funds and insurance companies but are more
interested in all-property indices. Smaller diversified
asset managers are greatly drawn to derivatives of
all-property indices, express some but not much
interest in property-type derivatives, and express
no interest at all in sub-sector derivatives. These
findings are in keeping with views of derivatives as
vehicles for exposure to real estate.
Exhibit 71: Usefulness of various types of sector derivatives for investment and risk management
All investorsDiversified asset managers
Real estate specialistsPension funds and insurers
-0.6 -0.3 0.0 0.3 0.6 0.9 1.2 1.5
All-property
All-property (residential property excluded)
Offices
0.501.29
-0.520.52
0.691.140.090.68
0.900.930.950.79
Retail0.900.771.190.86
Industrial0.780.481.140.71
Residential0.550.790.410.44
Single-family housing0.060.55
-0.29-0.26
Sub-sector0.220.230.86
-0.04
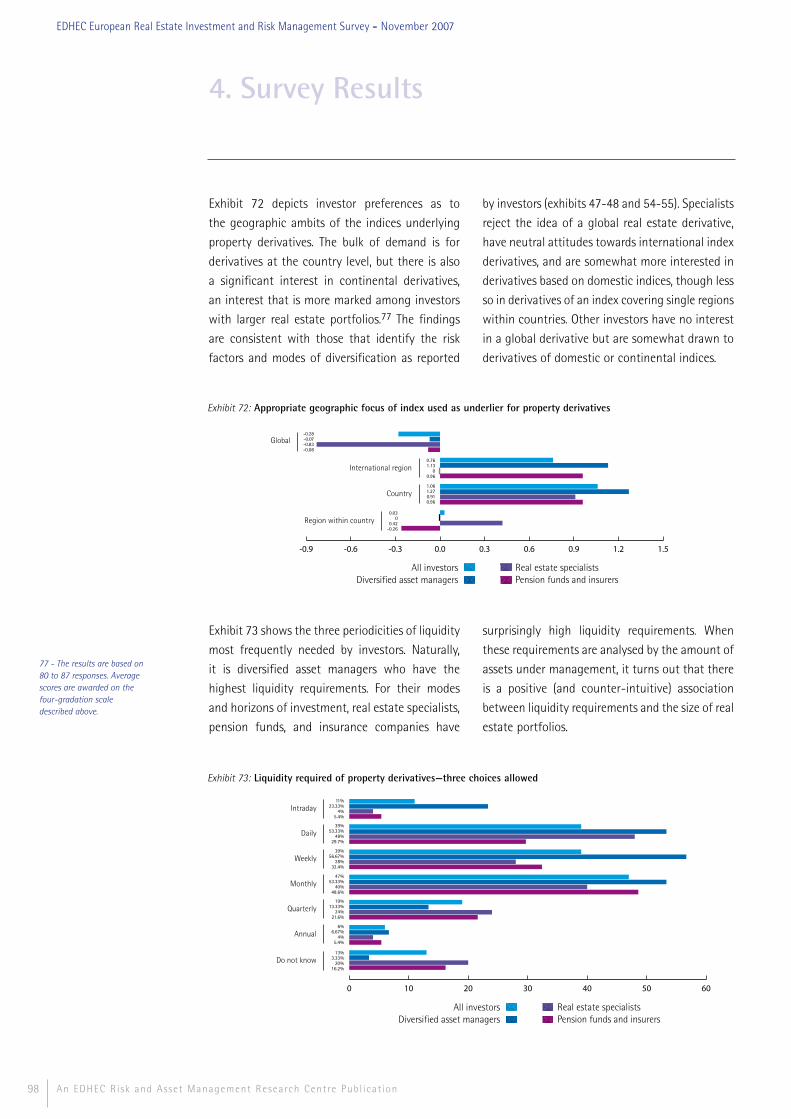
98
Exhibit 72 depicts investor preferences as to
the geographic ambits of the indices underlying
property derivatives. The bulk of demand is for
derivatives at the country level, but there is also
a significant interest in continental derivatives,
an interest that is more marked among investors
with larger real estate portfolios.77 The findings
are consistent with those that identify the risk
factors and modes of diversification as reported
by investors (exhibits 47-48 and 54-55). Specialists
reject the idea of a global real estate derivative,
have neutral attitudes towards international index
derivatives, and are somewhat more interested in
derivatives based on domestic indices, though less
so in derivatives of an index covering single regions
within countries. Other investors have no interest
in a global derivative but are somewhat drawn to
derivatives of domestic or continental indices.
4. Survey Results
An EDHEC Risk and Asset Management Research Centre Publ icat ion
77 - The results are based on 80 to 87 responses. Average scores are awarded on the four-gradation scale described above.
EDHEC European Real Estate Investment and Risk Management Survey - November 2007
Exhibit 73 shows the three periodicities of liquidity
most frequently needed by investors. Naturally,
it is diversified asset managers who have the
highest liquidity requirements. For their modes
and horizons of investment, real estate specialists,
pension funds, and insurance companies have
surprisingly high liquidity requirements. When
these requirements are analysed by the amount of
assets under management, it turns out that there
is a positive (and counter-intuitive) association
between liquidity requirements and the size of real
estate portfolios.
Exhibit 72: Appropriate geographic focus of index used as underlier for property derivatives
-0.9 -0.6 -0.3 0.0 0.3 0.6 0.9 1.2 1.5
Global-0.28-0.07-0.83-0.08
International region0.761.13
00.96
Country1.061.270.910.96
Region within country0.03
00.42
-0.26
All investorsDiversified asset managers
Real estate specialistsPension funds and insurers
Exhibit 73: Liquidity required of property derivatives—three choices allowed
Intraday11%
23.33%4%
5.4%
Daily39%
53.33%48%
29.7%
Weekly39%
56.67%28%
32.4%
Monthly47%
53.33%40%
48.6%
Quarterly19%
13.33%24%
21.6%
Annual6%
6.67%4%
5.4%
Do not know13%
3.33%20%
16.2%
0 10 20 30 40 50 60
All investorsDiversified asset managers
Real estate specialistsPension funds and insurers
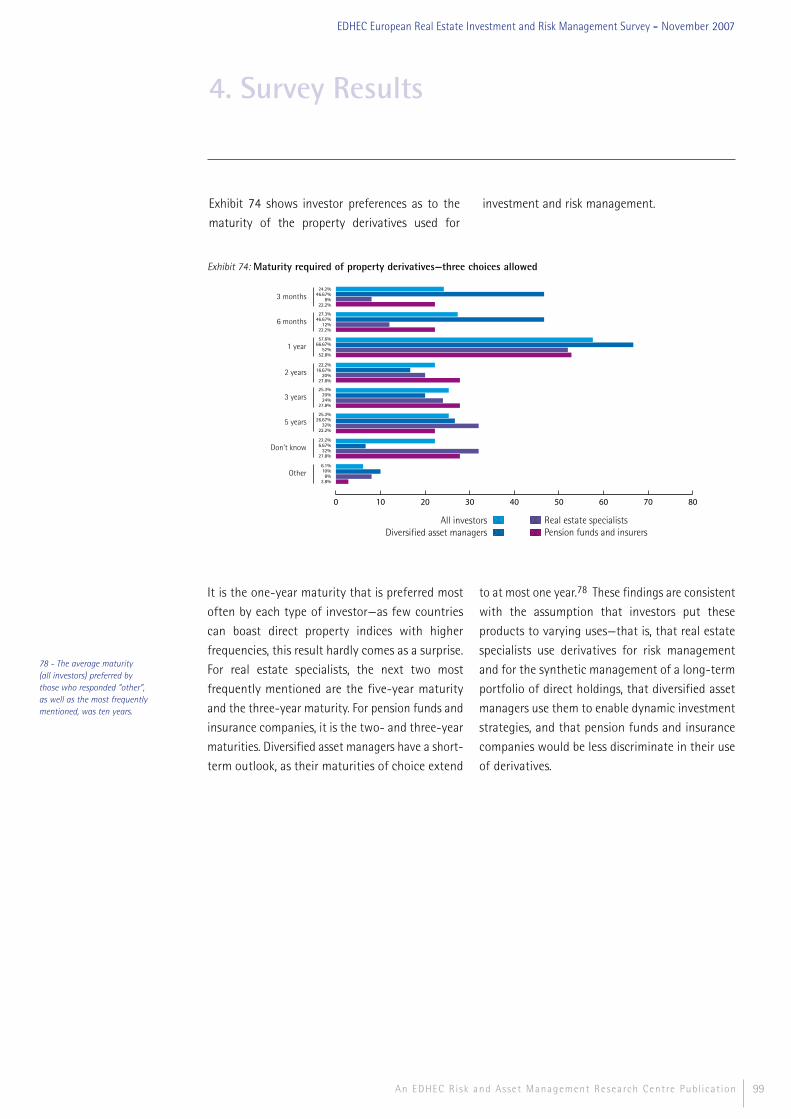
99An EDHEC Risk and Asset Management Research Centre Publ icat ion
EDHEC European Real Estate Investment and Risk Management Survey - November 2007
4. Survey Results
78 - The average maturity (all investors) preferred by those who responded “other”, as well as the most frequently mentioned, was ten years.
Exhibit 74 shows investor preferences as to the
maturity of the property derivatives used for
investment and risk management.
Exhibit 74: Maturity required of property derivatives—three choices allowed
3 months24.2%
46.67%8%
22.2%
6 months27.3%
46.67%12%
22.2%
1 year57.6%
66.67%52%
52.8%
2 years22.2%
16.67%20%
27.8%
3 years25.3%
20%24%
27.8%
5 years25.3%
26.67%32%
22.2%
Don't know22.2%6.67%
32%27.8%
Other6.1%10%8%
2.8%
All investorsDiversified asset managers
Real estate specialistsPension funds and insurers
0 10 20 30 40 50 60 70 80
It is the one-year maturity that is preferred most
often by each type of investor—as few countries
can boast direct property indices with higher
frequencies, this result hardly comes as a surprise.
For real estate specialists, the next two most
frequently mentioned are the five-year maturity
and the three-year maturity. For pension funds and
insurance companies, it is the two- and three-year
maturities. Diversified asset managers have a short-
term outlook, as their maturities of choice extend
to at most one year.78 These findings are consistent
with the assumption that investors put these
products to varying uses—that is, that real estate
specialists use derivatives for risk management
and for the synthetic management of a long-term
portfolio of direct holdings, that diversified asset
managers use them to enable dynamic investment
strategies, and that pension funds and insurance
companies would be less discriminate in their use
of derivatives.

100 An EDHEC Risk and Asset Management Research Centre Publ icat ion
EDHEC European Real Estate Investment and Risk Management Survey - November 2007

Conclusion
101An EDHEC Risk and Asset Management Research Centre Publ icat ion

102
Real estate equity investments are an asset class and investors are open to product innovationReal estate is considered an asset class of its own
by both academics and investors. For most, the
real estate asset class is made up solely of equity
vehicles: direct investment in the underlying
asset, stakes in non-listed vehicles, shares in listed
property firms. Fewer than one in five of those
who respond to our survey exclude listed property
firms from the asset class, and more than two-
thirds include structured products, index-linked
products, and derivatives as part of the class.
More than 60% of the real estate specialists
surveyed—as opposed to less than 30% of other
investors—view real estate debt products as part
of the asset class.
Reasons for allocation to real estate: diversification, performance, and hedgingThe advantages usually mentioned by those who
would invest in real estate are its low volatility,
its high adjusted returns, its superiority as a
hedge against inflation, its high and stable rent
component, and its excellent decorrelation
characteristics; only the two latter advantages
have been clearly documented by academic
research, whereas the usefulness of real estate
for hedging inflation risk has been confirmed
in the specific context of long-term studies and
residential real estate. Diversification of the
overall portfolio is, for the investors surveyed, by
far the major reason for allocation to the asset
class. The draw of high adjusted returns is likewise
a common reason for investment. A third reason,
much less important, is for use as a shield from
inflation. Overall, investors not specialised in real
estate express a secondary interest in alpha, but it
is likely that in less favourable market conditions
this interest would increase substantially.
At 10%, strategic allocations are significant but below those recommended by academic studiesThree-quarters of those responding (not counting
real estate specialists) take an approach to real
estate investments that views real estate as an
asset class of its own; for them, strategic allocation
comes to 9.9% of all assets. Mean-variance asset
management models recommend allocations
of between 15% and 25%. Improved modelling
of the distinctive features of the class and of
investor constraints, as well as the development
of vehicles enabling diversified, liquid, and fine-
grained exposure, will help to narrow the gap
between the allocations recommended and those
actually in use.
The conventional pecking order is maintained; listed and non-listed vehicles for indirect exposure are heavily usedAnalysis of vehicles for allocation to real estate
confirms the marginal role of debt products, the
use of vehicles for equity exposure in accordance
with longstanding conventions, and the still
limited importance of recent offers for structured
products, index-linked products, and derivatives.
Real estate specialists invest three-quarters of their
funds directly in the underlying physical asset—
double what other investors do. Pension funds
and insurance companies follow longstanding
conventions in their equity allocations, making
these allocations first to direct real estate, then to
non-listed vehicles, and finally to listed property
firms. Because of the problems of lumpiness and
diversification affecting the underlying assets,
direct allocation is positively linked to portfolio
size. The role of non-listed vehicles as the closest
proxies for direct investments is confirmed by the
inverse relationship between portfolio size and
allocation to non-listed vehicles. Diversified asset
managers invest more in listed property companies
and in new vehicles than they do in non-listed
funds; these preferences are compatible with
Conclusion
An EDHEC Risk and Asset Management Research Centre Publ icat ion
EDHEC European Real Estate Investment and Risk Management Survey - November 2007

103An EDHEC Risk and Asset Management Research Centre Publ icat ion
EDHEC European Real Estate Investment and Risk Management Survey - November 2007
dynamic management of real estate exposure
founded on liquid, flexible, and low-cost vehicles.
Investors seek absolute returns but use relative return measures as wellWhen it comes to gauging the performance of
real estate investments, four-fifths of real estate
specialists and one-half of other investors report
that they first set a nominal or real absolute return
objective. Nonetheless, more than two-thirds of
respondents use relative return approaches as a
primary or secondary measure of the performance
of their real estate investments.
Specific factors are the primary sources of risk and return in real estate, but property type and geography also play a roleThe performance of a real estate investment
is linked to factors specific to the property and
to the terms under which it is leased as well as
to systematic factors that affect yields with a
swiftness and intensity that vary depending on
property type and on local conditions.
The sources of systematic risk identified in the
literature are real growth, employment, interest
rates, and inflation rates. The investors surveyed
believe that there is a clear positive correlation
of real estate returns and GDP growth, a positive
correlation with employment and inflation, and—
less clearly—a negative correlation with interest
rates.
As has been shown by academic studies, the
importance of specific risk is greater in real
estate than in other asset classes. The investors
responding to the survey view idiosyncratic risks as
the main forces behind the returns on real estate
investments. Non-specialists identify property-
type and geographic exposure as significant
dimensions of risk as well.
Diversification is deemed the best approach to risk management; it implies intermediationDiversification appears to be the sole risk
management approach appropriate for real estate
specialists; for other investors, it is the most useful,
ahead of allocation limitations. Risk management
with the help of structured products or derivatives
is deemed largely irrelevant.
For investors as well as academics, the two major
types of diversification are by property type and
by geography.
95% diversification of specific risk is most likely
impossible through direct investment, as it
would require, on average, investing in several
hundred properties. This finding supports a vision
of direct investment centred on the selection
and management of a portfolio of relatively
few properties or, for strategies involving
diversification, heavy reliance on intermediation.
Index-based solutions show potential as vehicles for investment and diversificationIn essence, the major reasons for investment in
real estate reveal demand for beta that index-
linked products are in a good position to meet.
Likewise, the risks identified lend themselves to
diversification that index-based solutions would
deliver in optimal conditions. For direct real estate,
in particular, access to indices would facilitate
diversification that would be impossible in the
physical market. As passive vehicles, representative
of property-type and geographic risks, index-based
solutions would be unrivalled strategic allocation
vehicles; if these pure beta products were also
liquid and had low transaction costs, they would
allow the deployment of alpha-generating tactical
and arbitrage allocation strategies.
Conclusion

104
The relative return measures of real estate
investments used in the first instance by a third of
investors and in the second by two-thirds, as well
as the fact that two-thirds of investors believe
that an investable European real estate index (or
derivative thereof) is the best means of diversifying
the portfolio of an institutional investor with a
strong home bias, attest to the market potential
of these solutions.
Investors are aware of the possible uses of property derivatives, but only one in five has short-term plans to use themDerivatives of real estate indices allow investors to
take or modify positions with potentially greater
efficiency—in terms of liquidity, cost, granularity,
swiftness, or flexibility—than in the underlying
physical market; for direct real estate, then, where
benchmark indices are neither investable nor
easily replicable, they are particularly interesting.
Real estate derivatives can be used for investment
and diversification, to take advantage of price
differentials between markets and segments, to
bet on falling markets, for leverage, and, possibly,
for hedging and synthetic portfolio management.
Three potential uses are clearly recognised by
investors: hedging, synthetic portfolio rebalancing,
and synthetic investment. Unfortunately, with
direct real estate, hedging and synthetic portfolio
rebalancing are only partly efficient, as portfolios,
for want of diversification, are but slightly
correlated with indices.
81% of the investors responding to the survey
have no plans to use real estate derivatives in
the near future. Interest in derivatives is less
pronounced among real estate specialists, but is
greater among those with larger portfolios. The
major obstacles to the use of derivatives are a lack
of familiarity with the products, the unsuitability
of the products, and the investment policies in the
respondent organisations.
The key success factors of real estate derivatives are index quality and contract liquidityFor investors, the primary demand is for the
transparency of the index used as an underlier
for derivatives contracts. They also believe that
its representativity is very important, somewhat
more so than its breadth. They are unanimous in
their outright rejection of indices based on surveys
of real estate agents and, overall, they express
a preference for constant-quality transactions-
based indices.
Their primary demand of the market, far ahead of
demand for effective hedges, cost reductions, and
the presence of a central counterparty to reduce
risk, is for contract liquidity.
The ideal real estate derivative is a medium-term
and highly liquid forward contract on the total
return of a national or international commercial
real estate index of all property or of a single
property type.
Conclusion
An EDHEC Risk and Asset Management Research Centre Publ icat ion
EDHEC European Real Estate Investment and Risk Management Survey - November 2007

Appendices
105An EDHEC Risk and Asset Management Research Centre Publ icat ion
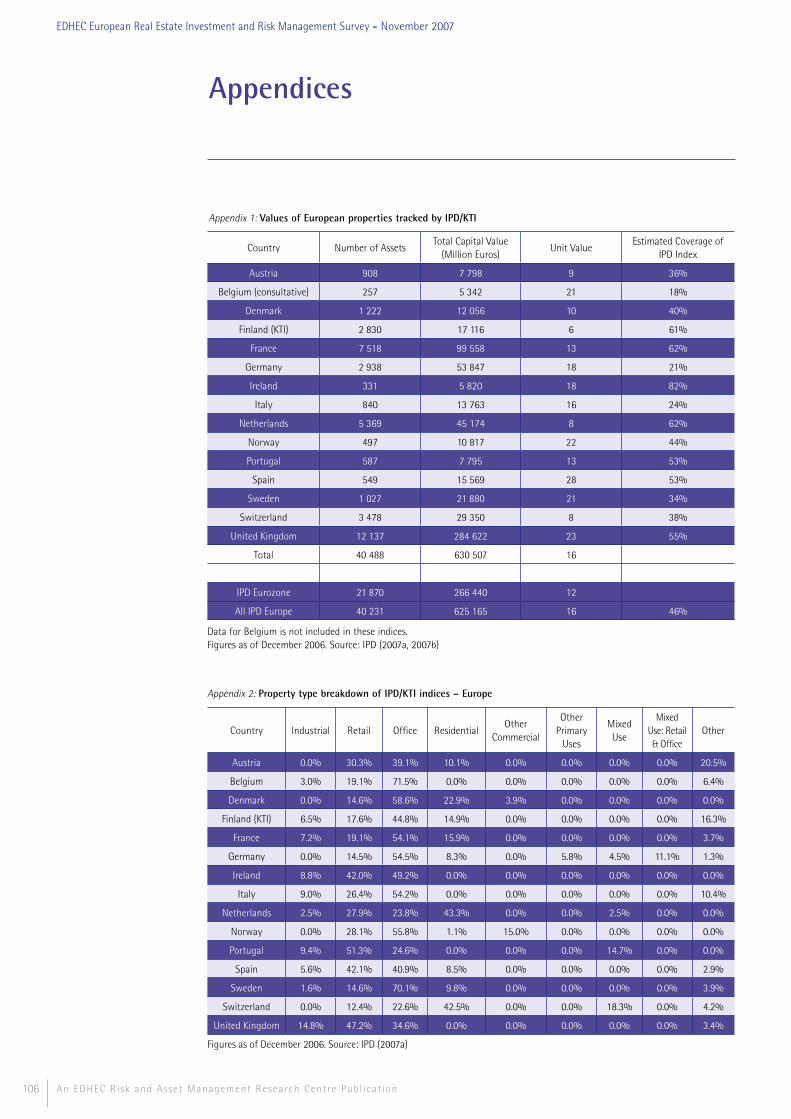
106
Appendix 1: Values of European properties tracked by IPD/KTI
Appendices
An EDHEC Risk and Asset Management Research Centre Publ icat ion
EDHEC European Real Estate Investment and Risk Management Survey - November 2007
Country Number of AssetsTotal Capital Value
(Million Euros)Unit Value
Estimated Coverage of IPD Index
Austria 908 7 798 9 36%
Belgium (consultative) 257 5 342 21 18%
Denmark 1 222 12 056 10 40%
Finland (KTI) 2 830 17 116 6 61%
France 7 518 99 558 13 62%
Germany 2 938 53 847 18 21%
Ireland 331 5 820 18 82%
Italy 840 13 763 16 24%
Netherlands 5 369 45 174 8 62%
Norway 497 10 817 22 44%
Portugal 587 7 795 13 53%
Spain 549 15 569 28 53%
Sweden 1 027 21 880 21 34%
Switzerland 3 478 29 350 8 38%
United Kingdom 12 137 284 622 23 55%
Total 40 488 630 507 16
IPD Eurozone 21 870 266 440 12
All IPD Europe 40 231 625 165 16 46%
Data for Belgium is not included in these indices.Figures as of December 2006. Source: IPD (2007a, 2007b)
Appendix 2: Property type breakdown of IPD/KTI indices – Europe
Country Industrial Retail Office ResidentialOther
Commercial
Other Primary
Uses
Mixed Use
Mixed Use: Retail & Office
Other
Austria 0.0% 30.3% 39.1% 10.1% 0.0% 0.0% 0.0% 0.0% 20.5%
Belgium 3.0% 19.1% 71.5% 0.0% 0.0% 0.0% 0.0% 0.0% 6.4%
Denmark 0.0% 14.6% 58.6% 22.9% 3.9% 0.0% 0.0% 0.0% 0.0%
Finland (KTI) 6.5% 17.6% 44.8% 14.9% 0.0% 0.0% 0.0% 0.0% 16.3%
France 7.2% 19.1% 54.1% 15.9% 0.0% 0.0% 0.0% 0.0% 3.7%
Germany 0.0% 14.5% 54.5% 8.3% 0.0% 5.8% 4.5% 11.1% 1.3%
Ireland 8.8% 42.0% 49.2% 0.0% 0.0% 0.0% 0.0% 0.0% 0.0%
Italy 9.0% 26.4% 54.2% 0.0% 0.0% 0.0% 0.0% 0.0% 10.4%
Netherlands 2.5% 27.9% 23.8% 43.3% 0.0% 0.0% 2.5% 0.0% 0.0%
Norway 0.0% 28.1% 55.8% 1.1% 15.0% 0.0% 0.0% 0.0% 0.0%
Portugal 9.4% 51.3% 24.6% 0.0% 0.0% 0.0% 14.7% 0.0% 0.0%
Spain 5.6% 42.1% 40.9% 8.5% 0.0% 0.0% 0.0% 0.0% 2.9%
Sweden 1.6% 14.6% 70.1% 9.8% 0.0% 0.0% 0.0% 0.0% 3.9%
Switzerland 0.0% 12.4% 22.6% 42.5% 0.0% 0.0% 18.3% 0.0% 4.2%
United Kingdom 14.8% 47.2% 34.6% 0.0% 0.0% 0.0% 0.0% 0.0% 3.4%
Figures as of December 2006. Source: IPD (2007a)

107An EDHEC Risk and Asset Management Research Centre Publ icat ion
EDHEC European Real Estate Investment and Risk Management Survey - November 2007
Appendices
Appendix 3: Estimated size of institutional real estate investment market in countries tracked by IPD/KTI indices – Europe
Market sizes estimated at end of 2006, Source: IPD (2007a, 2007b)
Country EUR bn Share of total
Austria 22 1.60%
Belgium 30 2.10%
Denmark 30 2.10%
Finland 28 2.00%
France 160 11.50%
Germany 251 18.10%
Ireland 7 0.50%
Italy 58 4.20%
Netherlands 73 5.20%
Norway 24 1.80%
Portugal 15 1.10%
Spain 29 2.10%
Sweden 64 4.60%
Switzerland 78 5.60%
United Kingdom 521 37.50%
1 389
Appendix 4: Typology of European private property vehicles – overriding legal structures and characteristics
Open or closed
Listed or non-listed
Retail or institutional
Vehicle types
Corporate Both Both BothInvestment companies e.g. Luxembourg SICAFs/SICAVs.
Regular companies e.g. Dutch BVs/NVs.
Partnership Closed Non-listed Institutional Limited partnerships e.g. LP (UK), SC (France), CV (Netherlands).
Contractual Both Both BothLuxembourg FCPs, Dutch FGRs, UK Managed Funds,
German Spezialfonds
Trust Both Non-listed Both UK Property Unit Trusts
After OPC (2004)
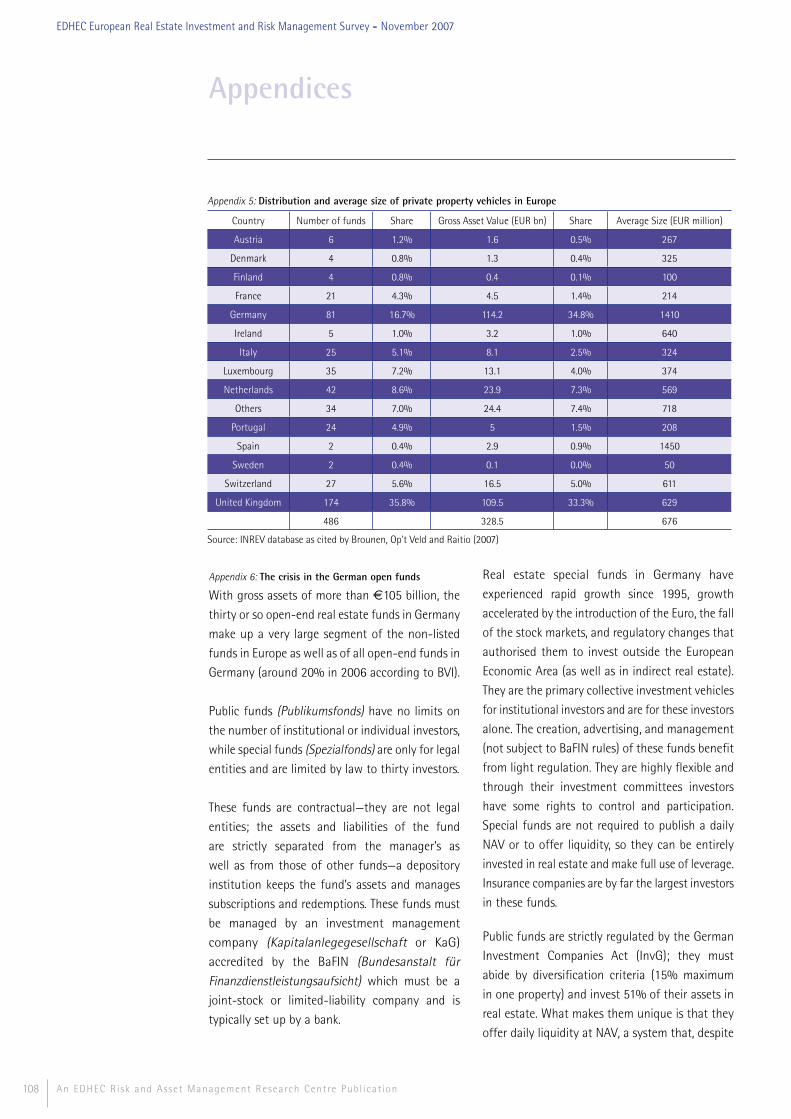
108
Appendix 6: The crisis in the German open funds
With gross assets of more than €105 billion, the
thirty or so open-end real estate funds in Germany
make up a very large segment of the non-listed
funds in Europe as well as of all open-end funds in
Germany (around 20% in 2006 according to BVI).
Public funds (Publikumsfonds) have no limits on
the number of institutional or individual investors,
while special funds (Spezialfonds) are only for legal
entities and are limited by law to thirty investors.
These funds are contractual—they are not legal
entities; the assets and liabilities of the fund
are strictly separated from the manager’s as
well as from those of other funds—a depository
institution keeps the fund’s assets and manages
subscriptions and redemptions. These funds must
be managed by an investment management
company (Kapitalanlegegesellschaft or KaG)
accredited by the BaFIN (Bundesanstalt für Finanzdienstleistungsaufsicht) which must be a
joint-stock or limited-liability company and is
typically set up by a bank.
Real estate special funds in Germany have
experienced rapid growth since 1995, growth
accelerated by the introduction of the Euro, the fall
of the stock markets, and regulatory changes that
authorised them to invest outside the European
Economic Area (as well as in indirect real estate).
They are the primary collective investment vehicles
for institutional investors and are for these investors
alone. The creation, advertising, and management
(not subject to BaFIN rules) of these funds benefit
from light regulation. They are highly flexible and
through their investment committees investors
have some rights to control and participation.
Special funds are not required to publish a daily
NAV or to offer liquidity, so they can be entirely
invested in real estate and make full use of leverage.
Insurance companies are by far the largest investors
in these funds.
Public funds are strictly regulated by the German
Investment Companies Act (InvG); they must
abide by diversification criteria (15% maximum
in one property) and invest 51% of their assets in
real estate. What makes them unique is that they
offer daily liquidity at NAV, a system that, despite
Appendices
An EDHEC Risk and Asset Management Research Centre Publ icat ion
EDHEC European Real Estate Investment and Risk Management Survey - November 2007
Appendix 5: Distribution and average size of private property vehicles in Europe
Country Number of funds Share Gross Asset Value (EUR bn) Share Average Size (EUR million)
Austria 6 1.2% 1.6 0.5% 267
Denmark 4 0.8% 1.3 0.4% 325
Finland 4 0.8% 0.4 0.1% 100
France 21 4.3% 4.5 1.4% 214
Germany 81 16.7% 114.2 34.8% 1410
Ireland 5 1.0% 3.2 1.0% 640
Italy 25 5.1% 8.1 2.5% 324
Luxembourg 35 7.2% 13.1 4.0% 374
Netherlands 42 8.6% 23.9 7.3% 569
Others 34 7.0% 24.4 7.4% 718
Portugal 24 4.9% 5 1.5% 208
Spain 2 0.4% 2.9 0.9% 1450
Sweden 2 0.4% 0.1 0.0% 50
Switzerland 27 5.6% 16.5 5.0% 611
United Kingdom 174 35.8% 109.5 33.3% 629
486 328.5 676
Source: INREV database as cited by Brounen, Op't Veld and Raitio (2007)

109An EDHEC Risk and Asset Management Research Centre Publ icat ion
EDHEC European Real Estate Investment and Risk Management Survey - November 2007
the eminently illiquid character of the underlying
assets, worked without a major hitch1 from 1959
until late 2005.2 To prevent crises, the law requires
that public funds hold at least 5% of their assets
in cash and that leverage not exceed 50% of the
value of real estate assets held. In practice, open
funds hold high percentages of their assets in
cash, rising from slightly more than 20% to nearly
50%, depending on the year. The law also allows
suspension of redemptions for up to two years in
the event of a liquidity crisis.
Subscription fees may play a role in limiting
arbitrage opportunities. Another stabilising element
is the requirement for an independent appraisal
of each property on the anniversary of the date
of acquisition rather than at a single set date: the
impact of changes in the value of the underlying
assets is thus spread out over the year, reducing
spikes—which may precipitate a rush for the door, if
the consensus is that they will be negative—without
entirely eliminating arbitrage opportunities. It
should be noted that the mere expectation of
large numbers of redemptions can set off a crisis,
as investors may wonder about the ability of the
fund to meet liquidity requirements.
Bannier, Fecht, and Tyrell (2006) note that public
funds drew institutional investors en masse after the
stock market crash at the start of the decade and
that—in an environment of low short-term interest
rates—these funds were used as an alternative to
money-market funds, as institutional investors
were exempted from the subscription fees. This
change afforded greater opportunities for arbitrage
and led to a reduction in the average length of
time for which shares in the fund were held, the
consumption of its cash cushion, complications
with liquidity transformation, and, finally, a greater
likelihood of crisis.
The low returns on German real estate in 2004/2005
caused large capital outflows that forced the banks
associated with investment management companies
to step in as liquidity providers (DekaBank,
HvB, Commerzbank). The crisis was sparked by
Deutsche Bank’s December 2005 announcement
of an unscheduled re-evaluation—downward, in
all probability—of its Grundbesitz Invest fund.
The ensuing flow of withdrawals absorbed most
of the fund’s liquidity reserves and forced the
bank—which did not want to provide liquidity—to
suspend transactions until further notice. This
announcement triggered a crisis of confidence of
unprecedented severity that from December 2005
to February 2006 resulted in the redemption of
10% of the assets under management in the real
estate funds sector. Several banks, unlike Deutsche
Bank, announced that they would provide liquidity.
KanAM, an independent, had no such patrons and
had to close its two funds after heavy withdrawals
triggered by the publication of a negative (and
contested) research note. The Deutsche Bank fund
reopened on 1 March at only 2.4% below its last
published value; the main KanAM fund reopened
on 31 March only to suspend issues of new shares
in May as a result of excessive demand.
Redemptions are not the only problems posed
by open-end real estate funds: high subscription
volumes cause capacity problems—cash reserves
may serve as a cushion, but investment restrictions
can then force managers to acquire assets with
limited potential for value creation; it is likely that
the problems in Germany were caused in part by
the massive inflows of capital as of 2001. In this
respect, KanAM’s May 2006 decision was certainly
the right one.
Appendices
1 - In 1993 the AGI no. 1 fund had to be closed and then merged with another fund as a result of excessive redemptions. 2 - According to Bannier, Fecht, and Tyrell (2006), the limits of the system were seen in the Netherlands with the Rodamco crisis in 1990 (the bank was forced to close the fund, then list it on the stock market), in Australia the same year (the government imposed a twelve-month suspension of redemptions on the entire industry and made all funds list on the stock exchange), and in Switzerland in 1991 (rule modification that required twelve-month notice for redemption).

110
REIT precursorsThe Massachusetts Trust, the first American form
of real estate investment trust, appeared in the
nineteenth century. It was a limited liability
trust with transferable shares allowing passive
investment in real estate. The trust itself was
exempt from corporate income tax as long as it
distributed its profits; investors on the receiving
end of these distributions were exempt from
taxation of rents. These exemptions remained
in force until 1935. Real estate trusts were then
subject to double taxation until 1960, when the
law that authorised real estate investment trusts
(REITs) established their fiscal transparency.
The first boom and the first bust In the late 1960’s and the early 1970’s,
spurred by financial institutions, REITs grew
uncontrollably and lent excessively to builders
and developers—the building boom resulted
in mass defaults after the first oil shock.3 In
two years (1973-1974), the capitalisation
of REITs fell by 62% and many lending
REITs disappeared, but equity REITs survived.4
1972 levels of capitalisation were not matched
until 19805 and lending REITs never recovered
their importance. Recovery was slow: in the early
1980’s the assets held by REITs amounted to only
a third of those that they held at their peak.
The impact of the tax reform act of 1986For years, REITs limped along in the United
States—the tax reform act of 1986 authorised
REITs to operate their properties directly, whereas
until then they had been confined to a passive
role and had to use independent contractors to
advise them and to operate their properties, an
obligation that led to higher costs and conflicts
of interest.
This reform accorded REITs greater autonomy and
helped attract real estate developers, who quickly
became the main investors in these trusts. That
limited partnerships lost their preferential tax
treatment, that the refinancing needs of these
partnerships were high (many of the loans in the
latter half of the 1980’s were medium term, and
for many partnerships the choice was simple: IPO
or bankruptcy), and that the prices of assets were
often lower than replacement costs (between
1989 and 1991 the country suffered its worst
real estate crisis since the Great Depression)
accounted for the development of REITs.
Institutionalisation of the REITs market in the 1990’s—“the modern REIT era”In 1991, the successful IPO of Kimco Realty
Corporation (which drew some institutional
investors and whose share price, unlike that of
most REITs, did not fall below the introduction
price) and the capitalisation of $1 billion
achieved by New Plan mark the beginning of
the return of REITs to the stock market (NAREIT
(2005)). According to Rosen (1995), it is the dawn
of the “modern REIT era” and the companies
listed on the stock market in the first great wave
of the 1990’s are radically different from older
REITs insofar as they have institutional-quality
portfolios and large capitalisations (Rosen, Torres,
Anderson (2002)).6
The new development of REITs was greatly
facilitated by the Taubman Centers’ 1992
invention of the UPREIT. UPREITs and DOWNREITs
enable the owners of real estate to exchange
their properties for shares in a partnership
controlled by the REIT and to defer payment
of capital-gains taxes until the shares in the
partnership are transformed into REIT shares
or until the assets are transferred.7
In 1993, an amendment was made to the rule
for the counting of investors (the 5/50 rule)
that eliminated a major obstacle to pension
fund investment in REITs.8 The participation
of institutional investors in REIT stock market
listings grew over the 1990’s.9
Appendices
An EDHEC Risk and Asset Management Research Centre Publ icat ion
3 - Long-term loans were financed with cheap short-term debt—cheap until the oil shock, that is. 4 - According to Nossiter (1982) cited in Chan, Erickson, and Wang (2002), the total number of REITs fell by half between 1972 and 1982.5 - Source: NAREIT at http://www.nareit.com/library/industry/marketcap.cfm6 - Wang, Chan, and Gau (1992) document the negative performance of REIT listings in the 1970’s and 1980’s. Ling and Ryngaert (1997), by contrast, show that listings in the early 1990’s generated positive returns in the short term. These findings are consistent with those of Buttimer, Hyland, and Sanders (2005), who study three waves of stock market listings in the 1980’s and 1990’s: 1985, 1993-1994, and 1997-1998. In the 1980’s, or in 1985, the IPO return is negative but not significant. For the two waves in the 1990’s, returns are positive and significant—the annual results for the decade, with the exceptions of 1993, 1994, and 1997, are positive but not significant. 7 - An umbrella partnership REIT has two components: the REIT and the operating partnership. The owners of properties exchange their assets for shares in the operating partnership—this exchange is deemed not subject to taxation under the tax deferral rules spelled out in section 731 of the internal revenue code. The REIT sells its shares and uses the product of the sale to gain control of the operating partnership—it is then called an UPREIT. In an UPREIT, all transactions take place within the operating partnership, but a DOWNREIT, a joint venture between the REIT and the contributing owners, can own shares in several operating partnerships. The number of UPREITs grew rapidly; by late 1999 more than half of listed REITs were UPREITs.
EDHEC European Real Estate Investment and Risk Management Survey - November 2007
Appendix 7: History of REITs in the United States

111An EDHEC Risk and Asset Management Research Centre Publ icat ion
EDHEC European Real Estate Investment and Risk Management Survey - November 2007
Chan, Erickson, and Wang (2002) note that
another significant change in the early 1990’s
was the increase in the number of REITs
specialised in a particular property type; they
believe that specialisation should allow greater
management efficiency and profitability.
The real estate investment trust simplification act of 1997 (REITSA) allowed REITs to provide some ancillary services to tenants without running the risk of income re-qualification and it did away with the limit on the share of profits that can be generated by short-term capital gains (previously 30%). It also authorised timber REITs. That same year, the treasury department modified its stance on fiscal agreements and allowed most non-resident investors to qualify for the reduced rate of 15% on REIT ordinary dividends—bilateral agreements had eliminated these withholdings by 2003.
A new wave of REIT listings took place in 1997-1998; institutional investors were active participants.
Recent changesThe REIT modernisation act of 1999 (REITMA) allowed REITs to create taxable REIT subsidiaries (TRS) that could provide tenant services without risking the loss of the tax benefits accorded rents received by REITs—the law does include some limits to ensure that REITs remain focused on owning and managing real estate, but—with respect to the advances of 1997—it also allows a considerable expansion in the array of services REITs can offer.
The REIT improvement act of 2003 (RIA) brought the previously discriminatory treatment of foreign shareholders in line with the treatment of foreign shareholders in other publicly traded U.S. companies and it allowed trusts in violation of REIT rules to correct their mistakes and to pay fines rather than lose their REIT status.
These reforms authorised REITs to have small shares of non-qualifying assets and income (services to tenants, property development, and so on) through taxable subsidiaries. These changes give REITs more flexibility and allow them to meet some of their needs without having to resort to independent contractors.
In 2003, several large 401(k) and 403(b) plans (employer-sponsored individual retirement plans) announced that they would offer the possibility to invest in REITs—for retirement plans, the real estate option has since grown very quickly.
Since the beginning of the decade, the number of listed REITs has been relatively stable,10 with new IPOs compensating for mergers and acquisitions. As a result of concentration and rising markets, the average capitalisation of REITs has grown significantly, growth that adds to economies of scale (and thus to performance), increases liquidity, and makes REITs more visible to the community of analysts—these factors have contributed to the growing institutionalisation of the market. In mid-2007, there were fourteen REITs in the S&P500 (large caps), fourteen in the S&P400 (mid caps), and sixteen in the S&P600 (small caps).
Recently, going private transactions have accounted for the bulk of mergers and acquisitions activity involving listed REITs —the arguments for these delistings are the same as for those in other industries, but the perception that in the United States REITs are traded at a discount to the value of their assets has played a key role. Arbitrage naturally led to higher share prices for REITs and a reduction of the discount. The pace of mergers and acquisitions and of delisting picked up in 2006, causing the number of listed REITs to fall by nearly 10%.
Appendices
8 - The rule made it illegal for a majority of the shares (50%) to be in the hands of fewer than five investors. For the purposes of the 5/50 rule, pension funds are counted not as a single investor, but by the number of investors in the pension fund—this major amendment was part of the Omnibus Budget Reconciliation Act. 9 - Ling and Ryngaert (1997) as well as Wang, Erickson, Gau, and Chan (1995) show that the participation of institutional investors and the short-term profitability of REIT listings are correlated. Downs (1998) shows that the change to the 5/50 rule has added value to the industry and that the REITs that attract more institutional investment have better stock market records. Crain, Cudd, and Brown (2000) note that the non-systematic risk listed REITs are subject to decreases—with respect to other forms of risk—as institutional investments increase.10 - 189 in late 2000 as opposed to 183 in late 2006. In late 2003 there was a low of 173 and in late 2005 a high of 197—source: NAREIT, http://www.nareit.com/library/industry/marketcap.cfm

112
Appendix 8: Main features of REIT regimes in Europe
Appendices
An EDHEC Risk and Asset Management Research Centre Publ icat ion
EDHEC European Real Estate Investment and Risk Management Survey - November 2007
German REIT French SIIC Dutch FBI UK REIT Italian SIIQ
Legal form
AG (stock corporation) with seat and management in Germany and obligatory listing within EU/EEA.
Any company with a share capital divided into shares.Additional restrictions (not applying to SIIC sub of a SIIC): i) listing in France and ii) minimum share capital of €15 million.
NV, BV (limited liability company) or FGR (mutual fund) or a comparable entity within the EU.
Closed ended company, listed on a “recognised” exchange.
Joint Stock Company (Società per Azioni), listed on Italian stock exchange.Company’s name must include the words “Società d’Investimento Immobiliare Quotata”. Minimum share capital of €40 million.
Investors’ requirements
No investor must hold more than 10% of voting rights. At least 15% of shares must be held by investors who own less than 3% of voting rights.
No investor or affiliated group of investors may own more than 60%.Upon election for SIIC regime 15% of the shares owned by investors with max 2% interest.
Various shareholders’ restrictions apply for tax purposes. Simplified restriction apply for listed FBIs.
Must not be a “close” company.
No investor must hold more than 51% of voting rights. At least 35% of shares must be held by investors owning not more than 1% of voting and dividends rights.
Activity test
At least 75% of the assets must comprise real estate which meets the qualifying criteria and at least 75% of gross income must come from letting such real state assets. Prohibition of real estate trading (= turnover of more than 50% of average real estate holdings within a 5 year period).
(French) real estate; non qualifying activities are allowed to a certain extent, however subject to standard CIT rate.
Only passive investments; project development for own portfolio within a taxable FBI subsidiary.
Must have at least 75% of its income and assets in qualifying profit rental business (‘PRB’).Development is permitted for investment purposes.Owner occupied property does not count as PRB.
At least 80% of assets and income must be comprised of real estate.
Leverage limits
55% of real estate value.
No specific leverage restrictions (however, regular thin capitalisation restrictions impact level of distribution obligations).
60% of fiscal book value properties; 20% for all other investments.
No restriction, but tax charge if finance cover is less than a ratio of 1.25.
No specific restrictions yet (however limitations may be introduced by regulatory provisions).
Distribution obligation
At least 90% of net annual income. 50% of capital gains included.
85% of the net rental income, 50% of capital gains and 100% of dividends from lower-tier SIIC subsidiaries.
Applicable to full profit; however, capital gains neutralised in tax free reserves.
90% of income profits of PRB (after deducting finance costs and capital allowances). No obligation to distribute capital gains.
At least 85% of income of real estate. Tax exemption for capital gain not (yet) implemented.

113An EDHEC Risk and Asset Management Research Centre Publ icat ion
EDHEC European Real Estate Investment and Risk Management Survey - November 2007
German REIT French SIIC Dutch FBI UK REIT Italian SIIQ
Tax treatment fund
Full exemption from corporate income tax as well as local trade tax.
Exempt from CIT with respect to qualifying income; regular CIT treatment with respect to non-qualifying income. Additional 20% levy on distributions to 10% or more exempt/low taxed shareholders.
Corporate income tax at a rate of 0%. Capital gains may be added to a tax free reinvestment reserve.
Qualifying income and gains of PRB (UK and indirectly held non-UK) are tax exempt. Charge on development if sold within a 3 year period.Residual business taxed in usual way. Tax charge in REIT if distribution made to corporate shareholder holding 10% or more.
Exempt from CIT with respect to income derived from rental or leasing activities. Regular CIT treatment with respect to capital gains.
Treaty application
As the G-REIT is subject to corporate income tax (although at a rate of 0%), in general, the G-REIT can make use of bilateral tax treaties.
In general a SIIC can make use of bilateral tax treaties.
As the FBI is subject to corporate income tax (although at a rate of 0%), in general, the FBI can make use of bilateral tax treaties.
Treaties should apply in the usual way, as REIT is taxable.
Whether the treaty relief and the Parent Subsidiary Directive apply is not clear.
Withholding tax treatment
Dividend distributions are subject to 25% withholding tax (reduced to 15 or 10% under tax treaties).
25% to non-resident shareholders and 0% to resident shareholders (see also extra levy above).
Dividend distributions are subject to 15% withholding tax. Distributions from the reinvestment reserve can be made free from dividend withholding tax.
22% withholding, subject to treaty relief.
20% withholding tax on tax-exempt income, can be reduced to 15% at dividends originating from residential building leases. A credit for corporate and business shareholders.
Conversion charge regime
Until December 31, 2009 only 50% of capital gains which are realised through conversion into G-REIT or a transfer of real estate to a G-REIT are taxable (‘exit tax privilege’), subject to restrictions.
Latent capital gains are taxed at 16.5% upon election for the regime. Same rate applies to capital gains on sales of properties by standard corporations to SIICs (holding period of 5 years). Reduced rate to sellers extended to December 2008.
No special favourable regime.
Charge of 2% on market value (to allow a step-up in base).
Latent capital gains are taxed at a 20% rate upon selection for the regime.Same rate applies to capital gains realised by corporate shareholders contributing property to SIIQs (three years holding period).
Appendices
Source: Loyens & Loeff (2007)
Appendix 9: Unsmoothing appraisal-based indices
Unsmoothing procedures are rooted in the
assumption that appraisals represent moving
averages of contemporaneous and lagged
information. The extent to which contemporaneous
information is impounded into appraisals and the
level of seasonality are either posited or estimated
empirically, which then allows extraction of the
unsmoothed contemporaneous component from
reported index values.
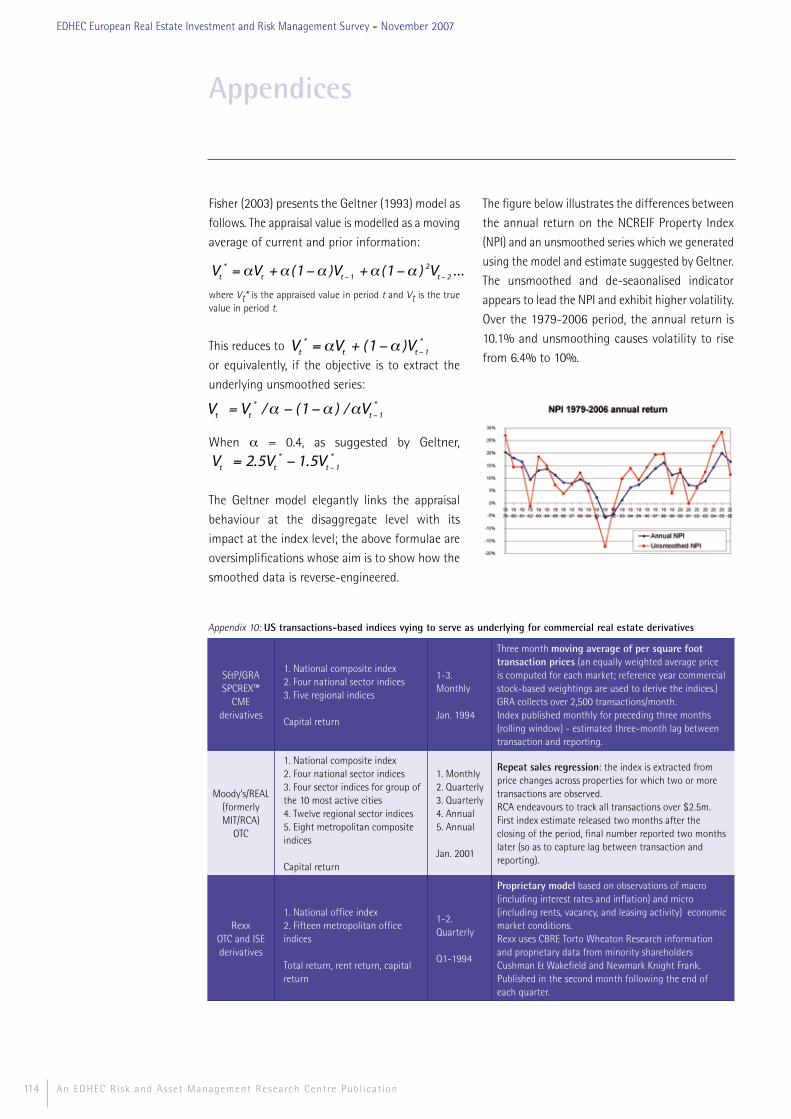
114
Fisher (2003) presents the Geltner (1993) model as
follows. The appraisal value is modelled as a moving
average of current and prior information:
Vt
* = αVt + α (1 − α )Vt − 1 + α (1 − α ) 2Vt − 2 ...where Vt* is the appraised value in period t and Vt is the true value in period t.
This reduces to Vt* = αVt + (1 − α )Vt − 1
*
or equivalently, if the objective is to extract the
underlying unsmoothed series:
Vt = Vt* /α − (1 − α ) /αVt − 1
*
When α = 0.4, as suggested by Geltner,
Vt = 2.5Vt* − 1.5Vt − 1
*
The Geltner model elegantly links the appraisal
behaviour at the disaggregate level with its
impact at the index level; the above formulae are
oversimplifications whose aim is to show how the
smoothed data is reverse-engineered.
The figure below illustrates the differences between
the annual return on the NCREIF Property Index
(NPI) and an unsmoothed series which we generated
using the model and estimate suggested by Geltner.
The unsmoothed and de-seaonalised indicator
appears to lead the NPI and exhibit higher volatility.
Over the 1979-2006 period, the annual return is
10.1% and unsmoothing causes volatility to rise
from 6.4% to 10%.
Appendices
An EDHEC Risk and Asset Management Research Centre Publ icat ion
EDHEC European Real Estate Investment and Risk Management Survey - November 2007
Appendix 10: US transactions-based indices vying to serve as underlying for commercial real estate derivatives
S&P/GRASPCREX™
CME derivatives
1. National composite index2. Four national sector indices3. Five regional indices
Capital return
1-3. Monthly
Jan. 1994
Three month moving average of per square foot transaction prices (an equally weighted average price is computed for each market; reference year commercial stock-based weightings are used to derive the indices.)GRA collects over 2,500 transactions/month.Index published monthly for preceding three months (rolling window) - estimated three-month lag between transaction and reporting.
Moody’s/REAL (formerly MIT/RCA)
OTC
1. National composite index2. Four national sector indices3. Four sector indices for group of the 10 most active cities4. Twelve regional sector indices5. Eight metropolitan composite indices
Capital return
1. Monthly2. Quarterly3. Quarterly4. Annual5. Annual
Jan. 2001
Repeat sales regression: the index is extracted from price changes across properties for which two or more transactions are observed.RCA endeavours to track all transactions over $2.5m.First index estimate released two months after the closing of the period, final number reported two months later (so as to capture lag between transaction and reporting).
RexxOTC and ISE derivatives
1. National office index2. Fifteen metropolitan office indices
Total return, rent return, capital return
1-2. Quarterly
Q1-1994
Proprietary model based on observations of macro (including interest rates and inflation) and micro (including rents, vacancy, and leasing activity) economic market conditions.Rexx uses CBRE Torto Wheaton Research information and proprietary data from minority shareholders Cushman & Wakefield and Newmark Knight Frank. Published in the second month following the end of each quarter.

References
115An EDHEC Risk and Asset Management Research Centre Publ icat ion
116
• Andrew, M., S. Devaney, and S. Lee. 2003. Another look at the relative importance of sectors and regions
in determining property returns. Working papers in real estate & planning. University of Reading Business
School, Centre for Real Estate Research.
• Bailey, J. V. 1992. Evaluating benchmark quality. Financial Analysts Journal 48 (3): 33-39.
• Bannier, C. E., F. Fecht, and M. Tyrell. 2006. Open-end real estate funds in Germany—genesis and crisis.
Working Paper Series: Finance and Accounting (165). J.W. Goethe Universität.
• Barber, C., D. Robertson, and A. Scott. 1997. Property and inflation: the hedging characteristics of U.K.
commercial property, 1967-1994. Journal of Real Estate Finance and Economics 15 (1): 59-76.
• Baum, A., and P. Struempell. 2006. Managing specific risk in property portfolios. Working Paper presented
at the European Real Estate Society Conference.
• Björk, T., and E. Clapham. 2002. On the pricing of real estate index linked swaps. Journal of Housing Economics 11:418-432.
• Blundell, G. 2003. Managing portfolio risk. Paper presented at the IPD/IPF Property Investment Conference,
November, Brighton.
• Blundell, G., S. Fairchild, and R. Goodchild. 2005. Managing portfolio risk in real estate. Journal of Property Research 22 (2-3): 115-36.
• Bond, M., and M. Seiler. 1998. Real estate returns and inflation: an added variable approach. Journal of Real Estate Research 15 (3).
• Bond, S., G. Karolyi, and A. Sanders. 2003. International real estate returns: a multifactor, multicountry
approach. Real Estate Economics 31 (3): 481-500.
• Booth, P. 2002. Real estate investment in an asset/liability modeling context. Journal of Real Estate Portfolio Management (September-December).
• Booth, P., and G. Marcato. 2004. The dependency between returns from direct real estate and returns
from real estate shares. Journal of Property Investment & Finance 22 (2): 147-161.
• —. 2004. The measurement and modelling of commercial real estate performance. British Actuarial Journal 10 (45): 5-61.
• Booth, P., and G. Matysiak. 2004. How should unsmoothing affect pension plan asset allocation? Journal of Property Investment & Finance 22 (6): 472 - 483.
• Brealey, R. 1983. An Introduction to Risk and Return. 2d ed. Oxford: Basil Blackwell.
• Brinson, G., and N. Fachler. 1985. Measuring Non-U.S. Equity Portfolio Performance. Journal of Portfolio Management 11 (3): 73-76.
• Brinson, G., L. Hood, and G. Beebower. 1986. Determinants of portfolio performance. Financial Analysts Journal 42 (4): 39-44.
• Brinson, G., B. Singer, and G. Beebower. 1991. Determinants of portfolio performance II: an update.
Financial Analysts Journal 47 (3): 40-48.
• Brounen, D., H. Op 't Veld, and V. Raitio. 2007. Transparency in the European non-listed real estate funds
market. Journal of Real Estate Portfolio Management 13 (2): 107-17.
• Brown, G., and G. Matysiak. 2000. Real Estate Investment. A Capital Market Approach. Pearson
Education.
References
An EDHEC Risk and Asset Management Research Centre Publ icat ion
EDHEC European Real Estate Investment and Risk Management Survey - November 2007

117An EDHEC Risk and Asset Management Research Centre Publ icat ion
EDHEC European Real Estate Investment and Risk Management Survey - November 2007
• Brown, G., and E. Schuck. 1996. Optimal portfolio allocations to real estate. Journal of Real Estate Portfolio Management 2 (1): 63-73.
• Brueggeman, W., and J. Fisher. 2005. Real Estate Finance and Investments. 12th ed. McGraw-Hill Higher
Education.
• Buttimer, R., D. Hyland, and A. Sanders. 2005. REITs, IPO waves and long-run performance. Real Estate Economics 33 (1): 51-87.
• Buttimer, R., J. Kau, and C. Slawson. 1997. A model for pricing securities dependent upon a real estate
index. Journal of Housing Economics 6 (1):16-30.
• Case, B., W. Goetzmann, and K. Rouwenhorst. 1999. Global real estate markets: cycles and fundamentals.
Working Papers. Yale School of Management, Economics Research Network.
• Case, K., R. Shiller, and A. Weiss. 1993. Index-based futures and options markets in real estate. Journal of Portfolio Management 19 (2): 83-92.
• Chan, S., J. Erickson, and K. Wang. 2002. Real Estate Investment Trusts: Structure, Performance, and Investment Opportunities. Oxford University Press.
• Chicago Board of Trade. 2007. CBOT to launch new futures contract based on the Dow Jones U.S. Real
Estate Index: contract to provide exposure to U.S. commercial real estate market. Press Release, January 9.
• Chen, L., and T. Mills. 2004. Global real estate investment going mainstream. UBS real estate research.
• —. 2006. Global real estate investment, vol. II. The world is becoming flatter. UBS real estate research.
• Chen, N.-F., R. Roll, and S. Ross. 1986. Economic forces and the stock market. Journal of Business 59 (3):
383-403.
• Cheng, P. 2001. Comparing downside-risk and mean-variance analysis using bootstrap simulation.
Journal of Real Estate Portfolio Management 7 (3): 225-38.
• —. 2005. Asymmetric risk measures and real estate returns. Journal of Real Estate Finance and Economics 30 (1): 89-102.
• Cheng, P., and S. Roulac. 2007. Measuring the effectiveness of geographical diversification. Journal of Real Estate Portfolio Management 13 (1): 29-44.
• Chua, A. 1999. The role of international real estate in global mixed-asset investment portfolios. Journal of Real Estate Portfolio Management 5 (2): 129-138.
• Chun, G., B. Ciochetti, and J. Shilling. 2000. Pension-plan real estate investment in an asset-liability
framework. Real Estate Economics 28 (3): 467-91.
• Chun, G., J. Sa-Aadu, and J. Shilling. 2004. The role of real estate in an institutional investor's portfolio
revisited. Journal of Real Estate Finance and Economics 29 (3): 295-320.
• CISDM. 2006. The benefits of real estate investment: 2006 update. Working Paper, Isenberg School of
Management, University of Massachusetts.
• Clayton, J. 2007. Commercial real estate derivatives: they’re here ... well, almost. PREA Quarterly
(winter).
• Coleman, M., and A. Mansour. 2005. Real estate in the real world: dealing with non-normality and risk in
an asset allocation model. Journal of Real Estate Portfolio Management 11 (1): 37-53.
References

118
• Craft, T. 2001. The role of private and public real estate in pension plan portfolio allocation choices.
Journal of Real Estate Portfolio Management 7 (1): 17.
• —. 2005. How funding ratios affect pension plan portfolio allocations. Journal of Real Estate Portfolio Management 11 (1): 29-35.
• Crain, J., M. Cudd, and C. Brown. 2000. The impact of the revenue reconciliation act of 1993 on the
pricing structure of equity REITs. Journal of Real Estate Research 19 (3): 275-285.
• D'Arcy, E., and S. Lee. 1998. Journal of Real Estate Portfolio Management 4 (2): 113-124.
• De Wit, I. and R. van Dijk. 2003. The global determinants of direct office real estate returns. Journal of Real Estate Finance and Economics 26 (1): 27-45.
• DeLisle, J. 1995. Real estate: a distinct asset class or an industry sector? University of Washington,
College of Architecture and Urban Design, Runstad Center for Real Estate Studies.
• —. 2002. Real estate: a distinct asset class or an industry sector? University of Washington, College of
Architecture and Urban Design, Runstad Center for Real Estate Studies.
• Downs, D. 1998. The value in targeting institutional investors: evidence from the five-or-fewer rule
change. Real Estate Economics 26 (4): 613-649.
• EDHEC. 2005. EDHEC funds of hedge funds reporting survey: a return-based approach to funds of
hedge funds reporting. Compiled by Noël Amenc, Philippe Malaise, and Mathieu Vaissié. EDHEC Publication
(January).
• Eichholtz, P., R. Huisman, K. Koedijk, and L. Schuin. 1998. Continental factors in international real estate
returns. Real Estate Economics 26 (3): 493-509.
• EPRA. 2005. FTSE EPRA/NAREIT monthly statistical bulletin (December 30).
• —. 2006. FTSE EPRA/NAREIT monthly statistical bulletin (December 29).
• —. 2007. FTSE EPRA/NAREIT monthly statistical bulletin (April 30).
• Europe Real Estate Yearbook. 2007. Europe Real Estate Yearbook 2007. Real Estate Publishers (March).
• Favre, L., and J.-A. Galeano. 2002. Mean-modified value-at-risk optimization with hedge funds. Journal of Alternative Investments 5 (2): 21-26.
• Feldman, B. 2003. Investment policy for securitized and direct real estate. Journal of Portfolio Management (October): 112-121.
• Fisher, J. 2003. US commercial real estate indices: the NCREIF property index. In Proceedings of the IMF/BIS Conference on Real Estate Indicators and Financial Stability. Washington DC (October 27-28).
• Fisher, J., D. Gatzlaff, D. Geltner, and D. Haurin. 2003. Controlling for the impact of variable liquidity in
commercial real estate price indices. Real Estate Economics 31 (2): 269-303.
• Geltner, D. 1993. Estimating market values for appraised values without assuming an efficient market.
Journal of Real Estate Research 8 (3): 325-346.
• —. 2003. IRR-based property-level performance attribution. Journal of Portfolio Management (October):
138-151.
• Georgiev, G., B. Gupta, and T. Kunkel. 2003. Benefits of real estate investment. Journal of Portfolio Management (October): 28-33.
References
An EDHEC Risk and Asset Management Research Centre Publ icat ion
EDHEC European Real Estate Investment and Risk Management Survey - November 2007

119An EDHEC Risk and Asset Management Research Centre Publ icat ion
EDHEC European Real Estate Investment and Risk Management Survey - November 2007
• Getmansky, M., A. Lo, and I. Makarov. 2004. An econometric model of serial correlation and illiquidity in
hedge fund returns. Journal of Financial Economics 74:529-609.
• Glascock, J., and L. Kelly. 2005. Working paper version of Glascock and Kelly (2007).
• —. 2007. The relative effect of property type and country factors in reduction of risk of internationally
diversified real estate portfolios. Journal of Real Estate Finance and Economics 34 (3): 369-84.
• Goetzmann, W., and E. Valaitis. 2006. Yale ICF Working Paper No. 06-04 (March).
• Gold, R. 1995. Why the efficient frontier for real estate is "fuzzy". Journal of Real Estate Portfolio Management 1 (1): 59-66.
• —. 1996. The use of MPT for real estate portfolios in an uncertain world. Journal of Real Estate Portfolio Management 2 (2): 95-106.
• Goldman Sachs. 2006. Presentation delivered by Cyril Cottu at IPD Workshop on Property Derivatives
(December 14).
• Gordon, J., and E. Tse. 2003. Journal of Portfolio Management (October): 62-65.
• Graff, R., A. Harrington, and M. Young. 1997. The shape of Australian real estate return distributions and
comparisons to the United States. Journal of Real Estate Research 14 (3): 291-308.
• Graff, R., and M. Young. 1996. Real estate return correlations: real-world limitations on relationships
inferred from NCREIF data. Journal of Real Estate Finance & Economics 13 (2): 121-142.
• Grant, D. 2002. Alternative approaches to testing hedge effectiveness under SFAS No. 133. Accounting Horizons (June 1).
• Hamelink, F., and M. Hoesli. 2004a. Maximum drawdown and the allocation to real estate. Journal of Property Research 21 (1): 5-29.
• —. 2004b. What factors determine international real estate security returns? Real Estate Economics 32
(3): 437-62.
• Hamelink, F., M. Hoesli, C. Lizieri, and B. MacGregor. 2000. Homogeneous commercial property market
groupings and portfolio construction in the United Kingdom. Environment and Planning A 32 (2): 323-
344.
• Hartzell, D., D. Shulman, and C. Wurtzebach. 1987. Refining the analysis of regional diversification for
income-producing real estate. Journal of Real Estate Research 2 (2): 85-95.
• Hoesli, M., and J. Lekander. 2006. Quelle proportion d'immobilier dans un portefeuille ? Réflexions immobilières (42).
• Hoesli, M., and B. MacGregor. 2000. Property Investment. Principles and Practices of Portfolio Management. Pearson Education.
• Hoesli, M., J. Lekander, and W. Witkiewicz. 2004. International evidence on real estate as a portfolio
diversifier. Journal of Real Estate Research 26 (2): 161-206.
• —. 2003. Real estate in the institutional portfolio: a comparison of suggested and actual weights. Journal of Alternative Investments 6 (3): 53-59.
• Hudson-Wilson, S., F. Fabozzi, and J. Gordon. 2003. Why real estate? Journal of Portfolio Management (October): 12-25.
References

120
• Hudson-Wilson, S., J. Gordon, F. Fabozzi, M. Anson, and S. Giliberto. 2005. Journal of Portfolio Management 32 (September): 12-22.
• HVB. 2007. Securitization market watch. (July 27).
• IPD. 2007a. Multi national index spreadsheet 2007--Update 4. Investment Property Databank, London.
• —. 2007b. IPD pan-European property index—Results to December 2006. Investment Property
Databank, London.
• IPF. 2001. Baum, A. Liquidity in private property vehicles: where next? London: Investment Property
Forum.
• —. 2002. Booth, P., G. Matysiak, and P. Ormerod. Risk measurement and management for real estate
investment portfolios. London: Investment Property Forum.
• —. 2007. Callender, M., S. Devaney, and A. Sheahan. Risk reduction and diversification in property
portfolios. London: Investment Property Forum.
• Jackson, C., S. Stevenson, and C. Watkins. 2005. NY-LON: does a single cross-continental office market
exist? Real estate working papers (03). Cass Business School.
• Jones Lang Lasalle. 2007. Direct European real estate investment totalled €242bn in 2006. Press release.
(February 19).
• Lee, S. 1999. Style analysis and property fund performance. Journal of Property Investment and Finance 17 (2): 145-156.
• Lee. S., and S. Devaney. 2004. Country, sector and regional factors in European property returns.
Working papers in real estate & planning. University of Reading Business School, Centre for Real Estate
Research (December).
• Liang. Y., and W. McIntosh. 1998. REIT style and performance. Journal of Real Estate Portfolio Management 4 (1): 69-78.
• Liang, Y., F. Myer, and J. Webb. 1996. The bootstrap efficient frontier for mixed-asset portfolios. Real Estate Economics 24 (3): 247-256.
• Liffe. 2007. Liffe launches futures on indices of real estate companies. Press release (September 6).
• Lim, J., and Y. Zhang. 2006. A study on real estate derivatives. Master's thesis, Massachusetts Institute of
Technology.
• Ling, D. and A. Naranjo. 2002. Commercial real estate return performance: a cross-country analysis.
Journal of Real Estate Finance and Economics 24 (1-2): 119-42.
• —. 1997. Economic risk factors and commercial real estate returns. Journal of Real Estate Finance and Economics 14 (3): 283-307.
• Ling, D., and M. Ryngaert. 1997. Valuation uncertainty, institutional involvement, and the underpricing
of IPOs: the case of REITs. Journal of Financial Economics 43 (3): 433-456.
• Lipe, R. 1996. Current accounting projects. Paper presented at the Twenty-Fourth Annual National
Conference on Current SEC Developments, U.S. Securities and Exchange Commission, Washington, D.C.
• Ljung, G., and G. Box. 1978. On a measure of a lack of fit in time series models. Biometrika 65:297-303.
• Lo, A. 2002. The statistics of Sharpe ratios. Financial Analysts Journal 58 (July-August): 36-52.
• Loyens & Loeff. 2007. Comparative table of European REIT regimes (August).
References
An EDHEC Risk and Asset Management Research Centre Publ icat ion
EDHEC European Real Estate Investment and Risk Management Survey - November 2007

121An EDHEC Risk and Asset Management Research Centre Publ icat ion
EDHEC European Real Estate Investment and Risk Management Survey - November 2007
• Marcato, G. 2004. Style analysis in real estate markets and the construction of value and growth indices.
Journal of Real Estate Portfolio Management 10 (3): 203-215.
• McAllister, P. 1999. Globalisation, integration and commercial property. Evidence from the UK. Journal of Property Investment and Finance 17 (1): 8-26.
• Miles, M., and T. McCue. 1982. Journal of the American Real Estate & Urban Economics Association 10
(2): 184-199.
• Morell, G., S. Jones, G. Blundell, A. Walker, C. Waites, M. Cumberworth, G. Matysiak, and N. Winter.
2004. An exploration of commercial property's liability matching qualities. Proceedings of the Institute and
Faculty of Actuaries Investment Conference—Investing to Manage Liability-Related Risk, London: 1-39.
• Mueller, G. 1993. Refining economic diversification strategies for real estate portfolios. Journal of Real Estate Research 8 (1): 55-68.
• Mueller, G., and B. Ziering. 1992. Real estate portfolio diversification using economic diversification.
Journal of Real Estate Research 7 (4): 375-86.
• Myer, F., and J. Webb. 2000. Management styles of REIT funds. Journal of Real Estate Portfolio Management 6 (4): 339-348.
• NAREIT. 2005. Forty-five @ 45. Real Estate Portfolio (September/October).
• NCREIF. 2003. Real estate investment styles: trends from the catwalk, NCREIF styles white paper
committee final report (October 2).
• Nossiter, D. 1982. Building values: REITs adapt to changes in the business climate. Barrons National and Business Financial Weekly 62:11+.
• OPC. 2006. The indirect property market in Europe. The OPC bi-annual report (5).
• —. 2005. The indirect property market in Europe. The OPC bi-annual report (3).
• —. 2004. The indirect property market in Europe. The OPC bi-annual report (January).
• Pagliari, J., K. Scherer, and R. Monopoli. 2003. Public versus private real estate equities. Journal of Portfolio Management 29 (October): 101-111.
• Pagliari, J., K. Scherer, and R. Monopoli. 2005. Public versus private real estate equities: a more refined,
long-term comparison. Real Estate Economics 33 (1): 147-187.
• Pagliari, J., J. Webb, and J. Del Casino. 1995. Applying MPT to institutional real estate portfolios: the good,
the bad and the uncertain. Journal of Real Estate Portfolio Management 1 (1): 67-88.
• Patel, K., and R. Pereira. 2007. Pricing property index linked swaps with counterparty Default risk. Journal of Real Estate Finance and Economics 36 (1).
• —. 2006. Working paper version of Patel and Pereira 2007.
• Quan, D., and S. Titman. 1999. Do real estate prices and stock prices move together? An international
analysis. Real Estate Economics 27 (2): 183-207.
• Riddiough, T., M. Moriarty, and P. Yeatman. 2005. Privately versus publicly held asset investment
performance. Real Estate Economics 33 (1): 121-146.
• Rosen, K. 1995. REITS: stocks, bonds or real estate?" Working Paper 96-244. Fisher Center for Real Estate
and Urban Economic Research, Haas School of Business, University of California, Berkeley (November).
• Rosen, K., M. Torres, and M. Anderson. 2002. REITs: an investor’s view. Lend Lease Rosen. Commentary (6).
References

122
• Rottke, Nico. 2004. Investitionen mit Real Estate Private Equity - Herleitung eines anreizkompatiblen
Beteiligungsmodells unter Berücksichtigung der Transaktionskosten- und Agency-Theorie. In Schriften zur Immobilienökonomie. Edited by Karl-Werner Schulte and Stephan Bone-Winkel. Bd. 29, Diss. Cologne.
• Roulac, S. 1976. Modern Real Estate Investment: An Institutional Approach. San Francisco: Property
Press.
• RREEF. 2007. Hobbs, P., and H. Chin. The future size of the global real estate market. RREEF Research
(July).
• Seiler, M., J. Webb, and F. Myer. 2001. Can private real estate portfolios be rebalanced/diversified using
equity REIT shares? Journal of Real Estate Portfolio Management 7 (1): 17-42.
• Sirmans, C., and E. Worzala. 2003a. International direct real estate investment: a review of the literature.
Urban Studies 40, (5-6): 1081-1114.
• —. 2003b. Investing in international real estate stocks: a review of the literature. Urban Studies 40, (5-6):
1115-1149.
• Stevenson, S. 2001. Evaluating the investment attributes and performance of property companies.
Journal of Property Investment & Finance 19 (3): 251-266.
• Swad, S. 1995. Presentation at the Twenty-Second Annual National Conference on Current SEC
Developments, U.S. Securities and Exchange Commission, Washington, D.C.
• Terhaar, K., R. Staub, and B. Singer. 2003. Appropriate policy allocation for alternative investments.
Journal of Portfolio Management 29 (3): 101-110.
• Wang, K., S. Chan, and G. Gau. 1992. Initial public offerings of equity securities: anomalous evidence
using REITs. Journal of Financial Economics 31 (3): 381-410.
• Wang, K., J. Erickson, G. Gau, and S. Chan. 1995. Market microstructure and real estate returns. Real Estate Economics 23 (1): 85-100.
• Webb, J., and F. Myer. 1996. Management style and asset allocations in real estate portfolios. Journal of Real Estate Portfolio Management, 1996 (2): 119-25.
• Young, M. 2008. Revisiting non-normal real estate return distributions by property type in the U.S.
Journal of Real Estate Finance and Economics 36 (2).
• —. 2006. Working paper version of Young 2008.
• Young, M., and S. Annis. 2002. Real estate performance attribution: pure theory meets messy reality.
Journal of Real Estate Research 23 (1-2): 3-27.
• Young, M., and R. Graff. 1995. Real estate is not normal: a fresh look at real estate return distributions.
Journal of Real Estate Finance & Economics 10 (3): 225-259.
• Young, M., S. Lee, and S. Devaney. 2006. Non-normal real estate return distributions by property type in
the UK. Journal of Property Research 23 (2): 109.
References
An EDHEC Risk and Asset Management Research Centre Publ icat ion
EDHEC European Real Estate Investment and Risk Management Survey - November 2007
123An EDHEC Risk and Asset Management Research Centre Publ icat ion
EDHEC European Real Estate Investment and Risk Management Survey - November 2007
The choice of asset allocationThe EDHEC Risk and Asset Management Research
Centre structures all of its research work around
asset allocation. This issue corresponds to a genuine
expectation from the market. On the one hand, the
prevailing stock market situation in recent years
has shown the limitations of active management
based solely on stock picking as a source of
performance.
On the other, the appearance of new asset
classes (hedge funds, private equity), with risk
profiles that are very different from those of the
traditional investment universe, constitutes a new
opportunity in both conceptual and operational
terms. This strategic choice is applied to all of
the centre's research programmes, whether they
involve proposing new methods of strategic
allocation, which integrate the alternative class;
measuring the performance of funds while taking
the tactical allocation dimension of the alphas into
account; taking extreme risks into account in the
allocation; or studying the usefulness of derivatives
in constructing the portfolio.
An applied research approachIn a desire to ensure that the research it carries
out is truly applicable in practice, EDHEC has
implemented a dual validation system for the
work of the EDHEC Risk and Asset Management
Research Centre. All research work must be part
of a research programme, the relevance and
goals of which have been validated from both
an academic and a business viewpoint by the
centre's advisory board. This board is made up of
both internationally recognised researchers and
the centre's business partners. The management
of the research programmes respects a rigorous
validation process, which guarantees both the
scientific quality and the operational usefulness
of the programmes.
To date, the centre has implemented six research
programmes:
Multi-style/multi-class allocationThis research programme has received
the support of Misys Asset Management
Systems, SG Asset Management and
FIMAT. The research carried out focuses
on the benefits, risks and integration
methods of the alternative class in asset allocation.
From that perspective, EDHEC is making a significant
contribution to the research conducted in the area of
multi-style/multi-class portfolio construction.
Performance and style analysisThe scientific goal of the research is to adapt the
portfolio performance and style analysis models
and methods to tactical allocation. The results
of the research carried out by EDHEC thereby
allow portfolio alphas to be measured not only
for stock picking but also for style timing. This
programme is part of a business partnership with
the firm EuroPerformance (part of the Fininfo
group).
Indices and benchmarkingEDHEC carries out analyses of the quality of indices
and the criteria for choosing indices for institutional
investors. EDHEC also proposes an original
proprietary style index construction methodology
for both the traditional and alternative universes.
These indices are intended to be a response to the
critiques relating to the lack of representativity of
the style indices that are available on the market.
EDHEC was the first to launch composite hedge fund
strategy indices as early as 2003. The indices and
About the EDHEC Risk and Asset Management Research Centre
EDHEC is one of the top fivebusiness schools in Franceand was ranked 7th in theFinancial Times Masters in
Management Rankings 2006owing to the high quality ofits academic staff (over 100
permanent lecturers fromFrance and abroad) and its
privileged relationship withprofessionals that the school
has been developing sinceit was established in 1906.
EDHEC Business School hasdecided to draw on its
extensive knowledge of theprofessional environment
and has thereforeconcentrated its research on
themes that satisfy the needsof professionals. EDHEC is
one of the few business schools in Europe to have received the
triple internationalaccreditation: AACSB
(US-Global), Equis (Europe-Global) andAMBA (UK-Global).
EDHEC pursues an activeresearch policy in the field of
finance. Its “Risk and AssetManagement Research
Centre” carries out numerousresearch programmes in theareas of asset allocation and
risk management in boththe traditional and
alternative investmentuniverses.
40% Strategic Asset Allocation
3.5% Fees
11% Stock Picking
45.5 Tactical Asset Allocation
Percentage of variation between funds
Source: EDHEC (2002) and Ibbotson, Kaplan (2000)

124
benchmarking research programme is supported by
AF2I, Euronext, BGI, BNP Paribas Asset Management
and UBS Global Asset Management.
Best Execution and Operational PerformanceThis research programme deals with two topics:
best execution and, more generally, the issue
of operational risk. The goal of the research
programme is to develop a complete framework
for measuring transaction costs: EBEX (“Estimated
Best Execution”) but also to develop the existing
framework for specific situations (constrained
orders, listed derivatives, etc.). Research will also
focus on risk-adjusted performance measurement
of execution strategies, analysis of market impact
and opportunity costs on listed derivatives order
books, impact of explicit and implicit transaction
costs on portfolio performances and the impact of
market fragmentation resulting from MiFID on the
quality of execution in European listed securities
markets.
Asset allocation and derivative instrumentsThis research programme focuses on the usefulness
of employing derivative instruments in the area
of portfolio construction, whether it involves
implementing active portfolio allocation or
replicating indices. “Passive” replication of “active”
hedge fund indices through portfolios of derivative
instruments is a key area in the research carried
out by EDHEC. This programme is supported by
Eurex and Lyxor.
ALM and asset management This programme concentrates on the application
of recent research in the area of asset-liability
management for pension plans and insurance
companies. The research centre is working on the
idea that improving asset management techniques
and particularly strategic allocation techniques has
a positive impact on the performance of Asset-
Liability Management programmes. The programme
includes research on the benefits of alternative
investments, such as hedge funds, in long-term
portfolio management. Particular attention is given
to the institutional context of ALM and notably the
integration of the impact of the IFRS standards and
the Solvency II directive project. This programme
is sponsored by AXA IM.
Research for businessTo optimise exchanges between the academic
and business worlds, the EDHEC Risk and Asset
Management Research Centre maintains a website
devoted to asset management research for the
industry: www.edhec-risk.com, circulates a monthly
newsletter to over 125,000 practitioners, conducts
regular industry surveys and consultations, and
organises annual conferences for the benefit of
institutional investors and asset managers. The
centre’s activities have also given rise to the business
offshoots EDHEC Investment Research and EDHEC
Asset Management Education.
EDHEC Investment Research supports institutional
investors and asset managers in the implementation
of the centre’s research results and proposes asset
allocation services in the context of a ‘core-satellite’
approach encompassing alternative investments.
EDHEC Asset Management Education helps
investment professionals to upgrade their skills
with advanced risk and asset management training
across traditional and alternative classes.
About the EDHEC Risk and Asset Management Research Centre
An EDHEC Risk and Asset Management Research Centre Publ icat ion
EDHEC European Real Estate Investment and Risk Management Survey - November 2007

125An EDHEC Risk and Asset Management Research Centre Publ icat ion
EDHEC European Real Estate Investment and Risk Management Survey - November 2007
About the EDHEC Risk and Asset Management Research Centre
Industry surveys: comparing research advances with industry best practices
EDHEC regularly conducts surveys on the state of the European asset management industry. These specifically look at the application of recent research advances within investment management companies and at best practices in the industry. Survey results receive considerable attention from professionals and are extensively reported by the international financial media.
Recent industry surveys conducted by the EDHEC Risk and Asset Management Research Centre
1/ The EDHEC European ETF Survey 2006 sponsored by iShares
2/ The EDHEC European Investment Practices Survey 2007 sponsored by Fimat
3/ EDHEC European Alternative Diversification Practices Survey sponsored by Fimat
EuroPerformance-EDHEC Style Ratings and Alpha League Table
The business partnership between France’s leading fund rating agency and the EDHEC Risk and Asset Management Research Centre led to the 2004 launch of the EuroPerformance-EDHEC Style Ratings, a free rating service for funds distributed in Europe which addresses market demand by delivering a true picture of the alphas, accounting for potential extreme loss, and measuring performance persistence.The risk-adjusted performance of individual funds is used to build the Alpha League Table, the first ranking of European asset management companies based on their ability to deliver value on their equity management.www.stylerating.com
EDHEC-Risk website
The EDHEC Risk and Asset Management Research Centre’s website puts EDHEC’s analyses and expertise in the field of asset management and ALM at the disposal of professionals. The site examines the latest academic research from a business perspective, and provides a critical look at the most recent industry news.www.edhec-risk.com
126 An EDHEC Risk and Asset Management Research Centre Publ icat ion
EDHEC European Real Estate Investment and Risk Management Survey - November 2007
126
Groupe UFG, 370 experienced professionals and a
subsidiary of Crédit Mutuel Nord Europe, is an asset
management firm specialised in multiple investment
fields for a diversified customer base. Groupe UFG’s
four core areas of expertise are:
• Real Estate Investment
(UFG Real Estate Managers),• Funds of Hedge Funds
(UFG Alteram),• Private Equity
(UFG Private Equity),• Traditional Asset Management
(UFG Investment Managers).
Thanks to the complementarity of these skills,
Groupe UFG is in a prime position to offer its
customers (institutional investors, financial advisers
and individual investors) investment solutions
that cover both traditional and alternative asset
classes. Headed by Xavier Lépine, Groupe UFG
manages more than 20 billion euros in assets as
of September 2007.
Groupe UFGAn asset management firm specialised in multiple investment fields for a diversified customer base
An EDHEC Risk and Asset Management Research Centre Publ icat ion
Groupe UFGUFG Real Estate Managers173, boulevard Haussmann75008 Paris - FranceTél. +33 1 44 56 10 00Fax +33 1 44 56 11 00E-mail: [email protected]: www.groupe-ufg.com


EDHEC Risk and Asset ManagementResearch Centre393-400 promenade des AnglaisBP 311606202 Nice Cedex 3 - FranceTel.: +33 (0)4 93 18 78 24Fax: +33 (0)4 93 18 78 41E-mail: [email protected]: www.edhec-risk.com
AberdeenAberdeen Property InvestorsLuntmakargatan 34Box 3039SE -103 63 Stockholm - SwedenTel: +46 (0)8 412 8000Fax: +46 (0)8 412 8004Web: www.aberdeenpropertyinvestors.com
Groupe UFGUFG Real Estate Managers173, boulevard Haussmann75008 Paris - FranceTél. +33 1 44 56 10 00Fax +33 1 44 56 11 00E-mail: [email protected]: www.groupe-ufg.com