edb business partner asa - evry · edb business partner asa fourth quarter 2004 . interim report...
TRANSCRIPT

EDB Business Partner ASAFourth quarter 2004

31.01.05Interim Report Q404 2
Q4 and 2004 highlights
• 2004 – a year with profitable growth – Q4 – double-digit margin, first ever – Full Year – all time high EBITA– Revenue growth - gaining share
• Acquiring IT-operations from Capgemini – Sweden and Norway
• New dividend policy – Annual dividend 20-50% of normalized
result– Suggested 2004 dividend;
NOK 0.50 / share
• Well positioned for profitable growth

31.01.05Interim Report Q404 3
Entering 2005 with new strategic moves
• Skanska FM (Coor) outsourcing IT operations to EDB in Sweden
– TCV NOK 100 mill / 5 years
• EDB outsourcing Internal Services to Skanska FM (Coor)
– 5 years contract - Norway
• Software consolidation agreement with Computer Associate (CA)
– TCV NOK 330 mill / 5 years / Nordic

31.01.05Interim Report Q404 4
Key figures Q4 2004 – Group
NOK million Q4 2004 Q4 2003*
Operating revenue 1 138 1 113 Operating costs 1 025 1 008 Operating profit before goodwill depr. (EBITA) 114 106
EBITA % 10,0 % 9,5 %
Profit from divestments -6 EBIT 67 68
Profit before tax 60 63
Cash flow from operations 283 343 Operational investments (CAPEX) 119 65
Earnings per share (NOK) ** 0,50 0,61
No. of employees 2 484 2 504 * Operating revenues include NOK 105 mill from sold and discontinued activities** EPS before tax costs related to tax reform, NOK 490 mill

31.01.05Interim Report Q404 5
Key figures 2004 – Group
NOK million 2004 2003*
Operating revenue 4 236 4 289 Operating costs 3 848 4 125 Operating profit before goodwill depr. (EBITA) 388 165
EBITA % 9,2 % 3,8 %
Profit from divestments 295 - EBIT 524 -4
Profit before tax 480 -88
Cash flow from operations 610 302 Operational investments (CAPEX) 233 210
Earnings per share (NOK) ** 3,72 -0,59
No. of employees 2 484 2 504 * Operating revenues include NOK 409 mill from sold and discontinued activities** EPS before tax costs related to tax reform, NOK 490 mill

31.01.05Interim Report Q404 6
Operating revenue – Group
0
200
400
600
800
1 000
1 200
Q1 Q2 Q3 Q4
NO
K m
illion
2003 2004 Sold/discontinuedbusiness

31.01.05Interim Report Q404 7
Revenue split by Industry – Group
Distr, Industry,
Public sector; 20 %
Bank / finance;
56 %
Telecom; 24 %
Distr, Industry,
Public sector; 32 %
Bank / finance;
48 %
Telecom; 20 %
Including IBM and Capgemini4. quarter 2004

31.01.05Interim Report Q404 8
EBITA margin – Group
-6 %
-4 %
-2 %
0 %
2 %
4 %
6 %
8 %
10 %
12 %
Q1 Q2 Q3 Q4
2003 2004 Adjusted for non-recurring items
31.01.05Interim Report Q404 9
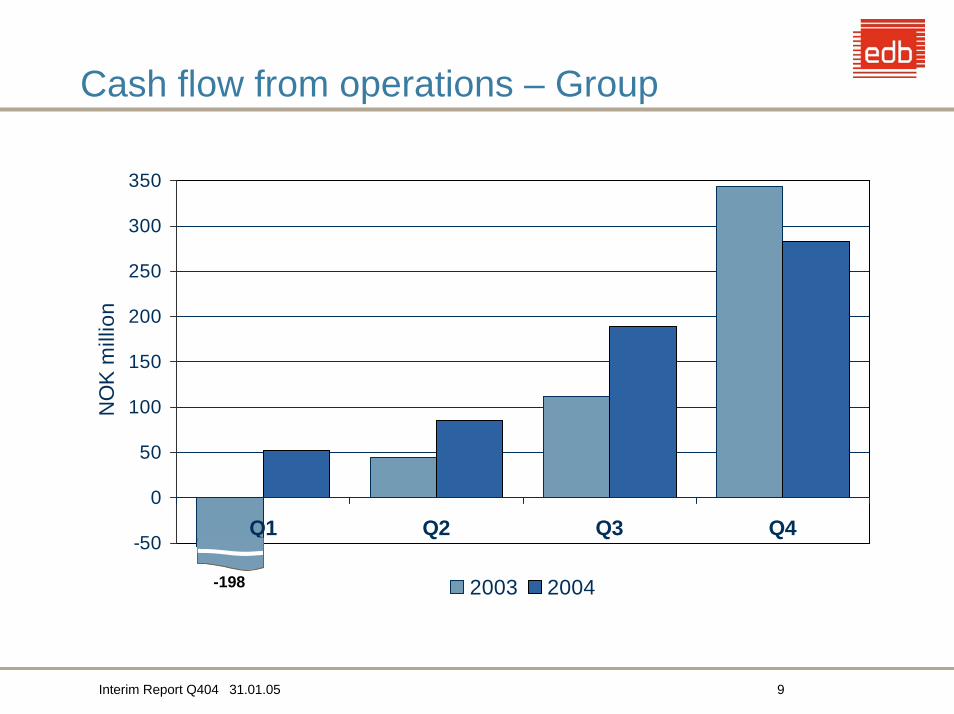
Cash flow from operations – Group
-50
0
50
100
150
200
250
300
350
Q1 Q2 Q3 Q4
NO
K m
illio
n
2003 2004-198

31.01.05Interim Report Q404 10
Net interest-bearing liabilities – Group
0
100
200
300
400
500
600
700
800
Q1 Q2 Q3 Q4*
NO
K m
illio
n
2003 2004
* Increase from Q3 to Q4 is entirely related to IBM and Capgemini transactions

31.01.05Interim Report Q404 11
ROIC – Return On Invested Capital
0,0 %
2,0 %
4,0 %
6,0 %
8,0 %
10,0 %
12,0 %
14,0 %
16,0 %
18,0 %
2003 1Q 2004 2Q 2004 3Q 2004 4Q 2004
• Invested Capital related to acquisitions completed 31.12.2004 not included

31.01.05Interim Report Q404 12
Order backlog – NOK 12.9 billion
TotalNOK mill order backlog
Order backlog 31.12.2004 2005 2006 2007 2008 LaterIT Operations 11 157 2 726 2 142 2 011 1 690 2 588
Bank & Finance 796 333 215 145 60 43
Telecom 95 90 5
Business from IBM/ Capgemini 861 574 191 96
Total order backlog EDB 12 909 3 724 2 552 2 253 1 750 2 631
% of total 29 % 20 % 17 % 14 % 20 %

31.01.05Interim Report Q404 13
Operating revenue by Business Area
0
100
200
300
400
500
600
700
800
900
1 000
Q1 Q2 Q3 Q4
NO
K m
illio
n
2003 2004
IT Operations
0
50
100
150
200
250
Q1 Q2 Q3 Q4
NO
K m
illio
n
2003 2004
Bank & Finance
0
20
40
60
80
100
120
140
160
180
200
Q1 Q2 Q3 Q4
NO
K m
illio
n
2003 2004
Telecom
• Q404/Q403: + 17 % • Q404/Q403: + 4 % • Q404/Q403: - 11 %
Note: Growth in percent is adjusted for sold and discontinued businesses

31.01.05Interim Report Q404 14
EBITA-margin by Business Area
-4 %
-2 %
0 %
2 %
4 %
6 %
8 %
10 %
12 %
14 %
Q1 Q2 Q3 Q4
2003 2004
TelecomBank & Finance
-15 %
-10 %
-5 %
0 %
5 %
10 %
15 %
20 %
Q1 Q2 Q3 Q4
2003 2004
-40,4%0 %
2 %
4 %
6 %
8 %
10 %
12 %
Q1 Q2 Q3 Q42003 2004
IT Operations
• Q404: 16 % • Q404: 5 %• Q404: 10 %
31.01.05Interim Report Q404 15
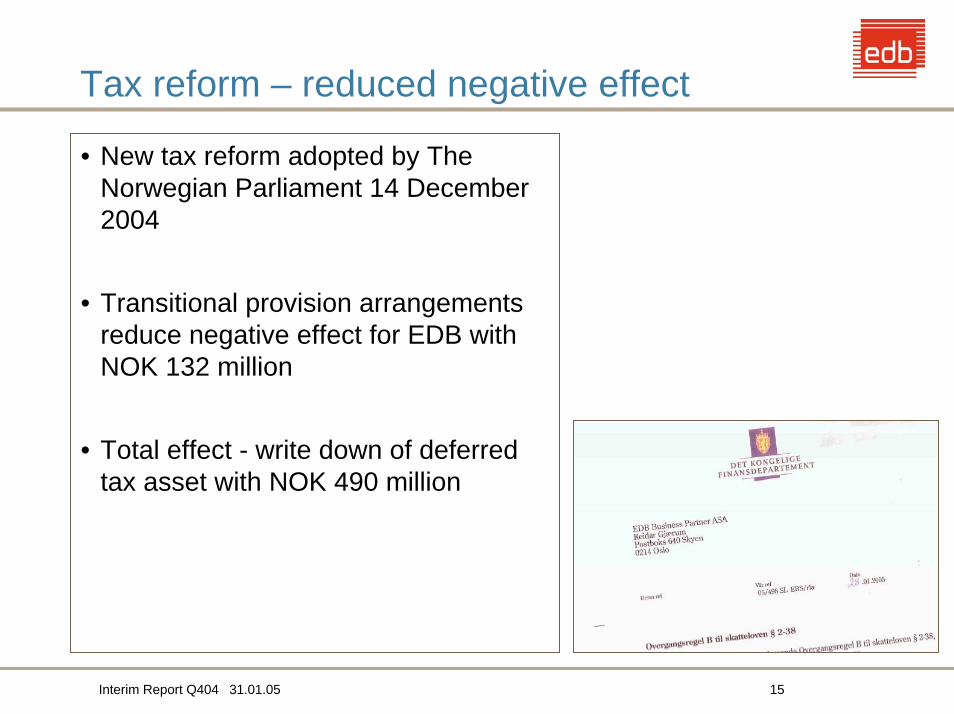
Tax reform – reduced negative effect
• New tax reform adopted by The Norwegian Parliament 14 December 2004
• Transitional provision arrangements reduce negative effect for EDB with NOK 132 million
• Total effect - write down of deferred tax asset with NOK 490 million

31.01.05Interim Report Q404 16
IFRS – no major implementation effects
• Main effects 2004 – Revenues and EBITA increase with app.
NOK 55 mill from changed revenue recognition principles
– Employee option expenses reduces EBITA with NOK 5 mill
– EBIT increases with app NOK 160 mill from reversal of goodwill depreciation
– Net effect direct equity adjustments NOK –160 mill
• Main effects 2005 – Amortization of intangible assets from IBM
and Capgemini transactions; app. NOK 90 mill in 2005 and NOK 40 mill in 2006
– No goodwill amortization– Changed revenue recognition on certain
license sales - may reduce revenues with app NOK 10 mill compared to NGAAP(Q1)

IT Operations
31.01.05Interim Report Q404 18
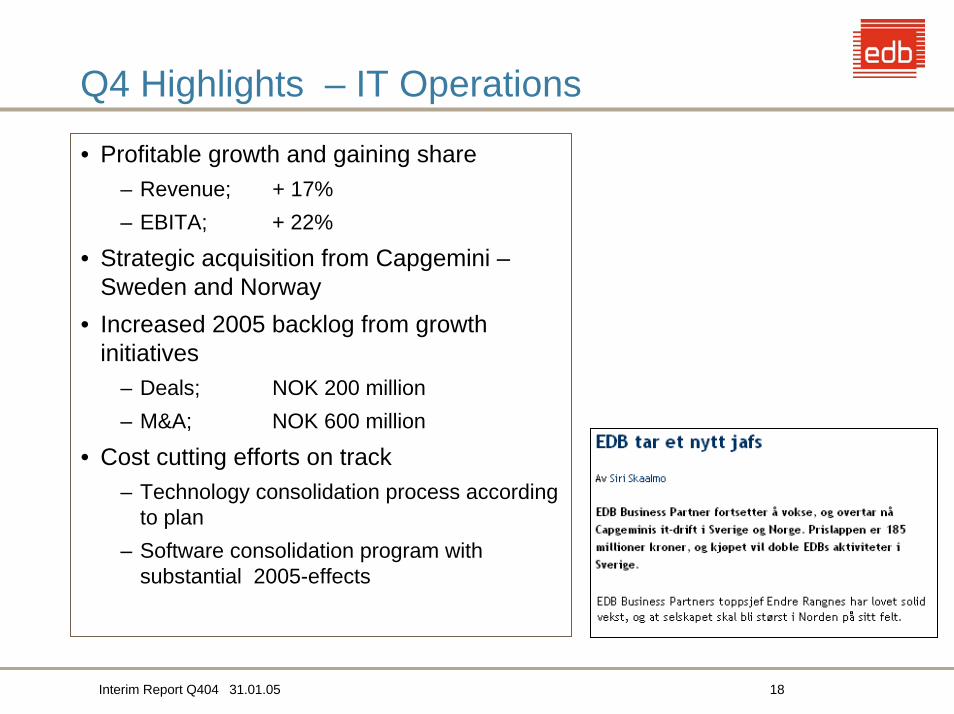
Q4 Highlights – IT Operations
• Profitable growth and gaining share– Revenue; + 17% – EBITA; + 22%
• Strategic acquisition from Capgemini –Sweden and Norway
• Increased 2005 backlog from growth initiatives
– Deals; NOK 200 million– M&A; NOK 600 million
• Cost cutting efforts on track– Technology consolidation process according
to plan– Software consolidation program with
substantial 2005-effects
31.01.05Interim Report Q404 19
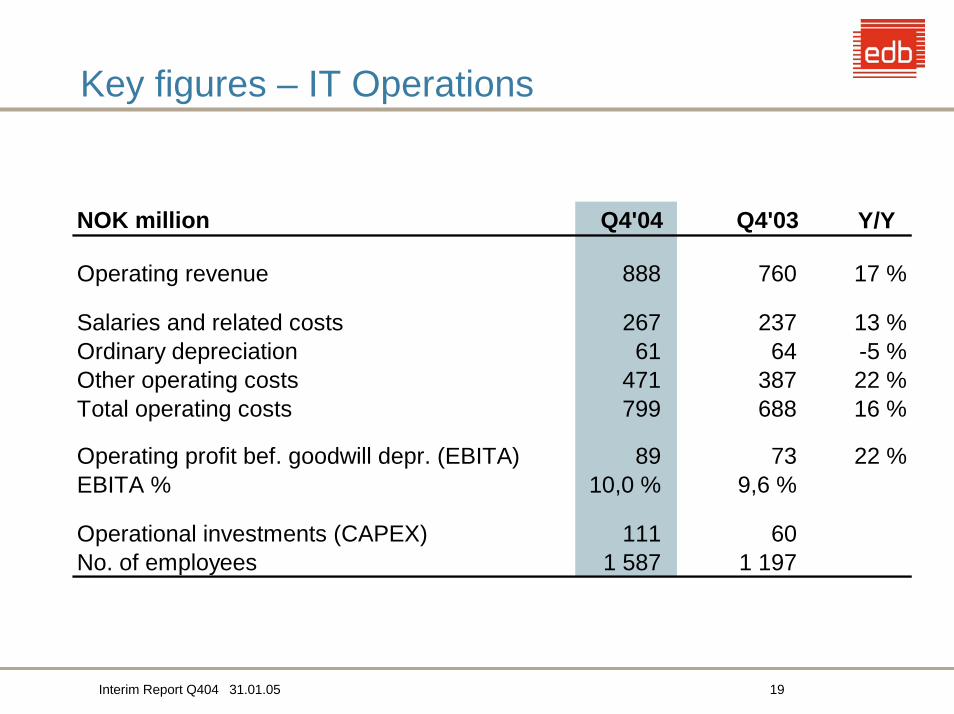
Key figures – IT Operations
NOK million Q4'04 Q4'03 Y/Y
Operating revenue 888 760 17 %
Salaries and related costs 267 237 13 %Ordinary depreciation 61 64 -5 %Other operating costs 471 387 22 %Total operating costs 799 688 16 %
Operating profit bef. goodwill depr. (EBITA) 89 73 22 %EBITA % 10,0 % 9,6 %
Operational investments (CAPEX) 111 60No. of employees 1 587 1 197
Bank & Finance

31.01.05Interim Report Q404 21
Q4 Highlights – Bank & Finance
• Continuous improvement of productivity and profitability
– Best Q4 EBITA-margin ever– Best full year result ever
• New long term contracts confirming competitive position
– Backlog improved
• Growth in electronic bank and card transactions
– High potential for new products and services (Internet bank/Exception-based Banking/Mobile banking)

31.01.05Interim Report Q404 22
Key figures – Bank & Finance
NOK million Q4'04 Q4'03 Y/Y
Operating revenue 219 212 4 %
Salaries and related costs 118 113 4 %Ordinary depreciation 2 3 -33 %Other operating costs 64 66 -3 %Total operating costs 184 182 1 %
Operating profit bef. goodwill depr. (EBITA) 35 30EBITA % 16,0 % 14,1 %
Operational investments (CAPEX) 2 2No. of employees 639 675

Telecom

31.01.05Interim Report Q404 24
Q4 Highlights – Telecom
• Two OEM-agreements with global vendors (incl. Nortel)
• New contracts signed in core areas– Vimpelcom: Mediation upgrade– Belgacom: NIMS (NOK 36 mill)– "European": NIMS (NOK 15 mill)
• Restructuring and cost cutting efforts – New management– Integration of staff functions– Sterling Best Routing – discontinued– HC reductions

31.01.05Interim Report Q404 25
Key figures – Telecom
NOK million Q4'04 Q4'03* Y/Y
Operating revenue 61 173 -49 %
Salaries and related costs 56 90 -36 %Ordinary depreciation 0 3 -56 %Other operating costs 2 61 -63 %Total operating costs 58 154 -45 %
Operating profit bef. goodwill depr. (EBITA) 3 19 -76 %EBITA % 4,8 % 11,1 %
Operational investments (CAPEX) 1 1No. of employees 207 621* Includes System Integration, sold with effect from 1. April 2004

2005 Market Outlook – IT Services

31.01.05Interim Report Q404 27
2004 – strategic moves and important deals
• EDB quantum leaping from acquisitions;
– Telenor, IBM and Capgemini
• EDB outperforming key competitors in size and number of deals
– 13 deals > NOK 100 million – Restructuring of Nordic IT-services
market to accelerate
• Several large out-sourcing deals expected in 2005 and 2006
• Global and regional players positioning to capture new growth
31.01.05Interim Report Q404 28
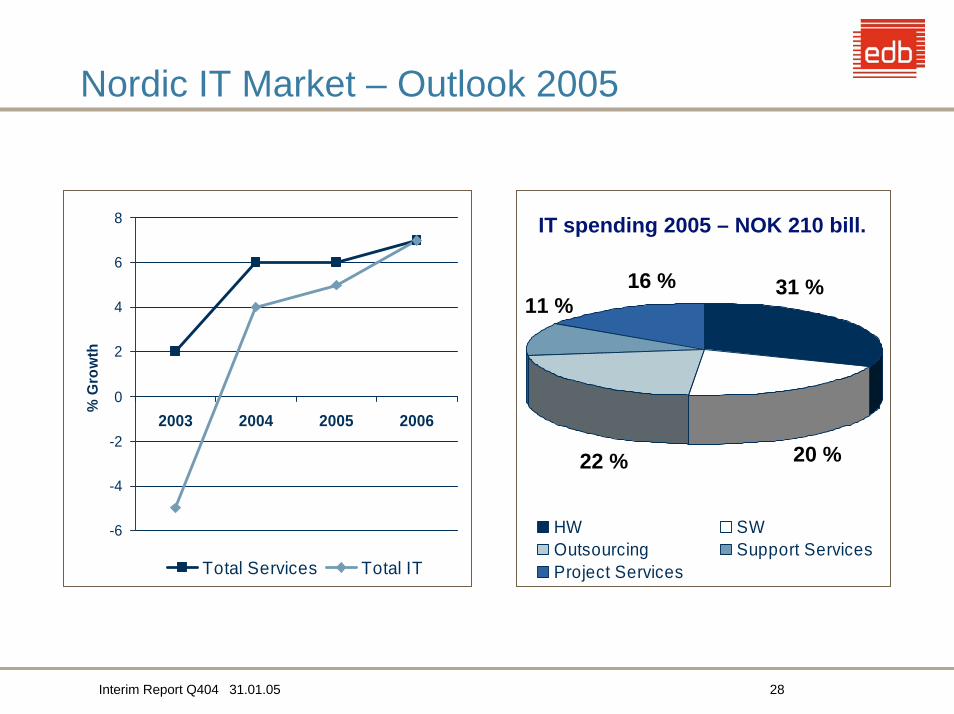
Nordic IT Market – Outlook 2005
-6
-4
-2
0
2
4
6
8
2003 2004 2005 2006
% G
row
th
Total Services Total IT
HW SWOutsourcing Support ServicesProject Services
IT spending 2005 – NOK 210 bill.
31 %16 %
20 %22 %
11 %

31.01.05Interim Report Q404 29
Nordic IT Outsourcing – Top 10 players
IBM GlobalCSC GlobalEDB RegionalTietoEnator RegionalHP GlobalWM Data RegionalErgo Group LocalEDS GlobalKMD LocalCapgemini Global
Company name Player
Source ; IDC (2004 estimates)

31.01.05Interim Report Q404 30
Nordic IT Services – Top 10 players
IBM GlobalTietoEnator RegionalWM Data RegionalHP GlobalCSC GlobalEDB RegionalAccenture GlobalKMD LocalAtos RegionalEmentor Regional
Company name Player
Source ; IDC (2004 estimates)
31.01.05Interim Report Q404 31
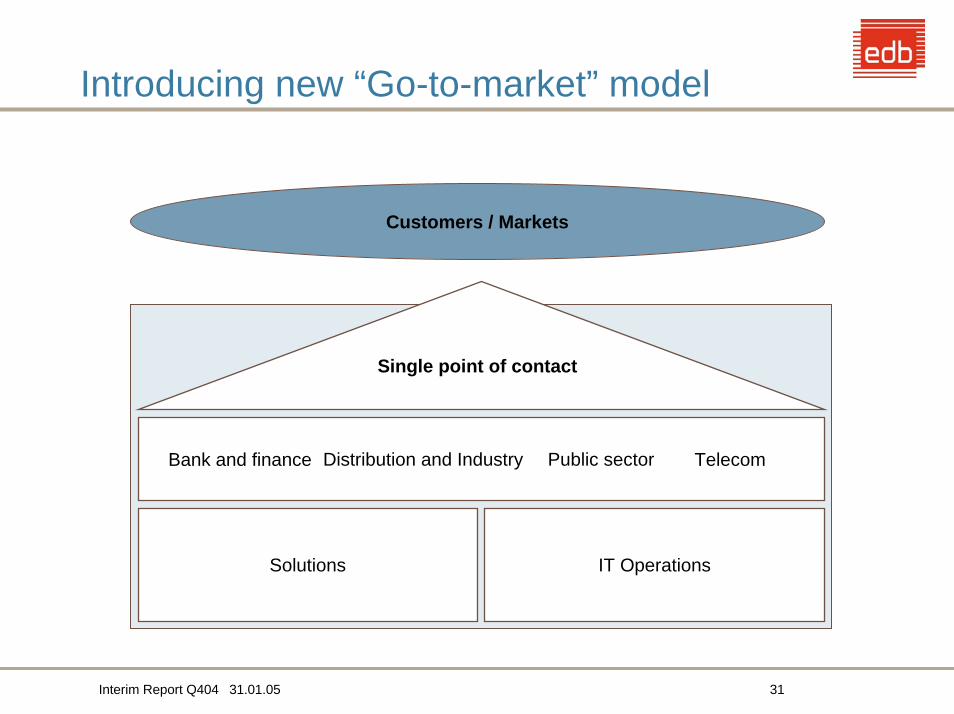
Introducing new “Go-to-market” model
Customers / Markets
Single point of contact
Solutions IT Operations
Bank and finance Distribution and Industry TelecomPublic sector

31.01.05Interim Report Q404 32
Summary
• Cost reductions programs on track
• Profitable growth in 2004
• Gaining share in new market segments
• Growing more than market in 2005
• Continuous growth in Sweden