ectomycorrhizal fungi contribute to soil organic matter cycling in sub-boreal forests
TRANSCRIPT

ORIGINAL ARTICLE
Ectomycorrhizal fungi contribute to soil organicmatter cycling in sub-boreal forests
Lori A Phillips1,2, Valerie Ward1 and Melanie D Jones1
1Department of Biology, University of British Columbia, Kelowna, British Columbia, Canada and 2Departmentof Environment and Primary Industries, Biosciences Research Division, Bundoora, Victoria, Australia
Soils of northern temperate and boreal forests represent a large terrestrial carbon (C) sink. The fateof this C under elevated atmospheric CO2 and climate change is still uncertain. A fundamentalknowledge gap is the extent to which ectomycorrhizal fungi (EMF) and saprotrophic fungi contributeto C cycling in the systems by soil organic matter (SOM) decomposition. In this study, we used anovel approach to generate and compare enzymatically active EMF hyphae-dominated andsaprotrophic hyphae-enriched communities under field conditions. Fermentation-humus (FH)-filledmesh bags, surrounded by a sand barrier, effectively trapped EMF hyphae with a communitystructure comparable to that found in the surrounding FH layer, at both trophic and taxonomiclevels. In contrast, over half the sequences from mesh bags with no sand barrier were identified asbelonging to saprotrophic fungi. The EMF hyphae-dominated systems exhibited levels of hydrolyticand oxidative enzyme activities that were comparable to or higher than saprotroph-enrichedsystems. The enzymes assayed included those associated with both labile and recalcitrant SOMdegradation. Our study shows that EMF hyphae are likely important contributors to currentSOM turnover in sub-boreal systems. Our results also suggest that any increased EMF biomassthat might result from higher below-ground C allocation by trees would not suppress C fluxes fromsub-boreal soils.The ISME Journal (2014) 8, 699–713; doi:10.1038/ismej.2013.195; published online 31 October 2013Subject Category: Microbial ecology and functional diversity of natural habitatsKeywords: carbon cycling; ectomycorrhizal fungi; enzyme activity; hyphal trap bags; mycelia;soil organic matter
Introduction
Northern temperate and boreal forests representa large carbon (C) sink, with an estimated half agigatonne of C sequestered in above ground biomassevery year (Myneni et al., 2001). Much of this C iseventually transferred below ground, either after thedeath or annual senescence of vegetation or directlyvia photosynthetic transfer to root systems andassociated ectomycorrhizal fungi (EMF). These soilsstore up to three times the amount of C as is storedin the above ground vegetation, primarily in theform of soil organic matter (SOM) (Schmidt et al.,2011). These C sinks have the potential to become Csources under the projected global climate change(IPCC, 2007). Although some climate modelsassume increased C storage in temperate forest soilsbecause of the increased plant allocation of photo-synthetic C to roots and symbiotic fungi (Drigo et al.,2010; Orwin et al., 2011; Clemmensen et al., 2013),there is a high degree of uncertainly in this
assumption (Higgins and Harte, 2012). Increased Callocation with elevated CO2 may not only be short-lived (Norby et al., 2010), but concomitant increasesin mycorrhizal and mycorrhizosphere activity maystimulate decomposition of previously recalcitrantSOM (Cheng et al., 2012; Phillips et al., 2012b).Fundamental gaps in our understanding of terres-trial C cycling, including the relative contributionsof EMF and other fungi to the release of SOM-C(Bargett, 2011), limit the predictive capability ofcurrent models (Von Lutzow and Kogel-Knabner,2009; Hayes et al., 2012).
Fungi, especially saprotrophic fungi, are thoughtto dominate organic matter turnover in temperateforest soils (Baldrian, 2008). Certain groups ofsaprotrophic fungi, specifically the white rot fungi,have unique abilities to degrade wood because theypossess numerous copies of class II peroxidases(Floudas et al., 2012). Both saprotrophic and EMFspecies, however, produce a range of hydrolyticand oxidative enzymes that have the potential tobreak down C-containing compounds and mobilizenutrients from SOM (Courty et al., 2010; Floudaset al., 2012). Although photosynthates are likely theprimary source of C used by EMF under idealconditions (Treseder et al., 2006; Wolfe et al., 2012),current research suggests that these fungi may also
Correspondence: LA Phillips, Department of Environment andPrimary Industries-AgriBioSciences Centre, Biosciences ResearchDivision, 5 Ring Road, Bundoora 3083, Victoria, Australia.E-mail: [email protected] 8 July 2013; revised 25 September 2013; accepted 26September 2013; published online 31 October 2013
The ISME Journal (2014) 8, 699–713& 2014 International Society for Microbial Ecology All rights reserved 1751-7362/14
www.nature.com/ismej
directly (Vaario et al., 2012) or indirectly (Rineauet al., 2012) access SOM-C pools.
Recalcitrant SOM, including lignin and humiccomplexes, is predominantly found in soil horizonsdominated by EMF mycelial networks (Lindahlet al., 2007). These mycelia are present at up to600 kg of hyphae per hectare (Wallander et al., 2001;Hendricks et al., 2006) and account for up toone-third of the total microbial biomass in conifer-ous forests (Hogberg and Hogberg, 2002; Cairney,2012). Although EMF mats are known to increasetotal soil CO2 respiration (Phillips et al., 2012a),the full contribution of these fungi, and theirextensive mycelia, to decomposition processesremains unknown (van der Wal et al., 2012). Giventhe current interest in the C sequestration potentialof boreal and temperate forests (De Luca andBoisvenue, 2012), as well as the influence of anyincreased C allocation below ground by plants, therole of EMF mycelia in SOM-C turnover warrantsincreased investigation (Talbot et al., 2008; Ekbladet al., 2013).
Current research to estimate the extent andactivity of EMF mycelia rely on methods to excluderoots and most saprotrophic fungi from a givenzone in the soil profile. Hyphal in-growth cores orbags are commonly used (Wallander et al., 2001).These hyphae traps are usually filled with an inertsubstrate, such as sand, that minimizes colonizationby saprotrophic fungi (Korkama et al., 2007; Lindahlet al., 2007; Wallander et al., 2010). In somecases, additional nutrient sources are added toensure sufficient hyphal colonization or to evaluatethe impact of limiting nutrients on EMF biomassproduction (Hagerberg and Wallander, 2002;Hagerberg et al., 2003; Hedh et al., 2008; Potilaet al., 2009; Berner et al., 2012). However, thecaptured extramatrical hyphae may not accuratelyrepresent the composition or abundance of EMFcommunities in the surrounding soil (Hendrickset al., 2006; Kjøller, 2006). Further, enzymeexpression and activity is downregulated when nonutrients are present (Wright et al., 2005). In order toestimate the contribution of EMF to the terrestrial Ccycle, the potential SOM-degrading enzyme activityin locally abundant EMF hyphae needs to bedetermined.
To investigate the relative contribution of EMFmycelia to enzyme activities in a sub-boreal spruceforest, we buried mesh bags filled with sterilizedorganic material with or without a surrounding sandbarrier. Bags with a sand barrier were served to trapenzymatically active EMF hyphae while excludingobligately saprotrophic hyphae. Filling the meshbags with fermentation-humic (FH) substrate takenfrom the same soil in which the traps were to beburied enabled a direct comparison between theEMF hyphae in the mesh bags and the surroundingFH layer. Based on our previous research, whichshowed that EMF root tips in these ecosystems hadhigh hydrolytic and oxidative enzyme activities
(Jones et al., 2010, 2012), we hypothesizedthat EMF-dominated communities would have aSOM-degradation potential comparable to thatof saprotroph-dominated communities. High-throughput sequencing, which combined withcomprehensive measures of enzymes involved inSOM turnover, allowed us to evaluate the relativeabundance and structure of fungal communities andto elucidate the potential role of EMF fungi in thesoil C cycle.
Materials and methods
Field siteThe field site was part of a British ColumbiaMinistry of Forests study that investigated theimpact of fertilization on forest productivity andbelow-ground ecosystem processes (Brockley andSimpson, 2004). The current study occurred at theCrow Creek site, established in 1994 near Houston,British Columbia, Australia (541 200 1261 170) in thesub-boreal spruce biogeoclimatic zone, on EluviatedDystric Brunisol to Orthic Humo-Ferric Podzol soils.Each treatment within the site consisted 0.164hectare plots replicated three times. The currentstudy utilized the non-fertilized control and twofertilized (annually and every 6 years) treatments;for further site information refer to Brockley andSimpson (2004). During the season of this study,the FH layer averaged 33% total C, 1.06% totalN, 64% organic matter, NH4-N, NO3-N and availableP of 46, 2.9 and 346 mg kg�1, respectively, andpH(CaCl2) 4.35 (British Columbia Ministry of ForestsResearch Laboratory, Victoria, British Columbia,Australia).
Mesh bag construction for EMF extramatricalhyphal captureFH layer substrate was collected from each treat-ment plot in the fall of 2008. Ten random sub-samples per plot were composited, sieved (4.5 mm)and stored at 4 1C until use. Eleven hyphal trap bags(4.5� 3.5 cm) were constructed for each treatmentplot (99 bags in total) using 50 mm mesh (NITEX03-50/31; Sefar Inc., Depew, NY, USA). Each bag wasfilled with 15 g FH substrate, heat-sealed and thensterilized by gamma irradiation with a total dose of6 Mrad (2� 3 Mrad with a 1 week resting interval).Post irradiation, bags were stored at 4 1C for an8-week stabilization period to minimize residualenzyme activity (Lensi et al., 1991). Substrate fromone bag from each plot was serially diluted inmonopotassium phosphate buffer, plated in tripli-cate on modified Melin–Norkrans or tryptic soy agarplates (Phillips et al., 2006) and incubated for 1month to assess for fungal or bacterial contamina-tion, respectively. No bacterial or fungal growth wasobserved on culture plates after 1 month of incuba-tion, indicating that two consecutive doses ofirradiation effectively eliminated residual spores.
EMF and soil organic matter cyclingLA Phillips et al
700
The ISME Journal

Irradiation did not significantly change the pH of thesubstrates. Another sub-sample of these controlswas assessed for residual enzyme activity and pH.Bags intended to capture EMF but exclude sapro-trophic hyphae (n¼ 5 per plot) were placed withinsand-filled plastic containers (NetPak, Coquitlam,British Columbia, Australia). These containers werepunched with circular holes (6 mm diameter;28 holes per horizontal face and 10 holes pervertical face) to allow hyphal access, lined with a50-mm NITEX mesh and filled to a depth of 1 cmwith sterile silica sand (HCl acid washed andautoclaved). Substrate-containing mesh bags wereplaced on the sand, covered with 1 cm additionalsand and then a final top layer of mesh was sealed tothe initial liner using silicone sealant to form acontinuous mesh envelope (SupplementaryFigure 1). Bags intended to capture both EMF andsaprotrophic hyphae (n¼ 5 each plot) were alsoencapsulated within another layer of mesh, but hadno intervening sand barrier.
Hyphal trap bags were buried at the Crow Creeksite on 5 June 2009. Each set of bags (with or withoutsand barriers, þSB and –SB, respectively) wereplaced in the FH layer of the treatment plots fromwhich the substrates were originally taken. One pairof þSB and –SB bags was buried at five randomspots within each plot, 60 cm from the base of a treeand 60 cm from each other. All bags and an FHsample (10� 10 cm) from between each set wereharvested on 1 October 2009. Upon return to thelab, the five þSB, �SB or FH sub-samplesfrom individual plots were composited, so that asingle representative þSB, �SB and FH samplewas obtained per plot. Sand from the þS mesh bagswas also composited on a plot basis. Half of eachcomposited sample was frozen at � 20 1C for sub-sequent molecular analysis and half was stored at4 1C overnight for use in enzyme assays.
Enzyme assaysAll þSB, �SB, FH, sand and residual-activitycontrol samples, as well as EMF tips selected fromthe FH samples, were assessed for their organic matterbreakdown potential. The assessed enzymes includedb-1,4-glucosidase (EC 3.2.1.21), cellobiohydrolase (EC3.2.1.91), b-1,4-xylosidase (EC 3.2.1.37), peroxidase(EC 1.11.1.7), laccase (EC 1.10.3.2), phenol oxidase(EC 1.14.18.1 and EC 1.10.3.2), b-1,4-N-acetylglucosa-minidase (EC 3.2.1.52), acid phosphatase (EC 3.1.3.2),leucine aminopeptidase (EC 3.4.11.1) and sulfatase(EC 3.1.6.1). Note that although laccases are phenoloxidases, the term laccase is used in the study todifferentiate a 2,20-azino-bis(3-ethylbenzothiazoline-6sulfonic acid) diammonium salt (ABTS) assay from aL-3, 4-dihydroxyphenylalanine (L-DOPA) assay.Full details of assay conditions are provided inSupplementary Table S1. All assays except laccase,peroxidase and phenol oxidase were fluorometric.
For þSB, �SB, FH and residual-activity controlassays, 5 g of sample was homogenized with asterile mortar and pestle, 0.1 g of sub-sample wastransferred to a sterile Nalgene bottle containing100 ml of 50 mM sodium acetate buffer (pH 5.0),and then suspensions were shaken for 1 h at500 r.p.m. Sand samples were similarly processedusing 10 g of sample and 1 g of sub-sample. Fluoro-metric and colorimetric assays were then performedaccording to previously published methods (Saiya-Cork et al., 2002 and Sinsabaugh et al., 2003), fullydescribed in the Supplementary Information.
For EMF tip assays, roots from the FH samplewere gently washed, separated under a dissectingmicroscope, and B7 turgid EMF tips from each ofthe four most common observed morphotypeswere randomly selected from each sample. Tipswere cleaned of debris and placed in individualmicrosieves in 96-well microplates containing75 mM Tris-maleic acid buffer (pH 4.5) to equilibratefor at least 5 min before beginning the sequentialenzyme assays (Supplementary Table S1). Fluoro-metric and colorimetric assays were then performedaccording to previously published methods (Courtyet al., 2005 and Pritsch et al., 2004), fully describedin the Supplementary Information. After the finalassay, tips were removed from the sieves andscanned (Scanmaker 8700; Microtek Lab, Sante FeSprings, CA, USA), and their surface areas weredetermined (WinRHIZO, Regent Instruments,Quebec, QC, Canada). Tips were then frozen at� 80 1C for subsequent molecular analysis. The totalenzymatic activity of EMF tips per plot wasdetermined by averaging the activities of all tips.EMF taxon-specific activities were determined byaveraging the activity of the (up to) seven EMF tipsper plot, whose identities were confirmed bymorphological and molecular identification.
Identification of fungal communities
Sequencing of ectomycorrhizal tips. DNA wasextracted from EMF tips using the Sigma Extract-N-Amp Plant Kit (Sigma-Aldrich, St Louis, MO,USA). Extraction solution (25ml) was added to eachEMF tip that was incubated at 95 1C for 10 min, afterwhich 25ml of dilution solution was added. TheITS1f and ITS4 primers (White et al., 1990; Gardesand Bruns, 1993) were used to amplify the fungalITS1, 5.8S and ITS2 region. Each 50ml reactioncontained 1.5ml of template DNA, 2.5ml of each10mM primer and 25ml GoTaq master mix (Promega,Madison, WI, USA). Following an initial denatura-tion step of 95 1C for 3 min, amplification proceededfor 35 cycles of 94, 50 and 72 1C per min, with a finalextension step of 10 min at 72 1C. PCR products werevisualized on 1.4% agarose gels (SYBR Safe; Invitrogen,Carlsbad, CA, USA). PCR products producing singlebands were cleaned using the Mag-Bind E-Z pure(Omega Bio-tek Inc., Norcross, GA, USA) system and
EMF and soil organic matter cyclingLA Phillips et al
701
The ISME Journal

sequenced (Applied Biosystems; 3130xl GeneticAnalyzer, Foster City, CA, USA). If more than oneband was produced (that is, from some tipsmorphologically identified as Cenococcum spp.),bands were extracted from the gel using an E.Z.N.Agel extraction kit (Omega Bio-tek Inc.) beforecleanup and sequencing. Sequences were submittedfor comparison with the GenBank databases usingthe BLAST algorithm (Altschul et al., 1997).
Sequencing of fungi in hyphal trap bag and FHsubstrates. Total community DNA was extractedfrom 0.5 g of all þSB, �SB and FH samples usingthe UltraClean Soil DNA Isolation Kit (Mo BioLaboratories Inc., Carlsbad, CA, USA). DNA wasextracted from 5 g sand samples using a previouslypublished bead-beating method (Phillips et al., 2006)suitable for large samples. Duplicate DNA extractionswere performed for each sample and pooled.
The ITS1 and partial 5.8S regions were amplifiedusing the ITS1f (Gardes and Bruns, 1993) and ITS2r(White et al., 1990) primer pair (Integrated DNATechnologies, Coralville, IA, USA). Amplicons weregenerated for 454-pyrosequencing in a single-stepreaction using the following fusion primers:50-TitaniumA-Multiplex Identifier-ITS1f-30 and 50-Tita-niumB-ITS2r-30 (Supplementary Table S2). Tripli-cate amplifications were performed for each sample.Each 50 ml amplification reaction contained 0.2 mM
each primer, 200 mM dNTP mix, 2 mM MgSO4,1� PCR reaction buffer, 1 U Platinum Taq DNAPolymerase (Invitrogen) and 5, 10 or 20 ng of sampleDNA. Following an initial denaturation step of 94 1Cfor 2 min, amplification proceeded for 35 cycles of94 and 55 1C per 30 s, and 68 1C per min, with a finalextension of 68 1C for 10 min. PCR products werevisualized on 1.4% agarose gels (SYBR Safe;Invitrogen), replicate reactions were pooled andPCR amplicons were cleaned using the Mag-BindE–Z pure (Omega Bio-tek Inc.) purification system.
Amplicon concentration was determined spectro-photometrically (NanoDrop ND-1000 Spectrophot-ometer) and both concentration and purity (that is,complete removal of primer-dimers) were verified on a1.4% agarose gel (SYBR Safe; Invitrogen). EquimolarPCR amplicons from each sample (equivalent to 200 ngeach) were pooled to create two Amplicon Librariesthat which were sequenced on half a plate each usingthe 454 GS FLX Titanium platform (Roche Diagnostics,Basel, Switzerland) at the Genome Quebec InnovationCenter, Montreal, Quebec, Canada. Results weredelivered as tag-sorted sequences, quality controlledfor the presence of the complete primer-tag.
Bioinformatic analysisPrimer sequences were removed and additionalquality filtering and trimming was performed usingMOTHUR (Schloss et al., 2009). Sequences withany ambiguous (N) bases, more than eight homo-polymers, shorter than 180 or longer than 400 bp, or
with greater than 1 bp difference in the primersequence were removed. Subsets of the excludedsequences were manually assessed for fungal group-specific biases. The quality filtered and trimmedsequences were then processed using the FungalITSextractor software (Nilsson et al., 2010), whichextracts the variable ITS1 of the nuclear ITS1 regionfrom the sequence, thus eliminating false align-ments and clusters being generated based on theconserved 18S and 5.8S regions. The extracted ITS1sequences were clustered at 98% (Ryberg et al.,2008) similarity (global alignment) using CD-Hit-Est(Huang et al., 2010). Representative sequences fromall clusters (operational taxonomic unit, OTU) wereused for BLAST searches against fully identifiedentries in INSD (Benson et al., 2011) and UNITE(Abarenkov et al., 2010a), using the PlutoF onlineserver (Abarenkov et al., 2010b). A minimum of 97%similarity across 97% of the sequence length wasrequired for positive taxonomic identification at anylevel. Singleton OTUs with 100% similarity toreference sequences not otherwise identified in thedata set were retained, and all other singletons werediscarded before statistical analysis. All sequences,fastq formatted on the Galaxy online server(Blankenberg et al., 2010), were deposited in theNCBI Short Read Archive under the accessionnumber SRP022584.
All OTUs greater than four reads within the dataset were placed into designated ecological functiongroups, determined by cross referencing Lawry andDiederich (2003), Rinaldi et al. (2008), Hibbet et al.(2000) and Moore et al. (2011). The groups wereEMF, other mycorrhizal (ericoid, arbutoid, mono-tropoid and arbuscular) fungi, saprotrophs, patho-gens, endophytes, yeasts and lichen fungi. Fungiknown to belong to more than one of these groupswere designated as mixed functional groups,whereas those whose ecological function isunverified were designated as functional groupUnknown.
Statistical analysisBefore statistical analysis, 454 taxonomic data werenormalized by dividing the absolute abundance ofindividual OTUs by total OTU’s within a sample(Gihring et al., 2012). Data were log transformedwherever required to meet the assumptionsof different statistical tests (Kenkel, 2006). Relation-ships between the þSB, �SB, FH and sandsubstrates were assessed using the statistical soft-ware package PAST (v 2.17; Hammer et al., 2001).Differences in taxonomy and enzyme activity wereexamined by analysis of variance (Welch’s analysisof variance, if variances are unequal, as assessedusing the Levene statistic), followed by a Tukeyor Mann–Whitney test to determine where signifi-cant differences occurred. Relationships betweenenzyme activities were assessed using Spearman’s rcorrelation test.
EMF and soil organic matter cyclingLA Phillips et al
702
The ISME Journal

Cluster analysis of functional and taxonomicfungal groups was performed using a correlationmatrix based on Pearson’s r correlation (1-r; PAST2.17; Bolhuis and Stal, 2011). Species richness (S),evenness (H/ln(S)) and diversity (Fisher’s Alpha (a),Shannon (H) and Simpson’s indices) of the fungalcommunities were calculated using proceduresavailable in PAST (v 2.17; Hammer et al., 2001).Patterns of enzyme activity were assessed byprinciple component analysis (PCA; Kenkel, 2006)in PC-ORD (McCune and Mefford, 2011). Relation-ships between enzyme activity and communitystructure were assessed by regressing enzyme PCA-loading factors with fungal community abundance(log transformed). Fungal communities significantly(Po0.05) associated with patterns of enzyme activ-ity were illustrated as joint plot vectors overlaid onthe enzyme ordinations (Ramette, 2007).
Results
General sequencing statisticsA total of 1 151 401 sequences were generated bypyrosequencing the ITS1 region of DNA extractedfrom hyphal trap substrates, barrier sand and forestfloor samples. Quality filtering removed 362 946sequences, primarily due to length constraints orlack of a complete primer sequence, leaving a totalof 788 455 ITS1 region sequences for analysis.The 36 individually assessed samples generated anaverage of 32 000 sequences and an average of22 000 quality filtered sequences (SupplementaryTable S3). Clustering at 98% similarity resulted inan average of 546 OTUs per sample (singletonsincluded), with rarefaction curves for most samplesbeginning to plateau (Supplementary Figure S2).The use of a stringent 98% clustering level meantthat some similar OTUs were split into differentclusters. These clusters were combined if they wereidentified through BLAST analysis, representing thesame fungal OTU. A total of 5541 singletons clusters(clusters containing 1–2 sequences) that did notmatch any database sequences were removed fromthe data set (Supplementary Table S3).
Fungal taxonomic diversityApproximately 94% of the sequences were matchedto fungal sequences in the INSD and UNITEdatabases (Figure 1a). A total of 353 fungal OTUswere identified, including 243 fungi identified tothe genus level (Supplementary Table S4). A largepercentage of the identified fungi, found in allsystems, were members of Basiodiomycota andAscomycota (Figure 1a). In hyphal traps without asand barrier (�SB) however, 44% of the sequencesbelonged to Fungi Incertae sedis. Hyphal traps witha sand barrier (þSB) and the surrounding FH layercontained numerous sequences that matched thoseof unidentified EMF amplified from root tips (21%and 11%, respectively). At this level of taxonomy,
FH and þSB fungal communities clustered at ahigh level of similarity, whereas �SB communitiesformed a distinct cluster (Figure 1b). This separationwas primarily due to significantly higher numbers ofFungi I. sedis in the absence of a sand barrier(Figure 1c). The presence of these fungi separatedthese �SB communities into distinct clusters atall levels of taxonomy (Supplementary Figure S3).
The lowest richness and diversity occurred in�SB communities, which had significantly fewerfungal taxa than the FH samples (Table 1). The FHcommunities had the highest level of diversity;however, all communities were populated by afew relatively abundant taxa (Table 2). Notably,the Fungi I. sedis saprotroph Mortierella was thesingle-most abundant taxon (44% of sequences)found in �SB communities. By contrast, Mortierellaspp. accounted for only 8% of sequences in FH and
Figure 1 Fungal taxonomic diversity in the different hyphal trapbags, sand barriers and FH layers of the forest floor. �SB, hyphaltrap bags with no sand barrier; FH, in situ fermentation-humiclayer; þSB, hyphal trap bags with sand barrier; Sand, sandbarrier; n¼9 each. (a) The relative abundance of different phylaor group in each compartment. The total number of contributingsequence reads is indicated next to each histogram. (b) Clusteranalysis of taxonomic diversity indicating the percent similarity(based on Pearson’s r correlation) of communities in the differentcompartments. (c) Differences in the abundance of eachtaxonomic group. Communities in the same row with differentletters are different at the indicated significance level; NS, notsignificant. Unknown EMF indicates that the best matchingsequences belonged to unidentified ectomycorrhizal tips.Unknown fungi indicates that the best matching sequencebelonged to the kingdom Fungi.
EMF and soil organic matter cyclingLA Phillips et al
703
The ISME Journal
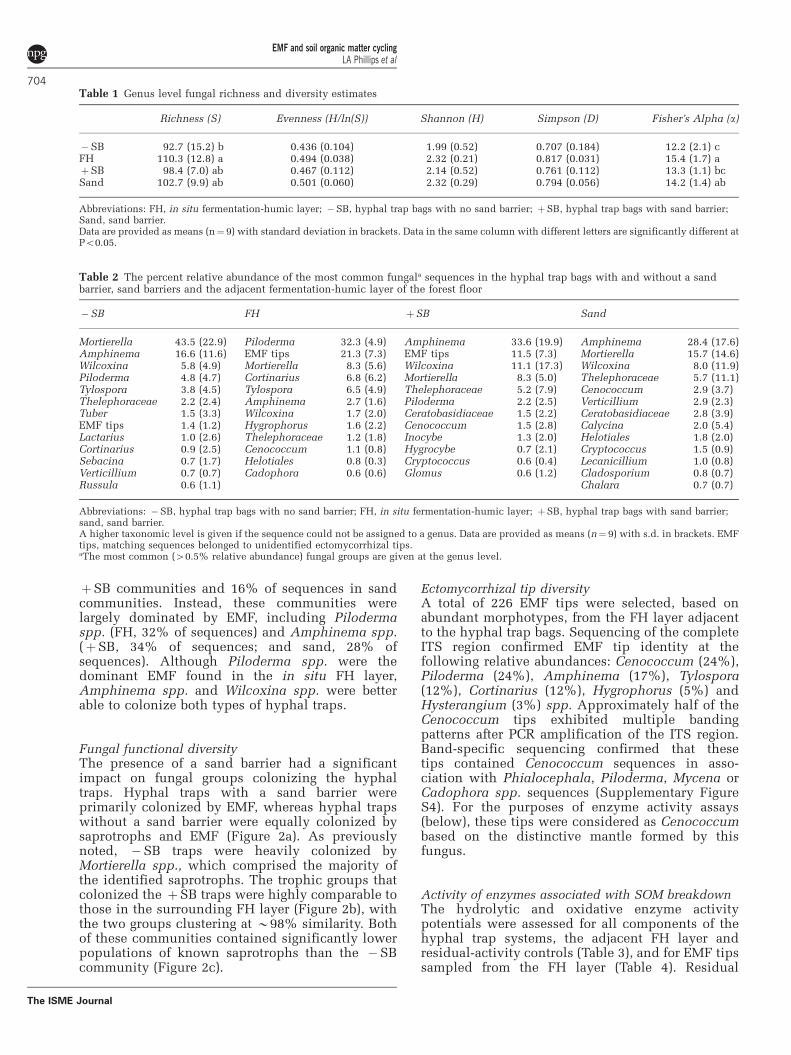
þSB communities and 16% of sequences in sandcommunities. Instead, these communities werelargely dominated by EMF, including Pilodermaspp. (FH, 32% of sequences) and Amphinema spp.(þSB, 34% of sequences; and sand, 28% ofsequences). Although Piloderma spp. were thedominant EMF found in the in situ FH layer,Amphinema spp. and Wilcoxina spp. were betterable to colonize both types of hyphal traps.
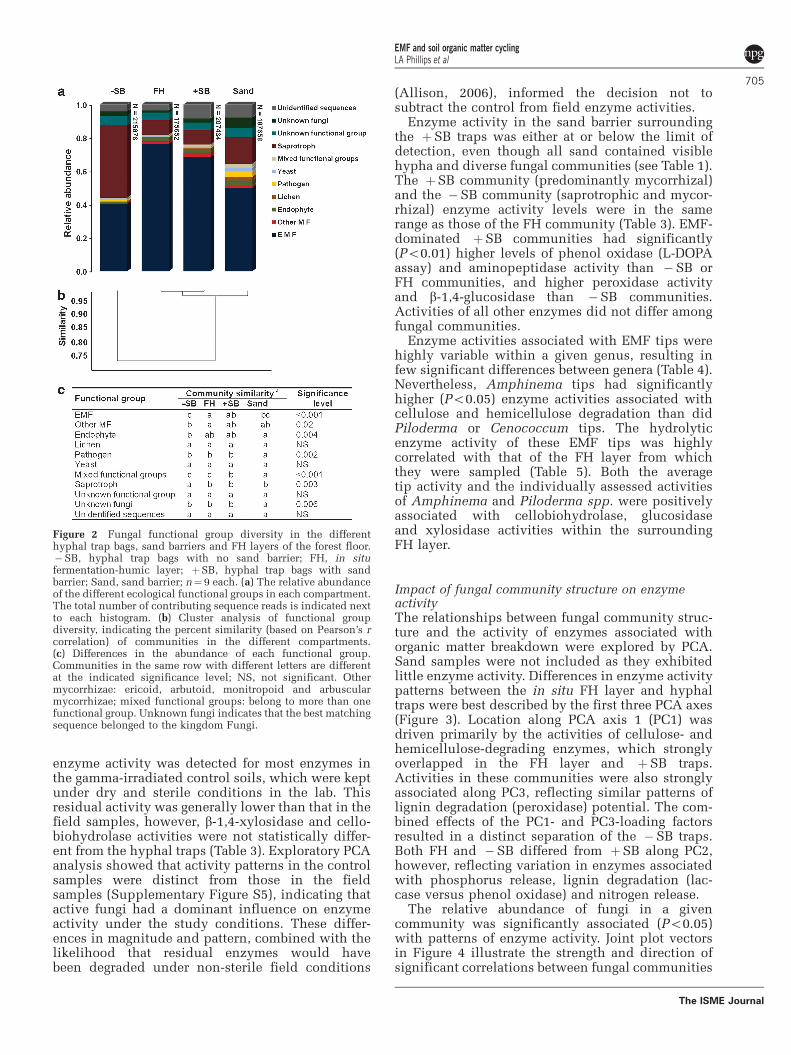
Fungal functional diversityThe presence of a sand barrier had a significantimpact on fungal groups colonizing the hyphaltraps. Hyphal traps with a sand barrier wereprimarily colonized by EMF, whereas hyphal trapswithout a sand barrier were equally colonized bysaprotrophs and EMF (Figure 2a). As previouslynoted, �SB traps were heavily colonized byMortierella spp., which comprised the majority ofthe identified saprotrophs. The trophic groups thatcolonized the þSB traps were highly comparable tothose in the surrounding FH layer (Figure 2b), withthe two groups clustering at B98% similarity. Bothof these communities contained significantly lowerpopulations of known saprotrophs than the �SBcommunity (Figure 2c).
Ectomycorrhizal tip diversityA total of 226 EMF tips were selected, based onabundant morphotypes, from the FH layer adjacentto the hyphal trap bags. Sequencing of the completeITS region confirmed EMF tip identity at thefollowing relative abundances: Cenococcum (24%),Piloderma (24%), Amphinema (17%), Tylospora(12%), Cortinarius (12%), Hygrophorus (5%) andHysterangium (3%) spp. Approximately half of theCenococcum tips exhibited multiple bandingpatterns after PCR amplification of the ITS region.Band-specific sequencing confirmed that thesetips contained Cenococcum sequences in asso-ciation with Phialocephala, Piloderma, Mycena orCadophora spp. sequences (Supplementary FigureS4). For the purposes of enzyme activity assays(below), these tips were considered as Cenococcumbased on the distinctive mantle formed by thisfungus.
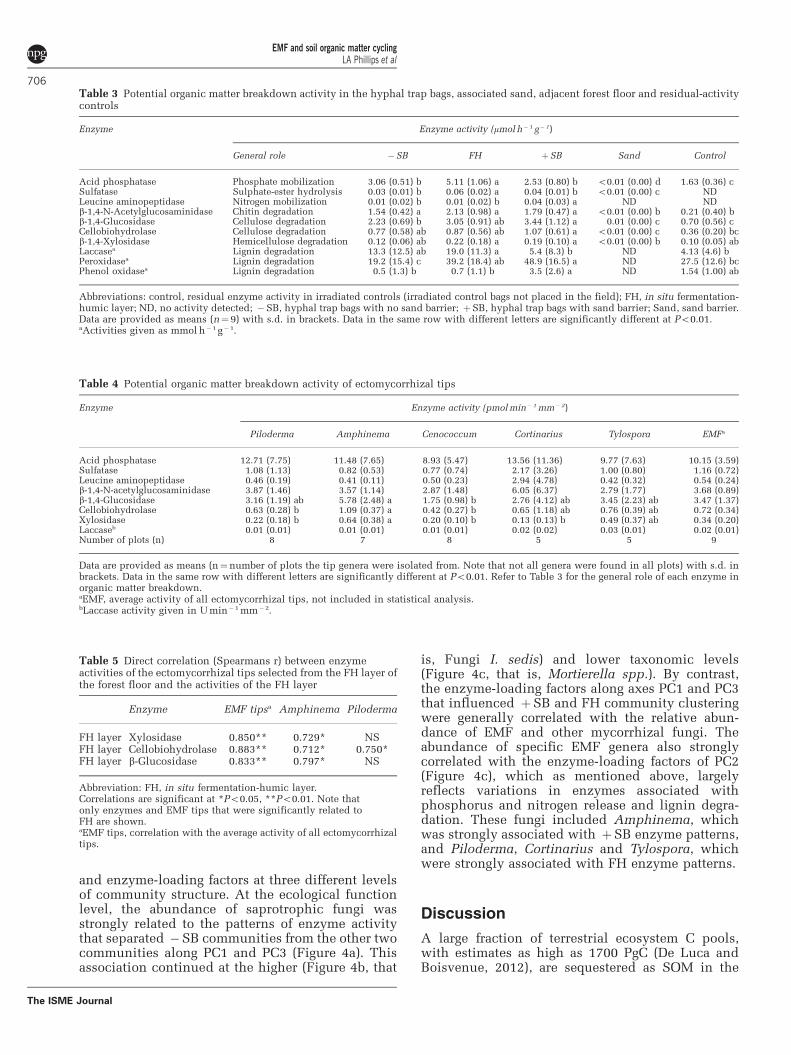
Activity of enzymes associated with SOM breakdownThe hydrolytic and oxidative enzyme activitypotentials were assessed for all components of thehyphal trap systems, the adjacent FH layer andresidual-activity controls (Table 3), and for EMF tipssampled from the FH layer (Table 4). Residual
Table 1 Genus level fungal richness and diversity estimates
Richness (S) Evenness (H/ln(S)) Shannon (H) Simpson (D) Fisher’s Alpha (a)
�SB 92.7 (15.2) b 0.436 (0.104) 1.99 (0.52) 0.707 (0.184) 12.2 (2.1) cFH 110.3 (12.8) a 0.494 (0.038) 2.32 (0.21) 0.817 (0.031) 15.4 (1.7) aþSB 98.4 (7.0) ab 0.467 (0.112) 2.14 (0.52) 0.761 (0.112) 13.3 (1.1) bcSand 102.7 (9.9) ab 0.501 (0.060) 2.32 (0.29) 0.794 (0.056) 14.2 (1.4) ab
Abbreviations: FH, in situ fermentation-humic layer; �SB, hyphal trap bags with no sand barrier; þSB, hyphal trap bags with sand barrier;Sand, sand barrier.Data are provided as means (n¼ 9) with standard deviation in brackets. Data in the same column with different letters are significantly different atPo0.05.
Table 2 The percent relative abundance of the most common fungala sequences in the hyphal trap bags with and without a sandbarrier, sand barriers and the adjacent fermentation-humic layer of the forest floor
�SB FH þSB Sand
Mortierella 43.5 (22.9) Piloderma 32.3 (4.9) Amphinema 33.6 (19.9) Amphinema 28.4 (17.6)Amphinema 16.6 (11.6) EMF tips 21.3 (7.3) EMF tips 11.5 (7.3) Mortierella 15.7 (14.6)Wilcoxina 5.8 (4.9) Mortierella 8.3 (5.6) Wilcoxina 11.1 (17.3) Wilcoxina 8.0 (11.9)Piloderma 4.8 (4.7) Cortinarius 6.8 (6.2) Mortierella 8.3 (5.0) Thelephoraceae 5.7 (11.1)Tylospora 3.8 (4.5) Tylospora 6.5 (4.9) Thelephoraceae 5.2 (7.9) Cenococcum 2.9 (3.7)Thelephoraceae 2.2 (2.4) Amphinema 2.7 (1.6) Piloderma 2.2 (2.5) Verticillium 2.9 (2.3)Tuber 1.5 (3.3) Wilcoxina 1.7 (2.0) Ceratobasidiaceae 1.5 (2.2) Ceratobasidiaceae 2.8 (3.9)EMF tips 1.4 (1.2) Hygrophorus 1.6 (2.2) Cenococcum 1.5 (2.8) Calycina 2.0 (5.4)Lactarius 1.0 (2.6) Thelephoraceae 1.2 (1.8) Inocybe 1.3 (2.0) Helotiales 1.8 (2.0)Cortinarius 0.9 (2.5) Cenococcum 1.1 (0.8) Hygrocybe 0.7 (2.1) Cryptococcus 1.5 (0.9)Sebacina 0.7 (1.7) Helotiales 0.8 (0.3) Cryptococcus 0.6 (0.4) Lecanicillium 1.0 (0.8)Verticillium 0.7 (0.7) Cadophora 0.6 (0.6) Glomus 0.6 (1.2) Cladosporium 0.8 (0.7)Russula 0.6 (1.1) Chalara 0.7 (0.7)
Abbreviations: �SB, hyphal trap bags with no sand barrier; FH, in situ fermentation-humic layer; þSB, hyphal trap bags with sand barrier;sand, sand barrier.A higher taxonomic level is given if the sequence could not be assigned to a genus. Data are provided as means (n¼ 9) with s.d. in brackets. EMFtips, matching sequences belonged to unidentified ectomycorrhizal tips.aThe most common (40.5% relative abundance) fungal groups are given at the genus level.
EMF and soil organic matter cyclingLA Phillips et al
704
The ISME Journal
enzyme activity was detected for most enzymes inthe gamma-irradiated control soils, which were keptunder dry and sterile conditions in the lab. Thisresidual activity was generally lower than that in thefield samples, however, b-1,4-xylosidase and cello-biohydrolase activities were not statistically differ-ent from the hyphal traps (Table 3). Exploratory PCAanalysis showed that activity patterns in the controlsamples were distinct from those in the fieldsamples (Supplementary Figure S5), indicating thatactive fungi had a dominant influence on enzymeactivity under the study conditions. These differ-ences in magnitude and pattern, combined with thelikelihood that residual enzymes would havebeen degraded under non-sterile field conditions
(Allison, 2006), informed the decision not tosubtract the control from field enzyme activities.
Enzyme activity in the sand barrier surroundingthe þSB traps was either at or below the limit ofdetection, even though all sand contained visiblehypha and diverse fungal communities (see Table 1).The þSB community (predominantly mycorrhizal)and the �SB community (saprotrophic and mycor-rhizal) enzyme activity levels were in the samerange as those of the FH community (Table 3). EMF-dominated þSB communities had significantly(Po0.01) higher levels of phenol oxidase (L-DOPAassay) and aminopeptidase activity than �SB orFH communities, and higher peroxidase activityand b-1,4-glucosidase than �SB communities.Activities of all other enzymes did not differ amongfungal communities.
Enzyme activities associated with EMF tips werehighly variable within a given genus, resulting infew significant differences between genera (Table 4).Nevertheless, Amphinema tips had significantlyhigher (Po0.05) enzyme activities associated withcellulose and hemicellulose degradation than didPiloderma or Cenococcum tips. The hydrolyticenzyme activity of these EMF tips was highlycorrelated with that of the FH layer from whichthey were sampled (Table 5). Both the averagetip activity and the individually assessed activitiesof Amphinema and Piloderma spp. were positivelyassociated with cellobiohydrolase, glucosidaseand xylosidase activities within the surroundingFH layer.
Impact of fungal community structure on enzymeactivityThe relationships between fungal community struc-ture and the activity of enzymes associated withorganic matter breakdown were explored by PCA.Sand samples were not included as they exhibitedlittle enzyme activity. Differences in enzyme activitypatterns between the in situ FH layer and hyphaltraps were best described by the first three PCA axes(Figure 3). Location along PCA axis 1 (PC1) wasdriven primarily by the activities of cellulose- andhemicellulose-degrading enzymes, which stronglyoverlapped in the FH layer and þSB traps.Activities in these communities were also stronglyassociated along PC3, reflecting similar patterns oflignin degradation (peroxidase) potential. The com-bined effects of the PC1- and PC3-loading factorsresulted in a distinct separation of the �SB traps.Both FH and �SB differed from þSB along PC2,however, reflecting variation in enzymes associatedwith phosphorus release, lignin degradation (lac-case versus phenol oxidase) and nitrogen release.
The relative abundance of fungi in a givencommunity was significantly associated (Po0.05)with patterns of enzyme activity. Joint plot vectorsin Figure 4 illustrate the strength and direction ofsignificant correlations between fungal communities
Figure 2 Fungal functional group diversity in the differenthyphal trap bags, sand barriers and FH layers of the forest floor.�SB, hyphal trap bags with no sand barrier; FH, in situfermentation-humic layer; þSB, hyphal trap bags with sandbarrier; Sand, sand barrier; n¼ 9 each. (a) The relative abundanceof the different ecological functional groups in each compartment.The total number of contributing sequence reads is indicated nextto each histogram. (b) Cluster analysis of functional groupdiversity, indicating the percent similarity (based on Pearson’s rcorrelation) of communities in the different compartments.(c) Differences in the abundance of each functional group.Communities in the same row with different letters are differentat the indicated significance level; NS, not significant. Othermycorrhizae: ericoid, arbutoid, monitropoid and arbuscularmycorrhizae; mixed functional groups: belong to more than onefunctional group. Unknown fungi indicates that the best matchingsequence belonged to the kingdom Fungi.
EMF and soil organic matter cyclingLA Phillips et al
705
The ISME Journal
and enzyme-loading factors at three different levelsof community structure. At the ecological functionlevel, the abundance of saprotrophic fungi wasstrongly related to the patterns of enzyme activitythat separated �SB communities from the other twocommunities along PC1 and PC3 (Figure 4a). Thisassociation continued at the higher (Figure 4b, that
is, Fungi I. sedis) and lower taxonomic levels(Figure 4c, that is, Mortierella spp.). By contrast,the enzyme-loading factors along axes PC1 and PC3that influenced þSB and FH community clusteringwere generally correlated with the relative abun-dance of EMF and other mycorrhizal fungi. Theabundance of specific EMF genera also stronglycorrelated with the enzyme-loading factors of PC2(Figure 4c), which as mentioned above, largelyreflects variations in enzymes associated withphosphorus and nitrogen release and lignin degra-dation. These fungi included Amphinema, whichwas strongly associated with þSB enzyme patterns,and Piloderma, Cortinarius and Tylospora, whichwere strongly associated with FH enzyme patterns.
Discussion
A large fraction of terrestrial ecosystem C pools,with estimates as high as 1700 PgC (De Luca andBoisvenue, 2012), are sequestered as SOM in the
Table 3 Potential organic matter breakdown activity in the hyphal trap bags, associated sand, adjacent forest floor and residual-activitycontrols
Enzyme Enzyme activity (mmol h� 1 g�1)
General role �SB FH þSB Sand Control
Acid phosphatase Phosphate mobilization 3.06 (0.51) b 5.11 (1.06) a 2.53 (0.80) b o0.01 (0.00) d 1.63 (0.36) cSulfatase Sulphate-ester hydrolysis 0.03 (0.01) b 0.06 (0.02) a 0.04 (0.01) b o0.01 (0.00) c NDLeucine aminopeptidase Nitrogen mobilization 0.01 (0.02) b 0.01 (0.02) b 0.04 (0.03) a ND NDb-1,4-N-Acetylglucosaminidase Chitin degradation 1.54 (0.42) a 2.13 (0.98) a 1.79 (0.47) a o0.01 (0.00) b 0.21 (0.40) bb-1,4-Glucosidase Cellulose degradation 2.23 (0.69) b 3.05 (0.91) ab 3.44 (1.12) a 0.01 (0.00) c 0.70 (0.56) cCellobiohydrolase Cellulose degradation 0.77 (0.58) ab 0.87 (0.56) ab 1.07 (0.61) a o0.01 (0.00) c 0.36 (0.20) bcb-1,4-Xylosidase Hemicellulose degradation 0.12 (0.06) ab 0.22 (0.18) a 0.19 (0.10) a o0.01 (0.00) b 0.10 (0.05) abLaccasea Lignin degradation 13.3 (12.5) ab 19.0 (11.3) a 5.4 (8.3) b ND 4.13 (4.6) bPeroxidasea Lignin degradation 19.2 (15.4) c 39.2 (18.4) ab 48.9 (16.5) a ND 27.5 (12.6) bcPhenol oxidasea Lignin degradation 0.5 (1.3) b 0.7 (1.1) b 3.5 (2.6) a ND 1.54 (1.00) ab
Abbreviations: control, residual enzyme activity in irradiated controls (irradiated control bags not placed in the field); FH, in situ fermentation-humic layer; ND, no activity detected; �SB, hyphal trap bags with no sand barrier; þSB, hyphal trap bags with sand barrier; Sand, sand barrier.Data are provided as means (n¼9) with s.d. in brackets. Data in the same row with different letters are significantly different at Po0.01.aActivities given as mmol h�1 g�1.
Table 4 Potential organic matter breakdown activity of ectomycorrhizal tips
Enzyme Enzyme activity (pmol min�1 mm�2)
Piloderma Amphinema Cenococcum Cortinarius Tylospora EMFa
Acid phosphatase 12.71 (7.75) 11.48 (7.65) 8.93 (5.47) 13.56 (11.36) 9.77 (7.63) 10.15 (3.59)Sulfatase 1.08 (1.13) 0.82 (0.53) 0.77 (0.74) 2.17 (3.26) 1.00 (0.80) 1.16 (0.72)Leucine aminopeptidase 0.46 (0.19) 0.41 (0.11) 0.50 (0.23) 2.94 (4.78) 0.42 (0.32) 0.54 (0.24)b-1,4-N-acetylglucosaminidase 3.87 (1.46) 3.57 (1.14) 2.87 (1.48) 6.05 (6.37) 2.79 (1.77) 3.68 (0.89)b-1,4-Glucosidase 3.16 (1.19) ab 5.78 (2.48) a 1.75 (0.98) b 2.76 (4.12) ab 3.45 (2.23) ab 3.47 (1.37)Cellobiohydrolase 0.63 (0.28) b 1.09 (0.37) a 0.42 (0.27) b 0.65 (1.18) ab 0.76 (0.39) ab 0.72 (0.34)Xylosidase 0.22 (0.18) b 0.64 (0.38) a 0.20 (0.10) b 0.13 (0.13) b 0.49 (0.37) ab 0.34 (0.20)Laccaseb 0.01 (0.01) 0.01 (0.01) 0.01 (0.01) 0.02 (0.02) 0.03 (0.01) 0.02 (0.01)Number of plots (n) 8 7 8 5 5 9
Data are provided as means (n¼number of plots the tip genera were isolated from. Note that not all genera were found in all plots) with s.d. inbrackets. Data in the same row with different letters are significantly different at Po0.01. Refer to Table 3 for the general role of each enzyme inorganic matter breakdown.aEMF, average activity of all ectomycorrhizal tips, not included in statistical analysis.bLaccase activity given in U min� 1 mm� 2.
Table 5 Direct correlation (Spearmans r) between enzymeactivities of the ectomycorrhizal tips selected from the FH layer ofthe forest floor and the activities of the FH layer
Enzyme EMF tipsa Amphinema Piloderma
FH layer Xylosidase 0.850** 0.729* NSFH layer Cellobiohydrolase 0.883** 0.712* 0.750*FH layer b-Glucosidase 0.833** 0.797* NS
Abbreviation: FH, in situ fermentation-humic layer.Correlations are significant at *Po0.05, **Po0.01. Note thatonly enzymes and EMF tips that were significantly related toFH are shown.aEMF tips, correlation with the average activity of all ectomycorrhizaltips.
EMF and soil organic matter cyclingLA Phillips et al
706
The ISME Journal

soils of temperate and boreal forests (Schmidt et al.,2011). Increased temperature and atmospheric CO2
levels associated with climate change are predictedto increase the decomposition of this SOM-C pool(Fierer et al., 2005; Conant et al., 2008; Craine et al.,2010). The majority of this SOM is found in the FHhorizons dominated by EMF and not saprotrophicfungi (Lindahl et al., 2007). Quantifying the con-tribution of EMF mycelia to SOM turnover is,therefore, of critical importance to Cmodels(Cairney, 2012).
Potential contribution of EMF mycelia to soil organicC turnoverIt has generally been believed that saprotrophicfungi bear primary responsibility for recalcitrantSOM-C decomposition in forest soils (Baldrian,2008). Recently, Talbot et al. (2013) concluded thatEMF and saprotrophic communities have comple-mentary roles in SOM turnover. Specifically, in pineforests in a Mediterranean climate, they found thatEMF species richness explained SOM-nitrogen (N)decomposition patterns, whereas saprotrophic com-munity structure explained SOM-C decompositionpatterns. In the current study, we directly measuredthe potential enzyme activity in FH-filled mesh bagscolonized by the two different trophic groups(colonization by obligate saprotrophs controlledby the presence or absence of a sand barrier) in asub-boreal spruce system, and compared thoseactivities with that of the surrounding FH horizon.We found that communities dominated byEMF hyphae exhibited significant potential todegrade both SOM-C and SOM-N. The oxidative andhydrolytic enzyme activities exhibited by these EMFcommunities were comparable to or higher than
those measured in communities enriched withsaprotrophic fungi. None of the measured enzymeswere specifically associated with saprotrophs, sug-gesting that it is premature to generalizeabout the role of these two trophic groups acrossecosystems.
The EMF-dominated mesh bag communities andFH horizon had significantly similar patterns ofcellulolytic and hemicellulolytic enzyme activity.Although these C-targeting hydrolase activities aregenerally attributed to saprotrophic fungi (Talbotet al., 2013), this was not the case in our spruce soilswhere communities with abundant saprotrophsexhibited lower hydrolytic enzyme activity. Thesingle-most abundant taxonomic group that corre-lated with these activities matched unidentifiedEMF from root tips. Some EMF, such as Laccariabicolor, have retained low levels of cellulolytic andhemicellulolytic hydrolases in their genomes(Martin et al., 2008; Nagendran et al., 2009; Martinet al., 2010). Although gene presence does notautomatically indicate functionality, several EMF,including L. bicolor, are able to use cellulose orhemicellulose as a sole C source (Durall et al., 1994;Vaario et al., 2012). The abundant unidentified EMFin our systems may have similar hydrolytic activity,an occurrence that may be favoured by a number ofsite-specific factors.
Hydrolase activity is known to increase with SOMcontent (Sinsabaugh et al., 2008). The FH horizon inour spruce soils contained 64% SOM, almost half ofwhich was cellulose and hemicellulose (data notshown). However, the most abundant saprotroph inour systems, Mortierella spp., is an inefficientdecomposer of cellulose, exhibiting very littleb-glucosidase activity (Hanson et al., 2008; Allisonet al., 2009). The significantly lower b-glucosidase
Figure 3 PCA ordination of potential enzyme activity in the hyphal trap bags and the FH layers of the forest floor. The proportionof variance explained by each axis is shown, and the contribution of each enzyme in the ordination is indicated by the plot vectors. �SB,hyphal trap bags with no sand barrier; FH, in situ fermentation-humic layer; þSB, hyphal trap bags with sand barrier. Cel,cellobiohydrolase; Glu, b-1,4-glucosidase; N-Ag, b-1,4-N-acetylglucosaminidase; Pho, acid phosphatase; Sul, sulfatase; peptidase,leucine aminopeptidase; Lac, laccase; perox, peroxidase; phenox, phenol oxidase PC1 is associated with Glu (r¼0.895), Cel (r¼0.599),Xyl (r¼0.851) and N-Ag (r¼ 0.865); PC2 is associated with Pho (r¼ -0.799), peptidase (r¼ 0.650), Lac (r¼ -0.695) and Phenox (r¼0.729);PC3 is associated with Sul (r¼ 0.798), peptidase (r¼0.484) and Perox (r¼ 0.702). All associations are significant at Po0.05.
EMF and soil organic matter cyclingLA Phillips et al
707
The ISME Journal

activity in our saprotroph-dominated hyphal traps islikely related to the abundant (50% of the totalsequences) Mortierella spp. colonizing these traps.In our spruce soils, a population of inefficientsaprotrophs combined with a large pool of
cellulolytic compounds may have favoured hydro-lytic C-prospecting by EMF, which are also known toincrease their enzymatic activity in the absence ofdirect saprotrophic competitors (Leake et al., 2001;Pereira et al., 2012). Although we cannot exclude
Figure 4 Relationship between fungal communities and the potential enzyme activities in hyphal trap bags and the FH layers of theforest floor. �SB, hyphal trap bags with no sand barrier; FH, in situ fermentation-humic layer; þSB, hyphal trap bags with sand barrier.Joint plots vectors indicate the strength and direction of significant (Po0.05) correlations between enzyme PC-loading factors andfungal communities at the level of (a) ecological function, (b) phyla and (c) genus or closest identity. The direction and strengthof enzyme correlations contributing to each PC axis (as in Figure 3) are indicated with the abbreviations Cel, cellobiohydrolase; Glu,b-1,4-glucosidase; N-Ag, b-1,4-N-acetylglucosaminidase; Pho, acid phosphatase; Sul, sulfatase; peptidase, leucine aminopeptidase; Lac,laccase; Perox, peroxidase.
EMF and soil organic matter cyclingLA Phillips et al
708
The ISME Journal

potential bacterial activity, a metaproteomicstudy of Fagus sylvatica L. litter (Schneider et al.,2012) and a 13C-cellulose stable isotope study ofspruce soils (Stursova et al., 2012), both found thatfungi were primarily responsible for cellulosedecomposition. In the latter study, Amphinemaspp. were identified as having incorporated 13Cfrom cellulose into their DNA. In our study, thecellulose and hemicellulose-degrading activities ofEMF tips, and in particular Amphinema tips,correlated highly with those activities in the FHlayer. Although requiring further research, thestrength of the correlations (r40.7) and the inter-relatedness of the enzymes involved make itunlikely that this is a spurious phenomenon.
Our results also suggest that EMF in spruce soilsare directly involved in the breakdown of lignin andhumic complexes, supporting research that suggeststhat increased mycorrhizal activity associated withclimate change will stimulate decomposition ofpreviously highly recalcitrant SOM-C (Cheng et al.,2012; Phillips et al., 2012b).The oxidative enzymesinvolved in the decomposition of these compoundsare broadly classified as phenol oxidases (includinglaccase and tyrosinase) and peroxidases (inclu-ding lignin and broad spectrum peroxidases)(Sinsabaugh, 2010; Theuerl and Buscot, 2010).Enzyme assays typically do not differentiatebetween the individual enzymes and instead mea-sure the activity of the broad classes (Sinsabaugh,2010; German et al., 2011; Eichlerova et al., 2012).In the current study, the potential phenol oxidaseactivity in EMF-dominated mesh bags was signifi-cantly higher than that of the FH or saprotroph-dominated bags when measured using a L-DOPAassay, but lower when measured using an ABTSassay. Research suggests that L-DOPA is oxidized byboth laccases and tyrosinases, whereas ABTS isprimarily oxidized by laccases (Burke and Cairney,2002; Gunther et al., 1998; Eichlerova et al., 2012).The EMF in our mesh bags did not have the relevantlaccases to effectively oxidize ABTS, a fundamentaldifference that separated these communities fromthe otherwise trophically similar communities inthe surrounding FH layer. These results suggest thatthe extent of EMF degradation of recalcitrant SOM-Cwill depend on the EMF community structure, asdiffering EMF genera were dominant in thetwo systems (Amphinema vs Piloderma, respec-tively) and individual EMF are known to differ intheir ability to oxidize these enzyme substrates(Gunther et al., 1998; Burke and Cairney, 2002;Tedersoo et al., 2012). Amphinema were also themost abundant EMF in the saprotroph-dominatedbags, but they were outnumbered by lignin-degrad-ing saprotrophic Mortierella spp. (Hanson et al.,2008; Allison et al., 2009). Although Allison et al.(2009) found no link between lignin degradation byMortierella spp. and L-DOPA-phenol oxidaseactivity, our Mortierella-dominated communitiesexhibited substantial ABTS-phenol oxidase activity.
Saprotrophs and EMF are known to contain a broadrange of phenol oxidases that differ in substratespecificity (Luis et al., 2004; Kellner et al., 2010).Until this complex group of enzymes are betterunderstood, researchers investigating the relativecontributions of EMF and saprotrophic fungi toSOM-C turnover should include numerous phenoloxidase assays, as reviewed by Sinsabaugh (2010) inparallel.
Release of SOM-degrading enzymes by EMFdoes not necessarily imply the uptake of anyreleased C. For example, phenol oxidase activityby EMF hyphae is associated with the explorationand the concomitant mining of polyphenolic-richhumic compounds for other nutrients (Talbot et al.,2008, 2013; Rineau et al., 2012). The EMF myceliacolonizing the mesh substrates may have beensimilarly prospecting for nitrogen, as there was apositive relationship between L-DOPA-phenoloxidase activity and protease activity (r¼ 0.731).However, the significantly higher levels of perox-idase activity in the EMF-dominated systems werenot directly associated with protease activity, sug-gesting that additional polyphenolic degradationmay be occurring independently of nitrogen acqui-sition. High peroxidase activity in systems withabundant EMF is not surprising, as many EMFcontain Class II peroxidase-encoding genes (Bodekeret al., 2009), and peroxidase activity has been shownto increase with increasing EMF species richness(Talbot et al., 2013). The combined and complexoxidase enzyme activity in our EMF-dominatedsystems suggests that EMF mycelia are activelybreaking down recalcitrant SOM.
Effectiveness of modified hyphal traps to isolate EMFmyceliaHyphal trap bags are a crucial tool for assessing therelative contributions of EMF and saprotrophicmycelium to SOM cycling (Wallander et al., 2001).Although it has been suggested that soil-basedin-growth cores were primarily selected for EMFhyphae in coniferous forests with low saprotrophicpopulations (Hendricks et al., 2006), comparableapproaches in our study (that is, bags without a sandbarrier) were equally colonized by both trophicgroups. Surrounding these mesh bags with a sandbarrier, however, trapped a fungal community thatwas highly similar to that of the adjacent soil, withB70% EMF sequences and fewer than 9% sapro-trophic sequences. Although other studies haveused sand-only hyphal traps to minimize saprotrophcolonization (Kjøller, 2006; Korkama et al., 2007;Wallander et al., 2010; Walker et al., 2012), in ourstudy the sand surrounding the hyphal traps con-tained large populations of saprotrophic Mortierellaspp. (16% of the total sequences). Mortierella werealso the most abundant saprotroph in the surround-ing soil and are similarly abundant in other spruceforest soils (Buee et al., 2009). These fungi are
EMF and soil organic matter cyclingLA Phillips et al
709
The ISME Journal

known to colonize the surface of spruce roots (Salt,1977) and may have incidentally exploredthe sand in association with EMF hyphae.Our results suggest that sand-only hyphal trapsmay not effectively isolate EMF hyphae in soilswhere Mortierella are abundant.
The fungal communities in our saprotroph-excluding mesh bags were also taxonomicallysimilar to those found in the surrounding soil,although differences did emerge at the genus level.The most abundant EMF in the hyphal traps wereAmphinema and Wilcoxina, but in the surroundingsoil were Piloderma, Cortinarius and Tylospora.These different colonization patterns could bebecause of explorer type, as EMF colonizing theþSB hyphal traps would need to explore at leastthe width of the sand barrier away from a colonizedroot tip. Although Amphinema and Pilodermaare both considered medium distance explorers,Piloderma may also form mats with a limitedrange of exploration (Agerer, 2001; Kluber et al.,2011). Berner et al. (2012) also hypothesized thatshort-term mesh bag studies may preferentiallyselect for early EMF colonizers. The most abundantEMF in our mesh bags, Amphinema and Wilcoxina,are highly competitive early colonizers of seedlings,both in greenhouses (Jones et al., 1997; Menkiset al., 2005) and under field conditions (Gagne et al.,2006; Barker et al., 2012; Walker et al., 2012). Earlycolonizing Amphinema and Wilcoxina may haveout-competed other species, including less compe-titive Piloderma spp. (Erland and Soderstrom,1991; Erland and Finlay, 1992; Wu et al., 1999).Differences in fungal nutritional requirements mightalso influence colonization. For example, Cortinariusspp. avoid nutrient-limited sand hyphal traps(Kjøller, 2006; Berner et al., 2012). These EMFmay have similarly avoided the sand barrier in thecurrent study, as Cortinarius were more abundant inhyphal traps without a sand barrier.
Conclusions
Using novel microcosms of sterile, FH substratesurrounded by a barrier of sand, we determinedthat both oxidative and hydrolytic enzyme activitiesin EMF-dominated substrates are comparable toor greater than that exhibited by microcosmsenriched in saprotrophic hyphae. Collectively, ourdata supports a substantial role for EMF hyphae inthe turnover of both recalcitrant and labile SOM insub-boreal spruce stands. Furthermore, it expandsour ability to predict feedbacks between elevatedatmospheric CO2 and soil C fluxes.
Conflict of Interest
The authors declare no conflict of interest.
Acknowledgements
This study was funded by a Natural Sciences andEngineering Research Council of Canada Strategic Grant.The preliminary study development, additional field andlab assistance was provided by Jeremy Bougoure, TristynHay, Lindsay Reddeman and Jennifer Walker. We thankNetPak of Coquitlam, British Columbia, Australia fordonating the plastic containers used to constructthe hyphal traps with sand barriers. We acknowledgeAlexandre Montpetit of the genotyping platform of theMcGill University and Genome Quebec Innovation Centrefor their technical assistance.
References
Abarenkov K, Nilsson RH, Larsson K-H, Alexander IJ,Eberhardt U, Erland S et al. (2010a). The UNITEdatabase for molecular identification of fungi - recentupdates and future perspectives. New Phytol 186:281–285.
Abarenkov K, Tedersoo L, Nilsson RH, Vellak K, Saar I,Veldre V et al. (2010b). PlutoF - a web basedworkbench for ecological and taxonomic research,with an online implementation for fungal ITSsequences. Evol Bioinform 6: 189–196.
Agerer R. (2001). Exploration types of ectomycorrhizae.Mycorrhiza 11: 107–114.
Agerer R, Rambold G. (2008). DEEMY—An informationsystem for determination and characterisation ofectomycorrhizae; www.deemy.de.
Allison SD. (2006). Soil minerals and humic acids alterenzyme stability: implications for ecosystem pro-cesses. Biogeochemistry 81: 361–373.
Allison SD, LeBauer DS, Ofrecio MR, Reyes R, Ta A-M,Tran TM. (2009). Low levels of nitrogen additionstimulate decomposition by boreal forest fungi. SoilBiol Biochem 41: 293–302.
Altschul SF, Madden TL, Schaffer AA, Zhang J, Zhang Z,Miller W et al. (1997). Gapped BLAST and PSI-BLAST:a new generation of protein database search programs.Nucleic Acids Res 25: 3389–3402.
Bardgett RD. (2011). Plant-soil interactions in a changingworld. F1000 Biol Rep 3: 16; http://f1000.com/reports/b/3/16.
Baldrian P. (2008). Enzymes of saprotrophic basidiomycetes.In: Boddy L, Frankland JC, van West P (eds) Ecology ofSaprotrophic Basidiomycetes. Academic Press: NY:USA, pp 19–41.
Barker JS, Simard SW, Jones MD, Durall DM. (2012).Ectomycorrhizal fungal community assembly onregenerating Douglas-fir after wildfire and clearcutharvesting. Oecologia 172: 1179–1189.
Benson DA, Karsch-Mizrachi I, Lipman DJ, Ostell J,Sayers EW. (2011). GenBank. Nucleic Acids Res 39:D32–D37.
Berner C, Johansson T, Wallander H. (2012). Long-termeffect of apatite on ectomycorrhizal growth andcommunity structure. Mycorrhiza 22: 615–621.
Blankenberg D, Gordon A, Von Kuster G, Coraor N,Taylor J, Nekrutenko A. (2010). Manipulationof FASTQ data with Galaxy. Bioinformatics 26:1783–1785.
Bodeker ITM, Nygren CMR, Taylor AFS, Olson A,Lindahl BD. (2009). ClassII peroxidase-encoding genes
EMF and soil organic matter cyclingLA Phillips et al
710
The ISME Journal

are present in a phylogenetically wide range ofectomycorrhizal fungi. ISME J 3: 1387–1395.
Bolhuis H, Stal LJ. (2011). Analysis of bacterial andarchaeal diversity in coastal microbial matsusing massive parallel 16S rRNA gene tag sequencing.ISME J 5: 1701–1712.
Brockley RP, Simpson DG. (2004). Effects of intensivefertilization on the foliar nutrition and growth ofyoung lodgepole pine and spruce forests in the interiorof British Columbia (E.P. 886.13): Establishment andprogress report. B.C. Ministry of Forests, Victoria.Technical Report 018. Available at http://www.for.gov.bc.ca/hre/standman/maxprod/index.htm.
Buee M, Reich M, Murat C, Morin E, Nilsson RH,Uroz S et al. (2009). 454 Pyrosequencing analyses offorest soils reveal an unexpectedly high fungaldiversity. New Phytol 184: 449–456.
Burke RM, Cairney JWG. (2002). Laccases and otherpolyphenol oxidases in ecto- and ericoid mycorrhizalfungi. Mycorrhiza 12: 249–255.
Cairney JWG. (2012). Extramatrical mycelia of ectomycor-rhizal fungi as moderators of carbon dynamics inforest soil. Soil Biol Biochem 47: 198–208.
Cheng L, Booker FL, Tu C, Burkey KO, Zhou L,Shew HD et al. (2012). Arbuscular mycorrhizal fungiincrease organic carbon decomposition under elevatedCO2. Science 31: 1084–1087.
Clemmensen KE, Bahr A, Ovaskainen O, Dahlberg A,Ekblad A, Wallander H et al. (2013). Roots andassociated fungi drive long-term carbon sequestrationin boreal forest. Science 339: 1615–1618.
Conant RT, Steinweg JM, Haddix ML, Paul EA, Plante AF,Six J. (2008). Experimental woaming shows thatdecomposition temperature sensitivity increaseswith soil organic matter recalcitrance. Ecology 89:2384–2391.
Courty PE, Buee M, Diedhiou AG, Frey-Klett P, Le Tacon F,Rineau F et al. (2010). The role of ectomycorrhizalcommunities in forest ecosystem processes. Soil BiolBiochem 42: 679–698.
Courty PE, Pritsch K, Schloter M, Hartmann A, Garbaye J.(2005). Activity profiling of ectomycorrhiza commu-nities in two forest soils using multiple enzymatictests. New Phytol 167: 309–319.
Craine JM, Fierer N, McLauchlan KK. (2010). Widespreadcoupling between the rate and temperaturesensitivity of organic matter decay. Nature Geosci 3:854–857.
De Luca TH, Boisvenue C. (2012). Boreal forestsoil carbon: Distribution, function, and modelling.Forestry 85: 161–184.
Drigo B, Pijl AS, Duyts H, Kielak AM, Gamper HA,Houtekamer MJ et al. (2010). Shifting carbon flow fromroots into associated microbial communities inresponse to elevated atmospheric CO2. Proc Natl AcadSci 107: 10938–10942.
Durall DM, Todd DM, Trappe JM. (1994). Decompositionof 14C-labelled substrates by ectomycorrhizal fungi inassociation with Douglas fir. New Phytol 127: 725–729.
Eichlerova I, Snajdr J, Baldrian P. (2012). Laccase activityin soils: Considerations for the measurement ofenzyme activity. Chemosphere 88: 1154–1160.
Ekblad A, Wallander H, Godbold DL, Cruz C, Johnson D,Baldrian P et al. (2013). The production and turnoverof extramatrical mycelium of ectomycorrhizal fungiin forest soils: role in carbon cycling. Plant Soil 366:1–27.
Erland S, Finlay R. (1992). Effects of temperature andincubation time on the ability of three ectomycorrhizalfungi to colonize Pinus sylvestris roots. Mycol Res 96:270–272.
Erland S, Soderstrom B. (1991). Effects of liming onectomycorrhizal fungi infecting Pinus sylvestris L. IIISaprophytic growth and host plant infection atdifferent pH values in unsterile humus. New Phytol117: 405–411.
Fierer N, Craine JM, McLauchlan KK, Schimel JP. (2005).Litter quality and the temperature sensitivity ofdecomposition. Ecology 86: 320–326.
Floudas D, Binder M, Riley R, Barry K, Blanchette RA,Henrissat B et al. (2012). CO2 enhancement offorest productivity constrained by limited nitrogenavailability. PNAS 107: 19368–19373.
Gagne A, Jany J-L, Bousquet J, Khasa DP. (2006).Ectomycorrhizal fungal communities of nursery-inoculated seedlings outplanted on clear-cut sites innorthern Alberta. Can J For Res 26: 1684–1694.
Gardes M, Bruns TD. (1993). ITS primers with enhancedspecificity for basidiomycetes - application to theidentification of mycorrhizas and rusts. Mol Ecol 2:113–118.
German DP, Weintraub MN, Grandy AS, Lauber CL,Rinkes ZL, Allison SD. (2011). Optimization ofextracellular enzyme assay methods for ecosystemstudies. Soil Biol Biochem 43: 1387–1397.
Gunther Th, Perner B, Gramss G. (1998). Activities ofphenol oxidizing enzymes of ectomycorrhizalfungi in axenic culture and in symbiosis withScots pine (Pinus sylvestris L.). J Basic Microbiol 38:197–206.
Gihring TM, Green SJ, Schadt CW. (2012). Massivelyparallel rRNA gene sequencing exacerbates the poten-tial for biased community diversity comparisonsdue to variable library sizes. Environ Microbiol 14:285–290.
Hagerberg D, Thelin G, Wallander H. (2003). The produc-tion of ectomycorrhizal mycelium in forests: relationbetween forest nutrient status and local mineralsources. Plant Soil 252: 279–290.
Hagerberg D, Wallander H. (2002). The impact of forestresidue removal and wood ash amendment on thegrowth of the ectomycorrhizal external mycelium.FEMS Microbiol Ecol 39: 139–146.
Hammer Ø, Harper DAT, Ryan PD. (2001). PAST: Paleon-tological Statistics Software Packagefor Education andData Analysis. Palaeontol Electron 4: 9.
Hanson CA, Allison SD, Bradford MA, Wallenstein MD,Treseder KK. (2008). Fungal taxa targetdifferent carbon sources in forest soil. Ecosystems11: 1157–1167.
Hayes DJ, Turner DP, Stinson G, McGuire DA, Wei Y,West TO et al. (2012). Reconciling estimates of thecontemporary North American carbon balance amongterrestrial biosphere models, atmospheric inversions,and a new approach for estimating net ecosystemexchange from inventory-based data. Glob Change Biol18: 1282–1299.
Hedh J, Wallander H, Erland S. (2008). Ectomy-corrhizal mycelial species composition in apatiteamended and non-amended mesh bags buried ina phosphorus-poor spruce forest. Mycol Res 112:681–688.
Hendricks JJ, Mitchell RJ, Kuehn KA, Pecot SD, Sims SE.(2006). Measuring external mycelia production of
EMF and soil organic matter cyclingLA Phillips et al
711
The ISME Journal

ectomycorrhizal fungi in the field: the soil matrixmatters. New Phytol 171: 179–186.
Hibbet DS, Gilbert L-B, Donoghue MJ. (2000). Evolutionaryinstability of ectomycrorrhizal symbioses in basiomy-cetes. Nature 407: 506–508.
Higgins PA, Harte J. (2012). Carbon cycle uncertaintyincreases climate change risks and mitigationchallenges. J Climate 25: 7660–7668.
Hogberg MN, Hogberg P. (2002). Extramatrical ectomycor-rhizal mycelium contributes one-third of microbialbiomass and produces, together with associatedroots, half the dissolved organic carbon in a forestsoil. New Phytol 154: 791–795.
Huang Y, Niu B, Gao Y, Fu L, Li W. (2010). CD-HIT Suite: aweb server for clustering and comparing biologicalsequences. Bioinformatics 26: 680.
Intergovernmental Panel on Climate Change (2007).Climate Change 2007 Synthesis Report. Summary forPolicymakers, Available at www.ipcc.ch.
Jones MD, Durall DM, Harniman SMK, Classen DC,Simard SW. (1997). Ectomycorrhizal diversity onBetula papyrifera and Pseudotsuga menziesiiseedlings grown in the greenhouse or outplanted insingle-species and mixed plots in southern BritishColumbia. Can J For Res 27: 1872–1889.
Jones MD, Phillips LA, Treu R, Ward V, Berch SM. (2012).Functional responses of ectomycorrhizal fungalcommunities to long-term fertilization of lodgepolepine (Pinus contorta Dougl. ex Loud. var. latifoliaEngelm.) stands in central British Columbia. App SoilEcol 60: 29–40.
Jones MD, Twieg BD, Ward V, Barker J, Durrall DM,Simard SW. (2010). Functional complementarity ofDouglas-fir ectomycorrhizas for extracellular enzymeactivity after wildfire or clearcut logging. Func Ecol24: 1139–1151.
Kellner H, Zak DR, Vandenbol M. (2010). Fungi unearthed:Transcripts encoding lignocellulolytic and chitinoly-tic enzymes in forest soil. PLoS One 5: e10971.
Kenkel NC. (2006). On selecting an appropriatemultivariate analysis. Can J Plant Sci 86: 663–676.
Kjøller R. (2006). Disproportionate abundance betweenectomycorrhizal root tips and their associated mycelia.FEMS Microbiol Ecol 58: 214–224.
Kluber LA, Smith JE, Myrold DD. (2011). Distinctivefungal and bacterial communities are associated withmats formed by ectomycorrhizal fungi. Soil BiolBiochem 43: 1042–1050.
Korkama T, Fritze H, Pakkanen A, Pennanen T. (2007).Interactions between extraradical ectomycorrhizalmycelia, microbes associated with the mycelia andgrowth rate of Norway spruce (Picea abies) clones.New Phytol 173: 798–807.
Lawry JD, Diederich P. (2003). Lichenicolous fungi:interactions, evolution, and biodiversity. TheBryologist 106: 80–120.
Leake JR, Donnelly DP, Saunders EM, Boddy L, Read DJ.(2001). Rates and quantities of carbon flux to ectomy-corrhizal mycelium following 14C pulse labelling ofPinus sylvestris L. seedlings: effects of litter patchesand interaction with a wood-decomposer fungus. TreePhysio 21: 71–82.
Lensi R, Lescure C, Steinberg C, Savoie JM, Faurie G.(1991). Dynamics of residual enzyme activities,denitrification potential, and physico-chemicalproperties in a g-sterilised soil. Soil Biol Biochem 23:367–373.
Lindahl BD, Ihrmark K, Boberg J, Trumbore SE, Hogberg P,Stenlid J et al. (2007). Spatial separation of litterdecomposition and mycorrhizal nitrogen uptake in aboreal forest. New Phytol 173: 611–620.
Luis P, Walther G, Kellner H, Martin F, Buscot F. (2004).Diversity of laccase genes from Basidiomycetes in aforest soil. Soil Biol Biochem 36: 1025–1036.
Martin F, Aerts A, Ahren D, Brun A, Duchaussoy F,Kohler A et al. (2008). The genome sequence of thebasidiomycete fungus Laccaria bicolor providesinsights into the mycorrhizal symbiosis. Nature 452:88–92.
Martin F, Kohler A, Murat C, Balestrini R, Coutinho PM,Jaillon O et al. (2010). Perigord black truffle genomeuncovers evolutionary origins and mechanisms ofsymbiosis. Nature 464: 1033–1038.
McCune B, Mefford MJ. (2011). PC-ORD. MultivariateAnalysis of Ecological Data. Version 6.0. MjMSoftware: Gleneden Beach, Oregon, USA.
Menkis A, Vasiliauskas R, Taylor AFS, Stenlid J, Finlay R.(2005). Fungal communities in mycorrhizal roots ofconifer seedlings in forest nurseries under differentcultivation systems, assessed by morphotyping,direct sequencing and mycelial isolation. Mycorrhiza16: 33–41.
Moore D, Robson GD, Trinci APJ. (2011). 21stCentury Guide to Fungi. Cambridge University Press:Cambridge, UK.
Myneni RB, Dong J, Tucker CJ, Kaufmann RK, Kauppi PE,Liski J et al. (2001). A large carbon sink in the woodybiomass of Northern forests. Proc Natl Acad Sci USA98: 14784–14789.
Nagendran S, Hallen-Adams HE, Paper JM, Aslam N,Walton JD. (2009). Reduced genomic potential forsecreted plant cell-wall-degrading enzymes in theectomycorrhizal fungus Amanita bisporigera, basedon the secretome of Trichoderma reesei. Fungal GenetBiol 46: 427–435.
Nilsson RH, Veldre V, Hartmann M, Unterseher M,Amend A, Bergsten J et al. (2010). An open sourcesoftware package for automated extraction of ITS1 andITS2 from fungal ITS sequences for use in high-throughput community assays and molecular ecology.Fungal Ecol 3: 284–287.
Norby RJ, Warren JM, Iversen CM, Medlyn BE, McMurtrie RE.(2010). CO2 enhancement of forest productivity con-strained by limited nitrogen availability. PNAS 107:19368–19373.
Orwin KH, Kirschbaum MUF St, John MG, Dickie IA.(2011). Organic nutrient uptake by mycorrhizal fungienhances ecosystem carbon storage: a model basedassessment. Ecol Lett 14: 493–502.
Pereira E, Coelho V, Tavares RM, Lino-Neto T, Baptista P.(2012). Effect of competitive interactions betweenectomycorrhizal and saprotrophic fungi on Castaneasativa performance. Mycorrhiza 22: 41–49.
Phillips CL, Kluber LA, Martin JP, Caldwell BA, Bond BJ.(2012a). Contributions of ectomycorrhizal fungalmats to forest soil respiration. Biogeosciences 9:2099–2110.
Phillips LA, Greer CW, Germida JJ. (2006). Culture-basedand culture-independent assessment of the impact ofmixed and single plant treatments on rhizospheremicrobial communities in hydrocarbon contaminatedflare-pit soil. Soil Biol Biochem 38: 2823–2833.
Phillips RP, Meier IC, Bernhardt ES, Grandy AS,Wickings K, Finzi AC. (2012b). Roots and fungi
EMF and soil organic matter cyclingLA Phillips et al
712
The ISME Journal
accelerate carbon and nitrogen cycling in forestsexposed to elevated CO2. Ecol Lett 15: 1042–1049.
Potila H, Wallander H, Sarjala T. (2009). Growth ofectomycorrhizal fungi in drained peatland forestswith variable P and K availability. Plant Soil 316:139–150.
Pritsch K, Raidl S, Marksteiner E, Agerer R, Blaschke H,Schloter M et al. (2004). A rapid and highly sensitivemethod for measuring enzyme activities in singlemycorrhizal tips using 4-methylumbelliferone-labelled fluorogenic substrates in a microplate system.J Microbiol Meth 58: 233–241.
Ramette A. (2007). Multivariate analyses in microbialecology. FEMS Microbiol Ecol 62: 142–160.
Rinaldi AC, Comandini O, Kuyper TW. (2008). Ectomycor-rhizal fungal diversity: separating the wheat from thechaff. Fungal Divers 33: 1–45.
Rineau F, Roth D, Shah F, Smits M, Johansson T,Canback B et al. (2012). The ectomycorrhizal fungusPaxillus involutus converts organic matter in plantlitter using a trimmed brown-rot mechanisminvolvinetg Fenton chemistry. Environ Microbiol 14:1477–1487.
Ryberg M, Nilsson RH, Kristiansson E, Topel M,Jacobsson S, Larsson E. (2008). Mining metadata fromunidentified ITS sequences in GenBank: A case studyin Inocybe (Basidiomycota). BMC Evol Biol 8: 50–64.
Saiya-Cork KR, Sinsabaugh R, Zak DR. (2002). The effectsof long term nitrogen deposition on extracellularenzyme activity in an Acer saccharum forest soil.Soil Biol Biochem 34: 1309–1315.
Salt GA. (1977). The incidence of root-surface fungi onnaturally regenerated Picea sitchensis seedlings insoutheast Alaska. Forestry 50: 113–115.
Schloss PD, Westcott SL, Ryabin T, Hall JR, Hartmann M,Hollister EB et al. (2009). Introducing mothur: Open-source, platform-independent, community-supportedsoftware for describing and comparing microbialcommunities. Appl Environ Microbiol 75: 7537–7541.
Schmidt WI, Torn MS, Abiven S, Dittmar T,Guggenberger G, Janssens IA et al. (2011). Persistenceof soil organic matter as an ecosystem property. Nature478: 49–56.
Schneider T, Keiblinger KM, Schmid E, Sterflinger-Gleixner K, Ellersdorfer G, Roschitzki B et al. (2012).Who is who in litter decomposition? Metaproteomicsreveals major microbial players and their biogeochem-ical functions. ISME J 6: 1749–1762.
Sinsabaugh RL. (2010). Phenol oxidase, peroxidase andorganic matter dynamics of soil. Soil Biol Biochem 42:391–404.
Sinsabaugh RL, Lauber CL, Weintraub MN, Ahmed B,Allison SD, Crenshaw C et al. (2008). Stoichiometryof soil enzyme activity at global scale. Ecol Lett 11:1252–1264.
Sinsabaugh RL, Saiya-Cork K, Long T, Osgood MP,Neher DA, Zak DR et al. (2003). Soil microbial activityin a Liquidambar plantation unresponsive toCO2- driven increases in primary production.Appl Soil Ecol 24: 263–271.
Stursova M, Zifcakova L, Leigh MB, Burgess R, Baldrian P.(2012). Cellulose utilization in forest litter and soil:identification of bacterial and fungal decomposers.FEMS Microbiol Ecol 80: 735–746.
Talbot JM, Allison SD, Treseder KK. (2008). Decomposersin disguise: mycorrhizal fungi as regulators of soil Cdynamics in ecosystems under global change. FunctEcol 22: 955–963.
Talbot JM, Bruns TD, Smith DP, Branco S, Glassman SI,Erlandson S et al. (2013). Independent roles ofectomycorrhizal and saprotrophic communities in soilorganic matter decomposition. Soil Biol Biochem 57:282–291.
Tedersoo L, Naadel T, Bahram M, Pritsch K, Buegger F,Leal M et al. (2012). Enzymatic activities and stableisotope patterns of ectomycorrhizal fungi in relation tophylogeny and exploration types in an afrotropicalrain forest. New Phytol 195: 832–843.
Theuerl S, Buscot F. (2010). Laccases: Toward disentan-gling their diversity and functions in relationto soil organic matter cycling. Biol Fertil Soils 46:215–225.
Treseder KK, Torn MS, Masiello CA. (2006). An ecosystem-scale radiocarbon tracer to test use of litter carbon byectomycorrhizal fungi. Soil Biol Biochem 38: 1077–1082.
Vaario L-M, Heinonsalo J, Spetz P, Pennanen T, HeinonenJ, Tervahauta A et al. (2012). The ectomycorrhizalfungus Tricholoma matsutake is a facultative sapro-troph in vitro. Mycorrhiza 22: 409–418.
van der Wal A, Geydan TD, Kuyper TW, de Boer W. (2012).A thready affair: linking fungal diversity and commu-nity dynamics to terrestrial decomposition processes.FEMS Microbiol Rev 37: 477–494.
Von Lutzow M, Kogel-Knabner I. (2009). Temperaturesensitivity of soil organic matter decomposition—what do we know? Bio Fertil Soil 46: 1–15.
Walker JKM, Ward V, Paterson C, Jones MD. (2012). Coarsewoody debris retention in subalpine clearcuts affectsectomycorrhizal root tip community structure within 15years of harvest. Appl Soil Ecol 60: 5–15.
Wallander H, Johansson U, Sterkenburg E, Durling MB,Lindahl BD. (2010). Production of ectomycorrhizalmycelium peaks during canopy closure in Norwayspruce forests. New Phytol 187: 1124–1134.
Wallander H, Nilsson L-O, Hagerberg D, Baath E. (2001).Estimation of the biomass and seasonal growth ofexternal mycelium of ectomycorrhizal fungi in thefield. New Phytol 151: 753–760.
White TJ, Bruns TD, Lee S, Taylor J. (1990). Amplificationand direct sequencing of fungal ribosomal RNAgenes for phylogenetics. In: Innis MA, Gelfand DH(eds) PCR Protocols: A Guide to Methodsand Applications. Academic Press: London, UK,pp 315–322.
Wolfe BE, Tulloss RE, Pringle A. (2012). The irreversibleloss of a decomposition pathway marks the singleorigin of an ectomycorrhizal symbiosis. PLoS One 7:e39597.
Wright DP, Johansson T, Le Quere A, Soderstrom B, TunlidA. (2005). Spatial patterns of gene expression in theextramatrical mycelium and mycorrhizal root tipsformed by the ectomycorrhizal fungus Paxillusinvolutus in association with birch (Betulapendula) seedlings in soil microcosms. New Phytol167: 579–596.
Wu B, Nara K, Hogetsu T. (1999). Competition betweenectomycorrhizal fungi colonizing Pinus densiflora.Mycorrhiza 9: 151–159.
Supplementary Information accompanies this paper on The ISME Journal website (http://www.nature.com/ismej)
EMF and soil organic matter cyclingLA Phillips et al
713
The ISME Journal