diversity and community structure of ectomycorrhizal fungi...
TRANSCRIPT
ava i lab le a t www.sc iencedi rec t .com
j ourna l homepage : www.e lsev ier . com/ loca te /mycres
m y c o l o g i c a l r e s e a r c h 1 1 0 ( 2 0 0 6 ) 7 3 4 – 7 4 8
Diversity and community structure of ectomycorrhizalfungi in a wooded meadow
Leho TEDERSOOa,*,y, Triin SUVIa,y, Ellen LARSSONb, Urmas KOLJALGa
aInstitute of Botany and Ecology, University of Tartu, 40 Lai Str., 51005 Tartu, EstoniabBotanical Institute, Goteborg University, PO Box 461, SE 40530 Goteborg, Sweden
a r t i c l e i n f o
Article history:
Received 1 September 2005
Received in revised form
13 February 2006
Accepted 16 February 2006
Published online 12 June 2006
Corresponding Editor:
John W. G. Cairney
Keywords:
Deciduous forest
Ectomycorrhizal fungal community
ITS sequencing
Nature conservation
Rarefaction
Seminatural ecosystems
Soil horizons
Species richness extrapolation
a b s t r a c t
Wooded meadows are seminatural plant communities that support high diversity of various
taxa. Due to changes in land use, wooded meadows have severely declined during the last
century. The dominant trees in wooded meadows acquire mineral nutrients via ectomycor-
rhizal fungi. Using anatomotyping and sequencing of root tips, interpolation and extrapola-
tion methods, we studied the diversity and community structure of ectomycorrhizal fungi in
two soil horizons of both managed and forested parts of a wooded meadow in Estonia.
Species of Thelephoraceae, Sebacinaceae and the genus Inocybe dominated the whole ectomy-
corrhizal fungal community of 172 observed species. Forested and managed parts of the
wooded meadow harboured different communities of ectomycorrhizal fungi, whereas soil
horizon had a negligible effect on the fungal community composition. Diverse soil condi-
tions and host trees likely support the high richness of ectomycorrhizal fungi in the wooded
meadow ecosystem. Direct sequencing integrated with interpolation and extrapolation
methods are promising to identify the fungi at the species level and to compare species rich-
ness between communities of ectomycorrhizal fungi.
ª 2006 The British Mycological Society. Published by Elsevier Ltd. All rights reserved.
Introduction
Wooded meadows are seminatural, sparsely wooded ecosys-
tems that have developed due to hay-making or sheep grazing
in low-productive areas in Europe. A few retained trees have
created heterogeneous light conditions and soil nutrient gra-
dients. Such patchiness, together with shallow, nutrient-
poor soils, support high small-scale species richness of plants
in wooded meadows (Kull & Zobel 1991).
During the last century, industrialization and urbaniza-
tion have strongly affected land use and reduced the
importance of traditional farming methods, driving vast
countryside areas to abandonment (Vitousek 1994; DeFries
2002). Seminatural meadows and wooded meadows have
been most affected among seminatural ecosystems (Kukk
& Kull 1997; van Dijk 2002). Wooded meadows covered im-
mense areas especially at low-productive coastal and moun-
tainous sites throughout Europe. At present more than 99 %
of the wooded meadows have been abandoned, and have
developed naturally into thickets, bushlands and marsh-
lands (Kukk & Kull 1997). Of similar ecosystems, North
American oak savannas have declined 5000-fold due to ces-
sation of prescribed burning in the last few hundred years
(Nuzzo 1986).
* Corresponding author.E-mail address: [email protected].
y These authors contributed equally to this work.0953-7562/$ – see front matter ª 2006 The British Mycological Society. Published by Elsevier Ltd. All rights reserved.doi:10.1016/j.mycres.2006.04.007
Ectomycorrhizal fungi in a wooded meadow 735
In addition to high plant diversity, wooded meadows sup-
port many threatened orchids and agarics (Kukk & Kull 1997;
Kalamees 2004; Watling 2005). Of the rare fungi, fruit bodies
of calciphilous Boletus spp. and Entoloma spp. are prominent
in wooded meadows, but absent in nearby forests and
strongly overgrown wooded meadows. Autumnal fruiting of
both rare and common fungi is considerably reduced if the
meadows remain unmown in summer (Kalamees 1979). Sim-
ilarly, plant species richness declines in a few years after ces-
sation of management due to shading by rapidly growing tree
seedlings and bushes. Restoration of wooded meadows is
costly and plant species require decades to re-establish if
they are lost from the seed bank (Stampfli & Zeiter 1999).
Ectomycorrhizal (EcM) fungi provide mineral nutrition to
the dominant trees (Quercus robur, Betula spp., Tilia cordata,
etc.) in North European wooded meadows. EcM fungi differ in
enzymatic activities (Courty et al. 2005) and deliver species-
specific benefits to their host plants (van der Heijden & Kuyper
2003), which render their biodiversity of high importance to
plant nutrition. EcM fungi are highly diverse in most ecosys-
tems, comprising tens of observed species. Similar or even
larger number of species remains undetected due to rarity
and aggregated distribution of EcM fungal species on adjacent
root tips (Horton & Bruns 2001; Taylor 2002). The natural
mechanisms promoting high fungal diversity have remained
unclear, but it seems likely that differential preference for
soil conditions and host plants play the key role (Bruns 1995).
Rarefaction (interpolation) provides a powerful alternative
for species richness comparisons between sites and experi-
mental conditions. When sample size is unequal among treat-
ments, rarefaction facilitates biodiversity comparisons by
interpolating randomized species accumulation curves to
the same sample size, including calculation of confidence
intervals (Gotelli & Colwell 2001; Taylor 2002). Similarly,
extrapolation (i.e. estimation of the amount of unobserved
species) methods enable comparisons between sites and stud-
ies that employ different sampling schemes. Extrapolation
methods exploit the relative number or abundance of the rar-
est species, or predict the plateau of species accumulation
curves to estimate the total number of unseen species (Colwell
& Coddington 1994; Keating et al. 1998).
In this study we intended to determine the community
composition of EcM fungi in a single wooded meadow. We
hypothesized that the community structure and species rich-
ness differ between the managed and unmanaged (hereafter
forest) parts of the wooded meadow and between soil hori-
zons. Using direct sequencing of EcM root tip DNA and species
richness extrapolation, we demonstrate an unusually high
below-ground diversity of EcM fungi. The forest and wooded
meadow harbour different communities of EcM fungi.
Materials and methods
Study site
Sampling was performed in a traditionally managed wooded
meadow and an adjacent forest at Tagamoisa, Saaremaa Is-
land, northwestern Estonia (58 �270N, 22 �000E). The Tagamoisa
wooded meadow was selected, because it comprised
contrasting managed and forested areas with known history.
The study area arose from the Baltic Sea ca 5000 y before pres-
ent and lies ca 8 m above sea level. The climate is dry maritime
with mean annual rainfall of 550 mm and mean annual
temperature ofþ5.8 �C. The Tagamoisa wooded meadow orig-
inates at least 300 y ago (T. Ojala, pers. comm.). Haymaking
and sheep grazing facilitated the development of a highly
diverse flora (up to 67 species m�2), including several rare
orchids (Kukk & Kull 1997). The wooded meadow was
partly abandoned during World War II, resulting in rapid
forestation and decline in plant species richness. Several
inconsistent restoration attempts resulted in partial recov-
ery of the wooded meadow during 1970 to 1990. Since the
mid-1990s, most of the area had been mown annually in
July and slightly grazed in late August (Kukk & Kull
1997). The forested area has remained unmanaged for
>60 y.
Vernal flooding has resulted in mound development espe-
cially in the forest. The soil is classified as a Mollisihumi-
Rendzic Leptosol (FAO et al. 1998), with a thick O-horizon (up
to 7 cm depth) and a sandy A-horizon (from 5–7 to 25–35 cm
depth) on maritime sand (below 25–35 cm depth) and lime-
stone (below 90 cm depth). Both the wooded meadow and for-
est were dominated by downy birch (Betula pubescens),
common oak (Quercus robur), hazel (Corylus avellana), European
aspen (Populus tremula), black alder (Alnus glutinosa) and small-
leaved lime (Tilia cordata). Of these, P. tremula, B. pubescens,
C. avellana, and A. glutinosa dominated the undergrowth.
Ground vegetation of the managed meadow was predomi-
nantly composed of a dense turf of Poaceae spp. and Cyperaceae
spp. The forested area was covered by sparse Vaccinium myrtil-
lus, Hepatica nobilis, Oxalis acetosella, and Carex spp.
To obtain reference sequences for species-level identifica-
tion of EcM fungi, we performed irregular fruit body surveys
in summer and autumn, 2003 to 2005. The most abundant
agarics included Lactarius pubescens, L. evosmus, Leccinum
spp., Boletus luridus, Inocybe rimosa and I. maculata. Of taxa
with resupinate fruit bodies, Tomentella terrestris, T. cinerascens,
and Amphinema byssoides were the most common. Peziza
michelii and Hymenogaster spp. were the most abundant cup
fungi and taxa with hypogeous fruit bodies, respectively. Bole-
tus spp. fruited exclusively in the wooded meadow, whereas
T. cinerascens, and A. byssoides were found only in the forest.
Sampling
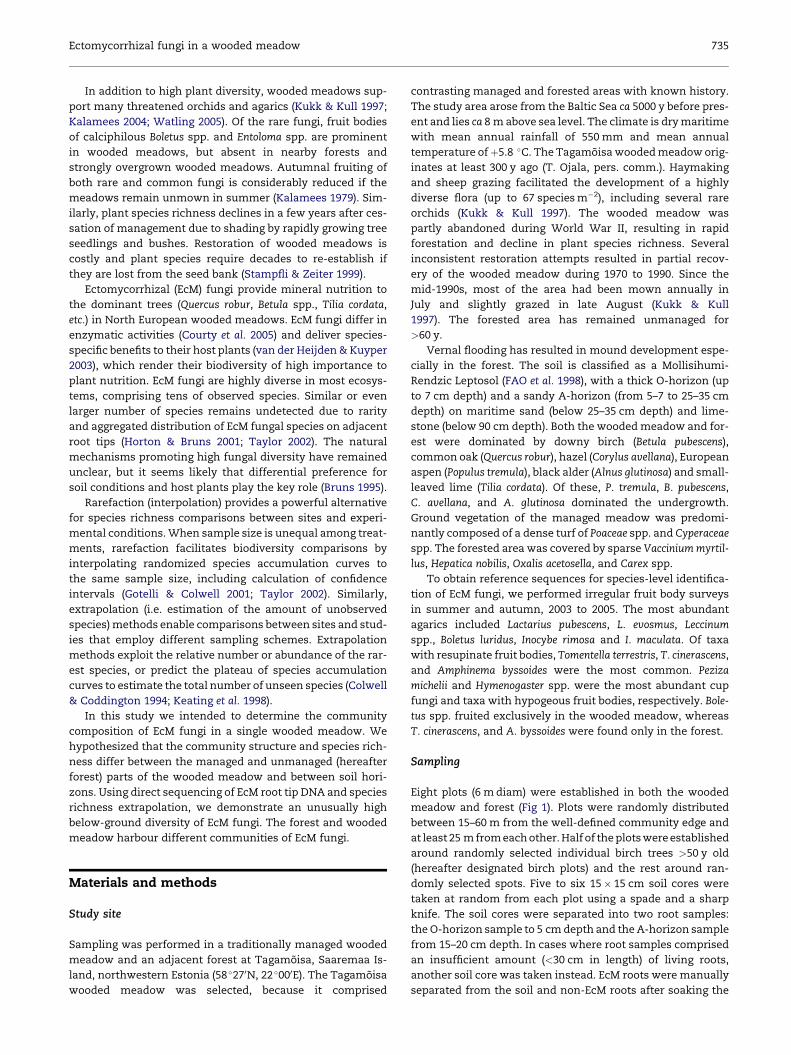
Eight plots (6 m diam) were established in both the wooded
meadow and forest (Fig 1). Plots were randomly distributed
between 15–60 m from the well-defined community edge and
at least 25 m from each other. Half of the plots were established
around randomly selected individual birch trees >50 y old
(hereafter designated birch plots) and the rest around ran-
domly selected spots. Five to six 15� 15 cm soil cores were
taken at random from each plot using a spade and a sharp
knife. The soil cores were separated into two root samples:
the O-horizon sample to 5 cm depth and the A-horizon sample
from 15–20 cm depth. In cases where root samples comprised
an insufficient amount (<30 cm in length) of living roots,
another soil core was taken instead. EcM roots were manually
separated from the soil and non-EcM roots after soaking the
736 L. Tedersoo et al.
root samples in tap water. Only birch roots were further ana-
lysed in birch plots, whereas the roots of all EcM trees were
studied in other plots. Birch roots were recognized by a charac-
teristic bright red bark, mild taste, and frequent ramification of
long roots. No attempt was made to confirm the host species
using molecular techniques. Roots were cut into 2–3 cm frag-
ments and laid onto large Petri dishes filled with water. All
EcM root tips were assigned to morphotypes on 12 randomly
selected root fragments, and counted. Two individual root
tips of each morphotype from each sample were mounted
into CTAB lysis buffer (100 mM Tris-HCI (pH 8.0), 1.4 M NaCl,
20 mM EDTA, 2% cetyl-trimethyl-ammonium-bromide) and
kept at room temperature until molecular analyses. An addi-
tional root tip cluster of each morphotype was stored in FEA
(90 % formalin, 5 % ethanol, 5 % acetic acid). Morphotypes
were further separated into anatomotypes based on the struc-
ture of mantle, cystidia, emanating hyphae and rhizomorphs
(Agerer 1991). One or two root tips of each anatomotype per
plot were subjected to DNA extraction and sequencing.
Fig 1 – Scheme of the study area at Tagamoisa including
the managed and unmanaged (forest) wooded meadow.
Randomly selected plots are shown as circles. B, only birch
roots sampled.
Three soil samples (125 cm3) were taken from each birch
plot from both O-horizon and A-horizon, and pooled by hori-
zon. Soil pH was determined in 1 N potassium chloride solu-
tion. Concentrations of calcium and magnesium were
measured optically in 1 M ammonium acetate (Tecator ASTN
90/92; Page et al. 1982). Phosphorus and potassium were deter-
mined in ammonium lactate (Tecator ASTN 9/84; AOAC 1990).
Organic matter content was determined based on the loss on
ignition for 2 h at 360 �C.
DNA extraction, PCR and sequencing
DNA was extracted according to Gardes & Bruns (1993), includ-
ing UltraClean� 15 (Mo Bio Laboratories, West Carlsbad, Cali-
fornia) treatment. PCR was performed using Ready To Go�beads (Amersham Pharmacia Biotech., Piscataway, New Jer-
sey), 0.5 ml of 20-mM primers, 6 ml DNA extract and 18 ml distilled
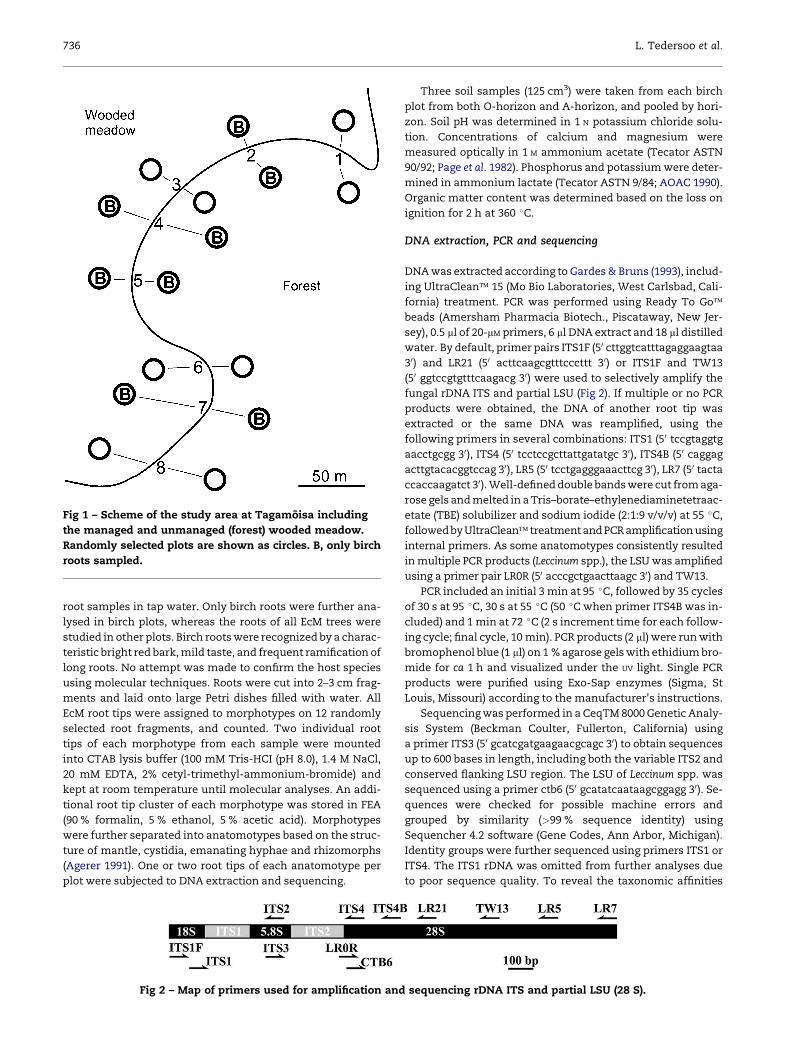
water. By default, primer pairs ITS1F (50 cttggtcatttagaggaagtaa
30) and LR21 (50 acttcaagcgtttcccttt 30) or ITS1F and TW13
(50 ggtccgtgtttcaagacg 30) were used to selectively amplify the
fungal rDNA ITS and partial LSU (Fig 2). If multiple or no PCR
products were obtained, the DNA of another root tip was
extracted or the same DNA was reamplified, using the
following primers in several combinations: ITS1 (50 tccgtaggtg
aacctgcgg 30), ITS4 (50 tcctccgcttattgatatgc 30), ITS4B (50 caggag
acttgtacacggtccag 30), LR5 (50 tcctgagggaaacttcg 30), LR7 (50 tacta
ccaccaagatct 30). Well-defined double bands were cut from aga-
rose gels and melted in a Tris–borate–ethylenediaminetetraac-
etate (TBE) solubilizer and sodium iodide (2:1:9 v/v/v) at 55 �C,
followed by UltraClean� treatment and PCR amplification using
internal primers. As some anatomotypes consistently resulted
in multiple PCR products (Leccinum spp.), the LSU was amplified
using a primer pair LR0R (50 acccgctgaacttaagc 30) and TW13.
PCR included an initial 3 min at 95 �C, followed by 35 cycles
of 30 s at 95 �C, 30 s at 55 �C (50 �C when primer ITS4B was in-
cluded) and 1 min at 72 �C (2 s increment time for each follow-
ing cycle; final cycle, 10 min). PCR products (2 ml) were run with
bromophenol blue (1 ml) on 1 % agarose gels with ethidium bro-
mide for ca 1 h and visualized under the UV light. Single PCR
products were purified using Exo-Sap enzymes (Sigma, St
Louis, Missouri) according to the manufacturer’s instructions.
Sequencing was performed in a CeqTM 8000 Genetic Analy-
sis System (Beckman Coulter, Fullerton, California) using
a primer ITS3 (50 gcatcgatgaagaacgcagc 30) to obtain sequences
up to 600 bases in length, including both the variable ITS2 and
conserved flanking LSU region. The LSU of Leccinum spp. was
sequenced using a primer ctb6 (50 gcatatcaataagcggagg 30). Se-
quences were checked for possible machine errors and
grouped by similarity (>99 % sequence identity) using
Sequencher 4.2 software (Gene Codes, Ann Arbor, Michigan).
Identity groups were further sequenced using primers ITS1 or
ITS4. The ITS1 rDNA was omitted from further analyses due
to poor sequence quality. To reveal the taxonomic affinities
Fig 2 – Map of primers used for amplification and sequencing rDNA ITS and partial LSU (28 S).
Ectomycorrhizal fungi in a wooded meadow 737
of fungal species, blastn or fasta3 searches of the ITS2 (without
any bases of flanking conserved regions) were carried out
against the public sequence databases National Center for Bio-
technology Information (NCBI), European Molecular Biology
Laboratory (EMBL) and UNITE (Koljalg et al. 2005). We also per-
formed blastn searches of partial LSU sequences if the ITS2 se-
quences could not be fully matched to any fruit body
sequences. We selected 98 % of ITS2 sequence identity as
a value of a molecular species criterion, because no sequences
obtained in this study displayed pair-wise identity between 97–
98.5 %. Moreover, many species of basidiomycetes exhibited
equally intense double peaks in sequence chromatograms,
which never included>1.5 % of the bases. These double peaks
probably represent polymorphism in ITS alleles (see Hibbett
2001; Selosse et al. 2002). To improve the identification at the
species level, we sequenced the ITS2 or the whole ITS region
of 16 fruit bodies from 12 fungal species as described above.
Both fruit body (Table 1) and root tip (Table 2) sequences
were submitted to EMBL. Throughout the text we prefer using
the major clades of Homobasidiomycetes (sensu Larsson et al.
2004) rather than orders, because there is much polyphyly
among taxa with resupinate and hypogeous fruit bodies.
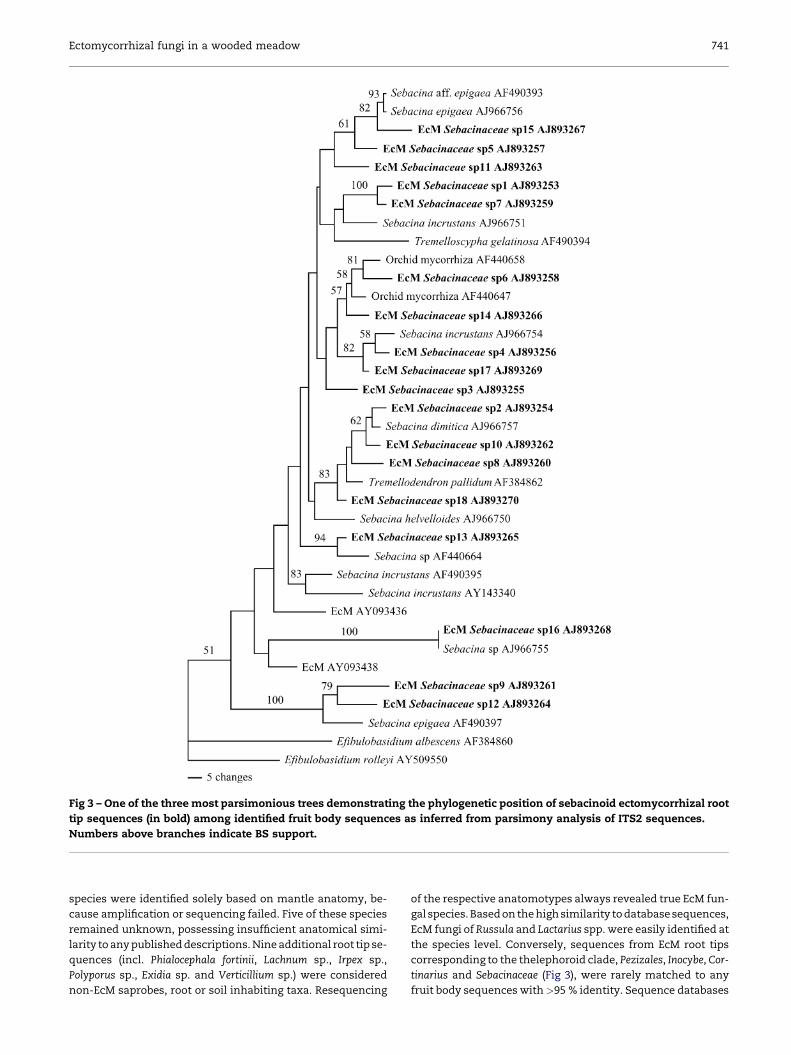
To demonstrate the phylogenetic position of sebacinoid
EcM species among Sebacinaceae (Fig 3), we manually aligned
all congeneric fruit body and a few best-matching root tip
sequences. We performed a parsimony analysis using PAUP
4.0d81 (Swofford 2002) with tree bisection–reconnection (TBR)
as a branch-swapping algorithm, gaps as the fifth character,
and 1000 random start replications. Efibulobasidium rolleyi was
selected as an outgroup taxon based on LSU phylogeny. BS
support was calculated based on 1000 permutations.
Statistical analyses
The plot was selected as a sampling unit, because samples
from such a small area are likely strongly autocorrelated and
not independent (Taylor 2002; Lilleskov et al. 2004). To compare
the large-scale differences in total species diversity between
the forest and wooded meadow and between soil horizons,
area-based rarefaction curves with 95 % confidence intervals
were calculated, using a computer program EstimateS (Colwell
2004). In these analyses, plots were sampled randomly with re-
placement, because otherwise confidence intervals are mean-
ingless in the upper end of the rarefaction curve (Colwell et al.
2004). To demonstrate the total EcM fungal diversity of the
study site and to estimate the sufficiency of sample size, we
calculated area-based species accumulation curves, sampling
plots randomly without replacement. Incidence-based species
richness estimates Jackknife2 (Burnham & Overton 1979) and
Chao2 (Chao 1987) were calculated to evaluate their perfor-
mance on this particular data set and to estimate the number
of unseen species. We always used area-based rarefaction and
species incidence, because EcM root tips do not represent fun-
gal individuals. As discussed by Colwell et al. (2004), area-based
rarefaction better reflects the true distribution of species,
whereas individual-based methods assume non-aggregated
distribution of species and individuals.
Detrended correspondence analysis (DCA) and canonical
correspondence analysis (CCA) were used to reveal trends
within the ectomycorrhizal fungal community and in relation
to measured environmental variables, respectively. Species
frequency with down-weighted rare species was used in
both analyses. Wooded meadow versus forest, soil horizon,
plot type (birch plot or all-tree plot) and ordinated plot (by
position, see Fig 1) were fitted in the species space to demon-
strate their relative importance and correlation with the
main axes. Birch plots were subjected to CCA. Ordination anal-
yses were performed using PC-ORD (McCune & Mefford 1999).
Results
Identification of EcM fungi
We distinguished 172 species of EcM fungi based on morpho-
typing 26,547 and sequencing 468 root tips. Among these, ten
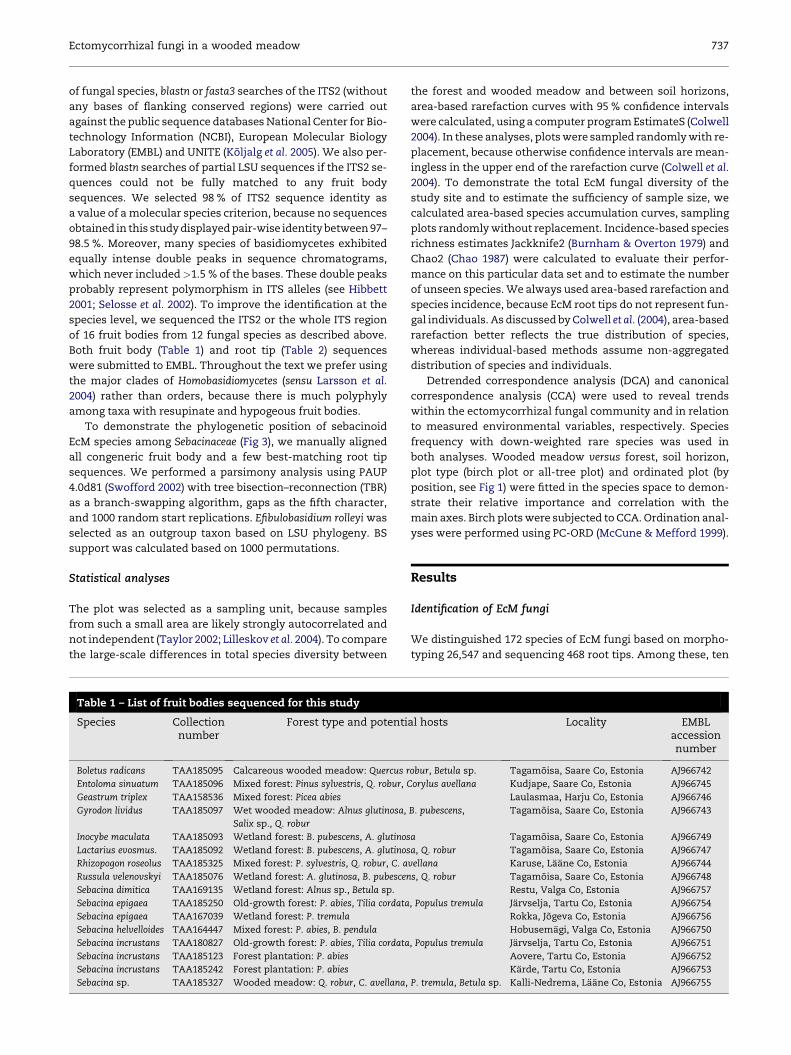
Table 1 – List of fruit bodies sequenced for this study
Species Collectionnumber
Forest type and potential hosts Locality EMBLaccessionnumber
Boletus radicans TAA185095 Calcareous wooded meadow: Quercus robur, Betula sp. Tagamoisa, Saare Co, Estonia AJ966742
Entoloma sinuatum TAA185096 Mixed forest: Pinus sylvestris, Q. robur, Corylus avellana Kudjape, Saare Co, Estonia AJ966745
Geastrum triplex TAA158536 Mixed forest: Picea abies Laulasmaa, Harju Co, Estonia AJ966746
Gyrodon lividus TAA185097 Wet wooded meadow: Alnus glutinosa, B. pubescens,
Salix sp., Q. robur
Tagamoisa, Saare Co, Estonia AJ966743
Inocybe maculata TAA185093 Wetland forest: B. pubescens, A. glutinosa Tagamoisa, Saare Co, Estonia AJ966749
Lactarius evosmus. TAA185092 Wetland forest: B. pubescens, A. glutinosa, Q. robur Tagamoisa, Saare Co, Estonia AJ966747
Rhizopogon roseolus TAA185325 Mixed forest: P. sylvestris, Q. robur, C. avellana Karuse, Laane Co, Estonia AJ966744
Russula velenovskyi TAA185076 Wetland forest: A. glutinosa, B. pubescens, Q. robur Tagamoisa, Saare Co, Estonia AJ966748
Sebacina dimitica TAA169135 Wetland forest: Alnus sp., Betula sp. Restu, Valga Co, Estonia AJ966757
Sebacina epigaea TAA185250 Old-growth forest: P. abies, Tilia cordata, Populus tremula Jarvselja, Tartu Co, Estonia AJ966754
Sebacina epigaea TAA167039 Wetland forest: P. tremula Rokka, Jogeva Co, Estonia AJ966756
Sebacina helvelloides TAA164447 Mixed forest: P. abies, B. pendula Hobusemagi, Valga Co, Estonia AJ966750
Sebacina incrustans TAA180827 Old-growth forest: P. abies, Tilia cordata, Populus tremula Jarvselja, Tartu Co, Estonia AJ966751
Sebacina incrustans TAA185123 Forest plantation: P. abies Aovere, Tartu Co, Estonia AJ966752
Sebacina incrustans TAA185242 Forest plantation: P. abies Karde, Tartu Co, Estonia AJ966753
Sebacina sp. TAA185327 Wooded meadow: Q. robur, C. avellana, P. tremula, Betula sp. Kalli-Nedrema, Laane Co, Estonia AJ966755
738 L. Tedersoo et al.
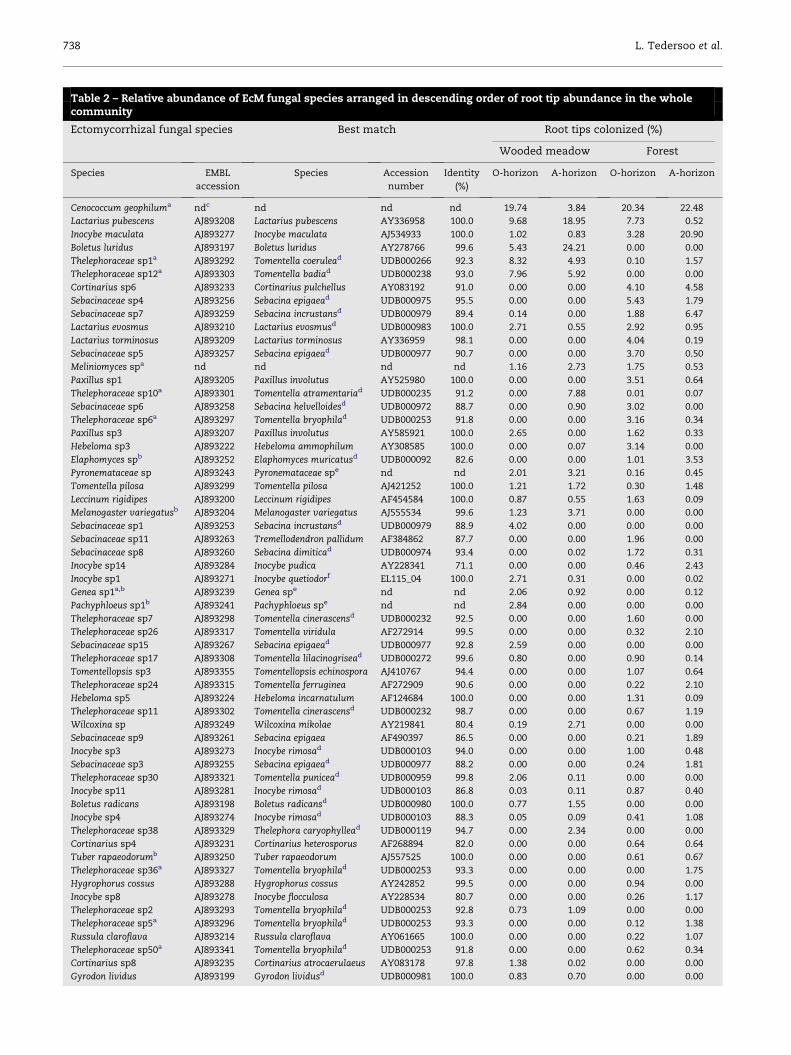
Table 2 – Relative abundance of EcM fungal species arranged in descending order of root tip abundance in the wholecommunity
Ectomycorrhizal fungal species Best match Root tips colonized (%)
Wooded meadow Forest
Species EMBL
accession
Species Accession
number
Identity
(%)
O-horizon A-horizon O-horizon A-horizon
Cenococcum geophiluma ndc nd nd nd 19.74 3.84 20.34 22.48
Lactarius pubescens AJ893208 Lactarius pubescens AY336958 100.0 9.68 18.95 7.73 0.52
Inocybe maculata AJ893277 Inocybe maculata AJ534933 100.0 1.02 0.83 3.28 20.90
Boletus luridus AJ893197 Boletus luridus AY278766 99.6 5.43 24.21 0.00 0.00
Thelephoraceae sp1a AJ893292 Tomentella coerulead UDB000266 92.3 8.32 4.93 0.10 1.57
Thelephoraceae sp12a AJ893303 Tomentella badiad UDB000238 93.0 7.96 5.92 0.00 0.00
Cortinarius sp6 AJ893233 Cortinarius pulchellus AY083192 91.0 0.00 0.00 4.10 4.58
Sebacinaceae sp4 AJ893256 Sebacina epigaead UDB000975 95.5 0.00 0.00 5.43 1.79
Sebacinaceae sp7 AJ893259 Sebacina incrustansd UDB000979 89.4 0.14 0.00 1.88 6.47
Lactarius evosmus AJ893210 Lactarius evosmusd UDB000983 100.0 2.71 0.55 2.92 0.95
Lactarius torminosus AJ893209 Lactarius torminosus AY336959 98.1 0.00 0.00 4.04 0.19
Sebacinaceae sp5 AJ893257 Sebacina epigaead UDB000977 90.7 0.00 0.00 3.70 0.50
Meliniomyces spa nd nd nd nd 1.16 2.73 1.75 0.53
Paxillus sp1 AJ893205 Paxillus involutus AY525980 100.0 0.00 0.00 3.51 0.64
Thelephoraceae sp10a AJ893301 Tomentella atramentariad UDB000235 91.2 0.00 7.88 0.01 0.07
Sebacinaceae sp6 AJ893258 Sebacina helvelloidesd UDB000972 88.7 0.00 0.90 3.02 0.00
Thelephoraceae sp6a AJ893297 Tomentella bryophilad UDB000253 91.8 0.00 0.00 3.16 0.34
Paxillus sp3 AJ893207 Paxillus involutus AY585921 100.0 2.65 0.00 1.62 0.33
Hebeloma sp3 AJ893222 Hebeloma ammophilum AY308585 100.0 0.00 0.07 3.14 0.00
Elaphomyces spb AJ893252 Elaphomyces muricatusd UDB000092 82.6 0.00 0.00 1.01 3.53
Pyronemataceae sp AJ893243 Pyronemataceae spe nd nd 2.01 3.21 0.16 0.45
Tomentella pilosa AJ893299 Tomentella pilosa AJ421252 100.0 1.21 1.72 0.30 1.48
Leccinum rigidipes AJ893200 Leccinum rigidipes AF454584 100.0 0.87 0.55 1.63 0.09
Melanogaster variegatusb AJ893204 Melanogaster variegatus AJ555534 99.6 1.23 3.71 0.00 0.00
Sebacinaceae sp1 AJ893253 Sebacina incrustansd UDB000979 88.9 4.02 0.00 0.00 0.00
Sebacinaceae sp11 AJ893263 Tremellodendron pallidum AF384862 87.7 0.00 0.00 1.96 0.00
Sebacinaceae sp8 AJ893260 Sebacina dimiticad UDB000974 93.4 0.00 0.02 1.72 0.31
Inocybe sp14 AJ893284 Inocybe pudica AY228341 71.1 0.00 0.00 0.46 2.43
Inocybe sp1 AJ893271 Inocybe quetiodorf EL115_04 100.0 2.71 0.31 0.00 0.02
Genea sp1a,b AJ893239 Genea spe nd nd 2.06 0.92 0.00 0.12
Pachyphloeus sp1b AJ893241 Pachyphloeus spe nd nd 2.84 0.00 0.00 0.00
Thelephoraceae sp7 AJ893298 Tomentella cinerascensd UDB000232 92.5 0.00 0.00 1.60 0.00
Thelephoraceae sp26 AJ893317 Tomentella viridula AF272914 99.5 0.00 0.00 0.32 2.10
Sebacinaceae sp15 AJ893267 Sebacina epigaead UDB000977 92.8 2.59 0.00 0.00 0.00
Thelephoraceae sp17 AJ893308 Tomentella lilacinogrisead UDB000272 99.6 0.80 0.00 0.90 0.14
Tomentellopsis sp3 AJ893355 Tomentellopsis echinospora AJ410767 94.4 0.00 0.00 1.07 0.64
Thelephoraceae sp24 AJ893315 Tomentella ferruginea AF272909 90.6 0.00 0.00 0.22 2.10
Hebeloma sp5 AJ893224 Hebeloma incarnatulum AF124684 100.0 0.00 0.00 1.31 0.09
Thelephoraceae sp11 AJ893302 Tomentella cinerascensd UDB000232 98.7 0.00 0.00 0.67 1.19
Wilcoxina sp AJ893249 Wilcoxina mikolae AY219841 80.4 0.19 2.71 0.00 0.00
Sebacinaceae sp9 AJ893261 Sebacina epigaea AF490397 86.5 0.00 0.00 0.21 1.89
Inocybe sp3 AJ893273 Inocybe rimosad UDB000103 94.0 0.00 0.00 1.00 0.48
Sebacinaceae sp3 AJ893255 Sebacina epigaead UDB000977 88.2 0.00 0.00 0.24 1.81
Thelephoraceae sp30 AJ893321 Tomentella punicead UDB000959 99.8 2.06 0.11 0.00 0.00
Inocybe sp11 AJ893281 Inocybe rimosad UDB000103 86.8 0.03 0.11 0.87 0.40
Boletus radicans AJ893198 Boletus radicansd UDB000980 100.0 0.77 1.55 0.00 0.00
Inocybe sp4 AJ893274 Inocybe rimosad UDB000103 88.3 0.05 0.09 0.41 1.08
Thelephoraceae sp38 AJ893329 Thelephora caryophyllead UDB000119 94.7 0.00 2.34 0.00 0.00
Cortinarius sp4 AJ893231 Cortinarius heterosporus AF268894 82.0 0.00 0.00 0.64 0.64
Tuber rapaeodorumb AJ893250 Tuber rapaeodorum AJ557525 100.0 0.00 0.00 0.61 0.67
Thelephoraceae sp36a AJ893327 Tomentella bryophilad UDB000253 93.3 0.00 0.00 0.00 1.75
Hygrophorus cossus AJ893288 Hygrophorus cossus AY242852 99.5 0.00 0.00 0.94 0.00
Inocybe sp8 AJ893278 Inocybe flocculosa AY228534 80.7 0.00 0.00 0.26 1.17
Thelephoraceae sp2 AJ893293 Tomentella bryophilad UDB000253 92.8 0.73 1.09 0.00 0.00
Thelephoraceae sp5a AJ893296 Tomentella bryophilad UDB000253 93.3 0.00 0.00 0.12 1.38
Russula claroflava AJ893214 Russula claroflava AY061665 100.0 0.00 0.00 0.22 1.07
Thelephoraceae sp50a AJ893341 Tomentella bryophilad UDB000253 91.8 0.00 0.00 0.62 0.34
Cortinarius sp8 AJ893235 Cortinarius atrocaerulaeus AY083178 97.8 1.38 0.02 0.00 0.00
Gyrodon lividus AJ893199 Gyrodon lividusd UDB000981 100.0 0.83 0.70 0.00 0.00
Ectomycorrhizal fungi in a wooded meadow 739
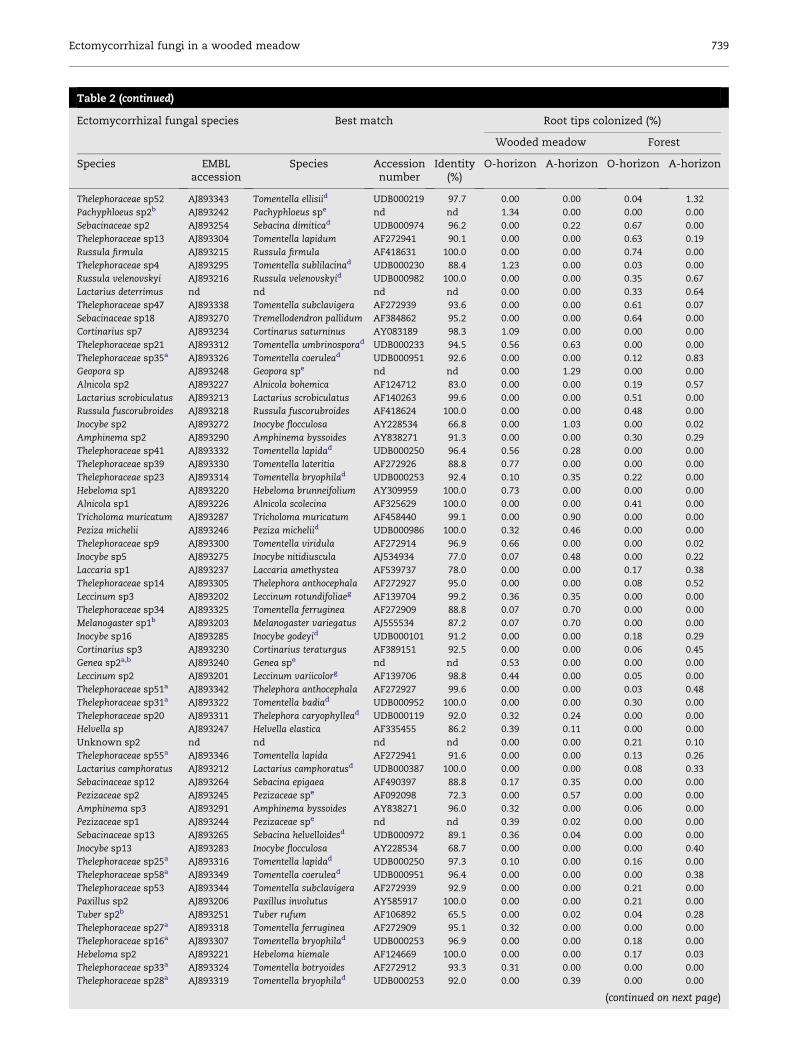
Table 2 (continued)
Ectomycorrhizal fungal species Best match Root tips colonized (%)
Wooded meadow Forest
Species EMBLaccession
Species Accessionnumber
Identity(%)
O-horizon A-horizon O-horizon A-horizon
Thelephoraceae sp52 AJ893343 Tomentella ellisiid UDB000219 97.7 0.00 0.00 0.04 1.32
Pachyphloeus sp2b AJ893242 Pachyphloeus spe nd nd 1.34 0.00 0.00 0.00
Sebacinaceae sp2 AJ893254 Sebacina dimiticad UDB000974 96.2 0.00 0.22 0.67 0.00
Thelephoraceae sp13 AJ893304 Tomentella lapidum AF272941 90.1 0.00 0.00 0.63 0.19
Russula firmula AJ893215 Russula firmula AF418631 100.0 0.00 0.00 0.74 0.00
Thelephoraceae sp4 AJ893295 Tomentella sublilacinad UDB000230 88.4 1.23 0.00 0.03 0.00
Russula velenovskyi AJ893216 Russula velenovskyid UDB000982 100.0 0.00 0.00 0.35 0.67
Lactarius deterrimus nd nd nd nd 0.00 0.00 0.33 0.64
Thelephoraceae sp47 AJ893338 Tomentella subclavigera AF272939 93.6 0.00 0.00 0.61 0.07
Sebacinaceae sp18 AJ893270 Tremellodendron pallidum AF384862 95.2 0.00 0.00 0.64 0.00
Cortinarius sp7 AJ893234 Cortinarus saturninus AY083189 98.3 1.09 0.00 0.00 0.00
Thelephoraceae sp21 AJ893312 Tomentella umbrinosporad UDB000233 94.5 0.56 0.63 0.00 0.00
Thelephoraceae sp35a AJ893326 Tomentella coerulead UDB000951 92.6 0.00 0.00 0.12 0.83
Geopora sp AJ893248 Geopora spe nd nd 0.00 1.29 0.00 0.00
Alnicola sp2 AJ893227 Alnicola bohemica AF124712 83.0 0.00 0.00 0.19 0.57
Lactarius scrobiculatus AJ893213 Lactarius scrobiculatus AF140263 99.6 0.00 0.00 0.51 0.00
Russula fuscorubroides AJ893218 Russula fuscorubroides AF418624 100.0 0.00 0.00 0.48 0.00
Inocybe sp2 AJ893272 Inocybe flocculosa AY228534 66.8 0.00 1.03 0.00 0.02
Amphinema sp2 AJ893290 Amphinema byssoides AY838271 91.3 0.00 0.00 0.30 0.29
Thelephoraceae sp41 AJ893332 Tomentella lapidad UDB000250 96.4 0.56 0.28 0.00 0.00
Thelephoraceae sp39 AJ893330 Tomentella lateritia AF272926 88.8 0.77 0.00 0.00 0.00
Thelephoraceae sp23 AJ893314 Tomentella bryophilad UDB000253 92.4 0.10 0.35 0.22 0.00
Hebeloma sp1 AJ893220 Hebeloma brunneifolium AY309959 100.0 0.73 0.00 0.00 0.00
Alnicola sp1 AJ893226 Alnicola scolecina AF325629 100.0 0.00 0.00 0.41 0.00
Tricholoma muricatum AJ893287 Tricholoma muricatum AF458440 99.1 0.00 0.90 0.00 0.00
Peziza michelii AJ893246 Peziza micheliid UDB000986 100.0 0.32 0.46 0.00 0.00
Thelephoraceae sp9 AJ893300 Tomentella viridula AF272914 96.9 0.66 0.00 0.00 0.02
Inocybe sp5 AJ893275 Inocybe nitidiuscula AJ534934 77.0 0.07 0.48 0.00 0.22
Laccaria sp1 AJ893237 Laccaria amethystea AF539737 78.0 0.00 0.00 0.17 0.38
Thelephoraceae sp14 AJ893305 Thelephora anthocephala AF272927 95.0 0.00 0.00 0.08 0.52
Leccinum sp3 AJ893202 Leccinum rotundifoliaeg AF139704 99.2 0.36 0.35 0.00 0.00
Thelephoraceae sp34 AJ893325 Tomentella ferruginea AF272909 88.8 0.07 0.70 0.00 0.00
Melanogaster sp1b AJ893203 Melanogaster variegatus AJ555534 87.2 0.07 0.70 0.00 0.00
Inocybe sp16 AJ893285 Inocybe godeyid UDB000101 91.2 0.00 0.00 0.18 0.29
Cortinarius sp3 AJ893230 Cortinarius teraturgus AF389151 92.5 0.00 0.00 0.06 0.45
Genea sp2a,b AJ893240 Genea spe nd nd 0.53 0.00 0.00 0.00
Leccinum sp2 AJ893201 Leccinum variicolorg AF139706 98.8 0.44 0.00 0.05 0.00
Thelephoraceae sp51a AJ893342 Thelephora anthocephala AF272927 99.6 0.00 0.00 0.03 0.48
Thelephoraceae sp31a AJ893322 Tomentella badiad UDB000952 100.0 0.00 0.00 0.30 0.00
Thelephoraceae sp20 AJ893311 Thelephora caryophyllead UDB000119 92.0 0.32 0.24 0.00 0.00
Helvella sp AJ893247 Helvella elastica AF335455 86.2 0.39 0.11 0.00 0.00
Unknown sp2 nd nd nd nd 0.00 0.00 0.21 0.10
Thelephoraceae sp55a AJ893346 Tomentella lapida AF272941 91.6 0.00 0.00 0.13 0.26
Lactarius camphoratus AJ893212 Lactarius camphoratusd UDB000387 100.0 0.00 0.00 0.08 0.33
Sebacinaceae sp12 AJ893264 Sebacina epigaea AF490397 88.8 0.17 0.35 0.00 0.00
Pezizaceae sp2 AJ893245 Pezizaceae spe AF092098 72.3 0.00 0.57 0.00 0.00
Amphinema sp3 AJ893291 Amphinema byssoides AY838271 96.0 0.32 0.00 0.06 0.00
Pezizaceae sp1 AJ893244 Pezizaceae spe nd nd 0.39 0.02 0.00 0.00
Sebacinaceae sp13 AJ893265 Sebacina helvelloidesd UDB000972 89.1 0.36 0.04 0.00 0.00
Inocybe sp13 AJ893283 Inocybe flocculosa AY228534 68.7 0.00 0.00 0.00 0.40
Thelephoraceae sp25a AJ893316 Tomentella lapidad UDB000250 97.3 0.10 0.00 0.16 0.00
Thelephoraceae sp58a AJ893349 Tomentella coerulead UDB000951 96.4 0.00 0.00 0.00 0.38
Thelephoraceae sp53 AJ893344 Tomentella subclavigera AF272939 92.9 0.00 0.00 0.21 0.00
Paxillus sp2 AJ893206 Paxillus involutus AY585917 100.0 0.00 0.00 0.21 0.00
Tuber sp2b AJ893251 Tuber rufum AF106892 65.5 0.00 0.02 0.04 0.28
Thelephoraceae sp27a AJ893318 Tomentella ferruginea AF272909 95.1 0.32 0.00 0.00 0.00
Thelephoraceae sp16a AJ893307 Tomentella bryophilad UDB000253 96.9 0.00 0.00 0.18 0.00
Hebeloma sp2 AJ893221 Hebeloma hiemale AF124669 100.0 0.00 0.00 0.17 0.03
Thelephoraceae sp33a AJ893324 Tomentella botryoides AF272912 93.3 0.31 0.00 0.00 0.00
Thelephoraceae sp28a AJ893319 Tomentella bryophilad UDB000253 92.0 0.00 0.39 0.00 0.00
(continued on next page)

740 L. Tedersoo et al.
Table 2 (continued)
Ectomycorrhizal fungal species Best match Root tips colonized (%)
Wooded meadow Forest
Species EMBLaccession
Species Accessionnumber
Identity(%)
O-horizon A-horizon O-horizon A-horizon
Pseudotomentella sp1 AJ893351 Pseudotomentella tristis AF274772 82.8 0.31 0.00 0.00 0.00
Thelephoraceae sp32a AJ893323 Tomentella lilacinogrisead UDB000272 94.4 0.00 0.00 0.00 0.31
Thelephoraceae sp3a AJ893294 Tomentella ferruginea AF272909 93.6 0.29 0.00 0.00 0.00
Thelephoraceae sp29 AJ893320 Tomentella galzinii AF272928 99.1 0.29 0.00 0.00 0.00
Thelephoraceae sp18 AJ893309 Tomentella umbrinospora AF272920 99.5 0.29 0.00 0.00 0.00
Hebeloma sp4 AJ893223 Hebeloma nigellum AY311524 99.5 0.00 0.00 0.15 0.03
Russula sphagnophila AJ893219 Russula sphagnophila AY061719 100.0 0.00 0.00 0.14 0.03
Thelephoraceae sp46a AJ893337 Tomentella lapidad UDB000249 96.9 0.24 0.00 0.00 0.00
Amphinema sp1 AJ893289 Amphinema byssoides AY838271 100.0 0.15 0.00 0.05 0.00
Thelephoraceae sp22 AJ893313 Tomentella lilacinogrisead UDB000953 99.6 0.00 0.00 0.00 0.22
Sebacinaceae sp17 AJ893269 Sebacina epigaead UDB000975 94.6 0.00 0.00 0.13 0.00
Lactarius cf. necator AJ893211 Lactarius necatord UDB000361 98.4 0.00 0.00 0.00 0.22
Thelephoraceae sp48a AJ893339 Tomentella atramentariad UDB000955 97.3 0.00 0.00 0.12 0.00
Unknown sp3 nd nd nd nd 0.10 0.11 0.00 0.00
Thelephoraceae sp43 AJ893334 Tomentella bryophilad UDB000253 91.5 0.17 0.02 0.00 0.00
Thelephoraceae sp54 AJ893345 Tomentella botryoidesd UDB000255 94.8 0.00 0.00 0.00 0.19
Thelephoraceae sp45 AJ893336 Tomentella ramosissima U83480 96.9 0.17 0.00 0.00 0.00
Thelephoraceae sp60a nd nd nd nd 0.00 0.00 0.10 0.00
Hebeloma sp6 AJ893225 Hebeloma aestivale AY308582 98.6 0.00 0.00 0.10 0.00
Thelephoraceae sp40a AJ893331 Tomentella atramentaria AF272904 89.8 0.10 0.07 0.00 0.00
Inocybe sp12 AJ893282 Inocybe flocculosa AY228534 65.9 0.00 0.20 0.00 0.00
Inocybe sp6 AJ893276 Inocybe maculta AF534933 72.4 0.00 0.02 0.08 0.00
Inocybe sp9 AJ893279 Inocybe aff. boltoniif EL 71_03 100.0 0.00 0.00 0.00 0.15
Thelephoraceae sp57a AJ893348 Tomentella stuposad UDB000246 100.0 0.00 0.00 0.08 0.00
Unknown sp4 nd nd nd nd 0.00 0.00 0.00 0.12
Unknown sp1a nd nd nd nd 0.00 0.00 0.00 0.12
Thelephoraceae sp37 AJ893328 Tomentella lilacinogrisead UDB000272 93.8 0.00 0.00 0.07 0.00
Inocybe sp10 AJ893280 Inocybe flocculosa AY228534 72.4 0.00 0.13 0.00 0.00
Sebacinaceae sp16 AJ893268 Sebacina spd UDB000976 100.0 0.00 0.00 0.01 0.09
Rhizopogon luteolus AJ893196 Rhizopogon luteolus AF062936 100.0 0.00 0.00 0.06 0.00
Thelephoraceae sp42a AJ893333 Tomentella viridula AF272914 93.3 0.00 0.11 0.00 0.00
Sebacinaceae sp14 AJ893266 Tremellodendron schweinitzii AY296258 86.3 0.09 0.00 0.00 0.00
Cortinarius sp5 AJ893232 Cortinarius casimirid UDB000062 94.3 0.00 0.11 0.00 0.00
Thelephoraceae sp56a AJ893347 Tomentella terrestris AF272901 99.1 0.00 0.00 0.05 0.00
Cortinarius sp2 AJ893229 Cortinarius acutovelatus AY083175 99.1 0.00 0.00 0.03 0.03
Thelephoraceae sp59a AJ893350 Tomentella stuposad UDB000248 97.3 0.00 0.09 0.00 0.00
Thelephoraceae sp49 AJ893340 Tomentella lateritiad UDB000963 92.9 0.00 0.00 0.03 0.02
Thelephoraceae sp15 AJ893306 Tomentella subclavigerad UDB000259 93.3 0.00 0.00 0.04 0.00
Inocybe sp17 AJ893286 Cortinarius subtortus AY174859 65.1 0.00 0.00 0.03 0.00
Tomentellopsis sp1 AJ893353 Tomentellopsis submollis AY641459 91.7 0.03 0.00 0.00 0.00
Sebacinaceae sp10 AJ893262 Sebacina dimiticad UDB000974 95.2 0.03 0.00 0.00 0.00
Hebeloma sp7 AJ893238 Hebeloma cavipes AF124670 95.3 0.00 0.04 0.00 0.00
Cortinarius sp10 nd nd nd nd 0.00 0.00 0.02 0.00
Thelephoraceae sp44 AJ893335 Tomentella lapida AF272941 90.6 0.00 0.02 0.00 0.00
Thelephoraceae sp19 AJ893310 Tomentella ferruginea AF272909 95.9 0.02 0.00 0.00 0.00
Cadophora finlandica nd nd nd nd 0.00 0.02 0.00 0.00
Unknown sp5 nd nd nd nd 0.00 0.00 0.01 0.00
Tomentellopsis sp2 AJ893354 Tomentellopsis echinospora AJ410758 100.0 0.00 0.00 0.01 0.00
Russula laricina AJ893217 Russula laricina AY061685 99.1 0.00 0.00 0.01 0.00
Pseudotomentella sp2 AJ893352 Pseudotomentella tristis AF274772 78.4 0.00 0.00 0.00 0.02
Laccaria sp2 nd nd nd nd 0.00 0.00 0.01 0.00
Cortinarius sp9 AJ893236 Cortinarius cedriolens AY083179 97.9 0.00 0.00 0.01 0.00
Cortinarius sp1 AJ893228 Cortinarius dionyseae AY174813 90.0 0.00 0.00 0.01 0.00
EMBL accession numbers and the best ITS2 sequence matches to fruit body sequences are indicated.
a Species with melanized cell walls.
b Species with presumably hypogeous fruit bodies.
c nd, Not determined.
d Identified according to UNITE database (Koljalg et al. 2005).
e Identified based on phylogenetic analysis in Tedersoo et al. (2006).
f E. Larsson, unpublished sequence data.
g Identification based on LSU sequence.
Ectomycorrhizal fungi in a wooded meadow 741
Fig 3 – One of the three most parsimonious trees demonstrating the phylogenetic position of sebacinoid ectomycorrhizal root
tip sequences (in bold) among identified fruit body sequences as inferred from parsimony analysis of ITS2 sequences.
Numbers above branches indicate BS support.
species were identified solely based on mantle anatomy, be-
cause amplification or sequencing failed. Five of these species
remained unknown, possessing insufficient anatomical simi-
larity to any published descriptions. Nine additional root tip se-
quences (incl. Phialocephala fortinii, Lachnum sp., Irpex sp.,
Polyporus sp., Exidia sp. and Verticillium sp.) were considered
non-EcM saprobes, root or soil inhabiting taxa. Resequencing
of the respective anatomotypes always revealed true EcM fun-
gal species. Based on the high similarity to database sequences,
EcM fungi of Russula and Lactarius spp. were easily identified at
the species level. Conversely, sequences from EcM root tips
corresponding to the thelephoroid clade, Pezizales, Inocybe, Cor-
tinarius and Sebacinaceae (Fig 3), were rarely matched to any
fruit body sequences with>95 % identity. Sequence databases
742 L. Tedersoo et al.
EMBL and NCBI taken together, and UNITE contributed to 55.0
and 39.4 % of the best ITS2 sequence matches, respectively.
Diversity and community structure of EcM fungi
This study revealed a few abundant and a large number of
rare species (Fig 4). Cenococcum geophilum was the most com-
mon species, occupying 17.8 % of root tips, 30.2 % of root
fragments, 59.0 % of samples and 93.8 % of plots. While C.
geophilum dominated from the root tip to plot scale, other
species were differentially represented at these scales (Fig
4), indicating more or less aggregated distribution. Of these
species, Lactarius pubescens (8.5 %), Inocybe maculata (6.2 %)
and Boletus luridus (5.4 %) exceeded 5 % in relative root tip
abundance. Apart from C. geophilum, I. maculata colonized
the largest number of root fragments (12.5 %) and samples
(28.3 %), while L. pubescens and Tomentella sp1 occupied the
largest number of plots (both 68.8 %), followed by I. maculata
(62.5 %) and Pyronemataceae sp. (56.3 %). Of the rare fungi, ten
species (5.8 %) colonized a single root tip, 22 species (12.8 %)
colonized a single root fragment, 60 species (34.9 %) occurred
only in one sample, and 101 species (58.7 %) were present in
a single plot.
Thelephora/Tomentella was the dominant taxon (60 spp.),
followed by Sebacina/Tremellodendron (18 spp.), Inocybe (16
spp.), Russula/Lactarius (13 spp.), Cortinarius (10 spp.) and Hebe-
loma/Alnicola (9 spp.). The thelephoroid clade comprised 65
species, followed by euagaric (39 spp.), russuloid (13 spp.)
and bolete (12 spp.) clades. Pezizales comprised 13 species.
Basidiomycetes and ascomycetes accounted for 150 and 17
of the identified species, respectively.
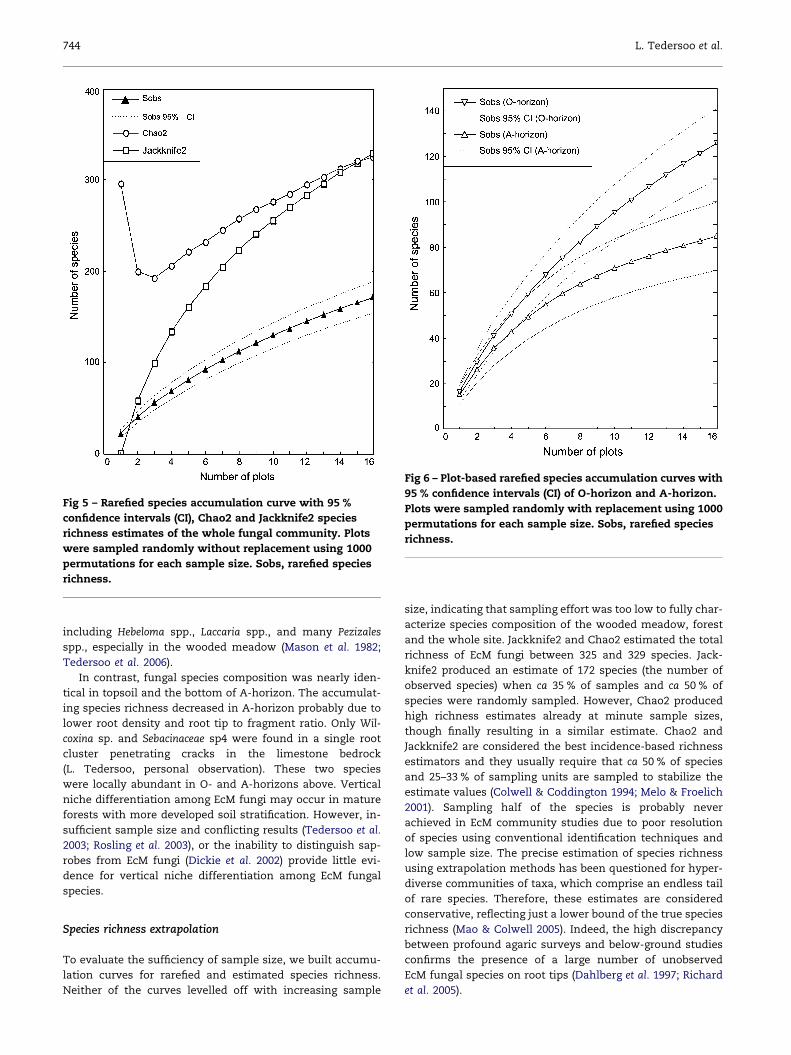
We calculated area-based rarefaction curves and species
richness estimates for the whole EcM fungal community (Fig 5).
The rarefaction curve did not reach a plateau when all
plots were randomly sampled. Chao2 and Jackknife2 func-
tions estimated the total richness of 325 and 329 species,
respectively. Neither of these functions levelled off with
increasing sample size. Jackknife2 produced an estimate
of the observed 172 spp. when ca 35 % of plots and ca
50 % of species were sampled, whereas Chao2 produced
high, but unstable total richness estimates at very small
sample sizes.
The forest and wooded meadow comprised 116 and 88 spe-
cies, respectively, with no significant difference based on the
overlapping confidence intervals (not shown). Only 32
(18.6 %) species were shared between the two communities.
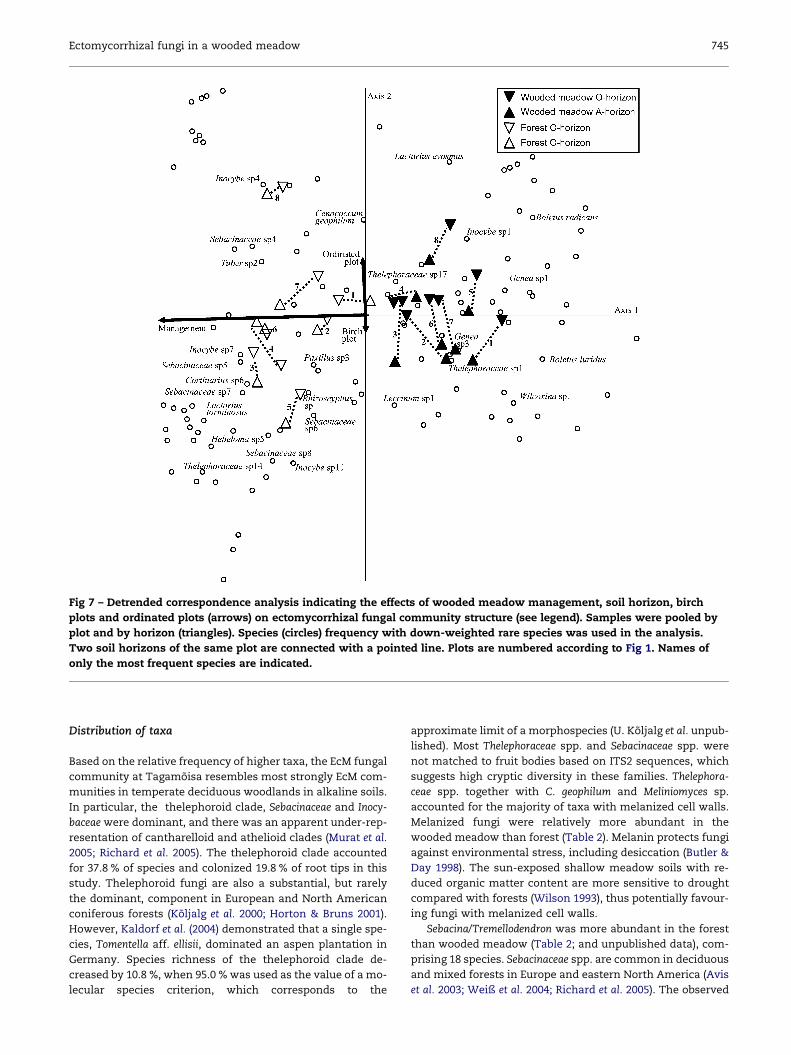
Species richness in O-horizon (146 spp.) was significantly
higher than in A-horizon (118 spp.; Fig 6). The two soil hori-
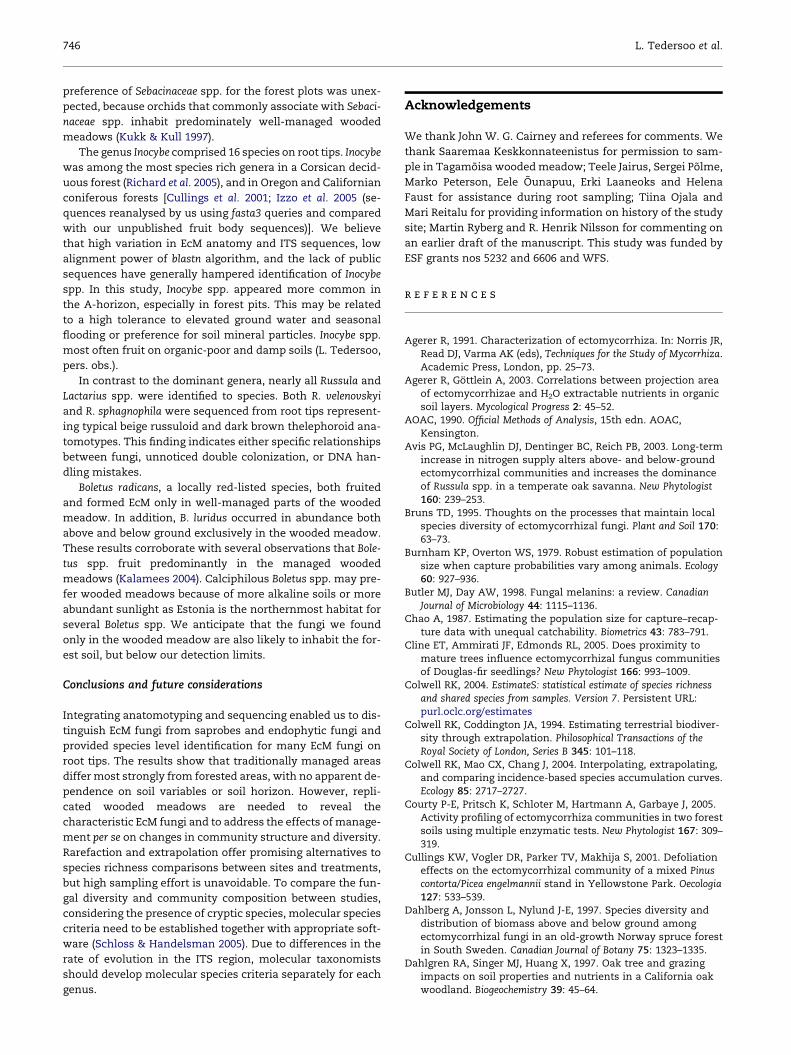
zons shared 92 (53.5 %) species. DCA axis1 separated the forest
plots from wooded meadow plots based on their fungal com-
munity composition (Fig 7). Axis2 was correlated with weak
effects of plot position and birch plot. EcM fungal community
structures was affected least by soil horizon. Fungal commu-
nities of the two soil horizons of the same plot nearly always
clustered together. The first two axes (eigenvalues 0.551 and
0.367) explained 18.5 and 11.4 % of the variance, respectively.
However, all the environmental variables were strongly corre-
lated with CCA axis1 and revealed no distinct patterns based
on species frequency (not shown).
Discussion
Diversity of EcM fungi
A total of 172 species of EcM fungi were observed in this
snapshot study of 166 root samples and 16 plots. Similarly,
high richness of EcM fungi has been reported in sequencing
studies in a Corsican old-growth Quercus ilex stand (140 spe-
cies, 120 samples; Richard et al. 2005) and a Californian mixed
old-growth forest (101 species, 144 samples over three years;
Izzo et al. 2005). Using sequencing and extrapolation, Walker
et al. (2005) estimated the total EcM species richness of oak
seedlings between 116 and 143 species in a mature mixed
forest in the Appalachian Mountains (75 observed species,
259 seedlings, 120 plots, two years). Anatomotyping and
RFLP-typing, the most frequently used identification methods
in most previous studies (reviewed in Horton & Bruns 2001),
tend to underestimate the diversity of EcM fungi due to poor
resolution of closely related species (Karen et al. 1997; Edwards
& Turco 2005).
Unlike plants (Kukk & Kull 1997), communities of EcM
fungi were highly diverse in both the wooded meadow and
forest. However, DCA revealed a substantial difference in
the fungal community composition in the wooded meadow
versus forest, which confirms the observation of only 18.6 %
of shared species. We believe that much of the difference
in species occurrence is attributable to an insufficient sam-
pling effort, where most of the rare species have remained
below the detection limit. Still, habitat quality may play
a substantial role in influencing the frequency and abun-
dance of dominant species. In general, a diverse array of
habitats and hosts likely contribute to the high species rich-
ness at the study site. In particular, the wooded meadow soil
has a higher pH, but lower nutrient concentrations than for-
est soil (L. Tedersoo et al. unpublished). However, CCA
revealed no obvious effect of the measured environmental
variables on the EcM fungal community, suggesting that
the most important soil parameters have remained unmea-
sured. Alternatively, plot size may be considerably larger
than the size of a nutrient patch (Agerer & Gottlein 2003),
or fungal species possess wide ecological amplitudes. Reich
et al. (2001) demonstrated lower nitrogen mineralization
and litter nitrogen concentration, lower shoot and fine root
net primary production, but higher fine root biomass and
lifespan when canopy openness increased in an American
oak savanna. Grassland soils are more compacted and
drought sensitive because of direct sun exposure (Wilson
1993), whereas differences in soil patch quality are more
pronounced in forests due to abundant dead wood, pit and
mound structure, and nutrient uptake by extensive tree
root systems. Stem flow and litter fall account for higher nu-
trient concentrations, creating local hotspots of enzymatic
and microbial activity below tree canopies (Dahlgren et al.
1997; Waldrop & Firestone 2004). Nutrient gradients influ-
ence EcM fungal species composition (Lilleskov et al. 2002)
and partly explain the differential preference of EcM fungi
for different distance to tree trunk (Mason et al. 1982; Cline
et al. 2005). Conversely, large gaps and sparse root distribu-
tion create establishment opportunities for early stage fungi,

Ectomycorrhizal fungi in a wooded meadow 743
Fig 4 – Abundance of EcM fungal species. (A) Based on colonized root tips; (B) Based on colonized root fragments (2–3 cm
diam); (C) Based on root samples; (D) Based on plots. Open bars, unmanaged wooded meadow (forest); closed bars, managed
wooded meadow. Species are arranged in descending order of root tip abundance (see Table 2).
744 L. Tedersoo et al.
including Hebeloma spp., Laccaria spp., and many Pezizales
spp., especially in the wooded meadow (Mason et al. 1982;
Tedersoo et al. 2006).
In contrast, fungal species composition was nearly iden-
tical in topsoil and the bottom of A-horizon. The accumulat-
ing species richness decreased in A-horizon probably due to
lower root density and root tip to fragment ratio. Only Wil-
coxina sp. and Sebacinaceae sp4 were found in a single root
cluster penetrating cracks in the limestone bedrock
(L. Tedersoo, personal observation). These two species
were locally abundant in O- and A-horizons above. Vertical
niche differentiation among EcM fungi may occur in mature
forests with more developed soil stratification. However, in-
sufficient sample size and conflicting results (Tedersoo et al.
2003; Rosling et al. 2003), or the inability to distinguish sap-
robes from EcM fungi (Dickie et al. 2002) provide little evi-
dence for vertical niche differentiation among EcM fungal
species.
Species richness extrapolation
To evaluate the sufficiency of sample size, we built accumu-
lation curves for rarefied and estimated species richness.
Neither of the curves levelled off with increasing sample
Fig 5 – Rarefied species accumulation curve with 95 %
confidence intervals (CI), Chao2 and Jackknife2 species
richness estimates of the whole fungal community. Plots
were sampled randomly without replacement using 1000
permutations for each sample size. Sobs, rarefied species
richness.
size, indicating that sampling effort was too low to fully char-
acterize species composition of the wooded meadow, forest
and the whole site. Jackknife2 and Chao2 estimated the total
richness of EcM fungi between 325 and 329 species. Jack-
knife2 produced an estimate of 172 species (the number of
observed species) when ca 35 % of samples and ca 50 % of
species were randomly sampled. However, Chao2 produced
high richness estimates already at minute sample sizes,
though finally resulting in a similar estimate. Chao2 and
Jackknife2 are considered the best incidence-based richness
estimators and they usually require that ca 50 % of species
and 25–33 % of sampling units are sampled to stabilize the
estimate values (Colwell & Coddington 1994; Melo & Froelich
2001). Sampling half of the species is probably never
achieved in EcM community studies due to poor resolution
of species using conventional identification techniques and
low sample size. The precise estimation of species richness
using extrapolation methods has been questioned for hyper-
diverse communities of taxa, which comprise an endless tail
of rare species. Therefore, these estimates are considered
conservative, reflecting just a lower bound of the true species
richness (Mao & Colwell 2005). Indeed, the high discrepancy
between profound agaric surveys and below-ground studies
confirms the presence of a large number of unobserved
EcM fungal species on root tips (Dahlberg et al. 1997; Richard
et al. 2005).
Fig 6 – Plot-based rarefied species accumulation curves with
95 % confidence intervals (CI) of O-horizon and A-horizon.
Plots were sampled randomly with replacement using 1000
permutations for each sample size. Sobs, rarefied species
richness.
Ectomycorrhizal fungi in a wooded meadow 745
Fig 7 – Detrended correspondence analysis indicating the effects of wooded meadow management, soil horizon, birch
plots and ordinated plots (arrows) on ectomycorrhizal fungal community structure (see legend). Samples were pooled by
plot and by horizon (triangles). Species (circles) frequency with down-weighted rare species was used in the analysis.
Two soil horizons of the same plot are connected with a pointed line. Plots are numbered according to Fig 1. Names of
only the most frequent species are indicated.
Distribution of taxa
Based on the relative frequency of higher taxa, the EcM fungal
community at Tagamoisa resembles most strongly EcM com-
munities in temperate deciduous woodlands in alkaline soils.
In particular, the thelephoroid clade, Sebacinaceae and Inocy-
baceae were dominant, and there was an apparent under-rep-
resentation of cantharelloid and athelioid clades (Murat et al.
2005; Richard et al. 2005). The thelephoroid clade accounted
for 37.8 % of species and colonized 19.8 % of root tips in this
study. Thelephoroid fungi are also a substantial, but rarely
the dominant, component in European and North American
coniferous forests (Koljalg et al. 2000; Horton & Bruns 2001).
However, Kaldorf et al. (2004) demonstrated that a single spe-
cies, Tomentella aff. ellisii, dominated an aspen plantation in
Germany. Species richness of the thelephoroid clade de-
creased by 10.8 %, when 95.0 % was used as the value of a mo-
lecular species criterion, which corresponds to the
approximate limit of a morphospecies (U. Koljalg et al. unpub-
lished). Most Thelephoraceae spp. and Sebacinaceae spp. were
not matched to fruit bodies based on ITS2 sequences, which
suggests high cryptic diversity in these families. Thelephora-
ceae spp. together with C. geophilum and Meliniomyces sp.
accounted for the majority of taxa with melanized cell walls.
Melanized fungi were relatively more abundant in the
wooded meadow than forest (Table 2). Melanin protects fungi
against environmental stress, including desiccation (Butler &
Day 1998). The sun-exposed shallow meadow soils with re-
duced organic matter content are more sensitive to drought
compared with forests (Wilson 1993), thus potentially favour-
ing fungi with melanized cell walls.
Sebacina/Tremellodendron was more abundant in the forest
than wooded meadow (Table 2; and unpublished data), com-
prising 18 species. Sebacinaceae spp. are common in deciduous
and mixed forests in Europe and eastern North America (Avis
et al. 2003; Weiß et al. 2004; Richard et al. 2005). The observed
746 L. Tedersoo et al.
preference of Sebacinaceae spp. for the forest plots was unex-
pected, because orchids that commonly associate with Sebaci-
naceae spp. inhabit predominately well-managed wooded
meadows (Kukk & Kull 1997).
The genus Inocybe comprised 16 species on root tips. Inocybe
was among the most species rich genera in a Corsican decid-
uous forest (Richard et al. 2005), and in Oregon and Californian
coniferous forests [Cullings et al. 2001; Izzo et al. 2005 (se-
quences reanalysed by us using fasta3 queries and compared
with our unpublished fruit body sequences)]. We believe
that high variation in EcM anatomy and ITS sequences, low
alignment power of blastn algorithm, and the lack of public
sequences have generally hampered identification of Inocybe
spp. In this study, Inocybe spp. appeared more common in
the A-horizon, especially in forest pits. This may be related
to a high tolerance to elevated ground water and seasonal
flooding or preference for soil mineral particles. Inocybe spp.
most often fruit on organic-poor and damp soils (L. Tedersoo,
pers. obs.).
In contrast to the dominant genera, nearly all Russula and
Lactarius spp. were identified to species. Both R. velenovskyi
and R. sphagnophila were sequenced from root tips represent-
ing typical beige russuloid and dark brown thelephoroid ana-
tomotypes. This finding indicates either specific relationships
between fungi, unnoticed double colonization, or DNA han-
dling mistakes.
Boletus radicans, a locally red-listed species, both fruited
and formed EcM only in well-managed parts of the wooded
meadow. In addition, B. luridus occurred in abundance both
above and below ground exclusively in the wooded meadow.
These results corroborate with several observations that Bole-
tus spp. fruit predominantly in the managed wooded
meadows (Kalamees 2004). Calciphilous Boletus spp. may pre-
fer wooded meadows because of more alkaline soils or more
abundant sunlight as Estonia is the northernmost habitat for
several Boletus spp. We anticipate that the fungi we found
only in the wooded meadow are also likely to inhabit the for-
est soil, but below our detection limits.
Conclusions and future considerations
Integrating anatomotyping and sequencing enabled us to dis-
tinguish EcM fungi from saprobes and endophytic fungi and
provided species level identification for many EcM fungi on
root tips. The results show that traditionally managed areas
differ most strongly from forested areas, with no apparent de-
pendence on soil variables or soil horizon. However, repli-
cated wooded meadows are needed to reveal the
characteristic EcM fungi and to address the effects of manage-
ment per se on changes in community structure and diversity.
Rarefaction and extrapolation offer promising alternatives to
species richness comparisons between sites and treatments,
but high sampling effort is unavoidable. To compare the fun-
gal diversity and community composition between studies,
considering the presence of cryptic species, molecular species
criteria need to be established together with appropriate soft-
ware (Schloss & Handelsman 2005). Due to differences in the
rate of evolution in the ITS region, molecular taxonomists
should develop molecular species criteria separately for each
genus.
Acknowledgements
We thank John W. G. Cairney and referees for comments. We
thank Saaremaa Keskkonnateenistus for permission to sam-
ple in Tagamoisa wooded meadow; Teele Jairus, Sergei Polme,
Marko Peterson, Eele Ounapuu, Erki Laaneoks and Helena
Faust for assistance during root sampling; Tiina Ojala and
Mari Reitalu for providing information on history of the study
site; Martin Ryberg and R. Henrik Nilsson for commenting on
an earlier draft of the manuscript. This study was funded by
ESF grants nos 5232 and 6606 and WFS.
r e f e r e n c e s
Agerer R, 1991. Characterization of ectomycorrhiza. In: Norris JR,Read DJ, Varma AK (eds), Techniques for the Study of Mycorrhiza.Academic Press, London, pp. 25–73.
Agerer R, Gottlein A, 2003. Correlations between projection areaof ectomycorrhizae and H2O extractable nutrients in organicsoil layers. Mycological Progress 2: 45–52.
AOAC, 1990. Official Methods of Analysis, 15th edn. AOAC,Kensington.
Avis PG, McLaughlin DJ, Dentinger BC, Reich PB, 2003. Long-termincrease in nitrogen supply alters above- and below-groundectomycorrhizal communities and increases the dominanceof Russula spp. in a temperate oak savanna. New Phytologist160: 239–253.
Bruns TD, 1995. Thoughts on the processes that maintain localspecies diversity of ectomycorrhizal fungi. Plant and Soil 170:63–73.
Burnham KP, Overton WS, 1979. Robust estimation of populationsize when capture probabilities vary among animals. Ecology60: 927–936.
Butler MJ, Day AW, 1998. Fungal melanins: a review. CanadianJournal of Microbiology 44: 1115–1136.
Chao A, 1987. Estimating the population size for capture–recap-ture data with unequal catchability. Biometrics 43: 783–791.
Cline ET, Ammirati JF, Edmonds RL, 2005. Does proximity tomature trees influence ectomycorrhizal fungus communitiesof Douglas-fir seedlings? New Phytologist 166: 993–1009.
Colwell RK, 2004. EstimateS: statistical estimate of species richnessand shared species from samples. Version 7. Persistent URL:purl.oclc.org/estimates
Colwell RK, Coddington JA, 1994. Estimating terrestrial biodiver-sity through extrapolation. Philosophical Transactions of theRoyal Society of London, Series B 345: 101–118.
Colwell RK, Mao CX, Chang J, 2004. Interpolating, extrapolating,and comparing incidence-based species accumulation curves.Ecology 85: 2717–2727.
Courty P-E, Pritsch K, Schloter M, Hartmann A, Garbaye J, 2005.Activity profiling of ectomycorrhiza communities in two forestsoils using multiple enzymatic tests. New Phytologist 167: 309–319.
Cullings KW, Vogler DR, Parker TV, Makhija S, 2001. Defoliationeffects on the ectomycorrhizal community of a mixed Pinuscontorta/Picea engelmannii stand in Yellowstone Park. Oecologia127: 533–539.
Dahlberg A, Jonsson L, Nylund J-E, 1997. Species diversity anddistribution of biomass above and below ground amongectomycorrhizal fungi in an old-growth Norway spruce forestin South Sweden. Canadian Journal of Botany 75: 1323–1335.
Dahlgren RA, Singer MJ, Huang X, 1997. Oak tree and grazingimpacts on soil properties and nutrients in a California oakwoodland. Biogeochemistry 39: 45–64.
Ectomycorrhizal fungi in a wooded meadow 747
DeFries R, 2002. Past and future sensitivity of primary productionto human modification of the landscape. Geophysics ResearchLetters 29: 36–39.
Dickie IA, Xu B, Koide RT, 2002. Vertical niche differentiation ofectomycorrhizal hyphae in soil as shown by T-RFLP analysis.New Phytologist 156: 527–535.
Edwards IP, Turco RF, 2005. Inter- and intraspecific resolution ofnrDNA TRFLP assessed by computer-simulated restrictionanalysis of a diverse collection of ectomycorrhizal fungi.Mycological Research 109: 213–226.
FAO, ISRIC, ISSS, 1998. World Reference Base for Soil Resources. FAO,Rome.
Gardes M, Bruns TD, 1993. ITS primers with enhancedspecificity for basidiomycetesdapplication to the identifi-cation of mycorrhizas and rusts. Molecular Ecology 2: 113–118.
Gotelli NJ, Colwell RK, 2001. Quantifying biodiversity: proceduresand pitfalls in the measurement and comparison of speciesrichness. Ecology Letters 4: 379–391.
Hibbett DS, 2001. Shiitake mushrooms and molecular clocks:historical biogeography of Lentinula. Journal of Biogeography 28:231–241.
Horton TR, Bruns TD, 2001. The molecular evolution in ectomy-corrhizal ecology: peeking into the black box. Molecular Ecology10: 1855–1871.
Izzo A, Agbowo J, Bruns TD, 2005. Detection of plot level changesin ectomycorrhizal communities across years in an old-growth mixed-conifer forest. New Phytologist 166: 619–629.
Kalamees K, 1979. The fungal cover and its seasonal dynamics ofthe Estonian meadows. Yearbook of The Estonian NaturalistsSociety 67: 39–54.
Kalamees K, 2004. Seenestik. In: Kukk T (ed), Parandkooslused.Parandkoosluste Kaitse Uhing, Tartu, pp. 136–142.
Kaldorf M, Renker C, Fladung M, Buscot F, 2004. Characterizationand spatial distribution of ectomycorrhizas colonizing aspenclones released in an experimental field. Mycorrhiza 14: 295–306.
Karen O, Hogberg N, Dahlberg A, Jonsson L, Nylund J-E, 1997.Inter- and intraspecific variation of the ITS region of rDNA ofectomycorrhizal fungi in Fennoscandia as detected by endo-nuclease analysis. New Phytologist 136: 313–325.
Keating KA, Quinn JF, Ivie MA, Ivie LL, 1998. Estimating the ef-fectiveness of further sampling in species inventories. Ecolog-ical Applications 8: 1239–1249.
Koljalg U, Dahlberg A, Taylor AFS, Larsson E, Hallenberg N,Stenlid J, Larsson K-H, Fransson PM, Karen O, Jonsson L, 2000.Diversity and abundance of resupinate thelephoroid fungi asectomycorrhizal symbionts in Swedish boreal forests. Molec-ular Ecology 9: 1985–1996.
Koljalg U, Larsson K-H, Abarenkov K, Nilsson RH, Alexander IJ,Eberhardt U, Erland S, Høiland K, Kjøller R, Larsson E,Pennanen T, Sen R, Taylor AFS, Tedersoo L, Vralstad T,Ursing BM, 2005. UNITE: a database providing web-basedmethods for the molecular identification of ectomycorrhizalfungi. New Phytologist 166: 1063–1068. http://unite.zbi.ee/.
Kukk T, Kull K, 1997. Puisniidud. Estonia Maritima 2: 1–249.Kull K, Zobel M, 1991. High species richness in an Estonian
wooded meadow. Journal of Vegetation Science 2: 711–714.Larsson K-H, Larsson E, Koljalg U, 2004. High phylogenetic
diversity among corticioid homobasidiomycetes. MycologicalResearch 108: 983–1002.
Lilleskov EA, Bruns TD, Horton TR, Taylor DL, Grogan P, 2004.Detection of forest stand-level spatial structure in ectomy-corrhizal fungal communities. FEMS Microbiology Ecology 49:319–332.
Lilleskov EA, Fahey TJ, Horton TR, Lovett GM, 2002. Belowgroundectomycorrhizal community change over a nitrogen deposi-tion gradient in Alaska. Ecology 83: 104–115.
Mao CX, Colwell RK, 2005. Estimation of species richness: mixturemodels, the role of rare species, and inferential challenges.Ecology 86: 1143–1153.
Mason PA, Last FT, Pelham J, Ingleby K, 1982. Ecology of somefungi associated with an ageing stand of birches (Betula pen-dula and B. pubescens). Forest Ecology and Management 4:19–39.
McCune B, Mefford MJ, 1999. Multivariate Analysis of Ecological DataVer. 4.01. MjM Software, Gleneden Beach.
Melo AS, Froelich CG, 2001. Evaluation of methods for estimatingmacroinvertebrate species richness using individual stones intropical streams. Freshwater Biology 46: 711–721.
Murat C, Vizzini A, Bonfante P, Mello A, 2005. Morphological andmolecular typing of the below-ground fungal community innatural Tuber magnatum truffle-ground. FEMS MicrobiologyLetters 245: 307–313.
Nuzzo V, 1986. Extent and status of Midwest oak savanna: pre-settlement and 1985. Natural Areas Journal 6: 6–36.
Page AL, Miller RH, Keeney DR, 1982. Methods of Soil Analysis. II.Chemical and Microbiological Properties, 2nd edn. AmericanSociety of Agronomy, Madison.
Reich PB, Peterson DW, Wedin DA, Wrage K, 2001. Fire and veg-etation effects on productivity and nitrogen cycling acrossa forest–grassland continuum. Ecology 82: 1703–1719.
Richard F, Millot S, Gardes M, Selosse M-A, 2005. Diversity andspecificity of ectomycorrhizal fungi retrieved from an old-growth Mediterranean forest dominated by Quercus ilex. NewPhytologist 166: 1011–1023.
Rosling A, Landeweert R, Lindahl BD, Larsson K-H, Kuyper TW,Taylor AFS, Finlay RD, 2003. Vertical distribution of ectomy-corrhizal fungi in a podzol profile. New Phytologist 159: 775–783.
Schloss PD, Handelsman J, 2005. Introducing DOTUR, a computerprogram for defining operational taxonomic units and esti-mating species richness. Applied and Environmental Microbiology71: 1501–1506.
Selosse M-A, Weiß M, Jany J-L, Tillier A, 2002. Communities andpopulations of sebacinoid basidiomycetes associated with theachlorophyllous orchid Neottia nidus-avis and neighbouringtree ectomycorrhizae. Molecular Ecology 11: 1831–1844.
Stampfli A, Zeiter M, 1999. Plant species decline due to aban-donment of meadows cannot easily be reversed by mowing. Acase study from the southern Alps. Journal of Vegetation Science10: 151–164.
Swofford DL, 2002. PAUP*. Phylogenetic Analysis Using Parsimony(*and Other Methods). Version 4. Sinauer Associates, Sunderland.
Taylor AFS, 2002. Fungal diversity in ectomycorrhizal communi-ties: sampling effort and species detection. Plant and Soil 244:19–28.
Tedersoo L, Koljalg U, Hallenberg N, Larsson K-H, 2003. Fine scaledistribution of ectomycorrhizal fungi and roots across sub-strate layers including coarse woody debris in a mixed forest.New Phytologist 159: 153–165.
Tedersoo L, Suvi T, Larsson E, Koljalg U, 2006. Molecular andmorphological diversity of pezizalean ectomycorrhiza. NewPhytologist, 170: 581–596.
van der Heijden EW, Kuyper TW, 2003. Ecological strategies ofectomycorrhizal fungi of Salix repens: root manipulationversus root replacement. Oikos 103: 668–680.
van Dijk, G, 2002. Biodiversity indicators in agriculture: a combi-nation of species and habitat approaches. Proceedings of theOECD Expert Meeting on Agri-Biodiversity Indicators. OECD,Zurich
Vitousek PM, 1994. Beyond global warming: ecology and globalchange. Ecology 75: 1861–1876.
Waldrop MP, Firestone MK, 2004. Microbial community utilizationof recalcitrant and simple carbon compounds: impact of oak-woodland plant communities. Oecologia 138: 275–284.

748 L. Tedersoo et al.
Walker JF, Miller OK, Horton JL, 2005. Hyperdiversity of ectomy-corrhizal fungus assemblages on oak seedlings in mixed for-ests in the Southern Appalachian Mountains. Molecular Ecology14: 829–838.
Watling R, 2005. Fungal conservation: some impressionsdapersonal view. Exotic species and fungi: interactions withfungal, plant, and animal communities. In: Dighton J, White JF,Oudemans P (eds), The Fungal Community. Its Organization
and Role in the Ecosystem. CRC Press, Boca Ranton, pp.881–896.
Weiß M, Selosse M-A, Rexer K-H, Urban A, Oberwinkler F, 2004.Sebacinales: a hitherto overlooked cosm of heterobasidiomy-cetes with a broad mycorrhizal potential. Mycological Research108: 1003–1010.
Wilson SD, 1993. Belowground competition in forest and prairie.Oikos 68: 146–150.

Unpublished supplementary information (lost during the revising process)
Table 1. The effect of wooded meadow management and soil horizon on diversity and frequency ofectomycorrhizal fungi. Values represent means ± SE. Different letters indicate significant differences (based onBenjamini and Hochberg´s sharpening modification to Bonferroni correction; Benjamini & Hochberg, 2000 asimplemented in a spreadsheet program of Verhoeven et al. (2005)) for both factors separately based on three-way mixed ANOVAs. Neither block effects nor interactions were significant. Species with melanized cell walls(see table 2) were distinguished microscopically; species with hypogeous fruit bodies were distinguished basedon sequence similarity and phylogenetic analyses (table 2).
Wooded meadow management Soil horizon
Diversity variables / taxa Managed Unmanaged O-horizon A-horizonThe number of observedspecies per plot 14.3 ± 0.9 16.4 ± 0.9 16.9 ± 1.0x 13.8 ± 0.7y
The number of observedspecies per sample 4.63 ± 0.36 5.30 ± 0.28 5.65 ± 0.32x 4.27 ± 0.23y
The number of observedspecies per root fragment 1.50 ± 0.07a 1.83 ± 0.07b 1.82 ± 0.07x 1.50 ± 0.07y
Jackknife2 richness estimatefor plot 25.3 ± 1.8 29.6 ± 1.9 30.1 ± 2.0x 24.8 ± 1.6y
Chao2 richness estimate forplot 24.1 ± 2.19 31.0 ± 3.3 29.8 ± 2.5 25.3 ± 3.2Shannon diversity index forplot 2.49 ± 0.08 2.65 ± 0.06 2.65 ± 0.08x 2.49 ± 0.05y
The number of root tips perroot fragment 10.8 ± 0.8a 15.3 ± 1.7b 15.9 ± 1.6x 10.3 ± 0.8y
Cenococcum geophilum 3.06 ± 0.48 2.81 ± 0.39 3.80 ± 0.36x 2.07 ± 0.38y
Genea sp1 0.75 ± 0.19a 0.05 ± 0.05b 0.50 ± 0.18 0.30 ± 0.15
Genea sp3 0.94 ± 0.23 0.31 ± 0.18 0.56 ± 0.22 0.69 ± 0.22
Inocybe maculata 0.25 ± 0.14a 2.49 ± 0.35b 1.16 ± 0.34x 1.58 ± 0.43y
Lactarius pubescens 1.13 ± 0.20 0.81 ± 0.32 1.25 ± 0.31 0.69 ± 0.20
Sebacinaceae sp4 0.00 ± 0.00a 0.98 ± 0.24b 0.62 ± 0.25 0.35 ± 0.15
Thelephoraceae sp1 2.06 ± 0.36a 0.56 ± 0.24b 1.44 ± 0.43 1.19 ± 0.28
Tomentella pilosa 0.69 ± 0.22 0.29 ± 0.11 0.68 ± 0.22x 0.30 ± 0.12y
Boletus spp. (%) 5.92 ± 0.90a 0.00 ± 0.00b 2.24 ± 0.75 3.69 ± 1.16
Cortinariaceae spp. (%) 6.75 ± 1.47a 4.12 ± 1.25b 3.75 ± 1.14 7.12 ± 1.50
Inocybe spp. (%) 8.78 ± 2.05 14.64 ± 1.59 8.36 ± 1.46x 15.06 ± 2.06y
Pezizales spp. (%) 18.1 ± 1.7a 4.1 ± 1.2b 10.1 ± 2.4 12.0 ± 2.3
Russulaceae spp. (%) 6.89 ± 0.85 9.61 ± 1.73 9.47 ± 1.27 7.03 ± 1.46
Sebacinaceae spp. (%) 4.52 ± 1.14a 13.79 ± 1.12b 9.36 ± 1.45 8.95 ± 1.82
Thelephorales spp. (%) 32.3 ± 2.2 26.9 ± 2.1 30.9 ± 2.3 28.3 ± 2.1Taxa with hypogeous fruitbodies (%) 15.8 ± 1.93a 4.6 ± 1.3b 10.2 ± 2.3 10.2 ± 2.1Taxa with melanized cell walls(%) 24.5 ± 2.2a 19.7 ± 1.8b 21.8 ± 2.1 22.3 ± 2.1Taxa with melanized cell walls(excl. C. geophilum; %) 17.7 ± 2.0a 14.3 ± 1.7b 16.1 ± 1.8 15.9 ± 2.0
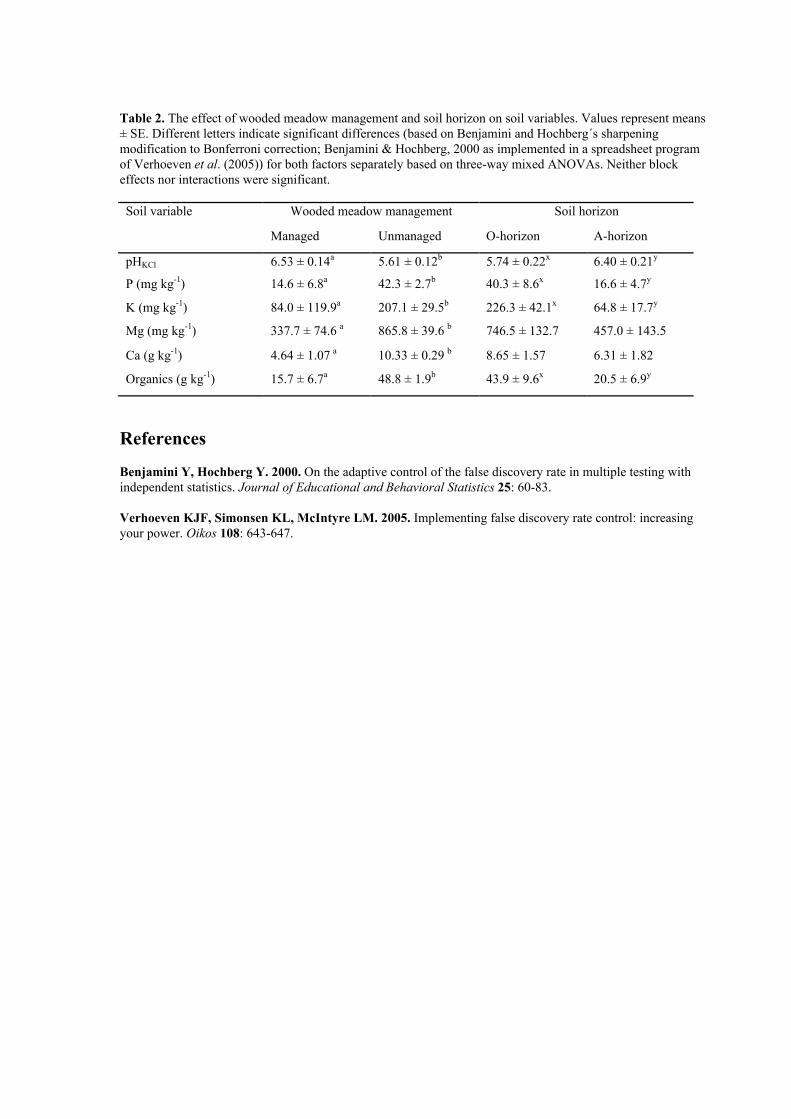
Table 2. The effect of wooded meadow management and soil horizon on soil variables. Values represent means± SE. Different letters indicate significant differences (based on Benjamini and Hochberg´s sharpeningmodification to Bonferroni correction; Benjamini & Hochberg, 2000 as implemented in a spreadsheet programof Verhoeven et al. (2005)) for both factors separately based on three-way mixed ANOVAs. Neither blockeffects nor interactions were significant.
Soil variable Wooded meadow management Soil horizon
Managed Unmanaged O-horizon A-horizon
pHKCl 6.53 ± 0.14a 5.61 ± 0.12b 5.74 ± 0.22x 6.40 ± 0.21y
P (mg kg-1) 14.6 ± 6.8a 42.3 ± 2.7b 40.3 ± 8.6x 16.6 ± 4.7y
K (mg kg-1) 84.0 ± 119.9a 207.1 ± 29.5b 226.3 ± 42.1x 64.8 ± 17.7y
Mg (mg kg-1) 337.7 ± 74.6 a 865.8 ± 39.6 b 746.5 ± 132.7 457.0 ± 143.5
Ca (g kg-1) 4.64 ± 1.07 a 10.33 ± 0.29 b 8.65 ± 1.57 6.31 ± 1.82
Organics (g kg-1) 15.7 ± 6.7a 48.8 ± 1.9b 43.9 ± 9.6x 20.5 ± 6.9y
References
Benjamini Y, Hochberg Y. 2000. On the adaptive control of the false discovery rate in multiple testing withindependent statistics. Journal of Educational and Behavioral Statistics 25: 60-83.
Verhoeven KJF, Simonsen KL, McIntyre LM. 2005. Implementing false discovery rate control: increasingyour power. Oikos 108: 643-647.