eco/wkp(2000)14 the healthcare system in hungary economics
TRANSCRIPT

Unclassified ECO/WKP(2000)14
Organisation de Coopération et de Développement Economiques OLIS : 28-Apr-2000Organisation for Economic Co-operation and Development Dist. : 05-May-2000__________________________________________________________________________________________
English text onlyECONOMICS DEPARTMENT
THE HEALTHCARE SYSTEM IN HUNGARY
ECONOMICS DEPARTMENT WORKING PAPERS NO. 241
byEva Orosz and Andrew Burns
Unclassified
EC
O/W
KP
(2000)14E
nglish text only
Most Economics Department Working Papers beginning with No. 144 are now available throughOECD’s Internet Web site at http://www.oecd.org/eco/eco.
90492
Document complet disponible sur OLIS dans son format d’origine
Complete document available on OLIS in its original format

ECO/WKP(2000)14
2
ABSTRACT/RÉSUMÉ
This paper examines within an international context, the healthcare system in Hungary. While the system resemblesin many of its broad features those of other OECD countries, Hungarians have the lowest life expectancy in theOECD and its rate of increase over the last 20 years has been much slower than in the rest of the area. The Hungarianhealth system is relatively resource intensive and is characterised by high hospitalisation rates, an excess supply ofspecialists and perverse incentives both for doctors and hospital administrators. Budgetary rules prevent hospitalsfrom properly amortising investments and limit their capacity to manage labour costs. Furthermore inadequatesupervision of billing by the state administrator has led to a fraudulent inflation in both the number and the“seriousness” of treatments. Recent reforms have concentrated on containing costs but efforts to improve servicedelivery and health outcomes have been plagued by problems of institutional conflict. Although cost pressures on thehealthcare system are likely to intensify in the future, the economy’s capacity to pay will improve and, as a result, thegap between the quality and quantity of Hungarian versus European healthcare will gradually close. The paper makesa series of concrete policy recommendations, principal of which is that reform should go ahead in an evolutionarymanner, albeit with a determined shift in priorities. Emphasis needs to be placed upon measures that support healthpromotion, while concerted changes are needed at the financial, legal and organisational levels in order to ensure thatdecision-makers are held accountable and that the authorities are in a position to monitor them. Finally, moreemphasis needs to be placed on increasing home-based care, occupational- and physio-therapy services and onmaking greater use of nursing-homes as opposed to chronic-care hospital beds.
JEL classification: I11Keywords: Health; OECD; Hungary; Transition economies
* * *
Le présent document examine, dans une perspective internationale, le système de santé de la Hongrie. Bien que cesystème soit, à de nombreux égards, comparable à ceux des autres pays de l’OCDE, l’espérance de vie en Hongrie estla plus basse de la zone de l’OCDE et, lors des vingt dernières années, son taux d’amélioration a été nettementinférieur à celui des autres pays membres. Le système de santé hongrois est relativement gros consommateur deressources et se caractérise par des taux élevés d’hospitalisation, une offre excédentaire de spécialistes et desincitations perverses aussi bien pour les médecins que pour les administrateurs d’établissements hospitaliers. Lesrègles budgétaires auxquelles sont soumis les hôpitaux ne leur permettent pas de prévoir et d’amortir correctementdes investissements et limitent leur capacité à gérer leurs coûts salariaux, et en même temps, la surveillanceinsuffisante des procédures de facturation par l’administrateur public ont conduit à une inflation frauduleuse tant dunombre que de la « gravité » des traitements. Les réformes récentes ont principalement visé à contenir les coûts, maisles efforts entrepris pour améliorer la fourniture des services et l’état général de santé de la population ont été entravéspar des conflits entre les institutions concernées. Toutefois les pressions sur les coûts persisteront, même si uneamélioration de la faculté contributive de l’économie fait contre poids. En conséquence, l’écart entre le système desanté hongrois et les systèmes européens sur le double plan qualitatif et quantitatif devrait progressivement se réduire.Le document présente un certain nombre de recommandations concrètes d’action, la principale étant que la réformedevrait se poursuivre de manière progressive même si les priorités ont besoin d'être résolument modifiées. Il faudraitmettre l’accent sur les mesures visant à encourager une amélioration des comportements et de l’hygiène de vie, et desmodifications concertées doivent être simultanément opérées sur les plans financier, juridique et administratif pourque la responsabilité de ceux qui prennent les décisions soit engagée et l’autorité de tutelle (Ministère de la santé)disposent des instruments nécessaires pour contrôler correctement ses choix. Il convient en outre de mettre davantagel’accent sur le développement des soins à domicile et les services de réadaptation professionnelle et médicale ainsique sur une plus large utilisation des établissements médicalisés au lieu des hôpitaux pour la prise en charge delongue durée.
Classification JEL: I11Mots clés : Santé ; OCDE ; Hongrie ; économies de transition
Copyright © OECD 2000. All rights reserved.
Application for permission to reproduce or translate all, or part of, this material should be made to:Head of Publications Service, OECD, 2 rue André Pascal, 75775 Paris Cédex 16, France

ECO/WKP(2000)14
3
TABLE OF CONTENTS
Introduction .................................................................................................................................................... 5Overview of the system .................................................................................................................................. 5
Organisational structure............................................................................................................................. 5Healthcare delivery and resource allocation.............................................................................................. 7Healthcare expenditures ............................................................................................................................ 9Inequalities .............................................................................................................................................. 12
International comparison .............................................................................................................................. 15Policy priorities............................................................................................................................................. 27
Cost containment ..................................................................................................................................... 30Microeconomic inefficiencies ................................................................................................................. 33Policy and administrative problems ........................................................................................................ 33Service delivery ....................................................................................................................................... 34Inappropriate incentives and ineffective supervision .............................................................................. 36
Scope for further action ................................................................................................................................ 39Conclusions .................................................................................................................................................. 42
Notes............................................................................................................................................................. 45
Glossary of acronyms ................................................................................................................................... 50
Bibliography ................................................................................................................................................. 51
Boxes
1. The structure of healthcare delivery................................................................................................ 82. A chronology of reform measures in healthcare ........................................................................... 29
Tables
1. Roles of the institutional actors in the healthcare system ............................................................... 62. Revenues and expenditures of the Health Insurance Fund............................................................ 103. Healthcare expenditures in Hungary ............................................................................................. 124. Indicators of health and socio-economic status and of health-service levels by region................ 145. Male mortality from selected causes ............................................................................................. 186. Per capita healthcare expenditure at purchasing-power parities ................................................... 207. Health expenditures in Hungary compared to selected countries ................................................. 208. Pharmaceutical and health expenditures in selected countries...................................................... 219. Health-sector employment in the OECD....................................................................................... 2310. Trends in health-sector employment in Hungary .......................................................................... 2411. Hospital and bed densities............................................................................................................. 2512. Monthly average health-sector earnings........................................................................................ 26

ECO/WKP(2000)14
4
13. Hospital beds per capita ................................................................................................................ 2614. Indicators of acute hospital care.................................................................................................... 2715. Hi-tech medical equipment ........................................................................................................... 2816. Stock and age of conventional medical equipment ....................................................................... 2817. Retail pharmaceutical spending and subsidies .............................................................................. 3118. Hospitals’ size and revenues by type ............................................................................................ 3619. Inpatient and outpatient activities.................................................................................................. 38
Figures
1. Regional inequalities in resource use and capacities..................................................................... 132. Life expectancy ............................................................................................................................. 163. Health risk factors ......................................................................................................................... 174. Healthcare expenditure.................................................................................................................. 195. Health sector compensation in the OECD..................................................................................... 256. Projected healthcare demand and supply ...................................................................................... 32
ECO/WKP(2000)14
5
THE HEALTHCARE SYSTEM IN HUNGARY
Eva Orosz and Andrew Burns1
Introduction
1. Developments in the Hungarian healthcare system over the past decade were deeply affected bythe political, social and economic transformation of the country. Indeed, the social costs of the transition toa market economy were substantially larger than initially expected, resulting in a rapid rise in transferpayments. To help restore balance in public finances, a substantial programme of government spendingrestraint was initiated, which, in the healthcare sector, translated into efforts at expenditure control.Throughout the period, the policy debate has been intense and, despite a focus on cost-saving, the reformsactually undertaken have generally sought to promote a well-functioning healthcare system by improvingefficiency, quality and equity. However, not all reforms have met their long-term goals either because ofincomplete implementation or failure to undertake necessary complementary action. As a result, thehealthcare system remains in serious need of reform.
2. The purpose of this paper is to shed some light on these issues. It first provides an overview ofthe institutional structure of the Hungarian healthcare system and compares internationally both itsoutcomes and resource-use. It then discusses a number of problems with the system, referring particularlyto: containing costs, re-establishing a balance between healthcare sectors, correcting misaligned incentivesand improving the extent to which participants are held responsible for their actions. The final section ofthe chapter builds on this analysis to offer some suggestions for reform.
Overview of the system
Organisational structure
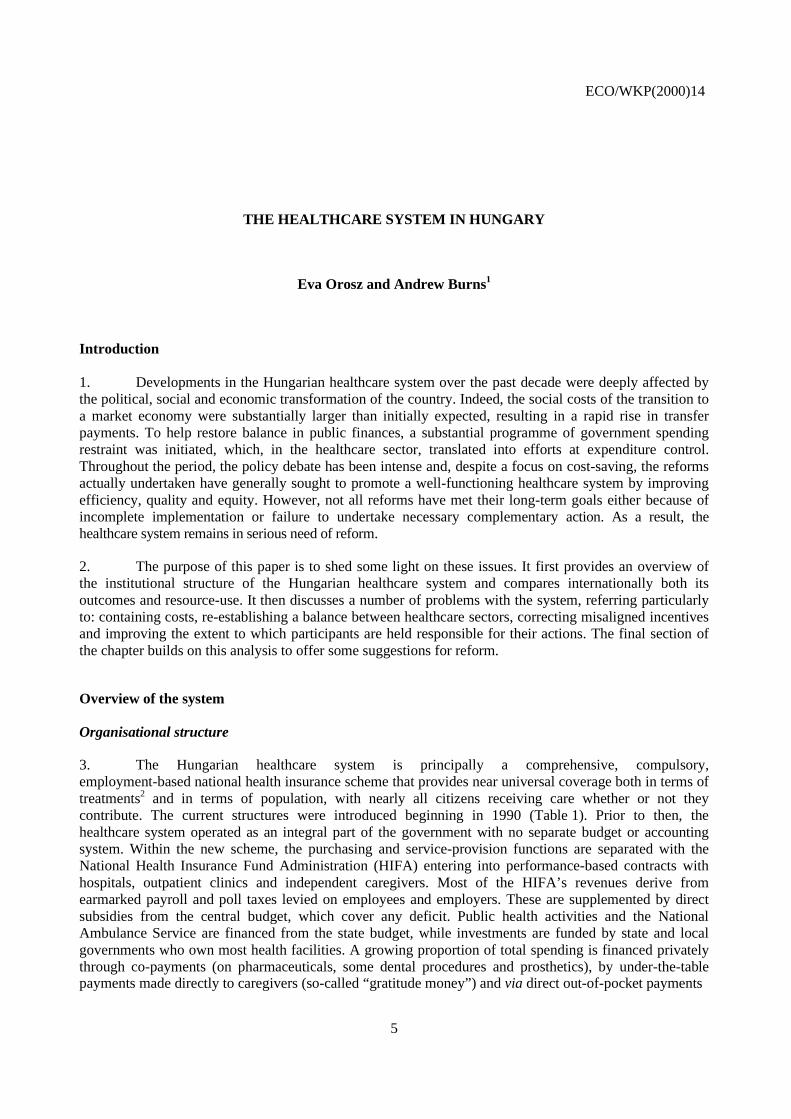
3. The Hungarian healthcare system is principally a comprehensive, compulsory,employment-based national health insurance scheme that provides near universal coverage both in terms oftreatments2 and in terms of population, with nearly all citizens receiving care whether or not theycontribute. The current structures were introduced beginning in 1990 (Table 1). Prior to then, thehealthcare system operated as an integral part of the government with no separate budget or accountingsystem. Within the new scheme, the purchasing and service-provision functions are separated with theNational Health Insurance Fund Administration (HIFA) entering into performance-based contracts withhospitals, outpatient clinics and independent caregivers. Most of the HIFA’s revenues derive fromearmarked payroll and poll taxes levied on employees and employers. These are supplemented by directsubsidies from the central budget, which cover any deficit. Public health activities and the NationalAmbulance Service are financed from the state budget, while investments are funded by state and localgovernments who own most health facilities. A growing proportion of total spending is financed privatelythrough co-payments (on pharmaceuticals, some dental procedures and prosthetics), by under-the-tablepayments made directly to caregivers (so-called “gratitude money”) and via direct out-of-pocket payments

ECO/WKP(2000)14
6
Table 1. Roles of the institutional actors in the healthcare system
Policy making Administration/Supervision Financial
Office of the Prime Minister (since July 1990)− Develops health policy − Supervises the HIFA
− Co-ordinates the activity of theMinistry of Health (among others)
Ministry of Health (Welfare prior to July 1998)− Develops health promotion and
health-care concepts, bills anddecrees
− Co-ordinates health policy withother sectoral policies (education,environmental protections etc.)
− Sets, with Ministry of Finance andthe HIFA, health-insurance budget
− implements legislation− Supervises public health via
National Public Health and MedicalOfficer’s Services
− Supervises medical education,training and research
− Interest reconciliation
− Determines fees paid to care givers− Finances national institutions’
investments (as owner)− Finances the NPHMOS and (since
1998) the National AmbulanceService and National Blood-SupplyService among others
− Supports other public health andcurative health services
Ministry of Finance− Develops concepts for healthcare
financing− Determines overall funding level of
the health-care system
− Sets, with the Ministry of Welfareand the HIFA, health-care budget
− Covers the deficit of the HIF
− Subsidises investmentexpenditures
− Monitors spending and revenuesthrough the Treasury function
Health Insurance Self Government (until July 1998)− Consulted during policy making− Right of Veto over health-related
government decrees until 1996
− Operated the Health InsuranceFund Administration
− Directed the management of HIFassets
Health Insurance Fund Administration− Prepared proposals for the HISG
(until July 1998)− Prepares proposals for the
government
− Responsible for assuring theprovision of health services
− Negotiates and executes contractswith health-care providers
− Manages insurance registry− Overall financial management and
supervision of expenditures
− Collects social securitycontributions from employers andemployees for both pension andhealth insurance
− Contracts and pays caregiversaccording to scales set by Ministryof Welfare and governmentdecrees
Local Government− Makes investment decisions− Responsible for healthcare
provision to their inhabitants
− Ultimately responsible for day today operation of health-careinstitutions
− Principal owner and operator ofhospitals and outpatient clinics
− Contracts with self-employed GPsand supplies and maintainsdoctor’s offices and equipment
− Receives grants from HIFA tocover operating costs
− Receives grants from centralgovernment to cover investments
Professional organisations− Input into policy making process − Supervise ethical and professional
conduct− Represent professional interests
− Advise expert bodies concerningfinancing including the revision oftariffs
− Collect fees to cover own expenses
Source: OECD.
to private providers operating outside of the national health insurance system. The law also provides forvoluntary mutual and private insurance funds to ensure supplementary coverage to the basic healthcaresystem. However, there is currently little medical activity that is not covered by the public system and,therefore, little for the voluntary funds to supplement.

ECO/WKP(2000)14
7
4. Overall health policy is determined by the government with the Ministry of Health (formerly theMinistry of Welfare) in conjunction with the HIFA proposing and implementing reforms. The financialparameters of the system, including the health insurance premiums paid by employers and employees andthe budget of the Health Insurance Fund (HIF), are decided and promulgated each year by parliament in its“Act on the Budget of the Social Insurance Funds”. The Ministry of Finance formulates the initial draft ofthe budget in consultation with the HIFA, which until mid-1998 was a subordinate body of the nowabolished Health Insurance Self-Government3 (HISG). The Ministry of Health operates the National PublicHealth and Medical Officer Service (NPHMOS), a centralised public-health service created in 1991. It is atraditional epidemiology and hygiene service that is also responsible for the licensing and professionalsupervision of healthcare institutions (such as hospitals and general practitioners’ practices); the operationof a number of local-level health promotion and prevention programmes; and the facilitation of contractingbetween the HIFA and local governments. Day-to-day administration of the healthcare system is splitbetween the local governments, who are responsible for service provision, and the government’spurchasing agent (the HIFA) and its network of 19 County Health Insurance Fund Offices.
Healthcare delivery and resource allocation
5. Since 1993, the HIFA has acted as a central purchasing agent for healthcare services fromhospitals, outpatient clinics and general practitioners. Primary care is paid for by a flat per-patient fee(capitation) that is adjusted for the qualification of the physician and the demographic characteristics of thepatient. Outpatient treatment is paid through a German-style point system and hospital-care is reimbursedaccording to Homogenous Diseases Groups (HDGs) inspired by the American Diagnosis Related Groups.The capitation and points system are capped while until 1998 so was the HDG system. The initial relativeweight of each sub-budget in total healthcare expenditure was determined by the share of spending in 1992and has changed little since. Although caregivers within the sub-systems can compete with one another fortheir share of the sub-budget, funds cannot be redistributed between them without a parliamentaryamendment to the Health Insurance Budget Act and the total payments under the HDG and points systemscannot exceed the budgeted amount. The final major healthcare payment provided by the HIF isout-of-hospital pharmaceutical subsidies, which are paid at varying rates, depending on the drugprescribed. Several services (mother and child healthcare nurses) are given a global budget by the HIFA,while the Public Health Service, additional drug subsidies for the poor, and (beginning in 1998) theNational Ambulance Services and the National Blood Transfusion service are financed directly from thecentral budget (see Box 1).
6. Local governments are legally responsible for providing primary healthcare, including familydoctor services. Until early 2000, they ran the services directly or provided surgeries to private GPs,including office space, basic equipment and building maintenance. In many cases they also paid forutilities. Ninety-three per cent of the GPs and paediatricians worked on contract with a local governmentand the HIFA, while the remainder contract only with the HIFA. Under new regulations these practiceshave been privatised, with ownership of the business having been ceded to the practitioner at that time. Asimilar reform is being contemplated to privatise the equipment and office spare occupied by these doctors.Capitation payments to family physicians represent 75 per cent of the revenues received by GPs from theHIFA, the rest coming in the form of a separate fixed maintenance allowance. In order to dissuade doctorsfrom having excessively large practices, and therefore providing poor service, there is a threshold oncapitation payments beyond which an adjustment factor is applied.4

ECO/WKP(2000)14
8
Box 1. The structure of healthcare delivery
PRIMARY HEALTHCARE1
Basic health services Public health services(financed by health insurance) (financed from state budget)
Family physician service Health educationPediatrician family physician practices ImmunisationNight duty service Food healthNetwork of mother and child health nurses Environmental healthDental healthcare Occupational healthSchool healthcareHome nursing (mainly private contracts with HIF)HospicesPhysiotherapyOccupational health services (since 1996 notcovered by compulsory insurance)
SECONDARY AND TERTIARY CARE (financed by health insurance)
Outpatient specialist services Inpatient careOutpatient clinics of the hospitals National institutesIndependent outpatient clinics Medical universitiesDispensaries (pulmonary, psychiatric, dermato- County hospitals veneral, oncology, alcohol and drugs) Local hospitals“Mobile” gynaecology and pediatrics specialist care (for rural settlements)Diagnostic centres (mainly private contracts with HIF)
National Ambulance Service (since 1998 financed from the state budget)National Blood Transfusion Service (since 1998 financed from the state budget)
COMMUNITY/SOCIAL CARE (financed by local governments)
Social welfare homes for the elderlySocial welfare homes for the mentally illDaycare centres for the elderly and the disabledHome social care services____________________1. The broader meaning of Primary Healthcare as defined by the WHO. (Terminology for the WHO
Conference on European Healthcare Reforms, WHO EURO, 1996).
7. The national network of hospitals has retained many of the hierarchical elements of the previoussystem.5 Local (town) hospitals provide a basic range of services and more specialised work is conductedat county institutions and at the research and teaching hospitals (run by the Ministry of Health and Ministryof Education respectively). The majority of specialists and healthcare employees are salaried publicservants and nearly all hospitals are owned and operated by local levels of government (county ormunicipality), while national institutes and medical universities are run by the central government. A

ECO/WKP(2000)14
9
number of private institutions exist within the national system, although their activities are limited mainlyto the provision of various specialised medical services such as Computerised Tomography (CT) scans,Magnetic Resonance Imaging (MRI) and kidney dialysis. In addition, many salaried medical professionalsalso own private outpatient clinics that operate outside of the national health insurance system. Generalpractitioners (family doctors) are the only significant group of non-salaried healthcare workers.6 Mostpharmacies are privately-owned businesses while the market itself is tightly regulated and pharmaceuticalsthemselves heavily subsidised. Within the public healthcare system, gratitude money constitutes animportant part of the remuneration of many medical professionals and introduces a significant (albeitillegal) co-payment component to publicly supplied healthcare.
8. The fees received from the HIFA for services performed in hospitals and outpatient clinics areused to pay the salaries of specialists, nurses and other healthcare workers, costs of maintenance includingpublic utilities as well as other variable costs including pharmaceuticals administered in the hospital. Thefees are not meant to cover capital costs including the depreciation of and investment in buildings andmedical equipment. These costs, which are the responsibility of the institution’s owners, are subsidisedfrom the central budget and the distribution of these funds is determined jointly by the Ministries ofFinance, Health and Internal Affairs.7
9. Outpatient care was initially remunerated according to a mixed system, consisting of twocomponents: i) a basic budget (equal to about 60 per cent of their revenues prior to 1996 and 40 per centafterwards); and ii) a relative-tariff fee-for-service system copied from the German “point-system”. As of1997, the first component has been replaced by a so-called “fixed-payment” (amounted to about 15 percent of the revenues of out-patient institutions). The system sets “points” for each type of service, fixingtheir relative values. The monthly forint value of a point is then determined by dividing the nationaloutpatient care budget by the total number of points earned during the month. Thus, as the aggregatenumber of points increases (or falls), the forint value of a point falls (rises), although for the economy as awhole, aggregate payments for outpatient care remain constant.
10. Acute care cases are classified according to HDGs and payment is determined by the weightassigned to that diagnosis.8 The Hungarian system differs from the American because, in Hungary, HDGpayments include doctors’ remuneration and, until fully phased out in 1998, raw HDG points were adjustedby a hospital-specific factor, with the result that hospitals with higher unit costs in 1992 (the base year)received as much as four times more than efficient ones.9 In addition, the national cap meant that the forintvalue of an adjusted HDG point fell as the total number of points billed rose. Since then, the HDG systemhas been modified several times. As of April 1998, the money value of a HDG unit was fully equalisedacross hospitals and they were given a fixed forint value, opening up the possibility that the cap for theseprocedures could be exceeded. Nevertheless, financing is not strictly activity based: hospitals continue toreceive payments based on inputs consumed rather than services rendered.10
11. At the micro-level physicians are the key decision-makers. Their behaviour is influenced not onlyby their economic interests but also by medical traditions, values and ethics; expectations of thepopulation; and wider social circumstances. Traditionally doctors are expected to do everything medicallypossible without regard to its effectiveness or costs. So far this has changed little at the level of theindividual doctor and is abetted by gratitude money and the influence exerted by pharmaceutical andmedical equipment companies on individual doctors.
Healthcare expenditures
12. The budget of the HIFA has been in deficit almost since its inception. Despite cost-containmentmeasures (see below) that reduced its expenditures (including cash benefits) from 8.8 to 6.2 per cent of

ECO/WKP(2000)14
10
GDP (between 1992 and 1998) and their real value by 22 per cent, falling revenues left the deficit virtuallyunchanged at 0.7 per cent of GDP (Table 2).11 The principal causes of the drop in revenues were: fallingemployment, the emergence of mass unemployment, widespread tax evasion by firms and workers andnon-payment of contributions12 (a particular problem among a number of large state-run entities such asthe railroad and even the police). While it is difficult to estimate the exact revenue shortfall fromunderpayment of contributions, the annual per capita total contribution of the self-employed is one-fifththat of salaried employees, suggesting widespread avoidance. The decrease of the contribution rate13 andthe 1997 withdrawal of pension insurance fund contributions made on behalf of pensioners and of central
Table 2. Revenues and expenditures of the Health Insurance Fund
1992 1993 1994 1995 1996 19971998
budget 19991
(Millions of forints)
Total contributions 221017 245207 287907 321983 369734 471812 540998 578010Employer health insurance contributions 173253 190778 233109 269168 308224 323812 370621 328268Contributions on unemployment benefits 9995 6608 6018 5836 4642 4664 3423Employee contributions 36098 44434 48190 44960 50551 62474 62662 74279Accident contributions 1837 1593 1251 960 514Employer contribution to sick pay 3530 7658 9499 10500Health tax 71974 92592 161026
Employer health tax 71587Health tax paid by individuals 386
Late payment fees 7787 10467 11196 9413 8141 8466 7722 9100Central budget contributions 2600 5800 7000 10400 12000
Revenues from collecting arrears 13322 15426 16867 15494 21500Other related to ins. Activity 1279 2113 4557 3318 4430 3655 2590 4940Central budget for state fin. service 2500 4462 2500 2500 2500 2500 3590Repayment by hospital 1501 1499Income from assets transf. by the state 0 0 0 4 8200 1925 19600Transfer between funds 10103 11298 54664 56726 66055Central budget to cover wage increase 1660 2371 5400 0Central Budget subsidy 26700Other 2 500 500 4 500 4400 2600 13000 6800 5970
TOTAL REVENUES 235775 280308 79716 422915 465473 499487 561462 649252
In-kind provisions 156203 186873 241525 275749 326102 389964 458449 503392Curative services 112123 131571 170464 190174 224832 265779 299092 337114Pharmaceutical expenditures 39392 49535 61572 69965 85495 100876 135474 141000Medical supplies subsidy 3570 4698 7269 10808 12118 16782 19618 20581Travel reimbursement 1118 1069 1414 1767 2133 2561 2225 2506Other (spa, mothers’ milk) 3035 1524 1708 2041 2191
Cash benefits 72895 88581 107970 118243 121959 141809 149657 169848Disability and accident compensation 36455 45034 57771 68147 79265 97982 99927 115684Maternity and child allowance 6419 7203 8261 8904 8276 6013 5569Sickpay 28912 35255 40833 39805 32977 36138 41225 46500Grants related to illness 537 441 428 679 699 865 639 1100Compensation payments 572 648 677 708 743 810 912 995Contribution to joint expenditure 24995 28834 1007 1116 2800 1262
Operational expenditures 10439 12553 15505 18157 21332 16847
Transfers between the funds 32931 37116 37198
TOTAL EXPENDITURES 257510 306033 397835 445141 508959 555585 632194 691905BALANCE -21735 -25725 18119 22226 -43486 -56098 -70732 -42653
(per cent of GDP)
Total revenues 8 7.9 8.7 7.5 6.8 5.8 5.5 5.5Total expenditures 8.8 8.6 9.1 7.9 7.4 6.5 6.2 5.9Balance -0.7 -0.7 -0.4 -0.4 -0.6 -0.7 -0.7 -0.4
1. Preliminary data.Source: HIFA.

ECO/WKP(2000)14
11
budget contributions made on behalf of social assistance recipients placed further pressure on revenues.14
The preliminary 1999 data show that the expenditures of the HIFA decreased further to the 5.9 per cent ofthe GDP and the share of the deficit also decreased to 0.4 per cent of the GDP.
13. Long-term spending trends and the actual level of expenditure in Hungary are difficult toestablish because of institutional changes and the lack of reliable data concerning gratitude payments andprivate service provision.15 The data concerning private expenditures on health services in Table 3 areprovided by the Central Statistical Office and include estimates of gratitude payments. They indicate thatin 1998 public healthcare expenditures amounted to 5.6 per cent of the GDP, considerably less than in1991. The increase in private expenditures (from 0.8 to 1.2 per cent of the GDP) did not fully compensatefor the decrease in public expenditures and overall spending declined somewhat as compared with 1991 to6.8 per cent of GDP. The majority of spending (68.1 per cent) was financed by the compulsory healthinsurance premiums paid by employees and employers, while direct contributions from the central budgetcovered about 14.3 per cent of all spending, with the remaining 17.6 per cent coming from private sources(individual co-payments on pharmaceuticals, payment for private services and gratitude money).16 Since1991, the share in total spending represented by compulsory insurance premiums has been falling (down7 per cent) as has that of the central budget (down 11 per cent), while the share financed by individualsincreased by 62 per cent.
14. While total real expenditures on healthcare were virtually unchanged between 1991 and 1997,real public expenditures decreased by 6 per cent. They grew by some 12 per cent between 1991 and 1994before falling by 14 per cent in 1995 (with the application of the Bokros package) and then a further 5 percent in the following two years. In 1998 real public expenditures slightly increased but still remainedbelow the 1991 level. Within the total health-insurance budget, the real value of funds allocated forhealthcare services decreased by 14 per cent between 1994 and 1998.17 However, due to the considerableincrease in subsidies on pharmaceuticals and medical appliances, the spending by Health Insurance Fundalmost reached the 1991 level. Pharmaceutical (and medical appliances) subsidies may have contributed toa crowding-out phenomenon as their share in health insurance expenditure rose from 22 to 33 per cent(between 1990 and 1998), remaining approximately constant at an internationally high 1.6 per cent ofGDP.18 Rising prices (principally driven by the entry of western-made drugs) and falling rates of subsidyfailed to reduce the volume of drug consumption,19 which, when measured by days of treatment, increased12 per cent between 1993 and 1997, approximately “normal” European levels.20
15. The main features of the Hungarian drug reimbursement system came into force inFebruary 1995. Depending upon the drug, medication is reimbursed at a zero, 50, 70 or 90 per cent rate.While drug companies are free to set their own wholesale prices, the price at which a specific chemical isreimbursed is fixed by the Ministry of Health following negotiations between the experts of the HIFA, theministries of Health and Finance and manufacturers.21 Individuals who suffer severe chronic disease areeligible for a 90 or 100 per cent subsidy, while certain classes of individuals on social assistance can get ahealth-card22 that entitles them to free drugs, medical appliances, dental care and physiotherapy. Forhealth-card holders, the health-insurance subsidy is paid by the NHIF, while the co-payment portion(normally paid by the patient) is financed by the central government.
16. Since 1990, government-owned wholesale and most retail pharmacies have been privatised. Thenumber of retail pharmacies increased by almost 50 per cent and in 1997 there were 74 wholesalers againstonly one in 1990. Nevertheless, the market is not very competitive. Drug prices in retail pharmacies areregulated and uniform, with pharmacies having a monopoly on the provision of all drugs for humantreatment, whether or not a prescription is required. Ownership of pharmacies is restricted to limitedpartnerships, where all active partners are pharmacists, at least one of whom must hold a “personal right tooperate a pharmacy”, and where the active partners hold at least a 25 per cent share in the enterprise. Strict

ECO/WKP(2000)14
12
rules also govern the location of pharmacies.23 Despite all of these restrictions, some chains are beginningto develop, but small independent pharmacies remain the rule.
Table 3. Healthcare expenditures in Hungary
1991 1992 1993 1994 1995 1996 1997 1998
(per cent of GDP)
Public ExpendituresRecurrent expenditures 5.9 6.2 6.2 6.6 5.8 5.5 5.2 5.2Investment 0.6 0.6 0.6 0.6 0.5 0.3 0.4 0.4
Total Public 6.5 6.8 6.8 7.3 6.3 5.9 5.6 5.6of which:Health Insurance Fund 5.3 5.4 5.4 5.6 5.0 4.8 4.7 4.6
Health care services 3.9 3.8 3.7 3.9 3.4 3.3 3.2 3.0Subsidies on pharmaceuticalsand medical appliances 1.4 1.5 1.5 1.6 1.5 1.4 1.4 1.5o/w pharmaceutical subsidies 1.3 1.3 1.4 1.4 1.3 1.2 1.2 1.3
Private ExpendituresCo-payments on drugs 0.3 0.4 0.4 0.5 0.5 0.5 0.5 0.5Health services1 0.5 0.5 0.6 0.6 0.7 0.8 0.8 0.7
Total Private 0.8 0.9 1.0 1.1 1.2 1.3 1.3 1.2
Total Expenditures 7.3 7.8 7.8 8.3 7.5 7.2 6.9 6.8
(index 1991 = 100)
Public expendituresRecurrent expenditures 100.0 102.9 102.7 112.8 100.1 7.0 95.6 100.5Investment 100.0 101.2 93.6 106.9 80.7 57.0 76.1 75.1
Total public 100.0 102.7 101.8 112.2 98.3 93.3 93.8 98.1of which:Health Insurance Fund 100.0 98.8 97.8 106.4 96.1 93.8 94.8 99.0
Health care services 100.0 96.1 92.9 100.7 89.7 87.1 87.6 87.1Subsidies on pharmaceuticalsand medical appliances 100.0 103.7 107.9 115.9 107.2 105.9 107.7 126.3o/w pharmaceutical subsidies 100.0 103.2 107.0 111.4 101.0 100.7 100.3 119.8
Private expendituresCo-payments on drugs 100.0 124.0 132.6 150.6 176.2 179.4 186.2 195.5Health services1 100.0 109.4 112.4 122.6 139.7 167.9 171.3 156.8
Total Private 100.0 115.2 120.3 133.6 154.1 172.4 177.1 172.0
Total Expenditures 100.0 104.1 103.8 114.6 104.4 101.9 102.8 106.1
1. Estimations by the CSO, including co-payments on medical appliances and gratitude money.Source: HIFA, MoH and CSO.
Inequalities
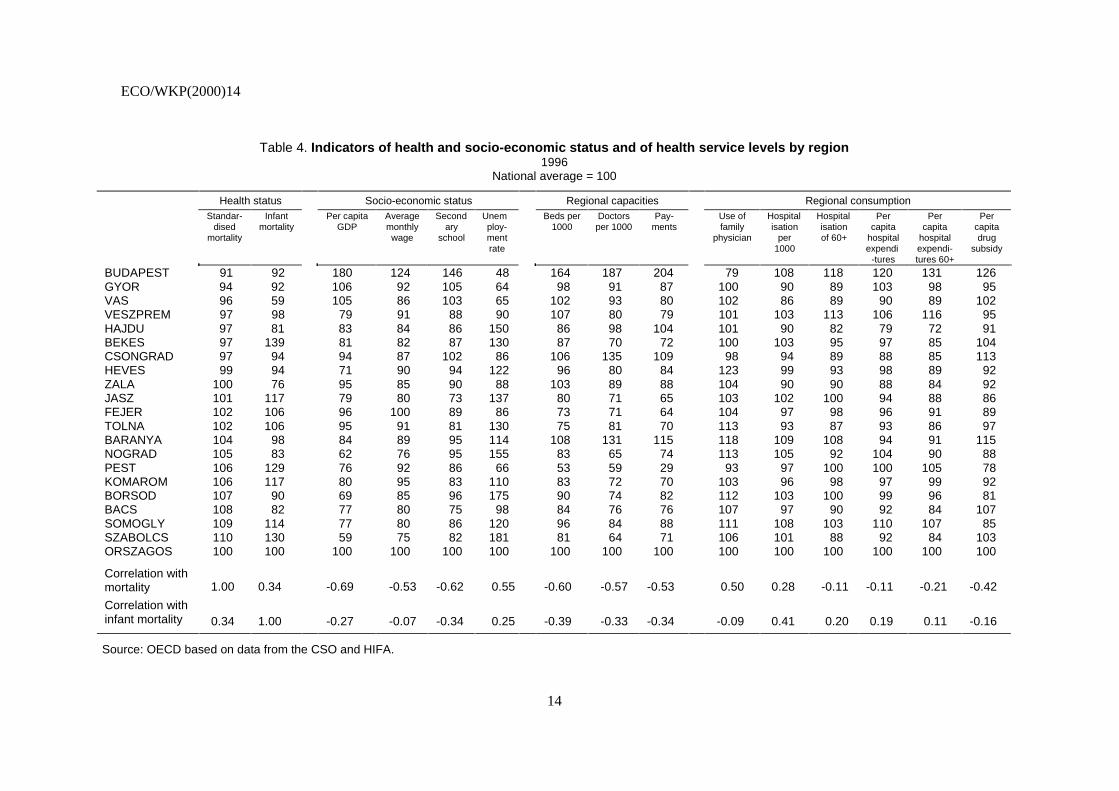
17. The distribution of equipment, beds and medical personnel across regions is relatively uneven,although the consumption of medical services is more evenly distributed. Table 4 compares the distributionof health- resources and health-service utilisation across the nineteen Hungarian counties. There is

ECO/WKP(2000)14
13
tendency for counties with the greatest need (worst health status) to have the lowest level of resources(health expenditures and supply of physicians), while Budapest and counties with the best health statusenjoy the highest supply of healthcare resources. Both the health status and supply of resources areconnected with socio-economic development and the allocation of health resources appear to exacerbaterather than mitigate these socio-economic inequalities. The concentration of resources in Budapest isstriking, the supply of physicians and hospital beds being respectively 87 and 64 per cent higher than thenational average. The concentration of financial resources is even more pronounced: per capitaexpenditures paid by the HIF to health services providers located in Budapest are twice the nationalaverage. Nevertheless, the resources that are concentrated in major centres24 such as Budapest are used byindividuals from other counties. As a result, the pattern of resource usage is more equally distributed — although inequalities remain large. The population of Budapest spends 20 per cent more than the nationalaverage on per-capita hospital-based care (31 per cent higher in the case of the elderly) and their per-capitadrug subsidy is also the most important.
18. Inequalities of resource allocation are summarised in Figure 1. Each column compares (as a percent deviation from the national average) the payments received by providers and the services consumedby patients25 from a given region,26 with the quantity of each that would be observed if all individuals indifferent demographic and socio-economic groups consumed the national average for their group.27 Itshows that the residents of the (central) region of Budapest-Pest county consumed 26 per cent morehealthcare services than the region would receive on the basis of their characteristics and that thehealthcare institutions in the region received 34 per cent more resources that they would receive than thenational average in similar institutions. In contrast, the inhabitants of Szeged, Debrecen and Miskolcregions consumed between 10 and 15 per cent fewer healthcare resources than in case of a need-basedallocation, while providers working in these regions received 15 per cent less resources. Thus while,consumption of healthcare resources located in Budapest by residents of other regions served to reduceinequalities, individuals living in the capital region nevertheless consumed much more than similar peopleliving in less well endowed regions.
Figure 1. REGIONAL INEQUALITIES IN RESOURCE USE AND CAPACITIESPercentage difference from national average
Source: KALO (1997).h98wp\ DISTRI - 18-Apr-00 (11:11)
-25
-20
-15
-10
-5
0
5
10
15
20
25
30
35
-25
-20
-15
-10
-5
0
5
10
15
20
25
30
35
Gyor Szombathely Pécs Szeged Debrecen Miskolc Budapest
CapacitiesResource use
ECO/WKP(2000)14
14
Table 4. Indicators of health and socio-economic status and of health service levels by region1996
National average = 100
Health status Socio-economic status Regional capacities Regional consumptionStandar-
disedmortality
Infantmortality
Per capitaGDP
Averagemonthlywage
Secondary
school
Unemploy-mentrate
Beds per1000
Doctorsper 1000
Pay-ments
Use offamily
physician
Hospitalisation
per1000
Hospitalisationof 60+
Percapita
hospitalexpendi
-tures
Percapita
hospitalexpendi-tures 60+
Percapitadrug
subsidy
BUDAPEST 91 92 180 124 146 48 164 187 204 79 108 118 120 131 126GYOR 94 92 106 92 105 64 98 91 87 100 90 89 103 98 95VAS 96 59 105 86 103 65 102 93 80 102 86 89 90 89 102VESZPREM 97 98 79 91 88 90 107 80 79 101 103 113 106 116 95HAJDU 97 81 83 84 86 150 86 98 104 101 90 82 79 72 91BEKES 97 139 81 82 87 130 87 70 72 100 103 95 97 85 104CSONGRAD 97 94 94 87 102 86 106 135 109 98 94 89 88 85 113HEVES 99 94 71 90 94 122 96 80 84 123 99 93 98 89 92ZALA 100 76 95 85 90 88 103 89 88 104 90 90 88 84 92JASZ 101 117 79 80 73 137 80 71 65 103 102 100 94 88 86FEJER 102 106 96 100 89 86 73 71 64 104 97 98 96 91 89TOLNA 102 106 95 91 81 130 75 81 70 113 93 87 93 86 97BARANYA 104 98 84 89 95 114 108 131 115 118 109 108 94 91 115NOGRAD 105 83 62 76 95 155 83 65 74 113 105 92 104 90 88PEST 106 129 76 92 86 66 53 59 29 93 97 100 100 105 78KOMAROM 106 117 80 95 83 110 83 72 70 103 96 98 97 99 92BORSOD 107 90 69 85 96 175 90 74 82 112 103 100 99 96 81BACS 108 82 77 80 75 98 84 76 76 107 97 90 92 84 107SOMOGLY 109 114 77 80 86 120 96 84 88 111 108 103 110 107 85SZABOLCS 110 130 59 75 82 181 81 64 71 106 101 88 92 84 103ORSZAGOS 100 100 100 100 100 100 100 100 100 100 100 100 100 100 100
Correlation withmortality 1.00 0.34 -0.69 -0.53 -0.62 0.55 -0.60 -0.57 -0.53 0.50 0.28 -0.11 -0.11 -0.21 -0.42
Correlation withinfant mortality 0.34 1.00 -0.27 -0.07 -0.34 0.25 -0.39 -0.33 -0.34 -0.09 0.41 0.20 0.19 0.11 -0.16
Source: OECD based on data from the CSO and HIFA.

ECO/WKP(2000)14
15
International comparison
19. Between 1930 and 1960 life expectancy at birth rose by more than 20 years in many OECDcountries, as it did in Hungary. Since then, progress has been less rapid, with life expectancy increasing by8.7 years between 1960 and 1990 in the OECD area but only 1.3 years in Hungary; and male lifeexpectancy has actually been falling28 (Figure 2, Panel A). As a result, Hungary now has the lowest lifeexpectancy in the area. Outcomes are poor for all age-sex groupings but especially for males between 40and 60 years of age, whose total life expectancy of 68.8 years (Figure 2, Panel C) is seven years less thanthe OECD average of 75.9 years (Figure 2, Panel C) and is lower than it was in 1930. Female lifeexpectancy is also the lowest among OECD countries, although it has been rising, and is much higher thanfor males, the gap between them having more than doubled from 4.4 to 9.1 years between 1960 and 1998.Although it is too soon to know if it represents a temporary improvement or a new positive long-termtrend, since 1995 the life expectancy at birth of males has started to increase.29
20. As with many socio-economic phenomena, better health outcomes are associated with goodeconomic performance — both at the societal level and at the individual level. Thus, in Hungary, a 30 yearold male with 15 or more years of education can expect to live 11 years longer than one with less than8 years of education (Hablicsek, 1995) and in 1995 residents of Budapest, where per capita income is80 per cent higher than the national average, could expect to live 4.7 years longer than individuals fromSzabolcs-Szatmár-Bereg in Eastern Hungary. Although low incomes certainly have contributed to thehigher mortality rate, the recent transition process itself does not appear to have been an important cause.30
The decline in male life expectancy began in the mid-1960s in Hungary, while across transition countriesthere seems to be little correlation between the severity of national adjustments and changes in lifeexpectancy.31
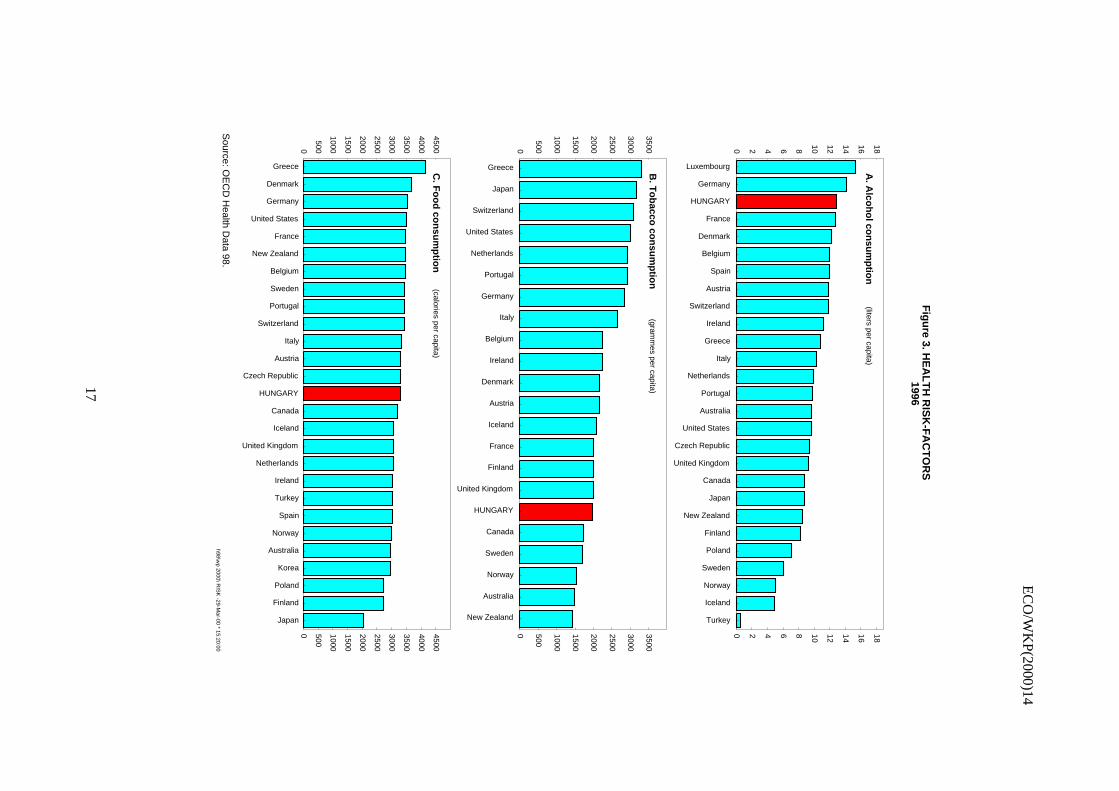
21. Over-work, poor diet, alcohol and tobacco addiction, unfulfilling work, falls in relative incomeand growing income inequalities, as well as feelings of relative disadvantage compared with westernEurope are considered to be the principal factors contributing to high prime-age male mortality both nowand in the 1970s and 1980s. Alcoholism has been cited as an important source of Hungarian mortality32
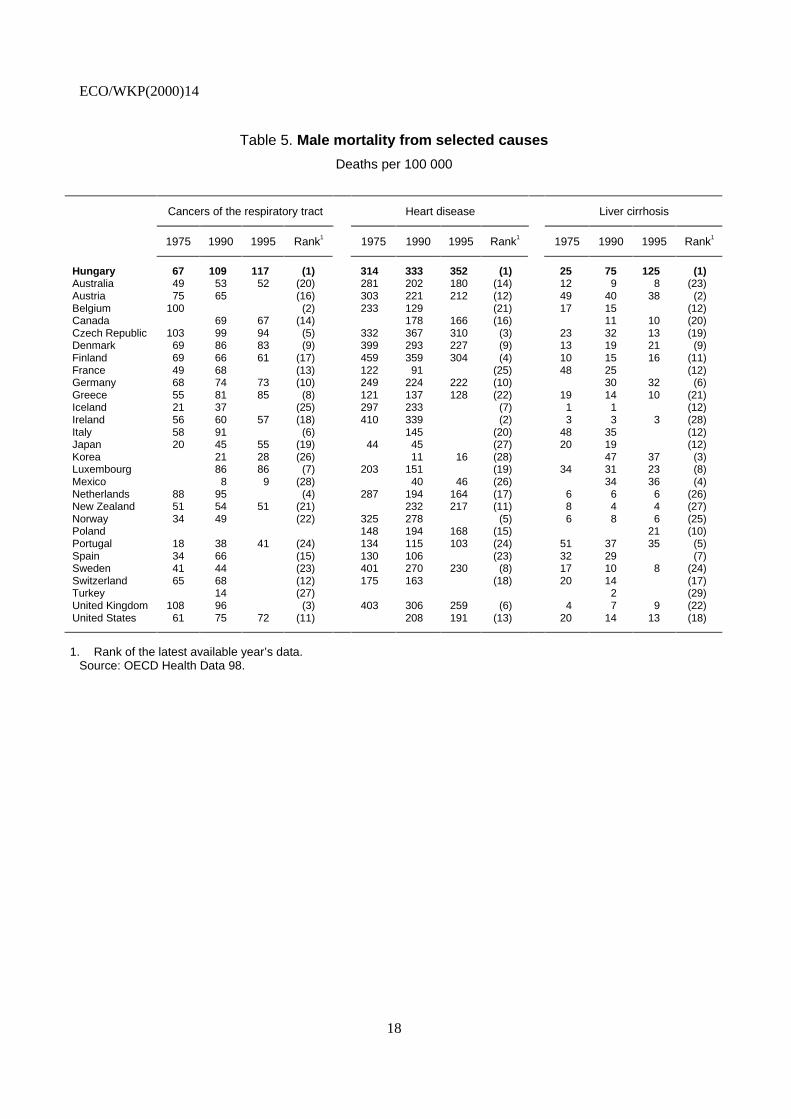
(Figure 3, Panel A) and Hungary has the third highest consumption rates in the OECD. The incidence ofsmoking is also high; 44 per cent of men and 27 per cent of women smoke (the fifth and eighth highestrates in the OECD). Spending on alcohol and tobacco products represent about twenty per cent of totalfood expenditures with the poorest 10 per cent of the population spending as much as 7.3 per cent of theirincome on these products. Although total caloric intake per capita is around the OECD average, thetraditional Hungarian diet relies excessively on foods with a high fat and sugar content, both of whichconstitute serious health hazards33 (Figure 3, Panel C). Deaths per capita from associated diseases exceedOECD averages by a wide margin, with Hungarians having the highest mortality rates in the area forcancers of the respiratory tract, heart diseases and cirrhosis of the liver (Table 5).
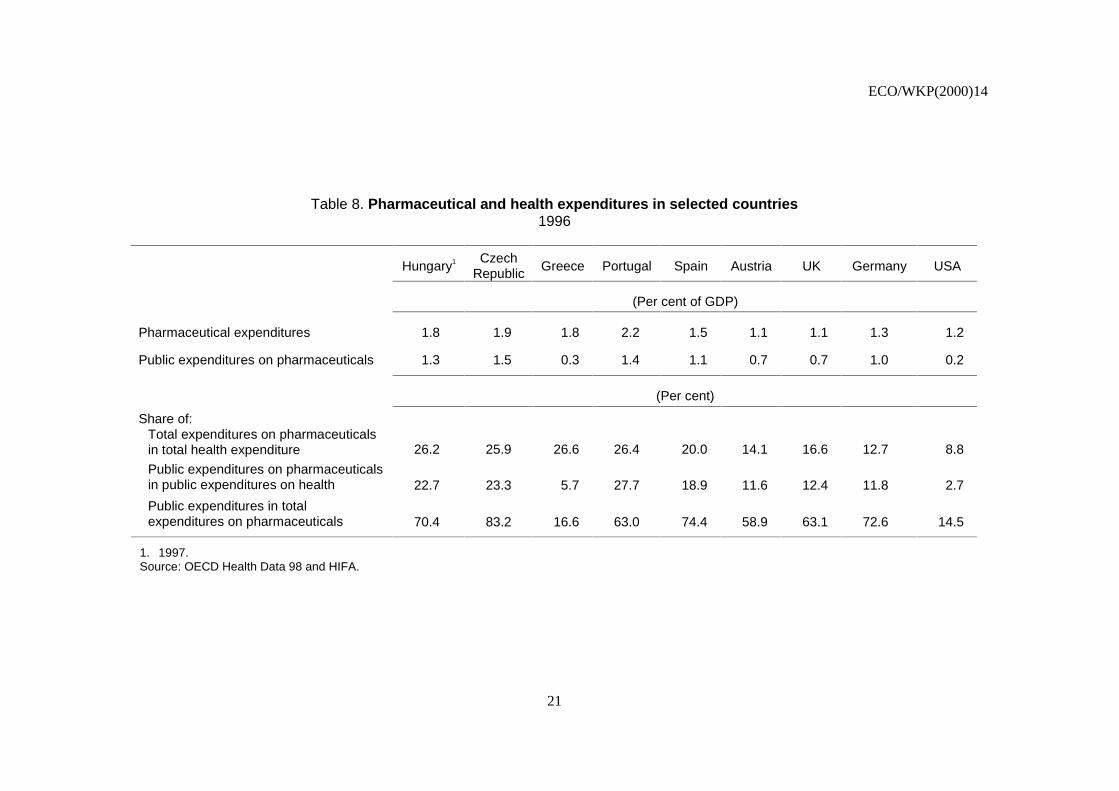
22. Hungary’s measured expenditures on healthcare are, as a share of GDP, among the lowest in theOECD (Figure 4, Panel A). In absolute terms, its spending has been declining34 ($602 at PPP in 1997), isabout half the level of Spain and Portugal (Table 6) and only 38 per cent of the OECD average. However,relative to countries with similar income levels, it is somewhat above average (Figure 4, Panel B). In termsof per capita public expenditures, relative position of Hungary has worsened both compared to the OECDaverage and to the less developed OECD countries (Table 7). In this context, the increase inpharmaceutical expenditures has been considered a major health policy problem. However, data show thatthe observed spending pattern is not that different from that observed in other lower income OECDcountries and is converging to this norm (Table 8).

ECO/WKP(2000)14
16
Figure 2. LIFE EXPECTANCY
Source: OECD Health Data 98.h98\wp 2000\ LIFE -29-Mar-00 * 15:13:59
45
50
55
60
65
70
75
80
85
45
50
55
60
65
70
75
80
85P
olan
d
Kor
ea
Mex
ico
Por
tuga
l
Uni
ted
Sta
tes
Fin
land
Ger
man
y
Spa
in
Aus
tria
Can
ada
Hu
ng
ary
A. Life expectancy at birthyear
19301950
19601970
19801990
Most recent
1960 1970 1980 1990 200060
65
70
75
80
85 Males
B. Expected age at death (Hungary)
At age 60At age 40At birth
1960 1970 1980 1990 200060
65
70
75
80
85 Females
65
67
69
71
73
75
77
79
65
67
69
71
73
75
77
79
HU
NG
AR
Y
Tur
key
Cze
ch R
epub
lic
Kor
ea
Den
mar
k
Irel
and
Pol
and
Por
tuga
l
Luxe
mbo
urg
Fin
land
Ger
man
y
Mex
ico
Net
herla
nds
Uni
ted
Sta
tes
Uni
ted
Kin
gdom
Aus
tria
Bel
gium
Fra
nce
Italy
New
Zea
land
Spa
in
Nor
way
Aus
tral
ia
Gre
ece
Can
ada
Sw
itzer
land
Sw
eden
Icel
and
Japa
n
C. Expected age at death (at age 40)
EC
O/W
KP(2000)14
17
Fig
ure 3. H
EA
LT
H R
ISK
-FA
CT
OR
S1996
Source: O
EC
D H
ealth Data 98.
h98\wp 2000\ R
ISK
-29-Mar-00 * 15:20:00
0 2 4 6 8 10 12 14 16 18
0 2 4 6 8 10 12 14 16 18
Luxembourg
Germany
HUNGARY
France
Denmark
Belgium
Spain
Austria
Switzerland
Ireland
Greece
Italy
Netherlands
Portugal
Australia
United States
Czech Republic
United Kingdom
Canada
Japan
New Zealand
Finland
Poland
Sweden
Norway
Iceland
Turkey
A. A
lcoh
ol co
nsu
mp
tion
(liters per capita)
0
500
1000
1500
2000
2500
3000
3500
0 500
1000
1500
2000
2500
3000
3500
Greece
Japan
Switzerland
United States
Netherlands
Portugal
Germany
Italy
Belgium
Ireland
Denmark
Austria
Iceland
France
Finland
United Kingdom
HUNGARY
Canada
Sweden
Norway
Australia
New Zealand
B. T
ob
acco co
nsu
mp
tion
(gramm
es per capita)
0
500
1000
1500
2000
2500
3000
3500
4000
4500
0 500
1000
1500
2000
2500
3000
3500
4000
4500
Greece
Denmark
Germany
United States
France
New Zealand
Belgium
Sweden
Portugal
Switzerland
Italy
Austria
Czech Republic
HUNGARY
Canada
Iceland
United Kingdom
Netherlands
Ireland
Turkey
Spain
Norway
Australia
Korea
Poland
Finland
Japan
C. F
oo
d co
nsu
mp
tion
(calories per capita)
ECO/WKP(2000)14
18
Table 5. Male mortality from selected causes
Deaths per 100 000
Cancers of the respiratory tract Heart disease Liver cirrhosis
1975 1990 1995 Rank1 1975 1990 1995 Rank1 1975 1990 1995 Rank1
Hungary 67 109 117 (1) 314 333 352 (1) 25 75 125 (1)Australia 49 53 52 (20) 281 202 180 (14) 12 9 8 (23)Austria 75 65 (16) 303 221 212 (12) 49 40 38 (2)Belgium 100 (2) 233 129 (21) 17 15 (12)Canada 69 67 (14) 178 166 (16) 11 10 (20)Czech Republic 103 99 94 (5) 332 367 310 (3) 23 32 13 (19)Denmark 69 86 83 (9) 399 293 227 (9) 13 19 21 (9)Finland 69 66 61 (17) 459 359 304 (4) 10 15 16 (11)France 49 68 (13) 122 91 (25) 48 25 (12)Germany 68 74 73 (10) 249 224 222 (10) 30 32 (6)Greece 55 81 85 (8) 121 137 128 (22) 19 14 10 (21)Iceland 21 37 (25) 297 233 (7) 1 1 (12)Ireland 56 60 57 (18) 410 339 (2) 3 3 3 (28)Italy 58 91 (6) 145 (20) 48 35 (12)Japan 20 45 55 (19) 44 45 (27) 20 19 (12)Korea 21 28 (26) 11 16 (28) 47 37 (3)Luxembourg 86 86 (7) 203 151 (19) 34 31 23 (8)Mexico 8 9 (28) 40 46 (26) 34 36 (4)Netherlands 88 95 (4) 287 194 164 (17) 6 6 6 (26)New Zealand 51 54 51 (21) 232 217 (11) 8 4 4 (27)Norway 34 49 (22) 325 278 (5) 6 8 6 (25)Poland 148 194 168 (15) 21 (10)Portugal 18 38 41 (24) 134 115 103 (24) 51 37 35 (5)Spain 34 66 (15) 130 106 (23) 32 29 (7)Sweden 41 44 (23) 401 270 230 (8) 17 10 8 (24)Switzerland 65 68 (12) 175 163 (18) 20 14 (17)Turkey 14 (27) 2 (29)United Kingdom 108 96 (3) 403 306 259 (6) 4 7 9 (22)United States 61 75 72 (11) 208 191 (13) 20 14 13 (18)
1. Rank of the latest available year’s data.Source: OECD Health Data 98.

ECO/WKP(2000)14
19
Figure 4. HEALTH CARE EXPENDITURE1996
Source: OECD Health Data 98.h98\wp 2000\ EXPEND - 29-Mar-00 * 15:22:02
0
2
4
6
8
10
12
14
0
2
4
6
8
10
12
14
Tur
key
Kor
ea
Mex
ico
Pol
and
HU
NG
AR
Y
Uni
ted
Kin
gdom
Cze
ch R
epub
lic
Irel
and
Gre
ece
Luxe
mbo
urg
Fin
land
Japa
n
Den
mar
k
Spa
in
Nor
way
Bel
gium Ita
ly
New
Zea
land
Aus
tria
Icel
and
Por
tuga
l
Aus
tral
ia
Net
herla
nds
Sw
eden
Can
ada
Fra
nce
Sw
itzer
land
Ger
man
y
Uni
ted
Sta
tes
A. Total health care expenditure as a per cent of GDP (1996)
3000 8000 13000 18000 23000 28000 330002
4
6
8
10
12
14
2
4
6
8
10
12
14B. Health care expenditure and GDP per capita at ppp
Aut
Can
Cze
Fra
Deu
Grc
Isl
Irl
Ita
Kor
Lux
Mex
Nld
Nzl
Pol
Prt
Esp
Swe
Che
Tur
Usa
Expenditure (% of GDP)
Per capita income ($ at ppp)
Gbr
Aus
Nor
JpnBel
Fin DnkHUNGARY

ECO/WKP(2000)14
20
Table 6. Per capita healthcare expenditure at purchasing-power parities
Country Latest year
Hungary 602Turkey 232Poland 371Mexico 391Korea 587Czech Republic 904Greece 974Portugal 1 125Spain 1 168Ireland 1 324United Kingdom 1 347New Zealand 1 352Finland 1 447Italy 1 589Sweden 1 728Japan 1 741Belgium 1 747Austria 1 793Australia 1 805Norway 1 814Netherlands 1 825Denmark 1 848Iceland 2 005France 2 051Canada 2 095Germany 2 339Luxembourg 2 340Switzerland 2 547United States 4 090Average 1 558
Source: OECD Health Data 98.
Table 7. Health expenditures in Hungary compared to selected countries
Public expendituresat exchange rate (%)
Public expendituresat PPP (%)
1992 1996 1992 1996
OECD average = 100 21 20 51 49
Austria = 100 19 16 50 44
Spain = 100 30 30 72 63
Portugal = 100 59 51 108 87
Source: OECD Health Data 98.
ECO/WKP(2000)14
21
Table 8. Pharmaceutical and health expenditures in selected countries1996
Hungary1 CzechRepublic Greece Portugal Spain Austria UK Germany USA
(Per cent of GDP)
Pharmaceutical expenditures 1.8 1.9 1.8 2.2 1.5 1.1 1.1 1.3 1.2
Public expenditures on pharmaceuticals 1.3 1.5 0.3 1.4 1.1 0.7 0.7 1.0 0.2
(Per cent)
Share of:Total expenditures on pharmaceuticalsin total health expenditure 26.2 25.9 26.6 26.4 20.0 14.1 16.6 12.7 8.8
Public expenditures on pharmaceuticalsin public expenditures on health 22.7 23.3 5.7 27.7 18.9 11.6 12.4 11.8 2.7
Public expenditures in totalexpenditures on pharmaceuticals 70.4 83.2 16.6 63.0 74.4 58.9 63.1 72.6 14.5
1. 1997.Source: OECD Health Data 98 and HIFA.

ECO/WKP(2000)14
22
23. In Hungary the supply of healthcare workers appears to be distorted as compared with otherOECD countries. While Hungary has among the lowest healthcare worker and nurse-to-patient ratios, theratio for specialists is the highest and that for doctors the fourth highest in the OECD, suggesting a seriousbias towards high-skill (and relatively high-cost) healthcare workers (Table 9). This distorted pattern ofspecialisation has grown worse in recent years. The number of physicians increased by 27 per cent between1990 and 1996 and that of specialists by 12 per cent despite internationally high doctor patient ratios evenin 199035 (Table 10). Despite the general over-supply, there are specialities in serious short supply: mainlythose that do not receive gratitude money (e.g. pathologists).
24. While employment in the whole economy fell by 20 per cent between 1991 and 1997, it declinedby only 2 per cent in the healthcare sector, partly because of these workers’ special status under the publicand civil servants acts36 (OECD, 1997). The increase in physician densities reflects in part a featherbeddingof hospital staffs with older physicians who continue to draw a salary in order to supplement their pensionincomes. The situation has been further exacerbated by a 40 per cent increase in the number of first-yearmedical students since 1990 (CSO, 1996). The current 850 medical graduates each year exceeds by 41 percent the number required to bring physician densities down to the average levels observed in Europeancountries.37 As a result, many doctors in the Hungarian system are underemployed, performing tasks that inother countries would be performed by less-skilled staff.
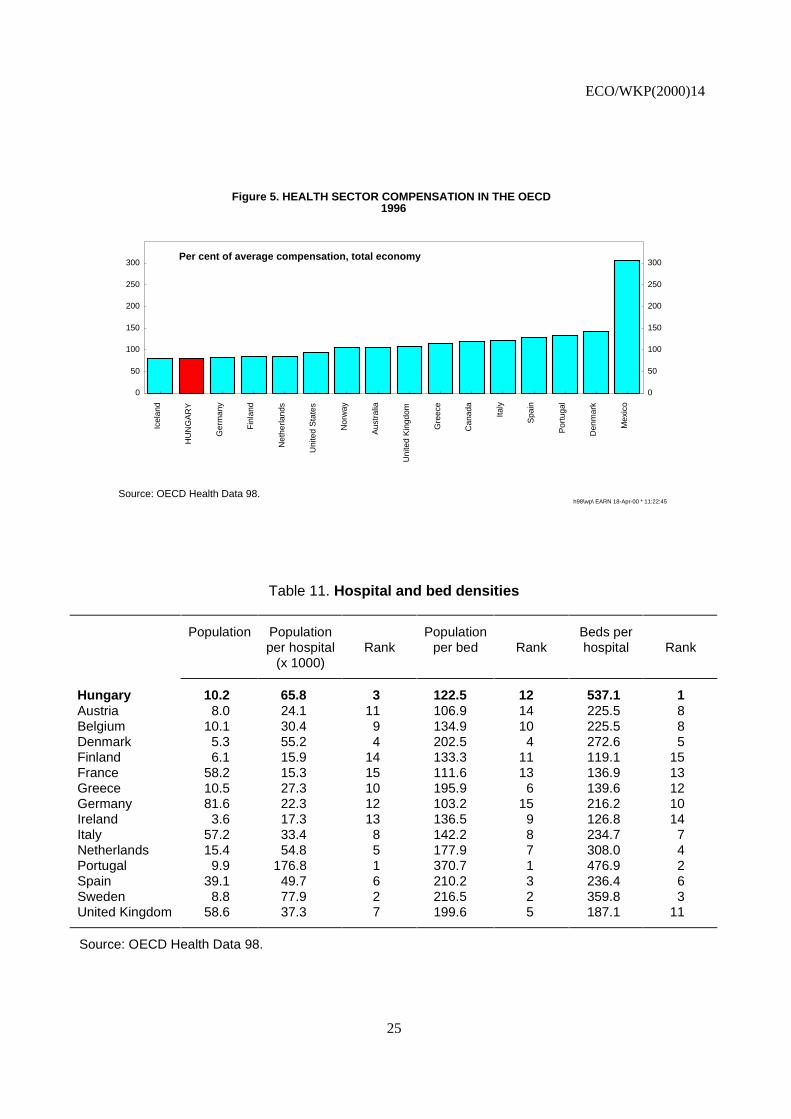
25. Throughout this period, health-sector earnings were falling in real terms, so that relative tonational averages Hungarian healthcare-sector workers are the lowest paid in the OECD (Figure 5). Lowwages in the sector were initially an inheritance from the previous regime. However, during the 1990s thetendency intensified following repeated austerity packages (aggravated by the failure to adjust employmentlevels). Nurses’ relative salaries fell by some 20 per cent of the average wage (Table 11) while physicians’earnings fell from being 50 per cent higher than the average wage in 1996 to being 36 per cent more in1996. In that year, their gross wage amounted to 70 000 forints, which compared very unfavourably withthose of private-sector workers possessing an advanced degree (between 110 000 and 150 000 forints) andprobably even less well with that of owners of small and medium-sized businesses operating in theunderground economy.
26. In contrast to doctors, nurses are in short supply, with significant regional variation. Shortagesare felt most keenly among health institutions located in the capital or in towns where there are otherindustrial or service units attracting employees with significantly higher wages. Other paramedicalprofessions such as physiotherapists and dieticians are also in under-supply. Increasing enrolments in theseprofessions might go part of the way to resolving the problem, but the principal source of the shortageremains low pay. While adequate training capacity is available,38 resources are limited, especially at thehighest level of education and training.
27. Compared with European countries, Hungary has relatively few hospitals but they have thehighest beds per capita ratio in the OECD (Table 12). Reflecting the preponderance of specialists andphysicians among healthcare workers, there is a particularly large number of acute-care beds and very fewnursing-home chronic-care beds (Table 13). Partly because of these features, the vast majority (68 per cent)of doctor-patient encounters occur in hospital outpatient centres under the care of specialists andHungarian make the second highest (14.6) number of medical visits per capita in the OECD.39
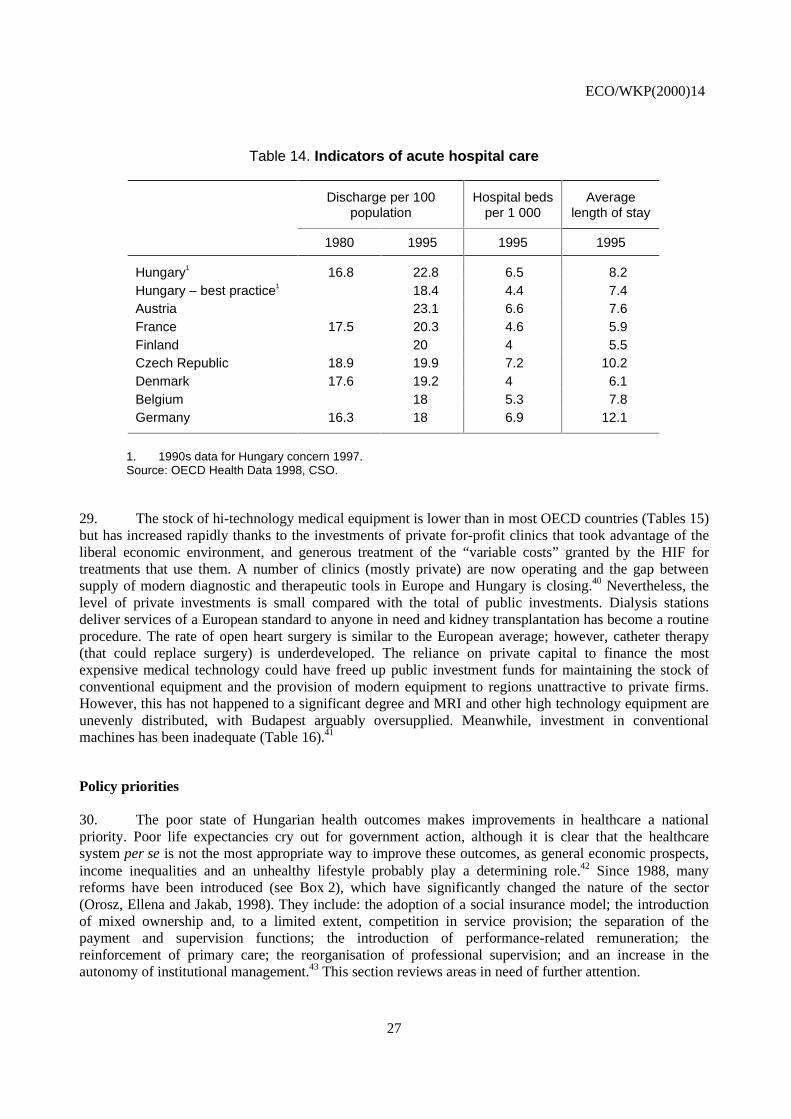
28. Even assuming that Hungary’s high hospitalisation rate (22.8 discharges per 100 population)represented the relative unhealthiness of the population, there appear to be more hospital beds thannecessary (even following the cut backs of the 1990s). Denmark, France and Finland are able to deliversimilar levels of service with only two-thirds the number of beds per capita by keeping patients in hospitalfor a shorter period of time (Table 14). Indeed, looking at the most efficient Hungarian counties (the lineHungary — best practice) demonstrates that even in Hungary it is possible to provide similar service levelswith as many as 30 per cent fewer beds.

ECO/WKP(2000)14
23
Table 9. Health-sector employment in the OECDPer 1 000 population (rank)
All health-care workers Physicians Specialists General Practitioners Nurses
Hungary 16.0 (21) 3.5 (4) 2.7 (1) 0.7 (13) 4.9 (19)Australia 32.3 (7) 2.5 (19) 0.9 (15) 1.3 (4) 9.6 (6)Austria .. .. 2.8 (14) 1.5 (10) 1.3 (4) 8.7 (9)Belgium 21.1 (13) 3.4 (5) 1.6 (8) 1.5 (2) 6.5 (15)Canada 25.0 (10) 2.1 (22) 0.9 (15) 0.9 (9) 8.9 (8)Czech Republic 21.9 (12) 2.9 (11) 2.2 (2) 0.7 (13) 8.1 (10)Denmark 18.9 (16) 2.9 (11) 0.1 (24) 0.6 (16) 7.0 (14)Finland 40.2 (3) 2.8 (14) 1.6 (8) 1.2 (7) .. ..France 26.3 (9) 2.9 (11) 1.5 (10) 1.5 (2) 5.9 (16)Germany 28.5 (8) 3.4 (5) 2.1 (4) 1.1 (8) 9.0 (7)Greece 12.2 (23) 3.9 (4) 2.1 (4) 1.3 (4) 3.6 (22)Iceland 33.6 (5) 3.0 (9) .. .. 0.6 (16) 7.3 (13)Ireland 18.1 (17) 2.1 (22) 0.3 (23) 0.5 (23) 14.8 (2)Italy 18.0 (19) 5.5 (1) 0.5 (21) .. .. 5.5 (18)Japan 20.4 (14) 1.8 (25) .. .. .. .. 7.4 (12)Korea 5.7 (26) 1.1 (28) 0.7 (18) 0.6 (16) 2.6 (24)Luxembourg 18.1 (17) 2.2 (21) 1.4 (12) 0.8 (10) .. ..Mexico 6.2 (25) 1.5 (27) 0.7 (18) 0.5 (23) 1.0 (25)Netherlands 23.8 (11) 2.6 (17) 0.9 (15) 0.4 (25) .. ..New Zealand 17.2 (20) 2.1 (22) 0.6 (20) 0.8 (10) 10.2 (4)Norway 71.4 (1) 2.8 (14) 1.8 (7) 0.8 (10) 14.9 (1)Poland .. .. 2.4 (20) .. .. 1.8 (1) 5.6 (17)Portugal 12.3 (22) 3.0 (9) 2.1 (4) 0.6 (16) 3.5 (23)Spain 11.9 (24) 4.2 (2) .. .. .. .. 4.5 (20)Sweden 39.0 (4) 3.1 (8) 2.2 (2) 0.6 (16) 10.2 (4)Switzerland 51.0 (2) 3.2 (7) 1.1 (14) 0.6 (16) 13.8 (3)Turkey 3.2 (27) 1.1 (28) 0.5 (21) 0.7 (13) 1.0 (25)United Kingdom 20.3 (15) 1.6 (26) .. .. 0.6 (16) 4.5 (20)United States 32.6 (6) 2.6 (17) 1.2 (13) 0.2 (26) 8.1 (10)Average 23.9 .. 2.7 .. 1.3 .. 0.8 .. 7.7 ..
Source: OECD Health Data 98, CSO.

ECO/WKP(2000)14
24
Table 10. Trends in health-sector employment in Hungary
1960 1970 1980 1990 1993 1995 1997 1998
Employees per 1000 population
Total health employment 5.5 8.4 12.5 15.9 16.0 16.0 15.7 15.0Practising physicians 1.5 2.0 2.9 3.7 4.0 4.2 3.5 3.6General practitioners 0.4 0.5 0.6 0.6 0.6 0.7 0.7Practising specialists 1.0 1.4 1.8 2.4 2.6 2.7Certified/registered nurses 1.7 2.7 3.7 4.5 4.9 4.9 4.7
Per cent of all employees
Total hospital employment- per cent of health employment 30.3 26.5 23.8 24.0 23.9
Practising physicians- per cent of health employment 28 24 23 20 21 21 22 24
Physicians working in hospitals- per cent of practising physicians 47.5 39.4
Source: OECD Health Data 98, HIFA.
ECO/WKP(2000)14
25
Figure 5. HEALTH SECTOR COMPENSATION IN THE OECD1996
Source: OECD Health Data 98.h98\wp\ EARN 18-Apr-00 * 11:22:45
0
50
100
150
200
250
300
0
50
100
150
200
250
300
Icel
and
HU
NG
AR
Y
Ger
man
y
Fin
land
Net
herla
nds
Uni
ted
Sta
tes
Nor
way
Aus
tral
ia
Uni
ted
Kin
gdom
Gre
ece
Can
ada
Italy
Spa
in
Por
tuga
l
Den
mar
k
Mex
ico
Per cent of average compensation, total economy
Table 11. Hospital and bed densities
Population Population Population Beds perper hospital
(x 1000)Rank per bed Rank hospital Rank
Hungary 10.2 65.8 3 122.5 12 537.1 1Austria 8.0 24.1 11 106.9 14 225.5 8Belgium 10.1 30.4 9 134.9 10 225.5 8Denmark 5.3 55.2 4 202.5 4 272.6 5Finland 6.1 15.9 14 133.3 11 119.1 15France 58.2 15.3 15 111.6 13 136.9 13Greece 10.5 27.3 10 195.9 6 139.6 12Germany 81.6 22.3 12 103.2 15 216.2 10Ireland 3.6 17.3 13 136.5 9 126.8 14Italy 57.2 33.4 8 142.2 8 234.7 7Netherlands 15.4 54.8 5 177.9 7 308.0 4Portugal 9.9 176.8 1 370.7 1 476.9 2Spain 39.1 49.7 6 210.2 3 236.4 6Sweden 8.8 77.9 2 216.5 2 359.8 3United Kingdom 58.6 37.3 7 199.6 5 187.1 11
Source: OECD Health Data 98.

ECO/WKP(2000)14
26
Table 12. Monthly average health-sector earnings
1992 1993 1994 1995 1996 1998
Per cent of average gross earnings
Compensation per health employee 0.91 0.83 0.88 0.83 0.80 0.82
Physicians mean income 1.53 1.38 1.36 1.281
Nurses salaries 0.92 0.77 0.76 0.711
1. In the hospitals.Source: Central Statistical Office.
Table 13. Hospital beds per capitaBeds per 1 000 (Rank)
In patient care Acute care Nursing homes
Hungary1 9.3 (8) 6.4 (6) 1.0 (15)Australia 8.7 (12) 4.3 (11) 4.1 (5)Austria 9.2 (9) 6.5 (5) 1.9 (12)Belgium 7.2 (14) 5.3 (7) 1.1 (14)Canada 5.1 (19) 3.6 (18) 8.1 (2)Czech Republic 9.0 (11) 6.9 (2) 0.6 (18)Denmark 4.9 (21) 3.9 (13)Finland 9.2 (9) 3.7 (16)France 8.7 (12) 4.5 (10) 1.4 (13)Germany 9.6 (7) 6.7 (3) 3.7 (6)Greece 5.0 (20) 3.9 (13)Iceland 14.8 (4) 3.7 (16) 4.3 (4)Ireland 3.7 (27) 3.4 (19) 5.2 (3)Italy 6.0 (16) 5.1 (9)Japan 16.2 (2) 0.8 (16)Korea 4.6 (22) 4.0 (12)Luxembourg 10.7 (6) 6.7 (3) 2.6 (9)Mexico 1.1 (29)Netherlands 11.2 (5) 3.8 (15) 3.5 (7)New Zealand 6.8 (15) 7.1 (1)Norway 15.0 (3) 3.3 (21) 10.0 (1)Poland 5.5 (18)Portugal 4.1 (24) 3.4 (19)Spain 4.0 (25) 3.2 (23) 0.8 (16)Sweden 5.6 (17) 2.8 (24) 0.5 (19)Switzerland 20.6 (1) 5.2 (8) 2.0 (10)Turkey 2.5 (28) 1.9 (26)United Kingdom 4.5 (23) 2.0 (25) 3.3 (8)United States 4.0 (25) 3.3 (21) 2.0 (10)
OECD average 7.8 4.4 2.7
1. Data for Hungary concern 1998.Source: OECD Health Data 98.
ECO/WKP(2000)14
27
Table 14. Indicators of acute hospital care
Discharge per 100population
Hospital bedsper 1 000
Averagelength of stay
1980 1995 1995 1995
Hungary1 16.8 22.8 6.5 8.2Hungary – best practice1 18.4 4.4 7.4Austria 23.1 6.6 7.6France 17.5 20.3 4.6 5.9Finland 20 4 5.5Czech Republic 18.9 19.9 7.2 10.2Denmark 17.6 19.2 4 6.1Belgium 18 5.3 7.8Germany 16.3 18 6.9 12.1
1. 1990s data for Hungary concern 1997.Source: OECD Health Data 1998, CSO.
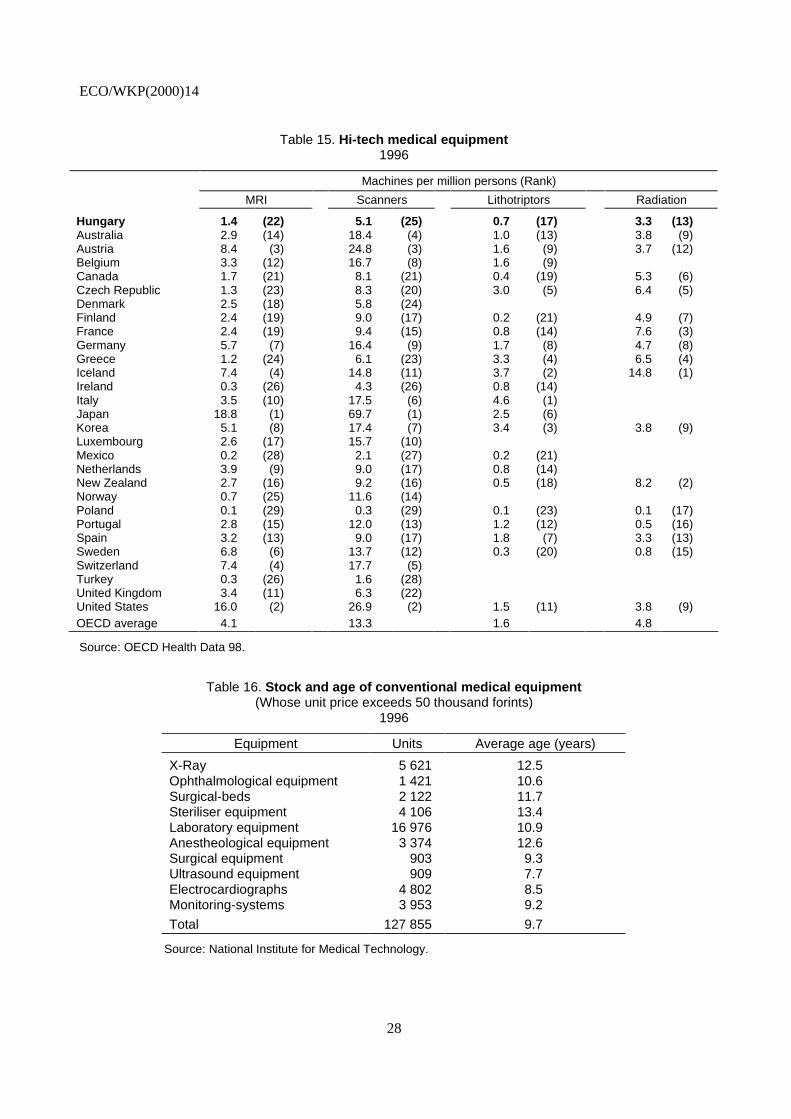
29. The stock of hi-technology medical equipment is lower than in most OECD countries (Tables 15)but has increased rapidly thanks to the investments of private for-profit clinics that took advantage of theliberal economic environment, and generous treatment of the “variable costs” granted by the HIF fortreatments that use them. A number of clinics (mostly private) are now operating and the gap betweensupply of modern diagnostic and therapeutic tools in Europe and Hungary is closing.40 Nevertheless, thelevel of private investments is small compared with the total of public investments. Dialysis stationsdeliver services of a European standard to anyone in need and kidney transplantation has become a routineprocedure. The rate of open heart surgery is similar to the European average; however, catheter therapy(that could replace surgery) is underdeveloped. The reliance on private capital to finance the mostexpensive medical technology could have freed up public investment funds for maintaining the stock ofconventional equipment and the provision of modern equipment to regions unattractive to private firms.However, this has not happened to a significant degree and MRI and other high technology equipment areunevenly distributed, with Budapest arguably oversupplied. Meanwhile, investment in conventionalmachines has been inadequate (Table 16).41
Policy priorities
30. The poor state of Hungarian health outcomes makes improvements in healthcare a nationalpriority. Poor life expectancies cry out for government action, although it is clear that the healthcaresystem per se is not the most appropriate way to improve these outcomes, as general economic prospects,income inequalities and an unhealthy lifestyle probably play a determining role.42 Since 1988, manyreforms have been introduced (see Box 2), which have significantly changed the nature of the sector(Orosz, Ellena and Jakab, 1998). They include: the adoption of a social insurance model; the introductionof mixed ownership and, to a limited extent, competition in service provision; the separation of thepayment and supervision functions; the introduction of performance-related remuneration; thereinforcement of primary care; the reorganisation of professional supervision; and an increase in theautonomy of institutional management.43 This section reviews areas in need of further attention.
ECO/WKP(2000)14
28
Table 15. Hi-tech medical equipment1996
Machines per million persons (Rank)
MRI Scanners Lithotriptors Radiation
Hungary 1.4 (22) 5.1 (25) 0.7 (17) 3.3 (13)Australia 2.9 (14) 18.4 (4) 1.0 (13) 3.8 (9)Austria 8.4 (3) 24.8 (3) 1.6 (9) 3.7 (12)Belgium 3.3 (12) 16.7 (8) 1.6 (9)Canada 1.7 (21) 8.1 (21) 0.4 (19) 5.3 (6)Czech Republic 1.3 (23) 8.3 (20) 3.0 (5) 6.4 (5)Denmark 2.5 (18) 5.8 (24)Finland 2.4 (19) 9.0 (17) 0.2 (21) 4.9 (7)France 2.4 (19) 9.4 (15) 0.8 (14) 7.6 (3)Germany 5.7 (7) 16.4 (9) 1.7 (8) 4.7 (8)Greece 1.2 (24) 6.1 (23) 3.3 (4) 6.5 (4)Iceland 7.4 (4) 14.8 (11) 3.7 (2) 14.8 (1)Ireland 0.3 (26) 4.3 (26) 0.8 (14)Italy 3.5 (10) 17.5 (6) 4.6 (1)Japan 18.8 (1) 69.7 (1) 2.5 (6)Korea 5.1 (8) 17.4 (7) 3.4 (3) 3.8 (9)Luxembourg 2.6 (17) 15.7 (10)Mexico 0.2 (28) 2.1 (27) 0.2 (21)Netherlands 3.9 (9) 9.0 (17) 0.8 (14)New Zealand 2.7 (16) 9.2 (16) 0.5 (18) 8.2 (2)Norway 0.7 (25) 11.6 (14)Poland 0.1 (29) 0.3 (29) 0.1 (23) 0.1 (17)Portugal 2.8 (15) 12.0 (13) 1.2 (12) 0.5 (16)Spain 3.2 (13) 9.0 (17) 1.8 (7) 3.3 (13)Sweden 6.8 (6) 13.7 (12) 0.3 (20) 0.8 (15)Switzerland 7.4 (4) 17.7 (5)Turkey 0.3 (26) 1.6 (28)United Kingdom 3.4 (11) 6.3 (22)United States 16.0 (2) 26.9 (2) 1.5 (11) 3.8 (9)OECD average 4.1 13.3 1.6 4.8
Source: OECD Health Data 98.
Table 16. Stock and age of conventional medical equipment(Whose unit price exceeds 50 thousand forints)
1996
Equipment Units Average age (years)
X-Ray 5 621 12.5Ophthalmological equipment 1 421 10.6Surgical-beds 2 122 11.7Steriliser equipment 4 106 13.4Laboratory equipment 16 976 10.9Anestheological equipment 3 374 12.6Surgical equipment 903 9.3Ultrasound equipment 909 7.7Electrocardiographs 4 802 8.5Monitoring-systems 3 953 9.2
Total 127 855 9.7
Source: National Institute for Medical Technology.

ECO/WKP(2000)14
29
Box 2. A chronology of reform measures in healthcare
1987: Experiment on HDG launched in 26 hospitals, National Health Promotion Program announced andReform Secretariat set up
1989: Private practice authorised
1990: Switch from tax-based funding to compulsory insurance
National Renewal Program includes section on healthcare reform
Ownership of health facilities transferred to local governments
Ministry of Social Affairs and Health renamed Ministry of Welfare
New system of consensus management in hospitals introduced
1991: Establishment of National Public Health Service (responsibility for local hygiene stations transferredfrom local governments)
Ministry of Welfare issues “Action Program” in June to supplement Government’s National RenewalProgram
1992: Social insurance fund separated into a Pension Fund and a Health Insurance Fund
Parliament creates a category of subgroup of “Public Employees”, comprising personnel involved inservice provision such as health and education, as distinct from “Civil Servants” comprising personnelin administrative positions, including staff of the Ministry of Welfare
Parliament eliminates universal entitlement to healthcare and defines conditions for eligibility
Family Physician Service is created and capitation-based payment introduced
1993: Voluntary “Mutual” Health Insurance (supplementary insurance operated by private non-profitinstitutions) authorised
First election of members of Self-Governments of Social Insurance with employer and employeerepresentationOutpatient care remuneration based partly on a fee-for-service scheme, and hospital care remunerationon HDG-type scheme
1994: The Act on the Hungarian Medical Chamber
New National Health Promotion Strategy is adopted by the government
1995: Hospital capacity reduction programme initiated
1996: Act on norms of hospital capacity (capacity reduction)
Government decree on minimum standard of healthcare facilities
1997: Act on Health
Act on Services of Compulsory Health Insurance
1998: Abolition of the Health Insurance Self-government
Creation of the Ministry of Health
1999: Pilot project on managed care launched
2000: Privatisation of the practices of general practitioners

ECO/WKP(2000)14
30
Cost containment
31. Cost containment is distinct from cost-cutting or efficiency improvement and refers togovernments’ efforts to restrict healthcare spending to predefined limits (WHO, 1997). It has been the keystimulus for the Hungarian healthcare reforms of the 1980s and 1990s as well as in many other OECDcountries (OECD, 1994 and 1995). Technological improvements, rising living standards and the lowmarginal cost for individuals of additional healthcare services tend to expand demand. In both private andpublic comprehensive insurance schemes, the absence of a price mechanism means that cost-containmentmust come from the supply side. In public systems government-defined spending limits represent thepolitical expression of the aggregate demand for healthcare services.44
32. In Hungary, prior to the transition, cost containment was achieved automatically within thecontext of the annual negotiations for resources in the plan. Initially it was not an issue in the transition aspolicy makers saw the move towards a social insurance system as a means to increase the resources goingtowards healthcare. Only more recently has controlling expenditures been recognised as an important issue.The introduction of explicit and tightly controlled caps on outpatient and inpatient care plus thecapitation-based payment system for GPs were very effective instruments of cost containment and theprincipal mechanisms by which costs were brought under control after 1994.
33. Initially, spending on speciality services such as MRI and dialysis systems were remunerated ona fee for service basis and the total number of services determined in the contracts made between HIFAand the providers. Because these expenditures are not capped, such spending has grown very quickly andits share in the HIFA’s healthcare expenditures increased from 5 to 6.6 per cent between 1993 and 1997.Most recently, total spending on such services, while still separate from other out-patient careexpenditures, are also capped. Pharmaceutical subsidies are also not capped and their share in HIFAspending rose from 22 to 30 per cent between 1990 and 1997 or from 1.0 to 1.4 per cent of GDP. Theseincreases would have been even larger if different pricing strategies and continuous changes to the subsidysystem had not been applied, including a tripling of pharmaceutical co-payments from 0.2 to 0.6 per centof GDP. These now represent about 30 per cent of total prescription expenditures (Table 17). Medicationsdelivered by hospitals (worth 18.4 billion forints in 1997) are not included in the pharmaceutical subsidybut are paid for indirectly through the HDG and points systems.
34. Cost pressures on the healthcare system are likely to intensify in the future, although theeconomy’s capacity to pay will also be improving. Several decades of neglect during the former politicalregime and the necessity of increasing healthcare workers’ salaries, upgrading existing technologicalinfrastructure and demographic pressures will all place upward pressure on costs. Figure 6 attempts to shedsome light on these pressures. Panel A illustrates the evolution of expected demand by age group assuminga 1.25 income elasticity of demand. It reflects demographic changes in the population, increasing demandfrom all groups which is offset (as a per cent of GDP) by productivity growth and higher levels ofemployment. While this graph clearly indicates that upward pressure from the demand side is unlikely toreverse itself in the future, Panel B shows that under a wide range of assumptions, the current quality gapbetween Hungarian and European healthcare systems is likely to be closed within the next 25 years. Itshows the evolution of healthcare supply, assuming expenditures of 6.5 per cent of GDP, under fourscenarios, based on assumptions of higher or lower long-term levels of employment and productivitygrowth. In all cases, Hungary catches up to current European levels of consumption within the next25 years — suggesting that the while the need to restrain demand through cost containment will continueunabated, under a wide range of assumptions, the economy’s capacity to pay will expand sufficientlyrapidly so as to close relatively quickly the current European quality and quantity gap.

ECO/WKP(2000)14
31
Table 17. Retail pharmaceutical spending and subsidies
Year SalesBudget for
pharmaceuticalspending
PharmaceuticalSpending
BalancebillionHUF
BalancePer cent
Co-payment
Governmentexpenses1
Totalpatient
co-payment
Reimburse-ment level by
the HIF %
Generalreimbursement
level %2
1993 66.2 35.5 51.13 -15.63 -44.0 15.1 15.1 77.2 77.2
1994 83.9 50.7 60.9 -10.2 -20.1 2.5 20.5 23.0 72.6 75.6
1995 108.7 67.7 72.8 -5.1 -7.5 5.5 30.4 35.9 67.0 72.0
1996 130.5 72.0 86.2 -14.2 -19.7 6.8 37.5 44.3 66.1 71.3
1997 156.4 86.7 101.7 -15.0 -17.3 8.8 46.1 54.9 65.0 70.7
1998 199.9 108.8 135.5 -26.7 -24.5 54.4 10.0 64.4 67.8 72.8
1999 122.9 141.0 -18.1 -14.7
1. Government pays the co-payments of low income of health-card holders.2. HIFA + government.Source: HIFA.
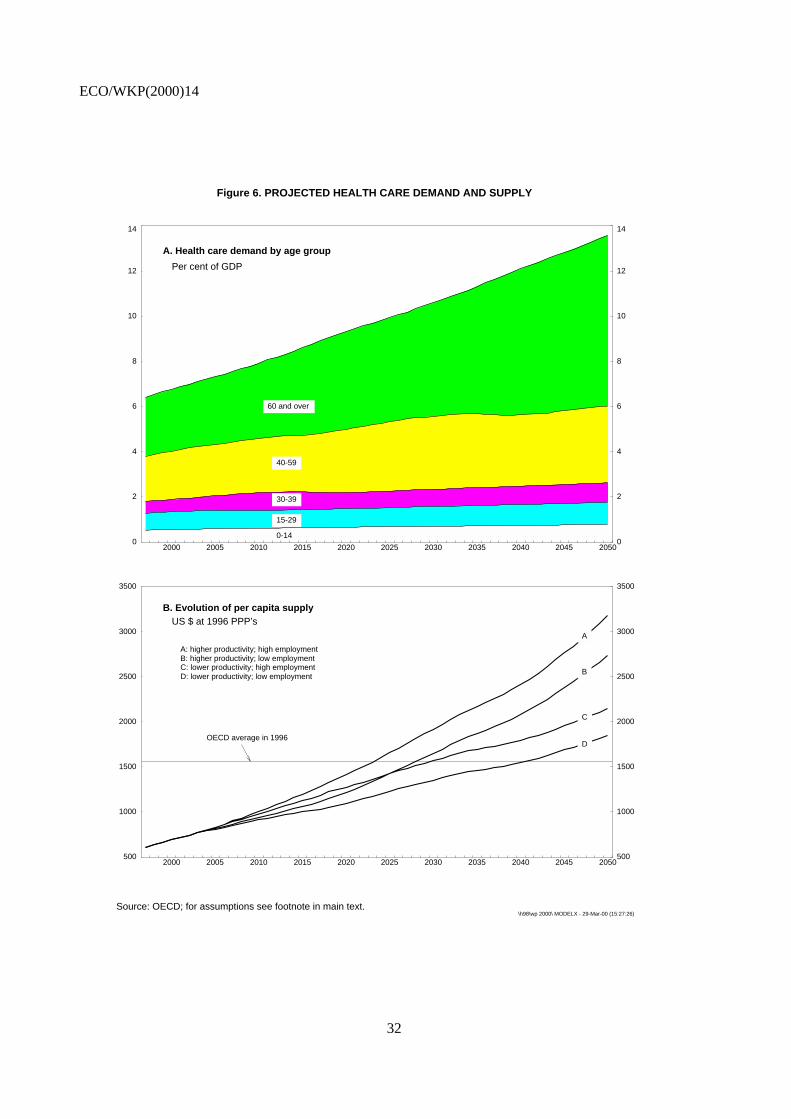
ECO/WKP(2000)14
32
Figure 6. PROJECTED HEALTH CARE DEMAND AND SUPPLY
Source: OECD; for assumptions see footnote in main text.\h98\wp 2000\ MODELX - 29-Mar-00 (15:27:26)
2000 2005 2010 2015 2020 2025 2030 2035 2040 2045 20500
2
4
6
8
10
12
14
0
2
4
6
8
10
12
14
A. Health care demand by age group
Per cent of GDP
0-14
15-29
30-39
40-59
60 and over
2000 2005 2010 2015 2020 2025 2030 2035 2040 2045 2050500
1000
1500
2000
2500
3000
3500
500
1000
1500
2000
2500
3000
3500
B. Evolution of per capita supplyUS $ at 1996 PPP’s
OECD average in 1996
A
B
C
D
A: higher productivity; high employmentB: higher productivity; low employmentC: lower productivity; high employmentD: lower productivity; low employment

ECO/WKP(2000)14
33
Microeconomic inefficiencies
35. While the use of spending caps enabled costs to be more or less contained, a number of factorsseverely reduce the efficiency with which the limited resources available to healthcare are employed. Aconfused policy and administrative structure; excess capacities in acute hospital care; an oversupply ofspecialists; weak preventive and primary care; lack of co-ordination within the healthcare system andbetween health and social care; inefficient and uncoordinated investments; weak supervision and policingof the payment system; fraudulent behaviour on the part of service providers and a number of awkwardincentives constitute some of the most serious problems with the system.
Policy and administrative problems
36. The process of policy formation and review is underdeveloped and plagued byintra-organisational conflict and this is reflected in the wide discrepancy between announced healthreforms and their implementation. Disenchantment with the healthcare system is widespread, and althoughhealthcare is a perennial election issue, political and public interest in a policy debate is limited.45 Thepolitics of reform are considerably complicated by the immediacy of its perceived costs compared with themedium to long-term nature of its payoffs. Needs are not assessed at regular intervals and there is nomechanism for prioritising the distribution of financial resources. Results of implemented reform measuresare not systematically evaluated and, as a result, programs are not adjusted and improved. Here, asignificant part of the problem stems from the fragmentation of healthcare statistics; as noted, there is nointegrated source of data and therefore no means of monitoring and comparing healthcare expenditures andprovision across different systems46 or regularly assessing the health of the population
37. Many of the problems reflect a general tension between the desire to reduce the role of the centralgovernment, which, since the beginning of the transition, has been perceived as having starved the system(and the people) of funding levels consistent with good quality medical care, and the need to control supplyand alleviate some of the worst distortions inherited from the previous system. The creation of the HIFA in1994 separated the payment and provision functions of the healthcare system and at the same time thehealth insurance self-government (HISG) was assigned the task of ensuring that insurance premia were notused by the government to fund non-health related activities. Unfortunately, the delineation ofresponsibilities and authority between the government and the HISG was never well defined and conflictsemerged almost immediately between the HISG, the HIFA and the Ministries of Finance and Welfare overboth health policy and the financing of the system. Inevitably, the lack of clear responsibility led to policyparalysis. The confusion and lack of direction extended to the administration of the system because theHIFA was simultaneously: a subordinate body of the HISG; an institution answerable to the Ministry ofWelfare on health policy and quality questions; and required to execute the budget issued by the Ministryof Finance. These problems were further complicated by pressures from various interest groups — notleast that of doctors.
38. Although the Ministries of Welfare and Finance shared many common concerns, their underlyingpreoccupations were, naturally, quite different. The Ministry of Finance focused on keeping costs atsustainable levels, while the Ministry of Welfare's principal goal was to improve the quality of care.Meanwhile, the HISG tended to behave as if it were a representative of sectoral interests rather than a bodyresponsible for the provision of cost-effective quality healthcare. In successive budget proposals, it askedfor increases in its expenditures in excess of its own receipts and the economic capacity of the economy. Inpart, the conflict between the HIFA and the Ministry of Health (Welfare) derived from the separation ofmanagement and financial responsibility. Thus, the Ministry of Health set prices and supply but did not

ECO/WKP(2000)14
34
pay bills, while the HIFA paid bills but has only limited authority to offset costs. Thus, it was and still isnot able to refuse to contract with public providers, cannot dictate supply limits and cannot enter intoperformance contracts in an effort to improve the quality of services delivered. Further, as administrator ofthe healthcare system, the HIFA’s execution of government decisions was unsatisfactory. It failed todevelop a real purchasing role with contractual relations that clearly defined the responsibilities ofproviders and which controlled for the quality of services performed. There was little concrete progress toimprove collection methods or control those healthcare costs under its control.47 Expenditures wereconsistently over budget among the open-ended medical services — drug-subsidies, sick pay and disabilitypensions48 — so that the HIFA was unable to balance its budget, despite the expenditure reducing effect ofthe spending caps.
39. So far, the government has not put forward a long-term strategy for the funding of the HIF. In theautumn of 1998, it transferred the premium collection role of the HIF to the tax office in an effort toimprove collection efficiency and allow the HIFA’s staff to concentrate on their main responsibilities (halfof the HIFA’s staff and much of the top management’s intellectual energy has been concerned withrevenue collection). Proposals for extending the use of co-payments, encouraging voluntary insurance andeven the possibility of abolishing the HIF’s monopoly position in favour of a multi-pillar financing systemwere put forward by the MoF early 1998 and again in early 1999 by a reform committee of the presentgovernment. For the moment, however, these proposals have not been accepted.
40. Because of these operational and organisational difficulties, the process of policy reform has beenrelatively confrontational with many of the recent reforms having been imposed on the healthcare systemby the Ministry of Finance — principally as cost-containment measures. Organisational problems exist atthe sub-national level as well (Orosz, 1997). As part of the overall political transformation, the system ofpublic administration was greatly decentralised during the 1990s and the co-ordinating function of thecounty governments was eliminated. Local governments were given responsibility for the development oftheir own healthcare infrastructure and hospitals (among other state-owned assets) were transferred to them(both municipal and county). As a result, significant duplication and excess capacities have became moreprevalent, while available financial resources to operate existing physical capacities have declined.Financially, hospitals were exposed to an imbalance between the large catchment areas they were meant toserve and the often very small communities to which they belonged. A number of hospitals were unable tomeet demands without generating large deficits. Part of the responsibility for these deficits lies with thelocal governments who, as owners, failed to exercise effective control over their hospitals and were unableto finance the deficits themselves but simultaneously refused to give up ownership and control. As a result,the central government has been placed in the position of bailing out the hospitals or letting them gobankrupt. Understandably, the former option was taken, but this has generated a serious moral hazardproblem.
Service delivery
41. As a consequence of excess capacities in terms of specialists and hospital beds, patients aretreated at a higher (and more expensive) level of the healthcare system than required and services such astargeted screening, health education, and rehabilitation are underdeveloped, while institutions (nursinghomes, home care) primarily caring for the elderly are almost entirely missing.
42. Successive governments have acknowledged the need to improve public health and reduce therole of hospital-based care in Hungary. Nevertheless, little concrete action has been taken and preventionhas played a decreasing role in overall healthcare spending. Public-health employees enjoy little prestigeeither professionally or within society at large: the National Health and Medical Officer Service isunderfunded; government anti-tobacco and public-health campaigns are underdeveloped; tobacco taxes are
ECO/WKP(2000)14
35
relatively low49 and little emphasis has been placed on preventive healthcare.50 In addition, thegate-keeping function, the mechanism by which access to expensive care is limited to patients most inneed, is weak. Patients can and do visit hospital-based specialists directly when in many cases cheaper andeven better care might be available at lower levels within the system. There is no effective system tocontrol excessive use of high-cost techniques, such as those employed by the many healthcare systems(including private ones), i.e. requiring referrals or prior authorisation for certain treatments, restricting thetreatments covered or dictating which doctors may be seen.
43. The creation of the Family Physician Service sought to enhance the role of general practitionersas gate-keepers. But while the initial reform envisaged expanding preventive medicine, programmes ofeducation, and quality assurance, the actual reform was limited to the “functional privatisation” of the GPspractice and the introduction of the capitation system. In the event, doctors’ practices have not changedmuch. GPs continue to offer mainly prescription and referral services and exercise only a weakgate-keeping function. Inertia doubtless explains part of their failure to play a more active role, but neitherdo they have any economic incentive to alter or expand the range of services they provide.51
44. Recent reforms have reinforced the role of the GP as gatekeepers. Decrees issued inDecember 1997 place some limitations on the specialised services that an individual can access withoutreferral but a wide range of services remains generally available.52 Access to hospital care can be gainedfollowing referral by a specialist or family physician, while only specialists can order MRI, CT and DigitalSubtraction Angiography (DSA) scans and only those working in hospitals can prescribe positron emissiontomography (PET) examinations. Since January 1998 co-payments are required if patients normallyrequiring referral consult directly a specialist or if they deal with a specialist other than the one to whichthey were referred. In such cases, service providers bill patients directly and the latter must pay with apostal-order. The government decree defines some basic fees but allows the providers (outpatient clinics,hospitals) to reduce or even waive fees. If the patient does not pay the bill, the institution is responsible forcollecting the money. There is no information as to how these provisions work in practice.
45. Three major reforms introduced in a 1990s were aimed at addressing the problems of the hospitalsector: the introduction of HDG based financing; a centrally planned bed reduction programme; and aregional restructuring programme.53 Reacting to the over-supply and duplication of services, thegovernment (beginning in 1994) attempted to dictate the number of beds required in each hospital. Aftermeeting with widespread opposition, this programme was replaced by a somewhat more flexible approachin 1996, by which the government stipulated for each county maximum outpatient capacities and themaximum number of inpatient beds by speciality. The decision regarding which beds or hospitals to closewas left to “consensus committees” in each county. This process led to the elimination of 6 300 acute-carebeds (9 per cent of the acute hospital capacity) and about 3000 chronic care beds, but, because fewfacilities were closed54 and there was no concomitant reduction in personnel, there were only limitedfinancial savings (Table 18).55 Hospital cases actually rose by 9 per cent between 1993 and 1997 and, inacute care, the number of HDG points charged to the HIFA rose 17.4 per cent, reflecting a 30 per centincrease in the hospitalisation of individuals over 60 years of age.
46. Overall, the system remains hospital centric and, despite the reforms, the rate of hospitalisationhas increased and the share of primary care in healthcare resources has decreased. As the medicaltechniques employed for a given illness, the intensity of services, and the quantity of their utilisation areheavily influenced by the number, structure and qualification of doctors — this orientation has substantialimplications. The concentration and compartmentalisation of resources in the hospital sector hascontributed importantly to the underdevelopment and underfunding of primary-care services, nursinghomes, home care and preventive medicine. Meanwhile, any market-driven trend towards these kinds ofcare is effectively stopped by the lack of flexibility in the distribution of the healthcare budget. Inaggregate, the medical profession cannot reallocate financial resources between the primary, chronic,
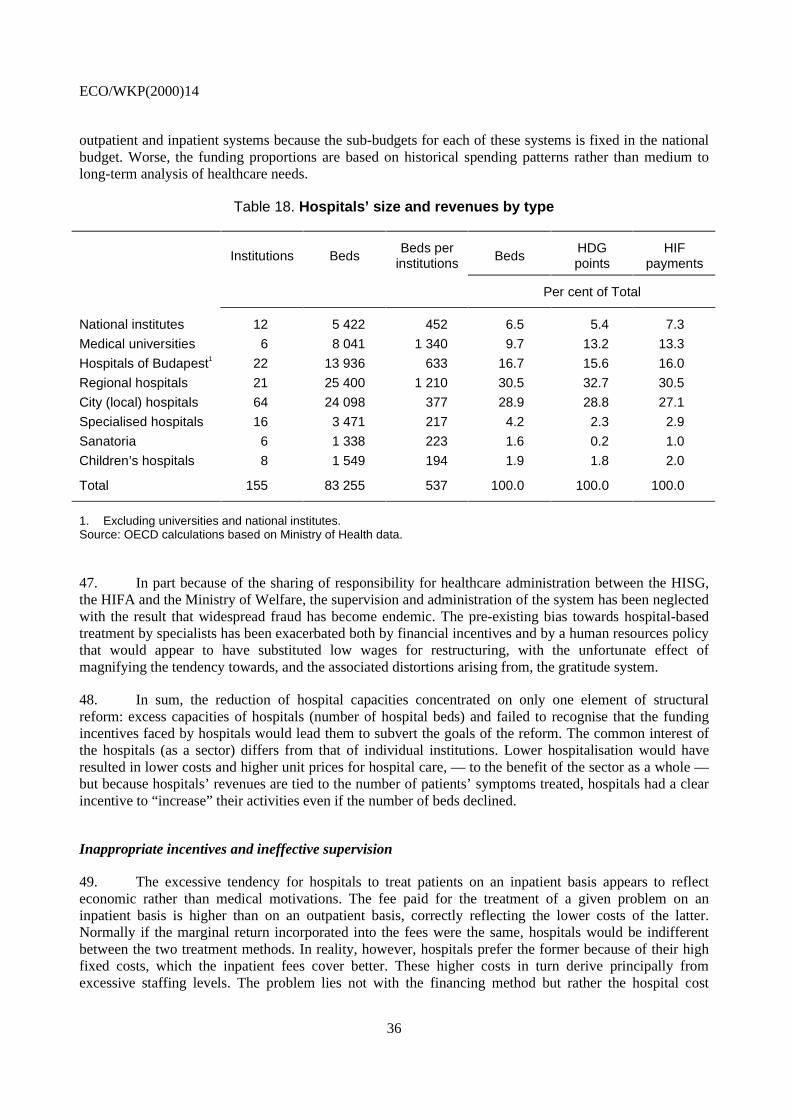
ECO/WKP(2000)14
36
outpatient and inpatient systems because the sub-budgets for each of these systems is fixed in the nationalbudget. Worse, the funding proportions are based on historical spending patterns rather than medium tolong-term analysis of healthcare needs.
Table 18. Hospitals’ size and revenues by type
Institutions BedsBeds per
institutions BedsHDGpoints
HIFpayments
Per cent of Total
National institutes 12 5 422 452 6.5 5.4 7.3
Medical universities 6 8 041 1 340 9.7 13.2 13.3
Hospitals of Budapest1 22 13 936 633 16.7 15.6 16.0
Regional hospitals 21 25 400 1 210 30.5 32.7 30.5
City (local) hospitals 64 24 098 377 28.9 28.8 27.1
Specialised hospitals 16 3 471 217 4.2 2.3 2.9
Sanatoria 6 1 338 223 1.6 0.2 1.0
Children’s hospitals 8 1 549 194 1.9 1.8 2.0
Total 155 83 255 537 100.0 100.0 100.0
1. Excluding universities and national institutes.Source: OECD calculations based on Ministry of Health data.
47. In part because of the sharing of responsibility for healthcare administration between the HISG,the HIFA and the Ministry of Welfare, the supervision and administration of the system has been neglectedwith the result that widespread fraud has become endemic. The pre-existing bias towards hospital-basedtreatment by specialists has been exacerbated both by financial incentives and by a human resources policythat would appear to have substituted low wages for restructuring, with the unfortunate effect ofmagnifying the tendency towards, and the associated distortions arising from, the gratitude system.
48. In sum, the reduction of hospital capacities concentrated on only one element of structuralreform: excess capacities of hospitals (number of hospital beds) and failed to recognise that the fundingincentives faced by hospitals would lead them to subvert the goals of the reform. The common interest ofthe hospitals (as a sector) differs from that of individual institutions. Lower hospitalisation would haveresulted in lower costs and higher unit prices for hospital care, — to the benefit of the sector as a whole —but because hospitals’ revenues are tied to the number of patients’ symptoms treated, hospitals had a clearincentive to “increase” their activities even if the number of beds declined.
Inappropriate incentives and ineffective supervision
49. The excessive tendency for hospitals to treat patients on an inpatient basis appears to reflecteconomic rather than medical motivations. The fee paid for the treatment of a given problem on aninpatient basis is higher than on an outpatient basis, correctly reflecting the lower costs of the latter.Normally if the marginal return incorporated into the fees were the same, hospitals would be indifferentbetween the two treatment methods. In reality, however, hospitals prefer the former because of their highfixed costs, which the inpatient fees cover better. These higher costs in turn derive principally fromexcessive staffing levels. The problem lies not with the financing method but rather the hospital cost

ECO/WKP(2000)14
37
structures. By increasing the variable portion of its costs and reducing its fixed costs, outpatient care wouldbecome a more attractive option for the hospitals. Here, the regulations of the Act on Public Employees,which governs hospitals’ relations with its salaried staff pose a serious problem.
50. The problem is further complicated because the capitation, HDG and points-based payments ofthe HIF do not cover depreciation costs. Funding for this — and other capital costs — are the responsibilityof hospital owners (local governments) and are subsidised on an ad hoc basis from the central budget. As aresult, health institutions have no financial incentive to use their equipment rationally. Medical decisionsare made on the basis of availability alone, while with respect to investment they are subject to politicaland budgetary pressures that are greatly removed from medical and economic considerations. Examples ofsubstantially over-used equipment often coexist with dramatic under-use within the same institution.Investment decisions follow neither a logic consistent with public policy (equal access to serviceprovision) nor one that guarantees a rational allocation of resources across competing needs. Whileeconomically irrelevant for an individual hospital, superfluous and under-used investment capacities drawresources away from other areas where they could help to contribute to improving service provision andcost-effectiveness.56
51. The legal status of hospitals as “budgetary institutions” has two important implications in thisregard. Perhaps most importantly, this status means that hospital staff — and in particular specialists — arecivil servants and are, therefore, subject to relatively stringent job protection legislation making it verydifficult to adjust staffing levels (see OECD, 1997). In addition, this status means that hospitals are obligedto use an inappropriate accounting system incapable of performing cost analysis. While most hospitalsoperate parallel systems and calculate the depreciation of their assets, no reserves are built up to financefuture capital purchases. The budgetary status also restricts the autonomy and responsibility of hospitalmanagers. Decisions on investments and capacity reductions are made by the local assembly and thehospitals are not allowed to borrow.
52. Within the hospital sector, the budgetary cost of the oversupply of doctors and the apparentfeatherbedding of hospital staff with above pension-age doctors has been offset somewhat by the fall indoctors’ salaries, itself an indirect result of the strict capping of HDG and points-based payments.However, the budgetary and health cost of the under-supply of nurses and other healthcare workers shouldnot be under-estimated. The relative under-supply of physiotherapists, chronic-care facilities (such asnursing homes) and home-care nursing programmes reflects the oversupply of specialists and theirinstitutional attachment to hospitals and inpatient treatment. At the same time, it leads to the perversesituation where doctors are performing duties normally fulfilled by nurses. Not only would greater use ofnurses and other healthcare professionals reduce costs in many respects, it might well improve outcomes— especially for the quality of life of long-term care patients. As the low salaries are accompanied with anexcess supply of specialists and a shortage of other lower-paid healthcare professionals, the obvioussolution would be to reduce the supply of the former and use the savings to raise the wages of the latter andhire more nurses. While such a “solution” appears simple, its implementation would be difficult and couldonly be achieved over a period of several years.
53. The low earnings of salaried health personnel need to be distinguished from their incomes which,in the case of some specialists, can be very high because of gratitude money. These illegal payments are aserious problem for the rational reform of the healthcare system. For some groups of influential doctorsthey represent a substantial undeclared — and, therefore, untaxed — portion of total income which makesthem resistant to some kinds of reform. In addition, gratitude payments are said to influence treatmentchoice as patients tend to make larger payments for riskier interventions such as surgery. Moreimportantly, they are increasingly transforming the healthcare system into one, where the quality of careand waiting periods experienced may depend upon a patient’s ability to provide gratitude money. In
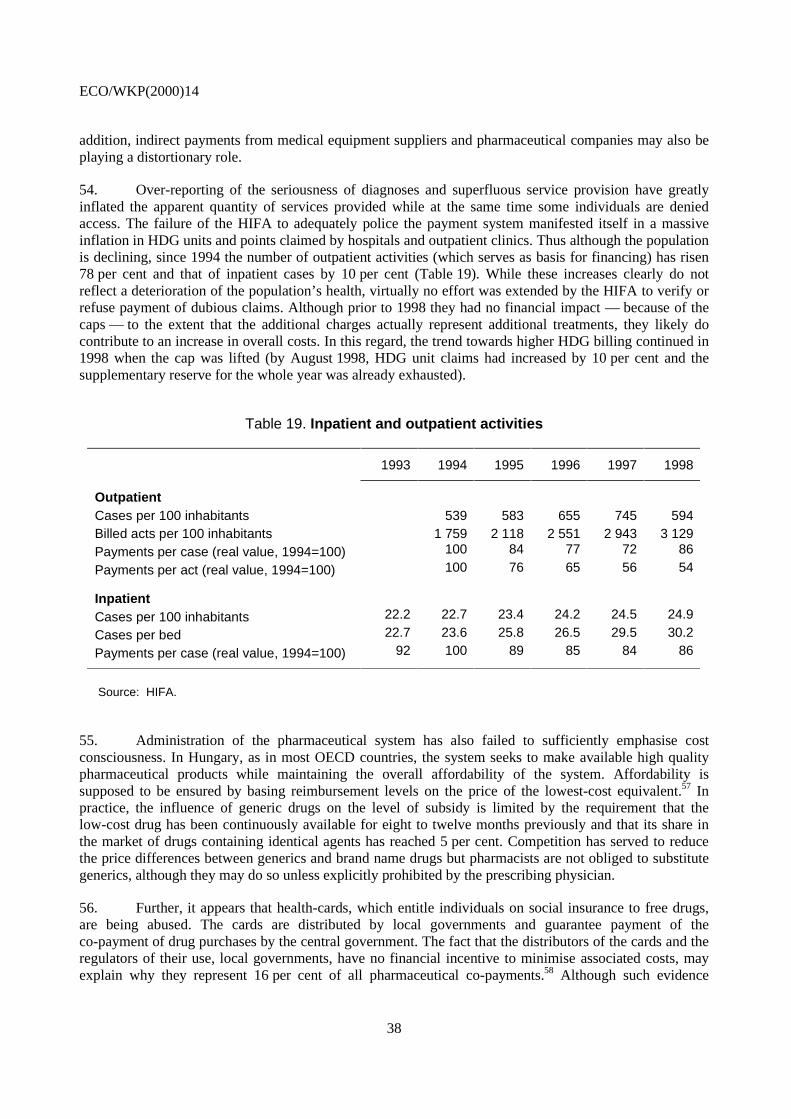
ECO/WKP(2000)14
38
addition, indirect payments from medical equipment suppliers and pharmaceutical companies may also beplaying a distortionary role.
54. Over-reporting of the seriousness of diagnoses and superfluous service provision have greatlyinflated the apparent quantity of services provided while at the same time some individuals are deniedaccess. The failure of the HIFA to adequately police the payment system manifested itself in a massiveinflation in HDG units and points claimed by hospitals and outpatient clinics. Thus although the populationis declining, since 1994 the number of outpatient activities (which serves as basis for financing) has risen78 per cent and that of inpatient cases by 10 per cent (Table 19). While these increases clearly do notreflect a deterioration of the population’s health, virtually no effort was extended by the HIFA to verify orrefuse payment of dubious claims. Although prior to 1998 they had no financial impact — because of thecaps — to the extent that the additional charges actually represent additional treatments, they likely docontribute to an increase in overall costs. In this regard, the trend towards higher HDG billing continued in1998 when the cap was lifted (by August 1998, HDG unit claims had increased by 10 per cent and thesupplementary reserve for the whole year was already exhausted).
Table 19. Inpatient and outpatient activities
1993 1994 1995 1996 1997 1998
OutpatientCases per 100 inhabitants 539 583 655 745 594Billed acts per 100 inhabitants 1 759 2 118 2 551 2 943 3 129Payments per case (real value, 1994=100) 100 84 77 72 86
Payments per act (real value, 1994=100) 100 76 65 56 54
InpatientCases per 100 inhabitants 22.2 22.7 23.4 24.2 24.5 24.9
Cases per bed 22.7 23.6 25.8 26.5 29.5 30.2
Payments per case (real value, 1994=100) 92 100 89 85 84 86
Source: HIFA.
55. Administration of the pharmaceutical system has also failed to sufficiently emphasise costconsciousness. In Hungary, as in most OECD countries, the system seeks to make available high qualitypharmaceutical products while maintaining the overall affordability of the system. Affordability issupposed to be ensured by basing reimbursement levels on the price of the lowest-cost equivalent.57 Inpractice, the influence of generic drugs on the level of subsidy is limited by the requirement that thelow-cost drug has been continuously available for eight to twelve months previously and that its share inthe market of drugs containing identical agents has reached 5 per cent. Competition has served to reducethe price differences between generics and brand name drugs but pharmacists are not obliged to substitutegenerics, although they may do so unless explicitly prohibited by the prescribing physician.
56. Further, it appears that health-cards, which entitle individuals on social insurance to free drugs,are being abused. The cards are distributed by local governments and guarantee payment of theco-payment of drug purchases by the central government. The fact that the distributors of the cards and theregulators of their use, local governments, have no financial incentive to minimise associated costs, mayexplain why they represent 16 per cent of all pharmaceutical co-payments.58 Although such evidence

ECO/WKP(2000)14
39
supports the disproportionate consumption of drugs by cardholders,59 no study has attempted to comparethe actual needs of this population group with their drug consumption although the HIFA does have acounty-based monitoring system that is supposed to control for health-card abuse. More general controlson the prescription system have yet to be put in place, although implementation efforts have beenunderway for several years (see below).
Scope for further action
57. The necessity of pursuing the reform effort in the healthcare system is apparent. Successivegovernments have introduced a range of measures, which, by and large, have contributed to improving theallocation of resources within the system. Nevertheless, as indicated in the previous section, there remain alarge number of distortions and inefficiencies that need to be addressed. Although problems exist at alllevels within the system, reform should proceed in an evolutionary manner, however with a determinedshift in priorities. The government should give priorities, on the one hand, to measures which aims tohealth promotion and, on the other hand, economic, legal and organisational measures that improve theallocation of resources and which emphasise outcome-oriented changes to the service-delivery system.
58. Perhaps the most critical key to improving the health state of Hungarians will be efforts toinfluence their own behaviour and to increase the extent to which they take responsibility for their ownhealth by choosing healthier life styles. While the government cannot dictate people’s attitude towardstheir own health, it can attempt to modify behaviour by using economic incentives — such as dissuasivetaxes on products and activities known to contribute to poorer health — and also through concertedprogrammes of health promotion. Here television advertising, educational programmes aimed at the wholefamily but directed explicitly towards children and programmes of sensitisation delivered by generalpractitioners and public health professionals can have an important effect. The presently fragmented healthpromotion activities and agencies should be integrated and local governments, employers and primary andsecondary schools should become more involved in health promotion. Furthermore, a more flexible andholistic approach to healthcare is required, necessarily implying less emphasis on hospital-based care, anda much greater use of primary and outpatient care, nursing homes, occupational and medical rehabilitationand other services for the chronically ill and not at least incorporation of the holistic approach into themedical education.
59. Generally speaking, the efficiency of the healthcare system (possible health-gain for the givenhealth-expenditures) could be improved by: moving towards a needs-based allocation of financialresources between territorial units; a better allocation of resources between prevention, primary andsecondary care and between different health-problems/diseases (choosing the more cost-effective treatmentpatterns of care and by reducing the costs of interventions made). However, there is no one magic tool:concerted changes are needed in financial, legal and organisational settings in order to placeallocation-decisions at the right level (with those actors that have the best information), to provide themwith the proper combination of incentives and to give system managers (Ministry of Health, localgovernments hospital managers and individual doctors) the tools to properly monitor choices made so thatdecision makers can be held accountable.
60. Obviously a great deal needs to be accomplished before such a system can be excepted to beoperational in Hungary. Indeed, the recent history of healthcare in Hungary is wrought with conflictsbetween different agencies and care-giver interest groups. A major challenge will be to introduce reformsin a way that reduces these tensions and increases co-operation between agencies. While it is difficult toindicate precisely how to do so, it is clear that a programme of consultation and integration of stakeholdersin the reform process is a necessary starting point.

ECO/WKP(2000)14
40
61. Notwithstanding the need to promote better co-operation, the abolition of the Health InsuranceSelf Government was a positive step and should be followed up by a decision to subordinate the NationalHealth Insurance Fund Administration (HIFA) to the Ministry of Health. While the HIFA has beenjustifiably criticised in the past for its failure to aggressively pursue cost containment and implement thepolicies of the government, at least some of the responsibility for these failures lay with its confusedgovernance structure. There is no reason to expect that in the future it will not efficiently perform itsfunction as purchaser of services and administrator of the health financing system, although, to do so, itsrelationship with the Ministry of Health needs to be clearly defined and an unambiguous set of goals, withappropriate incentives imposed. Here, increased use of performance-based and goal-oriented pay formanagers and more use of specific-task employment contracts could help realign the private objectives ofits employees with those of society at large. As yet, however, this relationship and these responsibilitieshave not been defined.
62. As discussed in OECD (1999 and 1997), the system’s reliance on a payroll tax (under the guiseof a compulsory insurance premium) for its financing unnecessarily raises labour costs, contributes tonon-employment and the underground economy and raises the spectre of large portions of the populationbeing uncovered. The recent government decision to reduce employer contributions, while broadening thebase upon which the tax is calculated and raising the obligatory payment should reduce some of thedisincentive effects. However, the increasing reliance on the flat-rate health tax makes the system evenmore digressive to the detriment of low-skill workers. A less distortionary response would explicitlyacknowledge that some 50 per cent of the working-age population does not work and would, therefore,widen the tax base to include all forms of personal income. Such a regime would have the additionaladvantage of allowing for lower tax rates, while the link in the minds of tax payers between the costs ofhealthcare and their contributions could be preserved by maintaining the earmarked nature of the tax andusing a separate line on the tax form. The decision to transfer collection responsibilities from the HIFA tothe Tax Authority is welcome in this regard. It will allow the HIFA to concentrate upon its much neglectedsupervisory and administrative roles, while the consolidation of these tax collection functions should helpreduce evasion.
63. There does not appear to be any need to introduce a more complicated payment system thanalready exists. International experience suggests that for a country such as Hungary the advantages of asingle purchaser outweigh its disadvantages. A single purchaser can use its monopsonistic power tomonitor closely service provision and, based on comparisons, pressure caregivers into following best andlow-cost practices. While some countries do operate healthcare systems relying principally on multipleinsurance funds (private or public), these systems tend to compete for good risks and generate a great dealof additional administrative costs without substantial additional savings from the competition betweenpurchasers. There is, however, considerable scope for increasing the capacity of the HIFA to influence thequality of care that it purchases. Here, the ability to enter into selective (the right to refuse to contract withsome suppliers) and performance contracts could introduce a significant element of competition amongservice providers. Finally, as the Hungarian scheme already allows for supplementary insurance, costsavings within the public system and increased competition could be introduced by expanding the currentlyvery narrow range of services not covered by the universal regime. In this regard and as has been done inother OECD countries, there may be scope for improving the effectiveness of spending by favouringprocedures and medical services that have been proven to have an above-average payoff in terms ofimproved health status and quality of life.
64. By the same token, despite the micro-level distortions that it has generated, the overall budgetarycap and basic payment schemes should not be abandoned. Alternative remuneration systems, such asglobal budgets for the individual hospitals, provide even fewer incentives to improve efficiency andquality. Rather, the government should allow for substitutability between payment systems by providing anequivalence scale between, HDG performance units, outpatient points and chronic-care points and then

ECO/WKP(2000)14
41
capping the total budget for specialist care. Hospitals would then be free to choose (from any of thesystems) the treatment that was most economically and medically effective. Further, they would have aprivate incentive to close down excess and high cost treatment systems. The possibility that the hospitals incertain regions attract a disproportionate share of resources could be avoided, if the envelope, from whichthe combined services were funded was first divided on a regional basis using a demographically-weightedcapitation scheme. To the extent current imbalances are judged to be inappropriate, special investmentfunds could be used to speed the rate at which have-not regions are able to catch up to Budapest. Specialprovisions could be made for the National Institutes and for those patients who seek treatment outside oftheir region (as they are e.g. in the United Kingdom), while the system would still be centrally managed bythe HIFA. Such a system of regional purchasers would have the additional advantage of increasing theproximity of the purchaser and provider, thereby raising the former’s ability to evaluate and influence theactivities of the latter. Ideally these regions would be small and geographically contiguous.
65. Resources for new developments and those for replacement of existing stock of capital should betreated differently. Decisions on the former should be controlled by the Ministry of Welfare while hospitalmanagers should be made responsible for the management of the existing stock of capital The variouspayments systems should be revised to include depreciation costs, but this reform must be coupled with therequirement that hospitals place these additional payments into capital funds, from which they would makefuture equipment purchases. Including the depreciation costs would realign incentives between treatmentchoices with different capital intensities, while the creation of a capital purchase fund would transferresponsibility for deciding on what equipment a hospital requires to those best able to judge, the hospital’sdoctors and administrators. Over time, it should ensure that hospitals rationalise the distribution of theircapital equipment.60
66. In this regard, a number of OECD countries have improved both the quality and efficiency ofhealthcare delivery by providing hospital administrators greater freedom to manage their institutions. In thecase of Hungary, such a change could be accomplished by changing the legal status of hospitals to that ofpublic-utility companies. This would increase the autonomy of hospital managers and reduce the currenttendency for political interference in investment decisions. It would also give possibility for the localgovernments and hospital managers to develop more efficient organisational settings and ownership formsbest suitable to local conditions (e.g. hospital mergers with joint ownership of the previous owners,developing joint ownership of a given hospital by the local governments in its catchment area, contractingout of hospital management through competition for fixed-time contracts, etc.). In addition, it would allowthem to adopt a more accurate and meaningful accounting system, promoting the more efficient use ofresources. This change in legal status of the hospitals would imply that hospital employees would nolonger be civil servants and, therefore, provide more flexibility to administrators in managing their labourforce. Here the need to increase the wages of hospital workers can be used to smooth the reform process.Except for a small sub-set of managers/specialists, funding for specialists working independently of thehospital system should be increased more rapidly than funding for those who remain hospital employees.The salary portion of current HDG points could be made explicit and would be paid to the hospital or thephysicians directly depending on whether or not the practitioner was a salaried employee. Currently, thegatekeeper function of the GPs is under-developed. In this regard, the recently-improved requirement thatreferrals be required prior to visits to specialists in some instances represents a step in the right direction.However, the list of exempted specialities needs to be reduced and the penalties for non-compliance needto be stiffened.
67. At the same time, in order to hasten the re-establishment of an equilibrium in the supply anddemand for healthcare professionals, admissions to medical schools should be dramatically reduced in linewith the 1995 calculations of the Ministry of Welfare (1995). In addition, doctors working as salaried civilservants should be required to retire from those posts when they reach the legal retirement age,61 althoughthey should be allowed to continue to work in private practice for as long as they are competent to do so.

ECO/WKP(2000)14
42
68. The introduction of depreciation payments and the integration of the three separate fundingbaskets must be accompanied by a much stricter system of accountability — legal, professional andmedical. If the reform is to successfully eliminate distortions by decentralising decision-makingresponsibility, then it must be possible to hold those making the decisions accountable for them. In thisregard, the government’s decision to crack down on the currently widespread practice of fraudulentlyover-billing for services provided should be reinforced. But more needs to be done. In practical terms, asystem of monitoring needs to be established along with systematic and random audits. The Ministry ofHealth should set norms for the incidence of HDG and outpatient procedures — using internationallyavailable data — and hospitals or clinics that exceed these should be subject to audit and be required toprove that the anomaly was medically justified or face legal penalties. The HIFA, as the administrator ofthe system, should have the right to decide on the foundation of these claims subject to appeal to the courts.
69. Over the longer term the government should consider eliminating the points-based system whichis procedure-based and includes a natural bias towards over treatment (supplier induced demand). An“Ambulatory Visit Group” (AVG) system similar in conception to the HDG would be preferable but maytake some time to develop. Alternatively it might be possible to move towards a more integrated healthcaresystem that would provide for a more active role for the general practitioner as gatekeeper. The AmericanHMO scheme and British GP-fundholder systems might constitute approaches that could be adapted to theHungarian system, perhaps after some initial small-scale or regional experiments. In general, efforts shouldbe made to increase the flexibility of the system — which to date retains a number of excessivelybureaucratic and command and control elements.
70. The conditions and rules governing the ownership, location and operation of pharmacies shouldbe relaxed as they serve no apparent economic or medical purpose but constrain competition and couldpromote corruption as entrepreneurs compete for the right to operate a pharmacy at a lucrative location.The pricing system of pharmaceuticals is excessively rigid and should be relaxed, but not until competitionwithin the distribution system is introduced. Stricter controls on the use of the 100 per cent Health Cardneed to be instituted and the computer system of the HIFA should be used to identify those who areapparently over using their cards and the doctors (if any) that are over prescribing to these people. Effortsare needed to develop guidelines for the cost-effective use of drugs and to rationalise physicianprescription habits and patient demands. Consideration should be given to scrutinising more closely thebasis upon which, in practice, fixed pharmaceutical subsidies are decided — with an eye to favouring theuse of low-cost drugs. Finally, if cost savings are a large priority, the government might consider reducingthe rates of subsidy provided on drugs or even eliminating drug subsidies for young and middle-agedadults. Currently subsidy rates are higher than the European average.
Conclusions
71. Since 1989, a number of important changes have been implemented in the Hungarian healthcaresystem particularly as concerns its macro structure. Its present framework is broadly in line with that ofother OECD countries, with the publicly funded system covering the vast majority of the population andbetween 70 and 80 per cent of expenditure. However, despite the many positive changes introduced sincethe beginning of the transition, the Hungarian healthcare system remains in serious need of reform.Hungarians have the lowest life expectancy in the OECD and, in contrast with almost all other countries, ithas been falling over the past twenty years. While this poor outcome owes much to social and economicphenomena, the effectiveness of the nearly universal national health insurance system is greatly reduced bysystemic inefficiency, perverse incentive structures and perennial over-spending in pharmaceuticalexpenditures. An overwhelming excess supply of specialists, the vast majority of whom are salaried publicservants working in hospitals, has combined with weak supervision on the part of the National HealthInsurance Fund Administration (HIFA) to yield an excessively hospital-centric and specialist-based pattern

ECO/WKP(2000)14
43
of treatment. While there is an excess supply of doctors, there are too few nurses and the wages of bothgroups are exceptionally low, the supply-side effects of which are mitigated in the case of doctors andparticularly specialists by wide-spread — but illegal — “gratitude payments”. Those general practitionersthat do exist do not act as effective gatekeepers and provide only limited healthcare services because thenumber of their patients determines their pay — not the ailments treated. Problems also plague the twopayment systems for inpatient (DRG) and outpatient hospital (points) care. Neither includes capital costs intheir fee structures leading to serious misallocations of equipment and irrational investment decisions bylocally-owned hospitals. At the same time, inadequate supervision of billing has led to a fraudulentinflation in both the number and the “seriousness” of treatments charged to the HIFA.
72. The budgetary impact of these exaggerated claims have been contained by a capping of theoverall budget of the DRG and points systems, with the result that as claims have risen the amount ofmoney paid per claim has fallen proportionately. While this mechanism (which for the DRG system wasabandoned in 1998) has kept costs under control, it has placed significant strain on hospitals. Their abilityto respond to these forces would be improved if their status were changed to “public corporations”. Such achange would reduce direct political influence on their decision making, allow them to adopt moreappropriate accounting techniques and would give them more flexibility as concerns their staff. Here anexplicit decision to increase the relative earnings of non-salaried specialists would be helpful and could beintegrated with a revision to the payments systems that incorporated depreciation costs into both HDG andpoints payments. These changes, which could be accompanied by a requirement that hospitals createspecific capital funds, from which they would make future equipment purchases, would enable hospitals(and provide them with economic incentives) to reallocate both labour and capital resources towards themost efficient and highest quality treatments. In order to redress the aggregate oversupply of doctors,admissions to medical schools should be cut and salaried doctors should be required to retire at the legalretirement age — although they should be free to continue in private practice.
73. Efforts to address these problems have been hindered by endemic conflict between the Ministryof Health (previously Welfare), the self-government of the health insurance fund, the HIFA and theMinistry of Finance who have (had) overlapping responsibilities in the financing, policy preparation andadministration of healthcare. A major challenge will be to introduce reforms in a way that reduces thesetensions and increases co-operation between agencies. The recent abolition of the self-insurancegovernment should serve to reduce some of this conflict, but any successful reform will require much moreco-operation than has been the case in the past. There does not appear to be any need to introduce a morecomplicated payment system than already exists. International experience suggests strongly that theadvantages of a single purchaser outweigh its disadvantages. As the Hungarian system already allows forsupplementary insurance, resources available to the system could be augmented and increased competitionintroduced by expanding the currently very narrow range of services not covered by the universal systemand widening the scope for co-payments. Similarly, despite the micro-level distortions that it hasgenerated, the overall budgetary cap and basic payment schemes should not be abandoned; alternativeremuneration systems provide even fewer incentives to improve efficiency and quality. Rather, thegovernment should concentrate on allowing hospitals more flexibility in choosing between in-patient andout-patient care and introduce private incentives for the closing down of excess capacities and investmentin areas under supplied. This could be achieved by introducing an equivalence scale between HDGperformance units, out-patient points and chronic-care points and by capping the total budget. Regionalequity concerns can be addressed by initially subdividing the national budget following a demographicallyadjusted per-capita formula and making special provisions for National Institutes and patients that seektreatment outside of their region. These reforms need to be accompanied by much more accountability,requiring systematic and random audits and significant financial and legal penalties imposed on institutionsand individuals found to be making medically unjustifiable charges.

ECO/WKP(2000)14
44
74. The pharmaceutical sector, as one of the uncapped areas of expenditure, is constantly in deficit.Here restrictions on the operations of pharmacies should be relaxed so that market forces can help toreduce distribution costs. While the principles by which the level of subsidy of different drugs isdetermined are sound, actual practice needs to be re-examined and subsidy levels more closely alignedwith the most cost-effective alternative therapies and efforts extended to examine the surroundingphysicians’ prescribing patterns. Once this is achieved it would be desirable to lift existing controls on theretail price of different brands of drugs. Additional cost savings could be achieved by auditing the use ofhealth cards, further reducing the rates of subsidy or even eliminating drug subsidies for young andmiddle-aged adults (except for those suffering from chronic diseases).
75. Cost pressures on the healthcare system are likely to intensify in the future, although theeconomy’s capacity to pay will also be improving. Several decades of neglect during the former politicalregime and the necessity of increasing healthcare workers’ salaries, upgrading existing technologicalinfrastructure and demographic pressures will all place upward pressure on costs. While cost containmentpolicies must be retained, it improvements in the economy’s capacity to pay should permit the quality andquantity of services provided to rise relatively quickly and to current European levels.
76. A key challenge in any reform will be to help citizens to take greater responsibility for their ownhealth by choosing healthier lifestyles and being more proactive concerning care. The transformation inattitudes can only occur slowly, but can be helped along by making full use of popular media, economicincentives (such as dissuasive taxes on “bads”) and through better co-ordination and funding of promotionprogrammes. The government should also consider developing an integrated disease-based paymentsystem along the lines of the HDG that would cover both in- and out-patient care. Alternatively it might bedesirable to experiment with more integrated healthcare systems such as the American HMO and BritishGP-fundholder systems. Finally, a wide range of quality of life healthcare services are underdeveloped inHungary. More emphasis needs to be placed on increasing home-based care, occupational- andphysio-therapy services and on making greater use of nursing-homes as opposed to chronic care hospitalbeds.

ECO/WKP(2000)14
45
NOTES
1. An earlier version of this paper served as input into the 1999 OECD Economic Survey of Hungary whichwas published in February 1999 under the authority of the Economic and Development ReviewCommittee. The authors would like to acknowledge the assistance of the Hungarian authorities andnumerous medical workers in the preparation of this paper. It has benefited from comments from BillDorotinsky, Peter Mihály, Howard Oxley, Jean-Pierre Poullier, Robert Fay and Jean-Claude Chouraqui.We would also like to thank Raoul Doquin-St. Preux who contributed invaluable technical assistance withtables and graphs, while Diane Scott, Nadine Hofman, Mee-Lan Frank and Sylvie Ricordeau providedexpert word processing. Remaining errors are our own responsibility.
2. Occupational healthcare and some part of dental care for those aged 18-60 were excluded from compulsoryinsurance in 1995.
3. The HISG, which was abolished in July 1998, had been an independent partially-elected body to whichparliament had delegated responsibility for managing the Health Insurance Fund. In 1994, it actuallysubmitted a separate budget to the parliament which had to choose between this proposal and that of theMinistry of Finance.
4. The adjustment is imposed if a doctor’s practice earns more than 2 400 points. Patients of different ageshave different points associated with them, such that a child 0-4 years old represents 4.5 points, one5-14 years old earns 2.5, individuals 15-34 years old generate 1.0 point, 35-60 year olds are worth1.5 points and individuals over 60 years of age 2.5.
5. The 64 local hospitals provide general internal medicine, general surgery, obstetrical and gynaecologicalservices as well as, to a more limited extent, neurological, psychiatric, urological, opthomological andear-nose-and-throat services. On average, they have 377 beds. County hospitals (on average 1 210 beds)provide a wider range of diagnostic and therapeutic services (besides the traditional specialities,cardiology, haematology and immunology, metabolism and endocrinology, gastroenterology, nephrology,dialysis, and perinatal intensive care, etc.). Some local hospitals with large catchment areas provided asimilar range of services. University hospitals and national institutes and clinics represent national centresof excellence for the various specialities as well as serving as supra-regional hospitals for some forms ofillness.
6. In 1998, out of 6 890 GPs, 5 675 were self-employed.
7. About 100 local governments own a hospital, but not every hospital receives capital funds each year.Support from the state budget is given only for larger investments, following application. Every two yearsa law is passed for targeted or “earmarked” investment projects of local governments including healthcare.
8. The main diagnosis and intervention, plus their combination with other acts of the same nature determineclassification within the main HDG categories. The length of stay is also taken account in determining thepayment.
9. In 1993, the value of a HDG unit ranged from 14 000 to 60 000 forints and in exceptional cases went ashigh as 100 000 forints.
10. Since 1997, institutions providing specialist care (out-patient clinics and hospitals) receive from the HIFAa so-called monthly “fixed-payment” (which is institution-specific and as an average about 15 per cent ofthe revenues of the healthcare institutions); which reduces the extent to which amount of resourcesdistributed according to performance. The introduction of the fixed-payment was intended to ensure thatthe yearly sectoral agreements on wage-increases could be implemented in every institution.
ECO/WKP(2000)14
46
11. These figures include non-healthcare expenditures of the HIFA, such as sick leave, maternity payments anddisability benefits.
12. Accumulated arrears represented 19 per cent of annual revenues in 1996.
13. In 1993 employers paid 19.5 per cent and employees paid 4 per cent of grow wages as a health insurancecontribution. The Employers’ contributions have been gradually decreased: in 1998 they were 15 per centplus 2 100 forints per month in per capita payments. In 1999 the contribution rate further decreased:employers paid 11 per cent plus 3 600 forints per month in per capita payments and employees paid 3 percent.
14. These payments were never adequate to cover the likely health costs of these individuals, even assumingthat they generated only average costs.
15. Private insurance expenditures (not included in Table 6) are estimated to equal 650 million forints (500 tovoluntary mutual funds and 150 million to private insurers).
16. The estimate of private payments including gratitude money may be somewhat low.
17. Primary care decreased by 25 per cent between 1994 and 1997, while over the same period outpatient andinpatient spending fell by 10 per cent.
18. Together with the state budget expenditures on health (which is not shown separately in the table).
19. In the last seven years the number of marketed drugs increased from 860 to 4 715. The share of importedproducts in the pharmaceuticals turnover (at consumer’s price) increased from 26 to 57 per cent between1990 and 1997. However, imported goods represent only 33 per cent share of consumption calculated onthe basis of daily therapeutic dose, while domestic products had a 43 per cent share in terms of turnoverand 67 per cent share in terms of consumption
20. Measured by the number of prescriptions filled or the number of boxes of pharmaceuticals supplied, drugconsumption appears high. However, these figures may reflect a tendency to include fewer drugs perpackage in Hungary and regulations requiring doctors to provide a separate prescription for eachmedication prescribed.
21. In line with the 89/105 ECC Directive concerning to the transparency requirements of drug reimbursementpolicies, the principles of the Hungarian drug reimbursement were published in the Welfare Gazette in1996.
22. A “health-card” is distributed by the local governments under the social assistance system and it should bedistinguished from the “insurance card” given to all insured individuals.
23. Public pharmacies must serve at least 5 000 inhabitants and may not be closer than 250 metres fromanother pharmacy (in cities) and 300 metres in towns.
24. The case of Pest county is special as Budapest provides hospital care for the majority of population livingthere. Baranya, Csongrád and Hajdu counties have medical universities which provide regional level ofcare for other counties.
25. Needs were estimated using the SANA-formula, currently used by the British healthcare system.
26. The regional division is identical to the division used for the planned Regional Healthcare Councils in1994. On the figure the individual regions are marked by the region centres.
27. Expenditures consumed by the population are calculated as the sums paid by HIFA for the services used bythe permanent residents of the region (whether or not those services were used in the given region oroutside the region).
28. The increase reflected improvements in female life-expectancy only, the life-expectancy of males fell by1.5 years.
29. In 1998, male life expectancy at birth was 66.1, while female life expectancy was 75.2 years. At age of 40it was 28.9 and 36.8 respectively.

ECO/WKP(2000)14
47
30. Across countries, life expectancy increases with income up to a certain threshold, after which more equaldistributions of income are associated with higher life expectancies. In Central and Eastern Europe infantdeath rates are well correlated with income levels, but adult death rates are more closely related to thedistribution of income (Preker and Feachem, 1995; and Bobak and Marmot, 1996, p. 423).
31. Despite the evident attractiveness of the hypothesis, there is no evidence that declining life expectanciesare associated with the economic transition or even the extent of economic disruption undergone.Preker et al.,1996) show that, although “average life expectancy at birth for males declined markedlybetween 1989 and 1993 in Hungary, Bulgaria, Russia and Ukraine” and that of women stagnated, declineswere “not universal during the early transition — contrary to what is frequently assumed — and themagnitude of changes is apparently not associated with the extent of overall socio-economic decline.Albania, Romania and Slovenia saw little change in male life expectancy, while Czech Republic, Polandand Slovakia have seen a modest improvement. All of these countries — with the exception ofCzech Republic — have suffered greater declines in real income during the transition than has Hungary”.
32. Saltzman and Figueras (1997), p.20.
33. Average consumption of fat exceeds the recommended maximum by more than 30 per cent and that ofsugars by more than 60 per cent.
34. Regression analysis indicates that spending of 5.7 per cent of GDP would be “normal” given Hungary’spresent income level.
35. Since 1980, the increase is even more stark, with a 28 per cent increase in health-sector employment,comprised of a 44 per cent increase in physicians, a 50 per cent increase in specialists and a 30 per centincrease in nurses.
36. See Chapter IV of the 1997 OECD Economic Survey of Hungary.
37. Ministry of Welfare (1995) in its so-called “Yellow book” indicates that if retirement at age 60 werestrictly enforced and graduates held to 600 a year it would be possible to bring the physician per 1 000 ratiodown to the European average of 2.6 by the year 2015.
38. Since 1994, the educational programme of nurses has been reoriented and the level of training upgraded toreflect the new needs of the health sector and European standards. The Ministry of Welfare is responsiblefor the training of practical nurses and nurse’s aides and the Ministry of Education is for registered nurses.The principal priorities of the Ministry of Welfare have been to standardise the legal and professionalcriteria for nurses and simultaneously to increase the educational level of existing staff and expand thetraining capacity. As much of a professional nurse’s training occurs outside of the classroom and differsaccording to specialisation, enrolments tend to be continuous and to follow medical requirements. As aresult, the teaching hospitals (and the local governments that own them) bear a significant responsibility indetermining supply.
39. See Table 38 (OECD, 1999).
40. In 1990, Hungary had 0.1 MRI per 1 000 people, one-eighth of the OECD average as compared with1.5 per 1 000 in 1996 or one-third the OECD average and 50 per cent of the average excluding theUnited States.
41. In 1998, the Ministry of Health launched a national campaign to upgrade the stock of x-ray machines,spending 18 billion forints by the end of 2000.
42. The statistics on healthcare outcomes probably underestimate the important positive role that healthcareplays in improving the quality of life of ill people, by limiting the deterioration of their health and byminimising the limitations placed on their everyday activities both at work and at home.
43. In 1997, two major acts were passed. The “Health Act” consolidated the changes introduced since themid-1980s, and defined the rights of patients; required conditions of service providers; and theresponsibilities of all major actors of the healthcare system. The 1997 Act on “Provisions of CompulsoryHealth Insurance” and decrees issued in December 1997 regulate access and co-payments and attempt toreinforce the role of the GP as gatekeeper.
ECO/WKP(2000)14
48
44. In private healthcare systems, the insurer’s rules are often the only objective constraint on demand. Thefree-rider problem means that an insured individual has no private motivation to restrain his insuredspending. At the societal level, the cost of insurance serves as an economic limitation, but one which inpublic systems is channelled through the political framework and emerges as various forms of supplyrestraint.
45. It was not until 1994 that the government produced a general report on the health of the population andwhen it organised a debate in parliament neither it, nor a 1997 WHO report “Investment for Health inHungary” raised much political or public interest. Local governments, generally speaking, are notconcerned about the health status of the population, only problems relating to institutions.
46. There are no comprehensive and systematic statistics available as to what percentage of GDP is devoted tohealthcare (the data provided here are OECD calculations). The Health Insurance Institute only registersdata concerning its own expenditures. The reports by the institutions, containing data on the amount offunds received from the local governments, are collected by the Information Service of the Tax Office.These data are not processed. The regulations concerning what the reports should contain and how the datashould be classified change almost every year, which makes it difficult to compare one year to the other.
47. In fact, very little is known about the unit costs of healthcare in Hungary.
48. An exception was spending on sick pay which was affected by the requirement, introduced in 1996, thatemployers pay one-third of the benefit paid out by the HIFA.
49. The excise duty on tobacco actually fell during the 1990s, from 50.9 per cent in 1990 to 40.8 in 1998 — well below the rate required by EU directives (57 per cent of the retail selling price for cigarettes of theprice category most in demand).
50. Although part of its electoral programme, the previous government failed to pass its bill on the “protectionof non-smokers”.
51 . Initially, physicians competed in an effort to attract and register as many patients as possible, but now thesystem has settled down to a stable equilibrium.
52. No referral is required for: dermatology, oto-rhino-laringology, gynaecology, surgery-traumatology,ophthalmology, oncology, urology, psychiatry, and dispensaries (psychiatric dispensaries, dispensaries forpulmonary diseases, dermato-venereological, oncological and dispensaries for alcoholics anddrug-addicts).
53. In early 1997 a new approach was taken to restructure the health service delivery: a pilot project wasinitiated in the framework of health projects financed from a World Bank loan. The ModernisationProgram intended to introduce two major functions at the regional level: strategic planning andco-ordination of service restructuring. A pilot project for reform of finance was proposed to add to theModernisation Project. According to the original proposal the region implementing the project was to begiven a regional sub-budget, separated within the national Health Insurance Fund budget, in order to ensurethat savings generated by modernisation will be kept in the region.
54. According to the Ministry of Welfare, the HIFA stopped financing 8 institutions, 8 premises, 74 wards and23 units.
55. Overall since 1990 the number of beds has decreased by 18 per cent although the resources available toeach patient (bed) increased.
56. For example, Hungary has 53 CT scanners, but only 350 000 CT exams were performed in 1996 — anumber that could probably have been performed by half as many machines.
57. In principle the price at which drugs are subsidised is determined by comparing new drugs prices withthose of similar therapeutic agents already available in Hungary as well as with the ones of the leastexpensive European drugs. Further savings should derive from the rule that bio-equivalent drugs aresubsidised a fixed amount, based on the price of the least expensive alternative product included in thegroup (health-card prescriptions account for about 10 per cent of the total prescription subsidies).
58. In 1997, total co-payments were 54.9 billion HUF, out of which 8.8 billion (16 per cent) were paid by thestate-budget on health-cards.

ECO/WKP(2000)14
49
59. Cardholders are estimated to spend 7.5 times as much on a per capita basis than the rest of the population.
60. Under this scheme, a hospital with more x-ray machines than it requires, need not replace all of them andcould use some of the depreciation money to purchase ultrasound machines or some other equipment thatis in short supply.
61. Exceptions might be necessary to apply for specialities in short supply (e.g. pathologists, anaesthetist, etc.).

ECO/WKP(2000)14
50
GLOSSARY OF ACRONYMNS
CSO Central Statistical Office
CT Computerised Tomography
DSA Digital Subtraction Angiography
HDG Homogeneous Diseases Group
HIF Health Insurance Fund
HIFA National Health Insurance Fund Administration
HISG Health Insurance Self-Government
MRI Magnetic Resonance Imaging
NPHMOS National Public Health and Medical Officer Service
PET Positron Emission Tomography

ECO/WKP(2000)14
51
BIBLIOGRAPHY
Bobak, M. and M. Marmor (1996),“East-West mortality divide and its potential explanations: proposed research agenda”, British MedicalJournal, 312, 17 February.
Hablicsek, L. (1995),“A jóléti rendszer reformjának statisztikai, demográfiai összefüggései”, Kézirat. (“Statistical and demographicissues of the reform of the welfare system”, Manuscript).
Kaló, Z. (1997),“Az angol egészségügyi területi forráselosztás magyar adaptációjának lehetõségei”, in Tanulmányok aregionális egészségügyi forráselosztásról, Soros Alapítvány Mintarégió Program, Budapest. (Possibilities ofapplication of the British regional resource-allocation methods in Hungary, in Study on regional resource-allocation, Soros Foundation).
Ministry of Welfare (1995),Program of Health Services Modernisation, October, Hungarian Ministry of Welfare, Budapest.
OECD (1994),The Reform of Healthcare Systems: A Review of Seventeen OECD Countries, Health Policy Studies No. 5,Paris.
OECD (1995), New Directions in Healthcare Policy, Health Policy Studies No. 7, Paris.
OECD (1997),Economic Survey of Hungary, Paris.
OECD (1999), Economic Survey of Hungary, Paris.
Orosz, E. (1997),Decentralization and Healthcare System Change: Hungary, Working paper, WHO EURO.
Orosz, E., G. Ellena and M. Jakab (1998),“Reforming the Healthcare System. The Unfinished Agenda”, in Public Finance Reform during theTransition: The Experience of Hungary, The World Bank, Washington.
Preker, A. and G. Feachem (1995),Market Mechanisms and the Health Sector in Central and Eastern Europe, World Bank Technical PaperNo. 293, Washington.
Preker, A., E. Goldstein, O. Adeyi, and G. Chellaraj (1996),Trends in Health Status, Health Services and Health Finance: The Transition in Central and Eastern Europe,World Bank Technical Paper No. 341, Washington.
Saltzman, R.B. and J. Figueras (1997),European healthcare reform: analysis of current strategies, WHO regional publications.
WHO (1997),Investment for Health in Hungary, The World Health Organisation.

ECO/WKP(2000)14
52
ECONOMICS DEPARTMENTWORKING PAPERS
240. Comparing semi-structural methods to estimate unobserved variables: the HPMV and Kalman Filtersapproaches(April 2000) Laurence Boone
239. New Issues in Public Debt Management: Government surpluses in several OECD countries, the commoncurrency in Europe and rapidly rising debt in Japan(April 2000) Paul Mylonas, Sebastian Schich, Thorsteinn Thorgeirsson and Gert Wehinger
238. Regulation, Industry Structure and Performance in the Electricity Supply Industry(April 2000) Faye Steiner
237. Regulation, Market Structure and Performance in Telecommunications(April 2000) Olivier Boylaud and Giuseppe Nicoletti
236. Predicting the evolution and effects of the Asia crisis from the OECD perspective(April 2000) Pete Richardson, Ignazio Visco and Claude Giorno
235. Modelling manufacturing export volumes equationsA system estimation approach(April 2000) Keiko Murata, Dave Turner, Dave Rae and Laurence Le Fouler
234. The Polish Tax Reform(March 2000) Patrick Lenain and Leszek Bartoszuk
233. The tax system in Mexico: a need for strengthening the revenue raising capacity(March 2000) Thomas Dalsgaard
232. EMU, the Euro and the European policy mix(February 2000) Jonathan Coppel, Martine Durand and Ignazio Visco
231. The tax system in Japan: a need for comprehensive reform(February 2000) Thomas Dalsgaard and Masaaki Kawagoe
230. The size and role of automatic fiscal stabilisers in the 1990s and beyond(January 2000) Paul van den Noord
229. Enhancing environmentally sustainable growth in Finland(January 2000) Ann Vourc’h and Miguel Jimenez
228. Finance and growth: Some theoretical considerations, and a review of the empirical literature(January 2000) Kotaro Tsuru
227. What the yield curves say about inflation: Does it change over time?(December 1999) Sebastian Schich
226. Summary Indicators of Product Market Regulation with an Extension to Employment Protection Legislation(December 1999) Giuseppe Nicoletti, Stefano Scarpetta and Olivier Boylaud
225. Some Issues Related to the Equity-Efficiency Trade-Off in the Swedish Tax and Transfer System(November 1999) Henning Strand

ECO/WKP(2000)14
53
224. The Economic Effects of Employment-Conditional Income Support Schemes for the Low-Paid: An Illustrationfrom a CGE Model Applied to Four OECD Countries(October 1999) Andrea Bassanini, Jørn Henrik Rasmussen and Stefano Scarpetta
223. The Use of Financial Market Indicators by Monetary Authorities(September 1999) Paul Mylonas and Sebastian Schich
222. Tax Reform in Switzerland(August 1999) David Carey, Kathryn Gordon and Philippe Thalman
221. Trends in Market Openness(August 1999) Jonathan Coppel and Martine Durand
220. Technology Upgrading with Learning Cost: A Solution for Two “Productivity Puzzles”(July 1999) Sanghoon Ahn
219. Testing for a Common OECD Phillips Curve(July 1999) Dave Turner and Elena Seghezza
218. Sustainable Economic Growth: Natural Resources and the Environment(July 1999) Paul van den Noord and Ann Vourc’h
217. Coping with Population Ageing in Australia(July 1999) David Carey
216. Estimating Prudent Budgetary Margins for 11 EU Countries: A Simulated SVAR Model Approach(July 1999) Thomas Dalsgaard and Alain de Serres
215. The Problems and Prospects Faced by Pay-As-You-Go Pension Systems: A Case Study of Greece(June 1999) Paul Mylonas and Christine de la Maisonneuve
214. Greek Public Enterprises: Challenges for Reform(May 1999) Paul Mylonas and Isabelle Joumard
213. The Levels and Cyclical Behaviour of Mark-Ups Across Countries and Market Structures(May 1999) Joaquim Oliveira Martins and Stefano Scarpetta
212. Poverty Dynamics in Four OECD Countries(April 1999) Pablo Antolín, Thai-Thanh Dang and Howard OxleyAssisted by Ross Finnie and Roger Sceviour
211. The Recent Experience with Capital Flows to Emerging Market Economies(February 1999) Sveinbjörn Blöndal and Hans Christiansen
210. Foreign Portfolio Investors Before and During a Crisis(February 1999) Woochan Kim and Shang-Jin Wei
209. Towards More Efficient Government: Reforming Federal Fiscal Relations in Germany(February 1999) Eckhard Wurzel