unclassified eco/wkp(2017)83 - oecd
TRANSCRIPT

Unclassified ECO/WKP(2017)83 Organisation de Coopération et de Développement Économiques Organisation for Economic Co-operation and Development 12-Dec-2017
___________________________________________________________________________________________
_____________ English - Or. English ECONOMICS DEPARTMENT
MAKING THE BUSINESS ENVIRONMENT MORE SUPPORTIVE OF PRODUCTIVITY IN
BELGIUM
ECONOMICS DEPARTMENT WORKING PAPERS No. 1451
By Peter Walkenhorst, Lilas Demmou and Manav Frohde
OECD Working Papers should not be reported as representing the official views of the OECD or of its member
countries. The opinions expressed and arguments employed are those of the author(s).
Authorised for publication by Alvaro Pereira, Director, Country Studies Branch, Economics Department.
All Economics Department Working Papers are available at www.oecd.org/eco/workingpapers.
JT03424625
This document, as well as any data and map included herein, are without prejudice to the status of or sovereignty over any territory, to the
delimitation of international frontiers and boundaries and to the name of any territory, city or area.
EC
O/W
KP
(20
17)8
3
Un
classified
En
glish
- Or. E
ng
lish
ECO/WKP(2017)83
2
OECD Working Papers should not be reported as representing the official views of the OECD or of its member
countries. The opinions expressed and arguments employed are those of the author(s).
Working Papers describe preliminary results or research in progress by the author(s) and are published to
stimulate discussion on a broad range of issues on which the OECD works.
Comments on Working Papers are welcomed, and may be sent to the Economics Department, OECD, 2 rue
André-Pascal, 75775 Paris Cedex 16, France.
All Economics Department Working Papers are available at www.oecd.org/eco/workingpapers.
This document and any map included herein are without prejudice to the status of or sovereignty over any territory, to
the delimitation of international frontiers and boundaries and to the name of any territory, city or area.
The statistical data for Israel are supplied by and under the responsibility of the relevant Israeli authorities. The use of
such data by the OECD is without prejudice to the status of the Golan Heights, East Jerusalem and Israeli settlements
in the West Bank under the terms of international law.
© OECD (2017)
You can copy, download or print OECD content for your own use, and you can include excerpts from OECD
publications, databases and multimedia products in your own documents, presentations, blogs, websites and teaching
materials, provided that suitable acknowledgment of OECD as source and copyright owner is given. All requests for
commercial use and translation rights should be submitted to [email protected]

ECO/WKP(2017)83
3
ABSTRACT/RESUMÉ
Making the business environment more supportive of productivity in Belgium
A favourable business environment is crucial to boosting Belgium’s productivity and inclusiveness
and to sustain improvements in long-term economic prosperity. This paper assesses the impact of the
business environment on productivity performance. Innovation management, technological diffusion,
private and public sector investment, and regulatory and competition policies all affect productivity
growth. Key challenges for Belgium include improving the effectiveness of existing tax exemptions for
R&D activities, addressing regulatory burdens on firms, improving access to finance for young innovative
firms and fostering an entrepreneurial start-up culture.
This Working Paper relates to the 2017 OECD Economic Survey of Belgium
(www.oecd.org/eco/surveys/economic-survey-belgium.htm).
JEL Classification: O31, O32, O43, R4, L5
Keywords: Belgium, productivity, innovation, technological diffusion, infrastructure, firm dynamism,
entrepreneurship, regulation in services
**********
Rendre l’environnement économique plus propice aux gains de productivité en Belgique
Un environnement économique favorable est crucial pour stimuler la productivité en Belgique et
l’inclusivité, et est le principal moteur de la prospérité économique à long terme. Ce document analyse
l’impact de l’environnement économique sur la performance de productivité. La gestion des innovations, la
diffusion technologique, l’investissement des secteurs privé et public ainsi que les politiques de
concurrence et de régulation ont tous un impact sur la croissance de la productivité. Les défis clefs pour la
Belgique incluent la modulation des exonérations fiscales en vigueur en faveur des activités de recherche-
développement afin d’améliorer leur utilisation et leur efficacité ; la réduction des charges administratives
sur les entreprises, l’amélioration de l’accès à la finance pour les jeunes entreprises innovantes et la
stimulation de la culture entrepreneuriale en matière de jeunes pousses.
Ce Document de travail se rapporte à l'Etude économique de l'OCDE de la Belgique 2017
(www.oecd.org/fr/eco/etudes/etude-economique-Belgique.htm).
Classification JEL: O31, O32, O43, R4, L5
Mots-clés :Belgique, productivité, innovation, diffusion technologique, infrastructures, dynamisme des
firms, culture d’entreprise, régulation du secteur des services

ECO/WKP(2017)83
4
TABLE OF CONTENTS
Introduction .................................................................................................................................................. 5 Strengthening innovation at the frontier ...................................................................................................... 8
Tax incentives are generally supportive of R&D investment but could be streamlined .......................... 8 Trans-regional synergies are not fully exploited .................................................................................... 11
Fostering corporate dynamism ................................................................................................................... 13 Despite a sound business environment, enterprise creation is low......................................................... 13 SMEs rely heavily on bank finance ........................................................................................................ 15 Low enterprise culture influences rates of enterprises dynamism .......................................................... 17
Enhancing technological diffusion throughout the economy..................................................................... 20 Continuing infrastructure and regulatory reforms ..................................................................................... 22
REFERENCES .............................................................................................................................................. 26
Tables
1. The productivity gap widens with distance to multinationals ............................................................ 21
Figures
1. The level of productivity is high but productivity growth has slowed ................................................. 6 2. Productivity growth has slowed continuously since the 1970s ............................................................ 7 3. R&D investment is around the OECD average .................................................................................. 10 4. Business dynamism is weak ............................................................................................................... 14 5. Administrative burdens on start-ups are substantial ........................................................................... 15 6. Venture capital could be strengthened ................................................................................................ 16 7. More should be done to foster entrepreneurship culture .................................................................... 18 8. Intellectual asset generation and commerciatisation are relatively weak ........................................... 19 9. Innovation outcomes are generally strong .......................................................................................... 20 10. The distribution of labour productivity across firms is wide .......................................................... 20 11. ICT usage in Belgian firms is comparatively high .......................................................................... 23 12. ICT adoption by enterprises varies across regions .......................................................................... 23 13. Some sectors remain highly regulated. ........................................................................................... 24
Boxes
Box 1. The decline in productivity growth is partly a composition effect .................................................. 7 Box 2. The challenge of measuring productivity ........................................................................................ 8 Box 3. Regional research support policies ................................................................................................ 12 Policy recommendations on improving the business environment ............................................................ 25

ECO/WKP(2017)83
5
MAKING THE BUSINESS ENVIRONMENT MORE SUPPORTIVE OF PRODUCTIVITY IN
BELGIUM
By Peter Walkenhorst, Lilas Demmou and Manav Frohde1
Introduction
Productivity has been a key driver of economic growth and prosperity in Belgium. GDP per hour
worked amounted to USD 63 in 2015 (in 2010 PPP), which was a third higher than the OECD average and
next only to labour productivity in Luxembourg, Norway and Ireland (Figure 1.A). The high productivity
level is the result of substantial capital deepening in the past; a highly-qualified workforce and strong
multifactor productivity (MFP), in particular in the lead manufacturing sectors: chemicals and chemical
products, and basic metal and fabricated metal products (Dumont and Kegels, 2016; Biatour et al., 2008).
However, the growth in productivity has slowed over time. A similar deceleration in MFP growth occurred
for most OECD countries, but it has been more pronounced in Belgium (Figure 1.B and C). In particular,
the 2008 financial crisis led to negative labour productivity growth rates in many OECD countries in 2008
and 2009, as companies retained workers while output declined. Belgium’s productivity briefly recovered
in 2010, but subsequently fell back and only picked up again in 2014 and 2015. A part of the recorded
productivity slowdown is related to changes in the composition of the Belgian economy (Box 1), as well as
from problems of accurately measuring quality improvements stemming from new information and
communication technology (ICT) products and services (Box 2).
Given the central importance of productivity for economic prosperity, an important challenge for
policy-makers is to identify and implement measures to lift productivity growth. Growth should also be
inclusive, so that all share in rising incomes, if it is to be sustainable in the longer term. Belgium ranks
relatively well on many of the key determinants of productivity growth such as overall business
environment, skills and innovation indicators. The recent OECD flagship report on The Future of
Productivity (OECD, 2015a) identifies two main avenues through which productivity growth can be
enhanced: creating a business environment that facilitates innovation and widespread distribution of
advanced technologies; and improving resource allocation within the economy, notably by better matching
employee skills with workplace requirements. This chapter discusses the role of various areas of the
business environment in productivity performance, including innovation management, technological
diffusion, private and public sector investment, and regulatory and competition policies.
1. Peter Walkenhorst is professor of Economics the American University of Paris. Lilas Demmou and Manav
Frohde are members of the OECD Economics Department. The authors would like to thank Piritta Sorsa,
Alvaro Pereira, Robert Ford and Olivier Durand-Lasserve from the OECD Economics Department for
valuable discussions and feedback on earlier drafts. Special thanks to Lenka Wildnerova from the OECD
Economics Department for her analysis of productivity in Belgium and to Bert Brys from the OECD
Center for Tax Policy and Administration for his comments on tax policies in Belgium. The authors would
also like to give special thanks to Pedro Herrera-Gimenez for statistical support and Anthony Bolton,
Brigitte Beyeler, Raquel Paramo and Mercedes Burgos for administrative and editorial assistance, all from
the OECD Economics Department.

ECO/WKP(2017)83
6
Figure 1. The level of productivity is high but productivity growth has slowed
Note: For Australia, Belgium, Chile, Iceland, Ireland, Japan, Korea, Mexico, Poland, Russia, South Africa, Turkey and United States, data refer to 2014 in the panel B.
Source: OECD Productivity Statistics Database; and The Conference Board Total Economy Database.

ECO/WKP(2017)83
7
Box 1. The decline in productivity growth is partly a composition effect
The productivity slowdown in Belgium began in the mid-1970s (Figure 2). Part of this slowdown is due to changes in the composition of the Belgian economy. Shift-share analysis of labour productivity growth at the two-digit industry level over the period 2000-2014 shows that the intra-industry effect, which represents productivity growth in individual industries, was higher than aggregate labour productivity growth. This suggests that industries with higher productivity growth decreased their share in total employment (Dumont and Kegels, 2016). The structural or inter-industry effect, which captures the reallocation of labour resources between industries, was slightly negative over the same period, implying an expansion of low-productivity sectors, such as non-tradable services, relative to high-productivity sectors.
Figure 2. Productivity growth has slowed continuously since the 1970s
GDP per hour worked (USD, current PPPS)
Source: OECD Productivity Statistics Database.
Another composition effect comes from labour market reforms that integrated low-productivity workers into the economy and thereby depressed average productivity (Boulhol and Turner, 2009). In 2003, the Federal government introduced service vouchers, which provide a wage cost subsidy for labour-intensive, low-skilled household work. The measure also aimed to transform previously undeclared work into regular jobs. The policy proved popular and uptake was high. Over the period 2000-2014, employment growth in “Administrative and support service activities” increased from 5% of total hours worked in the Belgian economy to almost 8%. This employment category experienced the strongest decrease in productivity growth during the period, pointing to important trade-offs between productivity and inclusiveness.
Another factor that has contributed to the deceleration of productivity growth in Belgium is population ageing. One study found that the cumulative multifactor productivity of the Belgian workforce declined by 4.5 percentage points as a result of the increase in the share of older workers in total employment (Ariu and Vandenberghe, 2014). Workers above 55 years of age were found to be almost a third less productive than their colleagues in their late 30s.
-2
-1
0
1
2
3
4
5
6
7
-2
-1
0
1
2
3
4
5
6
7
1971 1975 1979 1983 1987 1991 1995 1999 2003 2007 2011 2015
y-o-y % changesy-o-y % changes
GDP per hour worked (USD, current PPPs)
BEL EU28

ECO/WKP(2017)83
8
Box 2. The challenge of measuring productivity
Over the past decade, productivity growth has slowed markedly in many OECD countries. This broad-based decline is puzzling, since technological innovations have continued strongly. Some analysts have suggested that productivity growth may be underestimated (Derviş and Qureshi, 2016; Ahmad and Schreyer, 2016).
An important source for the underestimation of productivity is related to the fact that quality improvements in new information and communication technology (ICT) products are not fully reflected in prices or are not fully adjusted for by statistics agencies. As a result, price deflators will be biased upwards and real output will be underestimated. Second, some internet-based services, such as search engines and social media networks, are provided free of charge. Their consumption, is therefore not taken fully into account in GDP measurements, even though these services provide significant utility for consumers.
While mismeasurement cannot explain the full magnitude of the observed decline in productivity (Syverson, 2016), it is difficult to track the impact of ICT innovations and digital services. As the composition of ICT innovations shifts from hardware to software, the impact of new technologies on productivity becomes more difficult to predict and could well differ substantially across applications or sectors, by, for example raising quality in some cases while reducing costs in others. Moreover, the structural change in economies with a relative strengthening of services sectors might amplify mismeasurements if quality adjustments for digital inputs used in these services are not properly captured. Thus, statistics experts and analysts should pay close attention to the digital measurement challenge in order to maintain high quality productivity data.
Strengthening innovation at the frontier
One key determinant of productivity growth is the extent to which new products, processes and
organisational know-how are developed by frontier firms. Public policy has a key role to play in this
context. In particular, strengthening firm-level innovation and investment in research often requires public
financing of basic research to support the continued emergence of breakthrough innovations. Moreover,
public entities can frequently act as catalysts for collaboration between firms, research labs, and
universities.
Tax incentives are generally supportive of R&D investment but could be streamlined
The European Innovation Scoreboard 2016 classifies Belgium as a “Strong Innovator”, with a
normalised score of 0.6. This falls short of the 0.7 of top ranked Sweden and Denmark, but exceeds
the EU28 average of 0.52. Investment in intangibles such as research and development (R&D) is important
to boost productivity (Andrews et al., 2015). At 2.5% of GDP in 2014, Belgium’s gross spending on R&D
was higher than both the EU and OECD averages (Figure 3.A), but fell short of the Lisbon target of 3%.
Publicly financed expenditure on R&D has been expanding by an annual average growth rate of 7%
since 2008 and amounted to 0.72% of GDP in 2013, exceeding the OECD average of 0.61%.
Most R&D occurred within manufacturing, notably through firms in the pharmaceuticals, chemicals
and bio-tech sectors, and more than half of all business enterprise R&D (BERD) was carried out by foreign
affiliates (Figure 3.C). However, not all R&D is necessarily concentrated in large firms. Firms below 250
employees accounted for 35% of all BERD in Belgium in 2011(OECD, 2013a). The share of gross
domestic expenditure on R&D (GERD) that is financed by the business sector has declined over the past
two decades (Figure 3.B). Business expenditure on R&D tends to be concentrated in firms that are already
highly productive and want to stay at or reach the technological frontier (Andrews et al., 2015, Figure 3.C).
Therefore, the challenge for Belgian policy-makers is to induce more such firms to expand their investment
in R&D intangibles.

ECO/WKP(2017)83
9
The federal and regional governments have launched a number of programs to foster firm-level R&D
and innovation. Science, technology and innovation are largely a sub-federal responsibility. Scientific
research is mainly a Community competence, whereas innovation is almost entirely a regional
responsibility. Following consecutive state reforms which devolved many spending areas, around 80% of
total public R&D and innovation support derives from the communities and the regions. The remaining
part of support consists of resources from EU projects or federal initiatives. The latter are related to a
partial exemption of withholding tax on researchers’ wages, tax deductions on investments that stimulate
R&D and innovation, and tax deductions on patent income. The Federal government also retains
responsibility for research infrastructure of national interest, several scientific institutes, and a small
number of research programmes (climate change, nuclear energy, space policy and polar research). It also
sets the framework conditions in areas such as intellectual property rights, normalisation, standardisation,
and scientific visas.
The tax credit system is being reformed. Since 2008 firms have been entitled to an 80% tax deduction
on income from patents. This patent box regime was abolished in July 2016, with a five-year
grandfathering period for patent applications submitted before 1 July 2016. The objective was to bring the
new regime in line with the OECD G20 minimum standards of a “modified nexus approach”, which
requires substantial activity in IP regimes (OECD, 2014). Furthermore, a new innovation income
deduction regime has recently been approved aiming to widen the scope of qualifying innovation income
(such as licenses and exclusive rights), while restricting deductibility according to the “Nexus” rules. In
this context, the authorities should make sure, for example through careful monitoring, that a strong link
between the tax incentive and R&D spending is established and that the support granted is not merely used
by firms as a tax planning tool.
Another incentive scheme consists of deductions for R&D-related investments and patents.
Investments in assets that promote R&D and advanced technologies that are environmentally friendly, as
well as investments in R&D that result in self-developed patents or in the acquisition of patents, benefit
from a 13.5% tax deduction on the investment value. The deduction can be carried forward for an
unlimited period. Alternatively, the support can take the form of an R&D tax credit, which offers the same
tax benefits as the investment deduction, but the part which is not used after five years is refunded. Other
OECD countries operate similar R&D tax credit programmes, with some, such as the French Crédit
d'impôt recherche (CID), providing a tax credit of up to 30% of R&D expenses (up to EUR 100 million),
while other countries are far less generous than in Belgium. Overall, Belgium provides the most generous
R&D incentives in the OECD (OECD, 2016a).

ECO/WKP(2017)83
10
Figure 3. R&D investment is around the OECD average
Note: For Australia, Canada, Ireland and Turkey, data refer to 2014.
Source: OECD, Main Science & Technology indicators; and OECD, Science, Technology and Innovation Outlook 2016.

ECO/WKP(2017)83
11
Federal authorities also support R&D by allowing firms to recover up to 80% of the withholding tax
on professional wages for their researchers, providing certain conditions are met. In particular, there is an
upfront reporting obligation on the nature and duration of research projects to the Belgian Science Policy
Office (BELSPO). The partial exemption of wage withholding tax on researchers’ salaries corresponds
well to the principle that R&D incentives should be focused on those types of expenditures that bring about
strong knowledge spill-overs (Straathof et al. 2014). Also, tax incentives related to R&D wages generally
tend to have low administration and compliance costs.
Trans-regional synergies are not fully exploited
The regions and communities have developed their own complementary set of research-support
policies, which were slightly expanded after taking over additional responsibilities for some R&D
activities upon the Sixth State Reform of 2012-2014 (Box 1.3). Regional and community R&D promotion
policies largely consist of direct support and thereby complement the indirect support (tax incentives)
provided by federal authorities. This is a welcome policy practice (Appelt et al., 2016). Key policy
frameworks for R&D support are provided in the Flemish Region’s Governing Agreement (2014-19) and
Policy Note 2014-2019, the Walloon Region’s Marshall Plan 4.0 (2015-19), and the Brussels-Capital
Region’s Regional Innovation Plan (2015-20). In 2013 total R&D expenditure by region varied from
2.85% of GDP in the Walloon Region to 2.52% in the Flemish Region and 1.52% in the Brussels-Capital
Region. Several structural factors explain the relatively weak R&D intensity in the Brussels-Capital
Region: the strong presence of low-skilled services activities, the scarcity of high and medium-technology
manufacturing industries, and the weak representation of corporate headquarters of industrial companies,
which are often located in the other Belgian regions or abroad (Kalenga-Mpala and Wautelet, 2016). In
Flanders and Wallonia, private sector R&D spending relative to GDP exceeds the EU28 average, while the
share of publicly funded R&D in GDP is below the EU average. In the Brussels Capital Region, the
reverse is the case.
The regional innovation programmes provide considerable variety in terms of support activities. The
authorities are aware that too large a fragmentation of programmes and executing agencies could be
detrimental to transparency and cost efficiency. For example, Flanders commissioned an evaluation of its
innovation support landscape (Soete, 2012) and has consolidated its activities based on the assessment’s
recommendations. As of 2016 there is a single agency for all business support and a single agency for
researchers’ support in the Flemish region. Also, the agreement on the inter-university attractiveness poles
between the French and the Flemish Communities is a good example of cooperation. The French
Community and the Walloon Region decided to establish a common roadmap in the context of
the European Research Area (ERA) framework. Such cooperation has led to more coherence between
similar programmes offered in different regions (EC, 2016a). Going forward, continued streamlining of
programmes within each region and more developed cooperation between regions and with communities
would strengthen the efficiency of regional support for innovation (EC, 2016b). The Flemish Region, the
Brussels-Capital Region, and the federal authority have also drafted their own ERA roadmaps.

ECO/WKP(2017)83
12
Box 3. Regional research support policies
The Flemish authorities have established a number of R&D funding options. Feasibility studies are eligible to receive funding for up to 50% of costs, with a ceiling of EUR 50 000; SME innovation projects are eligible for up to 45% for small enterprises and 35% for medium-sized enterprises (with a ceiling of EUR 250 000). The development of new innovative products are eligible for 25% for development activities, and 50% for industrial research activities (with a ceiling of EUR 250 000). Projects to gain new knowledge to realise an important innovation are eligible for 25% (with a ceiling of EUR 250 000); and pre-doctoral researchers can obtain a 50-60% fellowship for up to four years if they co-operate with private companies in a specific sector.
In the Walloon Region, financial support is granted for feasibility studies, covering between 40 and 75% of expenses incurred by external service providers; basic industrial research is eligible for funding of up to 50% expenses; applied research or technological development is eligible for funding for between 50 and 75% of admissible research costs; patent registrations may receive financial aid of between 35 and 70% of registration costs; and managerial costs of enterprise spin-offs may receive support for the first two years.
In the Brussels-Capital Region, the creation of new companies (spin-offs) is supported with grants of 25-75%; industrial research projects can receive financial aid of 50-70% of eligible costs; participative research and social innovation for urban resilience can benefit from support of between 25% and 70% of outlays; experimental development projects can receive grants of 25-45% or advances of 40-60% of eligible expenses; implementation of process innovations is supported with 15-35% of the costs; the preparation of feasibility studies can be subsidised by 50-75%, and 35-70% of the costs of obtaining and validating patents can be financed by the region
The regions also provide support to innovators by nurturing innovative economic clusters, simplifying
government aid procedures, and reducing administrative burdens. These initiatives differ in line with
regional characteristics and policy priorities. For example, industrial cluster promotion is among the main
policy aims in the Flemish and Walloon Regions, while cluster policies are more focused on services in
Brussels. All the cluster programmes seek to form or reinforce networks among public and private entities,
including companies, universities, polytechnics, training organisations, and research centres, with the aim
of stimulating project partnerships and innovative value chains in areas in which the regions already have
some potential.
Flanders has adopted a smart specialisation strategy that prioritises support for eight different
domains: sustainable chemistry, specialised manufacturing solutions, personalised cure and care, value-
added logistics, specialised agro-foods, an integrated building-environment-energy cluster, and new ICT
platforms. In the Walloon Region, support is available through the region’s Marshall Plan for six
competitiveness clusters: transport and logistics; aerospace; green chemistry and durable materials;
biotechnology and health; food; and mechanical engineering. In the Brussels-Capital Region, there are five
clusters: eco-construction; biotechnology, pharma and medical activities; software production; audio-
visual production, post-production and distribution; and green technologies. Three of these clusters
correspond to the region’s smart specialisation priorities; namely personalised medicine, green economy,
and digital economy. Also, all regions provide overarching frameworks in accordance with the EU’s Small
Business Act to foster entrepreneurship, simplify the regulatory and policy environment for SMEs, and
remove barriers to their development. In 2016 Flanders introduced a “New Cluster Policy” based on two
types of clusters: small-scaled innovative business networks (fourteen of which were approved for public
support), and on the other hand spearhead clusters (at present five have been approved, namely in the
domains of sustainable chemistry, logistics, materials, energy and agro-foods).

ECO/WKP(2017)83
13
In 2014, the Walloon Institute for Evaluation, Prospective and Statistics published a set of
recommendations for the future development of the region’s cluster policy based on a detailed evaluation
(Iweps, 2014). Some of the key suggestions for improvement included the need for better coordination of
cluster activities with other governmental programmes, stronger monitoring of cluster projects and their
impact, improved integration of training components in other cluster activities, and stronger emphasis on
marketing and consumer-orientation. Similar evaluations of the cluster programmes in the other regions
could help inform the policy-making process.
Fostering corporate dynamism
Despite a sound business environment, enterprise creation is low
Young firms often have an advantage in commercialising radical innovations (Baumol, 2002), and a
vibrant start-up culture is conducive to high productivity growth. The World Bank’s Doing Business 2017
report ranks Belgium 17th out of 190 countries for starting a business (WB, 2016a), making it the 9th best
ranked OECD country. Belgium scores better than the OECD average for procedures, and time and costs to
start a company. Belgium also scores well for bankruptcy procedures, another requisite for a strong start-up
culture (Calvino et al., 2016). In “resolving insolvency” Belgium ranks 10th out of 190 countries and 9th
among OECD countries.
Despite the Relative ease at which a firm can be established (and shut down), Belgium, somewhat
surprisingly, had the lowest enterprise birth and death rates among all EU15 countries in 2014
(Figure 4.A). On the other hand, Belgium has the highest average post-entry employment growth of
surviving entrants (over a seven-year period following establishment) among all participating countries in
the OECD’s Dynemp project (Figure 4.B), suggesting that once established, firms tend to prosper.

ECO/WKP(2017)83
14
Figure 4. Business dynamism is weak
Note: Average post-entry growth defined as the ratio of total employment at t+3 to total initial employment of surviving entrants.
Source: European Commission and; Calvino et al. (2016).
The low birth and death rates might be related to the dominating presence of large, established firms,
which do not leave sufficient space for newcomers (Calvino et al., 2016), while the strong post-
establishment growth may reflect the generally favourable business environment. Yet, some aspects of the
regulatory framework could be improved. In particular, high minimum capital requirements may act as a
financial barrier to start a business. Another area where Belgium’s performance is relatively weak is
“enforcing contracts”: the country ranks 50th overall and is number 23 among OECD countries mainly due
to low scores for court automation and case management (WB, 2016a).
To encourage start-up enterprises, the Federal government is implementing measures within its
“SMEs plan” of February 2015 to reduce the administrative costs associated with firm registration by 30%,
for example by creating a single administrative contact for SMEs, the Banque-carrefour des Entreprises,
and systematically disseminating information and tender documents to SMEs that have expressed interest
in certain types of tenders. These efforts reduce the comparatively high administrative burdens on start-ups
(Figure 5). Federal initiatives are complemented by regional efforts to simplify administrative procedures
for SMEs and rationalise business support services, notably by establishing single contact points for all
administrative procedures.

ECO/WKP(2017)83
15
Figure 5. Administrative burdens on start-ups are substantial
Barriers to entrepreneurship, administrative burdens on start-ups, 2013
Source: OECD, PMR indicators database.
Some elements of the Belgian tax system might hamper growth of young firms and discourage firm
creation. In particular, as many other countries, Belgium exempts small companies from registration for
value added tax (VAT) to simplify tax procedures and lower administrative costs. However, the threshold
from which registration is required is relatively low, and, across EU countries, low VAT thresholds are
associated with low rates of business entry (IMF, 2016). The Belgian authorities are aware of the
potentially detrimental impact of a very low VAT registration threshold raising it to EUR 25 000 as part of
the reforms of the “SMEs plan” of 2015.
SMEs rely heavily on bank finance
While access to finance is not a significant impediment to the business sector at the macro level
(WB, 2016a), young innovative firms face financing constraints, particularly in the scale-up phase, and
SMEs more broadly rely heavily on banks. In 2014, the Belgian Federal Public Service of Economy,
SMEs, Self-employed and Energy conducted a survey on the financing of SMEs (SPF Economie, 2015).
The results indicate that firms below four years of age are far more dependent on bank loans than older
companies, who can draw on retained earnings to finance their operations. About 68% of Belgian start-ups
applied for bank loans in 2014, but only one-third of the total applications were approved. For firms older
than four years, the approval rate was 83%. According to a European Central Bank (ECB) survey, in
both 2015 and 2016 roughly 35% of Belgian SMEs reported having applied for a bank loan during the past
six months, which is among the highest rates in the EU (ECB, 2015; 2016).
The heavy dependence on bank finance makes the SME sector vulnerable to downturns. Although
there was no credit crunch, increased risk-aversion led banks to tighten credit standards for SMEs during
the crisis years of 2008 and 2009 (Piette and Zachary, 2015; Wilson and Silva, 2013). To broaden the
range of funding options the government could promote the use of small-scale debt instruments and
securitised receivables. Such instruments would allow SMEs to access capital markets directly without
obtaining a credit rating or preparing a prospectus (HLEG, 2016). High quality securitisation of SME loans
(and other liabilities such as leasing) can be used as a market-based shortcut to indirectly promote SME
financing, without the complete disintermediation of banks (Nassr and Wehinger, 2015). Private
placements also offer an alternative to public corporate bond issuance, providing a source of funding

ECO/WKP(2017)83
16
without the need for a formal credit rating or reporting requirements common for other capital market debt
products (OECD, 2015c).
Increased integration through the Capital Markets Union could also help diversify Belgian capital
markets. In this context, the government is supporting private equity finance for SMEs to strengthen the
provision of venture capital (Figure 6) and improve access to finance for start-ups. Closed-end investment
funds (“Pricafs Publiques”) that raise a fixed amount of capital through an initial public offering and are
listed on the stock exchange have been in existence since 1997. However, substantial disclosure and
transparency requirements have deterred many SMEs from using publicly listed funds. Less stringent
listing rules and requirements for small equity issuers could allow for more affordable transaction and
regulatory costs for small equity issuers without undermining investor protection and market integrity
(Nassr and Wehinger, 2016). Moreover, stringent regulations on dividend pay-outs and portfolio
management often made the funds unattractive to investors, so that only one such fund (“Quest for
Growth”) remained in existence by mid-2016.
In August 2016 new legislation was introduced to bolster the development of Pricafs Publiques.
In particular, the obligation to pay an annual dividend was dropped and fund managers were granted
greater flexibility in shaping investment portfolios. For instance the share of funds that have to be invested
in unlisted firms with a market capitalisation of less than EUR 1.5 billion was reduced from 100% to 70%.
Figure 6. Venture capital could be strengthened
As a percentage of GDP, 2015
Source: OECD, 2016d.
The authorities run a range of other initiatives to improve funding for SMEs. Guaranteed loans and
guarantees given by public sector entities partially offset negative growth rates in the stock of loans from
banks to businesses in 2009 and 2013 (OECD, 2016b). Moreover, since 2003 privately-held Pricafs Privés
(managed financial funds) have provided unlisted SMEs with an alternative source of risk capital. These
funds allow investors to benefit from professional management and risk pooling without incurring a fiscal
penalty compared to direct investments. By the end of 2016, 42 Pricaf Privés were registered with the
Finance Ministry.
In July 2015 the federal authorities introduced a new tax shelter for start-ups and small enterprises
less than 4 years old. Under this scheme, individuals investing in a start-up company can obtain an income

ECO/WKP(2017)83
17
tax reduction of 30% of an investment in an SME, and of 45% for an investment in micro-enterprises. A
person can benefit from this tax-shelter for investments up to EUR 100 000 per year, with a cumulative
investment ceiling of EUR 250 000. The investments can be made either directly or indirectly through a
crowdfunding platform, but have to be held for at least four years. In addition, start-up labour costs are
being reduced during the first years of operation, with the young companies being exempted from payment
of 10-20% of the withholding tax applied to wages. Also, digital goods, such as payment systems and
cyber-security, benefit from a tax exemption of 13.5% of the invested amount.
The federal efforts to improve access to finance for start-ups and SMEs are supplemented by regional
initiatives. In particular, all regions offer financial assistance to regional business angel networks
(“beangels” in the Brussels-Capital Region and the Walloon Region; “Business Angels Netwerk” in the
Flemish Region). Furthermore, the Flemish Region has been offering win-win-loans (“winwinleningen”)
since 2006. Under this scheme, investors in SMEs can deduct 2.5% of any outstanding loan volumes from
their income tax. An SME can borrow up to EUR 200 000 under the facility. In April 2016 the Walloon
Region introduced a similar scheme (“Prêt coup de pouce”), which differs in some aspects. Support is
limited to start-ups for a duration of up to eight years, and the ceilings are set at EUR 100 000 per firm
and EUR 50 000 per lender. Individual lenders benefit from a tax deduction of 4% of the invested amount
during the first four years and 2.5% thereafter. However, while regional authorities have taken steps to
simplify support schemes and make them more accessible to firms, better coordination between different
government entities could reduce information and search costs for SMEs and help ensure a more efficient
allocation of available funds (HLEG, 2016). In addition, a more neutral tax treatment of income from
savings deposits could improve the effectiveness of existing tax incentives for retail investors-based SME
financing.
Evidence increasingly suggests that firm age, and not necessarily firm size, is the most decisive factor
for net job creation and productivity growth (OECD, 2015a). Also, size-based taxes and social security or
labour advantages may create disincentives for companies to grow, thereby creating a small business trap
(IMF, 2016). In this context, the more focused support provided in the Walloon Region is welcome, and
the Flemish authorities might want to consider targeting their tax deductions more directly at start-ups and
young firms.
Low enterprise culture influences rates of enterprises dynamism
Recent empirical work found that with respect to the regulatory framework, market conditions, access
to finance, and entrepreneurial capabilities, Belgium scores favourably in comparison with the EU average
(De Mulder and Godefroid, 2016; OECD, 2015d). However, Belgium comes last in terms of enterprise
culture, which captures factors like job prestige and risk aversion (Figure 7). These findings suggest that
the authorities should continue to strengthen entrepreneurship education and better inform young graduates
about the nature and opportunities of private business. Case study evidence from initiatives to foster a more
entrepreneurial culture in East Germany also suggest that the creation of identifiable role models and
champions, as well as the establishment of mentor and patron panels of retired business people that counsel
company founders can be beneficial (Bergmann, 2007). Regional authorities could thus consider
expanding existing mentor programmes.

ECO/WKP(2017)83
18
Figure 7. More should be done to foster entrepreneurship culture
Relative performance to the EU, 2009-15
Note: Lower scores indicate lower performance. Scores are expressed relative to EU average equal to zero for each indicator. For EU, data refer to the unweighted average of scores calculated for Austria, Belgium, Denmark, France, Germany, Greece, Ireland, Italy, Luxembourg, Netherlands, Portugal, Spain and Sweden.
Source: De Mulder and Godefroid, 2016; OECD, 2015d.
One innovation area where Belgium does not score well relative to the EU average is patenting
(Figure 8). This finding may to some extend reflect Belgium's industrial structure, which is not focused on
high-tech activities. To encourage potential innovators to undertake research and development, effective
protection of intellectual property rights is important. Belgium ratified the regulation concerning
the European Patent with Unitary Effect in June 2014, and are considering establishing a local division of
the Unified Patent Court in Brussels that works in English as well as in the national languages.
The European patent provides firms with an opportunity to obtain legal protection for their innovation in
the 26 participating EU countries without applying for protection in each individual member state. This
reduces costs and administrative work involved with patent filing. Belgium also implemented the London
Agreement on the application of Article 65 of the European Patent Convention by the Act of 29/6/2016 by
removing the requirement to provide a translation to a national language of a European patent granted in
English from the code of economic law and from other legislation.

ECO/WKP(2017)83
19
Figure 8. Intellectual asset generation and commercialisation are relatively weak
Relative performance to the EU, 2015 or latest available
Source: European Commission, European Innovation Scoreboard, 2016.
Belgium also scores relatively poorly in commercialisation of new products (“sales share of new
product innovations”). Commercialisation of public research can occur through several channels, including
patents, licences, and spin-offs, as well as collaborative research, researcher mobility and contract research
(OECD, 2013a). All major research universities and research centres in Belgium have technology transfer
offices that act as liaisons between researchers, companies and public authorities. In particular, they are
responsible for the protection of intellectual property, the transfer of technologies to private firms and the
creation of spin-off companies. However, the evaluation of the competitiveness clusters in the Walloon
Region (Iweps, 2014) suggest that many R&D projects focusing on the commercialisation of their output
too late thereby insufficiently implicating potential customers in the process. On the other hand, some
Belgian research institutions, such as KU Leuven, rank among the most innovative research outlets in
Europe.
Belgium performs well in terms of innovation outcomes. This is particularly the case for product and
process innovations, where all three regions score well above the EU average (Figure 9). The Brussels-
Capital Region scores relatively poorly in new-to-market innovations, but this outcome can be attributed to
its economic structure, which is heavily dominated by services and lacks manufacturing firms.

ECO/WKP(2017)83
20
Figure 9. Innovation outcomes are generally strong
Relative performance to the EU, 2012
Note: Data for 2012.
Source: innovationdata.be, Scientific and Technical Information Service, Belgian Science Policy Department.
Enhancing technological diffusion throughout the economy
Strong, broad-based productivity growth requires that technological and organisational advances
made by innovators are widely diffused to other firms in the economy. However, while a small share of
Belgium firms have productivity levels that are among the highest in Europe, many others are far less
productive (Figure 10). While a high dispersion of productivity levels across firms is not unique to
Belgium (Verschelde et al., 2014), the difference between the productivity levels of the mean and median
firms is unusually large.
Figure 10. The distribution of labour productivity across firms is wide
Real value added per employee averaged, 2007-13
Source: CompNet, 2016.

ECO/WKP(2017)83
21
One explanation for the inter-firm diversity in productivity performance is the level of integration in
global value chains. Belgium has been very successful in attracting inward foreign direct investment (FDI),
with the FDI-to-GDP ratio amounting to 98% in 2016, compared to an average of 37% for the OECD.
Belgium has a large presence of so-called coordination centres, which finance the international activities of
multinational groups. While multinationals represent only 1% of all firms registered in Belgium, they
account for 38% of the country’s value-added and 29% of private sector employment (Duprez and Van
Nieuwenhuyze, 2016), as well as more than 60% of all R&D spending (Figure 3). Moreover, innovations
at the global frontier tend to be quickly adopted by multinationals and dispersed to their affiliates around
the world. Also, survey results indicate that 37% of all multinationals in Belgium invested in R&D
in 2013, compared with only 8% of non-exporting firms (NBB, 2016a). Thus, domestic companies that
have direct commercial relationships with multinationals can benefit from their innovation through spill-
over effects. Indeed, recent research shows that the productivity gap to frontier firms increases with the
distance to multinationals (OECD, 2015a, NBB, 2016a). A firm that supplies intermediate inputs or
services directly to a multinational has a productivity level that is 28% below the multinational itself, while
the gap is 44% for a company without either direct or indirect exposure to a frontier firm (Table 1).
Table 1. The productivity gap widens with distance to multinationals
(Difference in productivity level with respect to multinational firms)
Firm type Gap
1st rank domestic suppliers -27.6%
2nd
rank domestic suppliers -35.9%
3rd
rank domestic suppliers -45.3%
Other domestic firms -44.4%
Note: A 1st rank domestic supplier is a Belgian firm that supplies intermediate inputs to at least one multinational. A i-th rank domestic
supplier is a Belgian firm that does not supply a multinational, but that supplies (i-1)th rank domestic suppliers
Source: NBB, 2016a.
As in many other countries, the number of export firms is relatively small. Less than 5% of enterprises
sell their products abroad and almost half of these firms export less than 10% of their total turnover (Dhyne
and Duprez, 2013). However, if indirect exports, i.e. providing inputs for downstream exporters, are taken
into account the share of export firms rises to 82%, with about 10% of firms exporting more than a quarter
of their production. In Belgium, a high degree of specialisation and integration into long supply chains
with many separate production stages is associated with higher MFP growth of participating firms (Dhyne
and Duprez, 2015). The results also indicate that the positive effects on productivity are not evenly
distributed along the production chain, with firms closer to the end-consumer generating more value added,
as they often have larger pricing power. Belgium’s strong export sectors, including chemicals and metals,
tend to be in intermediate products rather than consumer goods, so that only a part of total exports benefit
from the progressive supply chain effect.
To foster supply chain integration, Belgium maintains an open trade regime and has less stringent
regulation than the OECD average in 20 out of 22 sectors according to the OECD’s Services Trade
Restrictiveness Index (OECD, 2017a). However, in accounting, auditing and architectural services
ownership restrictions impede international integration. In companies providing auditing and accounting
services, 50 % + 1 of the voting rights must be owned by locally registered professionals. In companies
providing architectural services, 60% of the voting rights and equities must be owned by locally registered
professionals. These rules apply equally to Belgian and foreign nationals. For EU nationals, the rules of
recognition of qualifications of directive 2005/36/EG are applicable. The conditions for access of legal
persons to economic and intellectual professions such as architects and accountants are currently being
reviewed. In addition restrictions on the movement of people (for example, duration of stays are limited to

ECO/WKP(2017)83
22
6 months for non-EU service suppliers) impede international integration. The authorities should continue
to promote trade openness, international connectivity and mobility of highly skilled labour to achieve more
pervasive GVC integration of domestic firms.
Continuing infrastructure and regulatory reforms
Global production chains require strong transport and logistics networks to effectively move goods
and people. Belgium ranks sixth out of 160 countries in the World Bank’s Logistics Performance Index
(WB, 2016b). However, dearth of public investment has meant that the quality of some types of
infrastructure, in particular the road and rail networks, is deteriorating and is only slowly adjusting to
changing needs. In 2006/07, the World Economic Forum ranked Belgium 10th in the world for the quality
of roads, by 2015 it had dropped to 30th (WEF, 2016). The Inrix 2015 traffic scorecard, which is based on
real-time monitoring of average speeds and traffic volumes in more than 100 metropolitan areas in the
United States and Europe, ranked Belgium as the European country with the worst congestion. Out of the
five worst affected urban centres in Europe, two are Belgian (Antwerp and Brussels), with commuters on
average spending 70 hours or more in traffic per year. These congestion costs discourage FDI and the
inflow of highly qualified professionals. In addition to improving public transport the authorities should
prioritise public investment in road infrastructure around the major agglomerations.
Some promising infrastructure investment initiatives have already been initiated. In April 2016 the
regions, which have the authority over the road system, introduced a new toll on heavy trucks. The levy is
charged for using motorways, as well as a number of regional and municipal roads. The proceeds of the
charges are used to finance road maintenance. The authorities might want to explore whether such user
fees could also be introduced for other infrastructure services, such as the rail network, to help fund upkeep
and avoid further deterioration of the existing infrastructure stock.
In April 2016 the government of the Brussels-Capital Region approved a multi-annual investment
plan to renovate the tunnels in the region. The investment plan foresees annual outlays of EUR 50 million
to EUR 60 million over a period of 15 years. In March 2017, the Flemish government approved a
EUR 3.6 billion investment plan for the period 2017-23 to complete the Oosterweel Junction.
One welcome development in traffic management is the development of a Regional Express Network
(Réseau Express Régional/Gewestelijk Expresnet) around Brussels. This mobility solution, which began in
December 2015, aims to integrate different modes of public transport, notably trains, subways, trams and
buses, to reduce congestion. The approach could be usefully extended to other urban areas.
Belgium invested 2.7% of its GDP in ICT in 2013, just below the OECD average. According to
the EU’s Digital Economy and Society sub-index on integration of digital technology, which measures the
digitisation of businesses and their exploitation of online sales channel, Belgium ranks fourth among the
28 EU countries (Figure 11). Results from the underlying enterprise survey of 4 500 firms show that
broadband usage was almost universal in Belgium by 2016, and that more than two-thirds of all companies
had an internet presence. However, there is some regional diversity in ICT adoption. In particular, the use
of internet and e-commerce facilities was on average somewhat lower in the Walloon Region than in the
Flemish Region and the Brussels-Capital Region (Figure 12).

ECO/WKP(2017)83
23
Figure 11. ICT usage in Belgian firms is comparatively high
EU’s Digital Economy and Society sub-index on integration of digital technology, 2016
Source: EC, 2017.
Figure 12. ICT adoption by enterprises varies across regions
As a percentage of all enterprises, 2016
Source: Statistics Belgium.
In April 2015, the Federal government launched a new medium-term action plan “Digital Belgium” to
further strengthen ICT usage. It strengthens the digital economy, develops digital infrastructure, fosters
digital skills and jobs, enhances digital security and confidence, and facilitates digital government. The
plan contains three numerical objectives that are to be achieved by 2020: move into the top 3 in the EU’s
ranking according to the overall Digital Economy and Society Index (up from 5th place in 2016); create
50 000 new jobs in sectors related to the digital economy; and help foster 1 000 start-ups.
New models of doing business based on innovative internet platforms, such as ride-sharing or
accommodation renting, have developed rapidly in recent years. These new service providers often offer
ECO/WKP(2017)83
24
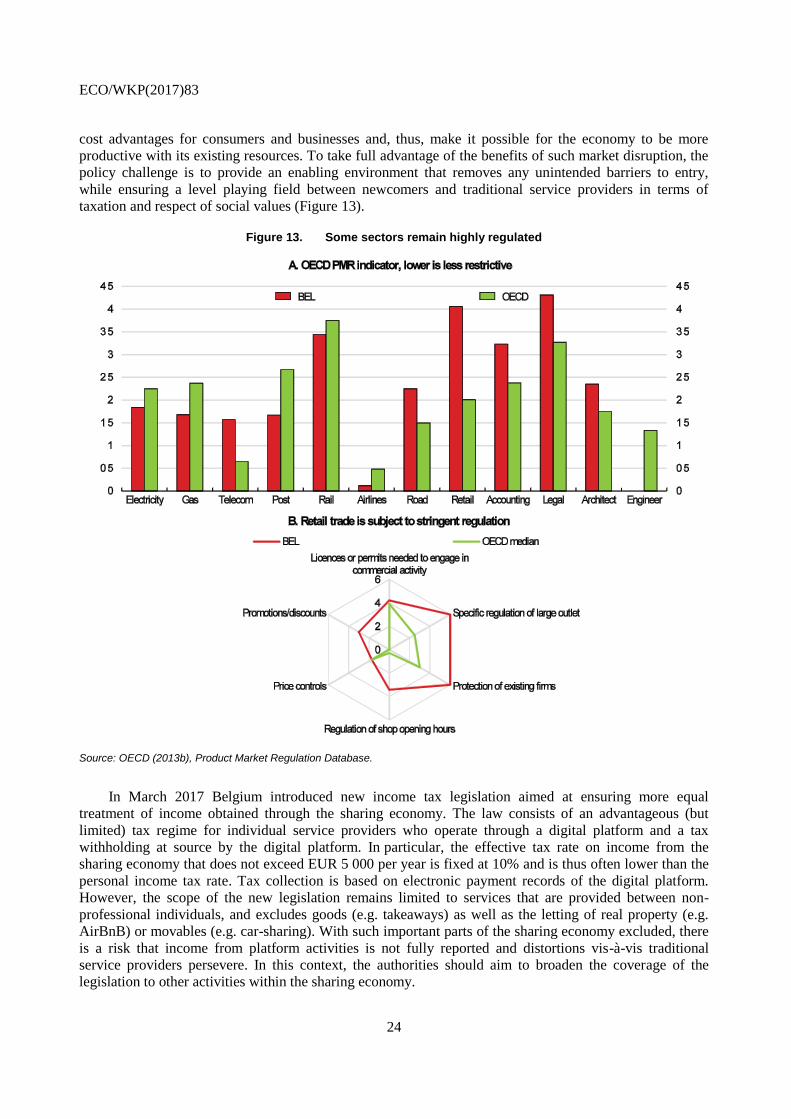
cost advantages for consumers and businesses and, thus, make it possible for the economy to be more
productive with its existing resources. To take full advantage of the benefits of such market disruption, the
policy challenge is to provide an enabling environment that removes any unintended barriers to entry,
while ensuring a level playing field between newcomers and traditional service providers in terms of
taxation and respect of social values (Figure 13).
Figure 13. Some sectors remain highly regulated
Source: OECD (2013b), Product Market Regulation Database.
In March 2017 Belgium introduced new income tax legislation aimed at ensuring more equal
treatment of income obtained through the sharing economy. The law consists of an advantageous (but
limited) tax regime for individual service providers who operate through a digital platform and a tax
withholding at source by the digital platform. In particular, the effective tax rate on income from the
sharing economy that does not exceed EUR 5 000 per year is fixed at 10% and is thus often lower than the
personal income tax rate. Tax collection is based on electronic payment records of the digital platform.
However, the scope of the new legislation remains limited to services that are provided between non-
professional individuals, and excludes goods (e.g. takeaways) as well as the letting of real property (e.g.
AirBnB) or movables (e.g. car-sharing). With such important parts of the sharing economy excluded, there
is a risk that income from platform activities is not fully reported and distortions vis-à-vis traditional
service providers persevere. In this context, the authorities should aim to broaden the coverage of the
legislation to other activities within the sharing economy.

ECO/WKP(2017)83
25
Policy recommendations on improving the business environment
Key recommendations
Further streamline public support for R&D and innovation within each Region. Regions and Communities could step up their innovation support cooperation where appropriate.
Further reduce administrative burdens on SMEs stemming from federal and regional measures; reduce the level of paid-in minimum capital requirements and strengthen contract enforcement by strengthening court automation and case management. Ensure appropriate financing tools are available for scaling up of young, innovative firms.
Other recommendations
Research and Innovation
Critically assess the effectiveness of the tax credit/investment deduction for R&D program, with a view to improving the existing programmes.
Continue to strengthen entrepreneurship education, promote identifiable role models and champions, and expand existing mentor and patron panels of retired business people to counsel new company founders.
Access to finance for start-up
Improve the effectiveness of existing tax incentives for retail investors based SME funding by a more neutral tax treatment of income from savings deposits. Encourage simple transparent and standard securitisation of SME loans by banks. Improve coordination between public sector entities responsible for SME financing.
Infrastructures
Explore whether user fees could be introduced for a broader range of infrastructure services to fund upkeep and avoid a further deterioration of the existing infrastructure stock.
Articulate a clear medium to long-term strategy for energy production to reduce policy uncertainty and thus facilitate long-life-cycle investments.

ECO/WKP(2017)83
26
REFERENCES
Ahmad, N. and P. Schreyer (2016), “Measuring GDP in a Digitalised Economy”, OECD Statistics
Working Papers, No. 2016/07, OECD Publishing, Paris, http://dx.doi.org/10.1787/5jlwqd81d09r-en.
Andrews, D., C. Criscuolo and P. Gal (2015), “Frontier Firms, Technology Diffusion and Public Policy: Micro
Evidence from OECD Countries”, OECD Productivity Working Papers, No. 2, OECD Publishing, Paris,
http:// dx.doi.org/10.1787/5jrql2q2jj7b-en.
Appelt, S., M. Bajgar, C. Criscuolo and F. Galindo-Rueda (2016), “R&D Tax Incentives: Evidence on
design, incidence and impacts”, OECD Science, Technology and Industry Policy Papers, No. 32,
OECD Publishing, Paris, http://dx.doi.org/10.1787/5jlr8fldqk7j-en.
Ariu, A. and V. Vandenberghe (2014), “Assessing the role of ageing, feminising and better-educated
workforces on TFP growth”, NBB Working Paper, No. 265, National Bank of Belgium, Brussels.
Baumol, W.J. (2002), The Free-Market Innovation Machine: Analyzing the Growth Miracle of
Capitalism, Princeton University Press.
Bergmann, H. (2007), “Cultural Aspects of Entrepreneurship”, in OECD, Key Issues in Entrepreneurship
and SME Development, OECD Publishing, Paris.
Biatour, B., J. Fiers, C. Kegels and B. Michel (2007), “Growth and Productivity in Belgium”, Federal
Planning Bureau, Working Paper 5-07, Brussels.
Biatour, B. and C. Kegels (2008), “Growth and Productivity in Belgium”, Federal Planning Bureau,
Working Paper 17-08, Brussels.
Boulhol, H. and L. Turner (2009), “Employment-Productivity Trade-off and Labour Composition”, OECD
Economics Department Working Papers, No. 698, OECD Publishing, Paris,
http://dx.doi.org/10.1787/ 224146182015.
Calvino, F., C. Criscuolo and C. Menon (2016), “No Country for Young Firms?: Start-up Dynamics and
National Policies”, OECD Science, Technology and Industry Policy Papers, No. 29, OECD
Publishing, Paris, http://dx.doi.org/10.1787/5jm22p40c8mw-en.
CompNet (2016), Competitiveness Research Network database.
Conference Board (2017), Total Economy Database, www.conference-
board.org/data/economydatabase/index. cfm?id=27762.
CREG-PwC (2016), A European comparison of electricity and gas prices for large industrial consumers,
Brussels.
De Mulder, J. and H. Godefroid (2016), “Comment stimuler l’entrepreneuriat en Belgique ?”, NBB Economic
Review, September 2016.
Dervis, K. and Z. Qureshi (2016), The productivity slump – fact of fiction: The measurement debate,
Brookings Institution, Washington, DC.

ECO/WKP(2017)83
27
Dhyne, E. and C. Duprez (2013), “Structural dynamics of Belgium’s foreign trade”, NBB Economic Review,
June 2013.
Dhyne, E. and C. Duprez (2015), “Has the crisis altered the Belgian economy’s DNA?”, NBB Economic
Review, September 2015.
Dumont, M. and C. Kegels (2016), “Young Firms and Industry Dynamics in Belgium”, Federal Planning
Bureau, Working Paper 6-16, Brussels.
Duprez, C. and C. Van Nieuwenhuyze (2016), “Inward and Outward Foreign Direct Investment in
Belgium”, NBB Economic Review, September 2016, pp. 45-62.
EC (2016a), RIO Country Report 2015: Belgium, JRC Science for Policy Report, European Commission.
EC (2016b), European Innovation Scoreboard 2016, European Commission.
EC (2017), The Digital Economy and Society Index (DESI), https://ec.europa.eu/digital-single-
market/en/desi.
ECB (2015), Survey on the Access to Finance of Enterprises (SAFE) 2015, European Central Bank.
ECB (2016), Survey on the Access to Finance of Enterprises (SAFE) 2016, European Central Bank.
HLEG (2016), The Future of the Belgian Financial Sector, Report of the High Level Expert Group
established on the initiative of the Minister of Finance of Belgium.
IMF (2016), Acting Now – Acting Together, Fiscal Monitor, April, International Monetary Fund, Washington
DC.
Iweps (2014), Evaluation du Plan Marshall 2.Vert; Evaluation thématique n°1; Pôles de compétitivité;
Rapport final; Belgrade/Belgium.
Kalenga-Mpala, R. and A. Wautelet (2016), “La recherche et le développement à Bruxelles : qui finance
ces activités et où sont-elles réalisées ?”, Focus, 12, January 2016.
Kegels, C. and Van der Linden (2011), “Competitiveness, productivity competition and structural reforms’:
The Belgian case”, Reflets et perspectives de la Vie Économique.
Nassr, I.K. and G. Wehinger (2015), “Unlocking SME finance through market-based debt: Securitisation,
private placements and bonds”, OECD Journal: Financial Market Trends, Vol.2014/2,
http://dx.doi.org/ 10.1787/fmt-2014-5js3bg1g53ln.
Nassr, I.K. and G. Wehinger (2016), “Opportunities and Limitations of Public Equity Markets for SMEs”,
OECD Journal: Financial Market Trends, http://dx.doi.org/10.1787/fmt-2015-5jrs051fvnjk.
NBB (2016a), Annual Report 2015, National Bank of Belgium.
NBB (2016b), “Raising the growth potential and resilience of the economy”, in Annual Report, National
Bank of Belgium.
OECD (2013a), OECD Science, Technology and Industry Scoreboard 2013: Innovation for Growth,
OECD Publishing, Paris, http://dx.doi.org/10.1787/sti_scoreboard-2013-en.

ECO/WKP(2017)83
28
OECD (2013b), PMR indicators Database,
www.oecd.org/eco/growth/indicatorsofproductmarketregulationhomepage.htm.
OECD (2014), Countering Harmful Tax Practices More Effectively, Taking into Account Transparency and
Substance, Action 5 – 2015 Final Report, OECD Publishing, Paris,
http://dx.doi.org/10.1787/9789264241190-en.
OECD (2015a), The Future of Productivity, OECD Publishing, Paris,
http://dx.doi.org/10.1787/9789264248533-en.
OECD (2015b), OECD Economic Surveys: Belgium 2015, OECD Publishing, Paris.
OECD (2015c), Opportunities and Constraints of Market-Based Financing for SMEs, OECD’s Report to
G20 Finance Ministers and Central Bank Governors, September 2015, available at
www.oecd.org/g20/ meetings/antalya/Opportunities-and-Constraints-of-Market-based-Financing-
for-SMEs.pdf.
OECD (2015d), Entrepreneurship at a Glance 2015, OECD Publishing, Paris.
http://dx.doi.org/10.1787/entrepreneur_aag-2015-en
OECD (2016a), OECD Science, Technology and Innovation Outlook 2016, OECD Publishing, Paris,
http:// dx.doi.org/10.1787/sti_in_outlook-2016-en.
OECD (2016b), Financing SMEs and Entrepreneurs 2016: An OECD Scoreboard, OECD Publishing, Paris,
http:// dx.doi.org/10.1787/fin_sme_ent-2016-en.
OECD (2016c), OECD Productivity Statistics Database, www.oecd.org/std/productivity-stats.
OECD (2016d), Entrepreneurship at a Glance 2016, OECD Publishing, Paris.
http://dx.doi.org/10.1787/entrepreneur_aag-2016-en
OECD (2017a), OECD Services Trade Restrictiveness Index (STRI): Belgium, www.oecd.org/tad/services-
trade/ STRI_BEL.pdf.
OECD (2017b), Main Science and Technology Indicators, www.oecd.org/sti/msti.htm.
Piette, C. and M.D. Zachary (2015), “Sensitivity to the crisis of SME financing in Belgium”, National Bank
of Belgium Working Paper.
Soete, L. (2012), Expertgroep voor de doorlichting van het Vlaams innovatieinstrumentarium.
SPF Economie (2015), Financement des PME 2014, SPF Economie, P.M.E., Classes moyennes et Energie
– Observatoire des PME, Brussels.
Statistics Belgium (2017), https://bestat.economie.fgov.be/bestat/.
Straathof, B., E. Gaillard Ladinska, H.L.M. Kox and R. Mocking (2014), “A study on R&D tax incentives:
Final Report”, EU Taxation Paper No. 52 (2014).
Syverson, C. (2016), “Challenges to Mismeasurement Explanations for the U.S. Productivity Slowdown”,
NBER Working Paper Series, Working Paper 21974, Cambridge, MA: National Bureau of Economic
Research.

ECO/WKP(2017)83
29
Van Beveren, I. and S. Vanormelingen (2014), “Human capital, firm capabilities and productivity growth”,
NBB Working Paper No. 257, National Bank of Belgium, Brussels.
Verschelde, M., M. Dumont, G. Rayp and B. Merlevede (2014), “European Competitiveness: A
semiparametric stochastic meta-frontier analysis at the firm level”, European Central Bank, Working
Paper No. 1701, Frankfurt.
WB (2016a), Doing Business 2017: Equal Opportunity for All, Washington DC.
WB (2016b), Logistics Performance Index 2016, http://lpi.worldbank.org/international/global.
WEF (2016), Global Competitiveness Report, Geneva.
Wilson, K. and F. Silva (2013), “Policies for Seed and Early Stage Finance: Findings from the 2012 OECD
Financing Questionnaire”, OECD Science, Technology and Industry Policy Papers, No. 9,
OECD Publishing, Paris, http://dx.doi.org/10.1787/5k3xqsf00j33-en.