ecosystem services approach pilot on wetlands · development for the ecosystem services pilot...
TRANSCRIPT

Ecosystem Services Approach Pilot on Wetlands
Wetland Ecosystem Services
Protocol for the United States (WESPUS) Site
Assessments
A Report Prepared for Alberta Environment and Sustainable Resource Development for the Ecosystem Services Pilot Project
Report Prepared by: O2 Planning + Design Inc.
August 15, 2011
FINAL REPORT

ISBN Number 978-1-4601-0282-4 (Printed Version) ISBN Number 978-1-4601-0283-1 (Online Version) Web Site: http/www.environment.alberta.ca Any comments, questions or suggestions regarding the content of this document may be directed to: Policy and Legislation Integration Branch 10th Floor, Oxbridge Place 9820 – 106 Street Edmonton, Alberta T5K 2J6 Fax: (780) 422-4192 Additional copies of this document may be obtained by contacting: Information Centre Alberta Environment and Sustainable Resource Development 4th Floor, Twin Atria Building 4999 – 98 Avenue Edmonton, Alberta T6B 2X3 Telephone: (780) 427-2700 Fax: (780) 422-4086

1
EXECUTIVE SUMMARY The Wetland Ecosystem Services Protocol for the United States (WESPUS) was highlighted by Alberta Environment as a method with the potential to help address identified gaps in the current regulatory context surrounding wetlands. This assessment was conducted for Alberta Environment by the Biophysical Team for the Wetland Ecosystem Services Pilot project in the Shepard Slough area east of Calgary, with the work being led and coordinated by O2 Planning + Design Inc. (O2). The intention of the WESPUS component of the pilot study was to identify the potential applicability of WESPUS in the context of Alberta’s biophysical and regulatory landscapes.
The purpose of the WESPUS component was to learn more about the WESPUS method, apply it using field assessments across a range of sites within the pilot study area, and to provide recommendations and strategies for moving forward in terms of potentially informing provincial policy and regulatory processes. After a series of trial site assessments and data analysis, the following recommendations and strategies were among those provided:
use caution when making inferences and correlations with Steward and Kantrud wetlands classes, as all classes appear to serve many ecosystem services
compare relative values of ecosystem function with a socio-economic evaluation of wetlands function
identify the differences in effectiveness and values of constructed wetlands based on their designated purpose
potentially use this tool to evaluate whether the pre-disturbance function of the compensated wetland has been effectively replaced post construction
consider how to address wetland numbers vs. wetland area. For example, if eight 1 ha wetlands are disturbed and replaced with one 8 ha wetland, it may not address the replacement of the original wetlands’ function
request that Dr. Paul Adamus make some adjustments to amend the WESPUS tool for the Alberta context and that some references are added to assist the field surveyor
initiate further research projects to strengthen the empirical data for Wetlands Ecosystem Services and to assist regulators in making approval decisions (e.g., conduct trials for boreal peatland applications)
The ability of WESPUS to address the gaps and weaknesses in the approval process based on the findings of the site assessments are discussed as well. For example:
WESPUS has the ability to inform what types of functions and related ecosystem services a wetland provides. It can also provide objective information on the values and functions of small and temporary wetlands which are often written off as unimportant when compared to large and visually appealing wetlands with permanent open water zones. This tool can provide some evidence to support avoidance, mitigation and compensation decisions on wetlands.
Applying WESPUS in the context of individual applications for wetland disturbance may improve cumulative effects management over time by moving towards greater maintenance of wetland functions and services as opposed to simply wetland acreage under a no net loss policy. Further investigation is required to determine how to make WESPUS compatible with a cumulative effects management system.
A standardized protocol such as WESPUS does allow for a quantifiable and objective approach in communicating the value of wetlands. An evaluation tool such as WESPUS could be used province-wide to evaluate the function and value of all types of wetlands and help inform reclamation planning or compensation efforts.

2
ERRATA
Ecosystem Services Approach Pilot on Wetlands: Wetland Ecosystem Services Protocol for the United States (WESPUS) Site Assessments
September 15th, 2011 On August 15th, 2011, O2 completed a report for Alberta Environment entitled “Wetland Ecosystem Services Protocol for the United States (WESPUS) Site Assessments”. The report summarized site visits applying the WESPUS methodology, and commented on the applicability of WESPUS to address gaps in the current provincial wetlands regulatory context.
Subsequent to the final submission, two errors were detected in the report and the clarifications are as follows:
The wetland named “Site 87 saline” (shown as site # 14 in Figure 2-1) assessed as part of the WESPUS training course with Dr. Adamus was identified in the report as a Class IV semipermanent pond, but should have been identified as a Class VI alkali pond. This does not change any of the substantive conclusions or interpretations in the report.
It was noted in the report that Site 16 (Patton 2 Class V wetland) and Site 17 (City of Calgary Wetland #3) were in fact the same wetland sampled by two teams at different locations, but little discussion of the implications. It can be elaborated that:
o As a very large wetland, this wetland can be subject to site sampling issues if access to the whole wetland perimeter and/or a detailed exploration of the entire wetland is not conducted by field survey teams prior to filling out the forms. The two teams made different observations based on their particular survey point (e.g., presence/absence of an outlet). This stresses the importance of spending as much time as necessary to become familiar with the site in its entirety.
o Statistical analyses conducted by Paul Adamus in the United States have shown that, on average, differences in WESPUS scores between different observers are typically minor. However, field assessors with different backgrounds and experiences will inevitably not fill out WESPUS forms consistently, and for some wetlands (e.g., large wetlands) this difference may be larger. It is also possible that differences between different observers may be larger for prairie pothole wetlands than for other types of environments where Dr. Adamus has conducted his statistical analyses.

3
ERRATA ...................................................................................................................................................................................2
3.1 SHEPARD UPLAND B (CLASS II)
4. O
2.1
REFE ..................................................................................................................................................................38
TABLE OF CONTENTS
EXECUTIVE SUMMARY .....................................................................................................................................................1
1. INTRODUCTION..........................................................................................................................................................4
2. METHODS .....................................................................................................................................................................5
3. RESULTS AND DISCUSSION ................................................................................................................................8
.......................................................................................................................................... 9
........................................................................................................................................113.3 SHEPARD UPLAND A
ATTON LASS
3.2 PATTON 3 (CLASS II)...................... (CLASS III) .......................................................................................................................................12
3.4 P 4 (C III) ..................... ROG WETLAND (C A
.......................................................................................................................................143.5 F L
ATTON LASS
SS IV) ...............................................................................................................................................153.6 P 5 (C IV).............
LACK OG (CLASS IV...............................................................................................................................................16
3.7 B D ILDEER (CLA
)........................................................................................................................................................193.8 K SITE SS IV
ITE 11 (C S IV)) ....................................................................................................................................................20
3.9 S 1 LAS ......... HEPARD PLAND C
....................................................................................................................................................213.10 S U
ITE INE (C(CLASS IV) ......................................................................................................................................22
3.11 S 87 SAL LASS IV) .......... LENMOR WETLA LA
......................................................................................................................................233.12 G E ND (C
ATT (SAME ITE AS IT
SS V) .....................................................................................................................................243.13 P ON 2 S C Y W
TH ST AND
TH AVE (C SS V
ETLAND #3) (CLASS V) .......................................................................................253.14 84 9 LA ) .................................................
EW BRIGHTON (CLASS V ..............................................................................................27
3.15 N ) .. M L (CL ) .. .......
........................................................................................................................................283.16 ZAH O ASS V ......
(CLAS
.................................................................................................................................................293.17 FRONTIER S V
OUNTR ILLS
).............................................................................................................................................................303.18 C Y H BLVD
UMMARY
. AND STONEY TRAIL (CLASS V) ...........................................................................................313.19 S ........................................................................................ ...........................................................................................32
PR POSED R ECOMMENDATIONS .................................................................................................................35
4.1 RECOMMENDED ADAPTATIONS OF WESPUS FOR THE ALBERTA CONTEXT ...................................................35 4.2 POTENTIAL OF WESPUS TO HELP ADDRESS GAPS IN THE APPROVALS PR OCESS ....................................36
4. Insufficient evidence to support avoidance, mitigation and compensation s ............................................................................................................................................ .................
decisions on wetland .... .....................................36
n 4.2.2 Insufficient consideration of cumulative effects and long-term consequences of decisiomaking 37
...37 4.2.3 Limited ability to communicate the ‘values’ of wetlands............................................................................
RENCES...

4
1. INTRODUCTION
This draft report summarizes the results of wetland function site-scale assessments conducted for Alberta Environment and Sustainable Resource Development (ESRD) by the Biophysical Team for the Wetland Ecosystem Services Pilot project in the Shepard Slough area east of Calgary. The broader pilot project includes a number of other components, stakeholders, and working group teams. Another component of the project being conducted by O2 is a GIS-based assessment of water storage and flood control functions for all wetlands in the study area, which is summarized separately from this report.
The Wetland Ecosystem Services Protocol for the United States (WESPUS) has been highlighted by ESRD as a method with the potential to help address identified gaps in the current regulatory context surrounding wetlands. Therefore, the purpose of the WESPUS component of the pilot study was to identify the potential applicability of WESPUS in the context of Alberta’s biophysical and regulatory landscapes. Potential limitations and required changes to the WESPUS protocol that would need to be made prior to more widespread application of such a method in the province were also chief objectives. Therefore, the purpose of the WESPUS component of the pilot project was to learn more about the WESPUS method, apply it using field assessments across a range of sites within the pilot study area, and to provide recommendations and strategies for moving forward in terms of potentially informing provincial policy and regulatory processes.
Section 2 of this report outlines the methods applied. Section 3 provides the results as well as an analysis and discussion of what they might mean. Section 4 outlines proposed recommendations for moving forward and discusses the effectiveness of this tool to address the key gaps and weaknesses in the approval process.

5
2. METHODS
The WESPUS model (Adamus 2011) is intended for all of temperate North America and models over 16 ecosystem functions, including, among others:
water storage and delay
sediment retention
phosphorus retention
nitrate removal
carbon sequestration
aquatic invertebrate habitat
amphibian and reptile habitat
water bird feeding and nesting habitats
songbird, raptor, and mammal habitat
pollinator habitat
native plant diversity
The WESPUS requires field visits to each site combined with desktop assessments to complete ratings for 140 criteria. Outputs of the WESPUS Excel spreadsheet include a number representing the relative effectiveness of each function, as well as the relative values associated with each ecosystem function.
Alberta Environment and Sustainable Resource Development (ESRD), as part of the Ecosystem Services Wetland Pilot, hosted a WESPUS training workshop conducted by Dr. Paul Adamus of Adamus Resources on June 21 – 23, 2011 at the ESRD in Calgary. A range of stakeholders and consultants for the Ecosystem Services Pilot were in attendance (see Table 2-1).
Table 2-1 Participants in the WESPUS training workshop June 21 to 23, 2011
Attendee Organization Rob Simieritsch Alberta Environment and Sustainable Resource Development Justin Wilkes Alberta Environment and Sustainable Resource Development Gillian Kerr Alberta Environment and Sustainable Resource Development Eric Beveridge Alberta Environment and Sustainable Resource Development Yihong Wang Alberta Environment and Sustainable Resource Development Brett Johnson Alberta Environment and Sustainable Resource Development Tom Klavins Alberta Environment and Sustainable Resource Development Anish Neupane Alberta Environment and Sustainable Resource Development Scott Millar Alberta Environment and Sustainable Resource Development Tracy Maconachie Ducks Unlimited Canada Tracy Scott Ducks Unlimited Canada Erika Almasi-Klausez City of Calgary Mona Keffer City of Calgary Irena Creed University of Western Ontario Shari Clare University of Alberta George Roman O2 Planning + Design Leif Olson O2 Planning + Design Jennifer Barker O2 Planning + Design Geneva Claesson Deloitte Greg Rokosh SNC-Lavalin Ciara Raudsepp-Hearne Consultant

6
The purpose of the workshop was to learn the design principles of the assessment tool with the intention of helping to determine its effectiveness and applicability to wetlands in Alberta. Two site assessments were conducted by the group and the results have been included in this report. The WESPUS rapid site assessment tool and manual is available at: www.oregonstate.edu/~adamusp/WESPUS.
Following the workshop, the pilot team initiated trial assessments in the study area east of Calgary. Pilot team members were responsible for selecting trial sites based on access, with the intention of assessing a variety of different wetland classes based on the Stewart and Kantrud (S-K) wetland classification system for prairie pothole wetlands. The assessment sites were completed the week of July 18, 2011 and are presented in Figure 2-1.
Members of the pilot team in association with O2 completed an additional 20 (22 total) assessments using the WESPUS rapid assessment tool. This process involved conducting a desktop assessment (Office Form) and a field assessment (Stressor and Field Forms). The majority of the team members filled out the Office Forms prior to the field assessment.
It must be noted that the City of Calgary Parks and ESRD surveyed the same wetland inadvertently, and Patton 2 and City Wetland #3 are two assessments completed on the same wetland. The results for both assessments are included in this report. Therefore, 22 assessments were completed on 21 wetland sites.
Following completion of the field assessments, data was entered into the WESPUS Excel spreadsheet calculator for each site and the results were compiled. The S-K wetland class for each site was also determined for the purposes of comparison. The results, including individual fact sheets for each site are presented in Section 3.
Recommendations and feedback for amendments to the tool were collected, reviewed in a follow-up meeting and compiled into the body of this document. Section 4 also summarizes aspects of the assessment tool not applicable to wetlands in Alberta, as well as proposed revisions and areas for further study.

Figure 2-1 Locations of WESPUS Site Assessments
7

8
3. RESULTS AND DISCUSSION
The sites have been arranged in ascending order for S-K wetland classes with an attempt to screen for any relationships between wetland class and WESPUS scores.
The output from the WESPUS model provides for each individual function a number representing:
the relative effectiveness of the function (e.g., water storage and delay)
the relative values each function, which depends on landscape context (e.g., opportunity for wetland water storage and delay to desynchronize flood peaks and significantly protect downstream property from flooding)
The City of Calgary Parks and ESRD surveyed the same wetland inadvertently, therefore Patton 2 and City Wetland #3 are two assessments completed on the same wetland. Both sets of results are included in this section whereby there are 22 assessments on 21 wetland sites.

3.1 Shepard Upland B (Class II)
Table 3-1 Shepard Upland B Class II wetland data summary
Specific Functions: Relative Effectiveness
of the Function
Relative Values of the Function
Water Storage & Delay (WS) 0.36 1.25
Sediment Retention & Stabilization (SR) 2.38 0.23
Phosphorus Retention (PR) 3.44 1.00
Nitrate Removal & Retention (NR) 1.54 1.93
Thermoregulation (T) 0.00 0.00
Carbon Sequestration (CS) 0.51 -
Organic Matter Export (OE) 2.66 -
Aquatic Invertebrate Habitat (INV) 3.53 6.92
Anadromous Fish Habitat (FA) 0.00 3.94
Non-anadromous Fish Habitat (FR) 4.05 1.97
Amphibian & Reptile Habitat (AM) 6.92 6.67
Waterbird Feeding Habitat (WBF) 3.94 5.00
Waterbird Nesting Habitat (WBN) 3.88 6.67
Songbird, Raptor, & Mammal Habitat (SBM) 3.72 6.67
Pollinator Habitat (POL) 2.63 0.83
Native Plant Diversity (PD) 1.85 3.33
GROUPED FUNCTIONS Group Scores (functions)
Group Scores (values)
Hydrologic Function (WS) 0.36 1.25
Water Quality Group (WQ) 3.44 1.93
Carbon Sequestration (CS) 0.51 -
Fish Support Group (FISH) 4.05 3.94
Aquatic Support Group (AQ) 6.92 6.67
Terrestrial Support Group (TERR) 3.72 6.67
Public Use & Recognition (PU) - 10.00
Provisioning Services (PS) - 0.00
“-“ denotes no information and coloured cell denotes relatively high values
Figure 3-1 Shepard Upland B Wetland, heavily disturbed by agriculture (Assessment completed by O2)
9

City of Calgary Wetland #1 (Class II)
Table 3-2 City of Calgary Wetland #1 Class II data summary
Specific Functions: Relative Effectiveness
of the Function Relative Values of the Function
Water Storage & Delay (WS) 0.33 2.08
Sediment Retention & Stabilization (SR) 8.33 3.54
Phosphorus Retention (PR) 9.72 3.96
Nitrate Removal & Retention (NR) 5.00 4.23
Thermoregulation (T) 0.00 0.00
Carbon Sequestration (CS) 2.00 -
Organic Matter Export (OE) 0.00 -
Aquatic Invertebrate Habitat (INV) 8.72 6.42
Anadromous Fish Habitat (FA) 0.00 6.42
Non-anadromous Fish Habitat (FR) 1.92 3.21
Amphibian & Reptile Habitat (AM) 5.58 3.67
Waterbird Feeding Habitat (WBF) 6.42 5.50
Waterbird Nesting Habitat (WBN) 0.00 3.67
Songbird, Raptor, & Mammal Habitat (SBM) 5.14 3.67
Pollinator Habitat (POL) 5.50 5.83
Native Plant Diversity (PD) 7.58 5.50 GROUPED FUNCTIONS Group Scores (functions) Group Scores (values)
Hydrologic Function (WS) 0.33 2.08
Water Quality Group (WQ) 9.72 4.23
Carbon Sequestration (CS) 2.00 -
Fish Support Group (FISH) 1.92 6.42
Aquatic Support Group (AQ) 8.72 5.50
Terrestrial Support Group (TERR) 7.58 5.83
Public Use & Recognition (PU) - 2.67
Provisioning Services (PS) - 0.00 “-“ denotes no information and coloured cell denotes relatively high values
Figure 3-2 City Wetland #1 (Assessment completed by City of Calgary Parks)
10
11
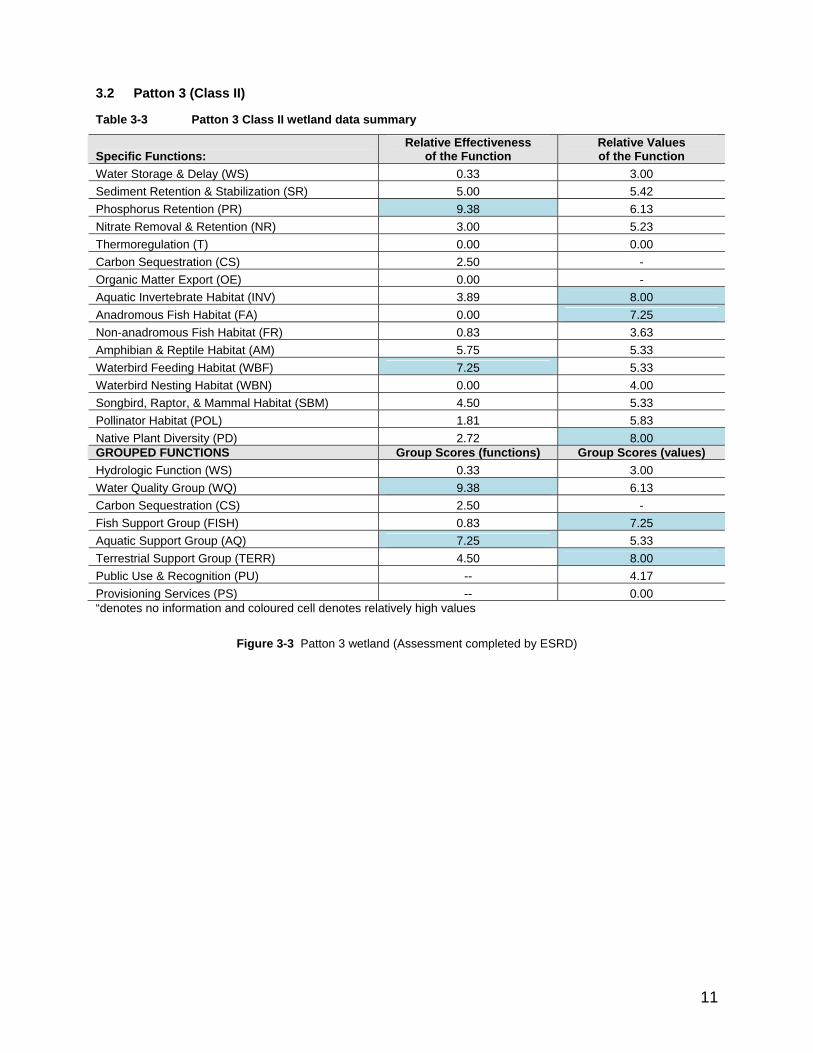
3.2 Patton 3 (Class II)
Table 3-3 Patton 3 Class II wetland data summary
Specific Functions: Relative Effectiveness
of the Function Relative Values of the Function
Water Storage & Delay (WS) 0.33 3.00
Sediment Retention & Stabilization (SR) 5.00 5.42
Phosphorus Retention (PR) 9.38 6.13
Nitrate Removal & Retention (NR) 3.00 5.23
Thermoregulation (T) 0.00 0.00
Carbon Sequestration (CS) 2.50 -
Organic Matter Export (OE) 0.00 -
Aquatic Invertebrate Habitat (INV) 3.89 8.00
Anadromous Fish Habitat (FA) 0.00 7.25
Non-anadromous Fish Habitat (FR) 0.83 3.63
Amphibian & Reptile Habitat (AM) 5.75 5.33
Waterbird Feeding Habitat (WBF) 7.25 5.33
Waterbird Nesting Habitat (WBN) 0.00 4.00
Songbird, Raptor, & Mammal Habitat (SBM) 4.50 5.33
Pollinator Habitat (POL) 1.81 5.83
Native Plant Diversity (PD) 2.72 8.00 GROUPED FUNCTIONS Group Scores (functions) Group Scores (values)
Hydrologic Function (WS) 0.33 3.00
Water Quality Group (WQ) 9.38 6.13
Carbon Sequestration (CS) 2.50 -
Fish Support Group (FISH) 0.83 7.25
Aquatic Support Group (AQ) 7.25 5.33
Terrestrial Support Group (TERR) 4.50 8.00
Public Use & Recognition (PU) -- 4.17
Provisioning Services (PS) -- 0.00 “denotes no information and coloured cell denotes relatively high values
Figure 3-3 Patton 3 wetland (Assessment completed by ESRD)

12
3.3 Shepard Upland A (Class III)
Table 3-4 Shepard Upland A Class III wetland data summary
Specific Functions: Relative Effectiveness of the Function
Relative Values of the Function
Water Storage & Delay (WS) 5.00 2.58
Sediment Retention & Stabilization (SR) 10.00 1.63
Phosphorus Retention (PR) 10.00 2.96
Nitrate Removal & Retention (NR) 10.00 3.73
Thermoregulation (T) 0.00 0.00
Carbon Sequestration (CS) 1.61 -
Organic Matter Export (OE) 0.00 -
Aquatic Invertebrate Habitat (INV) 5.29 10.00
Anadromous Fish Habitat (FA) 0.00 6.23
Non-anadromous Fish Habitat (FR) 0.38 10.00
Amphibian & Reptile Habitat (AM) 8.04 10.00
Waterbird Feeding Habitat (WBF) 6.23 10.00
Waterbird Nesting Habitat (WBN) 5.51 10.00
Songbird, Raptor, & Mammal Habitat (SBM) 6.38 10.00
Pollinator Habitat (POL) 5.04 5.00
Native Plant Diversity (PD) 5.49 10.00
GROUPED FUNCTIONS Group Scores (functions) Group Scores (values)
Hydrologic Function (WS) 5.00 2.58
Water Quality Group (WQ) 10.00 3.73
Carbon Sequestration (CS) 1.61 -
Fish Support Group (FISH) 0.38 10.00
Aquatic Support Group (AQ) 8.04 10.00
Terrestrial Support Group (TERR) 6.38 10.00
Public Use & Recognition (PU) - 10.00
Provisioning Services (PS) - 0.00
“-“ denotes no information and coloured cell denotes relatively high values

Figure 3-3 Patton 3 wetland (Assessment completed by ESRD)
Figure 3-4 Shepard Upland - A site adjacent to fence line (Assessment completed by O2)
13

3.4 Patton 4 (Class III)
Table 3-5 Patton 4 Class III wetland data summary
Specific Functions: Relative Effectiveness
of the Function Relative Values of the Function
Water Storage & Delay (WS) 7.00 3.00
Sediment Retention & Stabilization (SR) 10.00 5.23
Phosphorus Retention (PR) 10.00 6.13
Nitrate Removal & Retention (NR) 10.00 5.23
Thermoregulation (T) 0.00 0.00
Carbon Sequestration (CS) 1.32 -
Organic Matter Export (OE) 0.00 -
Aquatic Invertebrate Habitat (INV) 5.27 8.00
Anadromous Fish Habitat (FA) 0.00 6.07
Non-anadromous Fish Habitat (FR) 0.73 3.04
Amphibian & Reptile Habitat (AM) 6.93 5.33
Waterbird Feeding Habitat (WBF) 6.07 5.33
Waterbird Nesting Habitat (WBN) 4.86 4.00
Songbird, Raptor, & Mammal Habitat (SBM) 5.40 5.33
Pollinator Habitat (POL) 2.78 5.83
Native Plant Diversity (PD) 4.42 8.00
GROUPED FUNCTIONS Group Scores (functions) Group Scores (values)
Hydrologic Function (WS) 7.00 3.00
Water Quality Group (WQ) 10.00 6.13
Carbon Sequestration (CS) 1.32 -
Fish Support Group (FISH) 0.73 6.07
Aquatic Support Group (AQ) 6.93 5.33
Terrestrial Support Group (TERR) 5.40 8.00
Public Use & Recognition (PU) - 3.33
Provisioning Services (PS) - 0.00 “-“ denotes no information and coloured cell denotes relatively high values
Figure 3-5 Patton 4 Class III wetland adjacent to roadway (Assessment completed by ESRD)
14

3.5 Frog Wetland (Class IV)
Table 3-6 Frog Wetland Class IV data summary
Specific Functions: Relative Effectiveness
of the Function Relative Values of the Function
Water Storage & Delay (WS) 3.25 2.83
Sediment Retention & Stabilization (SR) 10.00 4.78
Phosphorus Retention (PR) 10.00 5.46
Nitrate Removal & Retention (NR) 10.00 4.60
Thermoregulation (T) 0.00 0.00
Carbon Sequestration (CS) 2.22 -
Organic Matter Export (OE) 0.00 -
Aquatic Invertebrate Habitat (INV) 6.60 8.00
Anadromous Fish Habitat (FA) 0.00 6.78
Non-anadromous Fish Habitat (FR) 3.80 3.39
Amphibian & Reptile Habitat (AM) 7.58 8.67
Waterbird Feeding Habitat (WBF) 6.78 5.33
Waterbird Nesting Habitat (WBN) 6.26 4.00
Songbird, Raptor, & Mammal Habitat (SBM) 4.41 5.33
Pollinator Habitat (POL) 3.56 5.83
Native Plant Diversity (PD) 4.79 8.00 GROUPED FUNCTIONS Group Scores (functions) Group Scores (values)
Hydrologic Function (WS) 3.25 2.83
Water Quality Group (WQ) 10.00 5.46
Carbon Sequestration (CS) 2.22 -
Fish Support Group (FISH) 3.80 6.78
Aquatic Support Group (AQ) 7.58 8.67
Terrestrial Support Group (TERR) 4.79 8.00
Public Use & Recognition (PU) - 3.33
Provisioning Services (PS) - 0.00 “-“ denotes no information and coloured cell denotes relatively high values
Figure 3-6 Frog wetland Class IV adjacent to roadway (Assessment completed by City of Calgary Parks)
15

3.6 Patton 5 (Class IV)
Table 3-7 Patton 5 Class IV wetland data summary
Specific Functions: Relative Effectiveness
of the Function Relative Values of the Function
Water Storage & Delay (WS) 3.25 3.00
Sediment Retention & Stabilization (SR) 10.00 5.44
Phosphorus Retention (PR) 10.00 6.13
Nitrate Removal & Retention (NR) 10.00 5.23
Thermoregulation (T) 0.00 0.00
Carbon Sequestration (CS) 1.70 -
Organic Matter Export (OE) 0.00 -
Aquatic Invertebrate Habitat (INV) 5.90 8.00
Anadromous Fish Habitat (FA) 0.00 6.74
Non-anadromous Fish Habitat (FR) 3.72 3.37
Amphibian & Reptile Habitat (AM) 7.00 5.33
Waterbird Feeding Habitat (WBF) 6.74 5.33
Waterbird Nesting Habitat (WBN) 7.07 4.00
Songbird, Raptor, & Mammal Habitat (SBM) 4.23 5.33
Pollinator Habitat (POL) 3.75 5.83
Native Plant Diversity (PD) 6.00 8.00
GROUPED FUNCTIONS Group Scores (functions) Group Scores (values)
Hydrologic Function (WS) 3.25 3.00
Water Quality Group (WQ) 10.00 6.13
Carbon Sequestration (CS) 1.70 -
Fish Support Group (FISH) 3.72 6.74
Aquatic Support Group (AQ) 7.07 5.33
Terrestrial Support Group (TERR) 6.00 8.00
Public Use & Recognition (PU) - 6.04
Provisioning Services (PS) - 0.00 “-“ denotes no information and coloured cell denotes relatively high values
Figure 3-7 Patton 5 wetland (Assessment completed by ESRD)
16

City Wetland #2 (Class IV)
Table 3-8 City Wetland #2 Class IV data summary
Specific Functions: Relative Effectiveness of
the Function Relative Values of the Function
Water Storage & Delay (WS) 7.00 2.58
Sediment Retention & Stabilization (SR) 10.00 4.67
Phosphorus Retention (PR) 10.00 4.96
Nitrate Removal & Retention (NR) 10.00 4.70
Thermoregulation (T) 0.00 0.00
Carbon Sequestration (CS) 1.81 -
Organic Matter Export (OE) 0.00 -
Aquatic Invertebrate Habitat (INV) 7.63 8.00
Anadromous Fish Habitat (FA) 0.00 0.00
Non-anadromous Fish Habitat (FR) 1.58 3.32
Amphibian & Reptile Habitat (AM) 7.39 5.33
Waterbird Feeding Habitat (WBF) 6.64 8.00
Waterbird Nesting Habitat (WBN) 4.37 5.33
Songbird, Raptor, & Mammal Habitat (SBM) 4.04 5.33
Pollinator Habitat (POL) - -
Native Plant Diversity (PD) 5.53 -
GROUPED FUNCTIONS Group Scores (functions) Group Scores (values)
Hydrologic Function (WS) 7.00 2.58
Water Quality Group (WQ) 10.00 4.96
Carbon Sequestration (CS) 1.81
Fish Support Group (FISH) 1.58 3.32
Aquatic Support Group (AQ) 7.63 8.00
Terrestrial Support Group (TERR) - -
Public Use & Recognition (PU) - 2.22
Provisioning Services (PS) - 2.63 “-“ denotes no information and coloured cell denotes relatively high values
Figure 3-8 City Wetland #2 (Assessment completed by City of Calgary Parks)
17

Patton 1 (Class IV)
Table 3-9 Patton 1 Class IV wetland data summary
Specific Functions: Relative Effectiveness
of the Function Relative Values of the Function
Water Storage & Delay (WS) 5.75 2.83
Sediment Retention & Stabilization (SR) 10.00 4.98
Phosphorus Retention (PR) 10.00 5.71
Nitrate Removal & Retention (NR) 10.00 5.23
Thermoregulation (T) 0.00 0.00
Carbon Sequestration (CS) 1.65 -
Organic Matter Export (OE) 0.00 -
Aquatic Invertebrate Habitat (INV) 5.94 8.00
Anadromous Fish Habitat (FA) 0.00 6.60
Non-anadromous Fish Habitat (FR) 2.84 3.30
Amphibian & Reptile Habitat (AM) 7.56 8.67
Waterbird Feeding Habitat (WBF) 6.60 5.33
Waterbird Nesting Habitat (WBN) 6.56 4.00
Songbird, Raptor, & Mammal Habitat (SBM) 4.67 5.33
Pollinator Habitat (POL) 2.78 5.83
Native Plant Diversity (PD) 5.20 8.00 GROUPED FUNCTIONS Group Scores (functions) Group Scores (values)
Hydrologic Function (WS) 5.75 2.83
Water Quality Group (WQ) 10.00 5.71
Carbon Sequestration (CS) 1.65 -
Fish Support Group (FISH) 2.84 6.60
Aquatic Support Group (AQ) 7.56 8.67
Terrestrial Support Group (TERR) 5.20 8.00
Public Use & Recognition (PU) - 4.17
Provisioning Services (PS) - 0.00 “-“ denotes no information and coloured cell denotes relatively high values
Figure 3-9 Patton 1 wetland that spans the fence line (Assessment completed by ESRD)
18

3.7 Black Dog (Class IV)
Table 3-10 Black Dog Class IV wetland data summary
Specific Functions: Relative Effectiveness of
the Function Relative Values of the Function
Water Storage & Delay (WS) 4.50 2.33
Sediment Retention & Stabilization (SR) 10.00 5.69
Phosphorus Retention (PR) 10.00 6.33
Nitrate Removal & Retention (NR) 10.00 5.52
Thermoregulation (T) 0.00 0.00
Carbon Sequestration (CS) 1.67 -
Organic Matter Export (OE) 0.00 -
Aquatic Invertebrate Habitat (INV) 5.63 8.00
Anadromous Fish Habitat (FA) 0.00 6.52
Non-anadromous Fish Habitat (FR) 2.30 3.26
Amphibian & Reptile Habitat (AM) 7.58 5.33
Waterbird Feeding Habitat (WBF) 6.52 5.33
Waterbird Nesting Habitat (WBN) 5.71 4.00
Songbird, Raptor, & Mammal Habitat (SBM) 6.08 5.33
Pollinator Habitat (POL) 4.86 5.83
Native Plant Diversity (PD) 4.86 8.00 GROUPED FUNCTIONS Group Scores (functions) Group Scores (values)
Hydrologic Function (WS) 4.50 2.33
Water Quality Group (WQ) 10.00 6.33
Carbon Sequestration (CS) 1.67 -
Fish Support Group (FISH) 2.30 6.52
Aquatic Support Group (AQ) 7.58 5.33
Terrestrial Support Group (TERR) 6.08 8.00
Public Use & Recognition (PU) - 5.83
Provisioning Services (PS) - 0.00 “-“ denotes no information and coloured cell denotes relatively high values
Figure 3-10 “Black Dog” wetland at the southernmost reach of the study area, adjacent to a homestead (Assessment completed by O2)
19

3.8 Kildeer Site (Class IV)
Table 3-11 Kildeer Class IV wetland data summary
Specific Functions: Relative Effectiveness
of the Function Relative Values of the Function
Water Storage & Delay (WS) 3.69 2.08
Sediment Retention & Stabilization (SR) 6.43 4.97
Phosphorus Retention (PR) 5.68 5.33
Nitrate Removal & Retention (NR) 5.50 4.98
Thermoregulation (T) 5.28 1.67
Carbon Sequestration (CS) 1.68 -
Organic Matter Export (OE) 6.71 -
Aquatic Invertebrate Habitat (INV) 6.54 8.00
Anadromous Fish Habitat (FA) 0.00 7.88
Non-anadromous Fish Habitat (FR) 3.42 3.94
Amphibian & Reptile Habitat (AM) 7.91 5.33
Waterbird Feeding Habitat (WBF) 7.88 5.33
Waterbird Nesting Habitat (WBN) 0.00 4.00
Songbird, Raptor, & Mammal Habitat (SBM) 5.78 5.33
Pollinator Habitat (POL) 5.30 6.67
Native Plant Diversity (PD) 6.90 8.00 GROUPED FUNCTIONS Group Scores (functions) Group Scores (values)
Hydrologic Function (WS) 3.69 2.08
Water Quality Group (WQ) 6.43 5.33
Carbon Sequestration (CS) 1.68 -
Fish Support Group (FISH) 3.42 7.88
Aquatic Support Group (AQ) 7.91 5.33
Terrestrial Support Group (TERR) 6.90 8.00
Public Use & Recognition (PU) - 5.83
Provisioning Services (PS) - 0.00 “-“ denotes no information and coloured cell denotes relatively high values
Figure 3-11 Kildeer site is in the southern portion of the study area and is surrounded by cropland (Assessment completed by O2)
20

3.9 Site 111 (Class IV)
Table 3-12 Site 111 Class IV wetland data summary
Specific Functions: Relative Effectiveness
of the Function Relative Values of the Function
Water Storage & Delay (WS) 2.33 4.33
Sediment Retention & Stabilization (SR) 5.47 4.02
Phosphorus Retention (PR) 7.83 5.43
Nitrate Removal & Retention (NR) 4.07 3.84
Thermoregulation (T) 1.94 1.67
Carbon Sequestration (CS) 2.57 -
Organic Matter Export (OE) 4.68 -
Aquatic Invertebrate Habitat (INV) 6.00 9.00
Anadromous Fish Habitat (FA) 0.00 5.11
Non-anadromous Fish Habitat (FR) 4.84 2.55
Amphibian & Reptile Habitat (AM) 6.91 9.33
Waterbird Feeding Habitat (WBF) 5.11 9.00
Waterbird Nesting Habitat (WBN) 6.57 6.00
Songbird, Raptor, & Mammal Habitat (SBM) 3.76 6.67
Pollinator Habitat (POL) 5.13 5.00
Native Plant Diversity (PD) 4.23 9.00 GROUPED FUNCTIONS Group Scores (functions) Group Scores (values)
Hydrologic Function (WS) 2.33 4.33
Water Quality Group (WQ) 7.83 5.43
Carbon Sequestration (CS) 2.57 -
Fish Support Group (FISH) 4.84 5.11
Aquatic Support Group (AQ) 6.91 9.33
Terrestrial Support Group (TERR) 5.13 9.00
Public Use & Recognition (PU) - 10.00
Provisioning Services (PS) - 0.00 “-“ denotes no information and coloured cell denotes relatively high values
Figure 3-12 Site 111 is one of the sites assessed by the group during the WESPUS course and is adjacent to a major roadway
(Assessment completed by WESPUS course team)
21

3.10 Shepard Upland C (Class IV)
Table 3-13 Shepard Upland C Class II wetland data summary
Specific Functions: Relative Effectiveness
of the Function Relative Values of the Function
Water Storage & Delay (WS) 7.00 3.17
Sediment Retention & Stabilization (SR) 10.00 4.22
Phosphorus Retention (PR) 10.00 4.79
Nitrate Removal & Retention (NR) 10.00 5.64
Thermoregulation (T) 0.00 0.00
Carbon Sequestration (CS) 1.38 -
Organic Matter Export (OE) 0.00 -
Aquatic Invertebrate Habitat (INV) 5.50 8.00
Anadromous Fish Habitat (FA) 0.00 6.80
Non-anadromous Fish Habitat (FR) 3.69 3.40
Amphibian & Reptile Habitat (AM) 7.74 8.67
Waterbird Feeding Habitat (WBF) 6.80 5.33
Waterbird Nesting Habitat (WBN) 6.89 6.67
Songbird, Raptor, & Mammal Habitat (SBM) 4.38 6.67
Pollinator Habitat (POL) 4.27 5.00
Native Plant Diversity (PD) 5.43 8.00 GROUPED FUNCTIONS Group Scores (functions) Group Scores (values)
Hydrologic Function (WS) 7.00 3.17
Water Quality Group (WQ) 10.00 5.64
Carbon Sequestration (CS) 1.38 -
Fish Support Group (FISH) 3.69 6.80
Aquatic Support Group (AQ) 7.74 8.67
Terrestrial Support Group (TERR) 5.43 8.00
Public Use & Recognition (PU) - 2.22
Provisioning Services (PS) - 0.00 “-“ denotes no information and coloured cell denotes relatively high values
Figure 3-13 Shepard Upland C wetland surrounded by canola and wheat fields (Assessment completed by O2)
22

3.11 Site 87 Saline (Class IV)
Table 3-14 Site 87 Saline Class IV wetland data summary
Specific Functions: Relative Effectiveness
of the Function Relative Values of the Function
Water Storage & Delay (WS) 4.75 2.92
Sediment Retention & Stabilization (SR) 10.00 4.56
Phosphorus Retention (PR) 10.00 4.98
Nitrate Removal & Retention (NR) 10.00 5.15
Thermoregulation (T) 0.00 0.00
Carbon Sequestration (CS) 2.44 -
Organic Matter Export (OE) 0.00 -
Aquatic Invertebrate Habitat (INV) 6.47 9.00
Anadromous Fish Habitat (FA) 0.00 7.37
Non-anadromous Fish Habitat (FR) 0.00 3.68
Amphibian & Reptile Habitat (AM) 0.00 9.33
Waterbird Feeding Habitat (WBF) 7.37 9.00
Waterbird Nesting Habitat (WBN) 6.48 6.00
Songbird, Raptor, & Mammal Habitat (SBM) 5.94 6.00
Pollinator Habitat (POL) 5.68 5.00
Native Plant Diversity (PD) 4.35 9.00
GROUPED FUNCTIONS Group Scores (functions) Group Scores (values)
Hydrologic Function (WS) 4.75 2.92
Water Quality Group (WQ) 10.00 5.15
Carbon Sequestration (CS) 2.44 -
Fish Support Group (FISH) 0.00 7.37
Aquatic Support Group (AQ) 7.37 9.33
Terrestrial Support Group (TERR) 5.94 9.00
Public Use & Recognition (PU) - 4.76
Provisioning Services (PS) - 0.00 “-“ denotes no information and coloured cell denotes relatively high values
Figure 3-14 Site 87 is one of the sites assessed by the group during the WESPUS course and is considered saline (Assessment completed by the WESPUS course team)
23

3.12 Glenmore Wetland (Class V)
Table 3-15 Glenmore Wetland Class V data summary
Specific Functions: Relative Effectiveness
of the Function Relative Values of the Function
Water Storage & Delay (WS) 3.38 2.42
Sediment Retention & Stabilization (SR) 5.81 4.14
Phosphorus Retention (PR) 7.40 4.69
Nitrate Removal & Retention (NR) 4.29 4.54
Thermoregulation (T) 2.58 1.67
Carbon Sequestration (CS) 2.19 -
Organic Matter Export (OE) 5.41 -
Aquatic Invertebrate Habitat (INV) 5.86 8.00
Anadromous Fish Habitat (FA) 0.00 5.94
Non-anadromous Fish Habitat (FR) 3.16 2.97
Amphibian & Reptile Habitat (AM) 6.90 8.67
Waterbird Feeding Habitat (WBF) 5.94 5.33
Waterbird Nesting Habitat (WBN) 5.98 4.00
Songbird, Raptor, & Mammal Habitat (SBM) 4.48 5.33
Pollinator Habitat (POL) 4.28 5.83
Native Plant Diversity (PD) 4.61 8.00
GROUPED FUNCTIONS Group Scores (functions) Group Scores (values)
Hydrologic Function (WS) 3.38 2.42
Water Quality Group (WQ) 7.40 4.69
Carbon Sequestration (CS) 2.19 -
Fish Support Group (FISH) 3.16 5.94
Aquatic Support Group (AQ) 6.90 8.67
Terrestrial Support Group (TERR) 4.61 8.00
Public Use & Recognition (PU) - 2.33
Provisioning Services (PS) - 2.00 “-“ denotes no information and coloured cell denotes relatively high values
Figure 3-15 Glenmore Wetland showing algal blooms (Assessment completed by ESRD)
24

3.13 Patton 2 (same site as City Wetland #3) (Class V)
Table 3-16 Patton 2 Class V wetland data summary
Specific Functions: Relative Effectiveness
of the Function Relative Values of the Function
Water Storage & Delay (WS) 3.28 3.00
Sediment Retention & Stabilization (SR) 5.10 4.68
Phosphorus Retention (PR) 7.70 5.50
Nitrate Removal & Retention (NR) 5.51 4.73
Thermoregulation (T) 2.78 0.00
Carbon Sequestration (CS) 1.97 -
Organic Matter Export (OE) 5.95 -
Aquatic Invertebrate Habitat (INV) 5.69 8.00
Anadromous Fish Habitat (FA) 0.00 5.75
Non-anadromous Fish Habitat (FR) 3.05 2.87
Amphibian & Reptile Habitat (AM) 7.37 5.33
Waterbird Feeding Habitat (WBF) 5.75 5.33
Waterbird Nesting Habitat (WBN) 5.72 4.00
Songbird, Raptor, & Mammal Habitat (SBM) 5.20 5.33
Pollinator Habitat (POL) 3.06 5.83
Native Plant Diversity (PD) 3.70 8.00
GROUPED FUNCTIONS Group Scores (functions) Group Scores (values)
Hydrologic Function (WS) 3.28 3.00
Water Quality Group (WQ) 7.70 5.50
Carbon Sequestration (CS) 1.97 -
Fish Support Group (FISH) 3.05 5.75
Aquatic Support Group (AQ) 7.37 5.33
Terrestrial Support Group (TERR) 5.20 8.00
Public Use & Recognition (PU) - 3.33
Provisioning Services (PS) - 0.00 “-“ denotes no information and coloured cell denotes relatively high values
Figure 3-16 Patton 2 wetland (Assessment completed by ESRD)
25

City Wetland #3 (same site as Patton 2)(Class V)
Table 3-17 City Wetland #3 Class V wetland data summary
Specific Functions: Relative Effectiveness
of the Function Relative Values of the Function
Water Storage & Delay (WS) 6.00 2.83
Sediment Retention & Stabilization (SR) 10.00 4.70
Phosphorus Retention (PR) 10.00 5.21
Nitrate Removal & Retention (NR) 10.00 4.73
Thermoregulation (T) 0.00 0.00
Carbon Sequestration (CS) 1.72 -
Organic Matter Export (OE) 0.00 -
Aquatic Invertebrate Habitat (INV) 7.64 8.00
Anadromous Fish Habitat (FA) 0.00 6.74
Non-anadromous Fish Habitat (FR) 4.59 3.37
Amphibian & Reptile Habitat (AM) 7.51 8.67
Waterbird Feeding Habitat (WBF) 6.74 5.33
Waterbird Nesting Habitat (WBN) 7.59 4.00
Songbird, Raptor, & Mammal Habitat (SBM) 4.01 5.33
Pollinator Habitat (POL) 3.30 5.83
Native Plant Diversity (PD) 5.18 8.00 GROUPED FUNCTIONS Group Scores (functions) Group Scores (values)
Hydrologic Function (WS) 6.00 2.83
Water Quality Group (WQ) 10.00 5.21
Carbon Sequestration (CS) 1.72 -
Fish Support Group (FISH) 4.59 6.74
Aquatic Support Group (AQ) 7.64 8.67
Terrestrial Support Group (TERR) 5.18 8.00
Public Use & Recognition (PU) - 2.67
Provisioning Services (PS) - 0.00 “-“ denotes no information and coloured cell denotes relatively high values
Figure 3-17 City Wetland #3 that spans the roadway (Assessment completed by City of Calgary Parks)
26

3.14 84th St and 9th Ave (Class V)
Table 3-18 Summary data for wetland at 84th Street and 9th Ave NE
Specific Functions: Relative Effectiveness of
the Function Relative Values of the Function
Water Storage & Delay (WS) 3.51 3.33
Sediment Retention & Stabilization (SR) 6.08 4.43
Phosphorus Retention (PR) 6.02 5.35
Nitrate Removal & Retention (NR) 5.64 4.59
Thermoregulation (T) 2.78 0.00
Carbon Sequestration (CS) 2.12 -
Organic Matter Export (OE) 6.47 -
Aquatic Invertebrate Habitat (INV) 5.56 8.00
Anadromous Fish Habitat (FA) 0.00 5.91
Non-anadromous Fish Habitat (FR) 3.93 2.95
Amphibian & Reptile Habitat (AM) 6.29 5.33
Waterbird Feeding Habitat (WBF) 5.91 5.33
Waterbird Nesting Habitat (WBN) 0.00 4.00
Songbird, Raptor, & Mammal Habitat (SBM) 4.23 5.33
Pollinator Habitat (POL) 3.10 5.83
Native Plant Diversity (PD) 4.32 8.00 GROUPED FUNCTIONS Group Scores (functions) Group Scores (values)
Hydrologic Function (WS) 3.51 3.33
Water Quality Group (WQ) 6.08 5.35
Carbon Sequestration (CS) 2.12 -
Fish Support Group (FISH) 3.93 5.91
Aquatic Support Group (AQ) 6.47 5.33
Terrestrial Support Group (TERR) 4.32 8.00
Public Use & Recognition (PU) - 3.33
Provisioning Services (PS) - 0.00 “-“ denotes no information and coloured cell denotes relatively high values
Figure 3-18 Wetland at the corner of 84th Street and 9th Ave NE (Assessment completed by O2)
27

3.15 New Brighton (Class V)
Table 3-19 New Brighton Class V wetland data summary
Specific Functions: Relative Effectiveness
of the Function Relative Values of the Function
Water Storage & Delay (WS) 3.14 3.33
Sediment Retention & Stabilization (SR) 5.59 1.64
Phosphorus Retention (PR) 7.55 3.18
Nitrate Removal & Retention (NR) 4.78 2.84
Thermoregulation (T) 1.94 3.33
Carbon Sequestration (CS) 1.57 -
Organic Matter Export (OE) 5.22 -
Aquatic Invertebrate Habitat (INV) 5.15 5.56
Anadromous Fish Habitat (FA) 0.00 5.56
Non-anadromous Fish Habitat (FR) 2.91 2.78
Amphibian & Reptile Habitat (AM) 5.56 2.00
Waterbird Feeding Habitat (WBF) 5.56 2.00
Waterbird Nesting Habitat (WBN) 5.07 1.50
Songbird, Raptor, & Mammal Habitat (SBM) 2.93 2.00
Pollinator Habitat (POL) 2.93 3.06
Native Plant Diversity (PD) 4.73 3.00
GROUPED FUNCTIONS Group Scores (functions) Group Scores (values)
Hydrologic Function (WS) 3.14 3.33
Water Quality Group (WQ) 7.55 3.33
Carbon Sequestration (CS) 1.57 -
Fish Support Group (FISH) 2.91 5.56
Aquatic Support Group (AQ) 5.56 2.00
Terrestrial Support Group (TERR) 4.73 3.06
Public Use & Recognition (PU) - 4.76
Provisioning Services (PS) - 0.00 “-“ denotes no information and coloured cell denotes relatively high values
Figure 3-19 New Brighton wetland has been constructed for compensation for urban development
(Assessment completed by O2)
28

3.16 Zahmol (Class V)
Table 3-20 Zahmol Class V wetland data summary
Specific Functions: Relative Effectiveness
of the Function Relative Values of the Function
Water Storage & Delay (WS) 8.00 3.08
Sediment Retention & Stabilization (SR) 10.00 3.71
Phosphorus Retention (PR) 10.00 4.96
Nitrate Removal & Retention (NR) 10.00 3.52
Thermoregulation (T) 0.00 0.00
Carbon Sequestration (CS) 1.20 -
Organic Matter Export (OE) 0.00 -
Aquatic Invertebrate Habitat (INV) 4.48 10.00
Anadromous Fish Habitat (FA) 0.00 5.40
Non-anadromous Fish Habitat (FR) 3.33 10.00
Amphibian & Reptile Habitat (AM) 6.65 10.00
Waterbird Feeding Habitat (WBF) 5.40 10.00
Waterbird Nesting Habitat (WBN) 5.08 10.00
Songbird, Raptor, & Mammal Habitat (SBM) 3.34 10.00
Pollinator Habitat (POL) 5.08 1.67
Native Plant Diversity (PD) 4.26 10.00 GROUPED FUNCTIONS Group Scores (functions) Group Scores (values)
Hydrologic Function (WS) 8.00 3.08
Water Quality Group (WQ) 10.00 4.96
Carbon Sequestration (CS) 1.20 -
Fish Support Group (FISH) 3.33 10.00
Aquatic Support Group (AQ) 6.65 10.00
Terrestrial Support Group (TERR) 5.08 10.00
Public Use & Recognition (PU) - 7.62
Provisioning Services (PS) - 0.00 “-“ denotes no information and coloured cell denotes relatively high values
Figure 3-20 Zahmol wetland has been constructed for compensation for industrial development
(Assessment completed by O2)
29
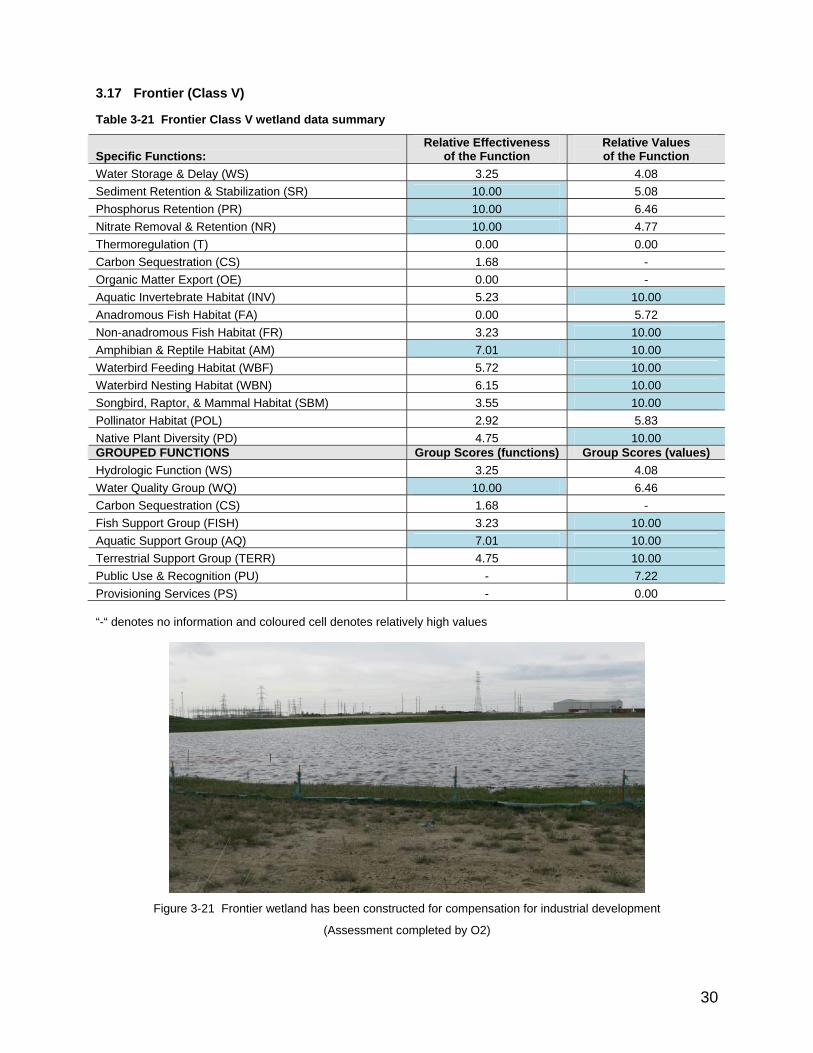
3.17 Frontier (Class V)
Table 3-21 Frontier Class V wetland data summary
Specific Functions: Relative Effectiveness
of the Function Relative Values of the Function
Water Storage & Delay (WS) 3.25 4.08
Sediment Retention & Stabilization (SR) 10.00 5.08
Phosphorus Retention (PR) 10.00 6.46
Nitrate Removal & Retention (NR) 10.00 4.77
Thermoregulation (T) 0.00 0.00
Carbon Sequestration (CS) 1.68 -
Organic Matter Export (OE) 0.00 -
Aquatic Invertebrate Habitat (INV) 5.23 10.00
Anadromous Fish Habitat (FA) 0.00 5.72
Non-anadromous Fish Habitat (FR) 3.23 10.00
Amphibian & Reptile Habitat (AM) 7.01 10.00
Waterbird Feeding Habitat (WBF) 5.72 10.00
Waterbird Nesting Habitat (WBN) 6.15 10.00
Songbird, Raptor, & Mammal Habitat (SBM) 3.55 10.00
Pollinator Habitat (POL) 2.92 5.83
Native Plant Diversity (PD) 4.75 10.00 GROUPED FUNCTIONS Group Scores (functions) Group Scores (values)
Hydrologic Function (WS) 3.25 4.08
Water Quality Group (WQ) 10.00 6.46
Carbon Sequestration (CS) 1.68 -
Fish Support Group (FISH) 3.23 10.00
Aquatic Support Group (AQ) 7.01 10.00
Terrestrial Support Group (TERR) 4.75 10.00
Public Use & Recognition (PU) - 7.22
Provisioning Services (PS) - 0.00 “-“ denotes no information and coloured cell denotes relatively high values
Figure 3-21 Frontier wetland has been constructed for compensation for industrial development
(Assessment completed by O2)
30

3.18 Country Hills Blvd. and Stoney Trail (Class V)
Table 3-22 Country Hills and Stoney Trail Class V wetland data summary
Specific Functions: Relative Effectiveness
of the Function Relative Values of the Function
Water Storage & Delay (WS) 3.85 3.58
Sediment Retention & Stabilization (SR) 6.48 3.29
Phosphorus Retention (PR) 8.07 4.21
Nitrate Removal & Retention (NR) 4.92 4.78
Thermoregulation (T) 1.94 1.67
Carbon Sequestration (CS) 2.06 -
Organic Matter Export (OE) 4.76 -
Aquatic Invertebrate Habitat (INV) 5.18 6.41
Anadromous Fish Habitat (FA) 0.00 5.10
Non-anadromous Fish Habitat (FR) 3.87 2.55
Amphibian & Reptile Habitat (AM) 6.41 3.67
Waterbird Feeding Habitat (WBF) 5.10 5.50
Waterbird Nesting Habitat (WBN) 5.98 3.67
Songbird, Raptor, & Mammal Habitat (SBM) 3.38 3.67
Pollinator Habitat (POL) 1.97 0.83
Native Plant Diversity (PD) 3.41 5.50
GROUPED FUNCTIONS Group Scores (functions) Group Scores (values)
Hydrologic Function (WS) 3.85 3.58
Water Quality Group (WQ) 8.07 4.78
Carbon Sequestration (CS) 2.06 -
Fish Support Group (FISH) 3.87 5.10
Aquatic Support Group (AQ) 6.41 5.50
Terrestrial Support Group (TERR) 3.41 5.50
Public Use & Recognition (PU) - 2.62
Provisioning Services (PS) - 0.00 “-“ denotes no information and coloured cell denotes relatively high values
Figure 3-22 The wetland at Country Hills Blvd. and Stoney Trail has been constructed for compensation and borders an arterial expressway.
31

32
3.19 Summary
For ease of comparison, only the Grouped Functions will be discussed in this summary. Table 3-23 shows the summary of all ratings for effectiveness of the function arranged by wetland class, where the relatively high and low values have been highlighted. Table 3-24 shows the summary of the relative values of the function for each site. Table 3-25 provides relative mean values for the grouped functions compared to the mean of each wetland class.
Trends identified in the study area, as well as associated limitations and potential beneficial uses of WESPUS within the Alberta regulatory context are summarized in the bullets below:
Mean values for each S-K class should be interpreted with caution, as the observed variability within each wetland class is relatively large, and the sample size within each class is very low. It is recommended to complete more sample sites if the desired outcome is a “look-up” table for the functions and values of each particular S-K wetlands class. Alternatively, the S-K system can be used simply as a guide and a revised WESPUS can be used in the decision making process with regards to wetlands impacts.
Any trends identified may be a function of the types of wetlands being assessed in the study area, which are almost entirely prairie pothole wetlands characteristic of central and southern Alberta.
Other considerations may be required if, for example, WESPUS is applied to bogs, fens, or riverine wetland systems common to other parts of Alberta.
Since this is a “rapid” assessment and all values generated are relative, there are no absolute values placed on the functions themselves (i.e., kg of Carbon sequestered, m3 of water stored). As a result, comparing values across different wetlands must be done with extreme caution. For example, a value score of 4 for wetland A and 2 for wetland B does not mean that wetland A has double the value of wetland B.
All wetlands in the region seem to perform fairly well for water quality and aquatic habitat support functions.
Apart from Class II wetlands, most wetlands in the study area provide high hydrologic functions related to water storage and delay. The Class II wetlands, which are temporary in nature and have limited water storage capacities, would also be expected to have much lower overall hydrologic functions per wetland.
Wetlands in all S-K classes provide fairly high aquatic habitat support functions; this is consistent with the reputation of prairie pothole wetlands as the “duck factory of North America”, as well as research indicating that heterogeneity of wetland types is important for maintaining biodiversity (Weller 1978; Gilbert et al. 2006).
The Class II wetlands appeared to provide slightly greater aquatic habitat support functions than the Class III or Class V wetlands, specifically due to more effective amphibian and aquatic invertebrate habitat; however, further investigations are necessary.
Class IV wetlands seem to provide slightly higher aquatic habitat support functions than Class V wetlands; this is consistent with research indicating that Class IV and Class III wetlands tend to provide the most productive and effective duck habitat in the prairies (Stewart and Kantrud 1973).
Carbon sequestration function ratings are low in all categories, and it is speculated that the lack of peat formation and general lack of woody vegetation plays a role in these low values. However, if peat accumulating wetlands (e.g., which are more prominent in northern and western portions of Alberta) were assessed, higher ratings may have been generated, as peatlands are known to function as carbon sinks. This category may be worth further exploration.
Fish support function ratings are relatively low in all sites, but the value of fish support functions has often been assessed as high; these results are very counterintuitive in the context of the study area, where almost all wetlands are characterized by isolated wetland catchments with no outlet, harsh winter conditions, dissolved oxygen depletion, and frequent seasonal or inter-annual drying that severely limits and in most cases eliminates permanent fish populations.

33
It is not clear whether this tool can effectively measure value in a quantitative manner appropriate for regulatory purposes. The values of wetlands might be better assessed by a socio-economic tool where absolute measures such as $ values could be generated, although it may be difficult to develop comparable “rapid” assessment tools using this approach.
For the purposes of this discussion, it may be easiest to discuss “value of the function” separately from the effectiveness. Table 3-24 demonstrates that the wetlands in the study area are valued for their native plant diversity and bird/mammal habitat, even though the effectiveness of that function (Terrestrial Support) is relatively low. It also appears that the Aquatic Support function (amphibian and invertebrate habitat) is relatively effective and valued in most cases. In any case where the Public Use and Recognition is relatively highly valued, the site has been identified as a conservation or compensation opportunity. It is uncertain whether these relative values of the function are relevant and it may be wise to compare these results with a socio-economic evaluation of wetlands function.
It is interesting to note that four of the seven Class V wetlands sampled have been constructed for compensation and it may be helpful to identify the differences in effectiveness and values based on their designated purpose.
It may be relevant to explore how the functions and associated values of the compensation wetlands are different from the wetland functions that were disturbed at the impacted sites. This is perhaps the key question that a tool like WESPUS can help to answer by moving forward with measuring wetland functions both pre-disturbance and post-construction in compensation wetlands. It appears that the best use of this tool would be to evaluate the functions of a single wetland. In a compensation scenario, this tool could be used to evaluate whether the pre-disturbance function of the compensated wetland has been effectively replaced post construction.
If WESPUS becomes a tool used in the regulatory application and approval process it will be necessary to consider how to address wetland numbers vs. wetland area. For example, if eight 1 ha wetlands are disturbed and replaced with one 8 ha wetland, it may not address the replacement of the original wetlands’ function.

WESPUS Site Assessments – ES Pilot
Table 3-23. Grouped wetland functions and their relative effectiveness for each site. Higher relative effectiveness values (greater than 7) are highlighted in blue and lower relative effectiveness values (less than 3) are highlighted in green.
Stewart and Kantrud (1971) Wetland Class II II II III III IV IV IV IV IV IV IV IV IV V V V V V V V V
Site Name Shepard Upland B
City Wetland
#1 Patton 3 Shepard Upland A Patton 4
Frog Wetland Patton 5
City Wetland
#2 Patton
1 Black Dog
Kildeer Site
Site 111
Shepard Upland
C Site87Saline
Glenmore Wetland Patton 2
City Wetland
#3 84St&9AveSE
New Brighton Zahmol Frontier
CountryHills & Stoney
Hydrologic Function (WS) 0.36 0.33 0.33 5.00 7.00 3.25 3.25 7.00 5.75 4.50 3.69 2.33 7.00 4.75 3.38 3.28 6.00 3.51 3.14 8.00 3.25 3.85
Water Quality Group (WQ) 3.44 9.72 9.38 10.00 10.00 10.00 10.00 10.00 10.00 10.00 6.43 7.83 10.00 10.00 7.40 7.70 10.00 6.08 7.55 10.00 10.00 8.07
Carbon Sequestration (CS) 0.51 2.00 2.50 1.61 1.32 2.22 1.70 1.81 1.65 1.67 1.68 2.57 1.38 2.44 2.19 1.97 1.72 2.12 1.57 1.20 1.68 2.06
Fish Support Group (FISH) 4.05 1.92 0.83 0.38 0.73 3.80 3.72 1.58 2.84 2.30 3.42 4.84 3.69 0.00 3.16 3.05 4.59 3.93 2.91 3.33 3.23 3.87
Aquatic Support Group (AQ) 6.92 8.72 7.25 8.04 6.93 7.58 7.07 7.63 7.56 7.58 7.91 6.91 7.74 7.37 6.90 7.37 7.64 6.47 5.56 6.65 7.01 6.41 Terrestrial Support Group (TERR) 3.72 7.58 4.50 6.38 5.40 4.79 6.00 - 5.20 6.08 6.90 5.13 5.43 5.94 4.61 5.20 5.18 4.32 4.73 5.08 4.75 3.41
Public Use & Recognition (PU) - - - - - - - - - - - - - - - - - - - - - -
Provisioning Services (PS) - - - - - - - - - - - - - - - - - - - - - -
Table 3-24. Grouped wetland functions and their relative values of the function for each site. Higher relative values (greater than 7) are highlighted in blue and lower relative values (less than 3) are highlighted in green.
Stewart and Kantrud (1971) Wetland Class II II II III III IV IV IV IV IV IV IV IV IV V V V V V V V V
Site Name Shepard Upland B
City Wetland
#1 Patton 3 Shepard Upland A Patton 4
Frog Wetland Patton 5
City Wetland
#2 Patton
1 Black Dog
Kildeer Site
Site 111
Shepard Upland
C Site87Saline
Glenmore Wetland Patton 2
City Wetland
#3 84St&9AveSE
New Brighton Zahmol Frontier
CountryHills & Stoney
Hydrologic Function (WS) 1.25 2.08 3.00 2.58 3.00 2.83 3.00 2.58 2.83 2.33 2.08 4.33 3.17 2.92 2.42 3.00 2.83 3.33 3.33 3.08 4.08 3.58
Water Quality Group (WQ) 1.93 4.23 6.13 3.73 6.13 5.46 6.13 4.96 5.71 6.33 5.33 5.43 5.64 5.15 4.69 5.50 5.21 5.35 3.33 4.96 6.46 4.78
Carbon Sequestration (CS) - - - - - - - - - - - - - - - - - - - - - -
Fish Support Group (FISH) 3.94 6.42 7.25 10.00 6.07 6.78 6.74 3.32 6.60 6.52 7.88 5.11 6.80 7.37 5.94 5.75 6.74 5.91 5.56 10.00 10.00 5.10
Aquatic Support Group (AQ) 6.67 5.50 5.33 10.00 5.33 8.67 5.33 8.00 8.67 5.33 5.33 9.33 8.67 9.33 8.67 5.33 8.67 5.33 2.00 10.00 10.00 5.50 Terrestrial Support Group (TERR) 6.67 5.83 8.00 10.00 8.00 8.00 8.00 - 8.00 8.00 8.00 9.00 8.00 9.00 8.00 8.00 8.00 8.00 3.06 10.00 10.00 5.50
Public Use & Recognition (PU) 10.00 2.67 4.17 10.00 3.33 3.33 6.04 2.22 4.17 5.83 5.83 10.0 2.22 4.76 2.33 3.33 2.67 3.33 4.76 7.62 7.22 2.62
Provisioning Services (PS) 0.00 0.00 0.00 0.00 0.00 0.00 0.00 2.63 0.00 0.00 0.00 0.00 0.00 0.00 2.00 0.00 0.00 0.00 0.00 0.00 0.00 0.00
Table 3-25. Grouped wetland functions and the relative mean values of their effectiveness for all sites compared to the mean of each wetland class. Relative values greater than the mean values are highlighted in blue and relative values less than the mean value are highlighted in green.
Stewart and Kantrud (1971) Wetland Class All sites Class II (n=3) Class III (n=2) Class IV (n=9) Class V (n=8)
Mean Effectiveness Values Effectiveness Values Effectiveness Values Effectiveness Values Effectiveness Values
Hydrologic Function (WS) 4.04 2.89 0.34 2.11 6.00 2.79 4.61 2.90 4.30 3.21
Water Quality Group (WQ) 8.80 5.12 7.51 4.10 10.00 4.93 9.36 5.57 8.35 5.03
Carbon Sequestration (CS) 1.80 - 1.67 - 1.46 - 1.90 - 1.81 -
Fish Support Group (FISH) 2.83 6.63 2.27 2.27 0.55 8.04 2.91 6.35 3.51 6.88
Aquatic Support Group (AQ) 7.24 7.14 7.63 5.83 7.48 7.67 7.48 7.63 6.75 6.94
Terrestrial Support Group (TERR) 5.25 7.86 5.27 6.83 5.89 9.00 - - 4.66 7.57
Public Use & Recognition (PU) - 4.93 - 5.61 - 6.67 - 4.93 - 4.24
Provisioning Services (PS) - 0.21 - 0.00 - 0.00 - 0.29 - 0.25
34

4. PROPOSED RECOMMENDATIONS
This section has been split into two subsections. Section 4.1 addressed recommended changes to WESPUS to make it more suitable for the Alberta context. Section 4.2 summarizes the potential of WESPUS for helping to address key gaps and weaknesses in Alberta’s current approach to wetland regulation and approvals for disturbance to wetlands.
4.1 Recommended Adaptations of WESPUS for the Alberta context
Following the trial assessments, some observations by the surveying teams were made on how the tool could be amended to make it applicable for Alberta. It is suggested that the following amendments be made to WESPUS by Dr. Paul Adamus:
Adjust all measurements to reflect the metric system (i.e., hectares, metres);
Change any references from “state” to “province”;
Amend the height of shrub classes to anything shorter than 5 m. Any woody species greater than 5 metres should be classed as trees, particularly on the prairies;
Adjust typical vegetation species (examples) to reflect Alberta ecosystems;
Remove references and questions related to tidal areas, estuaries and ice-free areas;
The definition of the limits of the assessment area should be based primarily on soil type and resulting wetland vegetation. Use references such as the Alberta Vegetation Inventory, Stewart and Kantrud (1971), Alberta Wetland Inventory Standards (Halsey and Vitt 1997) and/or other commonly used references in Alberta;
Change websites to reflect equivalent Canadian/Alberta references (precipitation, soils, rare plants, weeds, aquatic animals, listed species) including Alberta’s North American Waterfowl Management Plan (NAWMP) Priority Areas for areas with Special Conservation Designation;
Request the redefinition or rewording of the term “natural areas” to avoid confusion. Consider “relatively unmanaged land cover” as an alternative;
Investigate whether forest cover near prairie wetlands should be emphasized as a positive impact;
Investigate whether larger wetlands are in fact more favourable than smaller wetlands;
Adjust the value of ephemeral wetlands to migratory waterfowl;
Consider including breeding pairs of waterfowl as well as nesting pairs when addressing “Ponded Threshold”;
Address inconsistencies in the calculator for questions related to woody species; and
Address inconsistencies in the calculator for questions related to fish habitat, particularly for isolated prairie pothole wetlands.
It is recommended that the following be considered for further trial assessments once changes have been made to the assessment tool:
Append a list of weeds (non-native/native invasive) and define an approach to evaluation (list the Alberta Weed Act);
Append a list of nitrogen fixing plants that may be present in Alberta wetland assessment areas. ([e.g., Alnus rugosa, Alnus crispa, Myrica gale, Shepherdia canadensis, Elaeagnus commutata, Leguminoseae (pea) family];
Require that the office form be completed prior to field assessment and that it is completed by the same surveyor;
35

Require that if this revised assessment is used in the approval or BIA process that it is signed off by a professional designation (e.g., Qualified Wetland Aquatic Environment Specialist or QWAES);
Add Stewart and Kantrud (1971) wetland classification to information requirements; and
Require that the entire wetland be visually inspected during the field assessment process. In some cases this would require full access to the property.
The following projects could be initiated to strengthen the empirical data for Wetlands Ecosystem Services and to assist regulators in making approval decisions:
Conduct further study to determine how the size of the wetland relates to its value;
Conduct trials for other areas of Alberta, including the boreal wetlands. Determine whether this assessment would be applicable/transferable to peatlands (much of Alberta’s wetlands are peatlands);
Determine appropriate conductivity limits for salinity (geochemical environment) from baseline values in wetlands (Brief desktop study); and
The study area is primarily impacted by urban development. How would this tool translate to other development types? i.e. wellsites, aggregate, mining, In-situ oil sands, highways and infrastructure.
4.2 Potential of WESPUS to Help Address Gaps in the Approvals Process
The Ecosystem Services Approach Pilot on Wetlands Team (Pilot Team) identified a series of gaps and weaknesses in the Approvals Process that relate to decision-makers and the process itself (ESAPW 2011). These gaps were prioritized by the team and a discussion on how WESPUS can address them has been provided based on the findings of the site assessments.
4.2.1 Insufficient evidence to support avoidance, mitigation and compensation decisions on
pated that in identifying the functions a wetland provides, the findings would support the use
l have
tion chosen for whatever reason, regulators may choose to use this tool to r
nt
ing hat is
.
ts of
social paradigm about the values and functions that wetlands provide.
wetlands
It was anticiof avoidance as a mitigation measure in the approval process, even for wetlands that appear degraded.
WESPUS has the ability to inform what types of functions and related ecosystem services a wetland provides. It can also provide objective information on the values and functions of small and temporarywetlands which are often written off as unimportant when compared to large and visually appealing wetlands with permanent open water zones. Wetlands that are lower in Class, for example, may stila relatively high propensity to perform Water Quality functions and Aquatic Habitat Support functions (e.g., City Wetland #1).
If avoidance is not the opinform the approval process, by which the assessed functions should be replaced in the restoration ocompensation of the wetland. This process may also lead to enough associated costs that the proponehas more of an economic incentive to leave the wetland undisturbed or incorporate it into the development setting. Alternatively, it can provide more information to regulators when evaluatproposals for mitigation and compensation in terms of their relative appropriateness in relation to wbeing replaced. It provides a tool for regulators to shape the process of avoidance, mitigation, and compensation in a manner that may better reflect public values associated with wetland disturbance
This tool may be useful to measure Ecosystem Services changes over time associated with future development and allow regulators to adjust required compensation ratios as appropriate. The resulthis pilot study indicate that wetlands of all Classes perform valuable functions. Regulators may wish to use this tool to conduct further studies or to implement it as a trial in the approval process to shift the
36
4.2.2 Insufficient consideration of cumulative effects and long-term consequences of decisionmaking
The lack of a historical trend analysis and comprehensive information regarding the interactions of
wever, the values are relative and not absolute and are not necessarily spatially explicit m
to make WESPUS
due to the large number of variables, and it can be expected that the public and the development industry will generally not be able to easily understand how WESPUS measures and communicates values.
s a valuable way to
utreach or educational materials on
col uantifiable and objective approach that is not arbitrary. In the end,
he pilot study, it already shows that only one constructed site (Zahmol) has a
e oil
y for Forestry as the only measure of effective reclamation, in
wetlands make it difficult to make informed approval decisions. Data from these assessments can be used to help complement a mapping system and a trend study / inventory of wetlands in a particular watershed. Ho(e.g., area of wetlands is not factored in to WESPUS). This may lead to some ambiguity and criticisregarding whether WESPUS actually does address cumulative effects properly or not.
On the other hand, applying WESPUS in the context of individual applications for wetland disturbance would presumably improve cumulative effects management over time by moving towards greater maintenance of wetland functions and services as opposed to simply wetland acreage under a no net loss policy. Therefore, further research and investigation is required to determine how compatible with a cumulative effects management system.
4.2.3 Limited ability to communicate the ‘values’ of wetlands
The WESPUS approach at first glance can be overwhelming
One potential solution is to use and apply “flower diagrams” (e.g., Foley et al. 2005) acommunicate wetland values in a more visual manner, particularly if simple pre and post disturbance assessments are being compared.
Qualitative descriptions of functions should also accompany any owetland functions and values. However, a pitfall is that qualitative descriptions of wetland values can be misleading in that not all wetlands provide uniformly high values for all functions. A standardized protosuch as WESPUS does allow for a qhowever, development industry and public understanding of wetland functions may need to remain somewhat qualitative.
Further assessments of this type could be conducted to provide more defensible evidence of the value of leaving natural wetlands intact. It is possible to evaluate the engineered wetlands and compare the services to natural wetlands with this tool. For example, by comparing the constructed wetlands to tnatural wetlands in thisrelatively greater ability to perform Hydrologic functions. However, in this case this is the specific reason it was constructed (storm water pond).
The regulatory process currently supports the value of wetlands in the province and the importance of wetlands has been communicated to the public of Alberta. For example, regulatory approvals in thsands region address the importance of reconstructing wet landscapes in final reclamation. Approvals no longer rely on equivalent Land Capabilitrecognition of the value of wetlands. An evaluation tool such as WESPUS could be used province-wide to evaluate the function and value of all types of wetlands and help inform reclamation planning or compensation efforts.
37

38
REFERENCES
Adamus, P.R. 2011. Manual for the Wetland Ecosystem Services Protocol for the United States (WESPUS). www.oregonstate.edu/~adamusp/WESPUS
Ecosystem Services Approach Pilot on Wetlands (ESAPW). 2011. Internal Summary Report: The Gaps and Weaknesses of Alberta’s Wetland Approval Process. February 16, 2011.
Foley, J.A., R. DeFries, G.P. Asner, C. Barford, et al. 2005. Global consequences of land use. Science. 309(5734): p. 570-574.
Gilbert, M.C., P.M. Whited, E.J. Clairain, Jr. and R.D. Smith. 2006. A Regional Guidebook for applying the Hydrogeomorphic Approach to Assessing Wetland Functions of Prairie Potholes. Engineering and Research Development Center, U.S. Army Corp. of Engineers, 170 pp.
Halsey, L.A. and D.H. Vitt. 1997. Alberta Wetland Inventory Standards. In Alberta Vegetation InventoryStandards. Resource Data Division, Alberta Environmental Protection, Edmonton, AB, Canada.
Stewart and Kantrud. 1973. Ecological Distributions of Breeding Waterfowl Populations in North Dakota. Journal of Wildlife Management 37 (1): 39-50.
Stewart, Robert E., and Harold A. Kantrud. 1971. Classification of natural ponds and lakes in the glaciated prairie region. Resource Publication 92, Bureau of Sport Fisheries and Wildlife, U.S. Fish and Wildlife Service, Washington, D.C. Jamestown, ND: Northern Prairie Wildlife Research Center Online. http://www.npwrc.usgs.gov/resource/wetlands/pondlake/index.htm (Version 16APR1998).
Province of Alberta. 2010. Weed Control Act. Alberta Regulation 19/2010. Alberta’s Queen Printer. pp.8.
Weller, M.W. 1978. Management of freshwater marshes for wildlife. In: R.E. Good, D.F. Whigham, R.L. Simpson (eds.). Freshwater Wetlands. Academic Press, New York.