economic trends in dialysis delivery - usrds …usrds.org/2013/pres/solid_asn_talk_econ_v3.pdf ·...
TRANSCRIPT

Craig Solid, PhD Director, Health Economics USRDS Coordinating Center Minneapolis, MN
Economic Trends in Dialysis Delivery

Economics of health Policy payment reform: 2009 to 2011 • The growth in the ESRD program costs led Congress
to mandate a new payment system for dialysis to contain the potential over use fee for service medications
• The impact of these changes have mainly focused on the changes in medication usage but little on the longer term overall costs to Medicare
• This presentation reviews the trends in Medicare expenditures before and after the new Prospective Payment System for dialysis

ESRD expenditures, by payor Figure 11.1 (Volume 2)
Period prevalent ESRD patients; includes Part D.

Total Medicare dollars spent on ESRD, by type of service Figure 11.5 (Volume 2)
Total Medicare costs from claims data; include all Medicare as primary payor claims as well as amounts paid by Medicare as secondary payor.
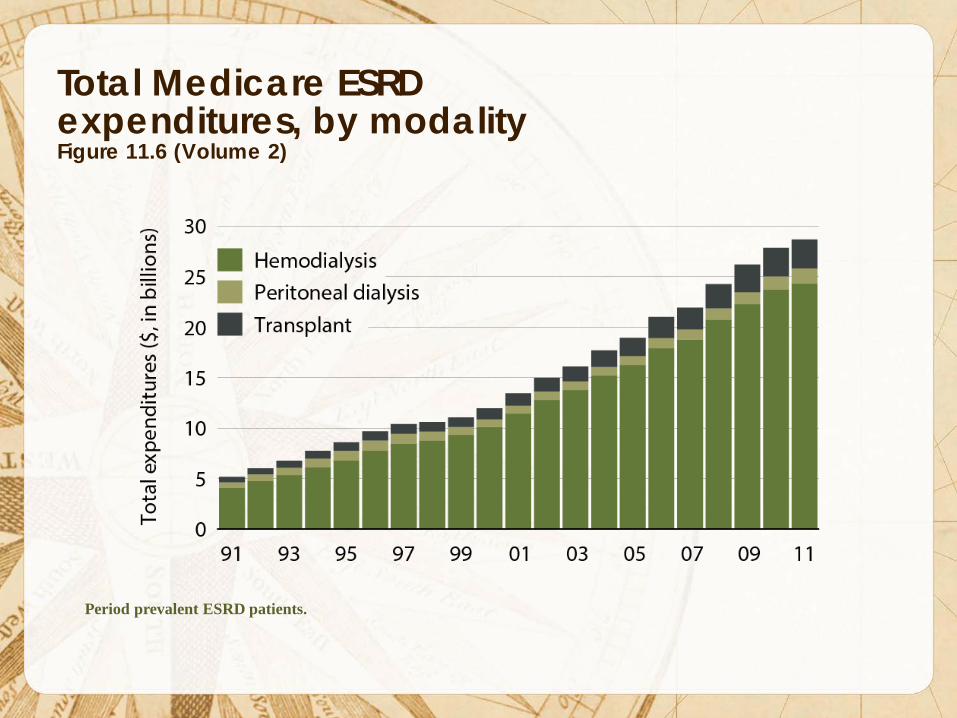
Total Medicare ESRD expenditures, by modality Figure 11.6 (Volume 2)
Period prevalent ESRD patients.
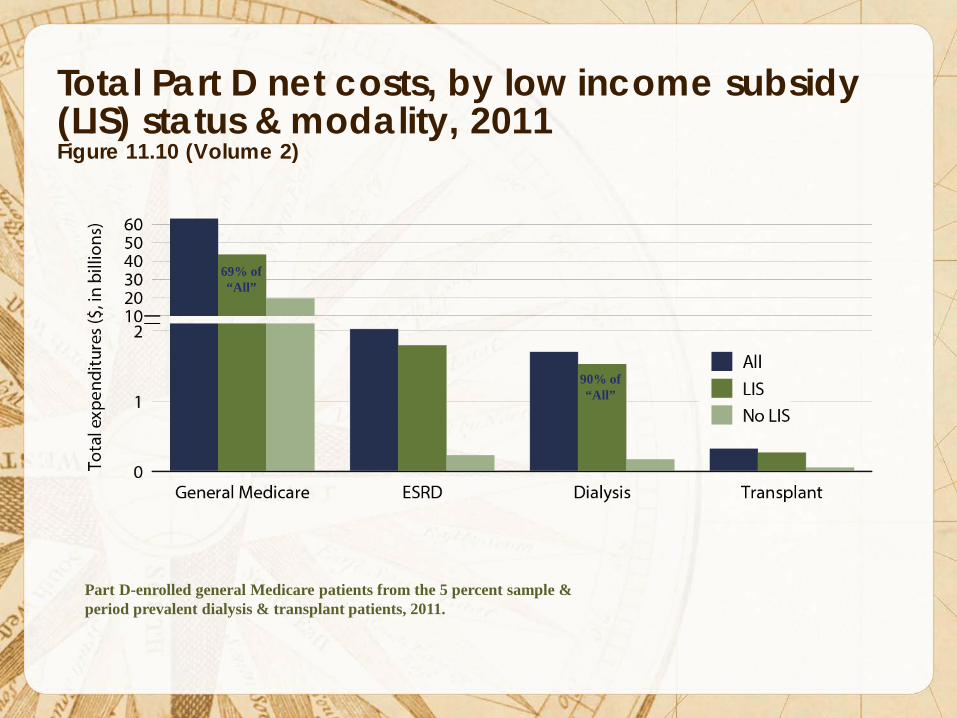
Total Part D net costs, by low income subsidy (LIS) status & modality, 2011 Figure 11.10 (Volume 2)
Part D-enrolled general Medicare patients from the 5 percent sample & period prevalent dialysis & transplant patients, 2011.
90% of “All”
69% of “All”

Total Medicare ESRD expenditures per person per year, by modality Figure 11.7 (Volume 2)
Period prevalent ESRD patients; patients with Medicare as secondary payor are excluded.
$88,000 PPPY $71,000 PPPY
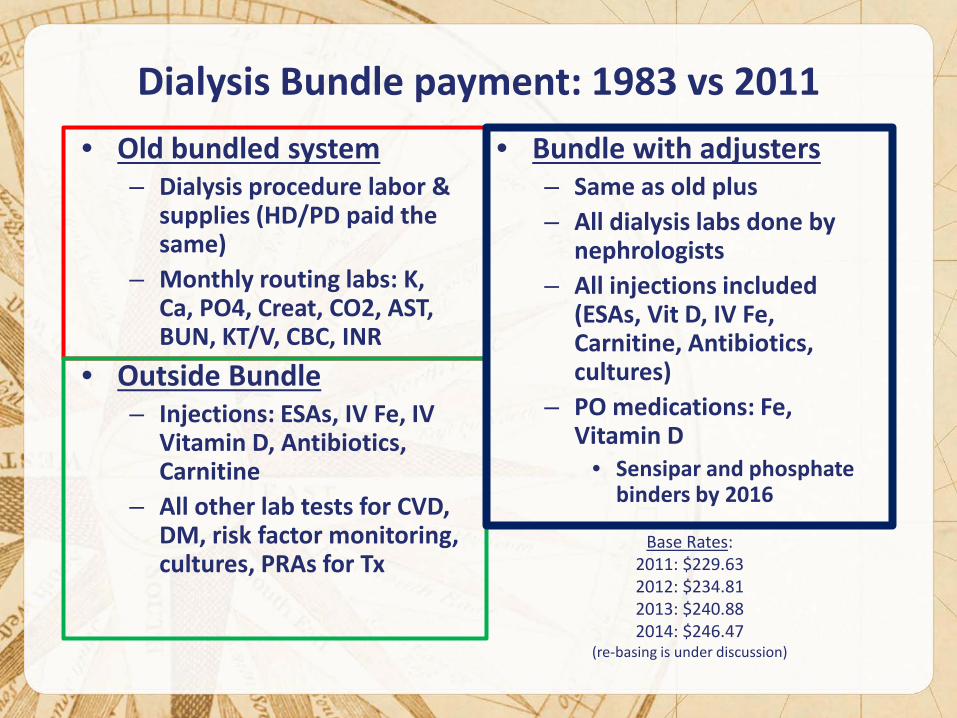
Dialysis Bundle payment: 1983 vs 2011
• Old bundled system – Dialysis procedure labor &
supplies (HD/PD paid the same)
– Monthly routing labs: K, Ca, PO4, Creat, CO2, AST, BUN, KT/V, CBC, INR
• Outside Bundle – Injections: ESAs, IV Fe, IV
Vitamin D, Antibiotics, Carnitine
– All other lab tests for CVD, DM, risk factor monitoring, cultures, PRAs for Tx
• Bundle with adjusters – Same as old plus – All dialysis labs done by
nephrologists – All injections included
(ESAs, Vit D, IV Fe, Carnitine, Antibiotics, cultures)
– PO medications: Fe, Vitamin D
• Sensipar and phosphate binders by 2016
Base Rates: 2011: $229.63 2012: $234.81 2013: $240.88 2014: $246.47
(re-basing is under discussion)

Prospective Payment System for Dialysis: • Dialysis is paid on a per treatment basis
• The same amount is paid for HD and equivalent PD
treatments normalized to three times per week for HD
• PD has a built in margin in the same way as the original composite rate for dialysis started in 1983
• Daily Home Hemodialysis is paid for each run beyond three treatments per week based on medical justification
• Adjusters are added for incident patients, medical conditions and home training beyond the first 4 months

Total Medicare ESRD expenditures per person per year, by modality Figure 11.7 (Volume 2)
Period prevalent ESRD patients; patients with Medicare as secondary payor are excluded.
$88,000 PPPY $71,000 PPPY
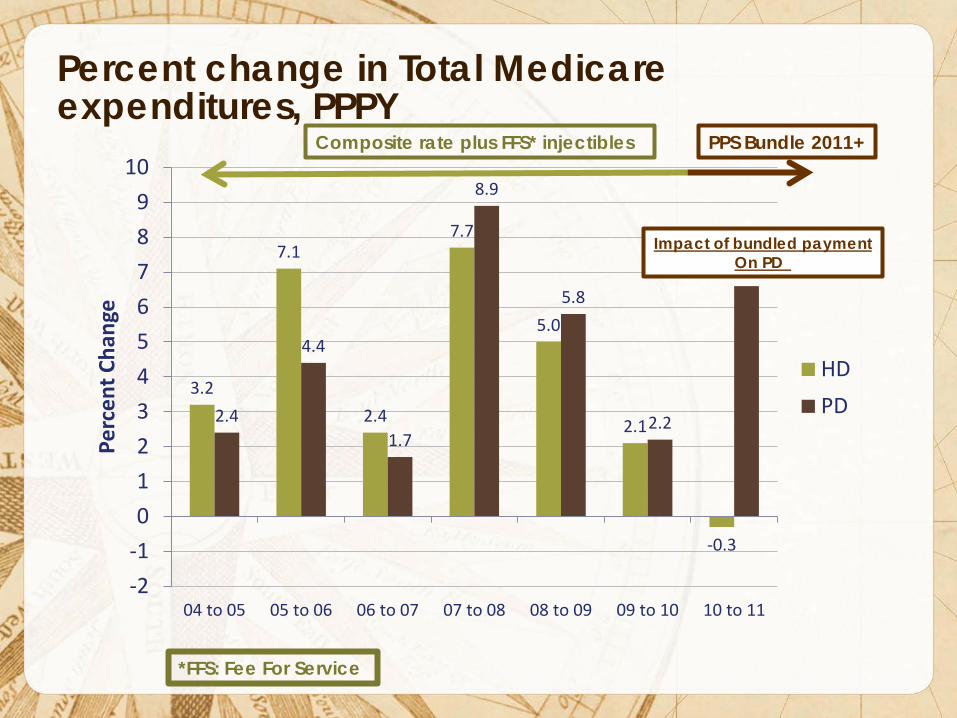
Percent change in Total Medicare expenditures, PPPY
3.2
7.1
2.4
7.7
5.0
2.1
-0.3
2.4
4.4
1.7
8.9
5.8
2.2
6.6
-2-10123456789
10
04 to 05 05 to 06 06 to 07 07 to 08 08 to 09 09 to 10 10 to 11
Perc
ent C
hang
e
HDPD
Impact of bundled payment On PD
Composite rate plus FFS* injectibles PPS Bundle 2011+
*FFS: Fee For Service

Distribution of providers opting into the new dialysis composite rate, 2011 Table 10.a (Volume 2)
Period prevalent dialysis patients 2010–2011; only facilities defined as opting in the new bundle are included.
USRDS 2012 ADR

Total Medicare Costs 2010-2011, PPPY (Tables K.a and K.b from 2013 USRDS ADR all patients)
$87,239 $88,191
$67,209
$33,103
$87,272 $87,945
$71,630
$32,922
$-
$10,000
$20,000
$30,000
$40,000
$50,000
$60,000
$70,000
$80,000
$90,000
$100,000
All Dialysis HD CAPD/CCPD Tx
Tota
l Med
icar
e PP
PY C
osts
2010
2011
Includes all patients and providers – not just those who opted into the composite rate

Change in Total Medicare PPPY, 2010 to 2011
$33.40
$246.34
$4,421.18
$180.83
-$1,000
$0
$1,000
$2,000
$3,000
$4,000
$5,000
All Dialysis HD CAPD/CCPD Tx
Chan
ge in
Tot
al M
edic
are
PPPY
'10-
'11

Change in Total Medicare PPPY, 2010-2011, by Claim Type
-$2,000
-$1,000
$0
$1,000
$2,000
$3,000
$4,000
$5,000
$6,000
All Dialysis HD CAPD/CCPD Tx
Chan
ge in
Tot
al M
edic
are
PPPY
'10-
'11
Total inpatient
Total outpatient
Total physician/supplier
Part D
Skilled nursing facility
Home health agency

Change in Total Medicare PPPY, 2010-2011, by Claim Type
-$1,500
-$1,000
-$500
$0
$500
$1,000
$1,500
$2,000
$2,500
All Dialysis HD CAPD/CCPD Tx
Chan
ge in
Tot
al M
edic
are
PPPY
'10-
'11
Total inpatient
Total outpatient
Total physician/supplier
Part D
$5,000
$5,500

Change in Total Medicare PPPY, 2010-2011, by Claim Type
-$1,500
-$1,000
-$500
$0
$500
$1,000
$1,500
$2,000
$2,500
All Dialysis HD CAPD/CCPD Tx
Chan
ge in
Tot
al M
edic
are
PPPY
'10-
'11
Total inpatient
Total outpatient
Total physician/supplier
Part D
$5,000
$5,500

Change in Total Medicare PPPY, 2010-2011, Hemodialysis (largest components)
$8 $689
$8,538
$5,772
$1,222 $811 $1,158
-$8,000
-$6,000
-$4,000
-$2,000
$0
$2,000
$4,000
$6,000
$8,000
$10,000
Med DRG Surg DRG Dialysis ESA Vit D IV Iron Lab/pathology
Chan
ge in
Tot
al M
edic
are
PPPY
'10-
'11
IP Overall PPPY
Change = -$615
OP Overall PPPY
Change = $792
PB Overall PPPY
Change = -$1051
$7,805

Change in Total Medicare PPPY, 2010-2011, by Claim Type
-$1,500
-$1,000
-$500
$0
$500
$1,000
$1,500
$2,000
$2,500
All Dialysis HD CAPD/CCPD Tx
Chan
ge in
Tot
al M
edic
are
PPPY
'10-
'11
Total inpatient
Total outpatient
Total physician/supplier
Part D
$5,000
$5,500

Change in Total Medicare PPPY, 2010-2011, CAPD/CCPD (largest components)
$394
$290
$8,722
$3,587
$25 $174 $1,079
-$6,000
-$4,000
-$2,000
$0
$2,000
$4,000
$6,000
$8,000
$10,000
Med DRG Surg DRG Dialysis ESA Vit D IV Iron Lab/pathology
Chan
ge in
Tot
al M
edic
are
PPPY
'10-
'11
IP Overall PPPY
Change = $214
OP Overall PPPY
Change = $5,331
PB Overall PPPY
Change = -$1085
$3,786

Change in Total Medicare PPPY, 2010-2011, by Claim Type
-$1,500
-$1,000
-$500
$0
$500
$1,000
$1,500
$2,000
$2,500
All Dialysis HD CAPD/CCPD Tx
Chan
ge in
Tot
al M
edic
are
PPPY
'10-
'11
Total inpatient
Total outpatient
Total physician/supplier
Part D
$5,000
$5,500

Change in Total Medicare PPPY, 2010-2011, Transplant (largest components)
$153 $146
$112
$73 $7 $8 $392
-6,000
-4,000
-2,000
0
2,000
4,000
6,000
Med DRG Surg DRG Dialysis ESA Vit D IV Iron Immunosup
Chan
ge in
Tot
al M
edic
are
PPPY
'10-
'11
IP Overall PPPY
Change = -$222
OP Overall PPPY
Change = $233
PB Overall PPPY
Change = -$341

Changes in Mean Monthly Dose of Medications in the Outpatient Setting (2013 ADR, Fig 10.7)
EPO Dose (units)
IV Iron Dose (mg)
IV Vit D Dose (mcg)
76826.3
61069.6
47141.7
2010 July 2011 July 2012 July
20.5% 38.6% 383.8
329.7 303.2
2010 July 2011 July 2012 July
14.1% 21.0%
56.4
48.3 47.6
2010 July 2011 July 2012 July
15.6% 14.3%

Distribution of HD/PD Patients, 2007-2011 (Table D.1, USRDS 2013 ADR)
6.0% 6.0%
6.3% 6.8%
7.4%
94.0% 94.0%
93.7% 93.2%
92.6%
91.5%
92.0%
92.5%
93.0%
93.5%
94.0%
94.5%
0.0%
1.0%
2.0%
3.0%
4.0%
5.0%
6.0%
7.0%
8.0%
2007 2008 2009 2010 2011
Perc
ent o
f Dia
lysi
s Pt
s tha
t are
HD
Perc
ent o
f Dia
lysi
s Pt
s tha
t are
PD
Incident Dialysis Patients
PD HD
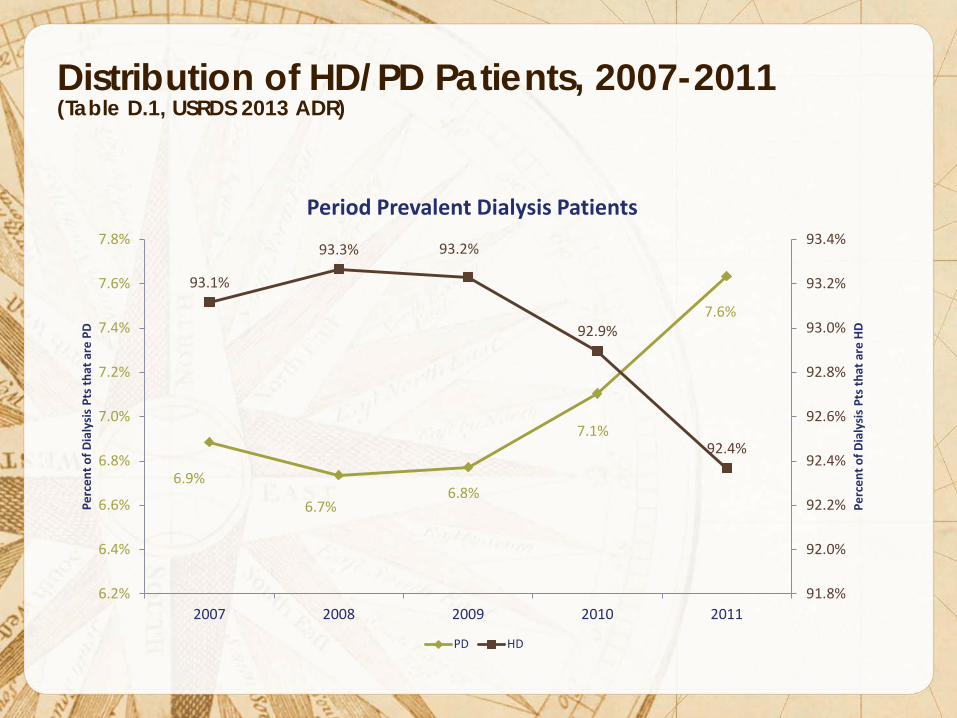
Distribution of HD/PD Patients, 2007-2011 (Table D.1, USRDS 2013 ADR)
6.9%
6.7% 6.8%
7.1%
7.6%
93.1%
93.3% 93.2%
92.9%
92.4%
91.8%
92.0%
92.2%
92.4%
92.6%
92.8%
93.0%
93.2%
93.4%
6.2%
6.4%
6.6%
6.8%
7.0%
7.2%
7.4%
7.6%
7.8%
2007 2008 2009 2010 2011
Perc
ent o
f Dia
lysi
s Pt
s tha
t are
HD
Perc
ent o
f Dia
lysi
s Pt
s tha
t are
PD
Period Prevalent Dialysis Patients
PD HD
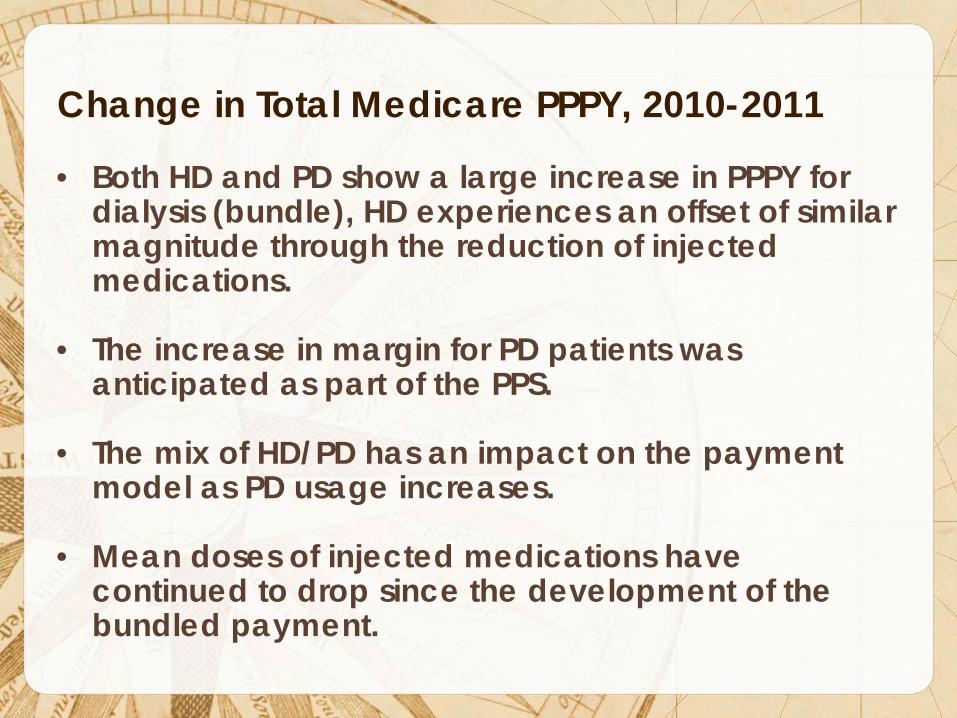
Change in Total Medicare PPPY, 2010-2011 • Both HD and PD show a large increase in PPPY for
dialysis (bundle), HD experiences an offset of similar magnitude through the reduction of injected medications.
• The increase in margin for PD patients was anticipated as part of the PPS.
• The mix of HD/PD has an impact on the payment model as PD usage increases.
• Mean doses of injected medications have continued to drop since the development of the bundled payment.

Adjustments to the Prospective Payment System
Element Adjustment
Low-volume: <4000 trts/yr for 3 years 1.202
Onset of dialysis ≤ 4 months 1.51
Acute conditions:
Pericarditis 1.114
Bacterial pneumonia 1.135
Gastrointestinal bleeding with hemorrhage 1.183
Chronic conditions:
Hereditary hemolytic or sickle cell anemia 1.072
Myelodysplastic syndrome 1.099
Monoclonal gammapathy 1.024

Adjustments to the Prospective Payment System • Incident patients under 65 not previously covered
by Medicare typically have a 90-day waiting period before Medicare pays.
• An exception is if the patient begins home dialysis Home HD PD
• Can be considered a financial incentive to start
patients with home dialysis, as opposed to in-center HD

Incident patients using home dialysis, by therapy type Figure 1.18 (Volume 2)
Incident dialysis patients.

Adjustments to the Prospective Payment System • Although home therapy represents a small portion
of all dialysis therapy, it appears as though more patients are initiating with a home therapy.
• There are many factors that influence the decision to attempt home therapy, however the financial incentives are clear and must be balanced by patient choice.