economic synergies across southeast louisiana · 2 contents 05 introduction 07 the big picture 09...
TRANSCRIPT

Elaine Ortiz & Allison Plyer
economic synergies across southeast louisiana
april 2013

w w w . g n o c d c . o r g
2
Contents
05 introduction
07 the b ig P icture
09 economic synergies
11 dr ivers o f the economy: baton rouge metro
13 dr ivers o f the economy: greater new or leans
15 dr ivers o f the economy: houma-thibodaux metro
17 shared economic dr ivers
22 the oPPortunity
24 base l ine in ta rget sectors
26 target sector impor tance and chal lenges
34 conclusion
35 endnotes
eco
no
mic
syn
erg
ies

w w w . g n o c d c . o r g
Economic SynErgiES
AcroSS SouthEASt LouiSiAnASpring 2013
3
PrinCiPal authors Elaine Ortiz is senior research associate at the Greater New Orleans Community Data Center. Allison Plyer is chief demographer and director of the Greater New Orleans Community Data Center. Design anD layout Catherine Burke
aCknowleDgments The Data Center would like to thank JPMorgan Chase for their support of Economic Synergies across Southeast Louisiana. Additional gratitude goes to United Way of Southeast Louisiana, Baptist Community Ministries, Metropolitan Opportunities Fund at the Greater New Orleans Foundation, RosaMary Foundation, John S. and James L. Knight Foundation, and blue moon fund for their ongoing support.
The authors also wish to express thanks and gratitude to the many people who provided important information and guidance that helped build and improve the report. First, we want to thank Liza Cowan for her essential editorial contributions. In addition, thanks go to Donald Andrews, Robin Barnes, Liz Cooke, Cullen Curole, Ted Falgout, Adam Knapp, Leo Marretta, Matt Rookard, and Dek Terrell who provided personal interviews and feedback on early drafts of this report. In addition, we are grateful to Rachel DiResto, Jim Edmonson, Jo-anna Jones, Quentin Messer, Jr., John Spain, and Lacy Strohschein for providing valuable feedback on this report. The authors also wish to thank Melissa Ehlinger and Tre Rials for sharing data on industry sectors developed by the New Orleans Business Alliance; and Quentin Messer, Jr. for sharing sector analyses developed by Louisiana Economic Development.
The authors also wish to thank George Hobor of Colgate University, whose expertise on regional economic development and linkages between industry sectors greatly improved this report. In addition, this report benefited enormously from groundbreaking research into the structure of the water management industry conducted by Marcy Lowe, Shawn Stokes, and Gary Gereffi at Duke University. The authors are also grateful to Jennifer Vey, Fellow for the Metropolitan Policy Program at the Brookings Institution, for her in-depth guidance on ground-truthing economic analyses.
Finally, our deep appreciation goes to team members for their significant contributions to this report. Ben Horwitz provided research, analysis, maps, and information design. Charlotte Cunliffe and Susan Sellers provided editorial support.
about the greater new orleans Community Data CenterThe Greater New Orleans Community Data Center makes informed decisions possible. For the past 15 years, we have been both a trusted resource and an objective partner in bringing reliable, thoroughly researched data to conversations about building a prosperous and inclusive region. A product of Nonprofit Knowledge Works, GNOCDC has played a critical role in assessing the strength of the New Orleans and Southeast Louisiana economy since the onset of the Great Recession. GNOCDC is also recognized across the country for expertise in New Orleans demographics, disaster recovery indica-tors, and actionable data visualization.

w w w . g n o c d c . o r g
Economic SynErgiES
AcroSS SouthEASt LouiSiAnASpring 2013
4
Louisiana Offshore Oil Port is the literal feedstock of the petrochemical manufacturing sectors in the Baton Rouge and New Orleans metros. The three regions also share complementary specializations in heavy construction and engineering, shipping, waste management, higher education, seafood processing, and certain advanced manufacturing sectors.
Harnessing these economic synergies in Southeast Louisiana will be critical for bolstering growth in three
emerging industries targeted by state and regional economic development organizations: the clean tech, digital media, and biosciences sectors. Many U.S. regions are competing for these same industries, and Southeast Louisiana faces significant
challenges in developing the financing, talent, and research capacities that can grow these nascent industries in the long-term.
At the heart of Southeast Louisiana’s economy are sophisticated heavy construction, engineering and scientific consulting, and water transportation. These services are omnipresent in three existing industries that economic development organizations aim to fortify: energy and chemicals, advanced manufactur-ing, and water management. The greatest challenge for these industries will be redeploying their assets to rebuild coastal marshes that protect economic infrastructure, including ports, pipelines, refineries, chemical plants, and ship yards. Wetland restoration activities will not only be synergistic to the region’s efforts toward economic transformation. They will also be key to the region’s overall sustainability.
Southeast Louisiana has received high rankings for its economic performance during the Great Recession. There is a newfound energy and optimism post-Katrina that is a much needed change after decades of economic stagnation, meager job growth, and high poverty rates.
However, the three metros of Baton Rouge, New Orleans, and Houma-Thibodaux are still largely depen-dent on legacy industries that are in decline, and the shift to a more diverse economy has been slow. Subsequently, these three Southeast Louisiana metros are expected to grow jobs 1.4 percent annually through 2020—well behind regions such as Austin-San Antonio, Raleigh, Houston, and Atlanta that are benefiting from earlier efforts to diversify their economies and are projected to grow jobs by more than 2 percent annually.
To compete with more vibrant Southern metros, Southeast Louisiana must diversify its economic base. At the same time, the region faces rapidly increasing flood risk to essential economic infrastructure and population centers. With post-Katrina rebuilding dollars coming to an end and an infusion of new dollars looming to support coastal restoration, the question arises: To what extent can New Orleans, Baton Rouge, and Houma-Thibodaux, working together, maximize their mutual economic sustainability?
To a great extent, the answer lies within a rigorous analysis of industrial drivers, or specializa-tions, within each region. Drilling down into the sub-sectors of shared industry specializations,
we find that Baton Rouge, New Orleans, and Houma-Thibodaux are highly synergistic to each other in their economic roles. For example, the oil and gas industry served by Houma-Thibodaux’s Port Fourchon and the
executive summary
To compete with more vibrant Southern metros,
Southeast Louisiana must diversify its economic base.
Baton Rouge, New Orleans, and Houma-Thibodaux are highly
synergistic to each other in their economic roles.
w w w . g n o c d c . o r g
Economic SynErgiES
AcroSS SouthEASt LouiSiAnASpring 2013
5
southeast louisiana has received high rankings for its economic performance during
the great recession.1 indeed, from December 2007 to December 2012, the three
metros of Baton rouge, new orleans, and houma-thibodaux combined grew jobs at a
rate of 0.8 percent while the nation lost 2.4 percent of all jobs.2 there is a newfound
energy and optimism post-Katrina that is a much needed change after decades of
economic stagnation, meager job growth, and high poverty rates.3
However, business leaders and economists generally agree that massive post-Katrina rebuilding invest-ments have buffered Southeast Louisiana from significant job losses during the recession, and that as these investments dwindle, the region will face new challenges. Because the region is still largely dependent on legacy industries that are declining and the shift to a more diverse economy has been slow, the fundamentals for a strong economy remain nascent.4
It should be no surprise that job projections for Southeast Louisiana continue to lag other more vibrant Southern regional economies. The three Southeast Louisiana metros combined are expected to grow jobs 1.4 percent annually through 2020 – well behind comparable regions such as Austin-San
Antonio, or individual metros such as Raleigh, Houston, and Atlanta, all of which are projected to grow over 2 percent annually.5 Broadly speaking, these other Southern regions have benefited from early efforts to diversify their economies into new and sometimes cutting-edge industry sectors.
To be sure, Southeast Louisiana is at a crossroads, with both threats and opportunities ahead. As the nation emerges from the recession, and our relative rankings slip, the optimism “bubble” may burst. Moreover, sea level rise is rapidly increasing the flood risk to essential economic infrastructure and population centers across Southeast Louisiana.
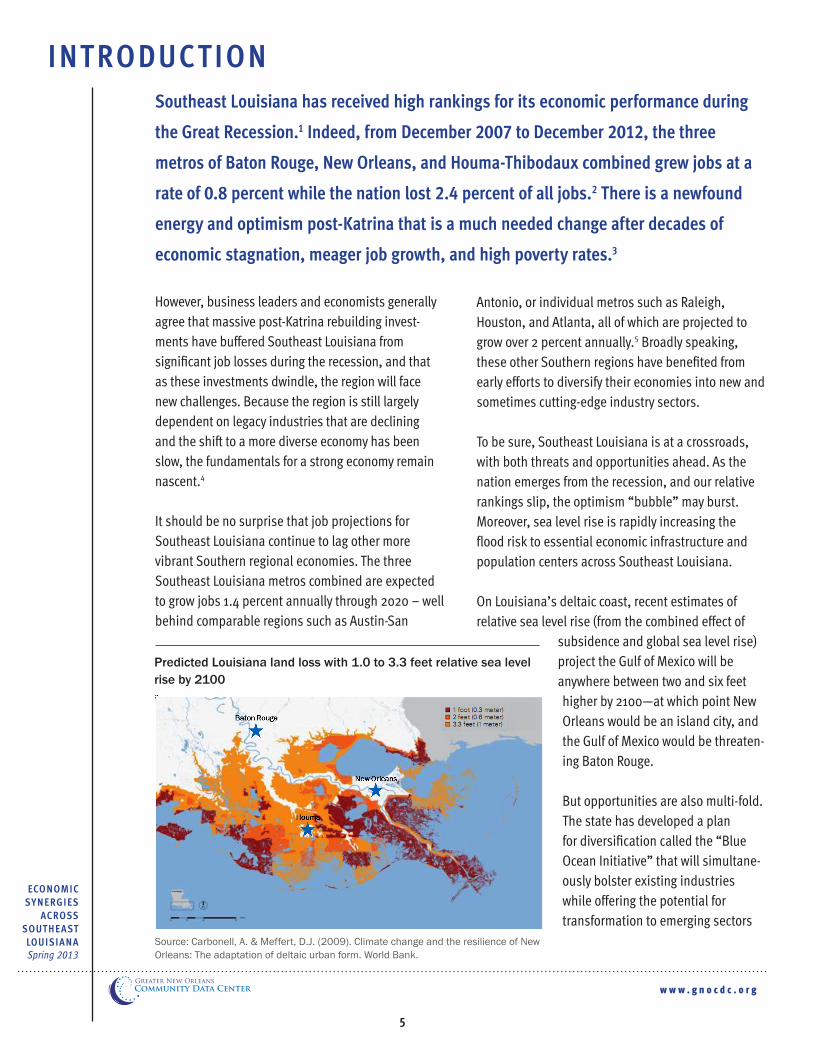
On Louisiana’s deltaic coast, recent estimates of relative sea level rise (from the combined effect of
subsidence and global sea level rise) project the Gulf of Mexico will be anywhere between two and six feet higher by 2100—at which point New Orleans would be an island city, and the Gulf of Mexico would be threaten-ing Baton Rouge.
But opportunities are also multi-fold. The state has developed a plan for diversification called the “Blue Ocean Initiative” that will simultane-ously bolster existing industries while offering the potential for transformation to emerging sectors
introDuction
Predicted Louisiana land loss with 1.0 to 3.3 feet relative sea level rise by 2100
Source: Carbonell, A. & Meffert, D.J. (2009). Climate change and the resilience of New Orleans: The adaptation of deltaic urban form. World Bank.
w w w . g n o c d c . o r g
Economic SynErgiES
AcroSS SouthEASt LouiSiAnASpring 2013
6
with greater potential for future job growth. With 55 percent of the state’s jobs and 53 percent of the state’s population located in Southeast Louisiana, this region has a particularly large role in the state’s plan. And following the passage of the RESTORE Act, the Gulf Coast is poised to receive billions of dollars for coastal restoration projects that will restore wetlands, reduce future flood risk, and stimulate the economy in ways that may accelerate the state’s plan for diversification. Meanwhile, economic development leaders across greater New Orleans and Baton Rouge have come together to form the Southeast Louisiana Super-Region Committee. With similar industries in their sights, these leaders are collaborating rather than competing in their efforts to attract new investment to the region—a sign of the increasing sophistication and alignment of regional leadership.
This report reinforces that Southeast Louisiana must continue to foster new strengths and grow new industry sectors in order to stay on the competitive edge. Moreover, it demonstrates that collaboration across the three metros in Southeast Louisiana
will be essential to the region’s long-term prosperity and sustain-ability. Importantly, this report provides new data that can help leaders understand the Southeast Louisiana regional economy as a whole, rather than as separate geographies defined by federal
and state agencies for administrative purposes. The report proceeds in three basic parts:
the big PiCture describes the baton rouge, new orleans, and houma-thibodaux “super region.” It raises awareness to sluggish job projec-tions and the need for further diversification to compete with more robust regions like Houston and Atlanta.
eConomiC synergies examines the intercon-nections between the three metro economies by highlighting commuter patterns, industrial specializations, and freight flows. This section provides a concise scan of each metro’s economic performance and market position, and emphasizes shared specializations and complementary strengths across metros to inform future growth plans.
the oPPortunity assesses and situates the market position of the super region, as a whole, relative to the sectors targeted in the state’s “blue ocean initiative.” It examines how these target sectors may draw on current strengths and bolster one another, and identifies interconnected assets and institutions, as well as challenges going forward.
Metro leaders, with support from state actors, have an opportunity and an obligation to work together to build a more prosperous and sustainable region. This report provides the rationale for and the start of a roadmap for that engagement.
Collaboration across the three metros in Southeast
Louisiana will be essential to the region’s
long-term prosperity and sustainability.
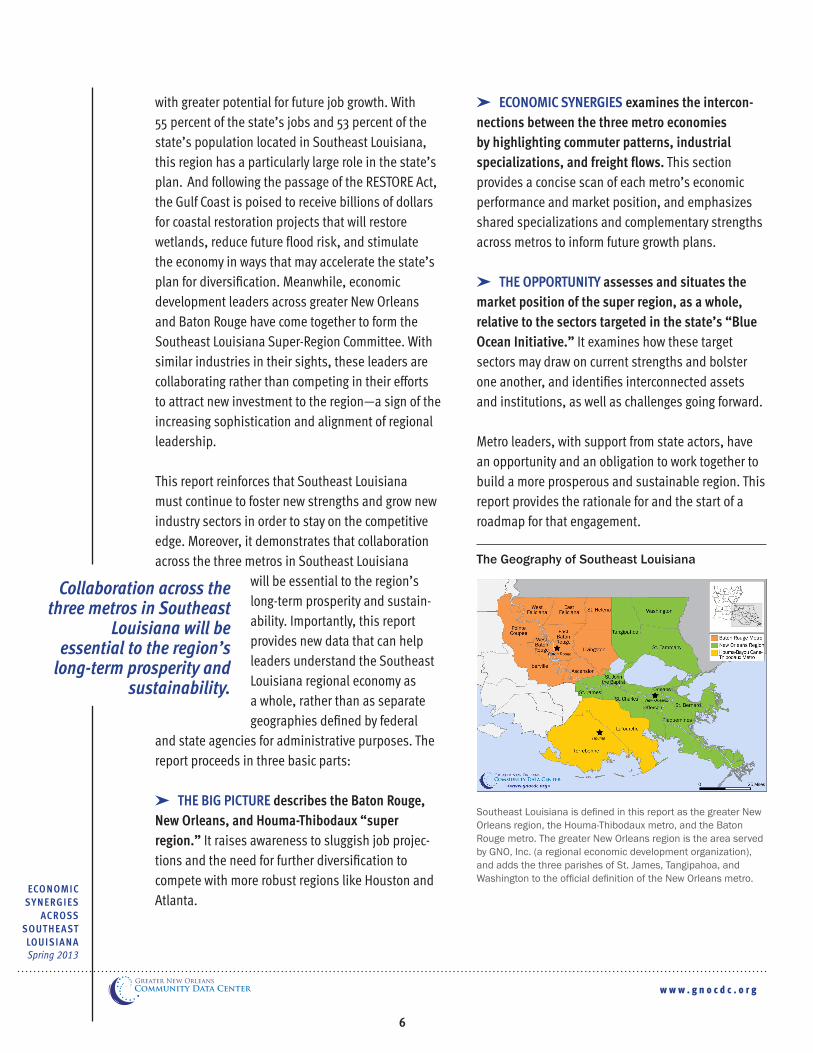
The Geography of Southeast Louisiana
Southeast Louisiana is defined in this report as the greater New Orleans region, the Houma-Thibodaux metro, and the Baton Rouge metro. The greater New Orleans region is the area served by GNO, Inc. (a regional economic development organization), and adds the three parishes of St. James, Tangipahoa, and Washington to the official definition of the New Orleans metro.

w w w . g n o c d c . o r g
Economic SynErgiES
AcroSS SouthEASt LouiSiAnASpring 2013
7
the Big P icturethe cities of new orleans, Baton rouge, and houma are each the center of a metropoli-
tan region—a larger economic geography where labor is pooled, and innovation and
production are concentrated.
Some scholars suggest that important economic interconnections extend across proximal metros forming “super regions” with interconnected firms and a shared specialized labor force.7 As a super region, Southeast Louisiana’s three metros are comparable in jobs and population to the Orlando metro, larger than the San Antonio metro, and eclipse the Raleigh-Durham super region, but are still significantly smaller than the Houston metro.8
If Southeast Louisiana aspires to compete with other more vibrant Southern regions like Raleigh, Houston, and the Orlando-Tampa super region, current job projections suggest that more work is needed. The Louisiana Workforce Commission projects that jobs in Southeast Louisiana will grow 1.3 percent annually through 2020.9 A slightly more optimistic outlook from Moody’s Analytics projects an annual growth rate of 1.4 percent. Either way, Southeast Louisiana’s job projections are more on par with Jackson, MS and
0.0%
1.0%
2.0%
3.0% 2.6%
2.4% 2.4%
2.1% 1.8%
1.4% 1.4% 1.2%
Houston, TX metro
Southeast Louisiana
Raleigh, NC metro
Atlanta, GA metro
Orlando-Tampa super region
Birmingham, AL metro
Jackson, MS metro
Austin-San Antonio super region
Birmingham, AL than with higher-performing regions. The Orlando-Tampa super region is projected to grow 1.8 percent annually, the Atlanta metro 2.1 percent, the Houston metro 2.4 percent, and the Austin-San Antonio super region is projected to grow 2.6 percent. If Southeast Louisiana were to grow jobs at the rate predicted for these high-performing peers through 2030, it would add at least 200,000 more jobs than currently anticipated.
Southeast Louisiana may experience somewhat more robust job growth than reflected in current job projec-tions (slated to be updated in June 2013). Sparked by low natural gas prices, more than $60 billion in new capital investments has been announced in Louisiana’s manufacturing sector.10 But the majority of jobs generated from these new projects will be construction jobs that will be largely eliminated by 2020. Without doubt, these jobs will be in the tens of thousands – but a much smaller number will remain
Projected employment compound annual growth rates, 2010-2020Select metros and super regions
Source: GNOCDC analysis of data from Moody’s Analytics (U.S. Bureau of Labor Statistics; CES, QCEW).

w w w . g n o c d c . o r g
Economic SynErgiES
AcroSS SouthEASt LouiSiAnASpring 2013
8
as permanent jobs within the new manufacturing facilities. Moreover, the oil bust of the 1980’s is a sobering reminder why Southeast Louisiana should not be complacent with job growth in industries
that are sensitive to swings in energy prices. Thus, it becomes even more important for Southeast Louisiana to focus on developing a
diversity of industries—at the very least to provide a hedge against rising natural gas prices in the U.S. or declining natural gas prices in other continents.
Houston provides a case study for why diversification is critical. After the 1980’s oil bust, Houston diversi-fied its economic base, growing specializations in innovative sectors such as wind energy, engineering, computer equipment manufacturing, and nanotech-nology, and growing total jobs at a much faster clip than Southeast Louisiana.11 Thus, as the national oil and gas extraction industry shrunk its employment base from 264,000 jobs in 1982 to 120,000 jobs in 2003, Houston’s diversification efforts were
1,722
1,530
2,593
916
832
1,049
0
500
1,000
1,500
2,000
2,500
3,000
19701980
19902000
2011
Houston metro
Southeast Louisiana
Oil bust
Early 1990’s recession
Early 2000s recession
GreatRecession
thousands
significantly more robust than Southeast Louisiana’s, resulting in booming job growth for that region.12
There is no doubt, a diverse economy is critically important for robust and sustainable economic growth. Developing a solid foundation in emerging new industries is an essential step toward putting our economy on a consistent growth trajectory. The state has made important strides in this direction with the development of its “Blue Ocean Initiative” in 2010. Southeast Louisiana—with the majority of the state’s jobs and population—concentrates the assets and industries that largely drive the state’s economy. With the conclusion of post-Katrina rebuilding dollars, a coastal crisis due to relative sea level rise, and an impending infusion of funding to support coastal restoration, the question arises: To what extent can New Orleans, Baton Rouge, and Houma-Thibodaux, working together, maximize their mutual economic sustainability? The answer to this question can be informed by a deeper understanding of the economic interconnections across the three metros.
Houston provides a case study for why diversification
is critical.
Historical job growth and loss, 1970-2011 (thousands of nonfarm jobs)Houston metro and Southeast Louisiana
Source: GNOCDC analysis of data from Moody’s Analytics (U.S. Bureau of Labor Statistics; CES, QCEW).
w w w . g n o c d c . o r g
Economic SynErgiES
AcroSS SouthEASt LouiSiAnASpring 2013
9
regional markets are made up of complex, place-based interactions that often
result in economic interdependence across proximal metros — ultimately forming
super regions. scholars studying super regions tend to look for several indicators
of economic interdependence, including a shared workforce, shared industry
specializations, and interconnected freight flows.13
economic synergies
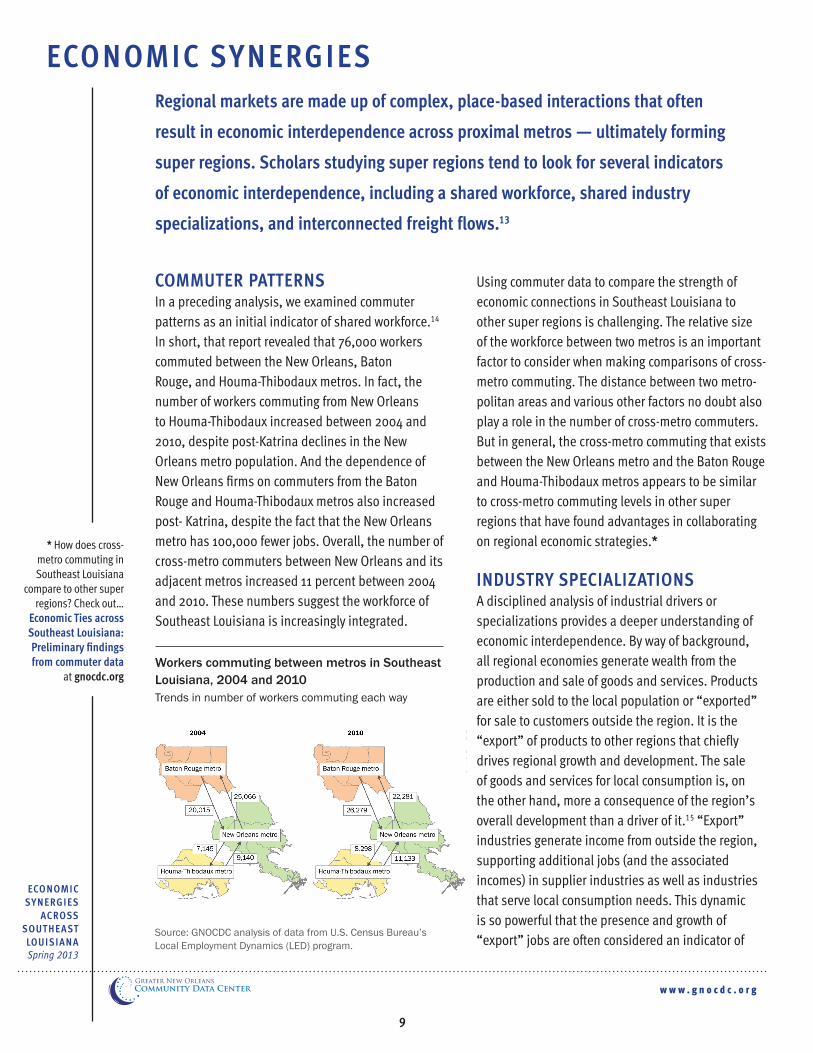
Commuter Patterns In a preceding analysis, we examined commuter patterns as an initial indicator of shared workforce.14 In short, that report revealed that 76,000 workers commuted between the New Orleans, Baton Rouge, and Houma-Thibodaux metros. In fact, the number of workers commuting from New Orleans to Houma-Thibodaux increased between 2004 and 2010, despite post-Katrina declines in the New Orleans metro population. And the dependence of New Orleans firms on commuters from the Baton Rouge and Houma-Thibodaux metros also increased post- Katrina, despite the fact that the New Orleans metro has 100,000 fewer jobs. Overall, the number of cross-metro commuters between New Orleans and its adjacent metros increased 11 percent between 2004 and 2010. These numbers suggest the workforce of Southeast Louisiana is increasingly integrated.
Workers commuting between metros in Southeast Louisiana, 2004 and 2010Trends in number of workers commuting each way
Using commuter data to compare the strength of economic connections in Southeast Louisiana to other super regions is challenging. The relative size of the workforce between two metros is an important factor to consider when making comparisons of cross-metro commuting. The distance between two metro-politan areas and various other factors no doubt also play a role in the number of cross-metro commuters. But in general, the cross-metro commuting that exists between the New Orleans metro and the Baton Rouge and Houma-Thibodaux metros appears to be similar to cross-metro commuting levels in other super regions that have found advantages in collaborating on regional economic strategies.*
inDustry sPeCializationsA disciplined analysis of industrial drivers or specializations provides a deeper understanding of economic interdependence. By way of background, all regional economies generate wealth from the production and sale of goods and services. Products are either sold to the local population or “exported” for sale to customers outside the region. It is the “export” of products to other regions that chiefly drives regional growth and development. The sale of goods and services for local consumption is, on the other hand, more a consequence of the region’s overall development than a driver of it.15 “Export” industries generate income from outside the region, supporting additional jobs (and the associated incomes) in supplier industries as well as industries that serve local consumption needs. This dynamic is so powerful that the presence and growth of “export” jobs are often considered an indicator of
Source: GNOCDC analysis of data from U.S. Census Bureau’s Local Employment Dynamics (LED) program.
* How does cross-metro commuting in Southeast Louisiana
compare to other super regions? Check out…
economic ties across southeast louisiana: Preliminary findings from commuter data
at gnocdc.org

w w w . g n o c d c . o r g
Economic SynErgiES
AcroSS SouthEASt LouiSiAnASpring 2013
10
a region’s overall economic success. Economists generally agree that an increase (or decrease) in the number of regional “export” jobs actually causes an increase (or decrease) in the number of local serving jobs.16 Although the number of additional jobs that each “export” job supports will vary by industry and region, a general rule is that each “export” job generates, on average, two additional jobs in the region. In addition, “export” jobs typically pay higher than average wages.17
In all three Southeast Louisiana metros, “export” industries pay at least 50 percent higher wages than local-serving jobs. The ratio of two local-serving jobs to every “export” job also holds true for New Orleans and Baton Rouge, but in Houma, there are fewer local-serving jobs for each “export” job. This reflects the strength of the Houma economy to attract workers who live outside the region to work in the offshore oil and gas industry (often in shifts of 7-days on/7-days off).
Regional economic systems are both dynamic and specialized. Every regional economy has a number
of “export” jobs—but the degree to which regional economies specialize in different “export” industries varies greatly. We define specializations as industries with a large number of “export” jobs and a high concentration of total jobs relative to the United States. These driver industries distinguish a metro’s economy from the economies of other regions and point to that metro’s competitive advantages.
In the next few pages, we quantify and track specialized driver industries over time for each of the three metros to allow for a clearer understanding of the strengths and vulnerabilities of each of the three regional economies in Southeast Louisiana. Then, we identify industry specializations that are shared across multiple Southeast Louisiana metros to point to important economic interconnections and synergies. Throughout we provide a rigorous analysis of the market position of each metro and the region as a whole. The aim is to inform bottom-up, multi-dimensional strategies that, through collective action, can enhance the economic prosperity and sustainability of Southeast Louisiana.
“Export” jobs vs. local-serving jobs
Source: GNOCDC analysis of data from Moody’s Analytics (U.S. Bureau of Labor Statistics; CES, QCEW).
Baton Rouge metro Greater New Orleans Houma-Thibodaux metro
Local-serving
Regional “export”
$40,031
$58,452
$42,360
$64,540
$36,340
$67,850
Jobs, 2011
Average annual wages, 2011
195,50739,090
53,802392,736
126,298
241,185
w w w . g n o c d c . o r g
11
how are the Drivers of the baton rouge metro eConomy Doing?
the baton rouge metro economy is largely depen-dent on public employment, heavy construction, and petrochemical manufacturing. state government and heavy construction have grown since 1980. as a result, total jobs in the baton rouge metro grew 57 percent from 1980 to 2011 while the nation grew jobs by only 45 percent. For three decades, state government and universities have been the top drivers in the Baton Rouge metro and a stabilizing influence on the economy.18 Louisiana State Univer-sity alone generates 3 percent of metro gross product, and 5 percent of metro wages.19 However, because of the recent state budget crisis, state government and universities have shed nearly 2,000 jobs since 2009 and now have 39,700 “export” jobs.
Since 1980, heavy construction and engineering has outperformed petrochemical manufacturing to become the second largest economic driver in the Baton Rouge metro. Although heavy construction lost one-quarter of its jobs between 2000 and 2004, the industry has since rebounded and now has nearly 19,600 “export” jobs.
Petrochemical manufacturing is the third largest driver in the Baton Rouge metro, which is home to about 65 petrochemical facilities, including Exxon-Mobil, Dow Chemical, Shell, and BASF. Although petrochemical manufacturing employment has declined since 1980, industry expansion is underway spurred by low natural gas prices.20 For example, CF Industries is building a $2.1 billion expansion of their nitrogen facility in Donaldsonville, and Methanex Corp is investing $550 million in a methanol plant in Ascension Parish.21
shipping is the fourth largest driver in Baton Rouge, owing to its deep water port at the convergence of the Mississippi River and the Gulf Intracoastal Waterway. Although shipping jobs are up since 1980, employ-ment has fallen from 3,800 in 2000 to 3,400 in 2011.
367,500The number of
jobs in the Baton Rouge metro
(2011).
35%The share of jobs
in Southeast Louisiana that are within the
Baton Rouge metro (2011).
eConomiC synergies
aCross southeast louisianaSpring 2013
Six more economic drivers in the Baton Rouge metro had between 700 and 2,000 “export” jobs in 2011. insurance agencies, industrial machinery leasing and repair, fabricated metal manufacturing, and waste management services have all grown since 1980, by a combined 4,000 jobs. The waste manage-ment sector includes hazardous material response, tank cleaning, and cargo hold cleaning for industrial clients in Baton Rouge and the nation.
imPliCationsEmployment in the Baton Rouge metro is heavily dependent on state government and public universi-ties, which have endured significant budget cuts since 2009. For example, Southern University’s School of Architecture—which graduates more black architects than any other school in the state—is on the verge of elimination.22 Nonetheless, Baton Rouge’s petrochemical manufacturing is poised for growth due to low prices for natural gas and strong regional transportation assets, including the Port of Greater Baton Rouge. In addition, the Tuscaloosa Marine Shale is a new and relatively large unconven-tional source of crude oil that spans the Baton Rouge metro.23
Current industry specializations—including the strong research assets at Louisiana State University (LSU) and Southern University—point to opportuni-ties in emerging industries targeted by state and regional economic development leaders, such as water management, digital media, advanced manufacturing, and clean tech. (See p.22-33 for more about these industries).
For example, the Water Institute of the Gulf generates top-level scientific research to support the state’s water management. And the Louisiana Digital Media Center combines together the assets of LSU and private companies to advance technologies and a workforce for the digital media industry.

w w w . g n o c d c . o r g
12
eConomiC synergies
aCross southeast louisianaSpring 2013
how are the Drivers of the baton rouge metro eConomy Doing? (cont’d)
Regional “export” jobs for the 10 largest “export” specializationsBaton Rouge metro24
State Government &Universities $46,208
Average wages for
regional “export” jobs, Baton Rouge metro, 2011
Cement & ConcreteManufacturing $46,837
Paper & Wood Manufacturing $65,079
Waste Management $51,144
Fabricated Metal Manufacturing $56,150
Industrial Machinery Leasing & Repair $49,099
Insurance Agencies $52,620
Shipping $56,243
Petrochemical Manufacturing and Oil & Gas $95,015
Heavy Construction & Engineering $63,582
50
40
30
20
10
0
thousand jobs19
80
1990
2000
2004
2011
Source: GNOCDC analysis of data from Moody’s Analytics (U.S. Bureau of Labor Statistics: CES, QCEW).

w w w . g n o c d c . o r g
13
the greater new orleans region is largely dependent on drivers that are declining, which has resulted in 0.1 percent growth in total jobs from 1980 to 2011 during a time when the nation grew jobs by 45 percent. For three decades, tourism, oil and gas, and shipping have been the top drivers in the New Orleans region despite shedding tens of thousands of jobs.
tourism is the largest specialization in greater New Orleans, even after Hurricane Katrina wiped out 20,000 jobs. Employment is rebounding but the tourism sector has lower wages than other top drivers.25 oil and gas is the second largest driver in greater New Orleans, but employment plummeted during the oil bust of the 1980’s and continued its descent—with the exception of a brief increase in 2008 when crude oil prices spiked.26 shipping is greater New Orleans’ third largest driver, but employ-ment declined by 50 percent between 1980 and 2004. Since 2006 about 1,000 jobs have been added due to growth in the region’s four deep water ports—the Ports of South Louisiana, New Orleans, St. Bernard, and Plaquemines.27
In the 1990s, jobs in higher education surpassed ship building to be the fourth largest economic driver in the metropolitan area.28 However, jobs in higher education are down by about 1,000 jobs compared to pre-Katrina. heavy construction and engineering is the fifth largest driver, and employment has doubled since 2004 due to post-Katrina rebuilding activity. ship building, on the other hand, lost 4,000 jobs between 2004 and 2011 as Avondale Shipyard prepared for closure.29
legal services and insurance agencies represent growth in the “export-oriented” share of jobs in these industries, such as legal firms with expertise in the oil and gas industry. Employment has shrunk in select food manufacturing (coffee, tea, spice, and seafood), falling from about 4,000 jobs in 1980 to 2,000 jobs in 2011. Finally, the motion picture
588,200The number of jobs in greater
New Orleans (2011).
56%The share of jobs in
Southeast Louisiana that
are within greater New
Orleans (2011).
eConomiC synergies
aCross southeast louisianaSpring 2013
how are the Drivers of the greater new orleans regional eConomy Doing?
industry has emerged as a new specialization in greater New Orleans, accounting for about 2,000 jobs in 2011. Louisiana—and New Orleans in particular—has become a popular destination for film production because of generous tax credits and a unique, creative culture.
imPliCationsThe New Orleans region is largely dependent on legacy industries in decline, including tourism, oil and gas, and shipping.* Knowledge-based jobs, such as those in higher education, legal services, and insur-ance agencies have begun to gradually emerge. But growth in knowledge-based industries has not made up for the losses in the top economic drivers, and the shift to a more diverse economy has been slow.
Nonetheless, the greater New Orleans region has formidable competitive strengths that can provide the foundation for economic growth. These include not only place-based assets such as its ports, rail system, and petrochemical plants along the Mississippi River, but also research and development capabilities that will be crucial to the innovation of high value products for the future. For example, since 1999, the National Aeronautics and Space Administration (NASA) and the University of New Orleans (UNO) have partnered in the development of advanced materials and fabrication processes at the National Center for Advanced Manufacturing. UNO includes the School of Naval Architecture and Marine Engineering. Tulane is constructing a new riverfront campus for research in coastal sciences and engineering.
Finally, current industry specializations in greater New Orleans and existing university-industry partner-ships provide a foundation for growth in many of the emerging industries targeted by state and regional economic development leaders, including advanced manufacturing, water management, clean tech, and digital media. (See p.22-33 for more information on these target industries).
* How are the drivers of the greater New Orleans regional economy doing
relative to national trends? Check out… regional “export” industries: Drivers of the new orleans
economy at gnocdc.org

0
10
20
30
40
50
60 19
80
1990
2000
2004
2011
$72,657
Average wages for
regional "export" jobs, Greater New
Orleans, 2011
thousand jobs
$32,162Tourism
$44,889
Motion Picture $79,378
Food Manufacturing
Insurance Agencies $85,925
Legal Services $82,280
Ship Building $62,791
Heavy Construction &Engineering $66,474
Higher Education
$54,528
Shipping
Oil & Gas $109,362
$44,889
w w w . g n o c d c . o r g
eConomiC synergies
aCross southeast louisianaSpring 2013
14
how are the Drivers of the greater new orleans regional eConomy Doing? (cont’d)
Regional “export” jobs for the 10 largest “export” specializationsGreater New Orleans30
Source: GNOCDC analysis of data from Moody’s Analytics (U.S. Bureau of Labor Statistics: CES, QCEW).

w w w . g n o c d c . o r g
eConomiC synergies
aCross southeast louisianaSpring 2013
15
how are the Drivers of the houma-thiboDaux metro eConomy Doing?
most drivers of the houma metro economy have grown since 1980 and total jobs are 39 percent greater than in 1980. still, job growth has lagged thenation, which grew jobs by 45 percent since 1980. the houma metro is deeply dependent on the offshore oil and gas industry. Port Fourchon services about half of all drilling rigs in the Gulf of Mexico and over 75 percent of deep water oil production in the Gulf—equating to about 18 percent of the nation’s oil supply and 20 percent of the domestic natural gas supply.31 The port also serves as the land base for the Louisiana Offshore Oil Port (LOOP), which handles about 14 percent of foreign oil imports and connects to 50 percent of U.S. refining capacity.32 Within this context, it is easy to understand why nine of the ten drivers of the Houma metro economy support the offshore oil and gas industry. The exception being the seafood and sugar manufacturing industries, in which the Houma metro also has a deep specialization.
In 1980, exploration and production companies were the largest driver of the Houma metro. But employ-ment plummeted during the oil bust and never fully recovered as the oil and gas extraction industry shrunk its employment base nationwide between 1982 and 2003.33 Nonetheless, water transportation services that support exploration and production have grown to support deep water oil production. Starting in 2004, waterborne transportation growth began to be led by an increase in inland water transportation as shipyards serving the oil and gas industry developed further inland. As of 2011, there were 8,800 “export” jobs in shipping and 5,350 in oil and gas extraction. (Note that oil and gas industry employment surged in 2008 as crude oil prices spiked to $135 per barrel.34) The ship building and industrial machinery leasing and repair industries build and maintain the fleet of work and supply boats that support offshore drilling in the Gulf. These two drivers accounted for 2,800 and 3,000 “export” jobs respectively in 2011.35 machinery manufacturing also accounted for about 2,800 jobs
92,900The number
of jobs in the Houma-
Thibodaux metro
(2011).
9%The share of jobs
in Southeast Louisiana that
are within the Houma-
Thibodaux metro (2011).
in 2011. This driver industry includes manufacturers of drilling rigs, drilling equipment, and oil derricks.
Houma’s sixth largest driver, heavy construction,surged from 1,000 “export” jobs in 2004 to 2,250in 2011—driven by the construction of oil and gas pipelines, marine facilities, and levees during a time when these industries declined nationally. “Export” employment in the waste management sector increased from 590 in 2010 to 950 in 2011, following the 2010 Deepwater Horizon oil disaster and stricter federal regulations enacted on plugging and decom-missioning platforms.
Finally, sugar and seafood manufacturing is Houma’s tenth largest driver, although farmers and fishers—who are typically self-employed—are undercounted within payroll employment data. The Houma metro includes two of 13 commercial fishing ports in the Gulf of Mexico, which yield more than half of the nation’s shrimp and oyster harvest.36
imPliCationsThe Houma-Thibodaux economy produces the feedstock for petrochemical manufacturers in the New Orleans and Baton Rouge metros. Current industry specializations within the Houma metro point toward opportunities in emerging target industries, such as advanced manufacturing, water management, and clean tech. (See p.22-33 for more information on these industries). For example, Houma’s specializations in waterborne transportation, heavy construction, and ship building can also be adapted to coastal restora-tion work.37 Houma-Thibodaux also has important renewable energy assets for producing biofuels and power from biomass, including a specialization in sugar manufacturing, a United States Department of Agricul-ture sugarcane research unit, and a biorefinery project. In addition, Fletcher Technical Community College and Nicholls State University have strong programs to support the workforce needs of the local industries.

1980
1990
2000
2004
2011
Sugar & SeafoodManufacturing $32,520
Waste Management $28,832
Management of Companies $47,109
Heavy Construction $69,532
Machinery Manufacturing $71,908
Ship Building $53,987
Industrial MachineryLeasing & Repair $83,648
Oil & Gas $92,543
Shipping & OtherTransportation $81,092
Average wages for
regional “export” jobs,
Houma metro, 2011
thousand jobs 10
5
0
Fabricated Metal Manufacturing $67,278
w w w . g n o c d c . o r g
Economic SynErgiES
AcroSS SouthEASt LouiSiAnASpring 2013
16
how ArE thE drivErS of thE houmA-thibodAux mEtro Economy doing? (cont’d)
Regional “export” jobs for the 10 largest “export” specializationsHouma-Thibodaux metro38
Source: GNOCDC analysis of data from Moody’s Analytics (U.S. Bureau of Labor Statistics: CES, QCEW).

w w w . g n o c d c . o r g
Economic SynErgiES
AcroSS SouthEASt LouiSiAnASpring 2013
17
Shared specialization in all 3 metros Shared specializations in 2 metros Other export jobs
All other jobs
Greater New Orleans Baton Rouge metro Houma metro
BATON ROUGE METRO
State Government and UniversityInsurance AgenciesPaper and Wood ManufacturingCement and Concrete Manufacturing
HOUMA METRO
All other export jobs
Total Export Jobs
Total Jobs
Petrochemical Manufacturing, and Oil and GasHeavy Construction and EngineeringShipping
Industrial Machinery Leasing and RepairFabricated Metal ManufacturingWaste Management
3,358
39,695
1,853829
677
39,841
126,298
367,483
13,463
21,930
1,770
1,610
1,272
GREATER NEW ORLEANS
Tourism
Legal ServicesMotion Picture
Higher Education
Insurance Agencies
All other export jobs
Total Export Jobs
Total Jobs
Oil and Gas
Heavy Construction andEngineeringShipping
Ship Building
Food Manufacturing
39,306
3,5651,886
11,264
2,843
88,159
195,507
588,243
17,821
9,515
13,711
5,483
1,954
Management of Companies
All other export jobs
Total Export Jobs
Total Jobs
Oil and Gas
Heavy Construction
Shipping
Industrial Machinery Leasing and RepairFabricated Metal ManufacturingWaste Management
Ship Building
Seafood and Sugar Manufacturing
Machinery Manufacturing1,886
10,065
39,090
92,892
5,355
2,255
8,790
2,966
875
951
2,804
380
2,763
New Orleans, Baton Rouge, and Houma-Thibodaux each have unique economic assets and challenges as demonstrated on the preceding pages. Yet Houma, Baton
Rouge, and New Orleans are more alike than they are different. All three regions share specializations in
Top industry specializations in Southeast LouisianaSorted by shared specializations
Source: GNOCDC analysis of data from Moody’s Analytics (U.S. Bureau of Labor Statistics: CES, QCEW). For our methodology and definitions of each industry specialization by region, see the downloadable data tables accompanying this report at www.gnocdc.org.
Do new orleans, baton rouge, anD houma-thiboDaux share imPortant eConomiC synergies?
Ten industry specializations are currently shared across
these three Southeast Louisiana metros.
oil, gas, and petrochemicals; heavy construction and engineering; and shipping. And seven other industry specializations are shared across two of the three metros, including waste management, ship building, higher education, and insurance agencies. All told, ten industry specializations are currently shared across these three Southeast Louisiana metros.

w w w . g n o c d c . o r g
Economic SynErgiES
AcroSS SouthEASt LouiSiAnASpring 2013
18
At first blush it might appear that New Orleans, Houma, and Baton Rouge are competitive in many of the same industry specializations. But drilling down into the sub-sectors of these shared industry specializations, and examining location quotients (LQs) at the sub-sector level, we find that the metros are highly complementary to each other in their economic roles (see table 1). These synergies across sub-sectors and metros point to specific opportuni-ties for cross-metro collaboration on economic development strategies. For example:
new orleans, baton rouge, and houma-thibodaux share a specialization in energy and petrochemicals, and yet each metro is strongest within a different sub-sector. The Houma metro is most specialized in oil and gas extraction, and support activities (with a LQ of 7.7 and 18.1 respec-tively); the New Orleans region is most specialized in petroleum product manufacturing (with an LQ of 8.7); and the Baton Rouge metro is most specialized in chemical manufacturing (with an LQ of 13.8 for basic chemical manufacturing).
houma, baton rouge, and new orleans are all powerhouses in shipping, but have unique sub-sector specializations as well. The Houma metro is very specialized in water transportation services that support the offshore oil industry. And because of the complex logistics of transporting equipment and crews for oil rig construction, the Houma metro is uniquely specialized in freight transportation arrangement services. Meanwhile, the New Orleans region is a center for international trade, and is uniquely specialized in warehousing.39 Specializa-tions in coastal and inland water transportation extend to the Baton Rouge metro, home to the Port
of Greater Baton Rouge and the farthest inland deep water port on the Mississippi River.
all three southeast louisiana economies share a specialization in heavy construction, although baton rouge is strongest in every sub-sector. Large industrial construction projects (primarily related to chemical manufacturing) give Baton Rouge a competi-tive edge over New Orleans and Houma within heavy construction and engineering sub-sectors. But all three regions are most specialized (relative to the U.S.) in other heavy construction projects, which include marine facilities, dredging, channeling, dock construction, and levees. Finally, architecture and engineering is a specialization in New Orleans and Baton Rouge, but not in Houma.
higher education is an industry specialization in baton rouge and new orleans, while in houma-thibodaux the higher education sector is a close partner with the maritime and energy industries. Baton Rouge is specialized within public colleges and universities, and New Orleans is specialized within private universities. And in Houma-Thibodaux, Nicholls State University and Fletcher Technical Community College provide education and technical training in close partnership with local industries.40 Indeed, the higher education sector in Southeast Louisiana is critical to providing a trained workforce of engineers, managers, process technicians, and logisticians for the region’s industrial drivers. Universities are also critically important for producing the innovative research and technologies that can support emerging sectors, such as water management, clean tech, digital media, biosciences, and advanced manufacturing. (See p.22-33 for more information on these industries).
houma and baton rouge share a specialization in fabricated metal manufacturing. Houma is special-ized within machine shops that support oil and gas operations while Baton Rouge is specialized within boiler, tank, and shipping container manufacturing.
What is a Location Quotient?A location quotient (LQ) is calculated as the ratio of an industry’s share in the local economy over that industry’s share in the national economy. A LQ greater than 1.0 indicates a specialization within the local economy.
Do new orleans, baton rouge, anD houma-thiboDaux share imPortant eConomiC synergies? (cont’d)

w w w . g n o c d c . o r g
Economic SynErgiES
AcroSS SouthEASt LouiSiAnASpring 2013
19
waste management and remediation services are a specialization in houma, baton rouge, and new orleans. All three Southeast Louisiana regions share a specialization in waste management, although “export” employment in the New Orleans region was insufficient to make it into the top ten. Waste management and remediation services include hazardous material response (e.g. oil spills), tank cleaning, cargo hold cleaning, as well as plugging and abandoning wells and decommissioning platforms for the offshore oil and gas industry.
ship building is a shared specialization in houma and new orleans, although a major new orleans shipyard is on the verge of closing. Houma and New Orleans have a long history of building ships for the offshore energy and marine transporta-tion industry, as well as for U.S. government and military. However, Avondale Shipyard is likely to close in 2013, which would be a significant setback to the specialized expertise New Orleans has developed in the ship building industry.
the new orleans region and houma metro share a specialization in seafood products, includ-ing four of 13 commercial fishing ports in the gulf of mexico, which together yield more than half of the nation’s shrimp and oyster harvest.41 However, commercial fishers are typically self-employed and their deckhands often include unpaid family members. Thus, though important to the Houma and New Orleans regions, the vast majority of commercial fishing jobs are not accounted for within this employ-ment data.
imPliCationsCrossing throughout Southeast Louisiana’s driver industries are sophisticated heavy construction, engineering and scientific consulting, and water transportation and management expertise. This
specialized expertise has largely been developed to serve energy and petrochemical clients within Southeast Louisiana, and yet can also be applied to serve new industries and clients around the world. For example, the region’s engineers have developed specialized skills working within a challenging coastal environment. This expertise can be exported to serve industries and governments in other coastal areas. The region’s heavy construction firms can also export their expertise in managing large-scale construction projects nationally and internationally. Thus, the current economic base offers a strong foundation for diversification.
Do new orleans, baton rouge, anD houma-thiboDaux share imPortant eConomiC synergies? (cont’d)

w w w . g n o c d c . o r g
Economic SynErgiES
AcroSS SouthEASt LouiSiAnASpring 2013
20
Table 1. Location quotients for industry specializations in Southeast Louisiana, 2011
Source: GNOCDC analysis of data from Moody’s Analytics (U.S. Bureau of Labor Statistics: CES, QCEW).
Industry specialization
NAICS code Industry
Greater New
Orleans
Baton Rouge metro
Houma metro
Southeast Louisiana
2111 2.9Oil and Gas Extraction 0.2 7.7 2.42131 Support Activities for Mining 1.5 2.9 18.1 3.73241 Petroleum and Coal Products Manufacturing 7.9 8.7 1.5 7.83251 Basic Chemical Manufacturing 13.8 4.7 0.6 7.5
3252Resin, Synthetic Rubber, and Artificial Synthetic Fibers and Filaments Manufacturing 9.3 2.3 0.5 4.6
3253Pesticide, Fertilizer, and Other Agricultural Chemical Manufacturing 11.5 3.0 0.8 5.8
3259 Other Chemical Product and Preparation Manufacturing 1.0 2.0 0.2 1.54831 Deep Sea, Coastal, and Great Lakes Water Transportation 2.7 6.0 39.1 7.84832 Inland Water Transportation 10.1 26.1 121.8 29.04842 Specialized Freight Trucking 1.3 0.8 3.2 1.14883 Support Activities for Water Transportation 7.5 12.9 60.7 15.34885 Freight Transportation Arrangement 0.3 1.0 2.0 0.84931 Warehousing and Storage 0.6 1.2 0.5 0.92362 Nonresidential Building Construction 3.1 1.4 0.7 1.92371 Utility System Construction 7.6 1.4 4.0 3.82373 Highway, Street, and Bridge Construction 4.1 3.0 2.0 3.32379 Other Heavy and Civil Engineering Construction 10.7 7.1 9.4 8.65413 Architectural, Engineering, and Related Services 1.9 1.4 1.0 1.56113 Colleges, Universities, and Professional Schools (private) 0.3 1.5 0.1 1.0
State Government (including public universities) 2.8 1.1 0.9 1.63324 Boiler, Tank, and Shipping Container Manufacturing 1.9 0.4 0.5 1.0
3327Machine Shops, Turned Product, and Screw, Nut, and Bolt Manufacturing 0.8 0.5 2.1 0.8
5622 Waste Treatment and Disposal 1.5 1.4 2.3 1.55629 Remediation and Other Waste Management Services 4.3 1.7 10.8 3.4
Ship Building 3366 Ship and Boat Building 0.8 10.2 32.9 8.93117 Seafood Product Preparation and Packaging 0.9 3.6 7.7 3.03119 Other Food Manufacturing 0.1 1.8 0.3 1.13113 Sugar and Confectionery Product Manufacturing 1.8 1.0 3.8 1.5
5324Commercial and Industrial Machinery and Equipment Rental and Leasing 2.9 2.4 25.8 4.6
8113Commercial and Industrial Machinery and Equipment (except Automotive and Electronic) Repair and 3.2 1.8 7.6 2.8
Insurance Agencies 5242
Insurance Agencies, Brokerages, and Other Insurance Related Activities 1.7 1.7 0.6 1.6
Food Manufacturing
Industrial Machinery Leasing and Repair
Oil, Gas, and Petrochemicals
Shipping
Heavy Construction and Engineering
Higher Education
Fabricated Metal Manufacturing
Waste Management
a location Quotient of 121.8?An industry with a location quotient equal to one indicates that a region has the exact same share of total jobs in that industry as the United States. An industry with a location quotient equal to two indicates that a region has two times the share of total jobs in that industry as the nation. An industry with a location quotient equal to 121.8, such is the case for inland transportation in the Houma-Thibodaux metro, indicates Houma has 121.8 times the share of total jobs in inland transportation as the nation! How is this possible? In 2011, Houma had 2,190 jobs in inland transportation out of 92,890 total jobs. Thus, 2.4 percent of total jobs were in inland transportation. The entire U.S. had only 25,470 jobs in inland transportation out of 131,359,416 total jobs. Thus, 0.02 percent of total jobs were in inland transportation. 121.8= 2.4 percent/ 0.02 percent.

w w w . g n o c d c . o r g
Economic SynErgiES
AcroSS SouthEASt LouiSiAnASpring 2013
21
freight flowsThus far, we’ve examined commuter patterns and industry specializations as indicators of economic integration in Southeast Louisiana. Researchers at the University of Texas have used freight flows as a measure of economic interdependence, and we follow suit here.42 Although earlier analyses of industry specializations suggested competition in the ship-ping and transportation sector, data on freight flows reveals a strong connection between Baton Rouge and New Orleans. In fact, the value of freight shipped between Baton Rouge43 and New Orleans is higher than between Baton Rouge and any other region in the U.S., and higher than between New Orleans and any other region in the U.S.
In 2007, the Baton Rouge region sent $7.7 billion in commodities to New Orleans, and New Orleans sent $19.2 billion in commodities to Baton Rouge. The value of waterborne shipments from Baton Rouge to New Orleans ($4.9 billion) amounted to 31 percent of the value of all commodities shipped from Baton Rouge to domestic locations (45 percent if you exclude shipments that stayed within Baton Rouge).
1,180 1,561
4,892
17,315
6,000
12,000
18,000
24,000
New Orleans to Baton Rouge
Baton Rouge to New Orleans
Pipeline
Multiple modes & mail
Water
Rail
Truck
19,206
7,772
Value of freight flows (in millions of dollars) between New Orleans and Baton Rouge, 2007By mode
New Orleans in turn sent $17.3 billion in goods to Baton Rouge via pipeline in 2007. An analysis of the commodity data indicate the bulk of this freight was gasoline and fuel oil (including diesel). The New Orleans metro sent $9.1 billion in gasoline and $5.9 billion in fuel oil to the Baton Rouge region—amount-ing to 30 percent and 24 percent, respectively, of all shipments of these two commodities from New Orleans to domestic locations (44 percent and 48 percent if you exclude shipments that stayed within New Orleans).
Although data on freight flows from the U.S. Bureau of Transportation Statistics is not available for the Houma metro, thousands of miles of pipeline move crude oil and natural gas from the coastline to refineries and chemical plants in the New Orleans and Baton Rouge metros.44 And although Houma-Thibodaux is very specialized in coastal and inland water transportation, the shipping industry there is uniquely focused on servicing the offshore oil and gas industry rather than on shipping commodities to other destinations.
2,775 2,450
5,916 1,652
9,159
6,000
12,000
18,000
24,000
New Orleans to Baton Rouge
Baton Rouge to New Orleans
Gasoline Fuel oils Basic chemicals Other Crude petroleum Natural gas Plastics/rubber
19,206
7,772
Value of freight flows (in millions of dollars) between New Orleans and Baton Rouge, 2007By commodity
Source: U.S. Bureau of Transportation Statistics, Freight Analysis Framework (FAF).

w w w . g n o c d c . o r g
Economic SynErgiES
AcroSS SouthEASt LouiSiAnASpring 2013
22
the oPPortunityThe preceding section provides a detailed analysis of economic synergies across Southeast Louisiana, and, in particular, shared specializations that are important for informing future growth plans. This section examines the opportunities, or target sectors, identified by the state for future growth, provides a baseline analysis of Southeast Louisiana’s economy relative to each of the target sectors, and examines the extent to which the region can draw on current strengths to bolster growth in each sector— as well as the challenges associated with each.
In 2010, Louisiana Economic Development (LED) developed a plan to target industry sectors that represented the best growth opportunities in the state. The state’s plan, called the “Blue Ocean
Initiative,” aspires for Louisiana to achieve employment growth rates similar to Southern peers such as Texas and Georgia. The plan aims to capitalize on the state’s unique strengths by, on the one hand, targeting emerging sectors of high growth where Louisiana has a clear advantage, and, on the other hand,
supporting legacy sectors of moderate or low growth where Louisiana has a clear advantage and accelera-tion is possible.
With 55 percent of the state’s jobs and 53 percent of the state’s population, Southeast Louisiana is critically important for the execution of the state’s plan to accelerate Louisiana’s economic growth. Each of the major regional economic development organizations in Southeast Louisiana including the Baton Rouge Area Chamber, Greater New Orleans, Inc. (GNO, Inc.), the New Orleans Business Alliance, and the South Louisiana Economic Council developed strategic plans separately from the state. But the target industries of each align very nicely with the target industries of LED. This alignment suggests a new window of opportunity for New Orleans, Baton Rouge, and Houma-Thibodaux to collaborate on economic development strategies.
Specifically, state and regional economic develop-ment organizations are already aligned in targeting six broad industry sectors: energy and chemicals, advanced manufacturing, water management, clean tech, digital media, and biosciences.
Energy and Petrochemical Manufacturing
Advanced Manufacturing
Water Management
Clean Tech
Digital Media
Biosciences
Energy
Advanced manufacturing
Water management
Clean tech
Digital media and software
Specialty healthcare
Louisiana Economic Development
Energy
Advanced manufacturing
Emerging environmental
Software and digital
Emerging environmental
Biosciences
GNO, Inc.
Chemicals and new energy production
Fabricated structural materials
Technical research and consulting
Emerging fuels
Software design
Baton Rouge Area Chamber
Marine transport and pipelines
Equipment manufacturing; Metal fabrication
Environmental and geotechnical services
Compressed natural gas and biofuels
South Louisiana Economic Council
Sustainable industries
Sustainable industries
Digital media
New Orleans Business Alliance
Advanced manufacturing
Bioinnovation and health care
With 55 percent of the state’s jobs and 53 percent
of the state’s population, Southeast Louisiana is
critically important for the execution of the state’s plan
to accelerate Louisiana’s economic growth.
Regional economic development organizations are aligned with state in targeting six industry sectors
Sources: Louisiana Economic Development, Greater New Orleans, Inc., New Orleans Business Alliance, Baton Rouge Area Chamber, and South Louisiana Economic Council.Notes: This table includes only target sectors where regional economic development organizations (EDOs) are aligned with state targets. EDOs may be targeting other industry sectors as well. See the downloadable data tables at www.gnocdc.org for the 4-digit NAICS within each sector.

w w w . g n o c d c . o r g
Economic SynErgiES
AcroSS SouthEASt LouiSiAnASpring 2013
23
The exact definition employed by each economic development organization varies somewhat to reflect the diverse assets and goals of each region. In order to create a set of baseline data for Southeast Louisiana for these six sectors, we combined the definitions from several regional economic develop-ment organizations, including Louisiana Economic Development, GNO, Inc., Baton Rouge Area Chamber, New Orleans Business Alliance, and South Louisiana Economic Council.45 The definitions of each sector are spelled out in more detail beginning on p.26.
Table 2. Jobs, wages, and location quotients by target industry sector, 2011Southeast Louisiana
target seCtors inCluDe “exPort” inDustriesImportantly, the target sectors where regional economic development organizations are aligned with state targets are “export” industries that bring in revenues from outside Southeast Louisiana. Although the number of additional jobs that each “export” job supports will vary by industry and region, a general rule is that each “export” job generates, on average, two additional jobs in the region. In addition, “export” jobs typically pay higher than average wages.
Like the state, these regional economic development organizations aim to capitalize on each region’s traditional strengths, while also looking toward new and emerging industries that deploy and leverage core competitive advantages. Importantly, they have narrowed their focus to high-wage growth sectors. Average annual wages in each target sector are significantly higher than the average of $48,540 for all industries in Southeast Louisiana.
Source: GNOCDC analysis of data from Moody’s Analytics (U.S. Bureau of Labor Statistics: CES, QCEW).Notes: A location quotient greater than 1.0 indicates a specialization within the local economy. Data is broken down for the energy and petrochemical manufacturing sector in order to provide more detail. See the downloadable data tables at www.gnocdc.org for the 4-digit NAICS within each sector.
Nonfarm Jobs
Average Annual
WageEnergyPetrochemical ManufacturingAdvanced ManufacturingWater ManagementClean TechDigital MediaBiosciencesAll other industriesTotal
2.83.70.61.70.60.40.51.01.0
Location Quotient
$85,349$96,242$63,990$72,798$68,911$67,304$62,863$43,840$48,540
49,83726,83732,75643,51914,95210,95611,016
897,7531,048,618
w w w . g n o c d c . o r g
Economic SynErgiES
AcroSS SouthEASt LouiSiAnASpring 2013
24
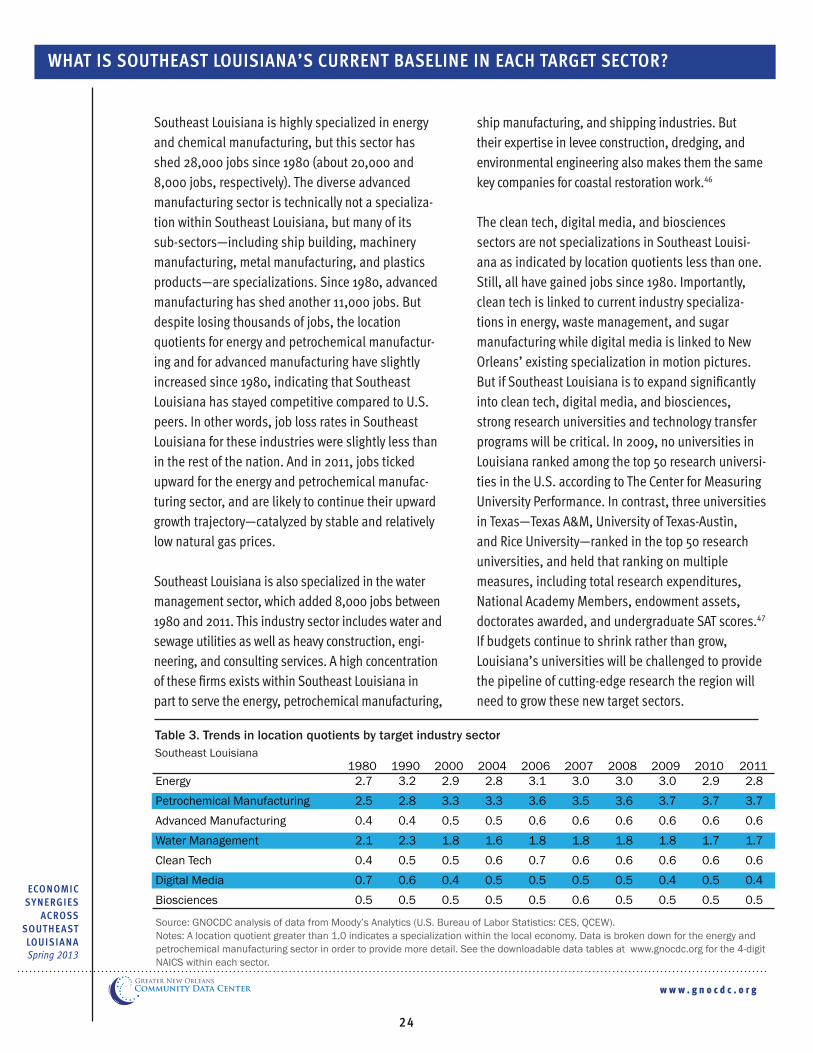
what is southeast louisiana’s Current baseline in eaCh target seCtor?
Southeast Louisiana is highly specialized in energy and chemical manufacturing, but this sector has shed 28,000 jobs since 1980 (about 20,000 and 8,000 jobs, respectively). The diverse advanced manufacturing sector is technically not a specializa-tion within Southeast Louisiana, but many of its sub-sectors—including ship building, machinery manufacturing, metal manufacturing, and plastics products—are specializations. Since 1980, advanced manufacturing has shed another 11,000 jobs. But despite losing thousands of jobs, the location quotients for energy and petrochemical manufactur-ing and for advanced manufacturing have slightly increased since 1980, indicating that Southeast Louisiana has stayed competitive compared to U.S. peers. In other words, job loss rates in Southeast Louisiana for these industries were slightly less than in the rest of the nation. And in 2011, jobs ticked upward for the energy and petrochemical manufac-turing sector, and are likely to continue their upward growth trajectory—catalyzed by stable and relatively low natural gas prices.
Southeast Louisiana is also specialized in the water management sector, which added 8,000 jobs between 1980 and 2011. This industry sector includes water and sewage utilities as well as heavy construction, engi-neering, and consulting services. A high concentration of these firms exists within Southeast Louisiana in part to serve the energy, petrochemical manufacturing,
ship manufacturing, and shipping industries. But their expertise in levee construction, dredging, and environmental engineering also makes them the same key companies for coastal restoration work.46
The clean tech, digital media, and biosciences sectors are not specializations in Southeast Louisi-ana as indicated by location quotients less than one. Still, all have gained jobs since 1980. Importantly, clean tech is linked to current industry specializa-tions in energy, waste management, and sugar manufacturing while digital media is linked to New Orleans’ existing specialization in motion pictures. But if Southeast Louisiana is to expand significantly into clean tech, digital media, and biosciences, strong research universities and technology transfer programs will be critical. In 2009, no universities in Louisiana ranked among the top 50 research universi-ties in the U.S. according to The Center for Measuring University Performance. In contrast, three universities in Texas—Texas A&M, University of Texas-Austin, and Rice University—ranked in the top 50 research universities, and held that ranking on multiple measures, including total research expenditures, National Academy Members, endowment assets, doctorates awarded, and undergraduate SAT scores.47 If budgets continue to shrink rather than grow, Louisiana’s universities will be challenged to provide the pipeline of cutting-edge research the region will need to grow these new target sectors.
1980Energy 2.7Petrochemical Manufacturing 2.5Advanced Manufacturing 0.4Water Management 2.1Clean Tech 0.4Digital Media 0.7Biosciences 0.5
19903.22.80.42.30.50.60.5
20002.93.30.51.80.50.40.5
20042.83.30.51.60.60.50.5
20063.13.60.61.80.70.50.5
20073.03.50.61.80.60.50.6
20083.03.60.61.80.60.50.5
20093.03.70.61.80.60.40.5
20102.93.70.61.70.60.50.5
20112.83.70.61.70.60.40.5
Source: GNOCDC analysis of data from Moody’s Analytics (U.S. Bureau of Labor Statistics: CES, QCEW).Notes: A location quotient greater than 1.0 indicates a specialization within the local economy. Data is broken down for the energy and petrochemical manufacturing sector in order to provide more detail. See the downloadable data tables at www.gnocdc.org for the 4-digit NAICS within each sector.
Table 3. Trends in location quotients by target industry sectorSoutheast Louisiana

w w w . g n o c d c . o r g
Economic SynErgiES
AcroSS SouthEASt LouiSiAnASpring 2013
25
0
10
20
30
40
50
60
70
80
90
100
1980
1990
2000
2004
2011
thousand jobs
Average wages for
targeted industries, Southeast Louisiana,
2011
Energy & PetrochemicalManufacturing $88,186
Water Management $72,798
Advanced Manufacturing $63,990
Clean Tech $68,911
Biosciences $62,863
Digital Media $67,304
Employment trends and wages by target industry sectorSoutheast Louisiana
Source: GNOCDC analysis of data from Moody’s Analytics (U.S. Bureau of Labor Statistics: CES, QCEW).Note: Target sectors are defined differently than industry specializations in the Economic Synergies section. For both, employment is aggregated across multiple sub-sectors. However, the industry specializations (and even the sub-sectors within shared industry specializations) vary across the three metros. This is because industry specializations are intended to highlight competitive advantages within each metro.On the other hand, target sectors are broadly-defined industries that regional economic development organizations have targeted for growth. To provide a set of baseline employment data for Southeast Louisiana, target sectors are defined uniformly across metros.
why is eaCh target seCtor imPortant, anD what are their Challenges?
w w w . g n o c d c . o r g
eConomiC synergies
aCross southeast louisianaSpring 2013
26
w w w . g n o c d c . o r g
eConomiC synergies
aCross southeast louisianaSpring 2013
26
what’s inCluDeD?The energy and petrochemicals industry includes oil and gas extraction; electric power generation; utility system construction and other heavy construction (e.g. oil and gas pipeline construction); refineries; basic chemical, resin, fertilizer, paint, and other chemical manufacturing; pipeline transportation; and related wholesalers. Power generation and fuel production from renewable sources such as biomass, ethanol, and hydropower are also included.
why is it imPortant?The energy and petrochemicals sector is a top economic driver across all three Southeast Louisiana metros. Port Fourchon and the Houma-Thibodaux metro are the center of oil and gas support services for the Gulf of Mexico, providing the power, fuel, and feedstock for the petrochemical industry in Baton Rouge and New Orleans. The Baton Rouge metro alone has at least 65 petrochemical manufacturers.48 And New Orleans and Baton Rouge are home to ten refineries that account for over 10 percent of total U.S. refining capacity.49 The Tuscaloosa Marine Shale in the Baton Rouge metro is a potentially large source of crude oil and other liquid hydrocarbons, although development is still in the very early stages and significant challenges must be overcome to unlock its full potential.50 Finally, Southeast Louisiana is rich
energy anD PetroChemiCal manufaCturing
66,900The number
of jobs in Southeast
Louisiana (2011).
$88,186The average pay
for these jobs in Southeast
Louisiana (2011).
2.9The location quotient for
Southeast Louisiana (2011).
in the transportation infrastructure that supports energy and petrochemicals, including five deep water ports that rank among the nation’s top 15 ports for tonnage, six Class One railways, 125,000 miles of inland and offshore oil and gas pipelines, and the nation’s only offshore oil port.51
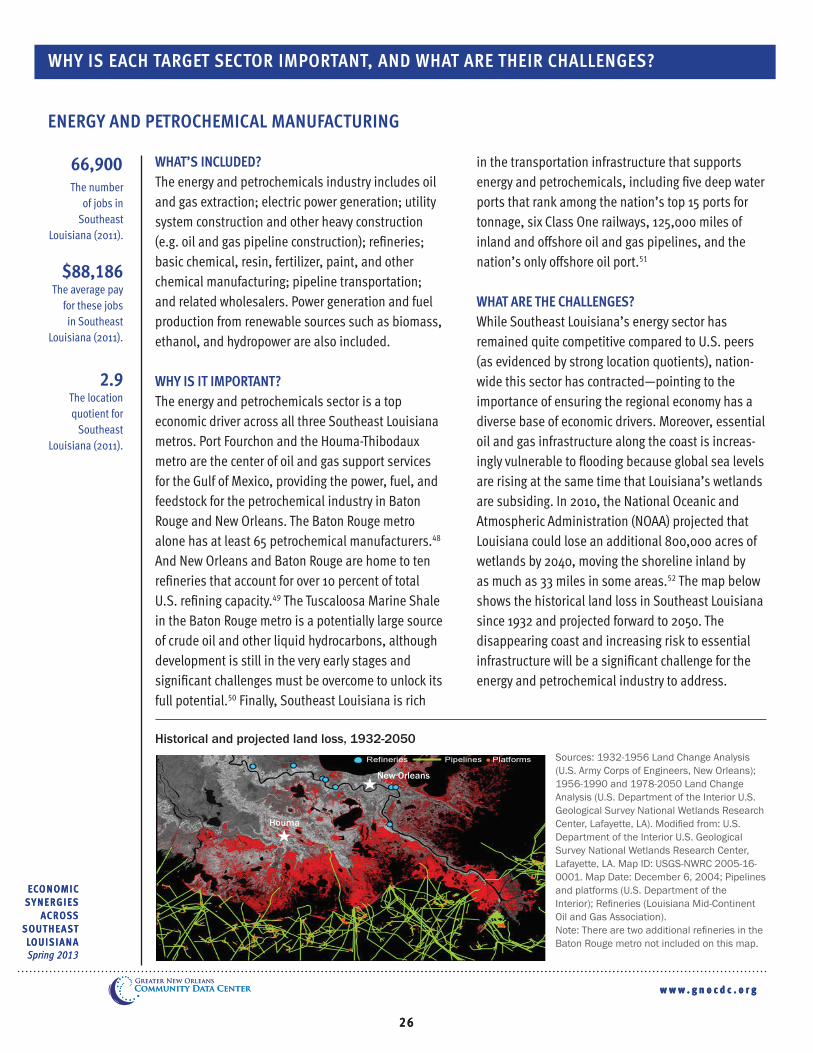
what are the Challenges?While Southeast Louisiana’s energy sector has remained quite competitive compared to U.S. peers (as evidenced by strong location quotients), nation-wide this sector has contracted—pointing to the importance of ensuring the regional economy has a diverse base of economic drivers. Moreover, essential oil and gas infrastructure along the coast is increas-ingly vulnerable to flooding because global sea levels are rising at the same time that Louisiana’s wetlands are subsiding. In 2010, the National Oceanic and Atmospheric Administration (NOAA) projected that Louisiana could lose an additional 800,000 acres of wetlands by 2040, moving the shoreline inland by as much as 33 miles in some areas.52 The map below shows the historical land loss in Southeast Louisiana since 1932 and projected forward to 2050. The disappearing coast and increasing risk to essential infrastructure will be a significant challenge for the energy and petrochemical industry to address.
Historical and projected land loss, 1932-2050 Sources: 1932-1956 Land Change Analysis (U.S. Army Corps of Engineers, New Orleans); 1956-1990 and 1978-2050 Land Change Analysis (U.S. Department of the Interior U.S. Geological Survey National Wetlands Research Center, Lafayette, LA). Modified from: U.S. Department of the Interior U.S. Geological Survey National Wetlands Research Center, Lafayette, LA. Map ID: USGS-NWRC 2005-16-0001. Map Date: December 6, 2004; Pipelines and platforms (U.S. Department of the Interior); Refineries (Louisiana Mid-Continent Oil and Gas Association).Note: There are two additional refineries in the Baton Rouge metro not included on this map.
Houma
New Orleans

w w w . g n o c d c . o r g
eConomiC synergies
aCross southeast louisianaSpring 2013
27
aDvanCeD manufaCturing
what’s inCluDeD?The advanced manufacturing sector includes ship building as well as plastic product, aerospace, motor vehicle, control instruments, computer equipment, machinery, and metals manufacturing. (Note that petrochemical manufacturing is not included in advanced manufacturing because it is included within the “energy and petrochemical manufactur-ing” sector.)
why is it imPortant?The advanced manufacturing sector creates quality jobs, fuels exports, and drives innovation.53 Given the emergence of low natural gas prices, the outlook for advanced manufacturing is improved. For example, Lockheed Martin will soon begin manufacturing 88-foot-long tanks at New Orleans’ Michoud Assem-bly Facility for transporting liquefied natural gas. The project adapts technologies previously used to build fuel tanks for the space shuttle program.54 Southeast Louisiana is home to such companies as Bollinger Shipyards, Gulf Island Fabricators, and Textron Marine & Land Systems, as well as major aerospace and advanced manufacturing research assets including NASA and the National Center for Advanced Manufacturing.
what are the Challenges?Advanced manufacturing requires a high-skilled workforce, including software programmers, engi-neers, and process operators. Supplying an adequate pipeline of trained workers for the advanced manufacturing (and petrochemical manufacturing) sector is a significant challenge, especially when budgets for local universities and community colleges are being cut. For example, at Nicholls State University—where around 60 percent of incoming freshmen are first-generation college students—state funding declined by 48 percent between 2008-09 and 2012-13. As a result, the school has eliminated 11
why is eaCh target seCtor imPortant, anD what are their Challenges? (cont’d)
32,800The number
of jobs in Southeast
Louisiana (2011).
$63,990The average pay
for these jobs in Southeast
Louisiana (2011).
0.6The location quotient for
Southeast Louisiana (2011).
academic programs and concentrations, and cut 33 faculty positions and 89 staff positions.55 Among the programs cut were bachelor’s degrees in computer science, manufacturing engineering technology, and agribusiness. In addition, the university’s bachelor’s degree in geomatics has been under consistent threat of closure by state officials, even though this unique program teaches crucial surveying and mapping skills demanded by the engineering, oilfield, and coastal restoration industries.56 And in Baton Rouge, Southern University eliminated 70 faculty positions, 99 staff positions, and 30 degree programs after a 40 percent cut in state funding forced the school to declare a financial emergency (called exigency).57

w w w . g n o c d c . o r g
eConomiC synergies
aCross southeast louisianaSpring 2013
28
Clean teCh
what’s inCluDeD?The clean tech industry includes waste collection and treatment; remediation and other waste management services; turbine manufacturing; control instruments manufacturing; air-conditioning and air purification equipment manufacturing; and scientific research and consulting. Hydroelectric, biomass, and nuclear power generation is not included within this sector because data was not available disaggregated from power generated by fossil fuels. Biofuels production (such as biodiesel and ethanol) is also not included because employment was not available disaggre-gated from all other basic chemical manufacturing.
why is it imPortant?The “green” or “clean” economy is a diverse sector tied together because its industries provide an environmental benefit. According to the Brookings Institution, “green” economy sectors represent substantial growth opportunities due to critical environmental and security trends across the globe.58 While clean tech is not yet a specialization in South-east Louisiana, it is linked to current specializations in energy, waste management, water management, and sugar manufacturing. New “green” companies in Southeast Louisiana include Blade Dynamics (manufacturer of wind turbine blades) and Dynamic Fuels (producer of renewable fuels). Research and development capabilities in the region include a Department of Energy-sponsored Energy Frontier Research Center at Louisiana State University and the University of New Orleans Energy Conversion and Conservation Center.
what are the Challenges?State and local policies are needed to increase the market for “green” products and services. For example, the state of Louisiana is one of only 15 states without a renewable portfolio standard or goal to increase electric power generation from renewable
why is eaCh target seCtor imPortant, anD what are their Challenges? (cont’d)
15,000The number
of jobs in Southeast
Louisiana (2011).
$68,911The average pay
for these jobs in Southeast
Louisiana (2011).
0.6The location quotient for
Southeast Louisiana (2011).
sources.59 Texas is the national leader in wind energy production in part because of the state’s mandate on investor-owned utilities to increase the use of renew-able sources of power.60 A lack of venture capital in Louisiana may have also constrained growth in the clean tech industry, but this may be changing. In 2011, the $250 million Louisiana Sustainability Fund was launched by California-based SAIL Capital Partners, which will target clean tech and water management startups within Louisiana.61
w w w . g n o c d c . o r g
eConomiC synergies
aCross southeast louisianaSpring 2013
29
Digital meDia
what’s inCluDeD?The digital media industry includes software design, software publishing, sound recording, data process-ing and information technology services, graphic design, motion picture, and advertising.
why is it imPortant?Digital media is a high-growth, high-wage, and high-profile industry.62 Computers, software, and digital technology permeate every industry sector, and are transforming the way business is done around the globe. Within the motion picture industry, New Orleans and Baton Rouge have attracted major studios, including Second Line Stages, Bayou FX, Digital FX, and Pixomondo.63 The motion picture industry has already emerged as a specialization and economic driver in greater New Orleans. Within the software industry, Baton Rouge and New Orleans have attracted such household names as IBM, Electronic Arts, and GE. (And just 60 miles to the west of Baton Rouge, Lafayette also has developed key firms within this industry, including the headquarters for the health information technology firm, Schum-acher Group.)
what are the Challenges?The digital media sector has grown in large part because of generous state tax incentives. If other states begin to offer similarly competitive tax incentives, Southeast Louisiana may lose some of its market share. Thus, developing a critical mass of firms and local talent to sustain a successful digital media industry in the long run is essential. Yet universities are facing significant budget cuts, making it difficult to expand their digital media curriculum and reach more students. In Baton Rouge, educational programs include the LSU Center for Computation and Technology; LSU’s AVATAR (Arts, Visualization, Advanced Technologies, and Research) program; and Baton Rouge Community College’s
why is eaCh target seCtor imPortant, anD what are their Challenges? (cont’d)
11,000The number
of jobs in Southeast
Louisiana (2011).
$67,304The average pay
for these jobs in Southeast
Louisiana (2011).
0.4The location quotient for
Southeast Louisiana (2011).
Entertainment Technologies curriculum. In New Orleans, talent development includes the University of New Orleans (UNO) Department of Film, Theatre, and Communication Arts (including Nims Center Studios) and the Delgado Digital Media Education Center.

w w w . g n o c d c . o r g
eConomiC synergies
aCross southeast louisianaSpring 2013
30
biosCienCes
what’s inCluDeD?The biosciences industry includes drug, medical device, and cosmetic product manufacturing; related distributors; and scientific research and development. The biosciences industry also depends on research generated in local universities and hospitals. However, employment in universities and hospitals is primarily not biosciences research, and is therefore not included within the biosciences industry.
why is it imPortant?The bioscience industry is a rapidly growing industry that creates high-value, export-oriented products for a global market.64 Bioscience industry assets in the region include the BioInnovation Center, Pennington Biomedical Research Center, and LSU and Tulane Health Sciences Centers.
what are the Challenges?Competition is fierce in the biosciences marketplace, and bioscience firms tend to locate within regions with a strong biosciences sector, which Southeast Louisiana does not have according to our analyses as well as the bioscience literature.65 Strong research capacity—often measured by funding from the single largest funder of such research, the National Insti-tutes of Health (NIH)—is critically important to the bioscience industry.66 And yet, Southeast Louisiana received only 0.6 percent of total NIH funding in 2011. In comparison, 10 other metros received half of all U.S. funding. On a per capita basis, NIH funding in Southeast Louisiana is also lower than in all these comparative metros as well as other Southern peers such as Houston and Birmingham. To attract more research dollars and top level faculty, universities will need to make larger investments within their life sciences programs, a challenge within the current budget environment.
why is eaCh target seCtor imPortant, anD what are their Challenges? (cont’d)
11,000The number
of jobs in Southeast
Louisiana (2011).
$62,863The average pay
for these jobs in Southeast
Louisiana (2011).
0.5The location quotient for
Southeast Louisiana (2011).
Access to capital is another critical factor to growing the biosciences industry. Yet, Louisiana receives less than 1 percent of all U.S. venture capital dollars.67 In recent years, new sources of capital have emerged in Louisiana, but their portfolios are small thus far. For example, since 2004 the Louisiana Fund has provided investment capital to 13 biotechnology companies.68 And in December 2012, the BioInnova-tion Center (New Orleans) established the Biofund, a source of low-interest loans for startup companies.69
what about healthCare serviCes?Healthcare is the fastest growing sector in most U.S. metros, driven by local demand from aging baby boomers and increasing life expectancy.70 Within Southeast Louisiana, the hospital sector has a location quotient below one in all three metros—indi-cating that hospitals serve a local population rather than being a specialization that draws patients from all over the country. In contrast, biosciences jobs include medical research, as well as drug and medical device manufacturing, which compete for markets near and far.71 Still, healthcare provides important career ladder opportunities for low-income workers.72

w w w . g n o c d c . o r g
eConomiC synergies
aCross southeast louisianaSpring 2013
31
why is eaCh target seCtor imPortant, anD what are their Challenges? (cont’d)
biosCienCes (cont’d)
$2,308
$1,727
$1,060 $1,030 $945 $918 $890 $875 $828 $814 $583
$235 $153
$0
$1,000
$2,000
$3,000
Boston
New Yo
rk
Washingto
n, D.C.
Los A
ngeles
San Fr
ancis
co
Baltim
ore
Seattle
San Dieg
o
Raleigh
Philadelp
hia
Housto
n
Birmingh
am
Southea
st Lo
uisian
a
$503 $461
$336
$279 $254
$215 $208 $186
$136 $96 $91 $80 $64
$0
$300
$600
Boston
Raleigh
Baltim
ore
San Dieg
o
Seattle
San Fr
ancis
co
Birmingh
am
Washingto
n, D.C.
Philadelp
hia
Housto
n
New Yo
rk
Los A
ngeles
Southea
st Lo
uisian
a
National Institutes of Health funding (in millions), 2011Southeast Louisiana and other select metros
Source: GNOCDC analysis of data from the National Institutes of Health.Notes: Data for Raleigh is for the combined statistical area including the Raleigh metro and Durham-Chapel Hill metro.
National Institutes of Health funding per capita, 2011Southeast Louisiana and other select metros

w w w . g n o c d c . o r g
eConomiC synergies
aCross southeast louisianaSpring 2013
32
water management
what’s inCluDeD?The water management industry includes storm water management in urbanized areas as well as coastal restoration (e.g. river diversion projects) and hurricane protection systems (e.g. levees). The specific industries included are water and sewage utilities; utility system construction; other heavy construction (including flood control projects, levees, and dredging); architecture and engineering services; and management, scientific, and technical consult-ing services (including environmental consulting services). The water management industry also
why is eaCh target seCtor imPortant, anD what are their Challenges? (cont’d)
43,500The number
of jobs in Southeast
Louisiana (2011).
$72,798The average pay
for these jobs in Southeast
Louisiana (2011).
1.7The location quotient for
Southeast Louisiana (2011).
relies extensively on barges, boats, amphibious machinery, and geosynthetic textiles for coastal restoration projects.73 However, the manufacturers of these ships, machines, and geosynthetic textiles are included within our advanced manufacturing sector.
why is it imPortant?Our discussion of the water management industry is reserved for last due to its importance to Southeast Louisiana. Between 1985 and 2010, Louisiana lost 1,833 square miles of wetlands.74 By themselves, levees cannot provide adequate hurricane protection
Increases and decreases in households receiving mail, July 2005-January 2013Coastal areas in Southeast Louisiana
Source: GNOCDC analysis of USPS Delivery Statistics Product; Bureau of Ocean Energy Management; and Army Corps of Engineers.Note: The increase in households around Larose, LA is due to changes in ZIP code boundaries, including the creation of a new ZIP code in fall 2008.

w w w . g n o c d c . o r g
eConomiC synergies
aCross southeast louisianaSpring 2013
33
for Southeast Louisiana residents. Coastal wetlands are the primary line of defense. In Southeast Louisi-ana, coastal wetlands also serve as a nursery for nearly the entire commercial fish and shellfish catch from the Gulf of Mexico, and protect national energy assets, including Port Fourchon, the Louisiana Offshore Oil Port, and ten refineries in Southeast Louisiana.
As the wetlands have eroded, residents in Southeast Louisiana have begun a gradual retreat from the coastline. Between July 2005 and January 2013, coastal ZIP codes in Terrebonne and Lafourche parishes lost households but ZIP codes inland within the same parishes grew. The Terrebonne Parish Master Plan indicates the migration of population from bayou areas to higher ground has been occurring since at least 1990, and probably much earlier.75 In addition, onshore support operations for the oil and gas industry have begun to move inland, led by BP’s opening of an Operations Learning Center in Schriever in 2007, and Chevron’s new warehouse in Gray in 2012.76 Costs for offshore energy exploration and production—and prices at the pump—will rise with the retreat of population and industry from the coast. Water management and coastal restoration can mitigate these costs and protect the nationally important energy industry of Southeast Louisiana.
Within the city of New Orleans, storm water manage-ment is critically important to reducing subsidence. The Sewerage and Water Board of New Orleans—and its contractor Veolia Water—manage large-scale drainage pumps to remove water from the city during rainstorms. Although effective, the current storm water management system is susceptible to failure and does not address the issue of soil subsidence. New Orleans has an opportunity to lead in the design of innovative urban hydrological systems that use bioswales, urban waterways, and open spaces to hold additional water during storms, and hydrate soils to
reduce subsidence.77 With a $2 million grant, GNO, Inc. has hired architects Waggonner & Ball to develop a comprehensive, sustainable, and integrated water management strategy for New Orleans that incorpo-rates international best practices.78
Fortunately, water management is already a specialization in Southeast Louisiana, and it is highly synergistic with other specializations such as energy, heavy construction, and advanced manufacturing. Importantly, it is poised for growth if local companies can export their expertise to the many coastal cities in the U.S. and abroad that face significant flood risk.
what are the Challenges?Challenges for the water management industry include securing sustainable and adequate sources of funding for coastal restoration projects, and finding the political will to implement major river diversion projects that use the natural power of the Mississippi to rebuild land. Thus far, federal funding has been slow and inadequate, and a source of private sector funding has not been developed (although may be possible, for example, through incentivizing firms to invest in wetland restoration to offset their carbon emissions).79 Louisiana does have some significant assets in the fight. Louisiana is set to receive billions from the RESTORE Act in order to support coastal restoration.80 And the state already has a Coastal Master Plan to guide the use of these funds toward the most significant projects. Furthermore, a new nonprofit—the Water Institute of the Gulf—will consolidate top-level scientific research on coastal restoration in Louisiana. Yet even with the best laid plans, major river diversion projects are difficult to implement because of the need to relocate communities and fisheries.81 Within the levees surrounding New Orleans, officials will need to eliminate institutional barriers to best water manage-ment practices and aggressively seek funding and technical support to implement those practices.
why is eaCh target seCtor imPortant, anD what are their Challenges? (cont’d)
water management (cont’d)

w w w . g n o c d c . o r g
Economic SynErgiES
AcroSS SouthEASt LouiSiAnASpring 2013
34
conclusion
the economy of southeast louisiana has been riding a tide of good news in recent
years—but threats lurk around the corner. efforts to accelerate growth in legacy
industries and diversify into emerging industries are needed and welcome.
The region is highly dependent on oil and gas as a major driver of all three metros—Houma-Thibodaux, New Orleans, and Baton Rouge. Moreover, oil and gas drives the major interconnections across the three metros. For example, Houma-Thibodaux’s Port Fourchon and the Louisiana Offshore Oil Port is the literal feedstock of the chemical manufacturing sector in Baton Rouge and New Orleans.
Capitalizing on new market developments is essen-tial to sustainably creating jobs and growing incomes. The state’s diversification plan aims to fortify legacy sectors while creating a dynamic business environ-ment that redeploys assets to harvest new markets.
At the heart of Southeast Louisiana’s economy are sophisticated heavy construction, engineering and scientific consulting, and water transportation. These services are omnipresent in the region’s extraction, chemical and ship
manufacturing, and logistics sectors. Importantly, these services provide a foundation for growing opportunities in water management and clean tech industries.
If engineering and water transportation represent the region’s heart, then higher education represents the brain. Critical efforts to diversify into biosciences, clean tech, and digital media will be thwarted by continuous downsizing of higher education. The assets of Southeast Louisiana’s higher education institutions must be bolstered if the region aspires to compete with highly diversified and robust economies like Houston and Atlanta.
Wetland restoration activities will not only be synergistic to the region’s efforts toward economic transformation. They will also be key to the region’s
overall sustainability. Coastal restoration projects are opportunities to redeploy existing industrial assets in new and expanded ways. There will also be opportu-nities to link smaller firms in the field with corporate and professional supports in New Orleans and Baton Rouge. Increased investment in transit corridors would expand the ability of specialized firms and workers to access new opportunities, and the ability of companies to draw from a larger labor pool. Finally, emerging industries will require methods for fully utilizing older workers in new job opportunities. A thorough assessment of the regional labor pool will be needed to inform workforce development strategies and priorities.
Baton Rouge’s and New Orleans’ bottom-up impulse to collaborate by forming the Southeast Louisiana Super-Region Committee puts the region in an elite category of superregional economic development pioneers. By collaborating to build on the assets of Houma-Thibodaux, New Orleans, and Baton Rouge through integrated strategies, the region can achieve more. Notably, the Lafayette metro to the west offers additional assets that could be the focus of future analysis to inform even larger collaborative ventures.
This report provides a rigorous analysis of Southeast Louisiana’s market position and can inform strate-gies for capitalizing on the region’s unique assets. With this information base, metro leaders can formulate linked strategies to improve performance based on particular niches of emerging sectors. By fashioning place-specific, collaborative economic strategies targeted to our unique opportunities, Southeast Louisiana can fuel an ambitious vision for collective action toward prosperity and sustainability.
If engineering and water transportation represent the region’s heart, then higher education repre-
sents the brain.

w w w . g n o c d c . o r g
Economic SynErgiES
AcroSS SouthEASt LouiSiAnASpring 2013
35
1 Greater New Orleans was named the most improved metro for business in 2011 by the Wall Street Journal and the top metro for technology job growth in 2011 by Forbes magazine, and Louisiana was named the #1 state for export growth in 2012 by the U.S. Chamber of Commerce.
2 GNOCDC analysis of data from the U.S. Bureau of Labor Statistics, CES. The Houma-Thibodaux metro includes the two parishes of Terrebonne and Lafourche. The Baton Rouge metro includes the nine parishes of East Baton Rouge, Ascension, Livingston, West Baton Rouge, East Feliciana, Iberville, Pointe Coupee, St. Helena, and West Feliciana. The New Orleans metro includes the seven parishes of Jefferson, Orleans, Plaquemines, St. Bernard, St. Charles, St. John, and St. Tammany.
3 From 1980 to 2011, jobs across Southeast Louisiana grew by only 18 percent, while jobs nationally grew 45 percent according to Moody’s Analytics (U.S. Bureau of Labor Statistics; CES, QCEW). And poverty rates have hovered 3 to 8 percentage points higher than the national average according to the U.S. Census Bureau. In 1989, poverty in Southeast Louisiana peaked at 21 percent while the nation experienced a 13 poverty rate. By 2011, the poverty rate in Southeast Louisiana was 19 percent compared to 16 percent nationwide.
4 Plyer, A. & Ortiz, E. (2011). Regional “export” industries: Drivers of the New Orleans economy. Greater New Orleans Community Data Center. Retrieved March 28, 2013 from http://www.gnocdc.org/ExportIndustries/index.html.
5 GNOCDC analysis of data from Moody’s Analytics (U.S. Bureau of Labor Statistics; CES, QCEW).
6 GNOCDC analysis of 2011 U.S. Bureau of Labor Statistics QCEW and 2012 Census Bureau population estimates.
7 Ortiz, E., Plyer, A., & Horwitz, B. (2012). Economic Ties across Southeast Louisiana. Greater New Orleans Community Data Center. Retrieved March 28, 2013 from http://www.gnocdc.org/EconomicTiesAcrossSoutheastLouisiana/index.html.
8 GNOCDC analysis of data from U.S. Bureau of Labor Statistics CES and U.S. Census Bureau population estimates.
9 The Louisiana Workforce Commission develops job projections that incorporate plans for company expansions (and contractions) from key driver firms in the state.
10 Dismukes, D. (2013). Unconventional resources and Louisiana’s manufacturing development renaissance. Baton Rouge, LA: LSU Center for Energy Studies. Retrieved January 20, 2013 from http://www.enrg.lsu.edu/files/images/publications/online/2013/ANGA_Report_11Jan2013.pdf.
11 Greater Houston Partnership. (2012). Basic fact sheets. Retrieved March 20, 2013 from http://www.houston.org/economic-development/about-us/basic-fact-sheets/index.aspx; GNOCDC analysis of data from Moody’s Analytics (U.S. Bureau of Labor Statistics; CES, QCEW).
12 Olien, R.M. (n.d.) Oil and gas industry. Handbook of Texas Online. Texas State Historical Association. Retrieved March 25, 2013 from http://www.tshaonline.org/handbook/online/articles/doogz; GNOCDC analysis of U.S. Bureau of Labor Statistics CES (national) for NAICS 211 Oil and Gas Extraction.
enDnotes

w w w . g n o c d c . o r g
Economic SynErgiES
AcroSS SouthEASt LouiSiAnASpring 2013
36
13 See the bibliography of super regions in Ortiz, E., Plyer, A., & Horwitz, B. (2012).
14 Ortiz, E., Plyer, A., & Horwitz, B. (2012).
15 Hoover, E. M., & Giarratani, F. (1999). An introduction to regional economics. Regional Research Institute, West Virginia University. Retrieved March 11, 2013 at http://www.rri.wvu.edu/WebBook/Giarratani/chaptereleven.htm#11.3.
16 Coulson, E.N. (2004). Measuring and analyzing urban employment fluctuations. Retrieved March 11, 2013 at http://econ.la.psu.edu/~ecoulson/blackwell4.pdf.
17 Harvard Business School Institute for Strategy and Competitiveness. (2010). Cluster mapping project: U.S. national benchmark data. Retrieved March 11, 2013 from http://sectormapping.us/.
18 State government is typically considered by economists to be “export-oriented” because it generates revenue (state tax collections as well as federal funding) from outside the region.
19 Barnes, S. & Terrell, D. (2011). The economic impact of Louisiana State University on the Baton Rouge MSA. Baton Rouge: Louisiana State University Division of Economic Development.
20 Dismukes, D. (2013).
21 Louisiana Economic Development. (2012). CF Industries announces $2.1 billion expansion in Donaldsonville. Retrieved March 28, 2013 from http://www.louisianaeconomicdevelopment.com/led-news/news-releases/cf-industries-announces-$21-billion-expansion-in-donaldsonville.aspx; Louisiana Economic Development (2012). Methanex announces $550 million methanol plant. Retrieved March 28, 2013 from http://www.louisianaeconomicdevelopment.com/led-news/news-releases/methanex-announces-$550-million-methanol-plant.aspx?c=NewsReleases&id=39.
22 Pope, J. (November 23, 2012). Southern University’s imperiled architecture school gets a 90 day reprieve. Times-Picayune. Retrieved March 28, 2013 from http://www.nola.com/education/index.ssf/2012/11/southern_universitys_imperiled.html.
23 Dismukes, D. (2012). Louisiana’s Tuscaloosa marine shale development: Emerging resource and economic potential. Catalyst, January-April 2012. Baton Rouge Area Chamber. Retrieved March 28, 2013 from http://www.brac.org/docs/catalyst/BRAC_Catalyst_Jan_Apr_2012_Shale.pdf.
24 Numbers reflect estimates of the “export” component of insurance agencies, heavy construction and engineering, waste management, and industrial machinery leasing and repair. For example, total employment in heavy construction and engineering was 31,100 in 2011, of which 21,900 are estimated to be “export” jobs. Average annual wages are weighted based on employment in 2011 and therefore do not apply to earlier years even if you adjust for inflation. Wages include commissions, tips, and bonuses. Wages may be skewed upward by the presence of a few high-wage workers or downward by the presence of many part-time workers.

w w w . g n o c d c . o r g
Economic SynErgiES
AcroSS SouthEASt LouiSiAnASpring 2013
37
25 The tourism sector includes many different industries, such as hotels, restaurants, and air transportation. However, only a portion of employment in restaurants and air transportation is included within tourism because these industries also serve the local population.
26 U.S. Energy Information Administration. (2013). [Graph illustration the short-term energy outlook] Real price viewer from the Energy Information Administration. Retrieved March 28, 2013 from http://www.eia.gov/forecasts/steo/realprices/.
27 Louisiana Economic Development (April 2012). International destination: Louisiana. Louisiana Economic Development Quarterly, Q2. Retrieved March 28, 2013 from http://www.louisianaeconomicdevelopment.com/downloads/multi-media/presentations/10_02_2012_02_55_54_ECON13-13_Q2_2010.pdf.
28 Due to data limitations, the higher education sector is defined here as only private colleges and universities—and thus undercounts total employment in higher education in the greater New Orleans region.
29 Thompson, R. (February 5, 2013). Huntington Ingalls to open Houston office to aid search for Avondale partner. Times-Picayune. Retrieved March 28, 2013 from http://www.nola.com/business/index.ssf/2013/02/huntington_ingalls_to_open_hou.html.
30 Numbers reflect estimates of the “export” component of legal services, insurance agencies, heavy construction and engineering, and tourism. For example, total employment in heavy construction and engineering was 21,700 in 2011, of which 9,500 are estimated to be “export” jobs. Data on commercial fishing jobs are not available but seafood packaging jobs are included in food manufacturing. Average annual wages are weighted based on employment in 2011 and therefore do not apply to earlier years even if you adjust for inflation. Wages include commissions, tips, and bonuses. Wages may be skewed upward by the presence of a few high-wage workers or downward by the presence of many part-time workers. However, American Community Survey 2011 data for the New Orleans metro indicates that full-time year-round wages for many tourism-related occupations are well below $32,162, such as personal care and service at $23,515.
31 South Central Planning and Development Commission. (2010). Comprehensive economic development strategy 2010. Retrieved March 28, 2013 from http://www.scpdc.org/wp-content/uploads/CEDS-2010-Final-Draft.pdf.
32 South Central Planning and Development Commission. (2010).
33 GNOCDC analysis of U.S. Bureau of Labor Statistics CES (national) for NAICS 211 Oil and Gas Extraction.
34 U.S. Energy Information Administration. (2013).
35 Note that “truck welders,” who supply their own equipment and make up the bulk of the workforce at many local fabrication and shipyards, are self-employed contractors and therefore missing from the data. See South Central Planning and Development Commission. (2010).
w w w . g n o c d c . o r g
Economic SynErgiES
AcroSS SouthEASt LouiSiAnASpring 2013
38
36 National Ocean Service, NOAA. (2011). The Gulf of Mexico at a glance: A second glance. Washington, DC: U.S. Department of Commerce. Retrieved March 28, 2013 from http://stateofthecoast.noaa.gov/NOAAs_Gulf_of_Mexico_at_a_Glance_report.pdf.
37 Lowe, M., Stokes, S., & Gereffi, G. (2011). Restoring the Gulf Coast: New Markets for Established Firms. Duke University. Retrieved March 28, 2013 from http://www.mississippiriverdelta.org/files/2012/07/CGGC_Gulf-Coast-Restoration.pdf.
38 Numbers reflect estimates of the “export” component of shipping, heavy construction, waste management, and industrial machinery leasing and repair. For example, total employment in heavy construction was 3,200 in 2011, of which 2,300 are estimated to be “export” jobs. Data on commercial fishing jobs are not available but seafood packaging jobs are included in sugar and seafood manufacturing. Average annual wages are weighted based on employment in 2011 and therefore do not apply to earlier years even if you adjust for inflation. Wages include commissions, tips, and bonuses. Wages may be skewed upward by the presence of a few high-wage workers or downward by the presence of many part-time workers.
39 Ports Association of Louisiana. (n.d). Port of New Orleans. Retrieved March 26, 2013 from http://portsoflouisiana.org/documents/port_profiles/NewOrleans.pdf.
40 For example, in 2013 Nicholls is adding a maritime management degree, which will be partially funded by local industry. And BP entered into a business and learning partnership with Fletcher, donating $4 million for construction of an Integrated Production Technology Program building on their new campus.
41 National Ocean Service, NOAA. (2011).
42 Chang, M. Steiner, F., & Butler, K. (2007). Connecting the Texas triangle: Economic integration and transportation coordination. Healdsburg, CA: The Healdsburg Research Seminar on Megaregions. Retrieved March 28, 2013 from http://www.america2050.org/Healdsburg_Texas_pp_21-36.pdf.
43 For our freight flows analysis, the Baton Rouge region is defined as the Baton Rouge – Pierre Part combined statistical area, which includes the Baton Rouge metro plus Assumption Parish.
44 South Central Planning and Development Commission. (2010).
45 The North American Industry Classification System (NAICS) is the primary mechanism for organizing and measuring employment within industries. However, using NAICS codes to define these industries is an imperfect science. For example, engineering is a diverse industry that cuts across many of these industry sectors. In addition, emerging industry sectors such as clean tech and water management are difficult to isolate from the energy and chemicals industry because NAICS codes are not detailed enough (or not accurate enough at detailed levels). Despite the limitations of NAICS codes, a quantification of employment within the six broad industry sectors provides important baseline information for regional economic development plans.

w w w . g n o c d c . o r g
Economic SynErgiES
AcroSS SouthEASt LouiSiAnASpring 2013
39
46 Lowe, M., Stokes, S., & Gereffi, G. (2011).
47 The Center for Measuring University Performance. (2011). American research university data. Retrieved March 4, 2013 from http://mup.asu.edu/research_data.html.
48 Baton Rouge Area Chamber. (2013). Regional assets. Retrieved March 28, 2013 from http://www.brac.org/ecodev/regional_regionalassets.asp.
49 Louisiana Mid-Continent Oil and Gas Association. (n.d.) Industry sectors. Retrieved March 28, 2013 from http://www.lmoga.com/industry-sector.
50 Dismukes, D. (2012).
51 Louisiana Mid-Continent Oil and Gas Association. (n.d.).
52 National Oceanic and Atmospheric Administration. (2010). Shorelines and coastal habitats in the Gulf of Mexico. Washington, DC: U.S. Department of Commerce. Retrieved March 28, 2013 from http://www.restorethegulf.gov/sites/default/files/documents/pdf/shorelines-coastal-habitats-fact-sheet.pdf.
53 Helper, S., Krueger, T., & Wial, H. (2012). Why does manufacturing matter? Which manufacturing matters?: A policy framework. Washington, DC: Brookings Institution. Retrieved March 28, 2013 from http://www.brookings.edu/~/media/research/files/papers/2012/2/22%20manufacturing%20helper%20krueger%20wial/0222_manufacturing_helper_krueger_wial.pdf.
54 Louisiana Economic Development. (March 2013). Lockheed Martin Announces Liquefied Natural Gas Project Creating 166 New Direct Jobs In New Orleans.
55 Nicholls State University. (2012). Nicholls finalizes slashed budget. Retrieved March 28, 2013 from http://www.nicholls.edu/news/2012/nicholls-finalizes-slashed-budget/.
56 McBride, D. (2009). Final tally on cuts at Nicholls is seven programs. Houma Today. Retrieved March 28, 2013 from http://www.houmatoday.com/article/20090829/ARTICLES/908299978?p=2&tc=pg; McBride D. (2011). Local students to have fewer programs. Daily Comet. Retrieved March 28, 2013 from http://www.dailycomet.com/article/20110428/ARTICLES/110429487?p=2&tc=pg.
57 Addo, K. (2012). Cuts have SU looking lean. The Advocate. Retrieved March 28, 2013 from http://theadvocate.com/home/3218436-125/cuts-have-su-looking-lean.
58 Muro, M. Rothwell, J., & Saha, D. (2011). Sizing the clean economy: A national and regional green jobs assessment. Washington, DC: Brookings Institution. Retrieved March 28, 2013 from http://www.brookings.edu/~/media/research/files/reports/2011/7/13-clean-economy/0713_clean_economy.pdf.

w w w . g n o c d c . o r g
Economic SynErgiES
AcroSS SouthEASt LouiSiAnASpring 2013
40
59 U.S. Energy Information Administration. (2012). Most states have renewable portfolio standards. Retrieved March 28, 2013 from http://www.eia.gov/todayinenergy/detail.cfm?id=4850.
60 American Wind Energy Assocation. (2012). Wind energy facts: Texas. Retrieved March 28, 2013 from http://www.awea.org/learnabout/publications/upload/4Q-11-Texas.pdf.
61 Larino, J. (2011). State launches capital fund for sustainable industry. New Orleans CityBusiness. Retrieved March 28, 2013 from http://neworleanscitybusiness.com/blog/2011/04/07/state-launches-capital-fund-for-sustainable-industry/.
62 Louisiana Department of Economic Development. (2010). Getting There First: Louisiana’s Blue Ocean Initiative.
63 Louisiana Economic Development. (April 2012).
64 Obama Administration. (2012). National bioeconomy blueprint. Retrieved March 28, 2013 from http://www.whitehouse.gov/sites/default/files/microsites/ostp/national_bioeconomy_blueprint_april_2012.pdf;Battelle & Biotechnology Industry Organization. (2012). State bioscience industry development. Retrieved February 7, 2013 from http://www.bio.org/sites/default/files/v3battelle-bio_2012_industry_development.pdf.
65 Battelle & Biotechnology Industry Organization. (2012);Battelle & Biotechnology Industry Organization. (2010). State bioscience initiatives. Retrieved February 7, 2013 from http://www.bio.org/articles/battellebio-state-bioscience-initiatives-2010.Cortright, J. & Mayer, H. (2002). Signs of life: The growth of biotechnology centers in the U.S. Washington, DC: Brookings Institution. Retrieved March 28, 2013 from http://www.brookings.edu/es/urban/publications/biotech.pdf.
66 Cortright, J. & Mayer, H. (2002);Battelle & Biotechnology Industry Organization. (2010).
67 Baton Rouge Area Chamber. (October 2011). 2012 economic outlook. Catalyst, Q4. Retrieved March 3, 2013 from http://www.brac.org/docs/catalyst/BRAC_Catalyst_Q411_Web.pdf
68 Louisiana Fund. (n.d). Home. Retrieved March 3, 2013 from http://www.louisianafund.com/default.aspx.
69 New Orleans BioInnovation Center. (2010). Home. Retrieved March 3, 2013 from http://www.neworleansbio.com/.
70 Vey, J. (2012). Building from strength: Creating opportunity in greater Baltimore’s next economy. Washington, DC: Brookings Institution. Retrieved February 7, 2013 from http://www.brookings.edu/~/media/research/files/reports/2012/4/26%20baltimore%20economy%20vey/0426_baltimore_economy_vey.pdf;Wood, C.A. (2011). Employment in healthcare: A crutch for the ailing economy during the 2007–09 recession. U.S. Bureau of Labor Statistics Monthly Labor Review, April, 13-18. Retrieved February 7, 2013 from http://www.bls.gov/opub/mlr/2011/04/art2full.pdf.

w w w . g n o c d c . o r g
Economic SynErgiES
AcroSS SouthEASt LouiSiAnASpring 2013
41
71 Battelle & Biotechnology Industry Organization. (2012);Battelle & Biotechnology Industry Organization. (2010).
72 Nelson, M. & Wolf-Powers, L. (2010). Chains and ladders: Exploring the opportunities for workforce development and poverty reduction in the hospital sector. Economic Development Quarterly, 24: 33-44.
73 Lowe, M., Stokes, S., & Gereffi, G. (2011).Stokes, S., Wunderink, S., Lowe, M., & Gereffi, G. (2012). Geosynthetics: Coastal Management Applications in the Gulf of Mexico. Duke University. Retrieved March 28, 2013 from http://www.cggc.duke.edu/pdfs/CGGC_Geosynthetics.pdf.
74 Couvillion, B., Barras, J.A., Steyer, G.D., Sleavin, W., Fischner, M., Beck, H., . . . Heckman, D. (2011). Land area change in coastal Louisiana from 1932 to 2010. U.S. Geological Survey Scientific Investigations Map 3164. Retrieved March 28, 2013 from http://pubs.usgs.gov/sim/3164/downloads/SIM3164_Pamphlet.pdf.
75 Terrebonne Parish Council of Governments. (2012). Vision 2030: Terrebonne’s plan for its future. Retrieved March 28, 2013 from http://www.tpcg.org/planning/pdf/Vision2030/Draft/revised-2012-11-29/Chapter%203%20-%20Population%20and%20Land%20Use.pdf.
76 Bayles, C. (February 4, 2012). La. 24 facility is a ‘commitment’ to region. Daily Comet. Retrieved March 28, 2013 from http://www.dailycomet.com/article/20120204/ARTICLES/120209804?p=1&tc=pg;Jacobs, D. (May 8, 2007). New BP warehouse opens in Schriever. Houma Today. Retrieved March 28, 2013 from http://www.houmatoday.com/article/20070508/NEWS/705080329?p=1&tc=pg.
77 Ruhnke, A.R. (2011). Stormwater management: Designing urban hydrological systems as infrascapes. Journal of Biourbanism, 1, 59-73. Retrieved March 21, 2013 from http://journalofbiourbanism.files.wordpress.com/2013/01/jbu1_2001_amiyo-r-ruhnke.pdf.
78 Dutch Dialogues. (2011). Waggonner & Ball selected to develop water management strategy. Retrieved March 28, 2013 from http://dutchdialogues.com/2011/03/25/waggonner-ball-selected-to-develop-water-management-strategy/.
79 Lowe, M., Stokes, S., & Gereffi, G. (2011).
80 Schleifstein, M. (January 29, 2013). Federal judge accepts $4 billion BP guilty plea for Deepwater Horizon oil disaster. Times-Picayune. Retrieved January 30, 2013 from http://www.nola.com/news/gulf-oil-spill/index.ssf/2013/01/federal_judge_accepts_4_billio.html#incart_river.
81 Mississippi River Delta Science and Engineering Special Team. (2012). Answering 10 fundamental questions about the Mississippi River delta. Retrieved March 28, 2013 from http://www.mississippiriverdelta.org/files/2012/04/MississippiRiverDeltaReport.pdf.