economic research: millennials are creating unsafe
TRANSCRIPT

Economic Research:
Millennials Are Creating UnsafeConditions On U.S. Roads--But Not InThe Way You Might Think
Credit Market Services:
Beth Ann Bovino, U.S. Chief Economist, New York (1) 212-438-1652;
Secondary Contact:
Geoffrey E Buswick, Boston (1) 617-530-8311; [email protected]
Table Of Contents
Road To Nowhere
(Baby, You Can) Drive My Car
Little Deuce Coupe
Freeway Of Love
Go Your Own Way
No Particular Place To Go
I Can't Drive 55
WWW.STANDARDANDPOORS.COM/RATINGSDIRECT OCTOBER 19, 2015 1
1466580 | 302229998

Economic Research:
Millennials Are Creating Unsafe Conditions OnU.S. Roads--But Not In The Way You Might Think
As banks, retailers, and consumer products companies continue their well-documented scramble to court so-called
Millennials, the lifestyle choices of this newly adult generation are having a profound effect on a lesser-explored area of
the U.S. economy: infrastructure.
In the simplest terms, Millennials (which Pew Research defines as Americans born from 1982-2000, and called
Generation Y by some) are driving less than older motorists did when they came of age--and when they do get behind
the wheel, they are generally in smaller, more fuel-efficient cars. This, in turn, has curbed revenues from the federal
gasoline tax, the primary source of funding for the Federal Highway Trust Fund, which is the backbone of the country's
surface transportation infrastructure.
This drop in funds available to construct and repair the country's infrastructure could, in Standard & Poor's Ratings
Services' view, weigh on growth prospects for U.S. GDP, as well as states' economies, and, in some cases, where states
and municipalities choose to replace the lost federal funds with locally derived revenues, could hurt credit quality. At a
time when many state and local government budgets are strained--and austerity measures pervasive--the lost
productivity and higher costs that inevitably accrue because of outdated infrastructure, combined with the need to
borrow more to undertake refurbishment and repair projects, could hamper the ability of some governments to pay
down debt.
Meanwhile, lawmakers in Washington have held the federal gas tax at 18.4 cents per gallon (and 24.4 cents on diesel
fuel) since 1993. If the gas tax had been indexed to inflation during that period, it would now be more than 30 cents
per gallon. In other words, the roughly $25 billion a year the gas tax now raises (with 60% earmarked for highway and
bridge construction) would be closer to $42 billion in annual revenue.
Road To Nowhere
On top of that, improvements in vehicle fuel efficiency over the past couple decades have rendered the gas tax an
insufficient source of funds for infrastructure construction and maintenance, and the higher Corporate Average Fuel
Economy (CAFE) standards now required will continue to erode the revenue-raising ability of the federal gas tax.
Cars on U.S. roads are now more fuel-efficient than ever--and by a substantial margin, compared with just a decade or
so ago. In August, the U.S. Environmental Protection Agency reported that adjusted fuel economy for light vehicles
from model year 2013 was a record 24.1 miles per gallon (mpg)--0.5 mpg higher than vehicles manufactured a year
earlier. For cars, that figure climbs to 27.6 mpg. All told, fuel efficiency has improved 25% compared with vehicles
from model year 2004, the EPA reported.
Meanwhile, perhaps the most important factor in all this is that, after steadily increasing for more than three decades,
the number of vehicle miles traveled (VMT) peaked at 3 trillion in 2007 (just before the onset of the Great Recession),
WWW.STANDARDANDPOORS.COM/RATINGSDIRECT OCTOBER 19, 2015 2
1466580 | 302229998
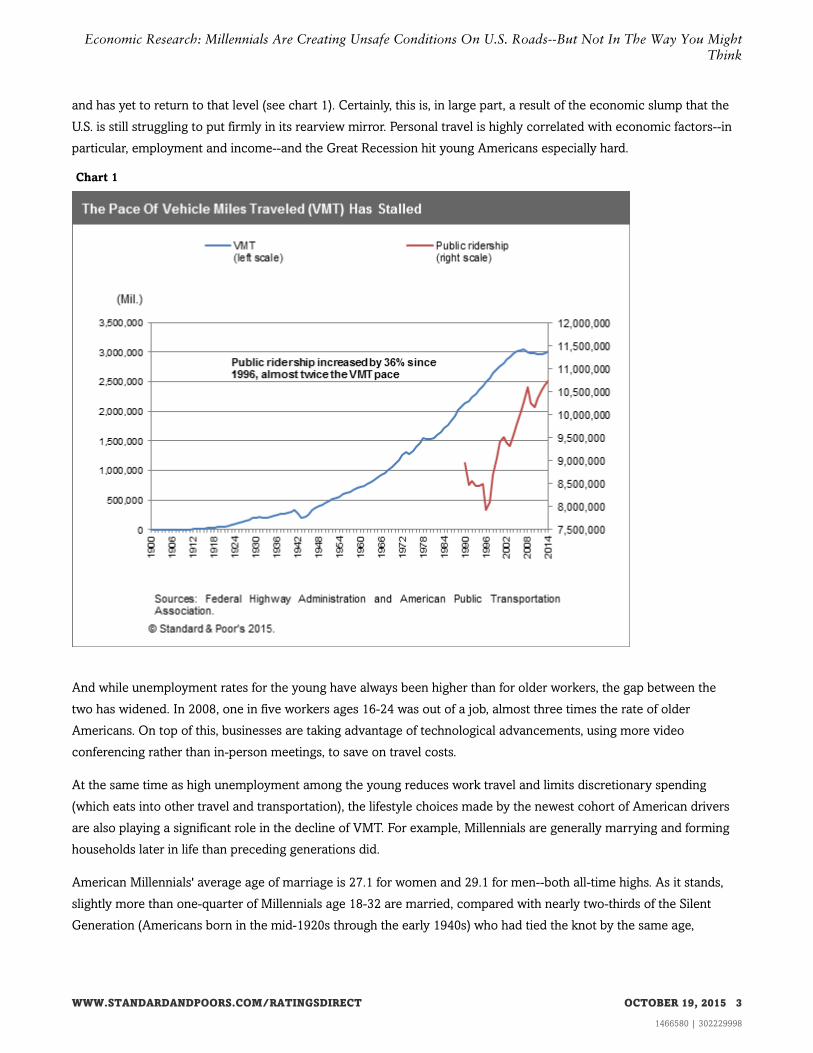
and has yet to return to that level (see chart 1). Certainly, this is, in large part, a result of the economic slump that the
U.S. is still struggling to put firmly in its rearview mirror. Personal travel is highly correlated with economic factors--in
particular, employment and income--and the Great Recession hit young Americans especially hard.
Chart 1
And while unemployment rates for the young have always been higher than for older workers, the gap between the
two has widened. In 2008, one in five workers ages 16-24 was out of a job, almost three times the rate of older
Americans. On top of this, businesses are taking advantage of technological advancements, using more video
conferencing rather than in-person meetings, to save on travel costs.
At the same time as high unemployment among the young reduces work travel and limits discretionary spending
(which eats into other travel and transportation), the lifestyle choices made by the newest cohort of American drivers
are also playing a significant role in the decline of VMT. For example, Millennials are generally marrying and forming
households later in life than preceding generations did.
American Millennials' average age of marriage is 27.1 for women and 29.1 for men--both all-time highs. As it stands,
slightly more than one-quarter of Millennials age 18-32 are married, compared with nearly two-thirds of the Silent
Generation (Americans born in the mid-1920s through the early 1940s) who had tied the knot by the same age,
WWW.STANDARDANDPOORS.COM/RATINGSDIRECT OCTOBER 19, 2015 3
1466580 | 302229998
Economic Research: Millennials Are Creating Unsafe Conditions On U.S. Roads--But Not In The Way You MightThink
according to Pew Research (see "Millennials And The U.S. Economy: The Kids Are All Right (Or Soon Will Be),"
published April 29 on RatingsDirect).
This propensity to marry and have children late, to rent instead of buy homes, and to live in cities has had a profound
effect on travel behavior. Suburban areas, where driving is the predominant mode of travel, have seen the fastest
growth in their aging populations. Meanwhile, transit ridership in the U.S. grew each year from 2010-2014--and this
year may continue that trend.
In the first quarter, nearly 2.6 billion trips were taken on U.S. public transportation, according to a June report from the
American Public Transportation Association (APTA). While that's down 0.7% from a year earlier, a historically frigid
and snowy winter across much of the Northeast--along with gas prices almost a third lower--affected ridership, the
report said. In fact, there was a collective increase of 0.6% in trips on subways and commuter rail lines in the first three
months of this year, the nonprofit advocacy group reported.
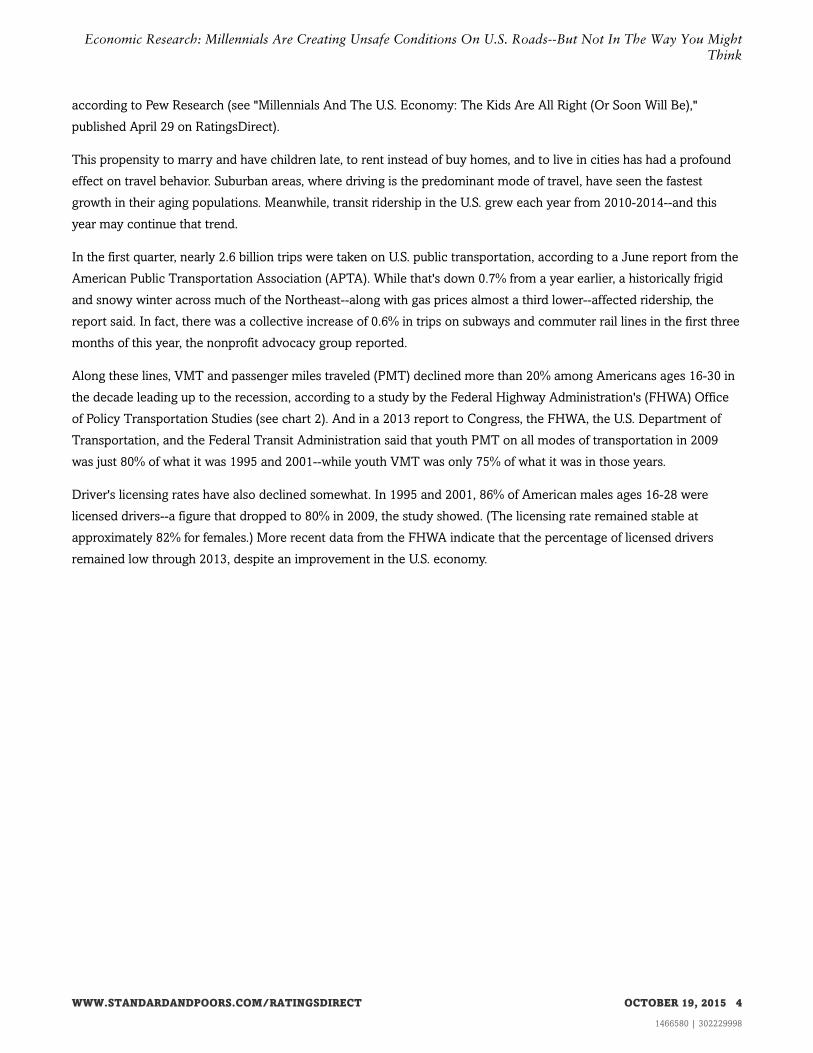
Along these lines, VMT and passenger miles traveled (PMT) declined more than 20% among Americans ages 16-30 in
the decade leading up to the recession, according to a study by the Federal Highway Administration's (FHWA) Office
of Policy Transportation Studies (see chart 2). And in a 2013 report to Congress, the FHWA, the U.S. Department of
Transportation, and the Federal Transit Administration said that youth PMT on all modes of transportation in 2009
was just 80% of what it was 1995 and 2001--while youth VMT was only 75% of what it was in those years.
Driver's licensing rates have also declined somewhat. In 1995 and 2001, 86% of American males ages 16-28 were
licensed drivers--a figure that dropped to 80% in 2009, the study showed. (The licensing rate remained stable at
approximately 82% for females.) More recent data from the FHWA indicate that the percentage of licensed drivers
remained low through 2013, despite an improvement in the U.S. economy.
WWW.STANDARDANDPOORS.COM/RATINGSDIRECT OCTOBER 19, 2015 4
1466580 | 302229998
Economic Research: Millennials Are Creating Unsafe Conditions On U.S. Roads--But Not In The Way You MightThink
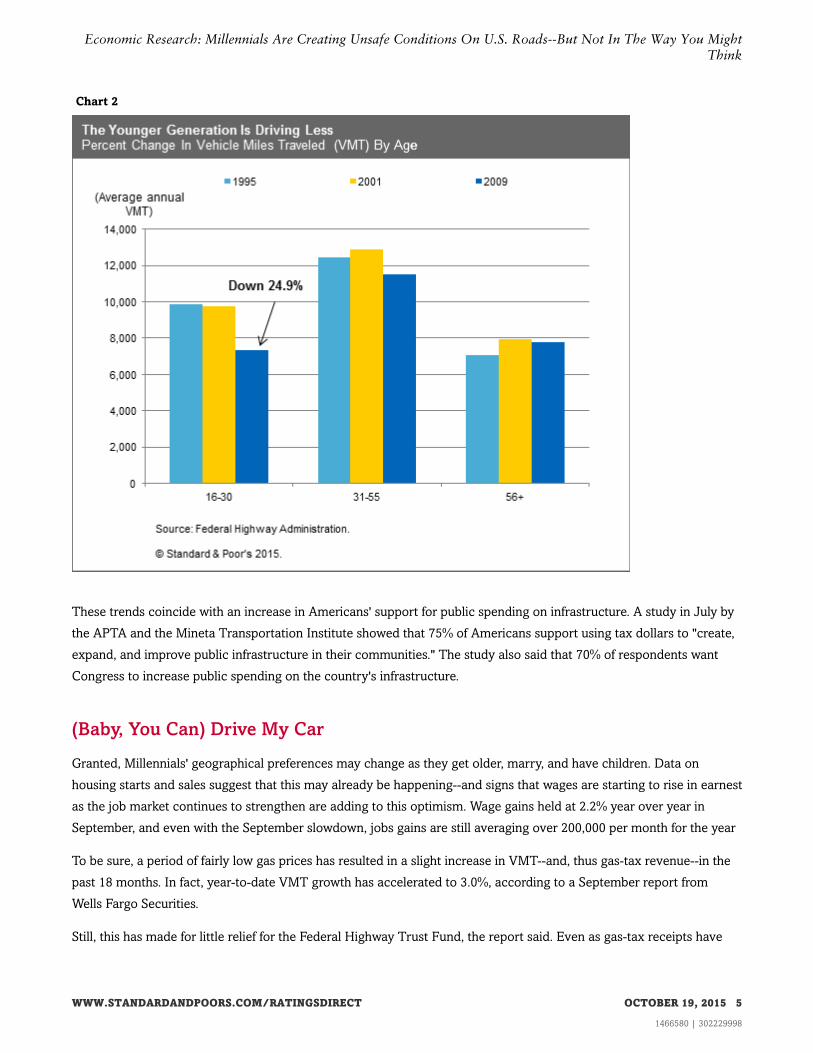
Chart 2
These trends coincide with an increase in Americans' support for public spending on infrastructure. A study in July by
the APTA and the Mineta Transportation Institute showed that 75% of Americans support using tax dollars to "create,
expand, and improve public infrastructure in their communities." The study also said that 70% of respondents want
Congress to increase public spending on the country's infrastructure.
(Baby, You Can) Drive My Car
Granted, Millennials' geographical preferences may change as they get older, marry, and have children. Data on
housing starts and sales suggest that this may already be happening--and signs that wages are starting to rise in earnest
as the job market continues to strengthen are adding to this optimism. Wage gains held at 2.2% year over year in
September, and even with the September slowdown, jobs gains are still averaging over 200,000 per month for the year
To be sure, a period of fairly low gas prices has resulted in a slight increase in VMT--and, thus gas-tax revenue--in the
past 18 months. In fact, year-to-date VMT growth has accelerated to 3.0%, according to a September report from
Wells Fargo Securities.
Still, this has made for little relief for the Federal Highway Trust Fund, the report said. Even as gas-tax receipts have
WWW.STANDARDANDPOORS.COM/RATINGSDIRECT OCTOBER 19, 2015 5
1466580 | 302229998
Economic Research: Millennials Are Creating Unsafe Conditions On U.S. Roads--But Not In The Way You MightThink
jumped 4% so far this year, in August the fund still needed an $8 billion transfer from the U.S. General Fund to provide
funding until May. And while increased tax revenue has allowed funding to stretch into next year, the authorization to
spend money from the highway fund expires at the end of this month, requiring Congress to act by then, and the
balance in the fund remains below the $4 billion "prudent" cash level.
At the same time, while a continuing economic rebound, declining unemployment, and signs that American workers
are gaining some bargaining power may suggest that household formation may be at an inflection point after years of
stagnation, recent reports that Millennials are already flocking to the suburbs seem to be a bit overblown. If they do,
it's probably for space in their parents' basement. The country's youngest adults are still saddled with huge student
loans (about 60% of the $1.2 trillion outstanding), and their net worth has declined sharply. Among households headed
by adults younger than 35, net worth declined 68% from 1984-2009--to $3,700, from $11,500--according to an analysis
of Pew Research data by Georgetown University's Center on Education and the Workforce. In 1984, older adults had
13 times more wealth than young adults. By 2009, that disparity had ballooned to 44 times. This is in line with our
analysis of the Federal Reserve's Survey of Consumer Finances. In 1989, older adults, age 65-74, had 9.5x more wealth
than adults age 18-35. They had 22.2x more wealth in 2013. Relative to people age 35-44, it has more than tripled from
1989 to 5x more wealth in 2013 (see chart 3).
Chart 3
WWW.STANDARDANDPOORS.COM/RATINGSDIRECT OCTOBER 19, 2015 6
1466580 | 302229998
Economic Research: Millennials Are Creating Unsafe Conditions On U.S. Roads--But Not In The Way You MightThink
Under these conditions, it should come as no surprise that the increases in household formation that the U.S. economy
has enjoyed in the past several quarters have actually been driven by older Americans. A study by the Terner Center
for Housing Innovation at UC Berkeley that looked at data from the Census Bureau and Pew Research showed that
household formation for age groups younger than 55 has been negative in 2014-2015, while 65-74 year-olds have
accounted for more than two-thirds of overall household formation. Additionally, the modest increase in household
formation among 25-34 year-olds has merely been the result of the growing population of young adults rather than
wholesale changes in their living arrangements, the study said (see sidebar).
WWW.STANDARDANDPOORS.COM/RATINGSDIRECT OCTOBER 19, 2015 7
1466580 | 302229998
Economic Research: Millennials Are Creating Unsafe Conditions On U.S. Roads--But Not In The Way You MightThink
Millennials May Want That White Picket Fence--They Just Can't Afford It
There seems little doubt that, as Millennials age, get married in larger numbers, and have children, the U.S.
housing market will benefit. When--and how quickly--this happens remains to be seen, but it seems clear that this
generation's migration to the land of cul-de-sacs and commuter trains isn't happening as fast as some reports
suggest.
Saddled with record amounts of student debt, and suffering sharp declines in net worth, the country's youngest
adults simply aren't forming households at a rate commensurate with previous generations. In fact, studies show
older Americans are driving the rise in household formation that the U.S. economy has enjoyed in the past several
quarters.
Meanwhile, a limited supply of homes on the market and land available for development, as well as constrained
demand from buyers who would like to purchase property but can't yet afford to do so, have tempered the
housing recovery. Under these conditions, the rental market will likely continue to benefit. And, in fact,
construction of multifamily housing has remained strong across most U.S. markets this year, accounting for an
increased share of new construction.
Last year, almost 65% of new-home starts were single-family homes, with the balance mostly multifamily
projects, according to U.S. Census data. As recently as 2009, single-family starts made up 80% of new
construction, versus approximately 18% for multifamily developments--which means that the share of multifamily
starts nearly doubled in just five years.
The mix of single-family and multifamily construction has varied widely, moving in cycles every few years. Over
the past four decades, multifamily starts have ranged as low as 12% of all starts to a high of 38%, with a long-term
average of 26%. Last year, the approximately 356 million multifamily units was the highest number of units in at
least 14 years. The previous high of 353 million units, in 2005, comprised just 17% of total housing starts. In this
light, we anticipate that total starts will eventually return to the historical average of 1.5 million units per year,
given that multifamily starts have already approached their previous peak, while total housing starts remain
around 1 million units.
Standard & Poor's believes this surge in multifamily starts reflects, at least in part, Millennials' lifestyle choices, as
well as their trouble in affording homes. However, we don't think this will have any meaningful detrimental effect
on the credit quality of the homebuilders we rate--even though they won't likely benefit much from any further
increases in multifamily construction, because they generally don't participate in the for-rent component of the
housing market.
Still, we've seen some signs that Millennials do want a more traditional, suburban lifestyle than their
urban-dwelling, marriage-eschewing reputation suggests. While conventional wisdom suggests that, because of
declining homeownership rates and the obstacles preventing Millennials from entering the property market,
apartments would be the primary and preferred rental choice. The data indicate otherwise. Census figures show
that, since, 2006, the number of single-family rental homes has grown 35%--to 15.1 million, from 11.2 million.
During that time, 3.9 million single-family homes have become rental properties, exceeding the 2.9 million newly
built apartment units. We expect this trend to continue for at least another year or two as the number of renters
leaving to buy homes remains low.
Historically, single-family homes for rent were owned by a fragmented group, usually individuals who owned a
few properties or owners who, for one reason or another, decide to rent their homes rather than sell. In the wake
of the recent housing crisis, large institutional investment companies have decided to enter the rental business,
lured by a supply of low-cost and foreclosed-upon houses (which, we should note, has helped homebuilders to
offset some of the decline in demand from traditional first-time buyers).
It's difficult to determine to what degree Millennials are driving the trend toward single-family rentals, but one
fact is clearer: Young adults are having trouble coming up with the money to buy their first homes.
WWW.STANDARDANDPOORS.COM/RATINGSDIRECT OCTOBER 19, 2015 8
1466580 | 302229998
Economic Research: Millennials Are Creating Unsafe Conditions On U.S. Roads--But Not In The Way You MightThink
An analysis done last year by John Burns Real Estate Consulting (JBREC) said that among U.S. residents aged
20-39, student loan debt caused an 8% decline in home purchases and that every $250 a month a person owed on
such a loan reduced home-purchasing power by $44,000. Given that about 35% of households under age 40 have
monthly student debt payments exceeding $250 (up from 22% a decade ago) approximately 308,000 purchases
were "lost" because of student loans with payments up to $500 monthly, the report said.
The demographics of student-debt holders fit nicely with those of typical first-time buyers, who last year
accounted for only 33% of transactions, according to the National Association of Realtors. That was the lowest
percentage since 1987 and substantially lower than the historical average of about 40%. While the decline in
first-time homebuyers has obviously weighed on the housing market, many of the homebuilders we rate are
shielded somewhat because they focus more on move-up homebuyers or luxury-homebuyers than on the
traditional entrants.
All told, we expect homeownership rates to improve in the long term. But for now, Millennials are waiting longer
to buy their first homes--and when they do, it's typically at a higher price than traditional first-time buyers paid,
and more often in urban areas. This is having a bit of a push-and-pull effect on homebuilders. While demand from
first-time buyers has waned, such sales are typically lower-margin, which, theoretically, should improve builders'
profitability. However, with Millennials waiting longer to purchase homes--even at higher prices--the pace of sales
is slower.
With the U.S. housing market still in the process of reverting back to more normalized levels (if, as we expect this
comes to pass), the end result for homebuilders rests in the hands of our country's youngest adults.
Author: Maurice Austin
Little Deuce Coupe
Historically, VMT has risen commensurate with increases in population, income gains, and higher rates of vehicle
ownership--although the importance of the last of these factors has waned, given that a majority of American
households now have more than one vehicle (with an overall average of more than two vehicles per household).
Additionally, young drivers--along with the rest of the American public--are still buying cars. In fact, given the
higher-than-expected level of U.S. auto sales over the last few months, Standard & Poor's economists revised their
forecast for annual average auto sales to 17.2 million for the year, from 16.7 million. The continuing economic
rebound, historically low interest rates, and looser lending standards have enabled many consumers to finance or lease
vehicles, often higher-value ones than they could have afforded several years ago. And long-term loans (those over 72
months) continue to dominate the market, though it's our understanding that this is a reflection of buyers with good
credit scores stretching to buy more expensive vehicles, rather than purchases by consumers with high-risk credit
profiles.
Low gas prices as well as an improving construction industry have also pushed consumers toward larger vehicles.
Sales of light trucks have made up roughly 57% of year-to-date light-vehicle sales--growing to levels that we haven't
seen in a decade. And we expect the small car segment's share of U.S. auto sales to decline slightly this year, to about
18% from a peak of around 20% in 2009 (though that is still higher than the 15% share in 2006-2007).
WWW.STANDARDANDPOORS.COM/RATINGSDIRECT OCTOBER 19, 2015 9
1466580 | 302229998
Economic Research: Millennials Are Creating Unsafe Conditions On U.S. Roads--But Not In The Way You MightThink
However, this may not hold true for younger drivers, who, according to J.D. Power, continue to buy smaller--and more
fuel-efficient--vehicles. It noted that young households accounted for a large chunk of overall car sales; of those sales
many were for compact cars. Whether this is due to the Millennials' reputation for being more environmentally
conscious or the fact that smaller cars are generally more affordable for purchasers of limited means remains a
question. But for the purposes of gas-tax revenue, the reason is immaterial, and the ramifications immense.
So far this year, Millennials have bought one of every four cars sold in the U.S. and are the only generation cohort for
which auto sales are growing year over year, according to J.D. Power. (Purchases by Gen-Xers are flat at nearly
one-third of the market.) At the same time, two-thirds of the vehicles that Millennials buy are being financed, and
almost three-quarters of the vehicle loans Millennials are signing are for 72 months or more as they try to keep
monthly payments to a minimum.
We expect the growth in U.S. auto sales overall to moderate somewhat in the next two years as the Federal Reserve
begins to normalize interest rates--a process we now expect central bank policymakers to begin in December. Annual
average auto sales are expected to hold above 17 million through 2017. Either way, the diminished correlation
between sales and VMT--and the significant declines in the latter--means that a rebound in revenues from the federal
gas tax is unlikely, at a time when the nation's infrastructure is in dire shape.
Freeway Of Love
The dismal assessment that the American Society of Civil Engineers (ACSE) gave to U.S. infrastructure in its most
recent report card, in 2013--an overall grade of 'D+,' with roads and transit each garnering a 'D'--has been
well-discussed. The same goes for the World Economic Forum's Global Competitiveness Report for 2012-2013, which
ranked U.S. infrastructure 25th in the world (out of 144), with the country's roads at No. 20 (see "Global Infrastructure
Investment: Timing Is Everything (And Now Is The Time)," published Jan. 15).
Real-world examples may tell the story better than relative rankings of infrastructure quality. Consider that nearly
70,000 bridges in America--about one out of every nine--are structurally deficient, according to a 2012 report by
Building America's Future Educational Fund, a bipartisan group co-chaired by former New York Mayor Michael
Bloomberg, former Pennsylvania Gov. Ed Rendell, and former California Gov. Arnold Schwarzenegger.
In November of last year, CBS's "60 Minutes" aired a report in which Mr. Rendell said that I-95--the country's busiest
interstate highway, stretching more than 1,900 miles from the Canadian border to Miami--is in such dire need of
refurbishment that, in the 22 miles that run through Philadelphia alone, there are 15 structurally deficient bridges, and
that to fix them would cost $7 billion.
Further west, in the nation's biggest rail center of Chicago, congestion is so bad that it typically takes a freight train
longer to get through the city limits than it does to travel the 2,000 miles to Los Angeles, the group's report said. All
told, freight bottlenecks and other forms of congestion cost the U.S. economy an annual $200 billion, or 1.6% of GDP.
Along these lines, the National Surface Transportation Infrastructure Financing Commission has said that merely
maintaining the existing condition and performance of U.S. roads and transit would require a 50% increase in current
WWW.STANDARDANDPOORS.COM/RATINGSDIRECT OCTOBER 19, 2015 10
1466580 | 302229998
Economic Research: Millennials Are Creating Unsafe Conditions On U.S. Roads--But Not In The Way You MightThink
funding. Unfortunately, U.S. government spending on projects, as a percentage of GDP, has dropped to a two-decade
low of about 1.7%, according to the St. Louis Fed.
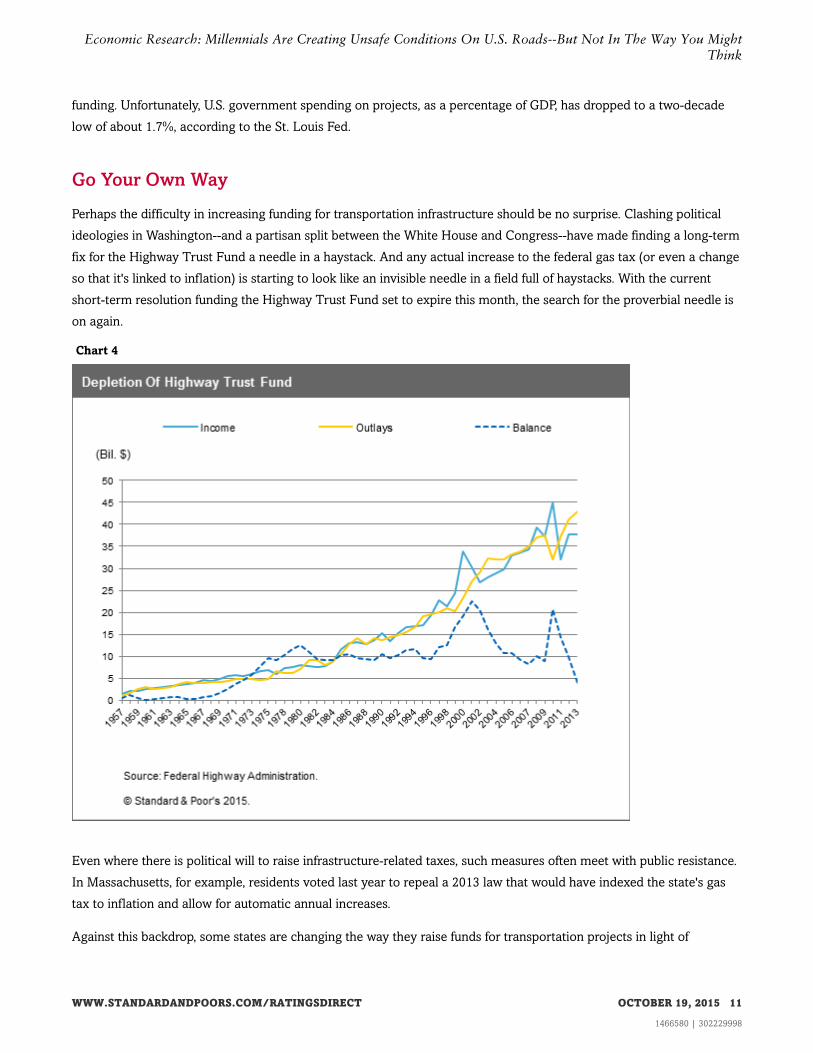
Go Your Own Way
Perhaps the difficulty in increasing funding for transportation infrastructure should be no surprise. Clashing political
ideologies in Washington--and a partisan split between the White House and Congress--have made finding a long-term
fix for the Highway Trust Fund a needle in a haystack. And any actual increase to the federal gas tax (or even a change
so that it's linked to inflation) is starting to look like an invisible needle in a field full of haystacks. With the current
short-term resolution funding the Highway Trust Fund set to expire this month, the search for the proverbial needle is
on again.
Chart 4
Even where there is political will to raise infrastructure-related taxes, such measures often meet with public resistance.
In Massachusetts, for example, residents voted last year to repeal a 2013 law that would have indexed the state's gas
tax to inflation and allow for automatic annual increases.
Against this backdrop, some states are changing the way they raise funds for transportation projects in light of
WWW.STANDARDANDPOORS.COM/RATINGSDIRECT OCTOBER 19, 2015 11
1466580 | 302229998
Economic Research: Millennials Are Creating Unsafe Conditions On U.S. Roads--But Not In The Way You MightThink

declining fuel-tax revenues. The Oregon Department of Transportation this year launched a project called OReGO, in
which state residents can enroll and pay a road-usage fee of 1.5 cents per mile for the amount of miles they drive,
instead of the fuel tax (which varies state by state, and is at 30 cents per gallon in Oregon). OReGO volunteers receive
credits to offset the fuel tax they pay at the pump. For now, the program is limited to 5,000 cars and light trucks--with
certain restrictions based on vehicles' mpg ratings.
Along similar lines, California Gov. Jerry Brown last year signed a law authorizing a study of a similar program for the
state where more miles by far are driven each year (upwards of 12% of the national total) than in any other.
Naturally, there's opposition to such programs--not the least of which comes from environmentalists. As currently
constructed, OReGO (which is, for now, voluntary) effectively rewards owners of gas-guzzling vehicles, while
punishing drivers of electric or hybrid vehicles, who pay little or nothing in gas tax. In pushing Congress to consider
charging motorists road-usage fees rather than a tax at the pump, nonprofit think tank the RAND Corp. has suggested
tailoring fees by vehicle type and perhaps even charging higher fees on crowded roads during peak hours--adding that
a nationwide average charge of 1.1 cents per mile might generate 20% more revenue than the federal gas tax does by
2030.
No Particular Place To Go
Meanwhile, Congress still faces the task of striking a deal on multiyear funding for the country's highways, roads, and
bridges, after legislators in July passed the 34th short-term fix since 2009. Such patches make it harder for states to
plan major transportation projects and delay maintenance and repair for aging and damaged infrastructure.
WWW.STANDARDANDPOORS.COM/RATINGSDIRECT OCTOBER 19, 2015 12
1466580 | 302229998
Economic Research: Millennials Are Creating Unsafe Conditions On U.S. Roads--But Not In The Way You MightThink
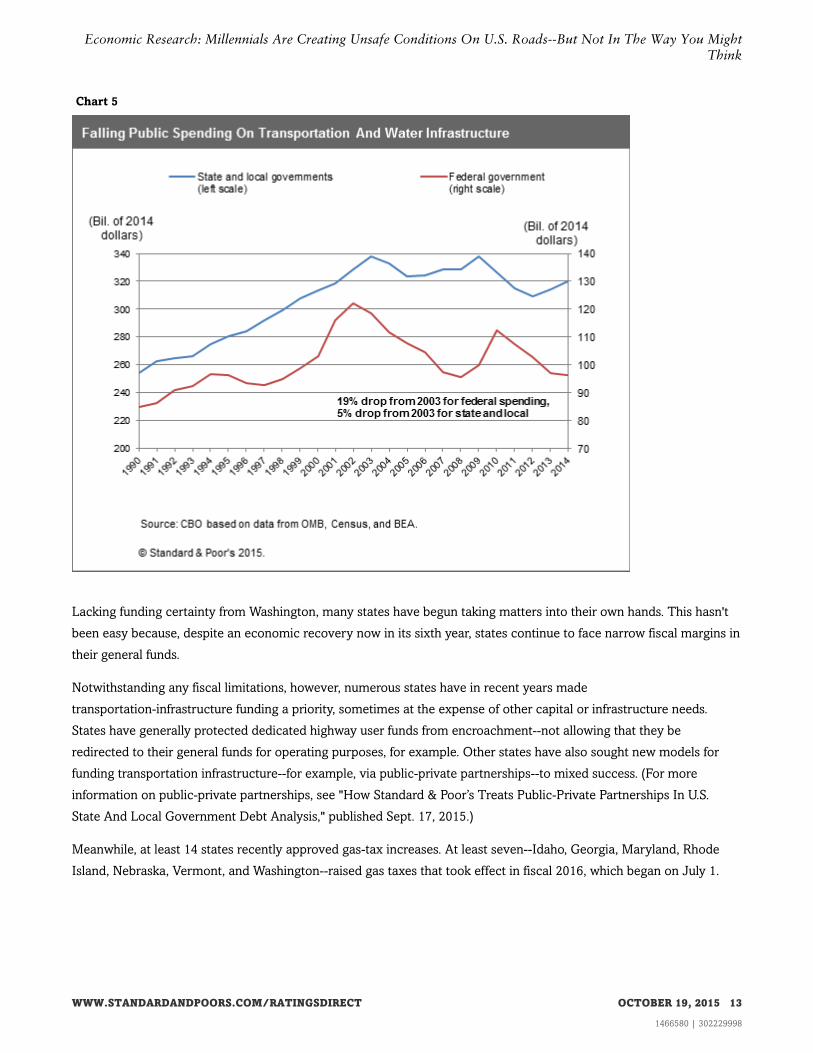
Chart 5
Lacking funding certainty from Washington, many states have begun taking matters into their own hands. This hasn't
been easy because, despite an economic recovery now in its sixth year, states continue to face narrow fiscal margins in
their general funds.
Notwithstanding any fiscal limitations, however, numerous states have in recent years made
transportation-infrastructure funding a priority, sometimes at the expense of other capital or infrastructure needs.
States have generally protected dedicated highway user funds from encroachment--not allowing that they be
redirected to their general funds for operating purposes, for example. Other states have also sought new models for
funding transportation infrastructure--for example, via public-private partnerships--to mixed success. (For more
information on public-private partnerships, see "How Standard & Poor’s Treats Public-Private Partnerships In U.S.
State And Local Government Debt Analysis," published Sept. 17, 2015.)
Meanwhile, at least 14 states recently approved gas-tax increases. At least seven--Idaho, Georgia, Maryland, Rhode
Island, Nebraska, Vermont, and Washington--raised gas taxes that took effect in fiscal 2016, which began on July 1.
WWW.STANDARDANDPOORS.COM/RATINGSDIRECT OCTOBER 19, 2015 13
1466580 | 302229998
Economic Research: Millennials Are Creating Unsafe Conditions On U.S. Roads--But Not In The Way You MightThink
I Can't Drive 55
Often, the debate about the U.S.'s crumbling infrastructure is framed in terms of cost. It's helpful, in our view, to look at
the issue in terms of what it will add to the world's biggest economy. We estimate that an increase in spending of 1%
of real U.S. GDP--or about $160 billion, spread out over four quarters--would boost economic output by $270 billion
over a three-year period. In other words, for each additional $1 allocated for public-sector investment, about $1.70
would be added to real GDP over the three years (see "U.S. Infrastructure Investment: A Chance To Reap More Than
We Sow," published May 5, 2014).
The "multiplier effect" for transportation infrastructure in particular is closer to 2 to 1. In other words, every dollar
spent would add $2 to the economy. (That said, the multiplier depends on the state of an economy; multipliers are
generally lower in a strong economy and higher in a stagnant or struggling one. Also, increased public spending would
likely crowd out some private investment, thus damping the multiplier effect.)
On the (not really) bright side, Americans wasted 4.8 billion hours and 1.9 billion gallons of fuel sitting in traffic in
2010, at a cost of $101 billion, according to the Building America's Future study. All flippancy aside, while that may
have added almost $350 million in federal gas tax to the coffers of the Highway Trust Fund, this is hardly a desirable
outcome.
Not that there's any easy fix on the horizon. The country's freshly minted drivers simply don't use their cars as often as
previous generations did at the same age. Whether that's a lifestyle choice or due to economic hardship is less
important that the fact that it's occurring--the result matters more than the reason. And with a federal gas tax that has
effectively declined 40% in real terms in the past two decades, it's clear that lawmakers must find a way to fund the
country's transportation infrastructure, or face harsh economic realities.
In perhaps starker terms, the weight of crumbling transportation infrastructure on productivity and growth puts the
U.S. at a competitive disadvantage with countries such as China, which leads the world in infrastructure spending and
whose economy is on track to overtake the U.S.'s as the world's largest. As rivals continue to modernize airports,
construct high-speed rail lines, expand their ports, and build surface-transportation systems that can handle 21st
century demand, wavering support in Washington for what was once an issue that enjoyed strong bipartisan backing
could harm U.S. economic growth prospects.
This is true not just relative to other large economies, but in an absolute sense, as well. Just as the multiplier effect
would add to GDP, a sort of "reverse multiplier" has been in effect for a number of years, as federal spending on
infrastructure has declined.
What has the U.S. already lost from the decline in spending on infrastructure since the recession began at the end of
2007 compared to if the pace of infrastructure spending picked up to rates seen years ago? In this scenario, the U.S.
has already lost $1.9 trillion in economic activity from that slowdown in infrastructure spending. Slower economic
activity meant 470,000 fewer jobs were needed than otherwise would have been the case. These lost jobs are not just
in infrastructure-related employment, but also jobs created from newfound economic activity that builds up after the
infrastructure was completed.
WWW.STANDARDANDPOORS.COM/RATINGSDIRECT OCTOBER 19, 2015 14
1466580 | 302229998
Economic Research: Millennials Are Creating Unsafe Conditions On U.S. Roads--But Not In The Way You MightThink

All told, simply maintaining the status quo may mean those 70,000 structurally deficient bridges may start to look like
the good old days, and the ACSE's (barely) passing grade could become a failing one.
Writer: Joe Maguire
We have determined, based solely on the developments described herein, that no rating actions are currently warranted. Only a rating
committee may determine a rating action and, as these developments were not viewed as material to the ratings, neither they nor this report
were reviewed by a rating committee.
WWW.STANDARDANDPOORS.COM/RATINGSDIRECT OCTOBER 19, 2015 15
1466580 | 302229998
Economic Research: Millennials Are Creating Unsafe Conditions On U.S. Roads--But Not In The Way You MightThink

S&P may receive compensation for its ratings and certain analyses, normally from issuers or underwriters of securities or from obligors. S&P
reserves the right to disseminate its opinions and analyses. S&P's public ratings and analyses are made available on its Web sites,
www.standardandpoors.com (free of charge), and www.ratingsdirect.com and www.globalcreditportal.com (subscription) and www.spcapitaliq.com
(subscription) and may be distributed through other means, including via S&P publications and third-party redistributors. Additional information
about our ratings fees is available at www.standardandpoors.com/usratingsfees.
S&P keeps certain activities of its business units separate from each other in order to preserve the independence and objectivity of their respective
activities. As a result, certain business units of S&P may have information that is not available to other S&P business units. S&P has established
policies and procedures to maintain the confidentiality of certain nonpublic information received in connection with each analytical process.
To the extent that regulatory authorities allow a rating agency to acknowledge in one jurisdiction a rating issued in another jurisdiction for certain
regulatory purposes, S&P reserves the right to assign, withdraw, or suspend such acknowledgement at any time and in its sole discretion. S&P
Parties disclaim any duty whatsoever arising out of the assignment, withdrawal, or suspension of an acknowledgment as well as any liability for any
damage alleged to have been suffered on account thereof.
Credit-related and other analyses, including ratings, and statements in the Content are statements of opinion as of the date they are expressed and
not statements of fact. S&P's opinions, analyses, and rating acknowledgment decisions (described below) are not recommendations to purchase,
hold, or sell any securities or to make any investment decisions, and do not address the suitability of any security. S&P assumes no obligation to
update the Content following publication in any form or format. The Content should not be relied on and is not a substitute for the skill, judgment
and experience of the user, its management, employees, advisors and/or clients when making investment and other business decisions. S&P does
not act as a fiduciary or an investment advisor except where registered as such. While S&P has obtained information from sources it believes to be
reliable, S&P does not perform an audit and undertakes no duty of due diligence or independent verification of any information it receives.
No content (including ratings, credit-related analyses and data, valuations, model, software or other application or output therefrom) or any part
thereof (Content) may be modified, reverse engineered, reproduced or distributed in any form by any means, or stored in a database or retrieval
system, without the prior written permission of Standard & Poor's Financial Services LLC or its affiliates (collectively, S&P). The Content shall not be
used for any unlawful or unauthorized purposes. S&P and any third-party providers, as well as their directors, officers, shareholders, employees or
agents (collectively S&P Parties) do not guarantee the accuracy, completeness, timeliness or availability of the Content. S&P Parties are not
responsible for any errors or omissions (negligent or otherwise), regardless of the cause, for the results obtained from the use of the Content, or for
the security or maintenance of any data input by the user. The Content is provided on an "as is" basis. S&P PARTIES DISCLAIM ANY AND ALL
EXPRESS OR IMPLIED WARRANTIES, INCLUDING, BUT NOT LIMITED TO, ANY WARRANTIES OF MERCHANTABILITY OR FITNESS FOR
A PARTICULAR PURPOSE OR USE, FREEDOM FROM BUGS, SOFTWARE ERRORS OR DEFECTS, THAT THE CONTENT'S FUNCTIONING
WILL BE UNINTERRUPTED, OR THAT THE CONTENT WILL OPERATE WITH ANY SOFTWARE OR HARDWARE CONFIGURATION. In no
event shall S&P Parties be liable to any party for any direct, indirect, incidental, exemplary, compensatory, punitive, special or consequential
damages, costs, expenses, legal fees, or losses (including, without limitation, lost income or lost profits and opportunity costs or losses caused by
negligence) in connection with any use of the Content even if advised of the possibility of such damages.
Copyright © 2015 Standard & Poor's Financial Services LLC, a part of McGraw Hill Financial. All rights reserved.
WWW.STANDARDANDPOORS.COM/RATINGSDIRECT OCTOBER 19, 2015 16
1466580 | 302229998