economic policy and prospects for reform under a second...
TRANSCRIPT

Economic Policy and Prospects for Reform under a Second Lula Administration
Otaviano CanutoWorld Bank, Executive Director forBrazil, Colombia, Dominican Republic,Ecuador, Haiti, Panama, Philippines, Suriname and Trinidad & Tobago
Woodrow Wilson Center Brazil InstituteWashington, November 1, 2006
1. Succession without a crisis: improved fundamentals2. Growth as the overriding challenge

Succession without a crisis:
improved fundamentals

Public Sector Primary Results and Targets (acc. in 12 months)Public Sector Primary Results and Targets (acc. in 12 months)Net Public Sector Debt / GDPNet Public Sector Debt / GDP
Source:Central Bank
Strong Fiscal Commitment =>expected debt reduction
Historical consolidated Public Sector Primary Surplus
3
Source:Central Bank
Historical consolidated Public Sector Primary Surplus Net Debt/GDP scenarios based on the FOCUS surveyNet Debt/GDP scenarios based on the FOCUS survey
Source:Central Bank and National Treasury* Data of Central Bank – IGP-DI (wholesale price index)‘modified’
35%
37%
39%
41%
43%
45%
47%
49%
51%
53%
2005 2006 2007 2008 2009 2010 2011
Market Scenario GDP 4% GDP 3%
4.33%
2.50%
3.10%
3.70%
4.30%
4.90%
5.50%
Jan-
02
Oct
-02
Jul-0
3
Apr-
04
Jan-
05
Oct
-05
Jul-0
6
% G
DP
Performed Target
% o
f GD
P
Market Expectations on Sep 26, 2006(annual data)
1Q00 through 2Q06 (quarterly data)
43.81Q00
3Q00
1Q01
3Q01
1Q02
3Q02
1Q03
3Q03
1Q04
3Q04
1Q05
3Q05
1Q06
2006 2008 201043
48
53
58
63 61.7
2Q 0650.3
Jan94
Jan95
Jan96
Jan97
Jan98
Jan99
Jan00
Jan01
Jan02
Jan03
Jan04
Jan05
Sep06
% o
f GD
P
-1
0
1
2
3
4
5
6
7
4.47
avg. 1994-Jun/954.77%
avg. Jul/95-1998-0.1%
avg. 1999-20023.18%
avg. 2003-20064.54%
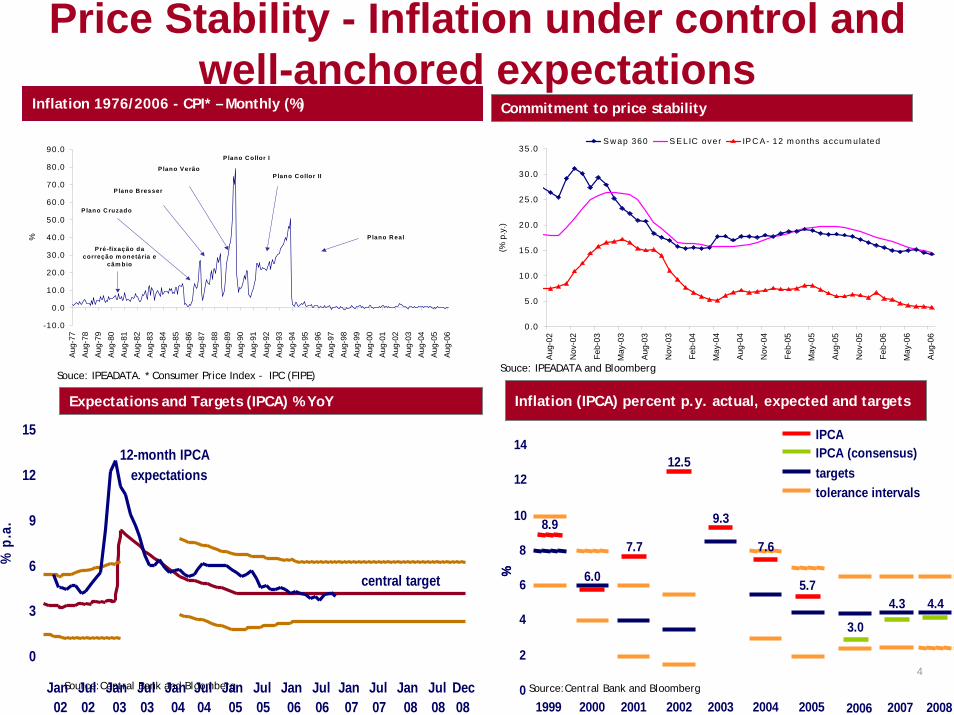
Inflation 1976/2006 - CPI* – Monthly (%)Inflation 1976/2006 - CPI* – Monthly (%)Commitment to price stability
Price Stability - Inflation under control and well-anchored expectations
Commitment to price stability
Expectations and Targets (IPCA) % YoY
Souce: IPEADATA. * Consumer Price Index - IPC (FIPE)
Expectations and Targets (IPCA) % YoY Inflation (IPCA) percent p.y. actual, expected and targetsInflation (IPCA) percent p.y. actual, expected and targets
4Source:Central Bank and Bloomberg
Souce: IPEADATA and Bloomberg
-10.0
0.0
10.0
20.0
30.0
40.0
50.0
60.0
70.0
80.0
90.0
Aug
-77
Aug
-78
Aug
-79
Aug
-80
Aug
-81
Aug
-82
Aug
-83
Aug
-84
Aug
-85
Aug
-86
Aug
-87
Aug
-88
Aug
-89
Aug
-90
Aug
-91
Aug
-92
Aug
-93
Aug
-94
Aug
-95
Aug
-96
Aug
-97
Aug
-98
Aug
-99
Aug
-00
Aug
-01
Aug
-02
Aug
-03
Aug
-04
Aug
-05
Aug
-06
%
Pré-fixação da correção m onetária e
câm bio
P lano C ruzado
Plano B resser
P lano Verão
P lano C ollor I
P lano C ollor II
P lano R eal
0.0
5.0
10.0
15.0
20.0
25.0
30.0
35.0
Aug-
02
Nov
-02
Feb-
03
May
-03
Aug-
03
Nov
-03
Feb-
04
May
-04
Aug-
04
Nov
-04
Feb-
05
May
-05
Aug-
05
Nov
-05
Feb-
06
May
-06
Aug-
06
(% p
.y.)
S w ap 360 S E LIC over IP C A - 12 m onths accum ula ted
% p
.a.
central target
12-month IPCA expectations
0
3
6
9
12
15
Jan02
Jul02
Jan03
Jul03
Jan04
Jul04
Jan05
Jul05
Jan06
Jul06
Jan07
Jul07
Jan08
Jul08
Dec08
%%
targetstolerance intervals
IPCAIPCA (consensus)
0
2
4
6
8
10
12
14
1999 2000 2001 2002 2003 2004 2005 2006
8.9
6.0
7.7
12.5
9.3
7.6
3.0
5.7
2007
4.3
2008
4.4
Source:Central Bank and Bloomberg

Market Expectations – Focus (Oct 30, 2006)

Current account (12 months accumulated - US$ bn)Current account (12 months accumulated - US$ bn)Trade Balance
Reduction in the External VulnerabilityTrade Balance
Net External Debt/Exports accumulated in 12 months*Net External Debt/Exports accumulated in 12 months*
Source: Central Bank. *Public Debt and Private Debt as a share of export accumulated in 12 months
External Trade (Exports + Imports) of GDP (%)External Trade (Exports + Imports) of GDP (%)
6
Source: MDIC - SECEX Source:Central Bank
* Until July, 2006Source: MDIC – SECEX and Central Bank
24.5%
10%
12%
14%
16%
18%
20%
22%
24%
26%
28%
1990
1991
1992
1993
1994
1995
1996
1997
1998
1999
2000
2001
2002
2003
2004
2005
2006
*
0 .0
20.0
40.0
60.0
80.0
100.0
120.0
140.0
Aug
-00
Dec
-00
Apr
-01
Aug
-01
Dec
-01
Apr
-02
Aug
-02
Dec
-02
Apr
-03
Aug
-03
Dec
-03
Apr
-04
Aug
-04
Dec
-04
Apr
-05
Aug
-05
Dec
-05
Apr
-06
Aug
-06
Imp.
and
Exp
. - U
S$
Bn
-10.0
0.0
10.0
20.0
30.0
40.0
50.0
Trad
e B
alan
ce -
US
$ B
n
T rade Balance Im port Export13.8
-30.0
-25.0
-20.0
-15.0
-10.0
-5.0
0.0
5.0
10.0
15.0
20.0
Aug
-01
Nov
-01
Feb-
02
May
-02
Aug
-02
Nov
-02
Feb-
03
May
-03
Aug
-03
Nov
-03
Feb-
04
May
-04
Aug
-04
Nov
-04
Feb-
05
May
-05
Aug
-05
Nov
-05
Feb-
06
May
-06
Aug
-06
US
$ B
illion
0.5
3.6
1.2
4.7
0.0
0.5
1.0
1.5
2.0
2.5
3.0
3.5
4.0
4.5
5.0
1999
2000
2001
2002
2003
2004
2005
Aug
-06
Net External Debt / Exports Gross External Debt / Exports

Brazilian exports by destination (as a % of total exports)Brazilian exports by destination (as a % of total exports)
Brazilian exports by type (as a % of total exports)Brazilian exports by type (as a % of total exports)
7
Broad-based exports: balanced growth across markets and products
2 0 0 0 2 0 0 1 2 0 0 2 2 0 0 3 2 0 0 41 2 - m o n t h s p e r c e n t a g e
c h a n g e 1
C o n t r ib u t io n ( p . p ) G r o w t h
L a t in A m e r ic a 2 3 . 4 % 2 1 . 0 % 1 6 . 3 % 1 7 . 7 % 2 0 . 4 % 3 1 . 6 % 5 . 2 o f w h ic h M e r c o s u l 1 4 .0 % 1 0 .9 % 5 .5 % 7 .8 % 9 .2 % 3 2 .6 % 2 .4A s ia 1 1 .5 % 1 1 .9 % 1 4 .6 % 1 6 .0 % 1 5 .1 % 2 4 .7 % 3 .7 o f w h ic h C h in a 2 .0 % 3 .3 % 4 .2 % 6 .2 % 5 .6 % 2 1 .4 % 1 .3 o f w h ic h J a p a n 4 .5 % 3 .4 % 3 .5 % 3 .2 % 2 .9 % 2 5 .3 % 0 .7C a n a d a 1 .0 % 1 .0 % 1 .3 % 1 .3 % 1 .2 % 5 1 .1 % 0 .4U S A 2 4 .3 % 2 4 .7 % 2 5 .7 % 2 3 .1 % 2 1 .1 % 1 2 .7 % 4 .7E u r o p e a n U n io n 1 6 .8 % 2 5 .5 % 2 5 .0 % 2 4 .8 % 2 5 .0 % 1 4 .6 % 5 .5O t h e r s 1 3 .0 % 1 5 .9 % 1 7 .0 % 1 7 .1 % 1 7 .1 % 3 9 .8 % 4 .7
T o t a l e x p o r t s ( U S $ b n ) 5 5 . 0 5 8 . 2 6 0 . 4 7 3 . 1 9 6 . 5 1 1 6 . 6 2 -
% g r o w t h 1 4 . 7 % 5 . 7 % 3 . 7 % 2 1 . 1 % 3 2 . 0 % 2 4 , 0 % 3-
S o u r c e : M D IC / S E C E X1 T h i s c o n t r ib u t io n r e f le c t D e c e m b e r 0 4 / N o v e m b e r 0 5 e x p o r t s in t e r m s o f D e c e m b e r 0 3 / N o v e m b e r 0 4 e x p o r t s2 T o t a l in D e c e m b e r 0 4 / N o v e m b e r 0 53 T o t a l g r o w t h in D e c e m b e r 0 4 / N o v e m b e r 0 5
1999 2000 2001 2002 2003 2004 November/041 November/051
Primary products 24.6% 22.8% 26.4% 28.1% 29.0% 29.6% 29.9% 29.0%Intermediary goods 16.6% 15.4% 14.2% 14.9% 15.0% 13.9% 14.1% 13.5%Manufactured products 56.9% 59.0% 56.5% 54.7% 54.3% 54.9% 54.4% 55.4%Special operations 1.8% 2.7% 3.0% 2.4% 1.8% 1.6% 1.6% 2.1%Total (US$ mn) 48.0 55.1 58.2 60.4 73.1 96.5 94.0 116.6 % growth (6.1)% 14.7% 5.7% 3.7% 21.1% 32.0% 31.4% 24.0%Source: MDIC/SECEX1 Total in 12 months

Trade Balances (Varying prices and volumes)
Volumes (as of)
Prices (as of )
2006 2005 2004 2003
2006 44.4 51.6 43.9 34.6
2005 35.8 44.8 37.7 29.7
2004 30.6 38.5 33.7 26.5
2003 26.9 34.0 29.7 24.8Source: Pactual

0
10,000
20,000
30,000
40,000
50,000
60,000
70,000
80,000
Aug
-99
Dec
-99
Apr-
00
Aug
-00
Dec
-00
Apr-
01
Aug
-01
Dec
-01
Apr-
02
Aug
-02
Dec
-02
Apr-
03
Aug
-03
Dec
-03
Apr-
04
Aug
-04
Dec
-04
Apr-
05
Aug
-05
Dec
-05
Apr-
06
Aug
-06
US
$ M
illio
n
Restructured Debt (Bradies) New Bonds Contractual Debt Net Reserves
External Debt – National TreasuryExternal Debt – National Treasury
New
Issuances
International ReservesInternational Reserves
9
Source: National TreasurySource: National Treasury
External Public Debt Profile – New Bonds and Bradies
Management of External Public Debt Lower vulnerability & International Reserves
External Public Debt Profile – New Bonds and Bradies
Source: National Treasury.
Average Maturity – At Issuance of New BondsAverage Maturity – At Issuance of New Bonds
Source: National Treasury*Does not include the A-bond.** As of May/06
4.18
17.92
-
2.0
4.0
6.0
8.0
10.0
12.0
14.0
16.0
18.0
20.0
2001
2002
2003
2004
2005
*
2006
**
Year
s
-
1,000
2,000
3,000
4,000
5,000
6,000
7,000
8,000
9,000
2007
2008
2009
2010
2011
2012
2013
2014
2015
2016
2017
2018
2019
2020
2021
2022
2023
2024
2025
2026
2027
2028
2029
2030
2031
2032
2033
2034
2035
2036
2037
2038
2039
2040
US
$ M
illion
Principal Interest
Oct 4:74.0
15
25
35
45
55
65
75
Jan99
Jan00
Jan01
Jan02
Jan03
Jan04
Jan05
Jan06
US$
bill
ion

Nominal Exchange RateNominal Exchange Rate Real Effective Exchange Rate
Exchange and Interest ratesReal Effective Exchange Rate
Souce: IPEADATA. * Consumer Price Index - IPC (FIPE)
Real Interest Rate (360-day Swap)Real Interest Rate (360-day Swap)
Source:Central Bank and Bloomberg
Souce: IPEADATA and Bloomberg
R$/
US$
Sep 292.17
10
1.0
1.5
2.0
2.5
3.0
3.5
4.0
Jan98
Jan99
Jan00
Jan01
Jan02
Jan03
Jan04
Jan05
Jan06
Jun
94=1
00
100.0
100.4
60
80
100
120
140
160
180
Jan88
Jan90
Jan92
Jan94
Jan96
Jan98
Jan00
Jan02
Jan04
Aug06
basket of 15 currencies
%
9.15
10
15
20
25
30
35
40
Jan96
Jan97
Jan98
Jan99
Jan00
Jan01
Jan02
Jan03
Jan04
Jan05
Sep06
avg. 06:10.0%avg. 96/99:
18.5% avg. 04/05:11.5%
avg. 00/03:15.0%

Federal Domestic Debt IndicatorsFederal Domestic Debt Indicators
Federal Debt Indicators*Federal Debt Indicators*
Management of Domestic Public Debt Lower Vulnerability
11
Minimum Maximum
Stock of DPMFi held by the public (R$ billion) 623.2 731.4 810.3 979.7 1,039.0 1,130.0 1,200.0Average Maturity of DPMFi (months) 33.2 31.3 28.1 27.4 29.8 30.0 35.0Average Life (month)¹ - - - 40.3 44.6 44.0 52.0% Maturing in 12 months 41.1 35.3 46.1 41.6 39.2 31.0 36.0
Share of DPMFi (%)Fixed rate 2.2 12.5 20.1 27.9 31.5 28.0 37.0Price Index 12.5 13.6 14.9 15.5 21.6 18.0 24.0Floating rate 60.8 61.4 57.1 51.8 42.5 39.0 48.0
Exchange rate 22.4 10.8 5.2 2.7 2.2 1.0 3.0Others 2.1 1.8 2.7 2.1 2.2 2.0 4.0
¹ Since these data have been calculated through the use of the commonly used international methodology, the statistics allow for comparisons with the indicators of other countries.
Aug/062002 2003 2005Indicators 20042006
Minimum MaximumStock of DPF* held by the public (R$ billion) 893.3 965.8 1,013.9 1,157.1 1,175.0 1,280.0 1,360.0Average maturity - Federal Outstanding Debt (months) 42.6 39.0 35.3 32.9 35.4 35.0 41.0Average Life (month)** - - - 56.3 57.8 60.0 70.0% Maturing in 12 months 34.6 30.7 39.3 38.2 36.5 28.0 33.0
Share of DPF (%)Fixed rate 1.5 9.5 16.1 23.6 27.8 25.0 33.0Price Index 8.8 10.3 11.9 13.1 19.1 16.0 22.0Floating rate 42.4 46.5 45.7 43.9 37.6 35.0 43.0
Exchange rate 45.8 32.4 24.2 17.6 13.6 11.0 15.0Others 1.4 1.4 2.2 1.8 2.0 1.0 3.0
* It includes the external debt under the responsibility of National Treasury** Since these data have been calculated through the use of the commonly used international methodology, the statistics allow for comparisons with the indicators of other countries.
20042002 20032006
Aug/062005Indicators

0.00%
10.00%
20.00%
30.00%
40.00%
50.00%
60.00%
1995 1996 1997 1998 1999 2000 2001 2002 2003 2004 2005
Directed CreditSelic
Interest rate, directed credit (TJLP) and Selic (%)Interest rate, directed credit (TJLP) and Selic (%)Volume and costs of credit
Default rates (above 60 days)

Profitable private sector and dynamic credit & capital markets
Credit to the private sector (Jan 2004=100)Credit to the private sector (Jan 2004=100)
Source:CVM
Risk Perception – Brazil and Emerging MarketsRisk Perception – Brazil and Emerging Markets
Profitability of 500 Top Firms (1981-2004)Profitability of 500 Top Firms (1981-2004)
Source: Conjuntura Econômica - FGV - August 2005
K Markets – Primary Issue (R$ million – current values)K Markets – Primary Issue (R$ million – current values)
0
10,000
20,000
30,000
40,000
50,000
60,000
70,000
1996
1997
1998
1999
2000
2001
2002
2003
2004
2005
2006
**
Shares Debentures Other*
175.8
100.0
110.0
120.0
130.0
140.0
150.0
160.0
170.0
180.0
Feb-
02
May
-02
Aug
-02
Nov
-02
Feb-
03
May
-03
Aug
-03
Nov
-03
Feb-
04
May
-04
Aug
-04
Nov
-04
Feb-
05
May
-05
Aug
-05
Nov
-05
(*) Includes promissory notes, CRIs (real estate receivables certificates), and quotas of credit rightsinvestment funds, among others. (**) Up to July
100
150
200
250
300
350
400
Oct
-05
Nov
-05
Jan-
06
Feb-
06
Mar
-06
Apr-
06
May
-06
Jul-0
6
Aug
-06
Spr
ead
50
150
250
350
450
550S
prea
d D
iffer
ence
Brazil - Emerging Markets EMBI+ Brasil EMBI+ X-Brasil X-Arg
Buy Back
Bradies Call

Some reforms have impacted average GDP growthSome reforms have impacted average GDP growth
Job creation 6 largest metropolitan areasJob creation 6 largest metropolitan areas
14
Job Creation (Net hiring in the formal sector)
Formal job creationJob Creation (Net hiring in the formal sector)
Rise in purchasing power of minimun wageRise in purchasing power of minimun wage
Source: IBGE
Source: Central Bank
1,188.6
-700
-180
340
860
1380
1900
1995 1996 1997 1998 1999 2000 2001 2002 2003 2004 2005*
Net
Adm
ittan
ce -
Thou
sand
6.900
7.400
7.900
8.400
8.900
9.400
Apr-02 Aug-02 Dec-02 Apr-03 Aug-03 Dec-03 Apr-04 Aug-04 Dec-04 Apr-05 Aug-05 Dec-05
Formal jobs
Informal jobs + autonomous
Source: IBGE. Prepared by MF/SPE.
Thousands
70
350
300
260240
200180
151136130
120112100
0
50
100
150
200
250
300
350
400
Jan-95 Oct-95 Jul-96 Apr-97 Jan-98 Oct-98 Jul-99 Apr-00 Jan-01 Oct-01 Jul-02 Apr-03 Jan-04 Oct-04 Jul-05 Apr-060,0
0,5
1,0
1,5
2,0
2,5R$
Minimum wage-to-basic food bundle ratio (right scale)
%
0
1
2
3
4
1981-1990 1991-2003 2004-2006*
1.6
2.3
3.7

Reduction in both poverty and inequality
15
Income Poverty 1992-2004Income Poverty 1992-2004
Comparison of poverty across countriesComparison of poverty across countriesIncome Distribution 1990-2004 Income Distribution 1990-2004
Source: IBGE Source: IBGE
Source: IBGE and The World BankSource: IBGE and The World Bank
< US$ 1/day < US$ 2/day Survey dateBRASIL 8,2 22,4 2001CHINA 16,6 46,7 2001ÍNDIA 35,3 80,6 1999-00
RÚSSIA <2 7,5 2002INDONÉSIA 7,5 52,4 2002MALASIA <2 9,3 1997MÉXICO 9,9 26,3 2000
FILIPINAS 15,5 47,5 2000TAILÂNDIA <2 32,5 2000
% Population living with
Income Inequality Measures (1976-2004)Income Inequality Measures (1976-2004)
35,87
36,57
29,82 29,8029,59
28,29
29,30 29,01 28,72
27,26
26,23
25,08
20
22
24
26
28
30
32
34
36
38
40
1992 1993 1995 1996 1997 1998 1999 2000 2001 2002 2003 2004
%
0,57
20,
665
0,50
0,55
0,60
0,65
0,70
0,75
0,80
0,85
0,90
0,95
1,00
1976
1977
1978
1979
1981
1982
1983
1984
1985
1986
1987
1988
1989
1990
1992
1993
1995
1996
1997
1998
1999
2001
2002
2003
2004
0,50
0,55
0,60
0,65
0,70
0,75
0,80
0,85
0,90
0,95
1,00
Theil T
Gini
48,0 48,447,2 46,7 47,3 46,4 45,7
44,7
14,113,513,212,412,611,912,111,5
40,539,5
40,9 40,7 40,4 40,4 41,240,8
1990 1993 1996 1999 2001 2002 2003 2004
50% poorest 40% 10% richest

Reduction in both poverty and inequality
16
Growth and Household IncomeGrowth and Household Income
Inequality Reduction: Labor Income and Bolsa-FamiliaInequality Reduction: Labor Income and Bolsa-FamiliaReturns to education. Average of schooling years of 10 y-old
(or more) people
Returns to education. Average of schooling years of 10 y-old (or more) people
5.0
6.6
4.0
4.5
5.0
5.5
6.0
6.5
7.0
1993 1995 1996 1997 1998 1999 2001 2002 2003 2004
Source: IBGE Source: IBGE
Income Transfer Programs (means-tested + CCTs)Income Transfer Programs (means-tested + CCTs)
2004-2003Gini - Concentration Coefficient Change (p.p.) -1,11 Concentration effect 88% Income effect 12%
Labor Income 1 71%Minimum wage indexed Pensions 2 -10%Other Pensions 3%Interests, dividends and Bolsa-família 3 38%Rentals and donations -2%
1,4%0,6%
1,3%
2,4%
4,7%4,3%
3,1%
2,3% 2,3%2,3%
4,0%
45.000
47.000
49.000
51.000
53.000
55.000
57.000
59.000
61.000
63.000
65.000
Dec
-02
Mar
-03
Jun-
03
Sep
-03
Dec
-03
Mar
-04
Jun-
04
Sep
-04
Dec
-04
Mar
-05
Jun-
05
Sep
-05
Dec
-05
Mar
-06
Jun-
06
Sep
-06
Dec
-06
0%
1%
2%
3%
4%
5%
6%
7%
8%
9%
10%R$ millions
8,2%
5,5%
5,2%
Real GDP yearly change (seasonally adjusted; right scale)
Note: Labor income + pensions, other social insurance and transfers (seguro-desemprego, INSS, FGTS e Bolsa-Família, etc). 2006 = ForecastSources: PME/ IBGE, Caixa Econômica Federal, MF/STN, IPEAdata e SIAFI. Prepared by MF/SPE.
Bolsa-Família
5,69
3,79
0,57
8,3
0,0
1,0
2,0
3,0
4,0
5,0
6,0
7,0
8,0
9,0
2.001 2002 2003 2004 2005 2006
R$ billionsOther programs
2,64
1,75
1,09
0,25
2,26
0,41
0,0
1,0
2,0
3,0
4,0
5,0
6,0
7,0
8,0
9,0
2001 2002 2003 2004 2005 2006 *
Cartão-AlimentaçãoAuxílio-GásBolsa-AlimentaçãoBolsa-Escola
R$ billions

Growth as the overriding challenge


Brazilian GDP grew at a lower pace than other emerging economies in the last 25 years
(average, 1980-2005)
0
2
4
6
8
10
China
Singapore
SouthKorea
Malaysia
Thailand
India
Chile
Turkey
Mexico
Brazil
%

The Primary Source of Growth- Productivity
Most Growth Episodes with a Growth Rate of over 7% have a TFG Contribution of 3% or more
GDP Growth Rate TFP GDP Growth Rate TFPCambodia 7.48 3.21China 9.94 6.33 7.13 2.49*Malaysia 8.45 3.4Singapore 7.95 3.69Korea 7.48 3.13Thailand 8.58 4.74Ireland 7.99 3.52Israel 7.03 2.11Chile 7.24 3.55Lebanon 13.51 12.27Syria 7.97 4.87
7.35 3.86
*Could be 0.5% higher because of revision of GDP growth upward during the period, according to Srinivasan, T.N. 2006
Developing Asia
1995-2003 (%)
Source: Jorgenson and Vu 2005. Of the 110 economies or 220 growth episodes studied by Jorgenson and Vu 2005, only these 12 episodes had a growth rate of over 7%.
1989-1995 (%)

Growth Total Factor Productivity
Investm.(risk-adjusted rates of return)

Inflation and Monetary Policy- The last price shock- End of disinflation and search for the natural rate
WPI
Foreign Prices –Commodities (R$)

Fiscal Policy and Quality of Adjustment