economic operation of typical microgrids
TRANSCRIPT
University of Kentucky University of Kentucky
UKnowledge UKnowledge
Theses and Dissertations--Electrical and Computer Engineering Electrical and Computer Engineering
2018
ECONOMIC OPERATION OF TYPICAL MICROGRIDS ECONOMIC OPERATION OF TYPICAL MICROGRIDS
Yuanzhen Guo University of Kentucky, [email protected] Digital Object Identifier: https://doi.org/10.13023/etd.2018.475
Right click to open a feedback form in a new tab to let us know how this document benefits you. Right click to open a feedback form in a new tab to let us know how this document benefits you.
Recommended Citation Recommended Citation Guo, Yuanzhen, "ECONOMIC OPERATION OF TYPICAL MICROGRIDS" (2018). Theses and Dissertations--Electrical and Computer Engineering. 131. https://uknowledge.uky.edu/ece_etds/131
This Master's Thesis is brought to you for free and open access by the Electrical and Computer Engineering at UKnowledge. It has been accepted for inclusion in Theses and Dissertations--Electrical and Computer Engineering by an authorized administrator of UKnowledge. For more information, please contact [email protected].

STUDENT AGREEMENT: STUDENT AGREEMENT:
I represent that my thesis or dissertation and abstract are my original work. Proper attribution
has been given to all outside sources. I understand that I am solely responsible for obtaining
any needed copyright permissions. I have obtained needed written permission statement(s)
from the owner(s) of each third-party copyrighted matter to be included in my work, allowing
electronic distribution (if such use is not permitted by the fair use doctrine) which will be
submitted to UKnowledge as Additional File.
I hereby grant to The University of Kentucky and its agents the irrevocable, non-exclusive, and
royalty-free license to archive and make accessible my work in whole or in part in all forms of
media, now or hereafter known. I agree that the document mentioned above may be made
available immediately for worldwide access unless an embargo applies.
I retain all other ownership rights to the copyright of my work. I also retain the right to use in
future works (such as articles or books) all or part of my work. I understand that I am free to
register the copyright to my work.
REVIEW, APPROVAL AND ACCEPTANCE REVIEW, APPROVAL AND ACCEPTANCE
The document mentioned above has been reviewed and accepted by the student’s advisor, on
behalf of the advisory committee, and by the Director of Graduate Studies (DGS), on behalf of
the program; we verify that this is the final, approved version of the student’s thesis including all
changes required by the advisory committee. The undersigned agree to abide by the statements
above.
Yuanzhen Guo, Student
Dr. Yuan Liao, Major Professor
Dr. Aaron Cramer, Director of Graduate Studies

ECONOMIC OPERATION OF TYPICAL MICROGRIDS
THESIS
A thesis submitted in partial fulfillment of the
requirements for the degree of Master of Science in Electrical Engineering
in the College of Engineering
at the University of Kentucky
By
Yuanzhen Guo
Lexington, Kentucky
Director: Dr. Yuan Liao, Professor of Electrical and Computer Engineering
Lexington, Kentucky
2018
Copyright © Yuanzhen Guo 2018

ABSTRACT OF THESIS
ECONOMIC OPERATION OF TYPICAL MICROGRIDS
A microgrid is a subnetwork of power system that consists of a group of
distributed energy sources and loads. It is designed to integrate distributed generation, loads, energy storage devices, converters, and monitoring and protection devices. Generally, a successful microgrid could run both in island mode (off-grid) and in grid-connected mode (on-grid), being able to convert between two modes at any time. With continuous development of the power system, distributed renewable generation unit accounts for an increasing proportion, since microgrid could effectively connect these generation units to the main grid, thereby improving the energy efficiency and the energy structure. Microgrid is increasingly playing an important role in the power system.
This thesis focuses on reducing the cost of microgrids through economic operation, including both static and dynamic economic operations. Three cases are tested based on these two methods. Also, each case will include four situations including one without ESS and three situations with 2MWh ESS, 3MWh ESS, 4MWh ESS, respectively.
KEYWORDS: Microgrid (MG), Static Economic Operation, Dynamic Economic Operation, Energy Storage System(ESS), Photovoltaic(PV) Generation.
Yuanzhen Guo
Signature
11/30/2018
Date
ECONOMIC OPERATION OF TYPICAL MICROGRIDS
By
Yuanzhen Guo
Yuan Liao
(Director of Thesis)
Aaron Cramer
(Director of Graduate Studies)
11/30/2018

iii
ACKNOWLEDGEMENTS
The following thesis is considered individual work, but its completion is
inseparable from the help of the following people. A special thanks to my thesis
advisor, my committee members, my parents, and my friends. I would never have
been able to finish my thesis without help and support from them.
First of all, I want to express my most sincere gratitude to my thesis advisor
and committee chair, Professor Yuan Liao, who provided me with meticulous
guidance so that I was fortunate enough to enhance my knowledge and attitude
towards academics. I also want to thank my committee members, Prof. Dan Ionel
and Prof. Yu-ming Zhang for providing very valuable guidance and insights for my
thesis during my thesis defense.
In addition, I would like to thank my parents, who have provided tremendous
financial support for my study abroad. Also, I would like to thank my friends,
Shaohong Wang, for her encouragement and help during my completion of the thesis,
which made me more confident in my own work.
iv
TABLE OF CONTENTS
ACKNOWLEDGEMENTS .............................................................................. iii
TABLE OF CONTENTS ................................................................................... iv
LIST OF TABLES ........................................................................................... vii
LIST OF FIGURES ........................................................................................ viii
Chapter 1 Introduction .................................................................................. 1
1.1 Background .......................................................................................................... 1
1.2 Literature Review ................................................................................................. 2
1.2.1 Adding or Improving Equipment ................................................................. 2
1.2.2 Economic Dispatch ...................................................................................... 3
1.3 Thesis Objectives and Outline ............................................................................. 5
Chapter 2 Components and Constraints of Microgrid System .................. 7
2.1 Microgrid Generators ........................................................................................... 9
2.1.1 Generator Parameter .................................................................................. 9
2.1.2 Constraints for Generation Units: ............................................................. 10

v
2.2 Load ................................................................................................................... 11
2.2.1 Load Parameter ......................................................................................... 11
2.3 Storage System ................................................................................................... 12
2.3.1 Energy Storage System Parameter ............................................................ 12
2.3.2 Constraints for Energy Storage System ..................................................... 13
2.4 AEP Utilities Price ............................................................................................. 14
2.4.1 APE Utilities Parameter ............................................................................ 14
2.4.2 Constraints for APE Utilities ..................................................................... 15
2.5 System Power Balance Constraints .................................................................... 15
Chapter 3 Static Economic Operation ........................................................ 17
3.1 Instruction of Static Economic Operation .......................................................... 17
3.2 Studied Method .................................................................................................. 17
3.2.1 Objective Formulation............................................................................... 18
3.2.2 Unknown Variable ..................................................................................... 19
3.2.3 Cost Coefficients ........................................................................................ 19
3.2.4 Constraints ................................................................................................ 19
vi
3.3 Test Result .......................................................................................................... 20
Chapter 4 Dynamic Economic Operation .................................................. 23
4.1 Introduction of Dynamic Economic Operation .................................................. 23
4.2 Studied Method .................................................................................................. 24
4.2.1 Objective Formulation............................................................................... 24
4.2.2 Unknown Variables ................................................................................... 25
4.2.3 Cost Coefficients: ...................................................................................... 25
4.2.4 Constraints: ............................................................................................... 25
4.3 Test Result .......................................................................................................... 26
Chapter 5 Conclusions ................................................................................. 44
5.1 Summary of Results Obtained ........................................................................... 44
5.2 Conclusion ......................................................................................................... 45
5.3 Future Work ....................................................................................................... 46
VITA ................................................................................................................. 50
vii
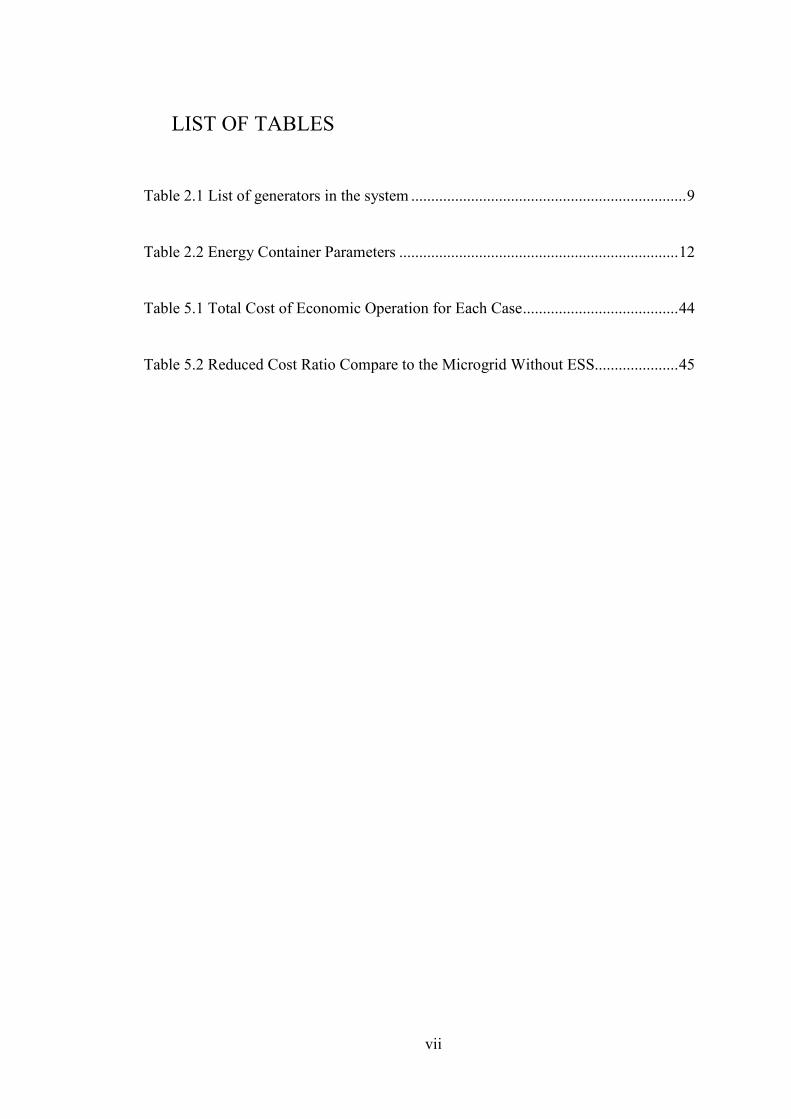
LIST OF TABLES
Table 2.1 List of generators in the system ..................................................................... 9
Table 2.2 Energy Container Parameters ...................................................................... 12
Table 5.1 Total Cost of Economic Operation for Each Case ....................................... 44
Table 5.2 Reduced Cost Ratio Compare to the Microgrid Without ESS..................... 45
viii
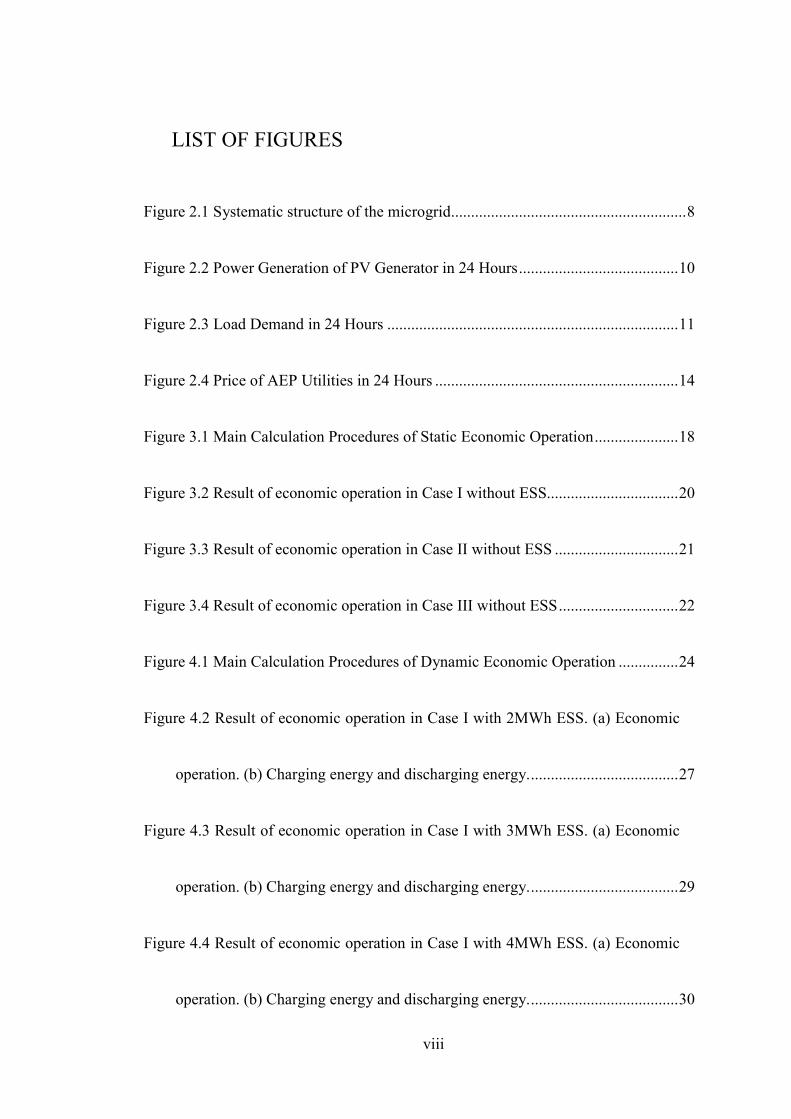
LIST OF FIGURES
Figure 2.1 Systematic structure of the microgrid........................................................... 8
Figure 2.2 Power Generation of PV Generator in 24 Hours ........................................ 10
Figure 2.3 Load Demand in 24 Hours ......................................................................... 11
Figure 2.4 Price of AEP Utilities in 24 Hours ............................................................. 14
Figure 3.1 Main Calculation Procedures of Static Economic Operation ..................... 18
Figure 3.2 Result of economic operation in Case I without ESS................................. 20
Figure 3.3 Result of economic operation in Case II without ESS ............................... 21
Figure 3.4 Result of economic operation in Case III without ESS .............................. 22
Figure 4.1 Main Calculation Procedures of Dynamic Economic Operation ............... 24
Figure 4.2 Result of economic operation in Case I with 2MWh ESS. (a) Economic
operation. (b) Charging energy and discharging energy. ..................................... 27
Figure 4.3 Result of economic operation in Case I with 3MWh ESS. (a) Economic
operation. (b) Charging energy and discharging energy. ..................................... 29
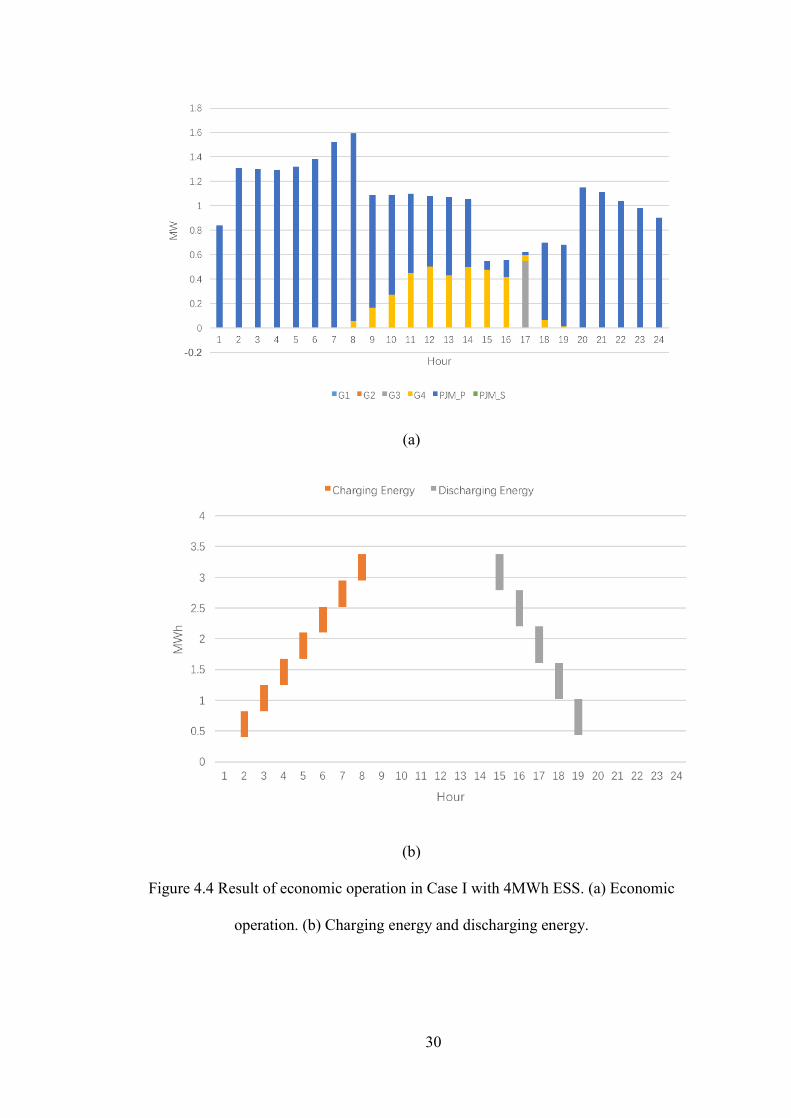
Figure 4.4 Result of economic operation in Case I with 4MWh ESS. (a) Economic
operation. (b) Charging energy and discharging energy. ..................................... 30
ix
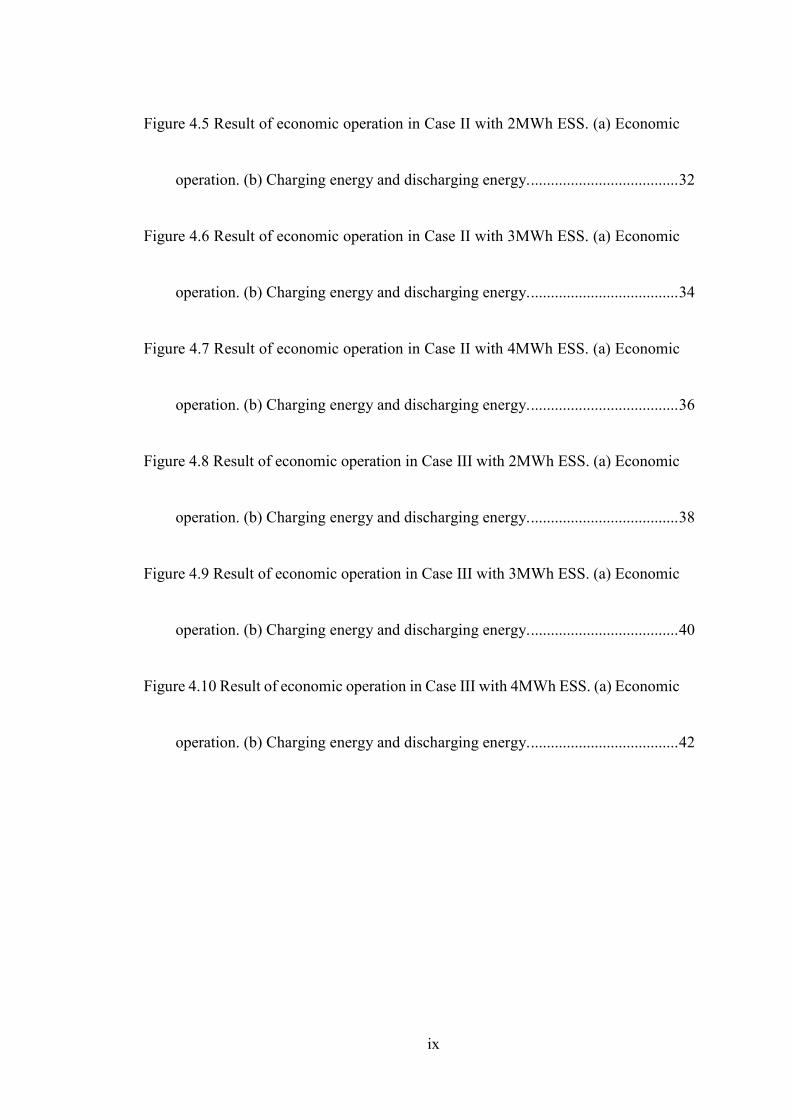
Figure 4.5 Result of economic operation in Case II with 2MWh ESS. (a) Economic
operation. (b) Charging energy and discharging energy. ..................................... 32
Figure 4.6 Result of economic operation in Case II with 3MWh ESS. (a) Economic
operation. (b) Charging energy and discharging energy. ..................................... 34
Figure 4.7 Result of economic operation in Case II with 4MWh ESS. (a) Economic
operation. (b) Charging energy and discharging energy. ..................................... 36
Figure 4.8 Result of economic operation in Case III with 2MWh ESS. (a) Economic
operation. (b) Charging energy and discharging energy. ..................................... 38
Figure 4.9 Result of economic operation in Case III with 3MWh ESS. (a) Economic
operation. (b) Charging energy and discharging energy. ..................................... 40
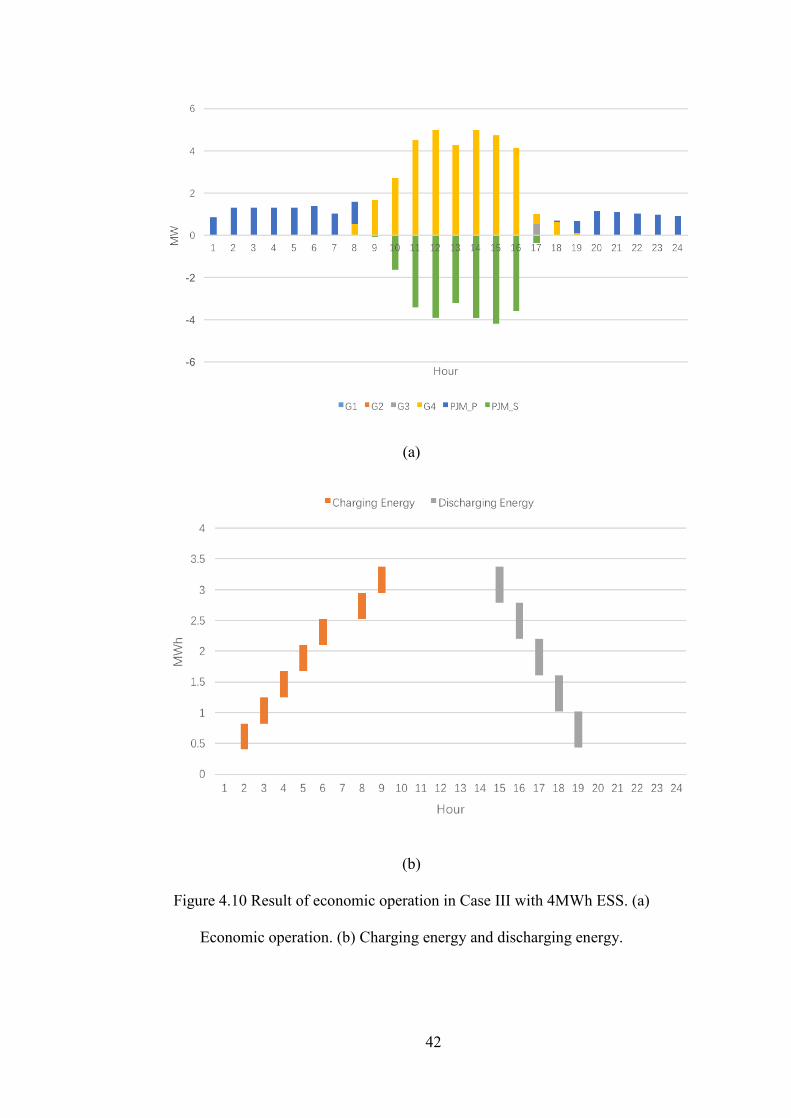
Figure 4.10 Result of economic operation in Case III with 4MWh ESS. (a) Economic
operation. (b) Charging energy and discharging energy. ..................................... 42

1
Chapter 1 Introduction
1.1 Background
A microgrid is a subnetwork of power system that consists of a group of
distributed energy sources and loads. It is designed to integrate distributed generation,
loads, energy storage devices, converters, and monitoring and protection devices. A
micro grid could be considered as a controllable load or generator for the power grid,
depending on whether the micro grid sells power to the power grid or buys power
from the main power grid. At the same time, a micro grid is a small, complete power
grid for itself consisting of every main part of a regular power grid. Generally, a
successful microgrid could run both in an island mode (off-grid) and in grid-
connected mode(on-grid), which could also convert between two modes at any time.
Microgrids become increasingly important and benefit from the development
of renewable sources, with the solar power station as the core. Traditional power
grids based on centralized generation and long distance transmission have the
disadvantages of high pollution and huge losses. Also, an unpredictable fault is one
of the factors that endangered its stability. Especially for the development of
renewable sources, generation unit using renewable energy sources are distributed,
unreliable, and result in huge capital costs [1], for example, the Photovoltaic (PV)
system has different outputs in different seasons, weather, location, and time. It
cannot provide stable voltage and frequency as a conventional energy sources
generator. Contrarily, the combination of microgrids and renewable source
generations overcome these limitations, thus, the prospect of micro grids is pretty
broad with the development of renewable sources.

2
At the same time, there is an increase of complex demand among many
customers across many regions. For example, islands and mountainous areas,
separate industrial districts and business districts, even schools and hospitals. They
are impossible and very costly to connect with power grids. They all rely on
distributed generations like PV, wind power, or fossil fuel generation units.
Automatically, a grid will form inside them known as the micro grid.
Last but not least, with the gradual improvement of microgrid research, more
and more advantages regarding microgrids are that they are gradually emerging, safe,
efficient, clear, and it can control itself. The microgrid is seen as an alternative to
some places which have high demand for power stability, such as hospitals, schools,
and some companies.
1.2 Literature Review
The following included details about different methods that are usually used in
decreasing operation cost problems are proposed in other literatures. These methods
may solve these problems in different aspects. In summary, there are two aspects:
Reduce operating costs by adding or improving equipment and reduce operating
costs by economic dispatch.
1.2.1 Adding or Improving Equipment
Reference [2] designs a transformation scheme for a low-voltage grid called
the green energy demonstration project implemented to reduce electricity bill.
Equipment of this microgrid includes a wind turbine, PV, two batteries, main
transformer capacity, and power factor. Transformation scheme goes into two stages.
First stage aims to transform the wind power system, PV system, battery system, and
3
install the energy management system. During this stage, the author adds a
bidirectional energy storage inverter between the wind power system and load bus.
The second stage aims to transform the load control unit and the backup unit,
especially EMS on the basis of controllable load. This scheme decreases 22% of
electricity, and in general, it could save 35% of the electricity bill in total.
Reference [3] provides a novel idea to increase the utilization of an off-grid
microgrid thus increase lifetime of its batteries. In order to keep battery performs in
better condition, the author uses buck-boost converter with supercapacitors(SC) to
control batteries’ charging and discharging. After test model in laboratory, the result
proves that SCs help batteries to charge in lower frequency current furthermore
increase its lifetime.
Reference [4] designs an economic operation monitoring system for traction
transformer. This system includes four data displays, they are load factor real-time
displays, TT losses and losses rate real-time curve, alternative critical load losses
curve. Because this system is designed for traction transformer used in electric
railway, the operation result is more focus on power losses. By operating alternative,
active, reactive and synthesis losses of all traction transformers, cost of the system
do reduce as expect.
1.2.2 Economic Dispatch
Reference [5] presents a multi-agent based distribution control strategy to
minimize the operation cost for a DC microgrid. Most of the applications optimize
microgrid in centralized way with a single centralized controller, this method has
many limitations. The author makes every distributed generations as an agent, then
share its information with only communicating with its direct neighbors through each

4
unit, every unit can get global information, making its decision locally to minimize
the operation cost for the whole system. According to simulation, this method
successfully reduces total operation cost in this DC microgrid without changing bus
voltage.
Reference [6] provides an improved Differential evolution (DE) method,
called the hybrid differential evolution (HDE). Its cost function contains valve point
effect, system load demand, power losses, ramp rate limits, and prohibits operation
zones, also, constraints for each known parameter which is needed. HDE method is
a combination of two operations, migrating operation and acceleration operation.
Then, through seven steps test on a 40-unit practical ED system of Taiwan Power
Company and a 140-unit thermal generating units of Korean power system, result
shows this method is more suitable for large-scale power system.
Reference [7] proposes a new approach to dynamic dispatch. This approach
is based on Constructive Dynamic Programming (CDP), and test in a single bus
system with 3 generating units for 24 hours’ periods. The author sets constraints for
each operating unit and set power balanced constraint, then uses the principle of
dynamic programming by avoiding discretization. The result provides this improved
CDP approach offers improved computational performance.
Reference [8] uses extended security constrained economic dispatch (ESCED)
algorithm to solve the problem of multi-stage dynamic economic dispatch (MDED),
at the same time, this problem consists of network security, regulating margin and
ramp rate constraints. The author uses one-stage Lagrangian equivalence by define
three matrixes, then uses standard Gaussian elimination techniques to get the result.
The model tested here is a 1200 buses, 1700 lines, and 85 generating units larger-
5
scale power system, the result demonstrates MDED problem could be solved by
ESCED algorithm, and 2-stages results is better than 1-stage results.
Reference [9] proposed possible methods for optimizing operation of
distribution systems with distributed generations considering various components
and constraints.
1.3 Thesis Objectives and Outline
This thesis focuses on an economic operation strategy to reduce the cost of
the microgrid with energy storage system based on the method proposed in [9]. The
thesis tests the methods with three cases. In order to make the results more
meaningful, these three cases correspond to three realistic microgrid situations, as
described below.
Case I is the microgrid in downtown areas, especially hospitals and schools.
These places usually do not only require a large amount of stable electricity to
maintain operation, but also to provide sufficient funding to build photovoltaic
generators and a microgrid. A microgrid in these places always have enough energy
provided by utilities grid. Backup generators, such as a diesel generator, are required
to ensure a stable supply of energy. However, due to the limited construction area
downtown, these areas usually are unable to establish large-scale photovoltaic power
generation equipment. The power of photovoltaic power generation equipment is not
high.
Case II is a microgrid in mountainous and islands areas. It is very difficult to
build a long-distance grid in these areas, thus, utilities grid usually can only provide
low-power energy. Especially for cities or villages in these areas, they need to build
a microgrid that uses local resources to generate energy to supply local electricity

6
needs. At the same time, due to loss of long-distance transmission, energy prices are
always higher than downtown areas.
Case III is a microgrid in power stations. The generation of these microgrids
are always much larger than load so that it can provide a large amount of energy to
the utilities grid. Due to the instability of photovoltaic power generation, these power
station need to establish a microgrid to provide stable power output. Also, since
photovoltaics requires light to generate energy, no energy can be produced at night.
For this reason, a backup generation is needed to meet to demand for basic operation
requirements of the power stations.
This thesis is organized as follows: Chapter II introduces components and
constraints of microgrid systems, including constraints for generators, load, energy
storage system, utilities grid, and system power balance constraints; the parameters
of each component in 3 cases. Chapter III presents a static economic operation
method for this microgrid without an energy storage system and static economic
operation was used for the 3 cases. Chapter IV presents a dynamic economic
operation method and later uses this method to operate the microgrid with 2MWh,
3MWh, and 4MWh energy storage systems, respectively. Chapter V summarizes all
results in both static and dynamic economic operation, concluding an economic
operation effect.
7
Chapter 2 Components and Constraints of Microgrid
System
A microgrid is always considered as a solution to overcome the problem of
greenhouse gas and power suppled in remote areas [10] [11]. In this chapter, the
author represents the components, parameters, and constraints of operating the
microgrid. This microgrid mainly consists of generators, battery system, and load,
and is expected to run both in an island mode (off-grid) and in parallel with power
grid mode(on-grid), which could also convert between the two modes at any time.
This can be organized in three types: Purchase energy from AEP, Sale energy to AEP,
and Power balanced in itself. Also, there are transformers, inverters, protective
system and other devices needed for microgrids because these are not main contents
of this paper, the author will not introduce them later. Figure 3.1 presents systematic
structure of this microgrid. The arrows in the figure represent the possible direction
of the current.
8
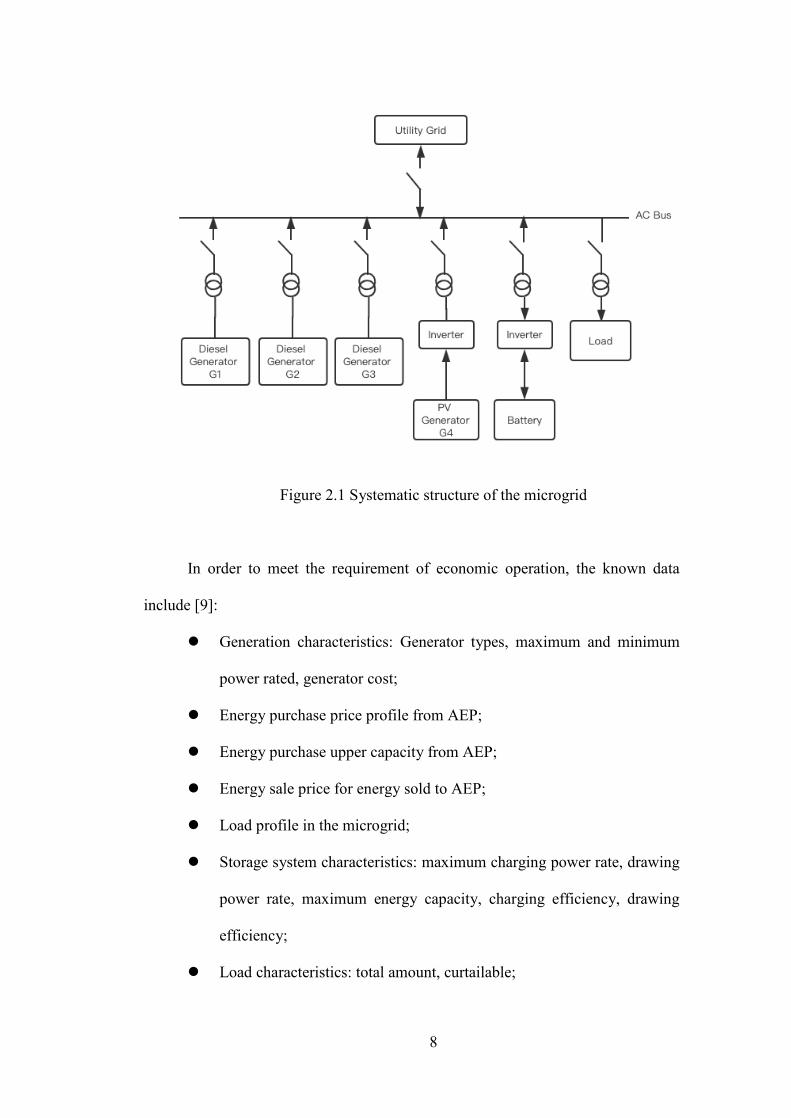
Figure 2.1 Systematic structure of the microgrid
In order to meet the requirement of economic operation, the known data
include [9]:
Generation characteristics: Generator types, maximum and minimum
power rated, generator cost;
Energy purchase price profile from AEP;
Energy purchase upper capacity from AEP;
Energy sale price for energy sold to AEP;
Load profile in the microgrid;
Storage system characteristics: maximum charging power rate, drawing
power rate, maximum energy capacity, charging efficiency, drawing
efficiency;
Load characteristics: total amount, curtailable;

9
2.1 Microgrid Generators
2.1.1 Generator Parameter
There are 3 diesel generators and 1 Photovoltaic(PV) generator to provide
energy in this microgrid. The main parameters of these generators are listed in Table
2.1. Some of the generating units are supplied with multiplied fuel resources such as
coal, natural gas, oil etc. Here, all four generating units are a single-fuel resource
[12]. G1, G2, G3 are diesel generators that could maintain running at a constant
power at any time. G4 is a PV generator and its generation depends on the intensity
of the light or time of the day. From the perspective of environmental protection,
photovoltaic generators will always maintain their current maximum power
operation, making full use of the energy generated by photovoltaics.
Table 2.1 List of generators in the system
Generator Type Minimum
Generation(MW)
Maximum
Generation(MW) Cost($/MWh)
G1 Diesel 0 0.5 60
G2 Diesel 0 0.65 50
G3 Diesel 0 0.55 45
G4 PV 0 0.5 or 5 0
Assuming all diesel generators running without ramp up and ramp down, they
could start up and shut down at any time. The power generation of photovoltaic
generator is unstable, depending on many factors including illumination intensity,
temperature, and so on. Figure 2.2 represents the PV generation in 24 hours and its
10
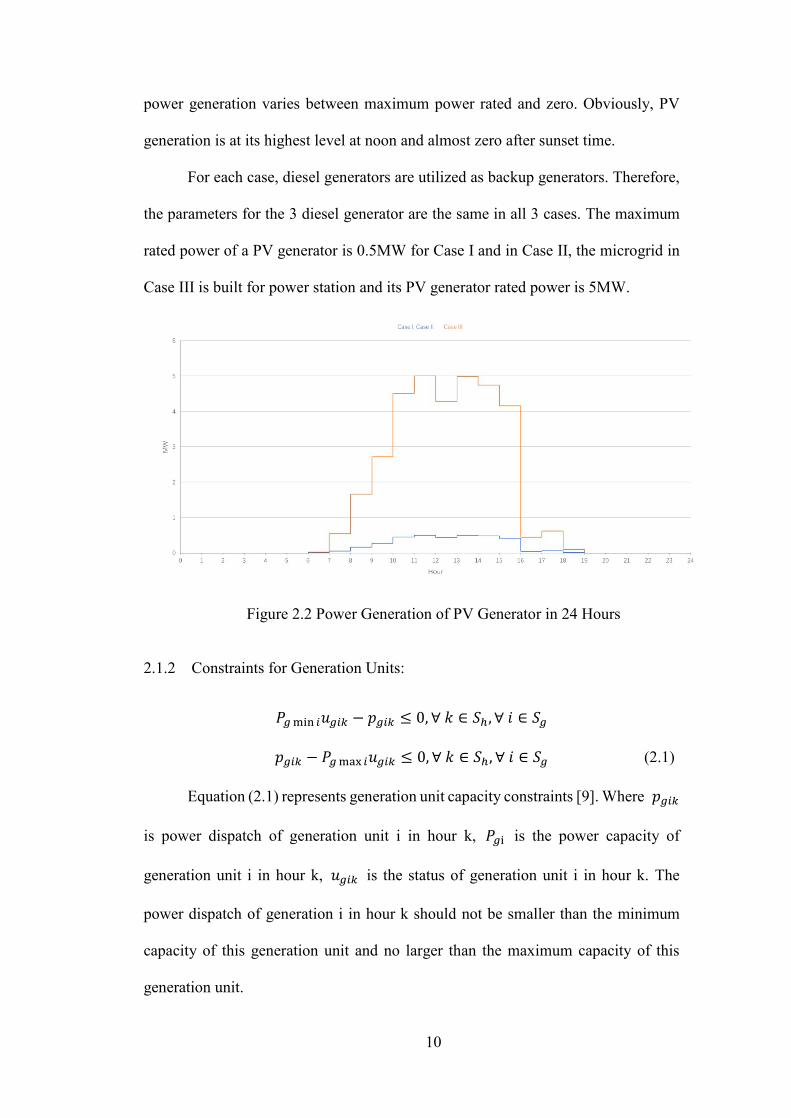
power generation varies between maximum power rated and zero. Obviously, PV
generation is at its highest level at noon and almost zero after sunset time.
For each case, diesel generators are utilized as backup generators. Therefore,
the parameters for the 3 diesel generator are the same in all 3 cases. The maximum
rated power of a PV generator is 0.5MW for Case I and in Case II, the microgrid in
Case III is built for power station and its PV generator rated power is 5MW.
Figure 2.2 Power Generation of PV Generator in 24 Hours
2.1.2 Constraints for Generation Units:
𝑃𝑃𝑔𝑔min 𝑖𝑖𝑢𝑢𝑔𝑔𝑖𝑖𝑔𝑔 − 𝑝𝑝𝑔𝑔𝑖𝑖𝑔𝑔 ≤ 0,∀ 𝑘𝑘 ∈ 𝑆𝑆ℎ,∀ 𝑖𝑖 ∈ 𝑆𝑆𝑔𝑔
𝑝𝑝𝑔𝑔𝑖𝑖𝑔𝑔 − 𝑃𝑃𝑔𝑔max 𝑖𝑖𝑢𝑢𝑔𝑔𝑖𝑖𝑔𝑔 ≤ 0,∀ 𝑘𝑘 ∈ 𝑆𝑆ℎ,∀ 𝑖𝑖 ∈ 𝑆𝑆𝑔𝑔 (2.1)
Equation (2.1) represents generation unit capacity constraints [9]. Where 𝑝𝑝𝑔𝑔𝑖𝑖𝑔𝑔
is power dispatch of generation unit i in hour k, 𝑃𝑃𝑔𝑔i is the power capacity of
generation unit i in hour k, 𝑢𝑢𝑔𝑔𝑖𝑖𝑔𝑔 is the status of generation unit i in hour k. The
power dispatch of generation i in hour k should not be smaller than the minimum
capacity of this generation unit and no larger than the maximum capacity of this
generation unit.

11
2.2 Load
2.2.1 Load Parameter
Load is the demand of the microgrid. This microgrid must meet the
requirement of the demand in this system. Figure 2.3 shows the change in load of
this system over 24 hours when demand at its highest level around 18:00, then
gradually decreases.
Figure 2.3 Load Demand in 24 Hours
In real life, the load is constantly changing and unpredictable based on
different types of equipment. In general, it can be summarized into three groups: firm
load, adjustable load, and interruptible load. In this system, the load is assumed to be
a constant value within an hour interval. A microgrid system is needed to operate
and meet the requirement of load. Also, in order to compare economic operation
result, the author set load in each case as the same value.

12
2.3 Storage System
2.3.1 Energy Storage System Parameter
Storage system is a necessary part of the microgrid. It usually has four effects
in the whole system [10] [13] [14] [15]:
Backup power supply when system fault;
Frequency regulation between the generation and demand side;
Storing renewable generation peaks for use during demand peaks;
Smoothens the output to eliminate rapid voltage and power swings of
renewable generator on the microgrid.
In this microgrid system, we assume there is no time during the mode
conversion between off-grid and on-grid of the microgrid. The storage system does
not need to be considered as a backup power to compensate for the power shortage
in the mode conversion. More importantly, storing energy for use during demand
peaks or a utilities grid price peak, thereby reducing operation cost of whole system.
Table 2.2 Energy Container Parameters
Model NaNiCl2
Power Rated 500kW
Nominal Capacity 2/3/4MWh
Charging Efficiency 85%
Depth of Discharge (DOD) 90%
System Voltage 480V
Table 2.2 represents parameters of energy storage system in the microgrid.
Power rated is a charging and discharging rate in this ESS. Combined with charging
13
efficiency, the actual amount of charge should be the charging rate multiplied by
charging efficiency. The discharging rate is equal to the charging rate and the actual
amount of discharge should be the discharging rate divided by the discharging
efficiency. Nominal capacity is the maximum capacity. There are three types of
nominal capacities used in this thesis to test economic operation results. In order to
protect ESS lifetime, an energy system should not be discharged exceeding DOD.
Thus, the actual maximum capacity needs to be considered as DOD multiplied by
Nominal Capacity.
2.3.2 Constraints for Energy Storage System
0 ≤ 𝑞𝑞𝑠𝑠𝑖𝑖𝑔𝑔 ≤ 𝑄𝑄𝑠𝑠max 𝑖𝑖,∀ 𝑘𝑘 ∈ 𝑆𝑆ℎ,∀ 𝑖𝑖 ∈ 𝑆𝑆𝑠𝑠 (2.2)
Equation (2.2) represents storage capacity constraints, where 𝑞𝑞𝑠𝑠𝑖𝑖𝑔𝑔 is energy
of storage system i at end of hour k [9], 𝑄𝑄𝑠𝑠max 𝑖𝑖 is maximum capacity of storage
system i. Energy of storage system i at end of hour k is between 0 and maximum
energy capacity of this storage system.
𝑠𝑠𝑠𝑠𝑠𝑠𝑖𝑖𝑔𝑔 + 𝑑𝑑𝑠𝑠𝑠𝑠𝑖𝑖𝑔𝑔 ≤ 1,∀ 𝑘𝑘 ∈ 𝑆𝑆ℎ,∀ 𝑖𝑖 ∈ 𝑆𝑆𝑠𝑠 (2.3)
Equation (2.3) represents storage charging and drawing relationship
constraint [9], where 𝑠𝑠𝑠𝑠𝑠𝑠𝑖𝑖𝑔𝑔 is charging status of storage system i at hour k and 𝑑𝑑𝑠𝑠𝑠𝑠𝑖𝑖𝑔𝑔
is discharging status, status is 1 when system performs this status otherwise is 0.
Storage i can only performs charging or drawing action or neither in hour k.
𝑞𝑞𝑠𝑠𝑖𝑖𝑔𝑔 − 𝑞𝑞𝑠𝑠𝑖𝑖(𝑔𝑔−1) = 𝑠𝑠𝑠𝑠𝑠𝑠𝑖𝑖𝑔𝑔𝑝𝑝𝑠𝑠𝑠𝑠𝑠𝑠𝑖𝑖𝑔𝑔𝜀𝜀𝑠𝑠𝑠𝑠𝑖𝑖 − 𝑑𝑑𝑠𝑠𝑠𝑠𝑖𝑖𝑔𝑔𝑝𝑝𝑠𝑠𝑠𝑠𝑠𝑠𝑖𝑖𝑔𝑔/𝜀𝜀𝑠𝑠𝑠𝑠𝑖𝑖, ∀ 𝑘𝑘 ∈ 𝑆𝑆ℎ,∀ 𝑖𝑖 ∈ 𝑆𝑆𝑠𝑠 (2.4)
Equation (2.4) represents storage charging and drawing power and energy
constraints [9], where 𝜀𝜀𝑠𝑠𝑠𝑠𝑖𝑖 is charging efficiency of energy storage system i. Energy
change of storage system i during hour k is equal to energy charging into this storage
minus energy drawing from this storage.
14
𝑞𝑞𝑠𝑠𝑖𝑖0 = 𝑄𝑄𝑠𝑠𝑖𝑖0,∀ 𝑖𝑖 ∈ 𝑆𝑆𝑠𝑠 (2.5)
Equation (2.5) represents storage initial output constraints [9], where 𝑞𝑞𝑠𝑠𝑖𝑖0 is
energy of storage system i at beginning of time 0, 𝑄𝑄𝑠𝑠𝑖𝑖0 is initial energy of storage i.
Energy of storage i in time 0 should be equal to initial energy of this storage system.
2.4 AEP Utilities Price
2.4.1 APE Utilities Parameter
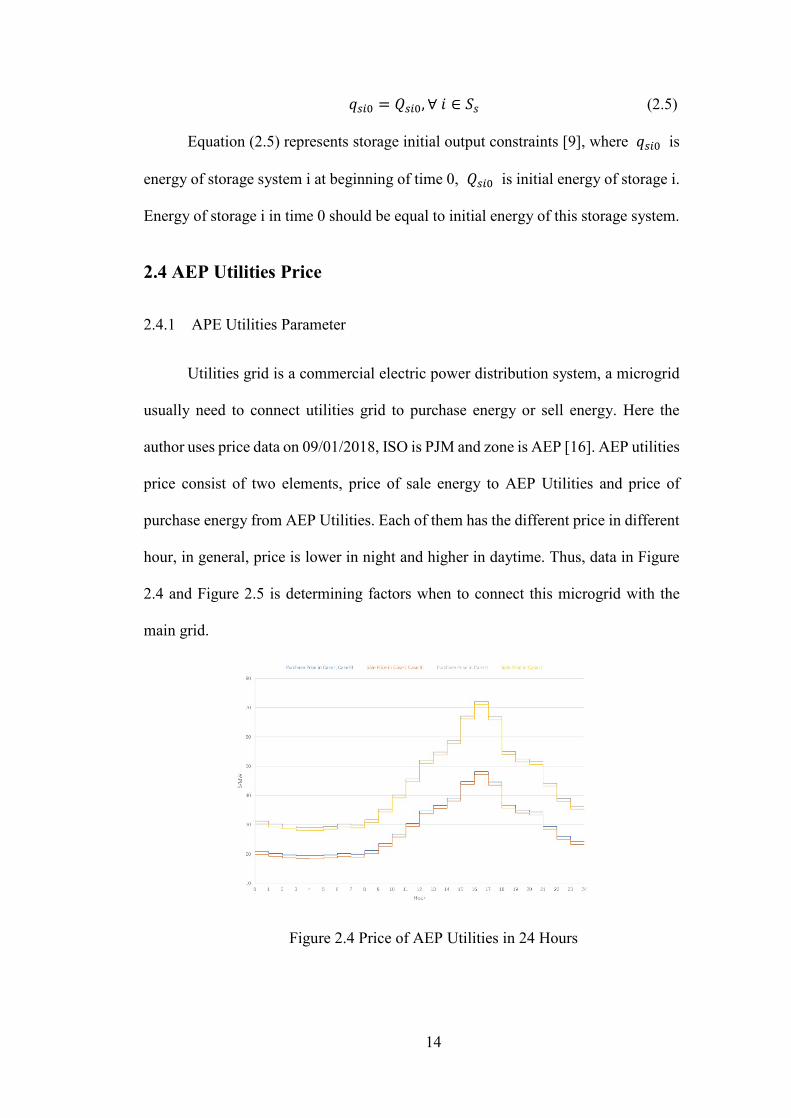
Utilities grid is a commercial electric power distribution system, a microgrid
usually need to connect utilities grid to purchase energy or sell energy. Here the
author uses price data on 09/01/2018, ISO is PJM and zone is AEP [16]. AEP utilities
price consist of two elements, price of sale energy to AEP Utilities and price of
purchase energy from AEP Utilities. Each of them has the different price in different
hour, in general, price is lower in night and higher in daytime. Thus, data in Figure
2.4 and Figure 2.5 is determining factors when to connect this microgrid with the
main grid.
Figure 2.4 Price of AEP Utilities in 24 Hours
15
APE Utilities price is hourly price, the price depends on amount of load on
this node in this hour, high demand leads to high price, low demand leads to low
price.
2.4.2 Constraints for APE Utilities
𝑃𝑃𝑝𝑝𝑝𝑝𝑠𝑠min𝑔𝑔 − 𝑝𝑝𝑝𝑝𝑝𝑝𝑠𝑠 𝑔𝑔𝑢𝑢𝑝𝑝𝑝𝑝𝑠𝑠 𝑔𝑔 ≤ 0,∀ 𝑘𝑘 ∈ 𝑆𝑆ℎ
𝑝𝑝𝑝𝑝𝑝𝑝𝑠𝑠 𝑔𝑔𝑢𝑢𝑝𝑝𝑝𝑝𝑠𝑠 𝑔𝑔 − 𝑃𝑃𝑝𝑝𝑝𝑝𝑠𝑠max𝑔𝑔 ≤ 0,∀ 𝑘𝑘 ∈ 𝑆𝑆ℎ (2.6)
Equation (2.6) represents constraints of purchase energy from utilities grid [9],
where 𝑝𝑝𝑝𝑝𝑝𝑝𝑠𝑠 𝑔𝑔 is energy purchased form utilities grid in hour k, 𝑃𝑃𝑝𝑝𝑝𝑝𝑠𝑠 min is
minimum purchase energy in hour k, 𝑃𝑃𝑝𝑝𝑝𝑝𝑠𝑠 max is maximum purchase energy in hour
k, 𝑢𝑢𝑝𝑝𝑝𝑝𝑠𝑠 𝑔𝑔 is energy purchase status in hour k. A microgrid purchase energy from
utilities grid in hour k should no less than minimum constraint and no more than
maximum constraint in this hour.
𝑃𝑃𝑠𝑠𝑠𝑠𝑠𝑠𝑠𝑠min𝑔𝑔 − 𝑝𝑝𝑠𝑠𝑠𝑠𝑠𝑠𝑠𝑠 𝑔𝑔𝑢𝑢𝑠𝑠𝑠𝑠𝑠𝑠𝑠𝑠 𝑔𝑔 ≤ 0,∀ 𝑘𝑘 ∈ 𝑆𝑆ℎ
𝑝𝑝𝑠𝑠𝑠𝑠𝑠𝑠𝑠𝑠 𝑔𝑔𝑢𝑢𝑠𝑠𝑠𝑠𝑠𝑠𝑠𝑠 𝑔𝑔 − 𝑃𝑃𝑠𝑠𝑠𝑠𝑠𝑠𝑠𝑠max𝑔𝑔 ≤ 0,∀ 𝑘𝑘 ∈ 𝑆𝑆ℎ (2.7)
Equation (2.7) represents constraints of sell energy to utilities grid [9], where
𝑝𝑝𝑠𝑠𝑠𝑠𝑠𝑠𝑠𝑠 𝑔𝑔 is energy sold to utilities grid in hour k, 𝑃𝑃𝑠𝑠𝑠𝑠𝑠𝑠𝑠𝑠 min is minimum sale energy
in hour k, 𝑃𝑃𝑠𝑠𝑠𝑠𝑠𝑠𝑠𝑠 max is maximum sale energy in hour k, 𝑢𝑢𝑠𝑠𝑠𝑠𝑠𝑠𝑠𝑠 𝑔𝑔 is energy sale status
in hour k. The microgrid sell energy to utilities grid in hour k should no less than
minimum constraint and no more than maximum constraint in this hour.
2.5 System Power Balance Constraints
∑ 𝑝𝑝𝑔𝑔𝑖𝑖1𝑔𝑔𝑖𝑖1 + 𝑝𝑝𝑝𝑝𝑝𝑝𝑠𝑠𝑔𝑔 − 𝑝𝑝𝑠𝑠𝑠𝑠𝑠𝑠𝑠𝑠𝑔𝑔 = ∑ 𝑝𝑝𝑠𝑠𝑖𝑖2𝑔𝑔𝑖𝑖2 + ∑ 𝑝𝑝𝑠𝑠𝑖𝑖3𝑔𝑔𝑖𝑖3 ,∀ 𝑘𝑘 ∈ 𝑆𝑆ℎ (2.8)
Equation (2.8) represents system power balance constraints, 𝑝𝑝𝑔𝑔𝑖𝑖1𝑔𝑔 is power
generation of generation unit i1 in hour k [9], 𝑝𝑝𝑝𝑝𝑝𝑝𝑠𝑠𝑔𝑔 is energy purchased from

16
utilities grid in hour k, 𝑝𝑝𝑠𝑠𝑠𝑠𝑠𝑠𝑠𝑠𝑔𝑔 is energy sold to utilities grid in hour k, 𝑝𝑝𝑠𝑠𝑖𝑖2𝑔𝑔 is
power consumed by energy storage system i2 in hour k, 𝑝𝑝𝑠𝑠𝑖𝑖3𝑔𝑔 is power consumed
by load i3 in hour k. In a balanced power system, power supply is equal to power
consumption. Power supply including generation, purchased power from AEP, and
sale power to AEP. Power consumption including power for storage, and load.
17
Chapter 3 Static Economic Operation
3.1 Instruction of Static Economic Operation
Economic operation is a determine of each electricity generation facilities, to
obtain optimal cost of output and meet the require of load. As a conventional
economic dispatch problem, static economic operation is a method to solve short-
term or particular time economic dispatch [17]. Static means this operation doesn’t
consider constraints in time domain, such as generator start-up and shutdown
constraints, generator ramp up and ramp down constraints, and charging and
discharging of energy storage system [9] [18]. Dispatching in each time period has
no effect on other time period, operation result only depend generation, load demand
and other condition in this time period.
𝑀𝑀𝑖𝑖𝑀𝑀𝑖𝑖𝑀𝑀𝑖𝑖𝑀𝑀𝑀𝑀 ∑ (𝐶𝐶𝑔𝑔𝑠𝑠𝑔𝑔 +𝑔𝑔 𝐶𝐶𝑝𝑝𝑝𝑝𝑠𝑠𝑔𝑔 − 𝐶𝐶𝑠𝑠𝑠𝑠𝑠𝑠𝑠𝑠𝑔𝑔) (3.1)
Where,
𝐶𝐶𝑔𝑔𝑠𝑠𝑔𝑔 generation energy cost, 𝐶𝐶𝑔𝑔𝑠𝑠𝑔𝑔 = ∑ (𝐶𝐶𝑔𝑔𝑠𝑠𝑖𝑖𝑝𝑝𝑔𝑔𝑖𝑖𝑔𝑔)𝑖𝑖
𝐶𝐶𝑝𝑝𝑝𝑝𝑠𝑠𝑔𝑔 cost for purchasing energy from AEP, 𝐶𝐶𝑝𝑝𝑝𝑝𝑠𝑠𝑔𝑔 = 𝐶𝐶𝑠𝑠𝑝𝑝𝑝𝑝𝑠𝑠𝑖𝑖𝑝𝑝𝑝𝑝𝑝𝑝𝑠𝑠𝑔𝑔
𝐶𝐶𝑠𝑠𝑠𝑠𝑠𝑠𝑠𝑠𝑔𝑔 revenue for energy sale to AEP, 𝐶𝐶𝑠𝑠𝑠𝑠𝑠𝑠𝑠𝑠𝑔𝑔 = 𝐶𝐶𝑠𝑠𝑠𝑠𝑠𝑠𝑠𝑠𝑠𝑠𝑔𝑔𝑝𝑝𝑠𝑠𝑠𝑠𝑠𝑠𝑠𝑠𝑔𝑔
Equation (3.1) is the objective function that minimizes the total operational
cost for the microgrid, we can see that the way to optimize the microgrid and reduce
operational cost is to reduce cost for energy production and sell more energy at the
same time.
3.2 Studied Method
Based on characters of static economic operation and objective of each case,
author decides to calculate economic operation using Liner Programming method.
18
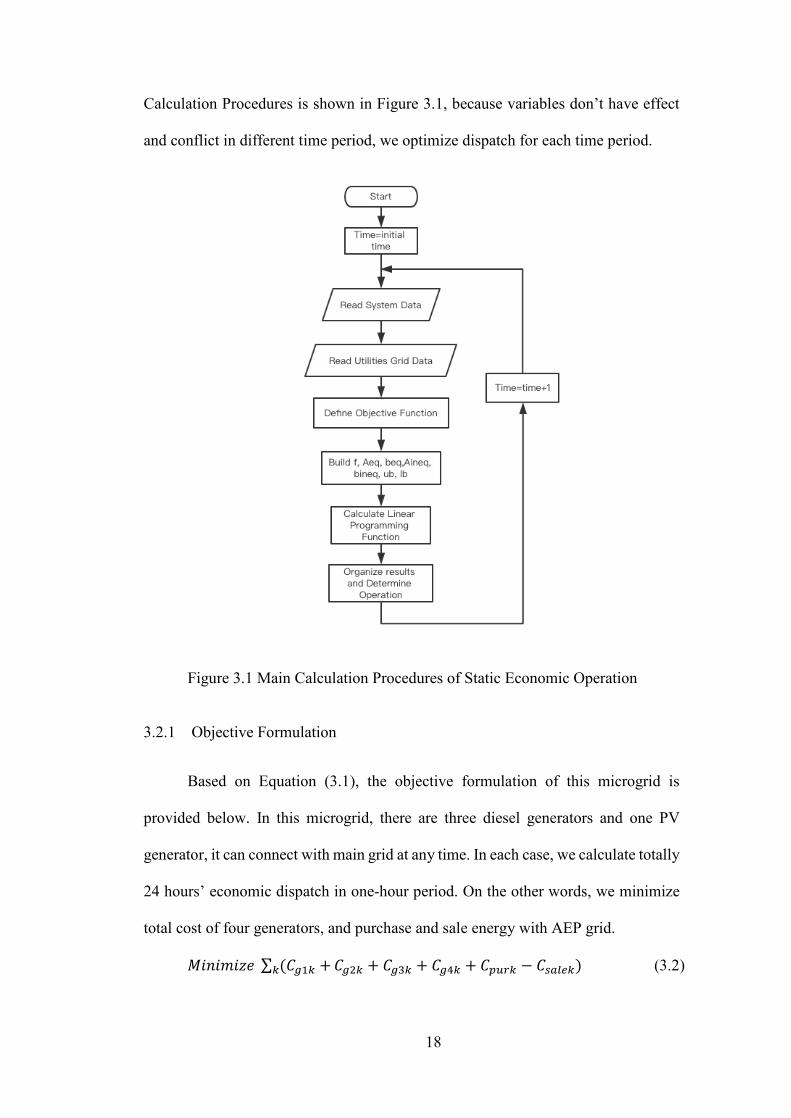
Calculation Procedures is shown in Figure 3.1, because variables don’t have effect
and conflict in different time period, we optimize dispatch for each time period.
Figure 3.1 Main Calculation Procedures of Static Economic Operation
3.2.1 Objective Formulation
Based on Equation (3.1), the objective formulation of this microgrid is
provided below. In this microgrid, there are three diesel generators and one PV
generator, it can connect with main grid at any time. In each case, we calculate totally
24 hours’ economic dispatch in one-hour period. On the other words, we minimize
total cost of four generators, and purchase and sale energy with AEP grid.
𝑀𝑀𝑖𝑖𝑀𝑀𝑖𝑖𝑀𝑀𝑖𝑖𝑀𝑀𝑀𝑀 ∑ (𝐶𝐶𝑔𝑔1𝑔𝑔 +𝑔𝑔 𝐶𝐶𝑔𝑔2𝑔𝑔 + 𝐶𝐶𝑔𝑔3𝑔𝑔 + 𝐶𝐶𝑔𝑔4𝑔𝑔 + 𝐶𝐶𝑝𝑝𝑝𝑝𝑠𝑠𝑔𝑔 − 𝐶𝐶𝑠𝑠𝑠𝑠𝑠𝑠𝑠𝑠𝑔𝑔) (3.2)
19
3.2.2 Unknown Variable
Set 𝑥𝑥𝑔𝑔 is a list of unknown variable in time k, the way to minimize objective
formulation is actually the way to dispatch the power of each variable, including
power of each generator, purchase energy from AEP grid, sell energy to AEP grid.
𝑥𝑥𝑔𝑔 = [𝑝𝑝𝑔𝑔1𝑔𝑔,𝑝𝑝𝑔𝑔2𝑔𝑔,𝑝𝑝𝑔𝑔3𝑔𝑔,𝑝𝑝𝑔𝑔4𝑔𝑔,𝑝𝑝𝑝𝑝𝑝𝑝𝑠𝑠 𝑔𝑔,𝑝𝑝𝑠𝑠𝑠𝑠𝑠𝑠𝑠𝑠 𝑔𝑔] (3.3)
3.2.3 Cost Coefficients
Set 𝑓𝑓𝑔𝑔 is a list of cost coefficients for variables, it is the determination of liner
programming to minimize total cost. Corresponding to each variable, they are
operation cost of each generator, AEP energy purchase price and energy sale price.
𝑓𝑓𝑔𝑔 = [𝐸𝐸𝑝𝑝𝑠𝑠𝑖𝑖𝑠𝑠𝑠𝑠 𝑔𝑔1𝑔𝑔; 𝐸𝐸𝑝𝑝𝑠𝑠𝑖𝑖𝑠𝑠𝑠𝑠 𝑔𝑔2𝑔𝑔;𝐸𝐸𝑝𝑝𝑠𝑠𝑖𝑖𝑠𝑠𝑠𝑠 𝑔𝑔3𝑔𝑔;𝐸𝐸𝑝𝑝𝑠𝑠𝑖𝑖𝑠𝑠𝑠𝑠 𝑔𝑔4𝑔𝑔; 𝐸𝐸𝑝𝑝𝑠𝑠𝑖𝑖𝑠𝑠𝑠𝑠 𝑝𝑝𝑝𝑝𝑠𝑠 𝑔𝑔;−𝐸𝐸𝑝𝑝𝑠𝑠𝑖𝑖𝑠𝑠𝑠𝑠 𝑠𝑠𝑠𝑠𝑠𝑠𝑠𝑠 𝑔𝑔] (3.4)
3.2.4 Constraints
In static economic operation for this microgrid, there are four constraints,
based on Equation (2.1) (2.6) (2.7) (2.8), we obtain constraints equation (3.5) -(3.8)
in this microgrid.
Equation (3.5) is power balance constraints, for each hour, power generation
of four generators and energy exchange to AEP grid is equal to power demand of
load. Equation (3.6) is capacity constraints of each diesel generator, in order to make
full use of solar power, PV generator keep running at its current maximum power.
Equation (3.7) and (3.8) is constraints for AEP Utilities, includes purchase
constraints and sale constraints.
𝑝𝑝𝑔𝑔1𝑔𝑔 + 𝑝𝑝𝑔𝑔2𝑔𝑔 + 𝑝𝑝𝑔𝑔3𝑔𝑔 + 𝑝𝑝𝑔𝑔4𝑔𝑔 + 𝑝𝑝𝑝𝑝𝑝𝑝𝑠𝑠 𝑔𝑔 − 𝑝𝑝𝑠𝑠𝑠𝑠𝑠𝑠𝑠𝑠 𝑔𝑔 = 𝑃𝑃𝑠𝑠𝑙𝑙𝑠𝑠𝑠𝑠 𝑔𝑔 (3.5)
𝑃𝑃𝑔𝑔min 𝑖𝑖 ≤ 𝑝𝑝𝑔𝑔𝑖𝑖𝑔𝑔 ≤ 𝑃𝑃𝑔𝑔max 𝑖𝑖 (3.6)
𝑃𝑃𝑝𝑝𝑝𝑝𝑠𝑠min𝑔𝑔 ≤ 𝑝𝑝𝑝𝑝𝑝𝑝𝑠𝑠 𝑔𝑔 ≤ 𝑃𝑃𝑝𝑝𝑝𝑝𝑠𝑠max𝑔𝑔 (3.7)
20
𝑃𝑃𝑠𝑠𝑠𝑠𝑠𝑠𝑠𝑠min𝑔𝑔 ≤ 𝑝𝑝𝑠𝑠𝑠𝑠𝑠𝑠𝑠𝑠 𝑔𝑔 ≤ 𝑃𝑃𝑠𝑠𝑠𝑠𝑠𝑠𝑠𝑠 max𝑔𝑔 (3.8)
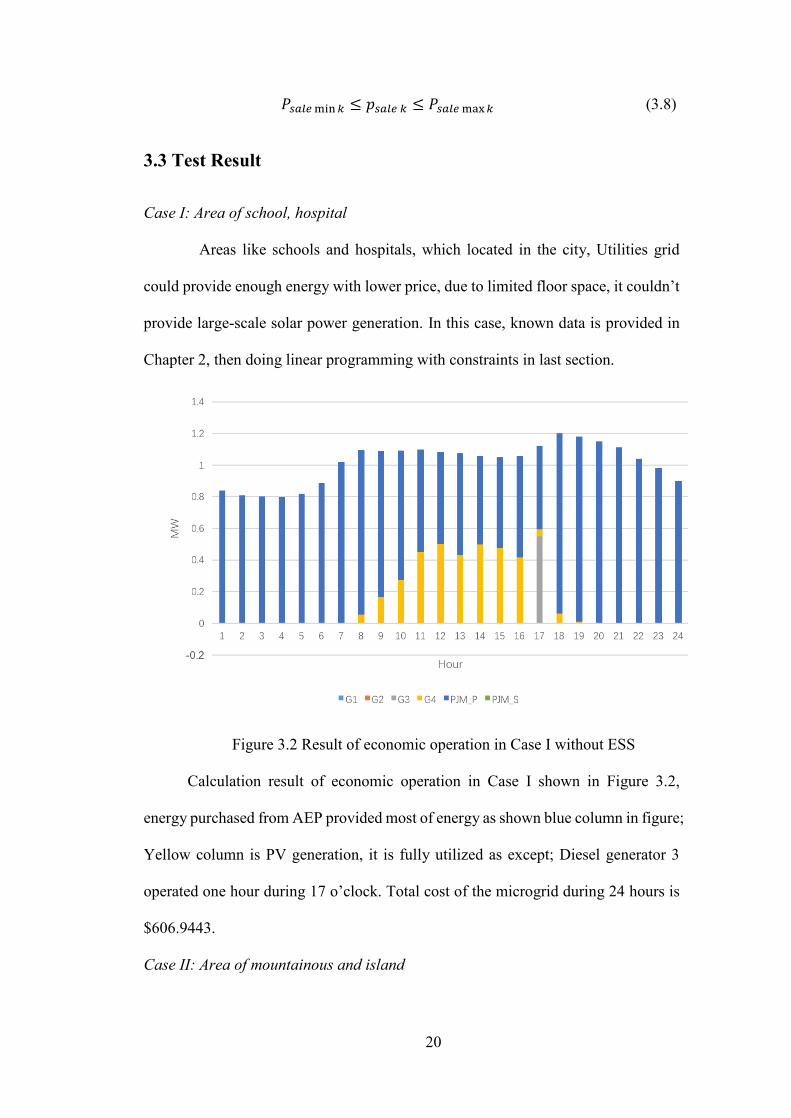
3.3 Test Result
Case I: Area of school, hospital
Areas like schools and hospitals, which located in the city, Utilities grid
could provide enough energy with lower price, due to limited floor space, it couldn’t
provide large-scale solar power generation. In this case, known data is provided in
Chapter 2, then doing linear programming with constraints in last section.
Figure 3.2 Result of economic operation in Case I without ESS
Calculation result of economic operation in Case I shown in Figure 3.2,
energy purchased from AEP provided most of energy as shown blue column in figure;
Yellow column is PV generation, it is fully utilized as except; Diesel generator 3
operated one hour during 17 o’clock. Total cost of the microgrid during 24 hours is
$606.9443.
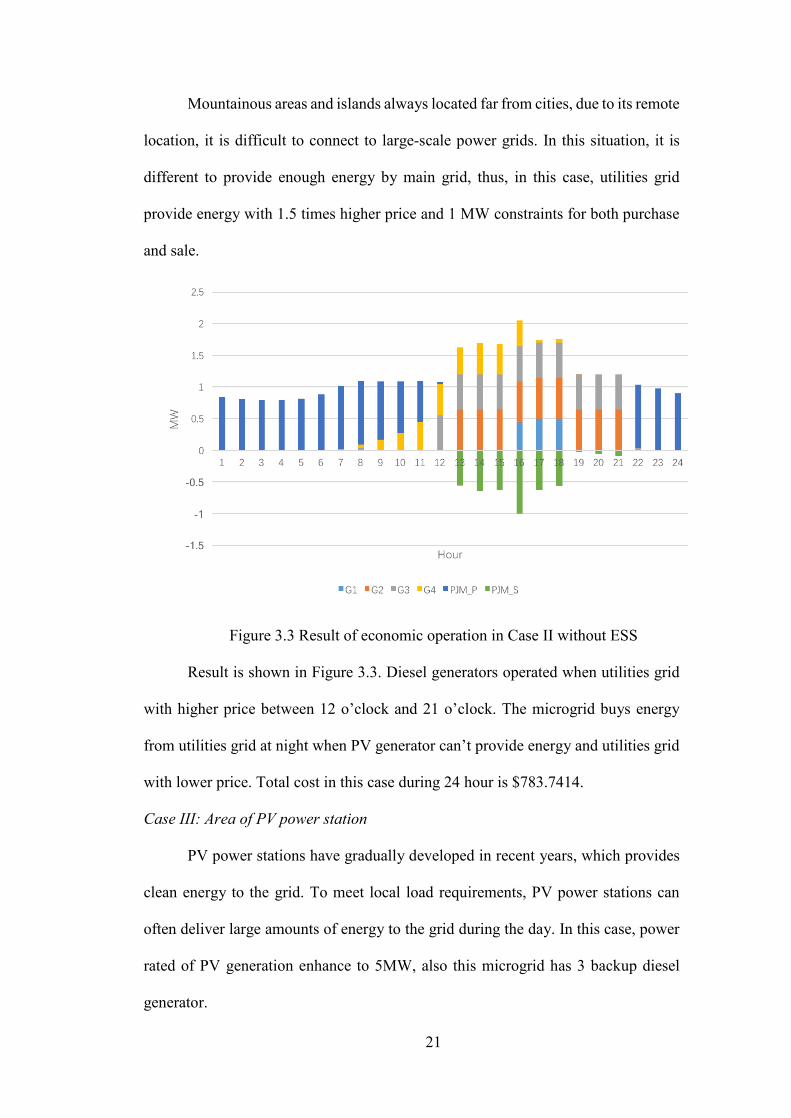
Case II: Area of mountainous and island
21
Mountainous areas and islands always located far from cities, due to its remote
location, it is difficult to connect to large-scale power grids. In this situation, it is
different to provide enough energy by main grid, thus, in this case, utilities grid
provide energy with 1.5 times higher price and 1 MW constraints for both purchase
and sale.
Figure 3.3 Result of economic operation in Case II without ESS
Result is shown in Figure 3.3. Diesel generators operated when utilities grid
with higher price between 12 o’clock and 21 o’clock. The microgrid buys energy
from utilities grid at night when PV generator can’t provide energy and utilities grid
with lower price. Total cost in this case during 24 hour is $783.7414.
Case III: Area of PV power station
PV power stations have gradually developed in recent years, which provides
clean energy to the grid. To meet local load requirements, PV power stations can
often deliver large amounts of energy to the grid during the day. In this case, power
rated of PV generation enhance to 5MW, also this microgrid has 3 backup diesel
generator.

22
Figure 3.4 Result of economic operation in Case III without ESS
Result of economic operation is shown in Figure 3.4. This microgrid sell large
amount of energy to grid during 9 o’clock to 16 o’clock when PV generator with
higher generation. G3 is operated during 17 o’clock to make up for the lack of energy.
Total cost after economic operation during 24 hours is $-393.5891, it means this
microgrid earn $393.5891 thus provide energy to utilities grid per day.
23
Chapter 4 Dynamic Economic Operation
4.1 Introduction of Dynamic Economic Operation
In this chapter, the author adds an energy storage system(ESS) to the
microgrid, ESS charging energy in one time and discharging energy in another time.
In this situation, economic operation needs to be considered in time domain, the
problem is becoming dynamic economic operation because it’s need to consider
economic operation in longer period such as 24 hours [17]. Dynamic economic
operation is a strategy to decide output of each generating units and output or input
of ESS and utilities grid, thereby reducing the total cost in the microgrid [19]. Earlier
efforts of solving dynamic economic dispatch problem were using classical methods
such as lambda iterative method, Gradient projection algorithm, Linear programming
and Dynamic programming [20]. In this thesis, the author uses Integer programming
to optimize ESS and Linear programming to optimize the rest.
𝑀𝑀𝑖𝑖𝑀𝑀𝑖𝑖𝑀𝑀𝑖𝑖𝑀𝑀𝑀𝑀 ∑ (𝐶𝐶𝑔𝑔𝑠𝑠𝑔𝑔 +𝑔𝑔 𝐶𝐶𝑝𝑝𝑝𝑝𝑠𝑠𝑔𝑔 − 𝐶𝐶𝑠𝑠𝑠𝑠𝑠𝑠𝑠𝑠𝑔𝑔) (4.1)
Where,
𝐶𝐶𝑔𝑔𝑠𝑠𝑔𝑔 generation energy cost, 𝐶𝐶𝑔𝑔𝑠𝑠𝑔𝑔 = ∑ (𝐶𝐶𝑔𝑔𝑠𝑠𝑖𝑖𝑝𝑝𝑔𝑔𝑖𝑖𝑔𝑔)𝑖𝑖
𝐶𝐶𝑝𝑝𝑝𝑝𝑠𝑠𝑔𝑔 cost for purchasing energy from AEP, 𝐶𝐶𝑝𝑝𝑝𝑝𝑠𝑠𝑔𝑔 = 𝐶𝐶𝑠𝑠𝑝𝑝𝑝𝑝𝑠𝑠𝑖𝑖𝑝𝑝𝑝𝑝𝑝𝑝𝑠𝑠𝑔𝑔
𝐶𝐶𝑠𝑠𝑠𝑠𝑠𝑠𝑠𝑠𝑔𝑔 revenue for energy sale to AEP, 𝐶𝐶𝑠𝑠𝑠𝑠𝑠𝑠𝑠𝑠𝑔𝑔 = 𝐶𝐶𝑠𝑠𝑠𝑠𝑠𝑠𝑠𝑠𝑠𝑠𝑔𝑔𝑝𝑝𝑠𝑠𝑠𝑠𝑠𝑠𝑠𝑠𝑔𝑔
Equation (4.1) is the function that minimize the total operational cost for the
microgrid, ESS could be considered as generator or load at one time. But when we
consider operation in long period, energy stored in ESS should be fully utilized at
the end of period. Thus, the function doesn’t include cost of ESS.
24
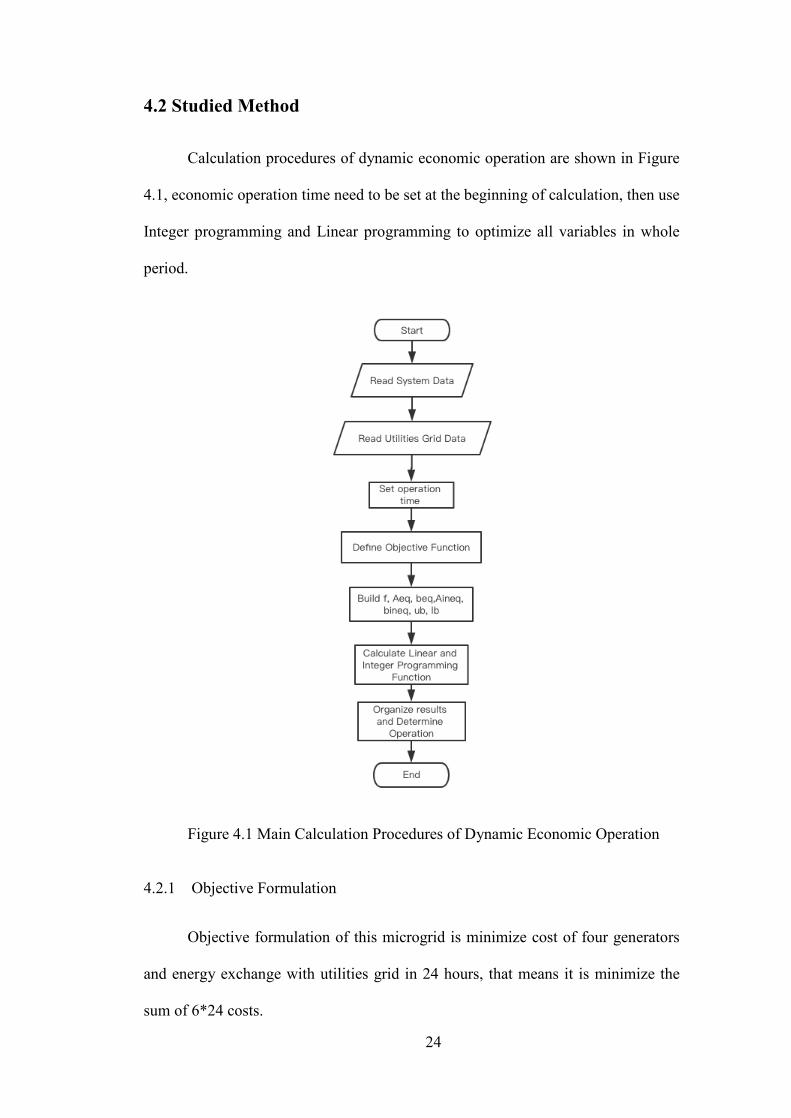
4.2 Studied Method
Calculation procedures of dynamic economic operation are shown in Figure
4.1, economic operation time need to be set at the beginning of calculation, then use
Integer programming and Linear programming to optimize all variables in whole
period.
Figure 4.1 Main Calculation Procedures of Dynamic Economic Operation
4.2.1 Objective Formulation
Objective formulation of this microgrid is minimize cost of four generators
and energy exchange with utilities grid in 24 hours, that means it is minimize the
sum of 6*24 costs.

25
𝑀𝑀𝑖𝑖𝑀𝑀𝑖𝑖𝑀𝑀𝑖𝑖𝑀𝑀𝑀𝑀 ∑ (𝐶𝐶𝑔𝑔1𝑔𝑔 +𝑔𝑔 𝐶𝐶𝑔𝑔2𝑔𝑔 + 𝐶𝐶𝑔𝑔3𝑔𝑔 + 𝐶𝐶𝑔𝑔4𝑔𝑔 + 𝐶𝐶𝑝𝑝𝑝𝑝𝑠𝑠𝑔𝑔 − 𝐶𝐶𝑠𝑠𝑠𝑠𝑠𝑠𝑠𝑠𝑔𝑔) (4.2)
4.2.2 Unknown Variables
Here, the author adds variables 𝑠𝑠𝑠𝑠𝑠𝑠1𝑔𝑔 and 𝑑𝑑𝑠𝑠𝑠𝑠1𝑔𝑔 to express charging action
and discharging action of ESS in time k, also, set 𝑥𝑥 includes 8*24 variables.
𝑥𝑥 = �𝑝𝑝𝑔𝑔1𝑔𝑔,𝑝𝑝𝑔𝑔2𝑔𝑔,𝑝𝑝𝑔𝑔3𝑔𝑔,𝑝𝑝𝑔𝑔4𝑔𝑔,𝑝𝑝𝑝𝑝𝑝𝑝𝑠𝑠 𝑔𝑔,𝑝𝑝𝑠𝑠𝑠𝑠𝑠𝑠𝑠𝑠 𝑔𝑔, 𝑠𝑠𝑠𝑠𝑠𝑠1𝑔𝑔,𝑑𝑑𝑠𝑠𝑠𝑠1𝑔𝑔�,𝑘𝑘 = 1,2,3 … (4.3)
4.2.3 Cost Coefficients:
Set 𝑓𝑓 represents cost coefficients for each variables, because ESS doesn’t
have cost, cost coefficients of variables charging action and discharging action is 0.
Similarly, set 𝑓𝑓 also includes 8*24 variables.
𝑓𝑓 = �𝐸𝐸𝑝𝑝𝑠𝑠𝑖𝑖𝑠𝑠𝑠𝑠 𝑔𝑔1𝑔𝑔; 𝐸𝐸𝑝𝑝𝑠𝑠𝑖𝑖𝑠𝑠𝑠𝑠 𝑔𝑔2𝑔𝑔;𝐸𝐸𝑝𝑝𝑠𝑠𝑖𝑖𝑠𝑠𝑠𝑠 𝑔𝑔3𝑔𝑔;𝐸𝐸𝑝𝑝𝑠𝑠𝑖𝑖𝑠𝑠𝑠𝑠 𝑔𝑔4𝑔𝑔; 𝐸𝐸𝑝𝑝𝑠𝑠𝑖𝑖𝑠𝑠𝑠𝑠 𝑝𝑝𝑝𝑝𝑠𝑠 𝑔𝑔;−𝐸𝐸𝑝𝑝𝑠𝑠𝑖𝑖𝑠𝑠𝑠𝑠 𝑠𝑠𝑠𝑠𝑠𝑠𝑠𝑠 𝑔𝑔; 0 ∗
𝑝𝑝𝑠𝑠𝑠𝑠𝑠𝑠1𝑔𝑔; 0 ∗ 𝑝𝑝𝑠𝑠𝑠𝑠𝑠𝑠1𝑔𝑔�,𝑘𝑘 = 1,2,3 … (4.4)
4.2.4 Constraints:
In dynamic economic operation, ESS is added into this microgrid. Comparing
to constraints of static economic operation, constraints equation (4.6) (4.7) (4.8)
(4.12) (4.13) is added as constraints for ESS, also, charging power and discharging
power is added into power balance constraint equation (4.5).
Based on constraints in Chapter 2, in this microgrid, equation (4.6) is storage
charging and discharging relationship constraint; Equation (4.7) is storage capacity
constraint; Equation (4.8) is storage energy constraint; Equation (4.12) is storage
charging and discharging action constraint; Equation (4.13) is storage initial output
constraint.

26
𝑝𝑝𝑔𝑔1𝑔𝑔 + 𝑝𝑝𝑔𝑔2𝑔𝑔 + 𝑝𝑝𝑔𝑔3𝑔𝑔 + 𝑝𝑝𝑔𝑔4𝑔𝑔 + 𝑝𝑝𝑝𝑝𝑝𝑝𝑠𝑠 𝑔𝑔 − 𝑝𝑝𝑠𝑠𝑠𝑠𝑠𝑠𝑠𝑠 𝑔𝑔 − 𝑝𝑝𝑠𝑠𝑠𝑠𝑠𝑠1𝑔𝑔𝑠𝑠𝑠𝑠𝑠𝑠1𝑔𝑔 + 𝑝𝑝𝑠𝑠𝑠𝑠𝑠𝑠1𝑔𝑔𝑑𝑑𝑠𝑠𝑠𝑠1𝑔𝑔 =
𝑃𝑃𝑠𝑠𝑙𝑙𝑠𝑠𝑠𝑠 (4.5)
𝑠𝑠𝑠𝑠𝑠𝑠1𝑔𝑔 + 𝑑𝑑𝑠𝑠𝑠𝑠1𝑔𝑔 ≤ 1 (4.6)
(1 − 𝐷𝐷𝐷𝐷𝐷𝐷)𝑄𝑄𝑠𝑠 𝑚𝑚𝑠𝑠𝑚𝑚 ≤ 𝑞𝑞𝑠𝑠1𝑔𝑔 ≤ 𝑄𝑄𝑠𝑠 𝑚𝑚𝑠𝑠𝑚𝑚 (4.7)
𝑞𝑞𝑠𝑠1𝑔𝑔 − 𝑞𝑞𝑠𝑠1(𝑔𝑔−1) = 𝑠𝑠𝑠𝑠𝑠𝑠1𝑔𝑔𝑝𝑝𝑠𝑠𝑠𝑠𝑠𝑠1𝑔𝑔𝜀𝜀 − 𝑑𝑑𝑠𝑠𝑠𝑠1𝑔𝑔𝑝𝑝𝑠𝑠𝑠𝑠𝑠𝑠1𝑔𝑔/𝜀𝜀 (4.8)
𝑃𝑃𝑔𝑔min 𝑖𝑖 ≤ 𝑝𝑝𝑔𝑔𝑖𝑖𝑔𝑔 ≤ 𝑃𝑃𝑔𝑔max 𝑖𝑖 (4.9)
𝑃𝑃𝑝𝑝𝑝𝑝𝑠𝑠min𝑔𝑔 ≤ 𝑝𝑝𝑝𝑝𝑝𝑝𝑠𝑠 𝑔𝑔 ≤ 𝑃𝑃𝑝𝑝𝑝𝑝𝑠𝑠max𝑔𝑔 (4.10)
𝑃𝑃𝑠𝑠𝑠𝑠𝑠𝑠𝑠𝑠min𝑔𝑔 ≤ 𝑝𝑝𝑠𝑠𝑠𝑠𝑠𝑠𝑠𝑠 𝑔𝑔 ≤ 𝑃𝑃𝑠𝑠𝑠𝑠𝑠𝑠𝑠𝑠max𝑔𝑔 (4.11)
(𝑠𝑠𝑠𝑠𝑠𝑠1𝑔𝑔,𝑑𝑑𝑠𝑠𝑠𝑠1𝑔𝑔) ∈ 0, 1 (4.12)
𝑞𝑞𝑠𝑠𝑖𝑖0 = 𝑄𝑄𝑠𝑠𝑖𝑖0 (4.13)
4.3 Test Result
There are 3 types of ESS test in this chapter in each case, as said in chapter 2,
they are 2MWh, 3MWh, and 4 MWh ESS with same other parameters. In this section,
result of each ESS is presented one by one for each case.
Case I: Area of school, hospital
The microgrid with ESS is tested in this case, this microgrid includes 4
generators and one ESS, it can operate both on-grid mode and off-grid mode.
27
(a)
(b)
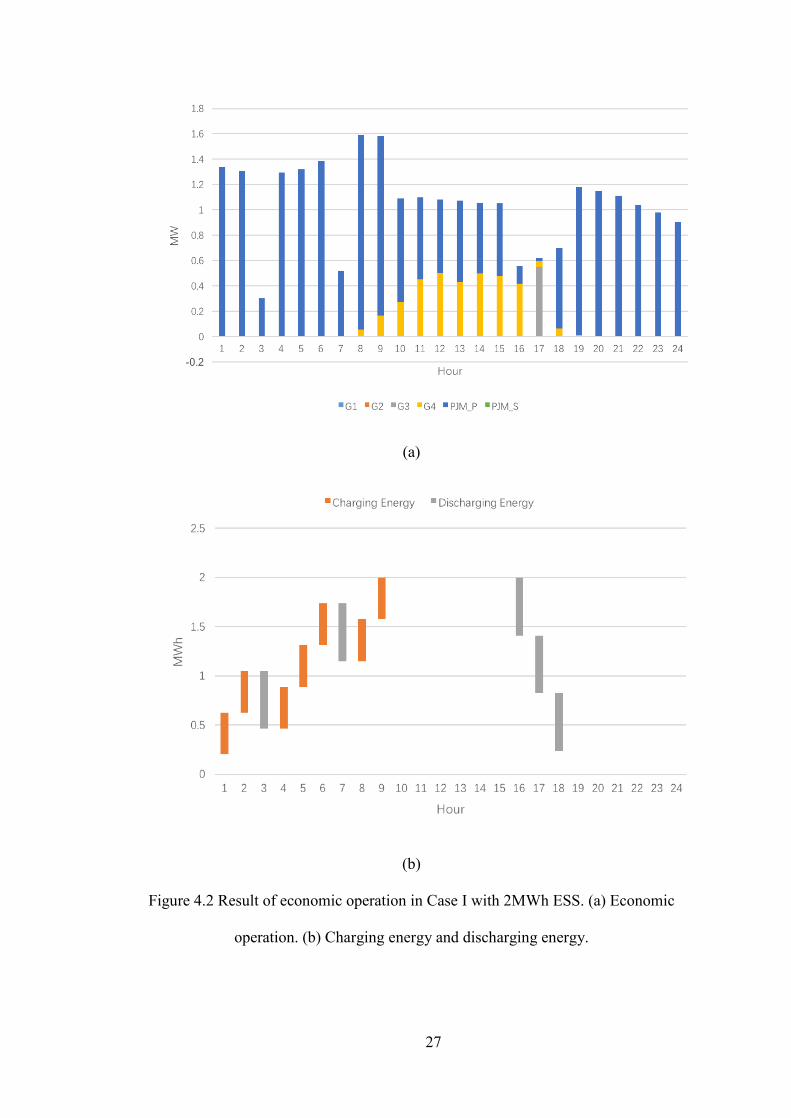
Figure 4.2 Result of economic operation in Case I with 2MWh ESS. (a) Economic
operation. (b) Charging energy and discharging energy.

28
Figure 4.2 is economic operation result of the microgrid with 2 MWh ESS.
From figure 4.2(a), we can see PV generator is running at maximum power every
hour, most of the energy is purchased from utilities grid to meet the demand, diesel
generators only operated G3 at 17 o’clock. Figure 4.2(b) waterfall chart for energy
in ESS, orange column is charging energy, the lowermost end of each column
represents the energy of the ESS at the beginning of this hour, the uppermost end of
each column represents the energy of the ESS at the end of the hour, the height of
the column indicates the amount of charge for that hour. The gray column is exactly
the opposite, the uppermost end of each column represents the energy of the ESS at
the beginning of this hour, the lowermost end of each column represents the energy
of the battery at the end of the hour, the height of the column indicates the amount
of charge for the hour. Thus, ESS is charging at 1,2,4,5,6,8,9 o’clock as orange
column in figure and discharging at 3,7,17,17 18 o’clock as gray column in figure.
ESS is reach its maximum capacity at 9 o’clock, and its energy is more than the
requirement of DOD at all time. The total economic operation cost is $588.5143.
29
(a)
(b)
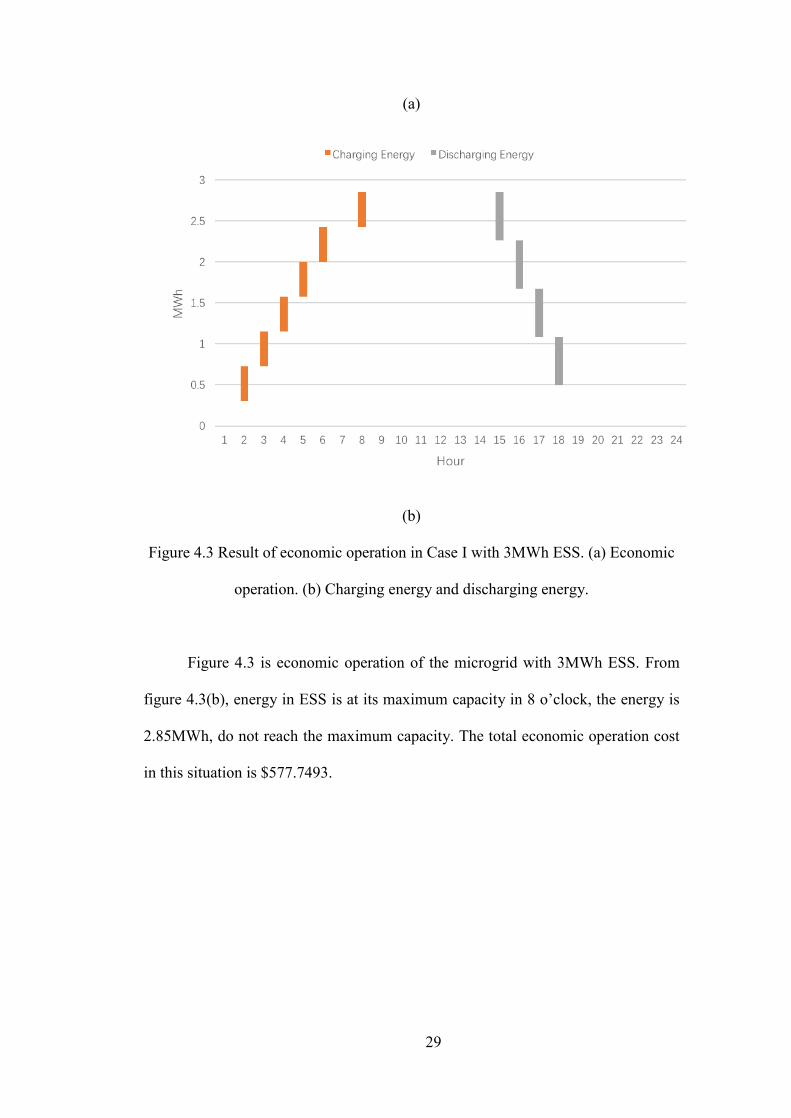
Figure 4.3 Result of economic operation in Case I with 3MWh ESS. (a) Economic
operation. (b) Charging energy and discharging energy.
Figure 4.3 is economic operation of the microgrid with 3MWh ESS. From
figure 4.3(b), energy in ESS is at its maximum capacity in 8 o’clock, the energy is
2.85MWh, do not reach the maximum capacity. The total economic operation cost
in this situation is $577.7493.
30
(a)
(b)
Figure 4.4 Result of economic operation in Case I with 4MWh ESS. (a) Economic
operation. (b) Charging energy and discharging energy.

31
Figure 4.4 represents the economic operation result of the microgrid with
4MWh ESS. Focus on figure 4.4(b), the maximum charging energy 3.375MWh is
0.625MWh less than maximum capacity of ESS. Total cost of economic operation is
$569.4993.
In downtown areas, it is possible to provide enough energy by utilities grid,
the cost of diesel generators is relatively higher than utilities grid. Thus, for these
areas, ESS will be used to store energy in the utilities grid, diesel generators are more
likely to be considered as a backup generation in some situation.
Case II: Area of mountainous and islands
Similarly, case II also provides economic operation for three different
capacities of ESS, 2MWh, 3MWh, and 4MWh. This case has higher price for both
energy purchase and energy sale, and 1MW rated power limitation for energy
exchange with utilities grid.

32
(a)
(b)
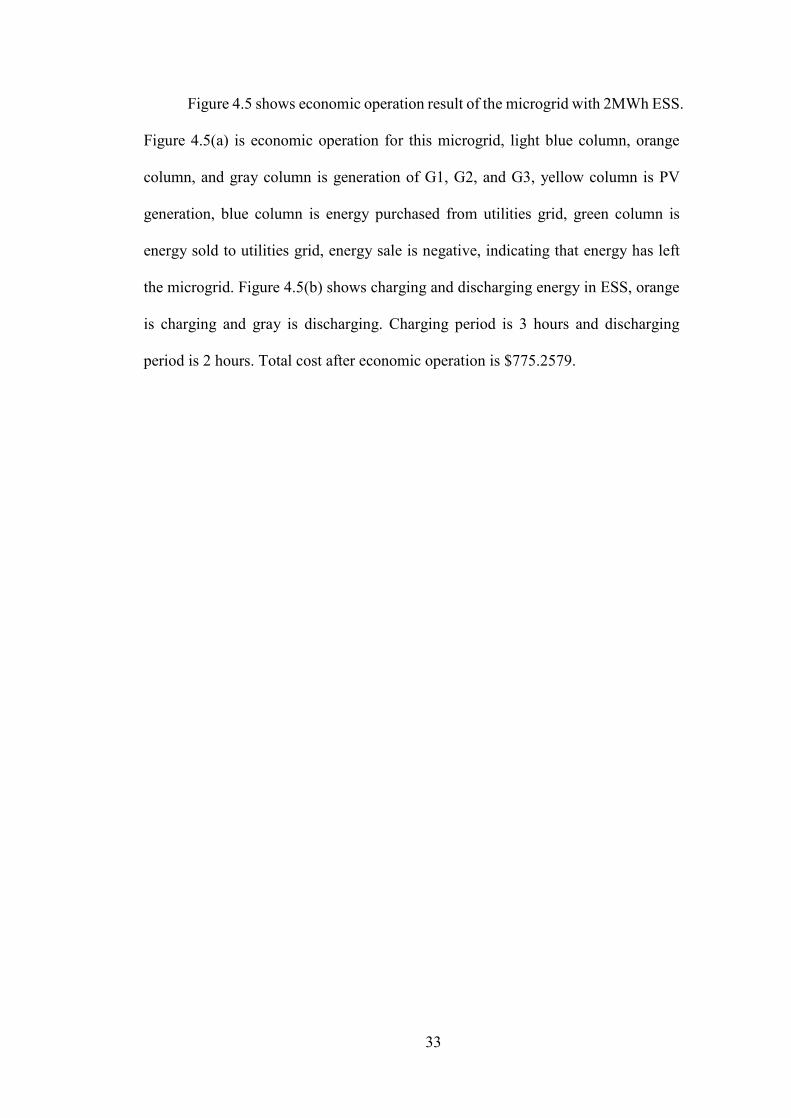
Figure 4.5 Result of economic operation in Case II with 2MWh ESS. (a) Economic
operation. (b) Charging energy and discharging energy.
33
Figure 4.5 shows economic operation result of the microgrid with 2MWh ESS.
Figure 4.5(a) is economic operation for this microgrid, light blue column, orange
column, and gray column is generation of G1, G2, and G3, yellow column is PV
generation, blue column is energy purchased from utilities grid, green column is
energy sold to utilities grid, energy sale is negative, indicating that energy has left
the microgrid. Figure 4.5(b) shows charging and discharging energy in ESS, orange
is charging and gray is discharging. Charging period is 3 hours and discharging
period is 2 hours. Total cost after economic operation is $775.2579.
34
(a)
(b)
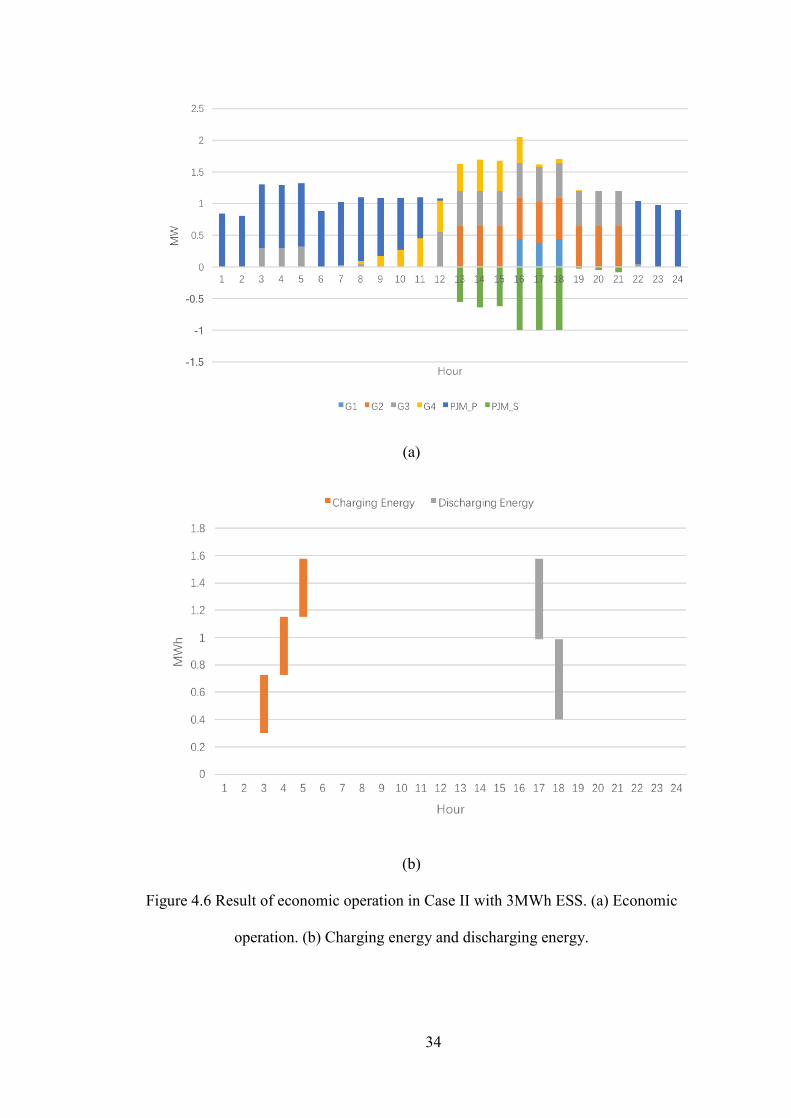
Figure 4.6 Result of economic operation in Case II with 3MWh ESS. (a) Economic
operation. (b) Charging energy and discharging energy.
35
Figure 4.6 represents result of economic operation with 3MWh ESS. In this
situation, economic operation result is totally same with the result of 2MWh ESS
except energy capacity. That is because 2MWh and 3MWh ESS have different initial
energy, on the other side, it doesn’t mean this microgrid system is already optimized.
Without changing any power input for any time, total cost of this microgrid is still
$775.2579.

36
(a)
(b)
Figure 4.7 Result of economic operation in Case II with 4MWh ESS. (a) Economic
operation. (b) Charging energy and discharging energy.
37
Figure 4.7 shows economic operation result of the microgrid with 4MWh ESS.
In this situation, ESS utilization is higher than before, charging period increase to 7
hours and discharging period increase to 5 hours. Total cost after economic operation
decrease to $772.4085.
Due to higher energy price and 1MW power purchase and sale limitation, the
microgrid in case II fully uses all generators to lower total cost. In mountainous and
islands areas, it is best to make full use of local energy, such as diesel generator and
PV generator in this microgrid, also wind power generation and tidal power
generation are good choices for these areas.
Case III: Area of PV power station
PV power station with local load is a great case to study economic operation,
similarly with cases above, this microgrid still connects with 2MWh, 3MWh, and
4MWh ESS, respectively.

38
(a)
(b)
Figure 4.8 Result of economic operation in Case III with 2MWh ESS. (a)
Economic operation. (b) Charging energy and discharging energy.
39
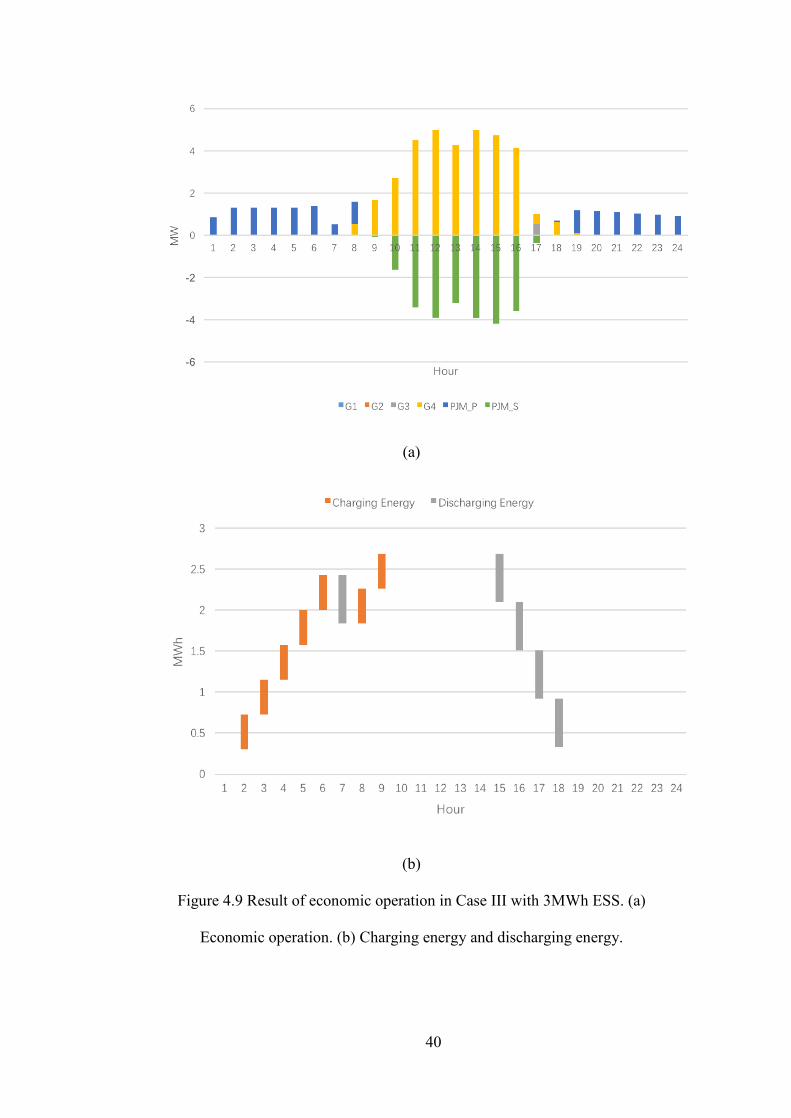
Figure 4.8 shows economic operation result of the microgrid in Case III with
2MWh ESS. In figure 4.8(a), blue column is energy purchased from utilities grid,
yellow column is PV generation for each hour, green column is energy sell to utilities
grid, and gray column is generation of diesel generators G3. In figure 4.8(b), orange
column is charging energy for each hour, gray column is discharging energy for each
hour. value of the highest point of the orange column and the lowest point of the gray
column is energy storage in ESS at end of this hour. Cost after economic operation
for this microgrid is $-411.6494, it means this microgrid earns $411.6494 in this 24
hours.
40
(a)
(b)
Figure 4.9 Result of economic operation in Case III with 3MWh ESS. (a)
Economic operation. (b) Charging energy and discharging energy.
41
Figure 4.9 is the result of economic operation for the microgrid with 3MWh
ESS. Diesel generator G3 still operated at 17 o’clock, ESS charging time is 2, 3, 4,
5, 6, 8, and 9 o’clock, discharging time is 7, 15, 16, 17, and 18 o’clock. ESS reach
its maximum charging capacity at 9 o’clock is 2.687MWh. Total cost of this
microgrid after economic operation is $-421.4344, this microgrid earns $421.4344
in this 24 hours.
42
(a)
(b)
Figure 4.10 Result of economic operation in Case III with 4MWh ESS. (a)
Economic operation. (b) Charging energy and discharging energy.

43
Figure 4.10 represents economic operation result for the microgrid with
4MWh ESS. G3 still generated at 17 o’clock, most of the energy generated by PV
generation sell to utilities grid between 9 o’clock to 17 o’clock, 4MWh ESS storage
maximum 3.375MWh energy at 9 o’clock and discharging between 15 o’clock and
19 o’clock. Total cost of this microgrid after economic operation is $-429.6844, thus,
this microgrid earns $429.6844 during these 24 hours.
In this case, maximum PV generation is 5MW, greater than load. Without
considering the cost of maintenance of PV generator equipment, PV generation’s
cost is 0 at all time. After providing enough energy to load, most of the energy sells
to utilities grid when utilities provide higher price, at the same time, this microgrid
also buys energy from utilities grid when price is lower. Because the peak time of
PV generation and the peak time of utilities grid prices are very similar, energy could
be sold to utilities grid immediately. Energy storage in ESS is more likely to meet
the load demand when PV generator couldn’t provide enough energy during night
time.

44
Chapter 5 Conclusions
5.1 Summary of Results Obtained
In previous two chapter, the author presents static and dynamic economic
operation for 3 cases and their results. The reason that we perform economic
operation and add ESS to the microgrid is we want to reduce total operation cost for
the microgrid, and thus, the author summarizes all economic operation results in this
chapter, expect to see the effect of adding ESS by comparison.
Table 5.1 Total Cost of Economic Operation for Each Case
No ESS 2MWh ESS 3MWh ESS 4MWh ESS
Case I 606.9443 588.5143 577.7493 569.4993
Case II 783.7414 775.2579 775.2579 772.4085
Case III -393.5891 -411.6494 -421.4344 -429.6844
A simple observation can be found that adding ESS does reduce costs, and as
the ESS capacity increasing, the cost is gradually reducing. Number in Case III is
negative, the reason is that the microgrid in Case III is profitable, the smaller the
value, the more profitable. But the numerical reduction does not allow us to
intuitively feel the reduced effect, then using Equation (5.1) to calculate reduced cost
ratio.
𝑅𝑅𝑀𝑀𝑑𝑑𝑢𝑢𝑅𝑅𝑀𝑀𝑑𝑑 𝐶𝐶𝐶𝐶𝑠𝑠𝐶𝐶 𝑅𝑅𝑅𝑅𝐶𝐶𝑖𝑖𝐶𝐶 = 𝐶𝐶𝑙𝑙𝑠𝑠𝐶𝐶 𝑤𝑤𝑖𝑖𝐶𝐶ℎ 𝐸𝐸𝐸𝐸𝐸𝐸−𝐶𝐶𝑙𝑙𝑠𝑠𝐶𝐶 𝑤𝑤𝑖𝑖𝐶𝐶ℎ𝑙𝑙𝑝𝑝𝐶𝐶 𝐸𝐸𝐸𝐸𝐸𝐸𝐶𝐶𝑙𝑙𝑠𝑠𝐶𝐶 𝑤𝑤𝑖𝑖𝐶𝐶ℎ𝑙𝑙𝑝𝑝𝐶𝐶 𝐸𝐸𝐸𝐸𝐸𝐸
× 100% (5.1)

45
Table 5.2 Reduced Cost Ratio Compare to the Microgrid Without ESS
2MWh ESS 3MWh ESS 4MWh ESS
Case I -3.04% -4.81% -6.19%
Case II -1.08% -1.08% -1.45%
Case III 4.59% 7.07% 9.17%
Based on Equation (5.1), the author gets reduced cost ratio for each case as
shown in Table 5.2, negative values indicate the percentage reduction, positive
values indicate the percentage increase. Compare with Case I, cost reduction in Case
II is inconspicuous, it is only 1.45% reduction with 4MWh ESS compare with 6.19%
reduction in Case I. The reason is that Case II has 1MW energy exchange limitation
with utilities grid, and 1.5 times utilities grid energy price compared to Case I.
5.2 Conclusion
Nowadays, electricity prices are gradually increasing, the requirements for
green energy are getting higher and higher, distributed power generation that can
effectively utilize local resources is also gradually emerging, so the demand for this
microgrids has also emerged. The microgrid can effectively reduce the impact of
unstable energy sources such as photovoltaic and wind energy on the main power
grid, at the same time, the internal energy balance can also be used to reduce the cost
of electricity. Therefore, this paper aims to reduce the operating cost of the microgrid
by economic operation and adding ESS.
The test cases of this thesis demonstrate that adding ESS to the microgrid can
effectively reduce costs, or increase income in PV power station. The effect of
reducing costs is directly proportional to the capacity of ESS, but as ESS capacity
46
increases, the cost may remain at a fixed value and may not decrease all the time.
Thus, if you want to get the best ESS capacity for the current microgrid, you only
need to set the nominal capacity to a large value, the value of the maximum capacity
of the ESS in the optimized result is the best ESS capacity for the microgrid. By
comparing the three cases, it can be found that the limitation of energy exchange
with the grid will reduce the cost reduction effect; Selling electricity at higher
electricity prices, buying electricity at lower electricity prices is a good strategy; The
longer the battery is continuously charged, the better the cost reduction effect.
5.3 Future Work
This thesis demonstrates the positive significance of adding ESS to the
microgrid, and the capacity of the ESS can affect the cost. Future work may consider
the following points.
First, other factors can also be analyzed. This thesis compares cost changes
by changing nominal ESS capacity. Similarly, other factors could be changed. For
example, you can change the power of the generators, compare the impact of power
changes on the cost, and find the generator which is most suitable for the current
microgrid. Or you can change the purchase and sale price of the utilities grid, and
find the impact of electricity prices on the cost of the microgrid.
Second, the system studied in this thesis is a relatively simple microgrid.
Bigger systems that require more constraints may be studied.
47
Reference
[1] Y. Liao, W. Fan, A. Cramer, P. Dolloff, Z. Fei, M. Qiu, S.
Bhattacharyya, L. Holloway and B. Gregory, Voltage and Var
Control to Enable High Penetration of Distributed Photovoltaic
Systems, 2012 North American Power Symposium (NAPS), 9-11
Sept. 2012.
[2] X. Zhang, Commercial Applications of Microgrid Technology in
Contract Energy Management, 2018 13th IEEE Conference on
Industrial Electronics and Applications (ICIEA), 2018.
[3] G. Oriti, A. L. Julian, N. Anglani and G. D. Hernandez, Novel
Economic Analysis to Design the Energy Storage Control System of
a Remote Islanded Microgrid, IEEE, 04 July 2018 .
[4] H. Lai, X. Zhu and J. Yu, "Design and Realization of the Economical
Operation Monitoring System for Traction Transformers".2009 IEEE
International Conference on Automation and Logistics.
[5] C. Li, J. C. Vasquez and J. M. Guerrero, Multiagent-based Distributed
Control for Operation Cost Minimization of Droop Controlled DC
Microgrid Using Incremental Cost Consensus, IEEE, 28 January
2016.
[6] J.-P. Chiou, . C.-F. Chang and C.-C. Wang, Hybrid Differential
Evolution for Static Economic Dispatch, vol. DOI
10.1109/IS3C.2014.249, 2014 International Symposium on
Computer, Consumer and Control, 2014.
48
[7] T. Dean L and J. K. R, Dynamic Dispatch by Constructive Dynamic
Programming, Vols. Vol. 13, No. 1, IEEE Transactions on Power
Systems, February 1998.
[8] W. R. Barcelo and P. Rastgoufard, "Dynamic Economic Dispatch
Using The Extended Security Constrained Economic Dispatch
Algorithm," IEEE Transactions on Power Systems, vol. 12, no. 2.
[9] S. Panta and S. Premrudeepreechacham, "Economic Dispatch for
Power Generation Using Artificial Neural Network ICPE'07
Conference in Daegu, Korea".
[10] P. L. J. A., M. C. L. and M. A. G., Defining Control Strategies for
MicroGrids Islanded Operation, IEEE TRANSACTIONS ON
POWER SYSTEMS, MAY 2006.
[11] L.-Y. Liu, M.-C. Tsai, C.-L. Hsu, K.-Y. Lo and Y.-R. Chang, Design
of an Energy Storage Converter for Microgrid Applications, Palermo,
Nov 2015.
[12] Y. Liao, Power Management and Protection of Distribution Systems
with Distributed Generations, AG, Cham: Springer International
Publishing, 2017.
[13] C.-L. Chiang, "Genetic Algorithm for Static Power Economic
Dispatch".2009 WRI World Congress on Computer Science and
Information Engineering.
[14] ABB Group, Energy Storage Modules - ESM, October 12, 2017.

49
[15] C. S. X. and G. H. B., Scheduling of Energy Storage in a Grid-
Connected PV/Battery System via SIMPLORER, TENCON 2009 -
2009 IEEE Region 10 Conference, 22 January 2010.
[16] J.-K. Eom, S.-R. Lee, E.-J. Ha, B.-Y. Choi and C.-Y. Won,
"Economic Dispatch Algorithm Considering Battery Degradation
Characteristic of Energy Storage System with PV System".
[17] "ENGIE," [Online]. Available:
https://www.engieresources.com/index.php.
[18] A. Nawaz, E. Mustafa, N. Saleem, M. I. Khattak, M. Shaf and A.
Malik, SOLVING CONVEX AND NON-CONVEX STATIC AND
DYNAMIC ECONOMIC DISPATCH PROBLEMS USING
HYBRID PARTICLE MULTI-SWARM OPTIMIZATION, vol.
Vol.24 No.4, Tehnički vjesnik, 2017.
[19] C. K, S. N and S. M, "Brent method for Dynamic Economic Dispatch
with Transmission Losses".
[20] X. Liu, M. Ding, J. Han, P. Han and Y. Peng, " Dynamic Economic
Dispatch for Microgrids Including Battery Energy Storage".
[21] C. C. K, S. N and S. M, Dynamic Economic Dispatch by Equal
Embedded Algorithm, 4th International Conference on Electrical and
Computer Engineering, 19-21 December 2006,.

50
VITA
Education
08/2017— 05/2019
Master Student
Department of Electrical and Computer Engineering, University of Kentucky,
Lexington, Kentucky, USA
08/2014—05/2017
Bachelor of Engineering
Department of Electrical and Computer Engineering, University of Kentucky,
Lexington, Kentucky, USA
09/2012—06/2014
Bachelor of Engineering
Electrical Engineering and Automation, China University of Mining an
Technology(CUMT), Xuzhou, Jiangsu. China
Awards
01/2017—05/2017
Dean’s list, University of Kentucky, Lexington, KY, USA