economic inequality in preventive maternal and child ... · much of the deaths of the mother as...
TRANSCRIPT

Economic Inequality in Preventive Maternal and Child Health Care A Study of Rural India
Avishek Hazra*, Debabrata Bera+, Sumit Mazumdar† and Puspita Datta*
International Institute for Population Sciences, Mumbai, India
Abstract: This paper examines inequalities in terms of economic well being in the preventive care of maternal and child health (MCH) in rural India based on a wealth index constructed from available information. The study makes use of the data of District Level Household Survey (DLHS-Round II, 2002-2004) under the Reproductive and Child Health (RCH) project. Frequency distribution and bi-variate analysis depicts the scenario of MCH services of women and children belonging to different economic strata and according to their background characteristics. Multilevel analysis has been carried out to find out the individual as well as community level effect on utilizing preventive health care services. A summary measure of Gini concentration index has been used to capture the variation in the wealth index. The findings reveal that economic well-being status of the household to which women or children belong, plays a crucial role in explaining the variation in service utilization. There is concentration of women deprived to take adequate maternal care amongst the poorest wealth quintile. Inequality in utilization is found to be more pronounced for between groups compared to within the wealth quintiles. The paper notes that factors that can be easily influenced like improved access to facilities, through both supply side initiatives as well as generating social awareness regarding the importance of preventive care, and affordability of the households towards usage of these services needs to be stressed upon in national policies.
Key Words: Inequality; wealth index; maternal and child health; health care utilization
1. Introduction
Equal access to health care has been viewed as one of the prime concern towards ensuring
‘Health for All’. However, in many parts of the developing world, a number of inhibiting
factors prevent such equality in access to and utilization of health care services. Inequality
in health care is considered to have different dimensions, based on an individual’s age,
place of residence, economic ability, ethnicity and gender. Among these domains of
inequality, poverty, manifest in absence or deficient economic power remains as one of
the most powerful barriers towards utilization of health care. Evidence around the world
suggest that, being poor is positively correlated with poorer health status and negative
* Research Fellow, International Institute for Population Sciences, Mumbai-400 088, India. E-mail: avishek. [email protected] + M.Phil. Scholar, International Institute for Population Sciences, Mumbai-400 088, India. E-mail: [email protected] † Junior Research Fellow, International Institute for Population Sciences, Mumbai-400 088, India. E-mail: [email protected] * Research Fellow, International Institute for Population Sciences, Mumbai-400 088, India. E-mail: puspita. [email protected]
2
health outcomes, much of it responsible to poor uptake of preventive, promotive and
curative aspects of health care services by these groups of people belonging to the lower
economic strata. Public provisioning of health care services across the developing world
had provoked questions regarding identifying the proper beneficiaries as the target of
public subsidies and carefully oriented policy measures aimed at ensuring equal access
and use of health services among these disadvantaged population groups.
Women and children among the poor are more vulnerable in terms of access to
health care. In other words, maternal and child health care services are more likely to
demonstrate sharp inequality in utilization. There is a general consensus that maternal
care plays a crucial role in the improvement of women’s reproductive health in
developing countries (Magadi et al. 2000, Bhatia and Cleland 1995, Becker et al. 1993).
Among the reproductive health parameters, antenatal care (ANC) and safe delivery has
important position as these are directly related with maternal mortality, loss of fetus, loss
of infant etc. Antenatal care comprises of routine health check up by a doctor,
consumption of iron supplement and injection of tetanus toxoid vaccine during
pregnancy. Delivery conducted by health professionals (doctor, nurse, auxiliary nurse
midwife and trained Dai) ensures safety of mother as well as the child.
This paper attempts to examine the degree of inequality in utilization of
preventive aspects of maternal and child health in rural India, based on a nationally
representative District Level Household Survey (DLHS) under the Reproductive and
Child Health (RCH) project of the Government of India conducted by the International
Institute for Population Sciences, across the country during 2002-04. Focus has been
given to the preventive aspects in particular, mainly because of the thrust of the recently
launched National Rural Health Mission by the government, along the lines of the
Millennium Development Goals is on reducing inequalities in access to and utilization of
health care, as a part of curbing the incidence of maternal and infant mortality. Since
much of the deaths of the mother as well as her children, during the initial years of life
can be successfully prevented by proper antenatal care, safe delivery practices and proper
immunization of the children against vaccine preventable diseases, presence of significant
inequalities in these domains of service utilization can have far-reaching consequences,
impeding the aforesaid efforts. The exercise is primarily oriented towards identifying the
magnitude of economic inequality among the rural Indian population, based on a wealth
index that has been constructed particularly for the present analysis, as the DLHS-RCH
data do not have any separate variable on income or household expenditure. It has also
3
been tried to examine the possible effects of community and individual level variables on
the utilization of preventive health care, in order to identify any community level
characteristics on inequality, through multi-level analysis. In the later part of the paper
attempt has been made to capture the extent of inequality for each of the elements of
preventive maternal and child health care mentioned earlier, using conventional summary
measures of inequality, like the Gini coefficient.
The paper is arranged as following: the next section provides a background to the
study and brief review of the earlier studies in this area along with a snapshot of the
maternal and child health scenario in India. Section 3 describes the data and the
methodology adopted in the construction of the wealth index, multi-level analysis and
inequality measures. In section 4, the results and answer the objectives of the study has
been given. Conclusion has been drawn in section 5, identifying the possible areas of
policy intervention.
2. Background
The nexus between poverty and ill-health as well as poor uptake of health services has
been well documented in literature. Persistence of inequality in different dimensions of
health care use has been documented between nations and within nations, between
different population groups. In almost all of the studies, economic ability has been
identified as one of the most significant barriers of access to and utilization of health care.
In case of preventive health care, the availability of health facilities does not necessarily
mean creation of demand and utilization (Obermeyer 1993, Basu 1990) suggesting the
overriding importance of access to financial resources towards improving and ensuring
utilization of health care services. Economic accessibility is an important factor in
availing maternal and childcare. Women from affluent households are more likely to avail
themselves of adequate maternal care than from poorer households do. A study in rural
Cote D’ Ivore in the mid- 1980s suggested households in the topmost income quintile was
twice more likely to seek care as a family in the lowest quintile. Similar differences were
also evidenced in immunization coverage in Peru (UNDP 1993). Pro-rich inequalities
favouring the rich with respect to malnutrition were also found in South Africa (Zere &
McIntyre 2003). Wagstaff (2002), in his cross-national comparison of health inequalities,
found poor children in poorer countries are less likely to get immunized or ORT in case
of diarrhoea in spite of increased incidence of diarrhoea among the poorer quintiles.
Another study in Nigeria found that income of the household exerts considerable
4
influence in child survival, particularly in the early years of life and likelihood of a child
getting immunized increase with the economic status of the household (Gage et al. 1997).
In terms of health outcomes, Wagstaff (2000) identified significant inequality in child
mortality in his cross-country study, and opined that unequal access to financial resources
as one of the major barriers impeding access to preventive as well as curative health
services.
In the Indian context, however, there is a dearth of quality studies aiming to
analyze the extent and causes of economic inequality leading to inequality in access and
utilization. The main reason may be attributed to the lack of information regarding
household income or consumption in most of the demographic and health surveys (DHS).
Visaria and Gumber (1998) had attempted to study such inequalities using the National
Sample Survey Data on Morbidity and Treatment of Ailments during 1980s, for the states
of Maharashtra and Gujarat. They found immunization to raise with monthly per capita
consumption expenditure quintiles, with sharp differences among the bottom 30 percent
and topmost 20 percent of the population. Hospitalized deliveries and registration of
mothers for pre and post-natal care were also similarly related. Another study found that
24 percent of the Indians in the poorest quintile did not seek medical care when they were
ill compared to only 9 percent in the richest quintile (Misra et al. 2003). However, the
study found coverage of immunization and antenatal care is much less unequal compared
to curative care, as among the poor 93 percent utilized immunization-related services, 74
percent sought antenatal care and 63 percent for delivery related inpatient stays. A recent
work based on the Indian National Family Health Survey (DHS in India), found full
vaccination rates to be about four times higher in the richest quintile than the poorest, and
observed similar patterns for medical treatment of acute respiratory infections. Probability
of child deaths was also found to be inversely related with household wealth status
(Rutstein & Johnson 2004). For maternal care too, more than three antenatal visits to
health facilities were about four times higher in the richer households.
The major issues that emerge from the review of earlier studies suggest that
inequality in access and utilization of health services is a global phenomenon, and
economic ability is an important determinant of the care-seeking behaviour, particularly
for the poorer households. However there is also some evidence asserting that inequality
is much less in the domains of preventive health care vis-à-vis curative care, with higher
dependence of poorer households for services like maternal health care and immunization
on the publicly provided services, because most of this services, at least on principle, is

5
generally free or charged nominally. The reproductive and child health service is a key
component of the publicly provided basic health services. The National Population Policy
(NPP 2000), National Health Policy (NHP 2002) and recently launched National Rural
Health Mission (NRHM 2005) emphasized enhancing the utilization of health services in
general and reproductive health services in particular among poorer and disadvantageous
segment of the population. The question that naturally arises involves defining the poor
and examining how the poor fare relative to other groups in maternal and child health
care utilization and health outcomes.
2.1 Maternal and Child Health in India
In a developing country like India beset with the problems of maternal morbidity and
mortality, ill health and death among infants and children in large parts of the country,
policy efforts and programmes exist since a long period of time involving various steps of
the government to combat with this deep-rooted problem. District Level Household
Survey (DLHS) under the Reproductive and Child Health (RCH) project is one of them,
directed to supplement evidence of maternal and child health problems, utilization pattern
and quality and competence of service provided.
The maternal and child health (MCH) programme was started in India in the early
60s. In the 1960s and 70s, maternal health services within the programme focused on
antenatal care and the high-risk approach, but nevertheless the level of maternal mortality
remained high in the country until mid-1980s. Maternal health care services in reducing
maternal morbidity and mortality gained prominence since the safe motherhood initiative
of 1987 and following the 1994 Cairo Conference (ICPD). It is believed that good
antenatal care and training of traditional birth attendants to improve their delivery
practices may help in reducing maternal mortality. With an aim to improve health status
of women and children and to reduce maternal morbidity and mortality, Child Survival &
Safe Motherhood (CSSM) programme was launched in India on 20th August 1992. The
CSSM envisaged the package of the following maternal health care: early registration of
pregnancy, at least 3 antenatal check ups, universal coverage with TT vaccine, universal
coverage with IFA tablets, advice on adequate food, nutrition and rest, timely
detection/identification and referral of obstetric/maternal complications, clean deliveries
by trained personnel, promotion of institutional deliveries especially for the women with
obstetric history and risk factors, and birth spacing.
6
In spite of these efforts and programs, maternal and child health situation in the
country has not improve remarkably. Women more specifically rural women, do not
attend to their most common health problems (Hazra et al. 2005). The World Bank report
has rightly remarked that although government programmes in India have gone a long
way in reducing the number of women dying from maternity related causes, the number
of pregnancy related deaths in rural areas in the country are still among the world’s
highest. Therefore, in the present study it is intended to focus on the rural area, for which
the village level information is available in the used dataset.
3. Materials and Methods
3.1 Data
The present paper uses the dataset of District Level Household Survey (DLHS) under the
Reproductive and Child Health (RCH) project (Round 2, 2002-04). The second round of
the survey was carried out in two phases 2002-03 and 2004. A systematic multistage
stratified sampling design was adopted for the purpose of data collection. In total 593
districts of country were surveyed. Information was collected on various indicators
pertaining to RCH that would assist policymakers and programme managers to formulate
and implement the goals set for RCH programmes. There were total five questionnaires:
i) households questionnaire, ii) women’s questionnaire, iii) husband’s questionnaire iv)
village questionnaire and v) health questionnaire. A total of 5,07,622 eligible women
(currently married women ages 15-44 years) were interviewed out of 6,20,107
households.
In District Level Household Survey, every woman who delivered at least one
child in the preceding three years of survey was asked about the type of antenatal care and
place of delivery. The full ANC comprises of at least one TT injection, more than 100
IFA tablets and at least three ANC visits. Safe delivery is defined as either institutional
delivery or home delivery assisted by either Doctor or Nurse or Trained Birth Attendant
(Dai). Information regarding the birth history of each child of a woman was also collected
and information on immunization was collected from women’s latest two birth in the last
three years prior to the survey, for the last two children. The present analysis considers
only the latest birth to minimize the possible error due to recall lapse.

7
3.2 Methodology
Construction of Wealth Index
It is to be noted that, as mentioned earlier, paucity of suitable economic variables in the
national level surveys on health care utilization (apart from the NSS rounds) hampers
meaningful analysis of health inequality in the population. Nevertheless, some methods
have been suggested to study such effects from large scale survey data in the absence of
data on income or expenditure (Rutstein & Johnson 2004, Filmer & Pritchett 2001). In
India, the two rounds of National Family Health Surveys, includes some variables which
can be incorporated in the construction of wealth index. The DLHS-RCH dataset, which is
used in the present analysis, has comparatively lesser scope of analysis of economic status
of households. The information available in the aforesaid dataset are on type of house,
source of drinking water, type of toilet facility, type of fuel used for cooking and source of
lighting. For the present study, the methodology of construction of DHS wealth index
given by Rutstein & Johnson (2004) has been followed. Here it is worth mentioning that
although the dataset that have been used does not include all the household assets and
utility services, instead of using straightforward the conventional standard of living index
(SLI), it will carry more weight if we construct an index that certainly reflects the
economic well-being condition of a household. Nevertheless, the constructed wealth index
should be interpreted with the caution that it does not capture the economic affluence, or
the absence of it, for individual households. It can, at the best, provide an approximation
of the economic well-being and financial capacity of the household. A number of
techniques exist for construction of any index based on individual scores. There are
various ways to assign weighting values to the indicator variables. Ad hoc weights work to
a certain extent, but they are arbitrary with regard to researcher and are difficult to assign
when the wealth ordering is not readily apparent (Rutstein & Johnson op. cit.). Filmer and
Pritchett (2001) recommended using principal component analysis (PCA) to assign the
indicator weights and the same procedure has been used here using the SPSS software,
through the factor analysis procedure. This procedure first standardizes the indicator
variables (calculating z-scores), then the factor coefficient scores (factor loadings) are
calculated. Finally, for each household, the indicator values are multiplied by the loadings
and summed to produce the household’s index value.
In order to find out the differential pattern of utilization of maternal and child
health care services among those belonging to different economic strata, wealth quintiles
have been used. These quintiles are based on the distribution of the household population
8
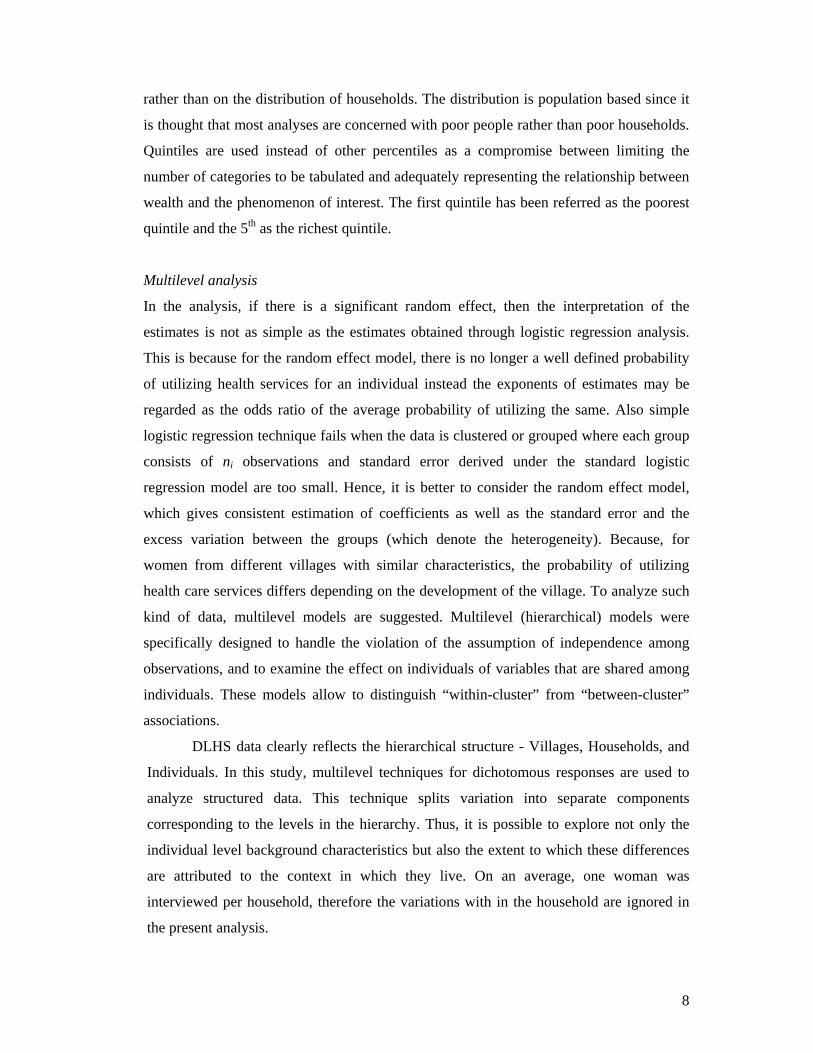
rather than on the distribution of households. The distribution is population based since it
is thought that most analyses are concerned with poor people rather than poor households.
Quintiles are used instead of other percentiles as a compromise between limiting the
number of categories to be tabulated and adequately representing the relationship between
wealth and the phenomenon of interest. The first quintile has been referred as the poorest
quintile and the 5th as the richest quintile.
Multilevel analysis
In the analysis, if there is a significant random effect, then the interpretation of the
estimates is not as simple as the estimates obtained through logistic regression analysis.
This is because for the random effect model, there is no longer a well defined probability
of utilizing health services for an individual instead the exponents of estimates may be
regarded as the odds ratio of the average probability of utilizing the same. Also simple
logistic regression technique fails when the data is clustered or grouped where each group
consists of ni observations and standard error derived under the standard logistic
regression model are too small. Hence, it is better to consider the random effect model,
which gives consistent estimation of coefficients as well as the standard error and the
excess variation between the groups (which denote the heterogeneity). Because, for
women from different villages with similar characteristics, the probability of utilizing
health care services differs depending on the development of the village. To analyze such
kind of data, multilevel models are suggested. Multilevel (hierarchical) models were
specifically designed to handle the violation of the assumption of independence among
observations, and to examine the effect on individuals of variables that are shared among
individuals. These models allow to distinguish “within-cluster” from “between-cluster”
associations.
DLHS data clearly reflects the hierarchical structure - Villages, Households, and
Individuals. In this study, multilevel techniques for dichotomous responses are used to
analyze structured data. This technique splits variation into separate components
corresponding to the levels in the hierarchy. Thus, it is possible to explore not only the
individual level background characteristics but also the extent to which these differences
are attributed to the context in which they live. On an average, one woman was
interviewed per household, therefore the variations with in the household are ignored in
the present analysis.

9
Random effects analysis explains variation between villages, within village
between individuals two level model has been constructed. Random effects also capture
the unobserved factors (variability) that influence at the individual and community level.
Multilevel statistical model used in the present study is:
Yij = Pij + eij
log[ Pij / (1- Pij) ] = βXij +γZj +Uj + eij
Yij denotes the response for individual 'i' in village 'j'
Pij denotes the probability of individual 'i' in village 'j' utilizing the health care services
log[ Pij / (1- Pij) ] denotes logit of the model
Xij and Zj are the vectors of individual level and community level attributes respectively.β
and γ are the vectors of their respective estimated parameter coefficients. Uj and eij are the
random effect, representing unobserved factors operating at the community and
individual levels.
In the multilevel analysis, the individual level variables are first introduced one by
one, in the form of dummy variables, as predictors (of receiving full ANC, preferring for
safe delivery and full immunization) in order to control for homogeneity among women
as well as children both at the household and community levels. Then systematically, the
individual level and community level variables were introduced in to the model. For the
analysis of the data by using multi-level techniques, MLwiN package is used and data is
structured according to the requirement of the package.
Gini Concentration Index
This index measures the distribution of one variable relative to another variable. Gini
concentration ratio measures the proportion of the total area under the diagonal and that
lies in the area between the diagonal and the Lorenz curve. The following formula
expresses the area on the graph contained between the curve and the diagonal as a
proportion of the entire area below the diagonal:
∑ ∑= =
++ −=n
i
n
iiiiii YXYXG
1 111
where Xi and Yi are the respective cumulative proportions of women in different quintiles
and percentages of women utilized the service facilities.

10
4. Results
Utilization of Maternal and Child Health Care in India
The scenario of maternal and child health care utilization in India, as emerging from our
analysis of the DLHS-RCH data, along with its major states are presented in Table 1 and
Table 2. The results depict a very poor utilization of maternal health care services at the
national as well as at the state level. Only around 12 per cent of women have received full
ANC and around 45 per cent of women have taken proper delivery care. Although there
exist a wide interstate variation, in some states like Bihar, Uttar Pradesh, Madhya Pradesh
and Rajasthan (which are referred as Empowered Action Group (EAG) states) very
negligible proportion of women have taken full antenatal care. The most fatal
consequence of improper delivery care in developing countries is high maternal mortality
rate. It is unfortunate that most of the maternal deaths are due to preventable causes of
infection arising form unhygienic conditions and breach presentation at the time of
delivery and eclampsia (Singh and Singh 2005). A safe delivery needs to be conducted by
doctor, nurse and other trained health personnel in order to save the life of both mother
and child. However, the extent of delivery care is also alarming in the aforementioned
states.
The vaccination of children against six serious but preventable diseases
(tuberculosis, diphtheria, pertussis, poliomyelitis and measles) has been an important
intervention in the Child Survival and Safe Motherhood Programme of the Government
of India (Government of India 1994). DLHS asked the mother whether the child had
received a vaccination against tuberculosis (BCG); diphtheria, whooping cough
(pertussis), and tetanus (DPT); poliomyelitis (polio) and measles. For DPT and polio,
information was also collected on the number of doses of vaccine given to the child. The
results indicate that around 26 per cent of children have not received any kind of
vaccination and only around 42 per cent of children have been given all the required
doses of vaccination i.e., full vaccination. The south Indian states perform quite well in
this respect, with around 70 percent of the children on an average completely immunized.
The picture is dismal for the northern and north- eastern states where only 20 to 25 per
cent of children have been fully immunized which explains to a certain extent high
childhood mortality rates in these states.

11
Figure 1. Utilization of maternal and child health services in major States of India
181818N =
Full ImmunizationSafe deliveryFull ANC
Perc
enta
ge
120
100
80
60
40
20
0
10
Box plots have been used for a comprehensive understanding of the maternal and
child health scenario in rural areas of the major Indian states. Box plot is a summary plot
based on the median, quartiles, and extreme values. The box represents the interquartile
range which contains the 50 per cent of values. The whiskers are lines that extend from the
box to the highest and lowest values, excluding outliers. A line across the box indicates
the median. Very low level of utilization of MCH services as well as wide inter-state
variation in all the three health parameters is seen from Figure 1 especially for receiving
full antenatal care.
Economic inequality in health care utilization
It is revealed from the findings that not only the proportion of women receiving full ANC
is very low in India; it varies greatly across different wealth quintiles of women. The
situation of full ANC according to different wealth quintile is given Table 4. Around five
per cent of women belonging to poorest wealth quintile are receiving full antenatal care
against about 30 per cent of women from the richest quintile. In states like Uttar Pradesh,
Bihar, Madhya Pradesh, Rajasthan, only around two per cent of women from the poorest
quintile has received full antenatal care. The corresponding values for Haryana,
Jharkhand and Assam are also lower than the national average.
There exists a vast rich-poor gap in delivery care also. A higher proportion of
women belonging to 4th and 5th quintile reported proper delivery care compared to those
belonging to lower quintiles. Around 77 per cent of women from the richest quintile have

12
delivered their child either at any institution or in home attended by trained birth
personnel, whereas only 27 per cent of women from poorest quintile have taken such
proper delivery care. Similar inter-quintile variation as in case of antenatal care persists in
delivery care too in all the states.
Children from the poorest quintile of the women are more likely of not being fully
immunized in India as a whole, as well as in the major states. Table 5 clearly shows that
around 65 per cent of children from the richest quintile of the women are fully immunized
whereas the percentage of children from the poorest quintile of the women is only about
27 per cent.
Figure 2a. Utilization of maternal and child health services in major States, for all those belonging to poorest quintile
Figure 2b. Utilization of maternal and child health services in major States for all those belonging to richest quintile
181818N =
Poorest quintile
Full ImmunizationSafe DeliveryFull ANC
Per
cent
age
100
80
60
40
20
0
10
181818N =
Richest quintile
Full ImmunizationSafe DeliveryFull ANC
Per
cent
age
120
100
80
60
40
20
0
10
The figures 2a and 2b elaborates the above findings more clearly. The maternal and child
heath care is better if the women and children are belonging to economically well-off
household than those belonging to poorer strata. In all the three parameters of MCH
services, comparatively a higher proportion of women and children from richest quintile
are availing the preventive heath care facilities, than those belonging to poorest quintile.
Bivariate Analysis
We have tried to examine the inequality in having full ANC, safe delivery and full
immunization of the respondents according to select socio-economic and demographic
characteristics. Besides the individual attributes, certain village-level characteristics

13
influencing access to such services like connectivity by all weather road, distance from
nearest town, government and private facility and mobile clinic facilities have been
included. The results have been presented in Table 7 to Table 9.
It appears from the figures that variation in uptake of full ANC is not much among
the quintiles, apart from the topmost one. The village level access factors included in our
analysis, assume importance from the 4th quintile onwards, but it cannot be taken for sure
that whether this access factors were primarily responsible for better use of the services, or
better economic access supplemented improved access in this direction. Insights can be
drawn only after multilevel multivariate exercises in the next section. In the case of safe
delivery, it is a case of inequality at a considerable higher level of service usage. However,
a couple of important points emerge from the analysis. Firstly, difference in usage is quite
sharp as even within groups having better physical access, viz. connected by all weather
roads, or having public health facility within the village for e.g., the topmost quintile
(richest) has nearly three times more incidence of safe delivery compared to the lowest
quintile (poorest). Secondly, for all the physical access parameters, as well as for some of
the socio-cultural factors (caste, religion), the differences between the categories (or
groups of classification) are less than the differences among the wealth quintiles. In other
words, for women in the lowest quintile, proportion having safe delivery does not vary as
much, irrespective of, say, distance from any government facility or caste membership as
it is between the higher wealth quintiles for these characteristics.
Similar unequal pattern can also be observed regarding full immunization. Along
the lines of the established view that education of both the parents positively influences
immunization of children, it can be seen from the table that, inequality is less pronounced
when both the couples are literate. Similar to our earlier observation regarding the
comparative importance of physical and economic access factors, it can be seen for the
case of immunization too, that variation within a quintile for each of these physical access
parameters is much less pronounced compared to the differentials across the wealth
quintiles, capturing economic inequality. For all the selected background variables, a
general pattern of variation in full immunization levels is also noted. From very lo levels
in the first quintile, the levels increase steadily till the third quintile, thereafter it gradually
tends to level off, suggesting the possibility of greater influence of economic ability
towards immunization in the lower wealth quintiles.

14
Multilevel analysis
The results of the multilevel analysis are given in Table 10. It is evident that non-Hindus,
Scheduled Caste / Scheduled Tribes and Other Backward Caste women are less likely to
avail the maternal and child health services compared to their respective counterparts. The
chances of utilizing such facilities increase with the increase in educational status of
couple. If the last child is female, the women are less likely to take proper delivery care
and also the child is less likely to be fully immunized. It is noteworthy to mention here
that such sex differential in preventive care of children that typically persists in India is
one of the leading causes of sex differential in childhood mortality (Singh et al. 2005). For
the women aged more than 30 years, the likelihoods of receiving proper MCH services are
significantly lesser compared to those of below 19 years of age. The economic condition
of the household to which the women belongs is crucial in explaining the significant
differential pattern of heath care utilization. Women from the richest quintile are around
three times more likely to receive such maternal heath care services compare to women
from poorest quintile.
The facilities available in the village are also having notable impact on heath care
utilization even controlling for several socio-economic characteristics. Non-existence of
road for connectivity to town or urban areas and longer distance from nearest town
minimizes the chances of availing such services. As the distance from any Government
health facilities as well as private health facilities increases, women are at lesser chance to
take full antenatal care and proper delivery care. In case of immunization, distance from
private health facilities does not matter at all. Of course if there are mobile clinics in the
village, women as well as children are more likely to be benefited by the services
rendered.
Individuals and community play an important role in their own health. The level
of heterogeneity shows a distinction in the health care utilization behaviour of the Indian
rural women. The random effects particularly at individual level corresponding to village
level shows that there is lot of heterogeneity and unexplained variation within the
communities. The community level effect (village effect) is found to be higher in case of
receiving full ANC than the same for safe delivery and full immunization. This clearly
signifies that receiving full antenatal care is much affected by the community facilities.
Hence the developmental status of any particular village in terms of existence of adequate
health care service facilities is more important than individual behaviour which is not in
the case of safe delivery and full immunization.
15
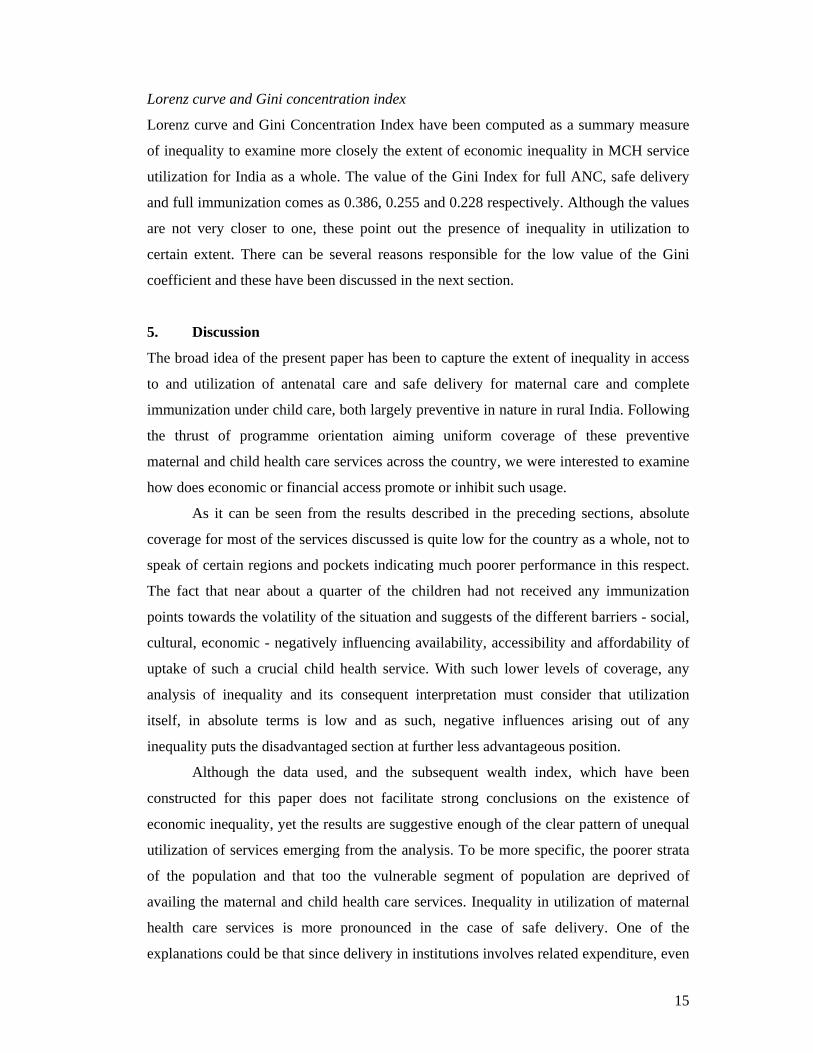
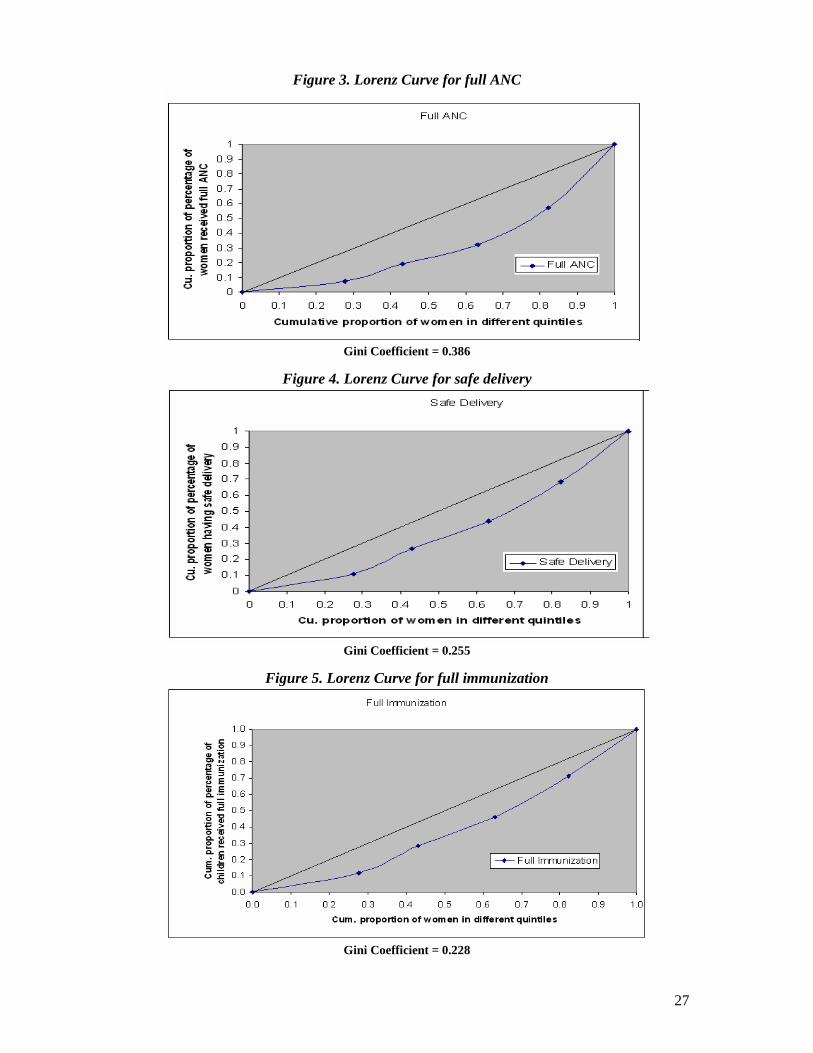
Lorenz curve and Gini concentration index
Lorenz curve and Gini Concentration Index have been computed as a summary measure
of inequality to examine more closely the extent of economic inequality in MCH service
utilization for India as a whole. The value of the Gini Index for full ANC, safe delivery
and full immunization comes as 0.386, 0.255 and 0.228 respectively. Although the values
are not very closer to one, these point out the presence of inequality in utilization to
certain extent. There can be several reasons responsible for the low value of the Gini
coefficient and these have been discussed in the next section.
5. Discussion
The broad idea of the present paper has been to capture the extent of inequality in access
to and utilization of antenatal care and safe delivery for maternal care and complete
immunization under child care, both largely preventive in nature in rural India. Following
the thrust of programme orientation aiming uniform coverage of these preventive
maternal and child health care services across the country, we were interested to examine
how does economic or financial access promote or inhibit such usage.
As it can be seen from the results described in the preceding sections, absolute
coverage for most of the services discussed is quite low for the country as a whole, not to
speak of certain regions and pockets indicating much poorer performance in this respect.
The fact that near about a quarter of the children had not received any immunization
points towards the volatility of the situation and suggests of the different barriers - social,
cultural, economic - negatively influencing availability, accessibility and affordability of
uptake of such a crucial child health service. With such lower levels of coverage, any
analysis of inequality and its consequent interpretation must consider that utilization
itself, in absolute terms is low and as such, negative influences arising out of any
inequality puts the disadvantaged section at further less advantageous position.
Although the data used, and the subsequent wealth index, which have been
constructed for this paper does not facilitate strong conclusions on the existence of
economic inequality, yet the results are suggestive enough of the clear pattern of unequal
utilization of services emerging from the analysis. To be more specific, the poorer strata
of the population and that too the vulnerable segment of population are deprived of
availing the maternal and child health care services. Inequality in utilization of maternal
health care services is more pronounced in the case of safe delivery. One of the
explanations could be that since delivery in institutions involves related expenditure, even

16
in the absence of user charges, a majority of the women from poorer households can opt
for low-cost alternatives. However, given the complex nature of decision-making
regarding the nature of service to be solicited for at delivery, and cumulative barriers of
physical access, social affiliations and other cultural notions that can put the women from
the households in the lower quintiles at lesser chances of utilizing such care, it cannot be
said per se that economic capacity solely governs and responsible for such unequal usage.
Another important finding from the present analysis is the fact that inequality is
far more pronounced between the quintiles, compared to among the different categories
of background attributes that can be thought of influencing service usage. Again, when
the extent of inequality for the physical access variables is considered, low variation in
this respect for women who otherwise enjoy better physical access to the facilities has
been depicted. Taken together, it can be mentioned that economic access possibly plays a
major role in explaining the variation in service utilization.
We have also tried to examine the possible effects of community-level
characteristics vis-à-vis individual factors in explaining the observed variations. The
findings suggest that community level effects were stronger than individual effects in the
case of receiving full ANC than the same for safe delivery and full immunization. The
result suggests that for antenatal care community level factors, mostly involving physical
access parameters like availability of health facility, presence of mobile clinics or better
connectivity with urban centres seems to influence individual decision-making to a larger
extent. On the other hand, for proper care at delivery or immunization individual factors,
including financial access may play a major role than the community characteristics.
In order to examine more closely the extent of economic inequality in MCH
service utilization, the Gini Concentration Index, which have been constructed as a
summary measure of inequality, indicates the presence of such inequality for India as a
whole. There can be several reasons responsible for the low value of the Gini coefficient.
Firstly, India as a unit of analysis is too heterogeneous for application of such summary
index. Substantial variation at the state level within the country, even if limited only in
the rural areas, can be masked when an aggregate measure is computed taking the entire
country as the unit of analysis. Secondly, it is an accepted view that for preventive
services, that too for maternal and child health care, there is considerable reliance on the
public sector by people across the country, cutting across economic classes. As such,
inequality is expected to be less pronounced for these services, compared to curative care.

17
Since most of the services provided at the public sector facilities are free, at least
in principle, and when utilization of such facilities is larger than private sector, economic
reasons does not always play major role in determining the utilization of such facilities.
Lastly, as it is difficult to separate the individual effects of physical, social and economic
access parameters that together leads to service utilization, and such analysis is beyond
the scope of the present exercise. Nevertheless, sufficient indication has emerged
suggesting significant, and in certain cases sharp differentials in usage of MCH services
across economic classes, which we have tried to approximate based on the constructed
wealth index.
The findings of the present study are also suggestive of policy actions in the right
directions. Preventive maternal and child health services, besides being important in its
own right, is also crucial towards attaining favourable health outcomes for the mother and
her child. Utilization of such facilities, in a uniform manner among the different
population groups becomes imperative from such a viewpoint. As seen in the preceding
sections, glaring differences among the population, when segregated based on their
economic well-being, calls for corrective action of such imbalances. Factors that can be
easily influenced like improved access to facilities, through both supply side initiatives as
well as generating social awareness regarding the importance of preventive care, and
affordability of the households towards usage of these services needs to be stressed upon
in national policies.

18
References
Basu, A.M. 1990. “Cultural influences on health care use: Two regional groups in India”, Studies in Family Planning, 21(5): 275-286.
Becker, S., David H. Peters, Ronald H. Gray, Connie Gultiano and Robert E. Black. 1993. “The determinants of use of maternal and child health services in Metro Cebu, the Philippines”, Health Transition Review, 3(1): 77-89.
Bhatia, J. and J. Cleland. 1995. “Determinants of maternal care in a region of South India”, Health Transition Review, 6, supplement: 45-60.
Filmer, D. and L.H. Pritchett. 2001. “Estimating wealth effects without expenditure data or tears: An application to educational enrollments in states of India”, Demography, 38 (1): 115-132.
Gage, A.J., A.E. Sommerfelt, A.L. Piani. 1997. “Household structure and childhood immunization in Niger and Nigeria”, Demography, 34: 295-309.
Government of India. 1994. “National Child Survival and Safe Motherhood Programme”, Maternal and Child Health Division, Department of Family Welfare, Ministry of Health and Family Welfare, New Delhi, India.
Hazra, Avishek, A. Das, P. Datta and D. Bera. 2005. “Maternal Health Scenario in Madhya Pradesh: Experiences, Expectations and Implication for Well-Being”. Paper presented at the National Seminar on Population of Madhya Pradesh during 21-23 February, Bhopal, Madhya Pradesh.
Magadi, M.A., N.J. Madise and R.N. Rodrigues. 2000. “Frequency and timing of antenatal care in Kenya: Explaining variations between women of different communities”, Social Science and Medicine, 5(4): 551-561.
Misra, R., R. Chaterjee and S. Rao. 2003. India Health Report, Oxford University Press: New Delhi.
Obermeyer, C. 1993. “Culture, maternal heath care and women’s status: A comparison of Morocco and Tunisia”, Studies in Family Planning, 24(6): 354-65.
Rutstein, Shea O. and K. Johnson. 2004. “The DHS wealth index”, DHS comparative reports 6, ORC Macro, Maryland, USA.
Singh Abhishek., Avishek Hazra and Faujdar Ram. 2005. “Women’s Autonomy and Sex Differential in Child Mortality in India”. Paper presented in the XXVth conference of the IUSSP held in Tours, France during July 18-23, 2005.
Singh L.L. and C.H. Singh. 2006. “Rich-poor gap in maternal care: A case of Northeast India”, Asian Population Studies,(Forthcoming).
United Nations. 1994. World Development Report 1993: Investing in Health, United Nations: New York.
Visaria P. and A.Gumber. 1998. “Socioeconomic differential in pattern of health care access and utilization” in Dasgupta, M. L.Chen and T.N. Krishnan (eds.) “Health, Poverty and Development in India” Oxford University Press: New Delhi.
Wagstaff, A. 2000. “Socioeconomic inequalities in child mortality: Comparisons across nine developing countries”, Bulletin of the World Health Organization, 78 (1): 19-29.
Wagstaff, A. 2002. “Poverty and health care inequalities”, Bulletin of the World Health Organization, 80 (2).
Zere, E and D. McIntyre. 2003. “Inequities in under-five child malnutrition in South Africa”, International Journal for Equity in Health, 2(7). Accessed online at www.equityhealthj.com/content/2/1/7

19
Table1: Percentage o women taken antenatal and delivery care in India and major States, 2002-04
Antenatal Care Delivery care
Region At least 3
ANC visit At leastone TT Any ANC Full ANC Institu-
tional
Home & assisted by
trained personnel
Safe delivery
India 39.5 76.6 67.5 12.1 29.8 20.8 44.5 Andhra Pradesh 84.2 86.3 93.4 39.3 51.7 42.7 72.4 Assam 33.8 60.3 55.2 6.9 17.1 12.4 27.6 Bihar 13.8 72.6 31.3 3.0 15.9 10.3 24.5 Chhatisgarh 37.7 75.8 75.0 9.2 10.0 29.4 36.5 Gujarat 48.3 82.7 84.9 19.2 41.2 36.7 62.9 Haryana 40.8 84.0 85.6 8.9 27.3 32.7 51.1 Jammu & Kashmir 77.8 81.6 85.6 41.0 68.6 46.8 83.4 Jharkhand 21.0 64.9 42.3 4.6 10.1 9.5 18.7 Karnataka 74.1 83.0 88.9 24.3 45.7 30.5 62.2 Kerala 96.2 95.3 99.6 69.2 97.3 37.9 98.4 Madhya Pradesh 23.4 72.9 69.1 3.1 17.0 22.5 35.7 Maharashtra 62.4 89.2 90.8 21.0 44.2 31.0 61.6 Orissa 37.9 84.6 72.7 11.1 25.2 21.3 41.3 Punjab 59.0 85.8 87.4 13.5 43.0 67.3 81.4 Rajasthan 22.6 63.1 62.0 2.8 22.5 21.1 38.9 Tamil Nadu 92.8 97.4 99.1 20.4 80.0 39.7 88.1 Uttar Pradesh 16.9 66.1 52.7 2.4 16.0 11.1 25.3 West Bengal 55.1 91.1 88.9 10.0 34.7 34.3 57.3

20
Table2. Percentage of children with different type of vaccination in India and major States, 2002-04
Immunization
Regions Polio DPT BCG Measles Any
immunization Full
immunizationIndia 52.5 53.1 70.7 52.4 73.7 41.6 Andhra Pradesh 81.6 77.7 92.4 73.9 94.7 62.0 Assam 26.8 35.1 58.5 35.3 64.5 16.1 Bihar 28.5 29.1 42.2 23.2 43.7 19.3 Chhatisgarh 66.7 66.7 86.5 65.4 88.0 55.5 Gujarat 67.5 64.3 84.8 64.4 88.6 52.3 Haryana 72.5 73.4 82.9 67.6 86.6 59.9 Jammu & Kashmir 52.9 43.6 94.2 84.7 96.3 35.0 Jharkhand 28.1 28.9 42.4 24.6 44.4 19.7 Karnataka 82.1 82.5 91.7 77.5 93.4 71.3 Kerala 88.9 90.2 97.2 89.3 99.1 79.8 Madhya Pradesh 39.7 36.0 69.3 43.9 76.2 24.6 Maharashtra 81.6 89.0 96.0 88.8 97.8 74.1 Orissa 68.5 68.5 89.9 71.1 92.4 55.1 Punjab 81.8 81.8 87.6 78.0 89.5 73.5 Rajasthan 29.9 29.3 55.3 30.0 60.9 18.3 Tamil Nadu 95.8 96.9 98.9 95.8 99.6 91.8 Uttar Pradesh 32.8 33.5 55.5 34.2 58.8 23.8 West Bengal 52.5 68.1 84.9 66.4 88.9 53.7

21
Table 3: Distribution of women in the different wealth quintiles
Wealth index Region 1st quintile 2nd quintile 3rd quintile 4th quintile 5th quintile
India 27.7 15.4 20.1 19.1 17.7 Andhra Pradesh 11.3 13.3 20.6 31.5 23.3 Assam 27.9 6.6 10.5 34.5 20.6 Bihar 50.9 15.7 18.4 6.7 8.3 Chhatisgarh 39.7 31.7 17.4 7.2 3.9 Gujarat 13.8 15.8 18.9 26.0 25.5 Haryana 3.9 12.0 24.3 29.0 30.8 Jharkhand 70.2 13.9 9.2 3.7 3.0 Jammu & Kashmir 11.0 4.7 9.0 21.6 53.8 Karnataka 4.9 10.0 26.0 40.9 18.2 Kerala 2.8 2.9 3.5 14.0 76.8 Madhya Pradesh 34.3 30.9 17.0 9.6 8.3 Maharashtra 16.3 20.6 21.6 23.1 18.4 Orissa 57.3 15.2 12.0 8.2 7.4 Punjab 2.7 10.1 24.8 18.7 43.6 Rajasthan 24.6 14.1 22.5 24.8 14.0 Tamil Nadu 4.3 10.7 24.7 43.1 17.2 Uttar Pradesh 30.4 19.1 32.0 8.3 10.2 West Bengal 48.5 10.7 10.1 17.3 13.4
Table 4: Percentage of women received full ANC according to wealth quintiles
Full ANC Region 1st quintile 2nd quintile 3rd quintile 4th quintile 5th quintile
India 5.3 8.0 9.4 17.5 30.0 Andhra Pradesh 33.0 32.5 35.2 41.3 48.8 Assam 4.7 5.1 5.7 5.4 16.5 Bihar 1.5 2.3 3.8 5.9 10.8 Chhatisgarh 6.6 9.7 10.5 13.4 21.7 Gujarat 12.6 14.9 15.4 17.6 34.0 Haryana 2.8 5.7 6.9 8.2 14.0 Jammu & Kashmir 9.1 23.8 19.7 25.9 54.5 Jharkhand 3.3 6.7 7.4 12.9 15.0 Karnataka 18.2 21.3 19.2 24.4 36.0 Kerala 55.0 56.1 53.0 68.0 71.4 Madhya Pradesh 2.3 2.6 2.8 4.4 8.8 Maharashtra 18.5 15.7 17.2 21.3 34.9 Orissa 8.2 12.3 14.2 18.9 22.7 Punjab 9.4 7.5 9.7 14.2 17.8 Rajasthan 1.7 2.0 1.8 4.1 6.5 Tamil Nadu 18.8 14.8 19.2 19.7 28.6 Uttar Pradesh 1.1 2.0 2.5 4.0 6.1 West Bengal 9.1 8.3 9.8 9.7 17.5

22
Table 5: Percentage of women gone for safe delivery according to wealth quintiles
Safe delivery Region 1st quintile 2nd quintile 3rd quintile 4th quintile 5th quintileIndia 27.2 38.9 41.8 59.8 77.4 Andhra Pradesh 52.4 69.9 69.8 74.2 86.6 Assam 15.2 19.9 23.4 27.5 60.5 Bihar 17.1 26.7 30.2 36.7 52.3 Chhatisgarh 31.4 39.1 33.9 42.9 76.5 Gujarat 42.5 51.9 57.4 69.3 85.3 Haryana 30.6 38.6 45.5 50.8 66.5 Jammu & Kashmir 54.5 65.9 74.7 84.2 89.0 Jharkhand 14.6 24.9 28.4 40.7 51.4 Karnataka 48.0 56.4 52.5 63.2 84.2 Kerala 89.1 96.5 91.3 98.2 99.3 Madhya Pradesh 24.8 32.5 43.3 54.5 74.5 Maharashtra 46.4 53.3 55.6 69.0 86.7 Orissa 33.1 44.4 48.4 61.4 78.0 Punjab 68.3 70.0 72.8 83.6 90.1 Rajasthan 28.7 35.7 36.1 44.1 64.8 Tamil Nadu 83.4 81.9 83.6 90.0 96.6 Uttar Pradesh 18.5 24.1 25.5 32.3 48.5 West Bengal 50.1 58.4 59.7 62.1 83.7
Table 6: Percentage of children (aged 12-35 months) fully immunized according to wealth quintiles
Full immunization Region 1st quintile 2nd quintile 3rd quintile 4th quintile 5th quintileIndia 26.6 37.7 39.9 55.9 65.2 Andhra Pradesh 48.8 60.8 59.5 63.9 70.0 Assam 9.4 10.3 12.1 15.8 34.5 Bihar 12.1 19.0 23.3 37.1 46.7 Chhatisgarh 49.6 53.3 63.6 69.5 75.9 Gujarat 34.9 43.1 43.9 57.0 73.8 Haryana 33.7 45.3 54.5 62.1 75.3 Jammu & Kashmir 13.0 26.9 25.0 34.0 40.2 Jharkhand 14.6 26.7 30.0 45.2 60.0 Karnataka 53.9 61.7 66.5 75.1 81.6 Kerala 77.6 79.7 69.8 80.5 80.2 Madhya Pradesh 19.1 21.1 25.3 38.1 51.5 Maharashtra 67.2 72.3 78.9 75.3 76.4 Orissa 49.2 62.6 56.6 67.4 73.1 Punjab 40.0 63.1 63.0 77.6 83.8 Rajasthan 8.4 15.5 14.2 22.9 45.8 Tamil Nadu 87.0 88.4 91.2 93.1 93.4 Uttar Pradesh 17.0 24.4 24.3 29.0 41.8 West Bengal 48.3 52.3 52.7 64.0 67.5

23
Table 7: Percentage of women received full ANC according to selected background attributes and for different wealth quintiles
Full ANC Back ground variables
1st quintile 2nd quintile 3rd quintile 4th quintile 5th quintile
Religion Hindu 5.5 8.2 9.7 18.7 29.4 Other 4.3 6.6 7.1 12.1 32.8 Caste General 5.3 8.8 9.4 15.4 28.3 OBC 4.4 6.7 7.9 15.3 28.4 SC/ST 5.2 7.0 8.6 13.1 23.3 Couple’s education Both illiterate 3.1 4.6 6.3 10.6 18.2 Anyone literate 5.4 4.7 5.5 6.1 10.6 Both literate 9.7 12.2 12.8 18.1 29.9 Sex of the last child Male 3.8 4.9 6.3 11.1 16.8 Female 4.8 7.3 8.5 14.4 27.3 Age of women at the time of last birth
<=20 3.8 4.9 6.2 11.0 16.8 21-30 5.1 7.6 9.7 15.3 23.5 31 & above 5.5 7.5 8.9 15.2 28.5 Year of last birth <=2000 5.3 7.0 8.6 13.3 24.5 2001-2002 5.0 7.3 8.3 14.8 27.0 2003 or later 4.5 7.1 8.6 15.1 28.9 All weather road Yes 3.3 11.9 26.7 26.1 44.1 No 5.1 7.5 8.6 15.5 27.9 Distance from nearest town
<= 5 km 4.4 6.6 7.6 14.7 30.7 6-10 km 4.2 7.4 8.0 14.3 26.0 11 km & above 5.5 7.3 9.3 14.5 24.5 Distance from any Govt. health facility
Within village 5.9 8.6 9.7 16.2 29.4 <= 5 km 4.6 5.9 7.9 12.8 23.8 6 km & above 3.3 6.3 6.1 10.8 16.4 Distance from any private
health facility Within village 5.0 7.6 8.5 16.2 29.9 <= 5 km 4.6 6.1 8.3 14.0 26.1 6 km & above 5.0 7.5 8.5 13.6 24.9 Mobile clinic for village
No 4.9 7.6 8.8 17.0 31.0 At least one 8.0 10.0 12.1 19.8 27.1

24
Table 8: Percentage of women gone for safe delivery according to selected background attributes and for different wealth quintiles
Safe delivery Back ground variables 1st quintile 2nd quintile 3rd quintile 4th quintile 5th quintileReligion Hindu 27.5 39.2 42.4 62.2 78.0 Other 25.6 36.8 37.8 48.5 75.9 Caste General 30.1 42.7 44.8 55.4 78.5 OBC 26.0 37.9 40.5 60.3 77.2 SC/ST 24.6 34.6 38.3 49.8 67.1 Couple’s education Both illiterate 19.8 27.7 31.0 39.6 49.8 any one literate 26.0 34.0 35.3 46.8 57.3 Both literate 40.9 52.4 53.8 65.0 80.8 Sex of the last child Male 30.6 39.6 44.9 59.1 69.7 Female 26.4 37.3 39.9 54.3 74.2 Age of women at the time of last birth <=20 30.6 42.2 45.9 58.6 74.5 21-30 25.3 37.0 40.6 55.6 76.4 31 & above 19.4 27.8 29.0 42.2 68.0 Year of last birth <=2000 25.3 36.4 39.3 52.8 72.9 2001-2002 25.8 37.0 39.7 54.4 75.0 2003 or later 26.8 38.3 43.1 58.1 76.5 Pregnancy complication No 5.2 8.2 9.3 17.3 29.1 At least one 5.6 7.5 9.6 18.0 32.7 All weather road Yes 28.1 39.1 42.6 58.2 76.7 No 22.7 33.0 35.3 46.7 67.7 Distance from nearest town <= 5 km 26.0 37.2 41.3 58.1 78.4 6-10 km 24.9 37.4 40.3 56.2 75.5 11 km & above 26.5 37.2 40.4 52.9 72.0 Distance from any Govt. health facility Within village 29.2 40.2 44.4 57.7 77.5 <= 5 km 24.8 36.1 38.7 53.8 72.0 6 & above 20.9 31.7 33.0 44.7 62.5 Distance from any private health facility Within village 27.6 38.3 41.1 56.6 77.6 <= 5 km 26.2 37.7 41.1 59.2 76.6 6 km & above 25.2 36.4 40.0 52.2 71.2 Mobile clinic for village No 26.7 38.1 40.7 58.7 77.2 At least one 31.0 43.4 47.1 64.8 78.2

25
Table 9: Percentage of children (aged 12-35 months) fully immunized according to selected background attributes and for different wealth quintiles
Full immunization Back ground variables 1st quintile 2nd quintile 3rd quintile 4th quintile 5th quintileReligion Hindu 27.5 38.0 40.9 59.6 67.1 Other 20.1 34.5 31.7 38.1 59.7 Caste General 31.4 43.9 43.2 53.2 65.8 OBC 22.6 36.2 36.1 57.0 66.2 SC/ST 27.6 36.0 42.4 56.8 59.9 Couple’s education Both illiterate 19.4 27.2 29.8 44.8 35.9 Any one literate 25.5 33.0 34.2 47.0 45.7 Both literate 46.2 56.2 55.2 65.7 71.5 Sex of the last child Male 27.1 37.4 40.7 55.6 65.5 Female 25.5 37.7 38.2 56.1 64.4 Age of the mother at the time of last birth <=20 29.0 40.5 42.6 56.5 61.1 21-30 26.8 38.5 41.1 57.5 67.5 31 & above 19.6 26.7 25.6 41.8 56.3 Year of last birth <=2000 29.4 37.8 40.1 55.4 64.1 2001-2002 25.7 37.4 38.7 55.7 64.7 2003 or later 21.5 37.3 41.9 57.3 68.9 All weather road Yes 26.4 39.0 40.4 56.9 66.4 No 26.2 34.3 37.3 53.1 59.7 Distance from nearest town <= 5 km 23.3 35.9 37.7 54.3 65.7 6-10 km 24.6 35.5 39.6 57.1 67.6 11 km & above 28.8 39.7 40.8 56.0 62.7 Distance from any Govt. health facility Within village 29.8 40.7 43.0 56.8 67.1 <= 5 km 24.6 35.5 36.9 55.4 62.5 6 km & above 21.3 33.9 35.8 51.5 55.7 Distance from any private health facility Within village 26.3 39.4 38.0 56.0 65.0 <= 5 km 26.6 37.3 38.9 58.6 66.4 6 km & above 26.2 36.4 41.8 53.6 63.7 Mobile clinic for village No 25.3 36.4 38.8 54.6 64.7 At least one 33.8 44.1 43.7 61.6 66.9

Table 10: Results of Multilevel Analysis
Exp B Back ground variables
Antenatal Care Safe Delivery Full ImmunizationReligion Hindu® Other 0.87* 0.89* 0.91*
Caste General® OBC 0.92* 0.88* 0.97*
SC/ST 0.89* 0.76* 0.95*
Couple’s education Both illiterate® any one literate 1.17* 1.23* 1.04*
Both literate 2.06* 2.31* 1.19*
Sex of the last child Male® Female 1.00 0.96* 0.98*
Age of women at the time of last birth
<=20® 21-30 1.05* 0.86* 1.01*
31& above 0.89* 0.74* 0.99*
Year of last birth <=2000® 2001-2002 1.07* 1.08* 0.97*
2003 or later 1.17* 1.16* 0.95*
Wealth index 1st quintile® 2nd quintile 1.26* 1.31* 1.05*
3rd quintile 1.44* 1.45* 1.06*
4th quintile 1.93* 1.96* 1.12*
5th quintile 2.93* 3.51* 1.18*
All weather road Yes® No 0.87* 0.74* 0.95*
Distance from nearest town <= 5 km® 6-10 km 0.92* 0.95* 1.02*
11 km & above 0.89* 0.91* 1.01*
Distance from any Govt. health facility
Within village® <= 5 km 0.74* 0.76* 0.97*
6 km & above 0.61 0.66* 0.94*
Distance from any private health facility
Within village® <=5 km 0.89* 0.94* 1.01 6 km & above 0.93* 0.88* 0.99 Mobile clinic for village No® At least one 1.11* 1.16* 1.04*
Constant -2.626 -0.511 0.368 Village effect 1.476 0.812 0.072 Individual effect 1.000 1.000 0.141
® indicates reference category; * p < 0.01
27
Figure 3. Lorenz Curve for full ANC
Gini Coefficient = 0.386
Figure 4. Lorenz Curve for safe delivery
Gini Coefficient = 0.255
Figure 5. Lorenz Curve for full immunization
Gini Coefficient = 0.228