economic digest - ct. · pdf fileaugust 1998 the connecticut economic digest ... (68.2%)...
TRANSCRIPT

August 1998 THE CONNECTICUT ECONOMIC DIGEST ●●●●●
Distribution Of Employed Persons By Occupation
0%
5%
10%
15%
20%
Manag
erial
Profes
siona
l
Tech
nician
sSale
s
Adm. S
uppo
rt
Service
Produc
tion
Mach.
Operat
ors
Trans
porta
tion
Labo
rers
1986 1996
ECONOMIC DIGESTVVVVVol.3 No.8ol.3 No.8ol.3 No.8ol.3 No.8ol.3 No.8
●●●●●●●●●●
A joint publication of the Connecticut Department of Labor & the Connecticut Department of Economic and Community Development A joint publication of the Connecticut Department of Labor & the Connecticut Department of Economic and Community Development A joint publication of the Connecticut Department of Labor & the Connecticut Department of Economic and Community Development A joint publication of the Connecticut Department of Labor & the Connecticut Department of Economic and Community Development A joint publication of the Connecticut Department of Labor & the Connecticut Department of Economic and Community Development
THE CONNECTICUT
AUGUST 1998
IN THIS ISSUE
■■■■■ Characteristics on Con-Characteristics on Con-Characteristics on Con-Characteristics on Con-Characteristics on Con-necticut workforce arenecticut workforce arenecticut workforce arenecticut workforce arenecticut workforce areprofiled. (article, pp.1-4)profiled. (article, pp.1-4)profiled. (article, pp.1-4)profiled. (article, pp.1-4)profiled. (article, pp.1-4)
■■■■■ Industry clusters: Bio-techIndustry clusters: Bio-techIndustry clusters: Bio-techIndustry clusters: Bio-techIndustry clusters: Bio-techcluster advances. (p.3)cluster advances. (p.3)cluster advances. (p.3)cluster advances. (p.3)cluster advances. (p.3)
■■■■■ June's employment: up byJune's employment: up byJune's employment: up byJune's employment: up byJune's employment: up by3,200 from Ma3,200 from Ma3,200 from Ma3,200 from Ma3,200 from Mayyyyy, and up b, and up b, and up b, and up b, and up byyyyy33,900 from a year ago. (p.6)33,900 from a year ago. (p.6)33,900 from a year ago. (p.6)33,900 from a year ago. (p.6)33,900 from a year ago. (p.6)
■■■■■ The unemployment rateThe unemployment rateThe unemployment rateThe unemployment rateThe unemployment ratestayed at 3.8 percent fromstayed at 3.8 percent fromstayed at 3.8 percent fromstayed at 3.8 percent fromstayed at 3.8 percent fromMaMaMaMaMayyyyy, and w, and w, and w, and w, and was beloas beloas beloas beloas below lastw lastw lastw lastw lastyear's 5.2 percent. (p.6)year's 5.2 percent. (p.6)year's 5.2 percent. (p.6)year's 5.2 percent. (p.6)year's 5.2 percent. (p.6)
■■■■■ Housing permits throughHousing permits throughHousing permits throughHousing permits throughHousing permits throughJune were up 15.1 percentJune were up 15.1 percentJune were up 15.1 percentJune were up 15.1 percentJune were up 15.1 percentfrom the same period lastfrom the same period lastfrom the same period lastfrom the same period lastfrom the same period lastyyyyyearearearearear..... (p (p (p (p (p.7).7).7).7).7)
■■■■■ Personal income is fore-Personal income is fore-Personal income is fore-Personal income is fore-Personal income is fore-casted to grow 6.1 percentcasted to grow 6.1 percentcasted to grow 6.1 percentcasted to grow 6.1 percentcasted to grow 6.1 percentin the fourth quarter fromin the fourth quarter fromin the fourth quarter fromin the fourth quarter fromin the fourth quarter fromlast ylast ylast ylast ylast yearearearearear..... (p (p (p (p (p.6).6).6).6).6)
By J. Charles Joo, Research Analyst
very year, the U.S. Bureauof Labor Statistics (BLS)EEEEE
THE CONNECTICUT ECONOMIC DIGEST
Industry ClustersIndustry ClustersIndustry ClustersIndustry ClustersIndustry Clusters ................................................................................................................... 33333Housing UpdateHousing UpdateHousing UpdateHousing UpdateHousing Update ............................................................................................................................. 33333Leading & Coincident Indicators 5Leading & Coincident Indicators 5Leading & Coincident Indicators 5Leading & Coincident Indicators 5Leading & Coincident Indicators 5Economic IndicatorsEconomic IndicatorsEconomic IndicatorsEconomic IndicatorsEconomic Indicators ................................................................................ 6-86-86-86-86-8Comparative Regional DataComparative Regional DataComparative Regional DataComparative Regional DataComparative Regional Data ........................................ 99999Economic Indicator Economic Indicator Economic Indicator Economic Indicator Economic Indicator TTTTTrendsrendsrendsrendsrends .......... 10-1310-1310-1310-1310-13Nonfarm Empl. EstimatesNonfarm Empl. EstimatesNonfarm Empl. EstimatesNonfarm Empl. EstimatesNonfarm Empl. Estimates ......................... 14-1914-1914-1914-1914-19Labor Force EstimatesLabor Force EstimatesLabor Force EstimatesLabor Force EstimatesLabor Force Estimates ...................................................................... 2020202020Hours and EarningsHours and EarningsHours and EarningsHours and EarningsHours and Earnings .......................................................................................... 2121212121Housing PHousing PHousing PHousing PHousing Pererererermit Activitymit Activitymit Activitymit Activitymit Activity ........................................ 21-2221-2221-2221-2221-22TTTTTechnical Notesechnical Notesechnical Notesechnical Notesechnical Notes ........................................................................................................................ 2323232323At a GlanceAt a GlanceAt a GlanceAt a GlanceAt a Glance ........................................................................................................................................................... 2424242424
Profiles Of The Workforce,1986 And 1996
provides a great deal of detaileddata on the characteristics ofConnecticut’s workforce in thepublication called GeographicProfile of Employment and Unem-ployment, which is based onannual average data from theCurrent Population Survey (CPS).Below are some of the findings for1996, the latest year available,along with some comparisons fromten years earlier.
Connecticut WConnecticut WConnecticut WConnecticut WConnecticut Workfororkfororkfororkfororkforcecececece In 1996, nearly seven of everyten (68.2%) Connecticut residents,16 years and older, participated inthe labor force. By comparison,the U.S. and New England laborforce participation rates wereslightly lower at 66.8% and 68.1%,respectively. While this was anincrease for the nation (from65.3%) and New England (from
68.0%) since 1986, Connecticut’sparticipation rate actually fell from69.9% a decade earlier. As the chart below shows, thelargest portion of the workforce in1986, was employed in the admin-istrative support (including clerical)occupational group, making up17.3% of all workers. Ten yearslater, however, this shifted to17.7% of the total employedpersons working in the executive,administrative, and managerialoccupational group. The profes-sional specialty category saw anincrease in its job share from14.9% to 17.6% between 1986 and1996. Other occupational groupswith increases in employmentshare included technicians andrelated support, and service. Thosewith a decline in employmentshare between the two periodswere administrative support (includ-ing clerical); precision production,craft, and repair; and operators,

August 1998THE CONNECTICUT ECONOMIC DIGEST●●●●●
Employment, 1996
0
200
400
600
800
1,000
Men WomenT
hous
ands
Full-time Part-time
50%
60%
70%
80%
Men Women
Labor Force Participation Rate
1986 1996
ConnecticutDepartment of Labor
THE CONNECTICUT
The Connecticut Economic Digest The Connecticut Economic Digest The Connecticut Economic Digest The Connecticut Economic Digest The Connecticut Economic Digest ispublished monthly by the ConnecticutDepartment of Labor, Office of Research andthe Connecticut Department of Economic andCommunity Development, Public andGovernment Relations Division. Its purpose isto regularly provide users with a compre-hensive source for the most current, up-to-datedata available on the workforce and economyof the state, within perspectives of the regionand nation.
The views expressed by authors are theirsalone and do not necessarily reflect those ofthe Departments of Labor or Economic andCommunity Development.
To receive this publication free of charge writeto: The Connecticut Economic DigestThe Connecticut Economic DigestThe Connecticut Economic DigestThe Connecticut Economic DigestThe Connecticut Economic Digest,Connecticut Department of Labor, Office ofResearch, 200 Folly Brook Boulevard,Wethersfield, CT 06109-1114; or call: (860)566-7823. Current subscribers who do not wishto continue receiving the publication or whohave a change of address are asked to fill outthe information on the back cover and return itto the above address.
Contributing DOL Staff:Contributing DOL Staff:Contributing DOL Staff:Contributing DOL Staff:Contributing DOL Staff: Salvatore DiPillo,Lincoln S. Dyer, Arthur Famiglietti, NoreenPassardi and Joseph Slepski. ManagingManagingManagingManagingManagingEditor:Editor:Editor:Editor:Editor: J. Charles Joo. Contributing DECD Contributing DECD Contributing DECD Contributing DECD Contributing DECDStaff:Staff:Staff:Staff:Staff: Todd Bentsen, Kolie Chang and MarkPrisloe. We would also like to thank ourassociates at the Connecticut Center forEconomic Analysis, University of Connecticut,for their contributions to the Digest.
ECONOMIC DIGEST
James F. Abromaitis, CommissionerRita Zangari, Deputy Commissioner
Public and Government Relations DivisionResearch Unit505 Hudson StreetHartford, CT 06106-2502Phone: (860) 270-8165Fax: (860) 270-8188E-Mail: [email protected]
Connecticut Departmentof Economic andCommunity Development
James P. Butler, CommissionerWilliam R. Bellotti, Deputy CommissionerJean E. Zurbrigen, Deputy Commissioner
Roger F. Therrien, DirectorOffice of Research200 Folly Brook BoulevardWethersfield, CT 06109-1114Phone: (860) 566-7823Fax: (860) 566-7963E-Mail: [email protected]
RESEARCH
DECD
22222
fabricators, and laborers. Thissupports the common belief thattoday’s economy is movingtoward hiring more educatedand highly skilled workers,while persons with less educa-tion and skill are facing morelimited job prospects. The data further confirmthat Connecticut workersshifted from manufacturingjobs to service jobs over thedecade, as the percentage ofworkers in manufacturingdeclined from 26.2% to 17.7%.The services industries nowemploy more than one of everyfour workers (27% in 1996), whilenearly the same percentage ofworkers can be found in wholesaleand retail trade (17.3%) as inmanufacturing.
Women In The Workforce From 1986 to 1996, the compo-sition of Connecticut’s labor forcehas changed as women haveentered the workforce in increasingnumbers. Chart below shows that
their participation rate increasedfrom 60.8% in 1986 to 62.5% in1996 as a consequence of socioeco-nomic changes such as the rise ofsingle-parent households and thedecline in buying power over thelast decade. By contrast, men’sparticipation rate decreased from80.0% to 74.5% over the sameperiod. As more women entered thelabor force, many were drawn topart-time jobs. In 1996, almostone third (31.1%) of workingfemales worked part time, whilethis was the case for only 11.8% of
men (chart below). About 36% ofthe women cited seasonal work,
job started or ended, own illness,child-care problems, other familyor personal obligations, labordispute, in school or training, andcivic or military duty as reasonsfor working part time. Manywomen worked in the services andtrade sectors, where part-timepositions are plentiful. In 1996,more than a third of womenworked in the services industry,and almost 17% in the tradesector. For men, despite theoverall decline, almost one in four
were still employed inmanufacturing in 1996. Although manywomen still worked inthe administrative sup-port (including clerical)and service occupationsin 1996, nearly one infive females also workedin the professional field,which was a higherproportion than men inthe same field. Even
more women were employed inmanagement positions than previ-ously, rising in employment sharefrom 11.6% in 1986 to 16.2% in1996, as their share in the salesand administrative support occupa-tions declined. A greater propor-tion of women workers enteredtechnical fields than ten yearsearlier as well, as men’s share inthat field actually declined over thesame time.
A Diverse Workforce Blacks and Hispanics nowmake up a larger share of the

August 1998 THE CONNECTICUT ECONOMIC DIGEST ●●●●●
The emergence of this cluster isa prime example of the clusterconcept: groups of industriesthat create products or servicesrelated by a common technol-ogy, market, or need, and thefirms that support them.
Connecticut offers proximity tothree major research centerscritical to biotech. Yale, espe-cially its Medical Center, is oneof the top-funded researchinstitutions in the U.S. TheUniversity of Connecticut HealthCenter and its Schools of Medi-cine and Dental Medicine inFarmington plus the Storrscampus receive total researchfunding in excess of $112million per year. Potential existsat Avery Point and Stamford.
As home to four major pharma-ceutical companies, namely,Bayer, Pfizer, Bristol MyersSquibb, and BoehringerIngelheim, Connecticut is alsothe headquarters of several newand established bio-technologyfirms: Alexion, CuraGen,Genaissance, Image ContentTechnologies, Institute forPharmaceutical Discovery,Neurogen, Protein SciencesCorporation, Sea-Free FishCompany, Vion Pharmaceuti-cals, and Xicon Technologies.Employment in SIC 283 (phar-maceuticals) and SIC 384(medical devices) now tops17,000.
Another example of thiscluster’s strength is the public-private partnership with Pfizer.A $216 million investment byPfizer in new laboratory/officespace in New London will createabout 2,000 new jobs. n
For morFor morFor morFor morFor more infore infore infore infore information on housing permation on housing permation on housing permation on housing permation on housing permits, see tables on pages 21-22.mits, see tables on pages 21-22.mits, see tables on pages 21-22.mits, see tables on pages 21-22.mits, see tables on pages 21-22.
ommissioner James F.Abromaitis of the Connecticut
June Housing Permits Up 35.8%CCCCC
33333
HOUSING UPDATE
Bio-Tech Cluster Advancesiotechnology is a growthindustry in Connecticut.BBBBB
Industry Clusters
(Continued On Page 4)
working-age population than theydid ten years ago. They consti-tuted 6% and 3%, respectively, ofthe total labor force in 1986. By1996, the figures had grown to10% for blacks and 5% for Hispan-ics. The number of whites in thelabor force, on the other hand,shrank from 93% in 1986 to 88%in 1996 (detail for race and His-panic-origin groups will not add tototals because data for the “other
races” group are not presented andHispanics are included in both thewhite and black populationgroups). These figures show thatminorities have undoubtedlybecome a significant part of State’sworkforce. Indeed, the number ofblacks and Hispanics working fulltime grew dramatically, by almost50% each over the decade, whilethe number working part-timedoubled.
Labor Force CompositionLabor Force CompositionLabor Force CompositionLabor Force CompositionLabor Force Composition
1986
White
93%
Non-
white
7%
Department of Economic andCommunity Development an-nounced that Connecticut com-munities authorized 1,203 newhousing units in June 1998, a35.8 percent increase compared toJune of 1997 when 886 wereauthorized. The Department further indi-cated that the 1,203 units permit-ted in June 1998 represent anincrease of 14.4 percent from the1,051 units permitted in May1998. The year-to-date permitsare up 15.1 percent, from 4,616through June 1997, to 5,313through June 1998. “The 15 percent increasethrough the first half of 1998 isencouraging, especially comingafter a 1997 that recorded the
highest permit growth in nearly adecade,” Abromaitis said.“Homebuilding is one of theanchors of our economy, and thehousing sector continues to showgreat strength.” Reports from municipal officialsthroughout the state indicate thatTolland County with 161.7 percentshowed the greatest percentageincrease in June compared to thesame month a year ago. FairfieldCounty followed with a 135.3percent increase. Fairfield County documentedthe largest number of new, autho-rized units in June with 353.Hartford County followed with 277units and New Haven County had179 units. Danbury led all Con-necticut communities with 120units, followed by Ellington with64 and Newtown with 49. n
1996
Non-white12%
White88%

August 1998THE CONNECTICUT ECONOMIC DIGEST●●●●●
Connecticut Workforce Summary: 1986 and 1996Population Group Population (000) Labor Force (000) Employment (000) Unempl. Rate (%)
1986 1996 1986 1996 1986 1996 1986 1996Total 2,490 2,521 1,740 1,720 1,674 1,621 3.8 5.7 Men 1,183 1,199 946 894 912 842 3.5 5.7 Women 1,307 1,322 794 826 762 779 4.1 5.7 Both sexes, 16 to 19 years 181 183 116 95 106 78 8.9 17.3
White 2,341 2,225 1,623 1,507 1,565 1,436 3.6 4.7 Men 1,109 1,065 882 794 852 755 3.4 4.9 Women 1,232 1,161 742 713 713 681 3.9 4.6 Both sexes, 16 to 19 years 170 152 111 82 102 70 7.8 14.3
Black 136 259 105 184 99 158 6.3 14.4 Men 68 114 59 84 55 72 6.0 14.7 Women 68 145 47 100 44 86 6.7 14.2
Hispanic origin 87 151 59 96 52 80 10.7 17.3
44444
In 1986, the managerial andprofessional fields employed thegreatest percentage of whites,while the largest percentage ofblacks held jobs in the administra-tive support, including clericalcategory. But a decade later,greater proportions of blacks wereworking in service occupations,and their share of workers in themanagerial and professionalspecialty group was on the in-crease. The number of Hispanicswho worked in the precisionproduction field fell dramaticallyfrom 17.1% in 1986 to 6.8% in1996. They also moved in greaternumbers to service and profes-sional jobs. In fact,a higher proportionof Hispanic thanblack workers wasemployed in theprofessional field in1996.
Involuntary Part-Timers Connecticut hada total of 40,000involuntary part-time workers in1996. These arepersons who workpart time for economic reasonswhich include: slack work orunfavorable business conditions,inability to find full-time work, andseasonal declines in demand. Menhad a larger share of involuntarypart-time workers (17.2%) thanwomen did (9.1%) in 1996. Almostone in four (22.6%) blacks workedas involuntary part-timers, whilethis was the case for 16.7% ofthose of Hispanic origin. Amongwhites, 10.4% said they had towork part time involuntarily.
Hours Of Work In 1996, out of those whousually worked full time, thebiggest reason for working lessthan 35 hours a week was due toweather-related curtailments(32%). For workers who usuallyworked part time, the major factorfor working less than 35 hours was
attributed to other family orpersonal obligations (28%). Thiswas especially the case for women(37%), whereas four out of everyten men said that being in schoolor training caused them to workless hours. For those not at work,over half of the persons with a jobsaid they were on vacation at thetime of the survey. About 23%cited their own illnesses as reasonfor not being at work in 1996.
Unemployment Any comparison of unemploy-ment in the years 1986 and 1996needs to consider the difference ineconomic conditions in the two
years. In 1986, Connecticut wasin the midst of an economic boom.The State had a very low unem-ployment rate of 3.8%, comparedto 5.7% in 1996. Unemploymentrates were higher in 1996 than in1986 among all population groups.Joblessness for blacks was 14.4%in 1996, compared with 6.3% in1986. The Hispanic labor forcehad 17.3% who were unemployed,up from 10.7% in 1986. Whitewomen experienced the lowest rateof 4.6% in 1996; white men hadthe lowest rate, 3.4%, ten yearsearlier. Those who involuntarily lostjobs made up over half (52.7%) ofthe total number of unemployedpersons in 1996. Reentrants, whopreviously worked but were out ofthe labor force prior to beginningtheir job search, made up 30.5% ofthe total unemployed. The biggest
change that occurred between1986 and 1996 was a significantdecline in the proportion of volun-tary job leavers, from 20.4% to9.7%, suggesting a much tighterjob market and less job security in1996 than in 1986. In 1986, almost half (46.9%) ofthe total unemployed experiencedjobless spells lasting less than 5weeks. In contrast, despite therecovery from the recession of theearly ’90s, the 1996 unemploy-ment rate was significantly higherat 5.7%. That translated to only athird (30.6%) being unemployed forless than 5 weeks. About 23.5%remained unemployed for more
than 15 weeks in 1986, whereaspeople in this category represented36.6% of the unemployed in 1996.Of these long-term unemployed,18.8% were without a job for morethan 27 weeks, compared to 13.6%back in 1986. Moreover, one outof every ten unemployed personsin 1996 had been looking for a jobfor over a year.
The above shows just some ofthe many findings on characteris-tics of the labor force publishedannually in Geographic Profile ofEmployment and Unemployment.This publication is available fromthe Bureau of Labor StatisticsPublication Center in Chicago,phone number: (312) 353-1880.The 1996 annual averages arecontained in the most recentedition, Bulletin 2498. n

August 1998 THE CONNECTICUT ECONOMIC DIGEST ●●●●●
20
40
60
80
100
120
70 72 74 76 78 80 82 84 86 88 90 92 94 96 9875
80
85
90
95
100
105
70 72 74 76 78 80 82 84 86 88 90 92 94 96 98
Peak02/89
Trough10/71
Peak12/69
Peak05/74
Trough09/75
Peak03/80
Trough01/83
Trough06/92
LEADING AND COINCIDENT INDICATORSCOINCIDENT INDEXCOINCIDENT INDEXCOINCIDENT INDEXCOINCIDENT INDEXCOINCIDENT INDEX
Source:Source:Source:Source:Source: Connecticut Center f Connecticut Center f Connecticut Center f Connecticut Center f Connecticut Center for Economic Analysisor Economic Analysisor Economic Analysisor Economic Analysisor Economic Analysis, Univ, Univ, Univ, Univ, University of Connecticut.ersity of Connecticut.ersity of Connecticut.ersity of Connecticut.ersity of Connecticut. De De De De Devvvvveloped beloped beloped beloped beloped by Py Py Py Py Pami Dua [(203) 461-6644,ami Dua [(203) 461-6644,ami Dua [(203) 461-6644,ami Dua [(203) 461-6644,ami Dua [(203) 461-6644,Stamford Campus (on leave)] and Stephen M. Miller [(860) 486-3853, Storrs Campus]. Kathryn E. Parr [(860) 486-0485, StorrsStamford Campus (on leave)] and Stephen M. Miller [(860) 486-3853, Storrs Campus]. Kathryn E. Parr [(860) 486-0485, StorrsStamford Campus (on leave)] and Stephen M. Miller [(860) 486-3853, Storrs Campus]. Kathryn E. Parr [(860) 486-0485, StorrsStamford Campus (on leave)] and Stephen M. Miller [(860) 486-3853, Storrs Campus]. Kathryn E. Parr [(860) 486-0485, StorrsStamford Campus (on leave)] and Stephen M. Miller [(860) 486-3853, Storrs Campus]. Kathryn E. Parr [(860) 486-0485, StorrsCampus] provided research support.Campus] provided research support.Campus] provided research support.Campus] provided research support.Campus] provided research support.
The distance from peak to trough, indicated by the shaded areas, measures the duration of an employment cycle recession. The vertical scale inboth charts is an index with 1987=100.
Connecticut Economy Continues ToThrow A Party!
ast month, we reported inthis space that "warningLLLLL
55555
flags may be flying from theConnecticut coincident and leadingemployment indexes.” Sincemonth-by-month movements ineconomic data are noisy, we alsoindicated that “the warning may bea false alarm and not a sign of badthings to come.” This month’s dataprovide a vote against thesewarning flags and a vote forcontinued expansion. That is, boththe coincident and leading employ-ment indexes reached new peaksin the current expansion with therelease of (preliminary) May data. The Connecticut coincidentemployment index, a barometer ofcurrent employment activity, lastreached its current level in Sep-tember 1990. Connecticut’s lead-ing employment index, a barom-eter of future employment activity,last reached its current level inAugust 1989. Non-farm employ-ment, one of the components ofthe coincident index, has returnedto its February 1990 level onseveral occasions in recent months
and currently falls only 37,000below its previous peak in Febru-ary 1989. The unemployment rate,another component of the coinci-dent index, last reached 3.8percent, its level in three recentmonths including May, in August1989. In other words, the economyhas returned to an overall condi-tion last experienced in the late1980s, but without the seriousimbalances and excesses associ-ated with that period. As the state economy throws aparty, some regions have not yetfully participated in it. Of the fivelarge cities, only Stamford hasseen the good times roll. Bridge-port, Hartford, New Haven, andWaterbury have lagged behind inthe current recovery. Moreover, thecities in Connecticut are muchsmaller geographic areas than isthe norm in rest of the nation,which tends to concentrate re-ported inner-city problems.Connecticut’s long-term futurecannot ignore the fate of the innercities. While growth in the stateeconomy offers help for the inner
cities, this growth cannot fullyaddress the economic problemsthat they face. Public policy mak-ers, civic leaders, and the citizensof Connecticut need to consideradditional remedies. In summary, the coincidentemployment index rose from 88.2in May 1997 to 95.2 in May 1998.All four index components con-tinue to point in a positive direc-tion on a year-over-year basis withhigher nonfarm employment,higher total employment, a lowerinsured unemployment rate, and alower total unemployment rate. The leading employment indexrose from 89.9 in May 1997 to92.3 in May 1998. All five indexcomponents sent positive signalson a year-over-year basis with alower short-duration (less than 15weeks) unemployment rate, lowerinitial claims for unemploymentinsurance, higher Hartford help-wanted advertising, higher totalhousing permits, and a longeraverage work week of manufactur-ing production workers. n
LEADING INDEXLEADING INDEXLEADING INDEXLEADING INDEXLEADING INDEX

August 1998THE CONNECTICUT ECONOMIC DIGEST●●●●●
EMPLOEMPLOEMPLOEMPLOEMPLOYMENT BY MAJOR INDUSTRYMENT BY MAJOR INDUSTRYMENT BY MAJOR INDUSTRYMENT BY MAJOR INDUSTRYMENT BY MAJOR INDUSTRY DIVISIONY DIVISIONY DIVISIONY DIVISIONY DIVISION
INCOME (Quarterly)INCOME (Quarterly)INCOME (Quarterly)INCOME (Quarterly)INCOME (Quarterly)
Labor force continued to
decline as the number of
unemployed persons fell
over the year. June's initial
claims data and insured
unemployment rate were
below last year's levels
also.
UNEMPLOYMENTUNEMPLOYMENTUNEMPLOYMENTUNEMPLOYMENTUNEMPLOYMENT
Both the average weekly
production worker hours
and hourly earnings rose
from a year ago. Output
also increased over the
year.
MANUFMANUFMANUFMANUFMANUFAAAAACTURING ACTURING ACTURING ACTURING ACTURING ACTIVITYCTIVITYCTIVITYCTIVITYCTIVITY
ECONOMIC INDICATORS OF EMPLOYMENT
Total nonfarm employment
increased by 33,900 over
the year, or 2.1 percent.
The manufacturing sector
added 400 jobs from
last year.
Personal income for fourth
quarter 1998 is forecasted
to increase 6.1 percent
from a year ago. The
wages component is
expected to grow 7.7
percent.
66666
Source: Connecticut Department of Labor
JUN JUN CHANGE MAY(Seasonally adjusted; 000s) 1998 1997 NO. % 1998TOTAL NONFARM 1,645.0 1,611.1 33.9 2.1 1,641.8 Private Sector 1,418.9 1,386.7 32.2 2.3 1,416.5 Construction and Mining 59.1 57.0 2.1 3.7 59.8 Manufacturing 276.6 276.2 0.4 0.1 276.7 Transportation, Public Utilities 76.3 74.7 1.6 2.1 76.7 Wholesale, Retail Trade 358.2 352.7 5.5 1.6 358.8 Finance, Insurance & Real Estate 135.7 130.4 5.3 4.1 135.5 Services 513.0 495.7 17.3 3.5 509.0 Government 226.1 224.4 1.7 0.8 225.3
Sources: Connecticut Department of Labor; The Conference Board
Source: Connecticut Department of Labor*Seasonally adjusted
Source: Bureau of Economic Analysis: July 1998 release*Forecasted by Connecticut Department of Labor
JUN JUN CHANGE MAY(Seasonally adjusted) 1998 1997 NO. % 1998Unemployment Rate, resident (%) 3.8 5.2 -1.4 --- 3.8Labor Force, resident (000s) 1,717.8 1,721.7 -3.9 -0.2 1,721.1 Employed (000s) 1,652.7 1,632.2 20.5 1.3 1,655.8 Unemployed (000s) 65.1 89.5 -24.4 -27.3 65.3Average Weekly Initial Claims 4,093 4,100 -7 -0.2 3,677Help Wanted Index -- Htfd. (1987=100) 39 38 1 2.6 40Avg. Insured Unemp. Rate (%) 1.84 2.22 -0.38 --- 2.16
JUN JUN CHANGE MAY(Not seasonally adjusted) 1998 1997 NO. % 1998Average Weekly Hours 43.1 42.5 0.6 1.4 42.9Average Hourly Earnings $14.81 $14.38 $0.43 3.0 $14.75Average Weekly Earnings $638.31 $611.15 $27.16 4.4 $632.78Mfg. Output Index (1982=100)* 125.0 120.7 4.3 3.6 124.4 Production Worker Hours (000s) 6,970 6,919 51 0.7 6,883 Productivity Index (1982=100)* 190.5 185.4 5.1 2.8 190.1
(Seasonally adjusted) 4Q* 4Q CHANGE 3Q*(Annualized; $ Millions) 1998 1997 NO. % 1998Personal Income $129,851 $122,410 $7,441 6.1 $128,105UI Covered Wages $69,273 $64,324 $4,949 7.7 $68,309

August 1998 THE CONNECTICUT ECONOMIC DIGEST ●●●●●
TTTTTOURISM AND OURISM AND OURISM AND OURISM AND OURISM AND TRATRATRATRATRAVELVELVELVELVEL
ECONOMIC INDICATORS
BBBBBUSINESS AUSINESS AUSINESS AUSINESS AUSINESS ACTIVITYCTIVITYCTIVITYCTIVITYCTIVITY Air cargo tons for May were up
9.9 percent from the month
before and electricity sales for
March were nearly unchanged
from their level in the same
month a year ago.
Positive year-to-date tourism
indicators included a 16.6
percent gain in inquiries, a 2.5
percent increase in information
center visitors, and a 13.1
percent increase in visitors at
major attractions.
BBBBBUSINESS STUSINESS STUSINESS STUSINESS STUSINESS STARARARARARTS AND TS AND TS AND TS AND TS AND TERMINATERMINATERMINATERMINATERMINATIONSTIONSTIONSTIONSTIONS Net business starts as reported
by the Connecticut Department
of Labor declined by 1,065
during the first half of this year.
Fiscal year-to-date tax collec-
tions increased overall 8.2
percent through June from the
same period a year ago, with
gains of 16.0 percent in per-
sonal income taxes and 23.1
percent in real estate convey-
ance taxes.
STSTSTSTSTAAAAATE TE TE TE TE TTTTTAX COLLECTIONSAX COLLECTIONSAX COLLECTIONSAX COLLECTIONSAX COLLECTIONS
77777
Sources: Department of Economic and Community Development; U.S. Department of Energy, Energy Information Administration; Connecticut Department of Revenue Services; F.W. Dodge; Connecticut Department of Motor Vehicles; Connecticut Department of Transportation, Bureau of Aviation and Ports
Sources: Connecticut Secretary of the State -- corporations and other legal entities Connecticut Department of Labor -- unemployment insurance program registrations
Source: Connecticut Department of Revenue Services*Includes all sources of tax revenue; Only selected taxes are displayed.
Sources: Connecticut Department of Transportation, Bureau of Aviation and Ports; Connecticut Department of Economic and Community Development; Connecticut Lodging & Attractions Association
Y/Y % YEAR TO DATE % MONTH LEVEL CHG CURRENT PRIOR CHG
New Housing Permits JUN 1998 1,203 35.8 5,313 4,616 15.1Electricity Sales (mil kWh) APR 1998 2,171 1.1 9,418 9,417 0.0Retail Sales (Bil. $) APR 1998 2.90 21.8 10.96 10.25 6.9Construction Contracts Index (1980=100) MAY 1998 175.0 -17.9 --- --- ---New Auto Registrations JUN 1998 19,813 20.3 110,283 101,655 8.5Air Cargo Tons MAY 1998 11,172 9.9 55,715 57,218 -2.6
JUN % CHANGE YEAR TO DATE1998 M/M Y/Y NO. % CHG
STARTS Secretary of the State 1,803 12.6 20.2 10,478 20.5 Department of Labor 906 -3.0 21.0 5,427 -4.0TERMINATIONS Secretary of the State 348 34.9 17.2 1,958 4.4 Department of Labor 872 19.8 45.6 6,492 9.5
FISCAL YEAR TOTALSJUN JUN % %
(Millions of dollars) 1998 1997 CHG 1997-98 1996-97 CHGTOTAL ALL TAXES* 866.6 813.3 6.6 8,092.7 7,477.1 8.2 Corporate Tax 142.9 142.6 0.2 630.7 640.6 -1.5 Personal Income Tax 350.8 307.3 14.2 3,398.4 2,930.3 16.0 Real Estate Conv. Tax 9.0 8.3 0.7 91.2 74.1 23.1 Sales & Use Tax 222.6 215.7 3.2 2,487.4 2,341.8 6.2
Y/Y % YEAR TO DATE % MONTH LEVEL CHG CURRENT PRIOR CHG
Tourism Inquiries JUN 1998 63,905 -8.8 190,282 163,206 16.6Info Center Visitors JUN 1998 63,640 8.7 208,100 202,999 2.5Major Attraction Visitor sJUN 1998 234,966 21.7 811,937 717,799 13.1Hotel-Motel Occupancy JUN 1998 83.6 2.2 70.5 71.3 -1.1Air Passenger Count MAY 1998 477,848 4.3 2,226,221 2,217,526 0.4
August 1998THE CONNECTICUT ECONOMIC DIGEST●●●●●
CONSUMER NEWSCONSUMER NEWSCONSUMER NEWSCONSUMER NEWSCONSUMER NEWS
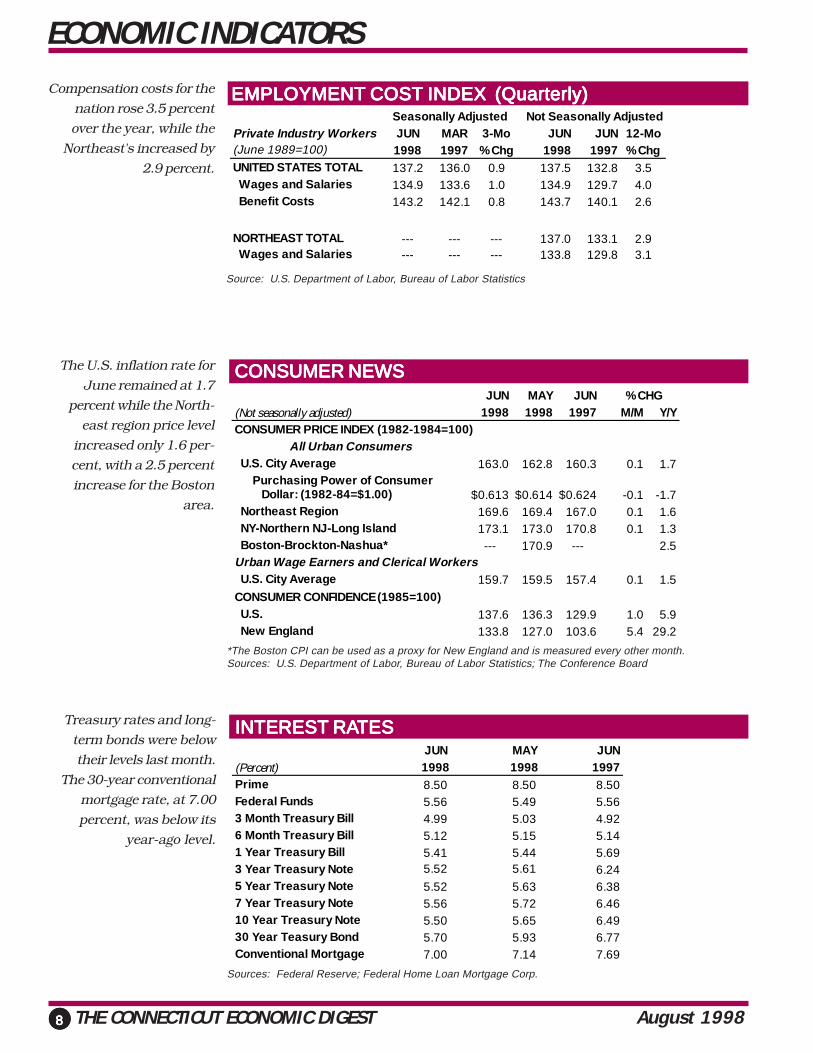
EMPLOYMENT COST INDEX (Quarterly)EMPLOYMENT COST INDEX (Quarterly)EMPLOYMENT COST INDEX (Quarterly)EMPLOYMENT COST INDEX (Quarterly)EMPLOYMENT COST INDEX (Quarterly)Compensation costs for the
nation rose 3.5 percent
over the year, while the
Northeast's increased by
2.9 percent.
Treasury rates and long-
term bonds were below
their levels last month.
The 30-year conventional
mortgage rate, at 7.00
percent, was below its
year-ago level.
INTEREST RAINTEREST RAINTEREST RAINTEREST RAINTEREST RATESTESTESTESTES
ECONOMIC INDICATORS
The U.S. inflation rate for
June remained at 1.7
percent while the North-
east region price level
increased only 1.6 per-
cent, with a 2.5 percent
increase for the Boston
area.
88888
Source: U.S. Department of Labor, Bureau of Labor Statistics
*The Boston CPI can be used as a proxy for New England and is measured every other month.Sources: U.S. Department of Labor, Bureau of Labor Statistics; The Conference Board
Sources: Federal Reserve; Federal Home Loan Mortgage Corp.
Seasonally Adjusted Not Seasonally AdjustedPrivate Industry Workers JUN MAR 3-Mo JUN JUN 12-Mo(June 1989=100) 1998 1997 % Chg 1998 1997 % ChgUNITED STATES TOTAL 137.2 136.0 0.9 137.5 132.8 3.5 Wages and Salaries 134.9 133.6 1.0 134.9 129.7 4.0 Benefit Costs 143.2 142.1 0.8 143.7 140.1 2.6
NORTHEAST TOTAL --- --- --- 137.0 133.1 2.9 Wages and Salaries --- --- --- 133.8 129.8 3.1
JUN MAY JUN % CHG(Not seasonally adjusted) 1998 1998 1997 M/M Y/YCONSUMER PRICE INDEX (1982-1984=100)
All Urban Consumers U.S. City Average 163.0 162.8 160.3 0.1 1.7 Purchasing Power of Consumer Dollar: (1982-84=$1.00) $0.613 $0.614 $0.624 -0.1 -1.7 Northeast Region 169.6 169.4 167.0 0.1 1.6 NY-Northern NJ-Long Island 173.1 173.0 170.8 0.1 1.3 Boston-Brockton-Nashua* --- 170.9 --- 2.5Urban Wage Earners and Clerical Workers U.S. City Average 159.7 159.5 157.4 0.1 1.5CONSUMER CONFIDENCE (1985=100) U.S. 137.6 136.3 129.9 1.0 5.9 New England 133.8 127.0 103.6 5.4 29.2
JUN MAY JUN(Percent) 1998 1998 1997Prime 8.50 8.50 8.50Federal Funds 5.56 5.49 5.563 Month Treasury Bill 4.99 5.03 4.926 Month Treasury Bill 5.12 5.15 5.141 Year Treasury Bill 5.41 5.44 5.693 Year Treasury Note 5.52 5.61 6.245 Year Treasury Note 5.52 5.63 6.387 Year Treasury Note 5.56 5.72 6.4610 Year Treasury Note 5.50 5.65 6.4930 Year Teasury Bond 5.70 5.93 6.77Conventional Mortgage 7.00 7.14 7.69

August 1998 THE CONNECTICUT ECONOMIC DIGEST ●●●●●
UNEMPLOUNEMPLOUNEMPLOUNEMPLOUNEMPLOYMENT RAYMENT RAYMENT RAYMENT RAYMENT RATESTESTESTESTES
LABOR FORCELABOR FORCELABOR FORCELABOR FORCELABOR FORCE
NONFNONFNONFNONFNONFARM EMPLOARM EMPLOARM EMPLOARM EMPLOARM EMPLOYMENTYMENTYMENTYMENTYMENT
All the states in the
region posted lower
unemployment rates
than last year.
Massachusetts posted
the strongest employ-
ment growth in the
region, while New
Hampshire experienced
the slowest increase
over the year.
Seven out of the nine
states in the region
experienced a decline in
the labor force from a
year ago.
COMPARATIVE REGIONAL DATA
99999
Source: U.S. Department of Labor, Bureau of Labor Statistics
JUN JUN CHANGE MAY(Seasonally adjusted; 000s) 1998 1997 NO. % 1998Connecticut 1,645.0 1,611.1 33.9 2.1 1,641.8Maine 562.5 552.6 9.9 1.8 560.9Massachusetts 3,205.6 3,110.8 94.8 3.0 3,207.5New Hampshire 574.1 568.7 5.4 0.9 574.2New Jersey 3,800.5 3,719.9 80.6 2.2 3,796.8New York 8,143.5 8,014.4 129.1 1.6 8,140.0Pennsylvania 5,449.6 5,385.0 64.6 1.2 5,457.8Rhode Island 457.3 448.1 9.2 2.1 456.8Vermont 283.6 278.4 5.2 1.9 282.6United States 125,748.0 122,534.0 3,214.0 2.6 125,543.0
JUN JUN CHANGE MAY(Seasonally adjusted; 000s) 1998 1997 NO. % 1998Connecticut 1,717.8 1,721.7 -3.9 -0.2 1,721.1Maine 650.2 656.6 -6.4 -1.0 654.1Massachusetts 3,255.3 3,267.7 -12.4 -0.4 3,263.7New Hampshire 654.0 647.0 7.0 1.1 655.2New Jersey 4,192.3 4,205.7 -13.4 -0.3 4,185.0New York 8,779.2 8,825.2 -46.0 -0.5 8,788.3Pennsylvania 5,959.1 5,981.9 -22.8 -0.4 5,963.8Rhode Island 499.3 505.3 -6.0 -1.2 501.8Vermont 330.2 324.7 5.5 1.7 329.1United States 137,447.0 136,206.0 1,241.0 0.9 137,364.0
JUN JUN MAY(Seasonally adjusted) 1998 1997 CHANGE 1998Connecticut 3.8 5.2 -1.4 3.8Maine 4.0 5.4 -1.4 3.8Massachusetts 3.4 4.1 -0.7 3.7New Hampshire 2.7 3.2 -0.5 3.0New Jersey 4.8 5.2 -0.4 5.0New York 5.5 6.5 -1.0 5.7Pennsylvania 4.3 5.3 -1.0 4.3Rhode Island 4.1 5.5 -1.4 4.7Vermont 3.5 3.9 -0.4 3.4United States 4.5 5.0 -0.5 4.3
Source: U.S. Department of Labor, Bureau of Labor Statistics
Source: U.S. Department of Labor, Bureau of Labor Statistics

August 1998THE CONNECTICUT ECONOMIC DIGEST●●●●●
ECONOMIC INDICATOR TRENDS
1010101010
NONFARM EMPLOYMENT (Seasonally adjusted) Month 1996 1997 1998Jan 1,560.2 1,600.5 1,639.6Feb 1,570.2 1,603.9 1,641.2Mar 1,571.3 1,605.6 1,639.6Apr 1,576.8 1,608.8 1,641.9May 1,581.5 1,609.3 1,641.8Jun 1,583.9 1,611.1 1,645.0Jul 1,580.7 1,611.9Aug 1,588.9 1,616.1Sep 1,586.7 1,621.7Oct 1,598.2 1,627.2Nov 1,600.4 1,634.6Dec 1,601.9 1,642.6
UNEMPLOYMENT RATE (Seasonally adjusted) Month 1996 1997 1998Jan 6.0 5.7 3.8Feb 5.8 5.5 3.8Mar 5.8 5.4 4.0Apr 5.7 5.4 3.9May 5.6 5.3 3.8Jun 5.7 5.2 3.8Jul 5.7 5.1Aug 5.7 4.9Sep 5.7 4.9Oct 5.8 4.8Nov 5.7 4.6Dec 5.7 4.5
LABOR FORCE (Seasonally adjusted) Month 1996 1997 1998
Jan 1,714.4 1,723.6 1,720.0Feb 1,717.2 1,720.8 1,716.8Mar 1,717.7 1,720.5 1,722.4Apr 1,718.5 1,722.2 1,714.9May 1,719.2 1,721.0 1,721.1Jun 1,721.5 1,721.7 1,717.8Jul 1,721.0 1,722.0Aug 1,722.4 1,722.9Sep 1,722.0 1,723.9Oct 1,727.1 1,725.7Nov 1,726.9 1,726.6Dec 1,726.1 1,728.2
AVERAGE WEEKLY INITIAL CLAIMS (Seasonally adjusted) Month 1996 1997 1998Jan 4,702 3,946 3,386Feb 4,666 3,903 3,578Mar 4,192 4,012 3,444Apr 4,250 4,326 3,493May 4,374 3,768 3,677Jun 4,211 4,100 4,093Jul 4,355 3,621Aug 4,223 3,799Sep 4,194 3,629Oct 4,193 3,503Nov 3,881 3,670Dec 4,383 4,178
2
3
4
5
6
7
8
9
84 85 86 87 88 89 90 91 92 93 94 95 96 97 98
Per
cent
1,400
1,450
1,500
1,550
1,600
1,650
1,700
84 85 86 87 88 89 90 91 92 93 94 95 96 97 98
Tho
usan
ds
2,000
3,000
4,000
5,000
6,000
7,000
8,000
9,000
84 85 86 87 88 89 90 91 92 93 94 95 96 97 98
1,550
1,600
1,650
1,700
1,750
1,800
1,850
1,900
84 85 86 87 88 89 90 91 92 93 94 95 96 97 98
Tho
usan
ds

August 1998 THE CONNECTICUT ECONOMIC DIGEST ●●●●●
ECONOMIC INDICATOR TRENDS
1111111111
REAL AVG MANUFACTURING HOURLY EARNINGS (Not seasonally adjusted)Month 1996 1997 1998Jan $9.22 $9.09 $9.26Feb 9.10 9.06 9.25Mar 9.12 9.08 9.29Apr 9.09 9.09 9.26May 9.01 9.13 9.25Jun 9.06 9.14 9.27Jul 9.12 9.26Aug 9.07 9.19Sep 9.07 9.24Oct 9.04 9.22Nov 9.03 9.25Dec 9.12 9.32
AVG MANUFACTURING WEEKLY HOURS (Not seasonally adjusted) Month 1996 1997 1998Jan 39.1 42.7 42.7Feb 42.6 42.1 42.9Mar 43.0 42.4 42.7Apr 42.0 42.5 42.6May 42.7 42.4 42.9Jun 43.0 42.5 43.1Jul 42.2 41.9Aug 42.6 42.0Sep 43.1 43.0Oct 42.9 42.8Nov 43.2 43.1Dec 43.4 43.4
HARTFORD HELP WANTED INDEX (Seasonally adjusted) Month 1996 1997 1998Jan 35 35 35Feb 33 36 38Mar 34 34 37Apr 34 36 37May 35 36 40Jun 36 38 39Jul 34 35Aug 32 34Sep 35 36Oct 35 35Nov 36 37Dec 35 36
DOL NEWLY REGISTERED EMPLOYERS (12-month moving average) Month 1996 1997 1998Jan 810 833 868Feb 794 840 870Mar 812 856 846Apr 813 849 878May 811 856 861Jun 838 848 836Jul 833 856Aug 833 862Sep 838 854Oct 825 859Nov 825 859Dec 828 852
38
39
40
41
42
43
44
45
84 85 86 87 88 89 90 91 92 93 94 95 96 97 98
8.4
8.6
8.8
9.0
9.2
9.4
9.6
84 85 86 87 88 89 90 91 92 93 94 95 96 97 98
1982
-84
Dol
lars
500
600
700
800
900
1,000
1,100
84 85 86 87 88 89 90 91 92 93 94 95 96 97 98
0
20
40
60
80
100
120
84 85 86 87 88 89 90 91 92 93 94 95 96 97 98
1987
=10
0

August 1998THE CONNECTICUT ECONOMIC DIGEST●●●●●
WHOLESALE TRADE EMPLOYMENT (Seasonally adjusted) Month 1996 1997 1998Jan 78.7 81.4 84.2Feb 79.5 82.0 84.2Mar 79.8 82.2 84.7Apr 80.2 82.7 85.0May 80.3 83.2 85.4Jun 80.3 83.1 85.5Jul 80.4 83.8Aug 80.9 83.9Sep 80.8 83.7Oct 81.1 83.4Nov 81.7 84.2Dec 81.9 84.7
RETAIL TRADE EMPLOYMENT (Seasonally adjusted) Month 1996 1997 1998Jan 264.2 268.4 276.0Feb 264.8 268.3 275.7Mar 265.0 269.5 274.3Apr 265.1 268.5 272.9May 265.7 269.0 273.4Jun 266.4 269.6 272.7Jul 266.3 268.9Aug 267.3 270.0Sep 267.3 271.3Oct 268.7 273.2Nov 268.5 275.4Dec 269.4 277.6
TOTAL SERVICES EMPLOYMENT (Seasonally adjusted) Month 1996 1997 1998Jan 470.8 490.5 506.6Feb 474.3 490.6 506.9Mar 475.7 491.6 505.4Apr 477.3 493.6 509.3May 480.8 493.6 509.0Jun 482.2 495.7 513.0Jul 481.5 495.4Aug 484.9 500.8Sep 486.1 500.7Oct 488.1 503.5Nov 490.0 506.4Dec 490.7 508.7
HEALTH SERVICES EMPLOYMENT (Not seasonally adjusted) Month 1996 1997 1998Jan 152.3 155.7 157.2Feb 152.8 155.6 156.8Mar 153.7 156.2 157.1Apr 153.7 156.0 157.1May 154.2 156.7 158.0Jun 155.3 157.5 159.2Jul 154.4 156.7Aug 155.2 157.2Sep 156.2 157.5Oct 155.6 157.2Nov 156.6 158.0Dec 157.4 158.8
70
75
80
85
90
95
84 85 86 87 88 89 90 91 92 93 94 95 96 97 98
Tho
usan
ds
280
330
380
430
480
530
84 85 86 87 88 89 90 91 92 93 94 95 96 97 98
Tho
usan
ds
220
230240
250
260
270280
290
300
84 85 86 87 88 89 90 91 92 93 94 95 96 97 98
Tho
usan
ds
110
120
130
140
150
160
170
84 85 86 87 88 89 90 91 92 93 94 95 96 97 98
Tho
usan
ds
ECONOMIC INDICATOR TRENDS
1212121212

August 1998 THE CONNECTICUT ECONOMIC DIGEST ●●●●●
PERSONAL INCOME (Seasonally adjusted) Quarter 1996 1997 1998First 4.4 9.1 6.6Second 6.9 7.0 6.8Third 6.6 7.0 7.6Fourth 7.3 7.6 6.1
UI COVERED WAGES (Seasonally adjusted) Quarter 1996 1997 1998First 5.0 7.4 12.1Second 5.6 6.3 10.9Third 4.8 8.6 10.3Fourth 6.7 9.9 7.7
U.S. EMPLOYMENT COST INDEX (Seasonally adjusted) Quarter 1996 1997 1998
First 2.8 2.8 3.3Second 2.8 2.8 3.4Third 2.8 2.9Fourth 3.0 3.2
U.S. CONSUMER PRICE INDEX (Not seasonally adjusted) Month 1996 1997 1998Jan 2.7 3.0 1.6Feb 2.7 3.0 1.4Mar 2.8 2.8 1.4Apr 2.9 2.5 1.4May 2.9 2.2 1.7Jun 2.8 2.3 1.7Jul 3.0 2.2Aug 2.9 2.2Sep 3.0 2.2Oct 3.0 2.1Nov 3.3 1.8Dec 3.3 1.7
-30-20-10
0102030405060
84 85 86 87 88 89 90 91 92 93 94 95 96 97 98
Yea
r-ov
er-y
ear
% c
hang
es
0
2
4
6
8
10
12
14
84 85 86 87 88 89 90 91 92 93 94 95 96 97 98
Yea
r-ov
er-y
ear
% c
hang
es
0
1
2
3
4
5
6
7
84 85 86 87 88 89 90 91 92 93 94 95 96 97 98
Yea
r-ov
er-y
ear
% c
hang
es
0
1
2
3
4
5
6
7
84 85 86 87 88 89 90 91 92 93 94 95 96 97 98
Yea
r-ov
er-y
ear
% c
hang
es
ECONOMIC INDICATOR TRENDS
1313131313

August 1998THE CONNECTICUT ECONOMIC DIGEST●●●●●
Not Seasonally Adjusted
JUN JUN CHANGE MAY1998 1997 NO. % 1998
TOTAL NONFARM EMPLOYMENT . . . . . . . 1,659,000 1,628,000 31,000 1.9 1,646,900 GOODS PRODUCING INDUSTRIES . . . . . 341,300 339,300 2,000 0.6 336,800 CONSTRUCTION & MINING . . . . . . . . . 63,100 60,500 2,600 4.3 60,400 MANUFACTURING . . . . . . . . . . . . . . . . 278,200 278,800 -600 -0.2 276,400 Durable . . . . . . . . . . . . . . . . . . . . . . . 194,600 195,500 -900 -0.5 193,500 Lumber & Furniture . . . . . . . . . . . . . . . . . . . . . 5,300 5,200 100 1.9 5,200 Stone, Clay & Glass . . . . . . . . . . . . . . . . . . . . . 3,100 3,100 0 0.0 3,000 Primary Metals . . . . . . . . . . . . . . . . . . . . . . . . . 9,100 9,100 0 0.0 9,000 Fabricated Metals . . . . . . . . . . . . . . . . . . . . . . . 34,900 34,900 0 0.0 34,800 Machinery & Computer Equipment . . . . . . . . . 34,800 34,600 200 0.6 34,700 Electronic & Electrical Equipment . . . . . . . . . 29,200 29,200 0 0.0 29,000 Transportation Equipment . . . . . . . . . . . . . . . . 49,600 50,300 -700 -1.4 49,300 Instruments . . . . . . . . . . . . . . . . . . . . . . . . . . . . 22,100 22,700 -600 -2.6 22,100 Miscellaneous Manufacturing . . . . . . . . . . . . . 6,500 6,400 100 1.6 6,400 Nondurable . . . . . . . . . . . . . . . . . . . . 83,600 83,300 300 0.4 82,900 Food . . . . . . . . . . . . . . . . . . . . . . . . . . . . . . . . . 8,600 8,500 100 1.2 8,500 Textiles. . . . . . . . . . . . . . . . . . . . . . . . . . . . . . . 2,200 2,100 100 4.8 2,100 Apparel . . . . . . . . . . . . . . . . . . . . . . . . . . . . . . . 4,500 4,600 -100 -2.2 4,500 Paper . . . . . . . . . . . . . . . . . . . . . . . . . . . . . . . . . 7,900 8,000 -100 -1.3 7,900 Printing & Publishing . . . . . . . . . . . . . . . . . . . . 25,600 25,500 100 0.4 25,500 Chemicals . . . . . . . . . . . . . . . . . . . . . . . . . . . . . 21,300 21,200 100 0.5 21,100 Rubber & Plastics . . . . . . . . . . . . . . . . . . . . . . 11,200 11,000 200 1.8 11,100 Other Nondurable Manufacturing . . . . . . . . . . . 2,300 2,400 -100 -4.2 2,200 SERVICE PRODUCING INDUSTRIES . . . . 1,317,700 1,288,700 29,000 2.3 1,310,100 TRANS., COMM. & UTILITIES . . . . . . . . 77,400 75,800 1,600 2.1 76,900 Transportation . . . . . . . . . . . . . . . . . . . . . . . . . . . 45,300 44,600 700 1.6 45,000 Motor Freight & Warehousing . . . . . . . . . . . . . 11,700 12,000 -300 -2.5 11,600 Other Transportation . . . . . . . . . . . . . . . . . . . . 33,600 32,600 1,000 3.1 33,400 Communications . . . . . . . . . . . . . . . . . . . . . . . . 19,900 18,800 1,100 5.9 19,700 Utilities . . . . . . . . . . . . . . . . . . . . . . . . . . . . . . . . 12,200 12,400 -200 -1.6 12,200 TRADE . . . . . . . . . . . . . . . . . . . . . . . . 361,600 356,500 5,100 1.4 357,900 Wholesale . . . . . . . . . . . . . . . . . . . . . . . . . . . . . . 85,800 83,900 1,900 2.3 85,400 Retail . . . . . . . . . . . . . . . . . . . . . . . . . . . . . . . . . . 275,800 272,600 3,200 1.2 272,500 General Merchandise . . . . . . . . . . . . . . . . . . . . 27,300 26,700 600 2.2 26,900 Food Stores . . . . . . . . . . . . . . . . . . . . . . . . . . . 52,500 52,300 200 0.4 52,000 Auto Dealers & Gas Stations . . . . . . . . . . . . . . 27,200 27,300 -100 -0.4 27,000 Restaurants . . . . . . . . . . . . . . . . . . . . . . . . . . . . 81,300 81,500 -200 -0.2 79,600 Other Retail Trade . . . . . . . . . . . . . . . . . . . . . . 87,500 84,800 2,700 3.2 87,000 FINANCE, INS. & REAL ESTATE. . . . . . . 136,500 131,700 4,800 3.6 135,200 Finance . . . . . . . . . . . . . . . . . . . . . . . . . . . . . . . . 48,900 45,700 3,200 7.0 48,200 Banking . . . . . . . . . . . . . . . . . . . . . . . . . . . . . . . 24,000 23,700 300 1.3 23,600 Insurance . . . . . . . . . . . . . . . . . . . . . . . . . . . . . . 71,100 69,900 1,200 1.7 70,800 Insurance Carriers . . . . . . . . . . . . . . . . . . . . . . 59,600 58,700 900 1.5 59,300 Real Estate . . . . . . . . . . . . . . . . . . . . . . . . . . . . . 16,500 16,100 400 2.5 16,200 SERVICES . . . . . . . . . . . . . . . . . . . . . 517,100 500,900 16,200 3.2 511,500 Hotels & Lodging Places . . . . . . . . . . . . . . . . . 11,500 11,100 400 3.6 11,000 Personal Services . . . . . . . . . . . . . . . . . . . . . . 18,000 17,900 100 0.6 18,100 Business Services . . . . . . . . . . . . . . . . . . . . . . 108,100 101,600 6,500 6.4 106,600 Health Services . . . . . . . . . . . . . . . . . . . . . . . . 159,200 157,500 1,700 1.1 158,000 Legal & Professional Services . . . . . . . . . . . . 53,700 51,700 2,000 3.9 52,800 Educational Services . . . . . . . . . . . . . . . . . . . . 39,400 37,500 1,900 5.1 41,600 Other Services . . . . . . . . . . . . . . . . . . . . . . . . . 127,200 123,600 3,600 2.9 123,400 GOVERNMENT . . . . . . . . . . . . . . . . . . 225,100 223,800 1,300 0.6 228,600 Federal . . . . . . . . . . . . . . . . . . . . . . . . . . . . . . . . 22,600 22,700 -100 -0.4 22,600 **State, Local & Other Government . . . . . . . . . . . 202,500 201,100 1,400 0.7 206,000
Current month's data are preliminary. Prior months' data have been revised. All data are benchmarked to March 1997. *Total excludes workers idled due to labor-management disputes. **Includes Indian tribal government employment.
CONNECTICUTCONNECTICUTCONNECTICUTCONNECTICUTCONNECTICUT
NONFARM EMPLOYMENT ESTIMATES
1414141414

August 1998 THE CONNECTICUT ECONOMIC DIGEST ●●●●●
Not Seasonally Adjusted
JUN JUN CHANGE MAY1998 1997 NO. % 1998
TOTAL NONFARM EMPLOYMENT . . . . . . . . . . . 87,000 86,300 700 0.8 86,900 GOODS PRODUCING INDUSTRIES . . . . . . . . . . 22,700 22,600 100 0.4 22,600 CONSTRUCTION & MINING . . . . . . . . . . . . . . . . 4,000 3,600 400 11.1 3,800 MANUFACTURING . . . . . . . . . . . . . . . . . . . . . . . . 18,700 19,000 -300 -1.6 18,800 Durable Goods . . . . . . . . . . . . . . . . . . . . . . . . . . 9,700 9,800 -100 -1.0 9,800 Machinery & Electric Equipment . . . . . . . . . . . 4,800 4,900 -100 -2.0 4,800 Instruments . . . . . . . . . . . . . . . . . . . . . . . . . . . . . 2,600 2,700 -100 -3.7 2,700 Nondurable Goods. . . . . . . . . . . . . . . . . . . . . . . 9,000 9,200 -200 -2.2 9,000 Printing & Publishing . . . . . . . . . . . . . . . . . . . . . 2,600 2,700 -100 -3.7 2,600 Chemicals . . . . . . . . . . . . . . . . . . . . . . . . . . . . . . 3,700 3,500 200 5.7 3,600 SERVICE PRODUCING INDUSTRIES . . . . . . . . . 64,300 63,700 600 0.9 64,300 TRANS., COMM. & UTILITIES . . . . . . . . . . . . . . . 2,500 2,600 -100 -3.8 2,500 TRADE . . . . . . . . . . . . . . . . . . . . . . . . . . . . . . . . . . 21,900 22,100 -200 -0.9 21,700 Wholesale . . . . . . . . . . . . . . . . . . . . . . . . . . . . . . 3,900 3,900 0 0.0 4,000 Retail . . . . . . . . . . . . . . . . . . . . . . . . . . . . . . . . . . 18,000 18,200 -200 -1.1 17,700 FINANCE, INS. & REAL ESTATE. . . . . . . . . . . . . 4,900 4,500 400 8.9 4,800 SERVICES . . . . . . . . . . . . . . . . . . . . . . . . . . . . . . . 25,300 24,900 400 1.6 25,100 GOVERNMENT . . . . . . . . . . . . . . . . . . . . . . . . . . . 9,700 9,600 100 1.0 10,200 Federal . . . . . . . . . . . . . . . . . . . . . . . . . . . . . . . . . 800 900 -100 -11.1 800 State & Local . . . . . . . . . . . . . . . . . . . . . . . . . . . . 8,900 8,700 200 2.3 9,400
Current month's data are preliminary. Prior months' data have been revised. All data are benchmarked to March 1997. *Total excludes workers idled due to labor-management disputes.
Not Seasonally Adjusted
JUN JUN CHANGE MAY1998 1997 NO. % 1998
TOTAL NONFARM EMPLOYMENT . . . . . . . . . . . 186,300 185,600 700 0.4 184,900 GOODS PRODUCING INDUSTRIES . . . . . . . . . . 46,900 46,700 200 0.4 46,300 CONSTRUCTION & MINING . . . . . . . . . . . . . . . . 7,000 6,700 300 4.5 6,600 MANUFACTURING . . . . . . . . . . . . . . . . . . . . . . . . 39,900 40,000 -100 -0.3 39,700 Durable Goods . . . . . . . . . . . . . . . . . . . . . . . . . . 32,600 32,700 -100 -0.3 32,500 Fabricated Metals . . . . . . . . . . . . . . . . . . . . . . . 4,400 4,300 100 2.3 4,400 Industrial Machinery . . . . . . . . . . . . . . . . . . . . . 6,400 6,400 0 0.0 6,400 Electronic Equipment . . . . . . . . . . . . . . . . . . . . 6,600 6,600 0 0.0 6,600 Transportation Equipment . . . . . . . . . . . . . . . . 8,800 9,000 -200 -2.2 8,800 Nondurable Goods. . . . . . . . . . . . . . . . . . . . . . . 7,300 7,300 0 0.0 7,200 Printing & Publishing . . . . . . . . . . . . . . . . . . . . . 2,100 2,100 0 0.0 2,100 SERVICE PRODUCING INDUSTRIES . . . . . . . . . 139,400 138,900 500 0.4 138,600 TRANS., COMM. & UTILITIES . . . . . . . . . . . . . . . 7,200 7,200 0 0.0 7,200 TRADE . . . . . . . . . . . . . . . . . . . . . . . . . . . . . . . . . . 41,500 41,400 100 0.2 41,500 Wholesale . . . . . . . . . . . . . . . . . . . . . . . . . . . . . . 9,700 9,900 -200 -2.0 9,900 Retail . . . . . . . . . . . . . . . . . . . . . . . . . . . . . . . . . . 31,800 31,500 300 1.0 31,600 FINANCE, INS. & REAL ESTATE. . . . . . . . . . . . . 10,300 10,400 -100 -1.0 10,200 SERVICES . . . . . . . . . . . . . . . . . . . . . . . . . . . . . . . 59,300 58,900 400 0.7 58,500 Business Services . . . . . . . . . . . . . . . . . . . . . . . 14,500 13,900 600 4.3 14,000 Health Services . . . . . . . . . . . . . . . . . . . . . . . . . 19,200 19,100 100 0.5 19,000 GOVERNMENT . . . . . . . . . . . . . . . . . . . . . . . . . . . 21,100 21,000 100 0.5 21,200 Federal . . . . . . . . . . . . . . . . . . . . . . . . . . . . . . . . . 2,300 2,200 100 4.5 2,300 State & Local . . . . . . . . . . . . . . . . . . . . . . . . . . . . 18,800 18,800 0 0.0 18,900
DDDDDANBANBANBANBANBURURURURURY LMAY LMAY LMAY LMAY LMA
BRIDGEPORT LMABRIDGEPORT LMABRIDGEPORT LMABRIDGEPORT LMABRIDGEPORT LMA
NONFARM EMPLOYMENT ESTIMATES
For further information on the Bridgeport Labor Market Area contact Arthur Famiglietti at (860) 566-3472.
For further information on the Danbury Labor Market Area contact Arthur Famiglietti at (860) 566-3472.
1515151515

August 1998THE CONNECTICUT ECONOMIC DIGEST●●●●●
Not Seasonally Adjusted
JUN JUN CHANGE MAY1998 1997 NO. % 1998
TOTAL NONFARM EMPLOYMENT . . . . . . . . . . . 602,200 600,600 1,600 0.3 601,500 GOODS PRODUCING INDUSTRIES . . . . . . . . . . 116,000 114,300 1,700 1.5 114,300 CONSTRUCTION & MINING . . . . . . . . . . . . . . . . 20,700 21,100 -400 -1.9 20,000 MANUFACTURING . . . . . . . . . . . . . . . . . . . . . . . . 95,300 93,200 2,100 2.3 94,300 Durable Goods . . . . . . . . . . . . . . . . . . . . . . . . . . 75,700 73,700 2,000 2.7 74,900 Primary & Fabricated Metals . . . . . . . . . . . . . . 18,300 18,200 100 0.5 18,300 Industrial Machinery . . . . . . . . . . . . . . . . . . . . . 14,600 14,500 100 0.7 14,500 Electronic Equipment . . . . . . . . . . . . . . . . . . . . 6,400 6,300 100 1.6 6,300 Transportation Equipment . . . . . . . . . . . . . . . . 27,700 26,200 1,500 5.7 27,200 Nondurable Goods. . . . . . . . . . . . . . . . . . . . . . . 19,600 19,500 100 0.5 19,400 Printing & Publishing . . . . . . . . . . . . . . . . . . . . . 7,700 7,700 0 0.0 7,800 SERVICE PRODUCING INDUSTRIES . . . . . . . . . 486,200 486,300 -100 0.0 487,200 TRANS., COMM. & UTILITIES . . . . . . . . . . . . . . . 27,600 27,500 100 0.4 27,200 Transportation . . . . . . . . . . . . . . . . . . . . . . . . . . 16,300 16,600 -300 -1.8 16,200 Communications & Utilities . . . . . . . . . . . . . . . 11,300 10,900 400 3.7 11,000 TRADE . . . . . . . . . . . . . . . . . . . . . . . . . . . . . . . . . . 124,500 125,700 -1,200 -1.0 123,200 Wholesale . . . . . . . . . . . . . . . . . . . . . . . . . . . . . . 30,500 30,600 -100 -0.3 30,100 Retail . . . . . . . . . . . . . . . . . . . . . . . . . . . . . . . . . . 94,000 95,100 -1,100 -1.2 93,100 FINANCE, INS. & REAL ESTATE. . . . . . . . . . . . . 69,000 68,900 100 0.1 69,200 Deposit & Nondeposit Institutions . . . . . . . . . . 9,700 9,500 200 2.1 9,500 Insurance Carriers . . . . . . . . . . . . . . . . . . . . . . . 46,300 46,400 -100 -0.2 46,800 SERVICES . . . . . . . . . . . . . . . . . . . . . . . . . . . . . . . 173,500 172,900 600 0.3 173,400 Business Services . . . . . . . . . . . . . . . . . . . . . . . 32,000 32,300 -300 -0.9 31,900 Health Services . . . . . . . . . . . . . . . . . . . . . . . . . . 60,100 59,600 500 0.8 59,700 GOVERNMENT . . . . . . . . . . . . . . . . . . . . . . . . . . . 91,600 91,300 300 0.3 94,200 Federal . . . . . . . . . . . . . . . . . . . . . . . . . . . . . . . . . 7,900 8,200 -300 -3.7 8,000 State & Local . . . . . . . . . . . . . . . . . . . . . . . . . . . . 83,700 83,100 600 0.7 86,200
Current month's data are preliminary. Prior months' data have been revised. All data are benchmarked to March 1997. *Total excludes workers idled due to labor-management disputes.
Not Seasonally Adjusted
JUN JUN CHANGE MAY1998 1997 NO. % 1998
TOTAL NONFARM EMPLOYMENT . . . . . . . . . . . 20,900 20,400 500 2.5 20,600 GOODS PRODUCING INDUSTRIES . . . . . . . . . . 7,200 7,000 200 2.9 7,000 CONSTRUCTION & MINING . . . . . . . . . . . . . . . . 1,000 900 100 11.1 900 MANUFACTURING . . . . . . . . . . . . . . . . . . . . . . . . 6,200 6,100 100 1.6 6,100 Durable Goods . . . . . . . . . . . . . . . . . . . . . . . . . . 2,700 2,700 0 0.0 2,700 Nondurable Goods. . . . . . . . . . . . . . . . . . . . . . . 3,500 3,400 100 2.9 3,400 SERVICE PRODUCING INDUSTRIES . . . . . . . . . 13,700 13,400 300 2.2 13,600 TRANS., COMM. & UTILITIES . . . . . . . . . . . . . . . 500 500 0 0.0 500 TRADE . . . . . . . . . . . . . . . . . . . . . . . . . . . . . . . . . . 4,800 4,700 100 2.1 4,700 Wholesale . . . . . . . . . . . . . . . . . . . . . . . . . . . . . . 700 700 0 0.0 700 Retail . . . . . . . . . . . . . . . . . . . . . . . . . . . . . . . . . . 4,100 4,000 100 2.5 4,000 FINANCE, INS. & REAL ESTATE. . . . . . . . . . . . . 600 600 0 0.0 600 SERVICES . . . . . . . . . . . . . . . . . . . . . . . . . . . . . . . 4,700 4,500 200 4.4 4,700 GOVERNMENT . . . . . . . . . . . . . . . . . . . . . . . . . . . 3,100 3,100 0 0.0 3,100 Federal . . . . . . . . . . . . . . . . . . . . . . . . . . . . . . . . . 100 100 0 0.0 100 State & Local . . . . . . . . . . . . . . . . . . . . . . . . . . . . 3,000 3,000 0 0.0 3,000
HARTFORD LMAHARTFORD LMAHARTFORD LMAHARTFORD LMAHARTFORD LMA
DANIELSON LMADANIELSON LMADANIELSON LMADANIELSON LMADANIELSON LMA
NONFARM EMPLOYMENT ESTIMATES
For further information on the Danielson Labor Market Area contact Noreen Passardi at (860) 566-3470.
For further information on the Hartford Labor Market Area contact Arthur Famiglietti at (860) 566-3472.
1616161616

August 1998 THE CONNECTICUT ECONOMIC DIGEST ●●●●●
Not Seasonally Adjusted
JUN JUN CHANGE MAY1998 1997 NO. % 1998
TOTAL NONFARM EMPLOYMENT . . . . . . . . . . . 250,600 251,100 -500 -0.2 249,900 GOODS PRODUCING INDUSTRIES . . . . . . . . . . 48,900 49,400 -500 -1.0 48,600 CONSTRUCTION & MINING . . . . . . . . . . . . . . . . 9,600 9,500 100 1.1 9,300 MANUFACTURING . . . . . . . . . . . . . . . . . . . . . . . . 39,300 39,900 -600 -1.5 39,300 Durable Goods . . . . . . . . . . . . . . . . . . . . . . . . . . 24,800 24,900 -100 -0.4 24,800 Primary & Fabricated Metals . . . . . . . . . . . . . . 6,500 6,700 -200 -3.0 6,500 Electronic Equipment . . . . . . . . . . . . . . . . . . . . 5,100 5,100 0 0.0 5,100 Nondurable Goods. . . . . . . . . . . . . . . . . . . . . . . 14,500 15,000 -500 -3.3 14,500 Paper, Printing & Publishing . . . . . . . . . . . . . . 5,100 5,200 -100 -1.9 5,100 Chemicals & Allied . . . . . . . . . . . . . . . . . . . . . . 6,200 6,000 200 3.3 6,200 SERVICE PRODUCING INDUSTRIES . . . . . . . . . 201,700 201,700 0 0.0 201,300 TRANS., COMM. & UTILITIES . . . . . . . . . . . . . . . 16,400 16,000 400 2.5 16,200 Communications & Utilities . . . . . . . . . . . . . . . 9,000 8,700 300 3.4 8,900 TRADE . . . . . . . . . . . . . . . . . . . . . . . . . . . . . . . . . . 53,400 53,400 0 0.0 52,600 Wholesale . . . . . . . . . . . . . . . . . . . . . . . . . . . . . . 13,300 13,000 300 2.3 13,200 Retail . . . . . . . . . . . . . . . . . . . . . . . . . . . . . . . . . . 40,100 40,400 -300 -0.7 39,400 Eating & Drinking Places . . . . . . . . . . . . . . . . . 11,400 12,000 -600 -5.0 11,000 FINANCE, INS. & REAL ESTATE. . . . . . . . . . . . . 13,100 13,200 -100 -0.8 12,900 Finance . . . . . . . . . . . . . . . . . . . . . . . . . . . . . . . . 3,800 4,000 -200 -5.0 3,800 Insurance . . . . . . . . . . . . . . . . . . . . . . . . . . . . . . . 7,200 7,100 100 1.4 7,100 SERVICES . . . . . . . . . . . . . . . . . . . . . . . . . . . . . . . 87,700 87,700 0 0.0 88,400 Business Services . . . . . . . . . . . . . . . . . . . . . . . 12,100 12,400 -300 -2.4 12,200 Health Services . . . . . . . . . . . . . . . . . . . . . . . . . 29,200 29,300 -100 -0.3 28,800 GOVERNMENT . . . . . . . . . . . . . . . . . . . . . . . . . . . 31,100 31,400 -300 -1.0 31,200 Federal . . . . . . . . . . . . . . . . . . . . . . . . . . . . . . . . . 5,300 5,700 -400 -7.0 5,400 State & Local . . . . . . . . . . . . . . . . . . . . . . . . . . . . 25,800 25,700 100 0.4 25,800
Current month's data are preliminary. Prior months' data have been revised. All data are benchmarked to March 1997. *Total excludes workers idled due to labor-management disputes.
Not Seasonally Adjusted
JUN JUN CHANGE MAY1998 1997 NO. % 1998
TOTAL NONFARM EMPLOYMENT . . . . . . . . . . . 10,000 9,800 200 2.0 9,800 GOODS PRODUCING INDUSTRIES . . . . . . . . . . 3,400 3,400 0 0.0 3,400 CONSTRUCTION & MINING . . . . . . . . . . . . . . . . 300 300 0 0.0 300 MANUFACTURING . . . . . . . . . . . . . . . . . . . . . . . . 3,100 3,100 0 0.0 3,100 Durable Goods . . . . . . . . . . . . . . . . . . . . . . . . . . 2,400 2,400 0 0.0 2,400 Electronic Equipment . . . . . . . . . . . . . . . . . . . . 800 800 0 0.0 800 Other Durable Goods . . . . . . . . . . . . . . . . . . . . 1,600 1,600 0 0.0 1,600 Nondurable Goods. . . . . . . . . . . . . . . . . . . . . . . 700 700 0 0.0 700 Rubber & Plastics . . . . . . . . . . . . . . . . . . . . . . . 300 300 0 0.0 300 Other Nondurable Goods . . . . . . . . . . . . . . . . . 400 400 0 0.0 400 SERVICE PRODUCING INDUSTRIES . . . . . . . . . 6,600 6,400 200 3.1 6,400 TRANS., COMM. & UTILITIES . . . . . . . . . . . . . . . 400 400 0 0.0 400 TRADE . . . . . . . . . . . . . . . . . . . . . . . . . . . . . . . . . . 2,300 2,200 100 4.5 2,100 Wholesale . . . . . . . . . . . . . . . . . . . . . . . . . . . . . . 400 400 0 0.0 400 Retail . . . . . . . . . . . . . . . . . . . . . . . . . . . . . . . . . . 1,900 1,800 100 5.6 1,700 FINANCE, INS. & REAL ESTATE. . . . . . . . . . . . . 400 300 100 33.3 400 SERVICES . . . . . . . . . . . . . . . . . . . . . . . . . . . . . . . 2,600 2,700 -100 -3.7 2,600 GOVERNMENT . . . . . . . . . . . . . . . . . . . . . . . . . . . 900 800 100 12.5 900 Federal . . . . . . . . . . . . . . . . . . . . . . . . . . . . . . . . . 0 0 0 0.0 0 State & Local . . . . . . . . . . . . . . . . . . . . . . . . . . . . 900 800 100 12.5 900
LOWER RIVER LMA LOWER RIVER LMA LOWER RIVER LMA LOWER RIVER LMA LOWER RIVER LMA
NONFARM EMPLOYMENT ESTIMATES
For further information on the Lower River Labor Market Area contact Noreen Passardi at (860) 566-3470.
NEW HA NEW HA NEW HA NEW HA NEW HAVEN LMAVEN LMAVEN LMAVEN LMAVEN LMA
For further information on the New Haven Labor Market Area contact J. Charles Joo at (860) 566-3470.
1717171717

August 1998THE CONNECTICUT ECONOMIC DIGEST●●●●●
Not Seasonally Adjusted
JUN JUN CHANGE MAY1998 1997 NO. % 1998
TOTAL NONFARM EMPLOYMENT . . . . . . . . . . . 211,200 206,000 5,200 2.5 208,100 GOODS PRODUCING INDUSTRIES . . . . . . . . . . 33,200 34,600 -1,400 -4.0 32,800 CONSTRUCTION & MINING . . . . . . . . . . . . . . . . 5,900 6,100 -200 -3.3 5,700 MANUFACTURING . . . . . . . . . . . . . . . . . . . . . . . . 27,300 28,500 -1,200 -4.2 27,100 Durable Goods . . . . . . . . . . . . . . . . . . . . . . . . . . 14,400 14,800 -400 -2.7 14,400 Industrial Machinery . . . . . . . . . . . . . . . . . . . . . 3,900 3,700 200 5.4 3,800 Electronic Equipment . . . . . . . . . . . . . . . . . . . . 2,600 2,500 100 4.0 2,600 Nondurable Goods. . . . . . . . . . . . . . . . . . . . . . . 12,900 13,700 -800 -5.8 12,700 Paper, Printing & Publishing . . . . . . . . . . . . . . 6,200 6,300 -100 -1.6 6,100 Chemicals & Allied . . . . . . . . . . . . . . . . . . . . . . 3,200 3,500 -300 -8.6 3,200 Other Nondurable . . . . . . . . . . . . . . . . . . . . . . . 3,500 3,900 -400 -10.3 3,400 SERVICE PRODUCING INDUSTRIES . . . . . . . . . 178,000 171,400 6,600 3.9 175,300 TRANS., COMM. & UTILITIES . . . . . . . . . . . . . . . 10,100 10,300 -200 -1.9 10,000 Communications & Utilities . . . . . . . . . . . . . . . 3,000 3,000 0 0.0 3,000 TRADE . . . . . . . . . . . . . . . . . . . . . . . . . . . . . . . . . . 46,900 46,200 700 1.5 46,300 Wholesale . . . . . . . . . . . . . . . . . . . . . . . . . . . . . . 12,000 12,200 -200 -1.6 12,000 Retail . . . . . . . . . . . . . . . . . . . . . . . . . . . . . . . . . . 34,900 34,000 900 2.6 34,300 FINANCE, INS. & REAL ESTATE. . . . . . . . . . . . . 26,700 23,700 3,000 12.7 26,300 SERVICES . . . . . . . . . . . . . . . . . . . . . . . . . . . . . . . 76,300 73,500 2,800 3.8 74,600 Business Services . . . . . . . . . . . . . . . . . . . . . . . 22,600 21,500 1,100 5.1 22,200 Engineering & Mgmnt. Services . . . . . . . . . . . 10,900 10,000 900 9.0 10,700 Other Services . . . . . . . . . . . . . . . . . . . . . . . . . . 42,800 42,000 800 1.9 41,700 GOVERNMENT . . . . . . . . . . . . . . . . . . . . . . . . . . . 18,000 17,700 300 1.7 18,100 Federal . . . . . . . . . . . . . . . . . . . . . . . . . . . . . . . . . 1,900 1,900 0 0.0 1,900 State & Local . . . . . . . . . . . . . . . . . . . . . . . . . . . . 16,100 15,800 300 1.9 16,200
Current month's data are preliminary. Prior months' data have been revised. All data are benchmarked to March 1997. *Total excludes workers idled due to labor-management disputes. **Includes Indian tribal government employment.
Not Seasonally Adjusted
JUN JUN CHANGE MAY1998 1997 NO. % 1998
TOTAL NONFARM EMPLOYMENT . . . . . . . . . . . 141,400 138,600 2,800 2.0 139,300 GOODS PRODUCING INDUSTRIES . . . . . . . . . . 29,200 29,800 -600 -2.0 29,100 CONSTRUCTION & MINING . . . . . . . . . . . . . . . . 4,800 4,700 100 2.1 4,600 MANUFACTURING . . . . . . . . . . . . . . . . . . . . . . . . 24,400 25,100 -700 -2.8 24,500 Durable Goods . . . . . . . . . . . . . . . . . . . . . . . . . . 14,600 15,400 -800 -5.2 14,700 Primary & Fabricated Metals . . . . . . . . . . . . . . 2,300 2,200 100 4.5 2,300 Other Durable Goods . . . . . . . . . . . . . . . . . . . . 12,300 13,200 -900 -6.8 12,400 Nondurable Goods. . . . . . . . . . . . . . . . . . . . . . . 9,800 9,700 100 1.0 9,800 Paper & Allied . . . . . . . . . . . . . . . . . . . . . . . . . . . 1,000 1,000 0 0.0 1,000 Other Nondurable Goods . . . . . . . . . . . . . . . . . 7,500 7,300 200 2.7 7,400 SERVICE PRODUCING INDUSTRIES . . . . . . . . . 112,200 108,800 3,400 3.1 110,200 TRANS., COMM. & UTILITIES . . . . . . . . . . . . . . . 6,800 6,600 200 3.0 6,700 TRADE . . . . . . . . . . . . . . . . . . . . . . . . . . . . . . . . . . 28,900 28,800 100 0.3 27,900 Wholesale . . . . . . . . . . . . . . . . . . . . . . . . . . . . . . 2,800 2,700 100 3.7 2,700 Retail . . . . . . . . . . . . . . . . . . . . . . . . . . . . . . . . . . 26,100 26,100 0 0.0 25,200 Eating & Drinking Places . . . . . . . . . . . . . . . . . 8,800 8,900 -100 -1.1 8,200 Other Retail . . . . . . . . . . . . . . . . . . . . . . . . . . . . . 17,300 17,300 0 0.0 17,000 FINANCE, INS. & REAL ESTATE. . . . . . . . . . . . . 3,900 3,800 100 2.6 3,800 SERVICES . . . . . . . . . . . . . . . . . . . . . . . . . . . . . . . 36,000 35,400 600 1.7 35,400 Personal & Business Services . . . . . . . . . . . . 6,800 6,600 200 3.0 6,700 Health Services . . . . . . . . . . . . . . . . . . . . . . . . . 11,700 11,500 200 1.7 11,600 GOVERNMENT . . . . . . . . . . . . . . . . . . . . . . . . . . . 36,600 34,200 2,400 7.0 36,400 Federal . . . . . . . . . . . . . . . . . . . . . . . . . . . . . . . . . 2,700 2,800 -100 -3.6 2,700 State & Local . . . . . . . . . . . . . . . . . . . . . . . . . . . . 33,900 31,400 2,500 8.0 33,700 **Local . . . . . . . . . . . . . . . . . . . . . . . . . . . . . . . . . . 30,100 27,500 2,600 9.5 30,000
NONFARM EMPLOYMENT ESTIMATESNEW LONDON LMANEW LONDON LMANEW LONDON LMANEW LONDON LMANEW LONDON LMA
For further information on the New London Labor Market Area contact Lincoln Dyer at (860) 566-3470.
For further information on the Stamford Labor Market Area contact Joseph Slepski at (860) 566-7823.
STSTSTSTSTAMFORD LMAAMFORD LMAAMFORD LMAAMFORD LMAAMFORD LMA
1818181818

August 1998 THE CONNECTICUT ECONOMIC DIGEST ●●●●●
Not Seasonally Adjusted
JUN JUN CHANGE MAY 1998 1997 NO. % 1998
TOTAL NONFARM EMPLOYMENT . . . . . . . . . . . 89,400 87,700 1,700 1.9 88,600 GOODS PRODUCING INDUSTRIES . . . . . . . . . . 22,900 22,600 300 1.3 22,600 CONSTRUCTION & MINING . . . . . . . . . . . . . . . . 3,600 3,400 200 5.9 3,500 MANUFACTURING . . . . . . . . . . . . . . . . . . . . . . . . 19,300 19,200 100 0.5 19,100 Durable Goods . . . . . . . . . . . . . . . . . . . . . . . . . . 15,100 14,900 200 1.3 14,900 Primary Metals . . . . . . . . . . . . . . . . . . . . . . . . . . 800 700 100 14.3 700 Fabricated Metals . . . . . . . . . . . . . . . . . . . . . . . 6,700 6,500 200 3.1 6,600 Machinery & Electric Equipment . . . . . . . . . . . 5,100 5,100 0 0.0 4,900 Nondurable Goods. . . . . . . . . . . . . . . . . . . . . . . 4,200 4,300 -100 -2.3 4,200 Paper, Printing & Publishing . . . . . . . . . . . . . . 1,300 1,200 100 8.3 1,300 SERVICE PRODUCING INDUSTRIES . . . . . . . . . 66,500 65,100 1,400 2.2 66,000 TRANS., COMM. & UTILITIES . . . . . . . . . . . . . . . 3,700 3,600 100 2.8 3,700 TRADE . . . . . . . . . . . . . . . . . . . . . . . . . . . . . . . . . . 18,900 17,700 1,200 6.8 19,000 Wholesale . . . . . . . . . . . . . . . . . . . . . . . . . . . . . . 2,900 3,200 -300 -9.4 3,000 Retail . . . . . . . . . . . . . . . . . . . . . . . . . . . . . . . . . . 16,000 14,500 1,500 10.3 16,000 FINANCE, INS. & REAL ESTATE. . . . . . . . . . . . . 4,300 4,300 0 0.0 4,200 SERVICES . . . . . . . . . . . . . . . . . . . . . . . . . . . . . . . 27,100 27,000 100 0.4 26,600 Personal & Business . . . . . . . . . . . . . . . . . . . . . 7,400 6,800 600 8.8 7,200 Health Services . . . . . . . . . . . . . . . . . . . . . . . . . 10,200 10,300 -100 -1.0 10,100 GOVERNMENT . . . . . . . . . . . . . . . . . . . . . . . . . . . 12,500 12,500 0 0.0 12,500 Federal . . . . . . . . . . . . . . . . . . . . . . . . . . . . . . . . . 800 800 0 0.0 800 State & Local . . . . . . . . . . . . . . . . . . . . . . . . . . . . 11,700 11,700 0 0.0 11,700
Current month's data are preliminary. Prior months' data have been revised. All data are benchmarked to March 1997. *Total excludes workers idled due to labor-management disputes.
Not Seasonally Adjusted
JUN JUN CHANGE MAY 1998 1997 NO. % 1998
TOTAL NONFARM EMPLOYMENT . . . . . . . . . . . 29,400 29,200 200 0.7 28,900 GOODS PRODUCING INDUSTRIES . . . . . . . . . . 8,500 8,400 100 1.2 8,300 CONSTRUCTION & MINING . . . . . . . . . . . . . . . . 2,300 2,000 300 15.0 2,200 MANUFACTURING . . . . . . . . . . . . . . . . . . . . . . . . 6,200 6,400 -200 -3.1 6,100 Durable Goods . . . . . . . . . . . . . . . . . . . . . . . . . . 4,300 4,400 -100 -2.3 4,200 Primary & Fabricated Metals . . . . . . . . . . . . . . 500 500 0 0.0 500 Industrial Machinery . . . . . . . . . . . . . . . . . . . . . 1,100 1,200 -100 -8.3 1,100 Electronic Equipment . . . . . . . . . . . . . . . . . . . . 500 500 0 0.0 500 Other Durable Goods . . . . . . . . . . . . . . . . . . . . 2,200 2,200 0 0.0 2,100 Nondurable Goods. . . . . . . . . . . . . . . . . . . . . . . 1,900 2,000 -100 -5.0 1,900 Rubber & Plastics . . . . . . . . . . . . . . . . . . . . . . . 900 1,000 -100 -10.0 900 Other Nondurable Goods . . . . . . . . . . . . . . . . . 1,000 1,000 0 0.0 1,000 SERVICE PRODUCING INDUSTRIES . . . . . . . . . 20,900 20,800 100 0.5 20,600 TRANS., COMM. & UTILITIES . . . . . . . . . . . . . . . 600 700 -100 -14.3 600 TRADE . . . . . . . . . . . . . . . . . . . . . . . . . . . . . . . . . . 6,600 6,300 300 4.8 6,500 Wholesale . . . . . . . . . . . . . . . . . . . . . . . . . . . . . . 700 700 0 0.0 700 Retail . . . . . . . . . . . . . . . . . . . . . . . . . . . . . . . . . . 5,900 5,600 300 5.4 5,800 FINANCE, INS. & REAL ESTATE. . . . . . . . . . . . . 900 900 0 0.0 900 SERVICES . . . . . . . . . . . . . . . . . . . . . . . . . . . . . . . 9,400 9,400 0 0.0 9,200 GOVERNMENT . . . . . . . . . . . . . . . . . . . . . . . . . . . 3,400 3,500 -100 -2.9 3,400 Federal . . . . . . . . . . . . . . . . . . . . . . . . . . . . . . . . . 200 200 0 0.0 200 State & Local . . . . . . . . . . . . . . . . . . . . . . . . . . . . 3,200 3,300 -100 -3.0 3,200
TTTTTORRINGTORRINGTORRINGTORRINGTORRINGTON LMAON LMAON LMAON LMAON LMA
WWWWWAAAAATERBTERBTERBTERBTERBURURURURURY LMAY LMAY LMAY LMAY LMA
NONFARM EMPLOYMENT ESTIMATES
For further information on the Torrington Labor Market Area contact Joseph Slepski at (860) 566-7823.
For further information on the Waterbury Labor Market Area contact Joseph Slepski at (860) 566-7823.
1919191919

August 1998THE CONNECTICUT ECONOMIC DIGEST●●●●●
LABOR FORCE ESTIMATES
2020202020
EMPLOYMENT JUN JUN CHANG E MAY(Not seasonally adjusted) STATUS 1998 1997 NO. % 1998
CONNECTICUT Civilian Labor Force 1,746,100 1,750,100 -4,000 -0.2 1,716,300Employed 1,675,800 1,655,400 20,400 1.2 1,652,500
Unemployed 70,200 94,700 -24,500 -25.9 63,800Unemployment Rate 4.0 5.4 -1.4 --- 3.7
BRIDGEPORT LMA Civilian Labor Force 222,400 223,600 -1,200 -0.5 217,700Employed 211,600 209,300 2,300 1.1 207,900
Unemployed 10,800 14,300 -3,500 -24.5 9,800Unemployment Rate 4.9 6.4 -1.5 --- 4.5
DANBURY LMA Civilian Labor Force 110,300 109,500 800 0.7 108,900Employed 107,200 105,600 1,600 1.5 106,300
Unemployed 3,000 3,900 -900 -23.1 2,600Unemployment Rate 2.7 3.5 -0.8 --- 2.4
DANIELSON LMA Civilian Labor Force 34,500 34,200 300 0.9 33,600Employed 32,500 31,700 800 2.5 31,800
Unemployed 2,000 2,500 -500 -20.0 1,800Unemployment Rate 5.9 7.3 -1.4 --- 5.4
HARTFORD LMA Civilian Labor Force 590,000 594,600 -4,600 -0.8 582,500Employed 565,500 560,800 4,700 0.8 560,300
Unemployed 24,500 33,800 -9,300 -27.5 22,200Unemployment Rate 4.2 5.7 -1.5 --- 3.8
LOWER RIVER LMA Civilian Labor Force 12,700 12,600 100 0.8 12,400Employed 12,300 12,100 200 1.7 12,100
Unemployed 400 500 -100 -20.0 300Unemployment Rate 3.0 4.0 -1.0 --- 2.5
NEW HAVEN LMA Civilian Labor Force 271,500 276,500 -5,000 -1.8 268,200Employed 260,700 261,000 -300 -0.1 258,200
Unemployed 10,700 15,500 -4,800 -31.0 10,000Unemployment Rate 3.9 5.6 -1.7 --- 3.7
NEW LONDON LMA Civilian Labor Force 158,800 158,000 800 0.5 154,700Employed 151,600 148,700 2,900 2.0 148,200
Unemployed 7,100 9,300 -2,200 -23.7 6,600Unemployment Rate 4.5 5.9 -1.4 --- 4.2
STAMFORD LMA Civilian Labor Force 201,000 197,600 3,400 1.7 196,200Employed 195,700 190,900 4,800 2.5 191,500
Unemployed 5,300 6,600 -1,300 -19.7 4,700Unemployment Rate 2.7 3.4 -0.7 --- 2.4
TORRINGTON LMA Civilian Labor Force 39,700 39,700 0 0.0 39,000Employed 38,600 38,100 500 1.3 37,900
Unemployed 1,100 1,600 -500 -31.3 1,000Unemployment Rate 2.7 3.9 -1.2 --- 2.7
WATERBURY LMA Civilian Labor Force 121,700 120,300 1,400 1.2 119,400Employed 116,100 113,000 3,100 2.7 114,200
Unemployed 5,600 7,300 -1,700 -23.3 5,200Unemployment Rate 4.6 6.1 -1.5 --- 4.4
UNITED STATES Civilian Labor Force 138,798,000 137,557,000 1,241,000 0.9 137,240,000Employed 132,265,000 130,463,000 1,802,000 1.4 131,476,000
Unemployed 6,534,000 7,094,000 -560,000 -7.9 5,764,000Unemployment Rate 4.7 5.2 -0.5 --- 4.2
Current month's data are preliminary. Prior months' data have been revised. All data are benchmarked to March 1997.

August 1998 THE CONNECTICUT ECONOMIC DIGEST ●●●●●
MANUFACTURING HOURS AND EARNINGS
NEW HOUSING PERMITS
2121212121
AVG WEEKLY EARNINGS AVG WEEKLY HOURS AVG HOURLY EARNINGSJUN CHG MAY JUN CHG MAY JUN CHG MAY
(Not seasonally adjusted) 1998 1997 Y/Y 1998 1998 1997 Y/Y 1998 1998 1997 Y/Y 1998MANUFACTURING $638.31 $611.15 $27.16 $632.78 43.1 42.5 0.6 42.9 $14.81 $14.38 $0.43 $14.75 DURABLE GOODS 654.26 625.31 28.96 648.43 43.3 42.8 0.5 43.2 15.11 14.61 0.50 15.01 Lumber & Furniture 491.47 468.86 22.61 482.57 41.3 41.9 -0.6 41.0 11.90 11.19 0.71 11.77 Stone, Clay and Glass 639.72 593.12 46.60 630.09 46.9 44.0 2.9 45.2 13.64 13.48 0.16 13.94 Primary Metals 650.54 603.37 47.17 625.95 46.5 44.3 2.2 45.0 13.99 13.62 0.37 13.91 Fabricated Metals 597.02 586.77 10.26 598.84 43.2 43.4 -0.2 43.3 13.82 13.52 0.30 13.83 Machinery 700.00 676.85 23.16 698.34 44.7 44.5 0.2 45.2 15.66 15.21 0.45 15.45 Electrical Equipment 505.77 488.35 17.42 501.43 40.3 40.9 -0.6 40.9 12.55 11.94 0.61 12.26 Trans. Equipment 829.39 768.53 60.86 823.44 44.4 41.7 2.7 43.8 18.68 18.43 0.25 18.80 Instruments 595.94 601.80 -5.86 592.56 41.5 42.5 -1.0 41.7 14.36 14.16 0.20 14.21 Miscellaneous Mfg 601.38 574.43 26.94 591.64 42.5 42.9 -0.4 42.2 14.15 13.39 0.76 14.02 NONDUR. GOODS 599.25 578.64 20.61 595.02 42.5 41.9 0.6 42.2 14.10 13.81 0.29 14.10 Food 551.15 504.78 46.37 541.58 43.5 42.1 1.4 43.5 12.67 11.99 0.68 12.45 Textiles 495.13 469.70 25.43 476.19 42.5 41.9 0.6 41.3 11.65 11.21 0.44 11.53 Apparel 351.14 337.79 13.35 338.13 40.5 39.6 0.9 39.0 8.67 8.53 0.14 8.67 Paper 696.78 704.09 -7.31 700.57 44.1 46.2 -2.1 44.2 15.80 15.24 0.56 15.85 Printing & Publishing 576.24 549.17 27.07 582.43 38.7 37.9 0.8 39.3 14.89 14.49 0.40 14.82 Chemicals 804.15 783.15 21.00 797.45 45.0 45.4 -0.4 44.6 17.87 17.25 0.62 17.88 Rubber & Misc. Plast. 526.80 497.12 29.68 520.80 43.9 41.6 2.3 43.4 12.00 11.95 0.05 12.00CONSTRUCTION 822.36 788.95 33.41 822.48 42.0 42.1 -0.1 42.2 19.58 18.74 0.84 19.49
LMAs AVG WEEKLY EARNINGS AVG WEEKLY HOURS AVG HOURLY EARNINGS JUN CHG MAY JUN CHG MAY JUN CHG MAY
MANUFACTURING 1998 1997 Y/Y 1998 1998 1997 Y/Y 1998 1998 1997 Y/Y 1998Bridgeport $655.87 $632.58 $23.29 $652.88 42.7 42.8 -0.1 42.7 $15.36 $14.78 $0.58 $15.29Danbury 640.93 640.92 0.01 645.79 42.9 43.6 -0.7 43.4 14.94 14.70 0.24 14.88Danielson 469.13 463.73 5.40 467.78 40.2 40.5 -0.3 40.5 11.67 11.45 0.22 11.55Hartford 672.88 643.81 29.07 667.44 43.3 42.3 1.0 43.2 15.54 15.22 0.32 15.45Lower River 540.42 525.81 14.61 536.07 40.3 42.2 -1.9 41.3 13.41 12.46 0.95 12.98New Haven 631.73 602.62 29.11 614.24 42.8 42.8 0.0 42.1 14.76 14.08 0.68 14.59New London 643.02 613.79 29.23 643.58 42.0 41.5 0.5 41.9 15.31 14.79 0.52 15.36Stamford 547.37 553.78 -6.41 545.60 40.1 40.6 -0.5 40.0 13.65 13.64 0.01 13.64Torrington 541.73 533.41 8.32 546.04 41.8 42.2 -0.4 42.1 12.96 12.64 0.32 12.97Waterbury 613.02 589.19 23.83 604.15 43.6 44.3 -0.7 43.0 14.06 13.30 0.76 14.05
Current month's data are preliminary. Prior months' data have been revised. All data are benchmarked to March 1997.
JUN JUN CHANGE Y/Y YTD CHANGE YTD MAY1998 1997 UNITS % 1998 1997 UNITS % 1998
Connecticut 1,203 886 317 35.8 5,313 4,616 697 15.1 1051Counties:Fairfield 353 150 203 135.3 1,271 997 274 27.5 243Hartford 277 158 119 75.3 1,447 1,098 349 31.8 330Litchfield 70 71 -1 -1.4 340 319 21 6.6 71Middlesex 75 57 18 31.6 337 278 59 21.2 51New Haven 179 292 -113 -38.7 961 1,166 -205 -17.6 183New London 92 73 19 26.0 440 375 65 17.3 83Tolland 123 47 76 161.7 350 238 112 47.1 54Windham 34 38 -4 -10.5 167 145 22 15.2 36

August 1998THE CONNECTICUT ECONOMIC DIGEST●●●●●
HOUSING PERMIT ACTIVITY BY TOWN
2222222222
TOWN JUN TOWN JUN TOWN JUN1998 1998 1997 1998 1998 1997 1998 1998 1997
Andover 1 13 14 Griswold 2 16 27 Preston 3 8 10Ansonia 2 9 7 Groton 19 63 35 Prospect 7 26 23Ashford 2 14 9 Guilford 17 81 63 Putnam 2 6 6Avon 73 121 55 Haddam 2 9 13 Reddin g 4 22 14Barkhamsted 5 17 10 Hamden 0 57 68 Ridgefield 14 68 63Beacon Falls 1 14 13 Hampton 2 8 7 Rocky Hill 12 51 44Berlin 7 42 36 Hartford 0 62 5 Roxbur y 3 12 5Bethany 3 15 15 Hartland 1 3 3 Salem 2 9 8Bethel 4 19 19 Harwinton 2 10 16 Salisbur y 2 6 0Bethlehem 1 6 6 Hebron 8 38 31 Scotland 1 10 9
Bloomfield 3 17 24 Kent 1 6 6 Seymour 7 24 36Bolton 1 9 13 Killin gly 5 14 20 Sharon 0 2 1Bozrah 1 4 4 Killin gworth 6 28 23 Shelton 20 122 79Branford 4 17 27 Lebanon 4 14 25 Sherman 1 9 8Brid geport 18 76 45 Ledyard 8 42 23 Simsbur y 15 44 35Brid gewater 0 5 2 Lisbon 2 11 11 Somers 7 17 17Bristol 11 44 44 Litchfield 5 19 15 South Windsor 12 74 56Brookfield 3 19 29 Lyme 2 8 5 Southbury 11 53 46Brookl yn 2 4 1 Madison 7 54 42 Southin gton 22 115 64Burlin gton 3 21 26 Manchester 1 262 282 Spra gue 0 1 1
Canaan 0 0 2 Mansfield 8 26 19 Stafford 5 19 14Canterbury 2 11 10 Marlborou gh 4 17 15 Stamford 29 116 104Canton 4 18 12 Meriden 8 28 19 Sterlin g 1 7 10Chaplin 2 9 6 Middlebury 2 10 12 Stonin gton 8 45 37Cheshire 14 53 121 Middlefield 2 7 8 Stratford 9 23 32Chester 1 6 13 Middletown 16 68 62 Suffield 6 139 25Clinton 10 42 20 Milford 10 61 92 Thomaston 8 22 19Colchester 9 50 52 Monroe 10 59 65 Thompson 1 11 10Colebrook 2 6 1 Montville 8 23 11 Tolland 15 58 46Columbia 2 15 9 Morris 1 4 1 Torrin gton 8 34 37
Cornwall 0 4 3 Naugatuck 8 27 19 Trumbull 11 69 47Coventry 8 28 28 New Britain 1 3 5 Union 1 2 1Cromwell 2 25 10 New Canaan 5 25 22 Vernon 2 13 14Danbur y 120 215 91 New Fairfield 2 14 22 Voluntown 4 12 8Darien 1 11 17 New Hartford 2 13 16 Wallin gford 19 94 65Deep River 2 11 8 New Haven 0 50 0 Warren 1 4 3Derby 3 15 15 New London 0 1 0 Washin gton 1 5 8Durham 4 22 22 New Milford 12 54 56 Waterbur y 6 30 20East Granby 2 9 11 Newin gton 11 58 24 Waterford 5 40 23East Haddam 8 34 31 Newtown 49 141 80 Watertown 5 38 51
East Hampton 6 22 12 Norfolk 0 1 1 West Hartford 1 8 5East Hartford 0 1 2 North Branford 4 33 37 West Haven 0 10 32East Haven 5 31 114 North Canaan 0 2 3 Westbrook 11 32 15East L yme 9 40 44 North Haven 11 68 27 Weston 1 8 6East Windsor 1 14 6 No. Stonin gton 3 22 13 Westport 5 23 15Eastford 1 6 4 Norwalk 7 63 45 Wethersfield 8 47 39Easton 5 22 16 Norwich 2 15 16 Willin gton 1 7 2Ellin gton 64 105 30 Old Lyme 1 16 18 Wilton 6 22 36Enfield 8 35 37 Old Sa ybrook 1 11 23 Winchester 1 6 4Essex 3 15 10 Orange 2 10 13 Windham 3 15 6
Fairfield 13 69 61 Oxford 9 47 24 Windsor 8 24 22Farmin gton 19 66 86 Plainfield 2 17 19 Windsor Locks 1 5 10Franklin 0 0 4 Plainville 3 13 18 Wolcott 14 32 110Glastonbury 34 111 80 Plymouth 3 17 9 Woodbrid ge 5 12 106Goshen 0 7 16 Pomfret 3 13 14 Woodbur y 7 40 28Granby 6 23 27 Portland 1 5 8 Woodstock 5 22 14Greenwich 16 56 81
YR TO DATE YR TO DATE YR TO DATE

August 1998 THE CONNECTICUT ECONOMIC DIGEST ●●●●●
TECHNICAL NOTESBUSINESS STBUSINESS STBUSINESS STBUSINESS STBUSINESS STARARARARARTS AND TERMINATS AND TERMINATS AND TERMINATS AND TERMINATS AND TERMINATIONSTIONSTIONSTIONSTIONSDOL newly registered employers are those businesses newly registered with the Labor Department’s unemployment insurance program (includ-ing reopened accounts) during the month. DOL discontinued employers are those accounts that are terminated due to inactivity (no employees)or business closure. Registrations and terminations of business entities as recorded with the Secretary of the State are an indication of newbusiness formation and activity. These registrations include limited liability companies, limited liability partnerships, and foreign-owned (out-of-state) and domestic-owned (in-state) corporations.
CONSUMER PRICE INDEXCONSUMER PRICE INDEXCONSUMER PRICE INDEXCONSUMER PRICE INDEXCONSUMER PRICE INDEXThe Consumer Price Index (CPI), computed and published by the U.S. Bureau of Labor Statistics, is a measure of the average change in pricesover time in a fixed market basket of goods and services. It is based on prices of food, clothing, shelter, fuels, transportation fares, charges fordoctors’ and dentists’ services, drugs and other goods and services that people buy for their day-to-day living. The Northeast region is comprisedof the New England states, New York, New Jersey and Pennsylvania. There is no separate consumer price index for Connecticut or any area withinthe state.
EMPLOYMENT COST INDEXEMPLOYMENT COST INDEXEMPLOYMENT COST INDEXEMPLOYMENT COST INDEXEMPLOYMENT COST INDEXThe Employment Cost Index (ECI) covers both wages and salaries and employer costs for employee benefits for all occupations and establish-ments in both the private nonfarm sector and state and local government. The ECI measures employers’ labor costs free from the influences ofemployment shifts among industries and occupations. The base period for all data is June 1989 when the ECI is 100.
HOURS AND EARNINGS ESTIMAHOURS AND EARNINGS ESTIMAHOURS AND EARNINGS ESTIMAHOURS AND EARNINGS ESTIMAHOURS AND EARNINGS ESTIMATESTESTESTESTESProduction worker earnings and hours estimates include full- and part-time employees working within manufacturing industries. Hours workedand earnings data are computed based on payroll figures for the week including the 12th of the month. Average hourly earnings are affected bysuch factors as premium pay for overtime and shift differential as well as changes in basic hourly and incentive rates of pay. Average weeklyearnings are the product of weekly hours worked and hourly earnings.
INITIAL CLAIMSINITIAL CLAIMSINITIAL CLAIMSINITIAL CLAIMSINITIAL CLAIMSAverage weekly initial claims are calculated by dividing the total number of new claims for unemployment insurance received in the month by thenumber of weeks in the month. A minor change in methodology takes effect with data published in the March 1997 issue of the DIGEST. Datahave been revised back to January 1980.
INSURED UNEMPLOYMENT RAINSURED UNEMPLOYMENT RAINSURED UNEMPLOYMENT RAINSURED UNEMPLOYMENT RAINSURED UNEMPLOYMENT RATETETETETEPrimarily a measure of unemployment insurance program activity, the insured unemployment rate is the 13-week average of the number ofpeople claiming unemployment benefits divided by the number of workers covered by the unemployment insurance system.
LABOR FORCE ESTIMALABOR FORCE ESTIMALABOR FORCE ESTIMALABOR FORCE ESTIMALABOR FORCE ESTIMATESTESTESTESTESLabor force estimates are a measure of the work status of people who live in Connecticut. Prepared under the direction of the U.S. Bureau ofLabor Statistics, the statewide estimates are the product of a multiple variable coefficient regression model, which uses results from the CurrentPopulation Survey (CPS), a monthly survey of Connecticut households, counts of claimants for unemployment benefits, and establishmentemployment estimates. Due to the small size of the sample taken in Connecticut, the CPS results are subject to significant sampling error andproduce considerable month-to-month fluctuations in estimates derived from the sample. In general, the CPS estimates, at the 90 percentconfidence level, have an error range of about 1.5 percentage points on a rate of 6.0 percent. An accepted method for calculating the error rangefor model estimates is currently not available. Labor force data, reflecting persons employed by place of residence, are not directly comparable tothe place-of-work industry employment series. In the labor force estimates, workers involved in labor disputes are counted as employed. Thelabor force data also includes agricultural workers, unpaid family workers, domestics and the self-employed. Because of these conceptualdifferences, total labor force employment is almost always different from nonfarm wage and salary employment.
LABOR MARKET AREASLABOR MARKET AREASLABOR MARKET AREASLABOR MARKET AREASLABOR MARKET AREASAll Labor Market Areas in Connecticut except three are federally designated areas for developing labor statistics. Industry employment data forthe Danielson, Lower River and Torrington Labor Market Areas are prepared exclusively by the Connecticut Department of Labor, following thesame statistical procedures used to prepare estimates for the other Labor Market Areas, which are developed in cooperation with the U.S.Department of Labor, Bureau of Labor Statistics.
The Bureau of Labor Statistics has identified the five towns of Canaan, Kent, North Canaan, Salisbury and Sharon as a separate area forreporting labor force data. For the convenience of our data users, data for these towns are included in the Torrington Labor Market Area. For thesame purpose, data for the town of Thompson, which is officially part of the Worcester Metropolitan Statistical Area, are included in theDanielson Labor Market Area. Also, data for Hopkinton and Westerly, Rhode Island are included in the New London Labor Market Area.
LEADING AND COINCIDENT EMPLOYMENT INDICESLEADING AND COINCIDENT EMPLOYMENT INDICESLEADING AND COINCIDENT EMPLOYMENT INDICESLEADING AND COINCIDENT EMPLOYMENT INDICESLEADING AND COINCIDENT EMPLOYMENT INDICESThe leading employment index is a composite of five individual employment-related series -the average workweek of manufacturing productionworkers, Hartford help-wanted advertising, short-duration (less than 15 weeks) unemployment rate, initial claims for unemployment insuranceand total housing permits. While not an employment-sector variable, housing permits are closely related to construction employment. Thecoincident employment index is a composite indicator of four individual employment-related series -the total unemployment rate, nonfarmemployment (employer survey), total employment (household survey) and the insured unemployment rate. All data are seasonally adjusted andcome from the Connecticut Labor Department and from the Federal Reserve Bank of Boston.
NONFNONFNONFNONFNONFARM EMPLOYMENT ESTIMAARM EMPLOYMENT ESTIMAARM EMPLOYMENT ESTIMAARM EMPLOYMENT ESTIMAARM EMPLOYMENT ESTIMATESTESTESTESTESNonfarm employment estimates are derived from a survey of businesses to measure jobs by industry. The estimates include all full- and part-time wage and salary employees who worked during or received pay for the pay period which includes the 12th of the month. Excluded fromthese estimates are proprietors, self-employed workers, private household employees and unpaid family workers. In some cases, due to spaceconstraints, all industry estimates are not shown. Call (860) 566-7823 for a more comprehensive breakout of nonfarm employment estimates.
UI COVERED WUI COVERED WUI COVERED WUI COVERED WUI COVERED WAGESAGESAGESAGESAGESUI covered wages is the total amount paid to those employees who are covered under the Connecticut’s Unemployment Insurance (UI) law forservices performed during the quarter. The fluctuations in the 1992-93 period reflect the effect of the changes in the tax law and the massiverestructuring in the state’s economy.
2323232323

August 1998THE CONNECTICUT ECONOMIC DIGEST●●●●●
ECONOMIC DIGESTTHE CONNECTICUT
❑ If you wish to have your name removed from our mailing list, please
check here and return this page to the address at left.
❑ If your address has changed, please check here, make the necessarychanges to your address label and return this page to the address atleft.
❑ If you receive more than one copy of this publication, please checkhere and return this page from the duplicate copy to the address at left.
ECONOMIC INDICATORS AT A GLANCE
Leading Employment IndexLeading Employment IndexLeading Employment IndexLeading Employment IndexLeading Employment Index ............................................. +2.7+2.7+2.7+2.7+2.7Coincident Employment IndexCoincident Employment IndexCoincident Employment IndexCoincident Employment IndexCoincident Employment Index ......................... +7.9+7.9+7.9+7.9+7.9
TTTTTotal Nonfotal Nonfotal Nonfotal Nonfotal Nonfarararararm Emplom Emplom Emplom Emplom Employmentymentymentymentyment ............................................. +2.1+2.1+2.1+2.1+2.1
UnemploymentUnemploymentUnemploymentUnemploymentUnemployment ....................................................................................................................................... -1.4*-1.4*-1.4*-1.4*-1.4* Labor Force .................................... -0.2 Employed ...................................... +1.3 Unemployed ................................. -27.3
AAAAAvvvvverererererage age age age age WWWWWeekly Initial Claimseekly Initial Claimseekly Initial Claimseekly Initial Claimseekly Initial Claims ................................... -0.2-0.2-0.2-0.2-0.2Help Help Help Help Help WWWWWanted Indeanted Indeanted Indeanted Indeanted Index -- Harx -- Harx -- Harx -- Harx -- Hartftftftftfordordordordord .............................. +2.6+2.6+2.6+2.6+2.6AAAAAvvvvverererererage Insage Insage Insage Insage Ins..... Unempl. Unempl. Unempl. Unempl. Unempl. Rate Rate Rate Rate Rate ........................................ -0.38*-0.38*-0.38*-0.38*-0.38*
AAAAAvvvvverererererage age age age age WWWWWeekly Hourseekly Hourseekly Hourseekly Hourseekly Hours, Mfg, Mfg, Mfg, Mfg, Mfg ............................................. +1.4+1.4+1.4+1.4+1.4AAAAAvvvvverererererage Hourage Hourage Hourage Hourage Hourly Early Early Early Early Earningsningsningsningsnings, Mfg, Mfg, Mfg, Mfg, Mfg .............................. +3.0+3.0+3.0+3.0+3.0AAAAAvvvvverererererage age age age age WWWWWeekly Eareekly Eareekly Eareekly Eareekly Earningsningsningsningsnings, Mfg, Mfg, Mfg, Mfg, Mfg ......................... +4.4+4.4+4.4+4.4+4.4Manufacturing OutputManufacturing OutputManufacturing OutputManufacturing OutputManufacturing Output .......................................................................................... +3.6+3.6+3.6+3.6+3.6 Production Worker Hours ............... +0.7 Productivity .................................... +2.8
Personal IncomePersonal IncomePersonal IncomePersonal IncomePersonal Income ............................................................................................................................. +6.1+6.1+6.1+6.1+6.1UI CoUI CoUI CoUI CoUI Covvvvvered ered ered ered ered WWWWWagesagesagesagesages ................................................................................................................... +7.7+7.7+7.7+7.7+7.7
Business ActivityBusiness ActivityBusiness ActivityBusiness ActivityBusiness Activity New Housing Permits .................. +35.8 Electricity Sales ............................. +1.1 Retail Sales ................................. +21.8 Construction Contracts Index ........ -17.9 New Auto Registrations ................ +20.3 Air Cargo Tons ............................... +9.9
Business StartsBusiness StartsBusiness StartsBusiness StartsBusiness Starts Secretary of the State .................. +20.2 Dept. of Labor .............................. +21.0
Business Business Business Business Business TTTTTerererererminationsminationsminationsminationsminations Secretary of the State .................. +17.2 Dept. of Labor .............................. +45.6
State State State State State TTTTTax Collectionsax Collectionsax Collectionsax Collectionsax Collections ............................................................................................... +6.6+6.6+6.6+6.6+6.6 Corporate Tax ................................. +0.2 Personal Income Tax .................... +14.2 Real Estate Conveyance Tax .......... +0.7 Sales & Use Tax ............................. +3.2
TTTTTourourourourourism and ism and ism and ism and ism and TTTTTrrrrraaaaavvvvvelelelelel Tourism Inquiries ............................. -8.8 Tourism Info Centers ...................... +8.7 Attraction Visitors ......................... +21.7 Hotel-Motel Occupancy .................. +2.2 Air Passenger Count ..................... +4.3
Employment Cost Index (U.S.)Employment Cost Index (U.S.)Employment Cost Index (U.S.)Employment Cost Index (U.S.)Employment Cost Index (U.S.) Total ............................................... +3.5 Wages & Salaries .......................... +4.0 Benefit Costs ................................. +2.6
Consumer Price IndexConsumer Price IndexConsumer Price IndexConsumer Price IndexConsumer Price Index U.S. City Average........................... +1.7 Northeast Region ........................... +1.6 NY-NJ-Long Island ......................... +1.3 Boston-Brockton-Nashua ............... +2.5Consumer ConfidenceConsumer ConfidenceConsumer ConfidenceConsumer ConfidenceConsumer Confidence U.S. ............................................... +5.9 New England .............................. +29.2
Interest RatesInterest RatesInterest RatesInterest RatesInterest Rates Prime .............................................. 0.0* Conventional Mortgage ............... -0.69*
A joint publication of The Connecticut Departments of Labor and Economic and Community Development
Mailing address:
Connecticut Economic DigestConnecticut Economic DigestConnecticut Economic DigestConnecticut Economic DigestConnecticut Economic DigestConnecticut Department of LaborConnecticut Department of LaborConnecticut Department of LaborConnecticut Department of LaborConnecticut Department of Labor
Office of ResearchOffice of ResearchOffice of ResearchOffice of ResearchOffice of Research200 Folly Brook Boulevard200 Folly Brook Boulevard200 Folly Brook Boulevard200 Folly Brook Boulevard200 Folly Brook Boulevard
WWWWWethersfield, CT 06109-1114ethersfield, CT 06109-1114ethersfield, CT 06109-1114ethersfield, CT 06109-1114ethersfield, CT 06109-1114
THE CONNECTICUT ECONOMIC DIGEST
*Percentage point change; **Less than 0.05 percent; NA = Not Available
The Connecticut Economic Digest is available on the internet at:http://wwwhttp://wwwhttp://wwwhttp://wwwhttp://www.ctdol.state.ctdol.state.ctdol.state.ctdol.state.ctdol.state.ct.us.ct.us.ct.us.ct.us.ct.us
orhttp://wwwhttp://wwwhttp://wwwhttp://wwwhttp://www.state.state.state.state.state.ct.us/ecd/research.ct.us/ecd/research.ct.us/ecd/research.ct.us/ecd/research.ct.us/ecd/research
August 1998
(Percent change from prior year; see pages 5-9 for reference months)(Percent change from prior year; see pages 5-9 for reference months)(Percent change from prior year; see pages 5-9 for reference months)(Percent change from prior year; see pages 5-9 for reference months)(Percent change from prior year; see pages 5-9 for reference months)