the connecticut economic digest · o2 the connecticut economic digest january 2015 connecticut...
TRANSCRIPT
THE CONNECTICUT
ECONOMIC DIGESTJANUARY 2015
January 2015
Economic Indicators on the Overall Economy ......................... 5 Individual Data Items ......................... 6-8Comparative Regional Data .............. 9Economic Indicator Trends ........ 10-11Help Wanted OnLine ........................ 15Business and Employment ChangesAnnounced in the News Media ...... 19Labor Market Areas: Nonfarm Employment .................... 12-17 Sea. Adj. Nonfarm Employment ..........14 Labor Force ............................................ 18 Hours and Earnings .............................. 19Cities and Towns: Labor Force ..................................... 20-21 Housing Permits .................................... 22Technical Notes ............................... 23At a Glance ....................................... 24
The 2015 Economic Outlook......................................... 1-5
IN THIS ISSUE...
In November...Nonfarm Employment Connecticut..................... 1,687,100 Change over month ........... +0.27% Change over year ................ +1.5%
United States .............. 140,045,000 Change over month ........... +0.23% Change over year ................. +2.0%
Unemployment Rate Connecticut............................. 6.5% United States .......................... 5.8%
Consumer Price Index United States ...................... 236.151 Change over year .................. +1.3%
Vol.20 No.1 A joint publication of the Connecticut Department of Labor & the Connecticut Department of Economic and Community Development
By Mark R. Prisloe, Associate Economist, ([email protected]), DECDThe 2015 Economic OutlookThe 2015 Economic OutlookThe 2015 Economic OutlookThe 2015 Economic OutlookThe 2015 Economic Outlook
A s we begin a new year, thisissue of the Digest looks at
the economic prospects for 2015.As usual, this annual outlookattempts to interpret recent dataand their trends, and to offersome insights about what islikely for the U.S. andConnecticut economies in theyear ahead.
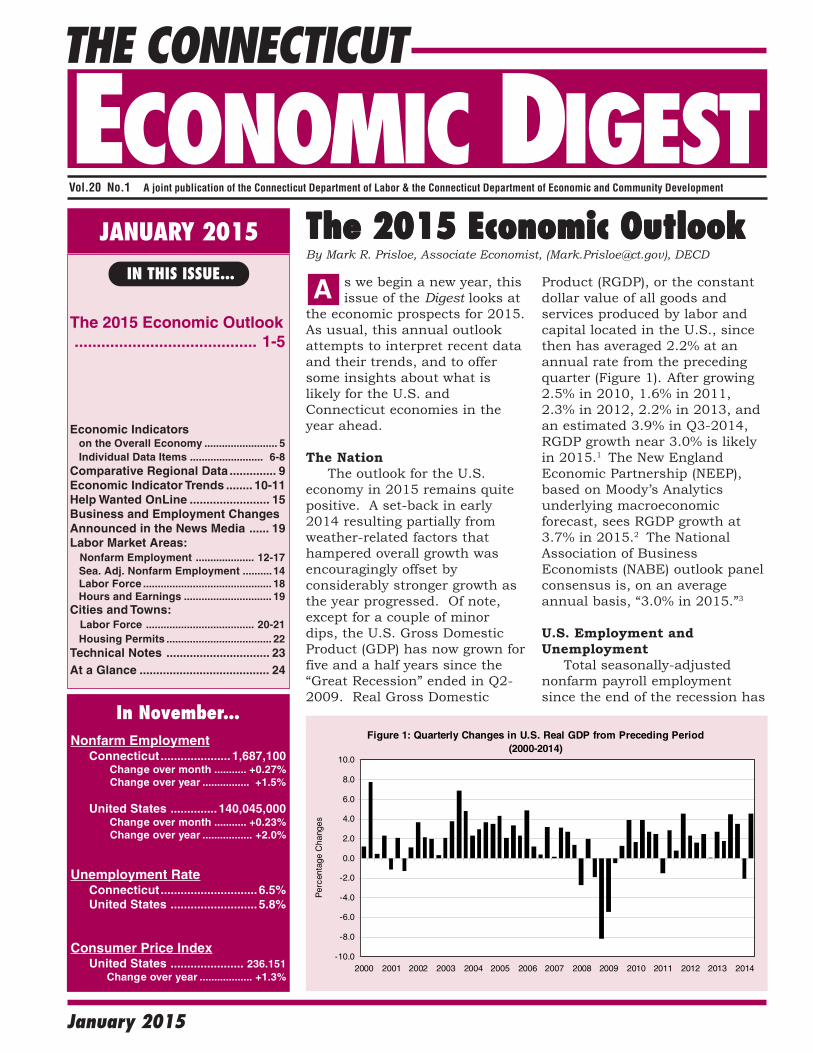
The Nation The outlook for the U.S.economy in 2015 remains quitepositive. A set-back in early2014 resulting partially fromweather-related factors thathampered overall growth wasencouragingly offset byconsiderably stronger growth asthe year progressed. Of note,except for a couple of minordips, the U.S. Gross DomesticProduct (GDP) has now grown forfive and a half years since the“Great Recession” ended in Q2-2009. Real Gross Domestic
Product (RGDP), or the constantdollar value of all goods andservices produced by labor andcapital located in the U.S., sincethen has averaged 2.2% at anannual rate from the precedingquarter (Figure 1). After growing2.5% in 2010, 1.6% in 2011,2.3% in 2012, 2.2% in 2013, andan estimated 3.9% in Q3-2014,RGDP growth near 3.0% is likelyin 2015.1 The New EnglandEconomic Partnership (NEEP),based on Moody’s Analyticsunderlying macroeconomicforecast, sees RGDP growth at3.7% in 2015.2 The NationalAssociation of BusinessEconomists (NABE) outlook panelconsensus is, on an averageannual basis, “3.0% in 2015.”3
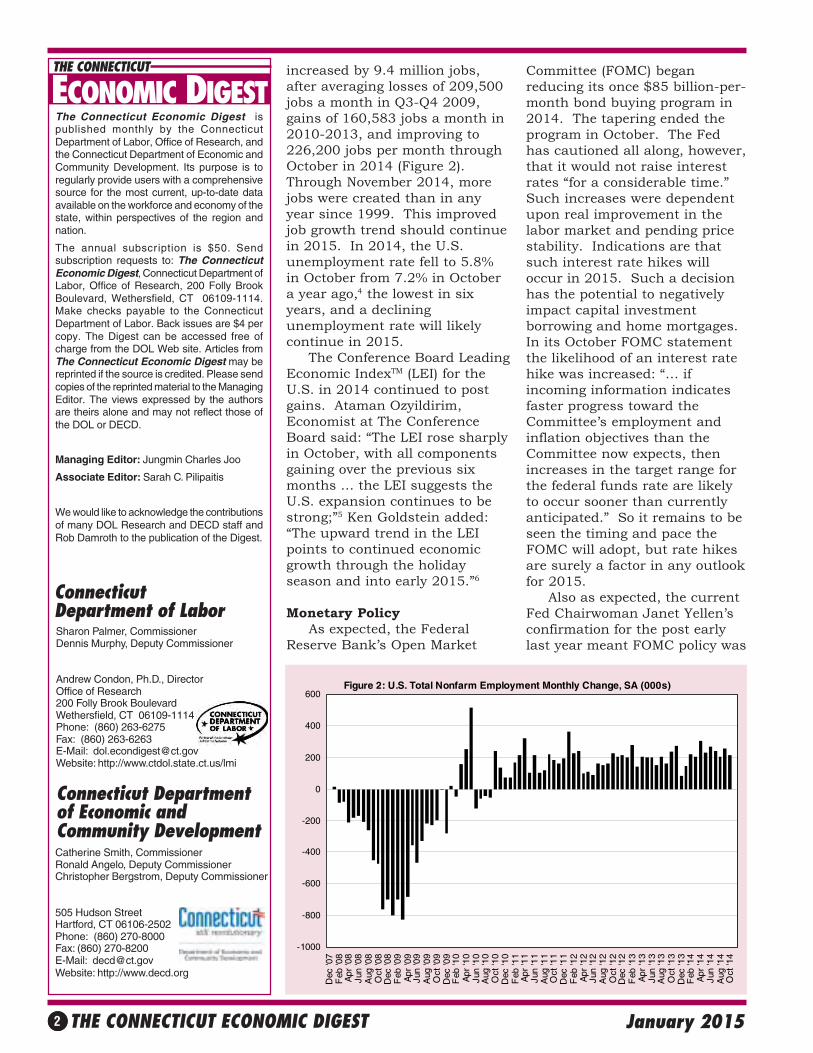
U.S. Employment andUnemployment Total seasonally-adjustednonfarm payroll employmentsince the end of the recession has
Figure 1: Quarterly Changes in U.S. Real GDP from Preceding Period (2000-2014)
-10.0
-8.0
-6.0
-4.0
-2.0
0.0
2.0
4.0
6.0
8.0
10.0
2000 2001 2002 2003 2004 2005 2006 2007 2008 2009 2010 2011 2012 2013 2014
Per
cent
age
Cha
nges
THE CONNECTICUT ECONOMIC DIGEST2 January 2015
ConnecticutDepartment of Labor
Connecticut Departmentof Economic andCommunity Development
THE CONNECTICUT
The Connecticut Economic Digest ispublished monthly by the ConnecticutDepartment of Labor, Office of Research, andthe Connecticut Department of Economic andCommunity Development. Its purpose is toregularly provide users with a comprehensivesource for the most current, up-to-date dataavailable on the workforce and economy of thestate, within perspectives of the region andnation.
The annual subscription is $50. Sendsubscription requests to: The ConnecticutEconomic Digest, Connecticut Department ofLabor, Office of Research, 200 Folly BrookBoulevard, Wethersfield, CT 06109-1114.Make checks payable to the ConnecticutDepartment of Labor. Back issues are $4 percopy. The Digest can be accessed free ofcharge from the DOL Web site. Articles fromThe Connecticut Economic Digest may bereprinted if the source is credited. Please sendcopies of the reprinted material to the ManagingEditor. The views expressed by the authorsare theirs alone and may not reflect those ofthe DOL or DECD.
Managing Editor: Jungmin Charles Joo
Associate Editor: Sarah C. Pilipaitis
We would like to acknowledge the contributionsof many DOL Research and DECD staff andRob Damroth to the publication of the Digest.
Catherine Smith, CommissionerRonald Angelo, Deputy CommissionerChristopher Bergstrom, Deputy Commissioner
505 Hudson StreetHartford, CT 06106-2502Phone: (860) 270-8000Fax: (860) 270-8200E-Mail: [email protected]: http://www.decd.org
Sharon Palmer, CommissionerDennis Murphy, Deputy Commissioner
Andrew Condon, Ph.D., DirectorOffice of Research200 Folly Brook BoulevardWethersfield, CT 06109-1114Phone: (860) 263-6275Fax: (860) 263-6263E-Mail: [email protected]: http://www.ctdol.state.ct.us/lmi
ECONOMIC DIGESTincreased by 9.4 million jobs,after averaging losses of 209,500jobs a month in Q3-Q4 2009,gains of 160,583 jobs a month in2010-2013, and improving to226,200 jobs per month throughOctober in 2014 (Figure 2).Through November 2014, morejobs were created than in anyyear since 1999. This improvedjob growth trend should continuein 2015. In 2014, the U.S.unemployment rate fell to 5.8%in October from 7.2% in Octobera year ago,4 the lowest in sixyears, and a decliningunemployment rate will likelycontinue in 2015. The Conference Board LeadingEconomic IndexTM (LEI) for theU.S. in 2014 continued to postgains. Ataman Ozyildirim,Economist at The ConferenceBoard said: “The LEI rose sharplyin October, with all componentsgaining over the previous sixmonths … the LEI suggests theU.S. expansion continues to bestrong;”5 Ken Goldstein added:“The upward trend in the LEIpoints to continued economicgrowth through the holidayseason and into early 2015.”6
Monetary Policy As expected, the FederalReserve Bank’s Open Market
Committee (FOMC) beganreducing its once $85 billion-per-month bond buying program in2014. The tapering ended theprogram in October. The Fedhas cautioned all along, however,that it would not raise interestrates “for a considerable time.”Such increases were dependentupon real improvement in thelabor market and pending pricestability. Indications are thatsuch interest rate hikes willoccur in 2015. Such a decisionhas the potential to negativelyimpact capital investmentborrowing and home mortgages.In its October FOMC statementthe likelihood of an interest ratehike was increased: “… ifincoming information indicatesfaster progress toward theCommittee’s employment andinflation objectives than theCommittee now expects, thenincreases in the target range forthe federal funds rate are likelyto occur sooner than currentlyanticipated.” So it remains to beseen the timing and pace theFOMC will adopt, but rate hikesare surely a factor in any outlookfor 2015. Also as expected, the currentFed Chairwoman Janet Yellen’sconfirmation for the post earlylast year meant FOMC policy was
Figure 2: U.S. Total Nonfarm Employment Monthly Change, SA (000s)
-1000
-800
-600
-400
-200
0
200
400
600
Dec
'07
Feb
'08
Apr
'08
Jun
'08
Aug
'08
Oct
'08
Dec
'08
Feb
'09
Apr
'09
Jun
'09
Aug
'09
Oct
'09
Dec
'09
Feb
'10
Apr
'10
Jun
'10
Aug
'10
Oct
'10
Dec
'10
Feb
'11
Apr
'11
Jun
'11
Aug
'11
Oct
'11
Dec
'11
Feb
'12
Apr
'12
Jun
'12
Aug
'12
Oct
'12
Dec
'12
Feb
'13
Apr
'13
Jun
'13
Aug
'13
Oct
'13
Dec
'13
Feb
'14
Apr
'14
Jun
'14
Aug
'14
Oct
'14
THE CONNECTICUT ECONOMIC DIGEST 3January 2015
likely to change only verygradually and given strongindications the labor andhousing markets were improving.Yellen was considered thearchitect of the almostunprecedented original rounds ofso-called “quantitative easing”(QE). Stock and bond marketshave had mixed reactions to Fedpolicy, often rising or fallingimmediately after statementreleases. Late in 2014, followingsome tumultuous selloffs andrebounds, the Dow JonesIndustrial Average and the S&PIndex both managed some all-time record-high closing levels.
U.S. Growth Prospects The forecast embodied in thisarticle – political confrontationaside – will assume continuationof a number of positivedevelopments going into 2015.Growth prospects remain positivefor some of the following reasons:The Manufacturing ISM Reporton Business® reported the 65thconsecutive monthly expansioninto November 2014 of theoverall economy; the ISM reportnoted that: “Comments from thepanel generally cite positivebusiness conditions, with growthin demand and productionvolumes.”7 Moreover, October’sPMI [Purchasing Managers Index]registered 59 percent, “anincrease of 2.4 percentage pointsfrom September’s reading of 56.6percent, indicating continuedexpansion in manufacturing.” 8 Areading above 50% indicates thatthe manufacturing economy isgenerally expanding; below 50%indicates that it is generallycontracting. Consumer spending also sawgains with average monthlyincreases of 2.3% in 2014, upfrom 1.9% from the same montha year ago in 2013.9 TheThomson Reuters/University ofMichigan final Index ofConsumer Sentiment advancedto 86.9 in October 2014, thehighest level since July 2007.10
The Conference Board ConsumerConfidence Index® also reacheda seven-year high of 94.5 inOctober 2014. The Indexexceeded its same-month year-ago level throughout 2014. InNovember the Index stood at88.7 (1985=100).11
Real exports of U.S. goodsand services increased 7.8percent in the third quarter of2014, compared with an increaseof 11.1 percent in the secondquarter. Real nonresidentialfixed investment (purchases ofplant and equipment) gained5.5% in Q3-2014 and 9.7% inQ2-2014, compared with Q3 andQ2-2013. New U.S. homes sales grew20.6% into October from a yearago to the highest level in sixyears, and new housing unitsauthorized by building permitswere up 2.5% in September froma year ago; meanwhile U.S.median home sales prices rose4.8% in the 12 months up toOctober. Likewise, constructionspending during the first 9months of 2014 amounted to$710.1 billion, 6.1 percent abovethe $669.3 billion for the sameperiod in 2013, according to theU.S. Commerce Department. U.S. retail sales in Octoberwere up 4.1% from the samemonth last year. There is alsocontinued momentum in carsales, up 8.6% YTD throughOctober 2014 over 2013.12
Meanwhile, U.S. inflationremains tame; Social Securityrecipients, for example, willreceive a Cost of LivingAdjustment (COLA) in 2015 ofonly 1.7%, compared to 1.5% in2014 and less than 2% for thefifth time in six years.
Connecticut Connecticut’s economyshould continue to experiencemodest growth in 2015.Connecticut’s real state grossdomestic product (SGDP), thebroadest measure of the state’seconomic health, increased 0.9%
in 201313 (the latest yearavailable). This growth followed a0.9% decline in 2011, and a 1.0%growth rate in 2012. The nextrelease of GDP by state isscheduled for the summer of2015. The release will includerevised statistics for 1997-2013and advance statistics for 2014.When released for 2014,Connecticut should see positivegrowth again that shouldcontinue into 2015. Connecticutpersonal income grew 0.8% inQ2-2013, seasonally adjusted atquarterly rates, increased by0.4% in Q3-2013, was unchangedin Q4-2013, but increased afurther 1.2% in Q1-2014, and1.3% in Q2-2014, all relative tothe preceding quarter.14 Asforecasted by the ConnecticutDepartment of Labor, personalincome for Q1-2015 will increaseby 3.2% from Q1-2014.15
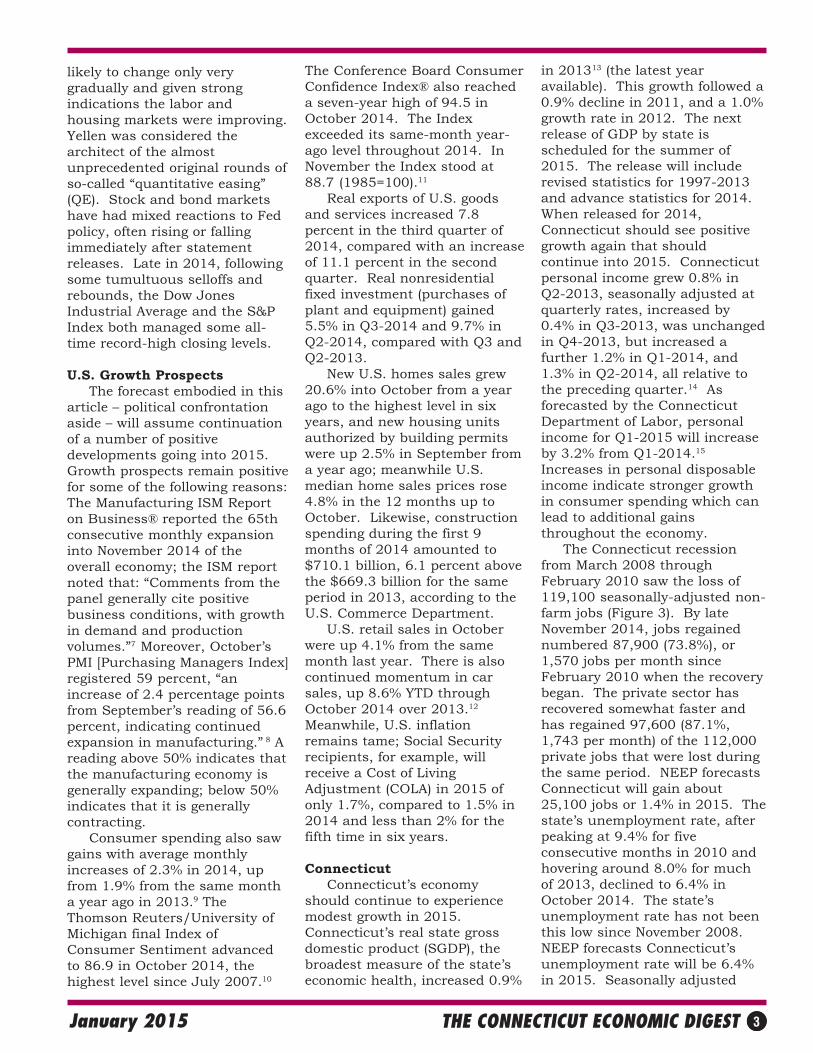
Increases in personal disposableincome indicate stronger growthin consumer spending which canlead to additional gainsthroughout the economy. The Connecticut recessionfrom March 2008 throughFebruary 2010 saw the loss of119,100 seasonally-adjusted non-farm jobs (Figure 3). By lateNovember 2014, jobs regainednumbered 87,900 (73.8%), or1,570 jobs per month sinceFebruary 2010 when the recoverybegan. The private sector hasrecovered somewhat faster andhas regained 97,600 (87.1%,1,743 per month) of the 112,000private jobs that were lost duringthe same period. NEEP forecastsConnecticut will gain about25,100 jobs or 1.4% in 2015. Thestate’s unemployment rate, afterpeaking at 9.4% for fiveconsecutive months in 2010 andhovering around 8.0% for muchof 2013, declined to 6.4% inOctober 2014. The state’sunemployment rate has not beenthis low since November 2008.NEEP forecasts Connecticut’sunemployment rate will be 6.4%in 2015. Seasonally adjusted
THE CONNECTICUT ECONOMIC DIGEST4 January 2015
average weekly initial claims forunemployment insurance peakedat 7,496 in March 2009, butdeclined to 4,101 (-45.3%) byNovember 2014. ThroughNovember, Connecticut’s totalnon-farm employment was upevery month over the samemonth a year ago.
Connecticut’s Fiscal Outlook The state’s fiscal outlook wasstable in 2014 evidenced by a FY2014 surplus of $248.5 million,based on Generally AcceptedAccounting Principles (GAAP).That surplus was deposited inthe Budget Reserve (“Rainy Day”)Fund bringing its balance to$519.2 million. A newly revisedbudget for the fiscal year endingin 2015, introduced in February2014, is in place. However, thestate potentially faces a $1.3billion to $1.4 billion deficit in FY2016 and FY 2017.
Connecticut’s Budget Outlook In October 2014, the statecomptroller reported the General
Fund for fiscal year 2015“anticipates a GAAP basis …balance of $0.3 million[$300,000].”16 “ConsensusRevenues” for FY 2015 wereestimated to be $17,398.9million.17 The Connecticutlegislature’s Office of FiscalAnalysis (OFA) projects an $89.1million deficit for FY 2015, asshown in Table 1.18
Housing The state’s housing marketagain experienced modest growthin 2014 and the U.S. Census-based residential permit data for128 towns reported monthly bythe Department of Economic andCommunity Developmentthrough September 2014 hadgrown by 23.7% compared to thesame period a year ago.Moreover, the data seems toindicate “that the housingmarket will continue its upwardtrend.”19 NEEP expectsConnecticut housing permitsthat peaked at 12,269 in Q3-2005 and reached bottom at
3,173 for all of 2011 will reboundto 6,033 in 2014, and likelyreach 7,734 in 2015. Accordingto NEEP, existing Connecticutsingle family median home pricespeaked at $320,800 in 2007, butfell to a low of $251,100 in 2012,and are expected to average$258,600 for 2014 and $272,700in 2015. Existing home salesmight show a gain from 38,300 in2014 to 45,600 in 2015.20
Initiatives The Connecticut economycontinued to benefit from anaggressive campaign tostrengthen small businesses inrecent years. The Small BusinessExpress Program (EXP) providesloans and grants to Connecticut’ssmall businesses to spur jobcreation and growth and hasseen vigorous activity since itsinception. As of mid-November2014, the state has assisted1,207 companies with more than$171 million in loans and grants.With this much-needed capital,up to 4,485 jobs are expected tobe created and 12,679 retained.Likewise the state’s “First Five”and “Next Five” job initiativeshave promised substantialgrowth in employment andcapital investment inConnecticut. At year’s end(2014), eleven business deals hadbeen announced as part of theongoing expansion program,which leveraged nearly $1.3billion in private investment.Among the eleven companies —Cigna, ESPN, NBC, AlexionPharmaceuticals, CareCentrix,Sustainable Building SystemsLLC, Deloitte, BridgewaterAssociates, CharterCommunications, NavigatorsGroup, Inc., and Pitney Bowes —up to 5,248 jobs were expected tobe created and 12,690 retained.
Conclusion Connecticut and the nation’srecovery are affected by constantuncertainties. Many of the issuesare the same as in past years:
($-millions) FY 15 $ FY 16 $ FY 17 $ FY 18 $Est. Expenditures 17,488.0 18,766.9 19,599.1 20,560.7Est. Revenue 17,398.9 17,445.5 18,160.0 18,832.4Surplus/(Deficit) (89.1) (1,321.4) (1,439.1) (1,728.3)% of Est. Expenditures -0.5% -7.0% -7.3% -8.4%
Table 1: Connecticut Budget Outlook
Figure 3: CT Seasonally Adjusted Nonfarm Employment Monthly Change
-25.0
-20.0
-15.0
-10.0
-5.0
0.0
5.0
10.0
15.0D
ec '0
7F
eb '0
8A
pr '0
8Ju
n '0
8A
ug '0
8O
ct '0
8D
ec '0
8F
eb '0
9A
pr '0
9Ju
n '0
9A
ug '0
9O
ct '0
9D
ec '0
9F
eb '1
0A
pr '1
0Ju
n '1
0A
ug '1
0O
ct '1
0D
ec '1
0F
eb '1
1A
pr '1
1Ju
n '1
1A
ug '1
1O
ct '1
1D
ec '1
1F
eb '1
2A
pr '1
2Ju
n '1
2A
ug '1
2O
ct '1
2D
ec. '
12F
eb '1
3A
pr '1
3Ju
n '1
3A
ug '1
3O
ct '1
3D
ec. '
13F
eb. '
14A
pr. '
14Ju
n. '1
4A
ug. '
14O
ct. '
14
In th
ousa
nds
THE CONNECTICUT ECONOMIC DIGEST 5January 2015
OCCUPATIONAL PROFILE: Physician Assistants
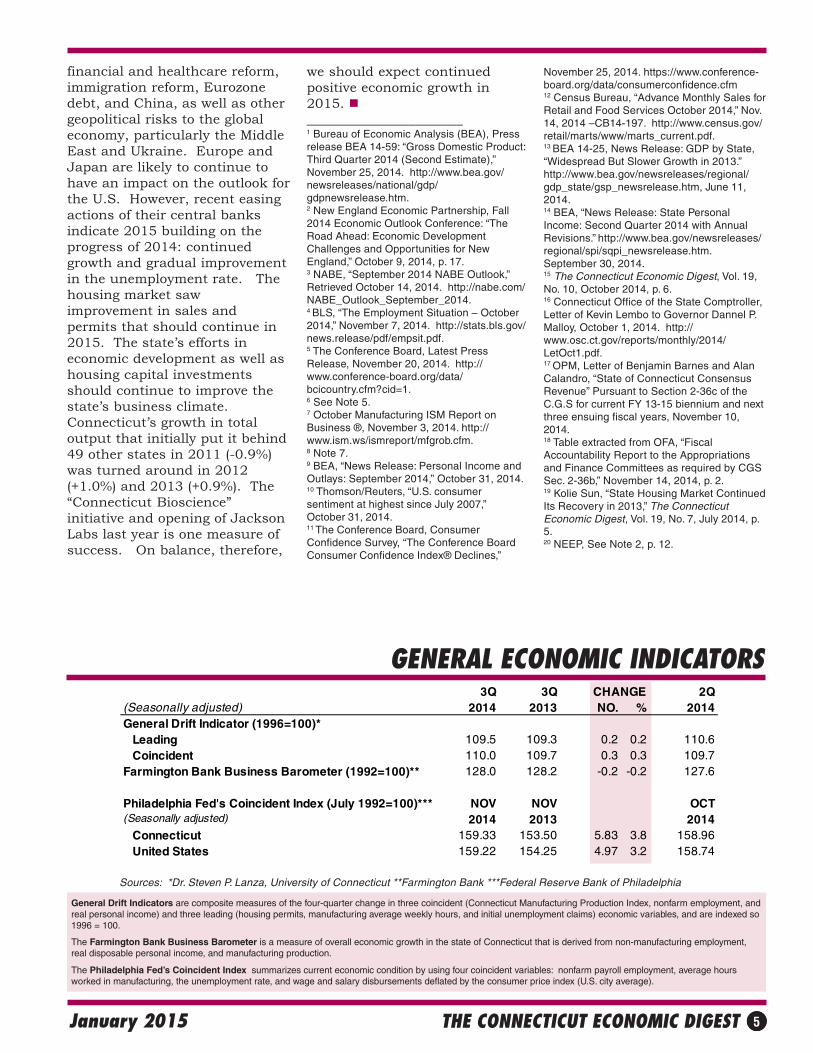
GENERAL ECONOMIC INDICATORS
Sources: *Dr. Steven P. Lanza, University of Connecticut **Farmington Bank ***Federal Reserve Bank of Philadelphia
General Drift Indicators are composite measures of the four-quarter change in three coincident (Connecticut Manufacturing Production Index, nonfarm employment, andreal personal income) and three leading (housing permits, manufacturing average weekly hours, and initial unemployment claims) economic variables, and are indexed so1996 = 100.
The Farmington Bank Business Barometer is a measure of overall economic growth in the state of Connecticut that is derived from non-manufacturing employment,real disposable personal income, and manufacturing production.
The Philadelphia Fed’s Coincident Index summarizes current economic condition by using four coincident variables: nonfarm payroll employment, average hoursworked in manufacturing, the unemployment rate, and wage and salary disbursements deflated by the consumer price index (U.S. city average).
3Q 3Q CHANGE 2Q(Seasonally adjusted) 2014 2013 NO. % 2014General Drift Indicator (1996=100)* Leading 109.5 109.3 0.2 0.2 110.6 Coincident 110.0 109.7 0.3 0.3 109.7Farmington Bank Business Barometer (1992=100)** 128.0 128.2 -0.2 -0.2 127.6
Philadelphia Fed's Coincident Index (July 1992=100)*** NOV NOV OCT(Seasonally adjusted) 2014 2013 2014 Connecticut 159.33 153.50 5.83 3.8 158.96 United States 159.22 154.25 4.97 3.2 158.74
financial and healthcare reform,immigration reform, Eurozonedebt, and China, as well as othergeopolitical risks to the globaleconomy, particularly the MiddleEast and Ukraine. Europe andJapan are likely to continue tohave an impact on the outlook forthe U.S. However, recent easingactions of their central banksindicate 2015 building on theprogress of 2014: continuedgrowth and gradual improvementin the unemployment rate. Thehousing market sawimprovement in sales andpermits that should continue in2015. The state’s efforts ineconomic development as well ashousing capital investmentsshould continue to improve thestate’s business climate.Connecticut’s growth in totaloutput that initially put it behind49 other states in 2011 (-0.9%)was turned around in 2012(+1.0%) and 2013 (+0.9%). The“Connecticut Bioscience”initiative and opening of JacksonLabs last year is one measure ofsuccess. On balance, therefore,
we should expect continuedpositive economic growth in2015. _______________________1 Bureau of Economic Analysis (BEA), Pressrelease BEA 14-59: “Gross Domestic Product:Third Quarter 2014 (Second Estimate),”November 25, 2014. http://www.bea.gov/newsreleases/national/gdp/gdpnewsrelease.htm.2 New England Economic Partnership, Fall2014 Economic Outlook Conference: “TheRoad Ahead: Economic DevelopmentChallenges and Opportunities for NewEngland,” October 9, 2014, p. 17.3 NABE, “September 2014 NABE Outlook,”Retrieved October 14, 2014. http://nabe.com/NABE_Outlook_September_2014.4 BLS, “The Employment Situation – October2014,” November 7, 2014. http://stats.bls.gov/news.release/pdf/empsit.pdf.5 The Conference Board, Latest PressRelease, November 20, 2014. http://www.conference-board.org/data/bcicountry.cfm?cid=1.6 See Note 5.7 October Manufacturing ISM Report onBusiness ®, November 3, 2014. http://www.ism.ws/ismreport/mfgrob.cfm.8 Note 7.9 BEA, “News Release: Personal Income andOutlays: September 2014,” October 31, 2014.10 Thomson/Reuters, “U.S. consumersentiment at highest since July 2007,”October 31, 2014.11 The Conference Board, ConsumerConfidence Survey, “The Conference BoardConsumer Confidence Index® Declines,”
November 25, 2014. https://www.conference-board.org/data/consumerconfidence.cfm12 Census Bureau, “Advance Monthly Sales forRetail and Food Services October 2014,” Nov.14, 2014 –CB14-197. http://www.census.gov/retail/marts/www/marts_current.pdf.13 BEA 14-25, News Release: GDP by State,“Widespread But Slower Growth in 2013.”http://www.bea.gov/newsreleases/regional/gdp_state/gsp_newsrelease.htm, June 11,2014.14 BEA, “News Release: State PersonalIncome: Second Quarter 2014 with AnnualRevisions.” http://www.bea.gov/newsreleases/regional/spi/sqpi_newsrelease.htm.September 30, 2014.15 The Connecticut Economic Digest, Vol. 19,No. 10, October 2014, p. 6.16 Connecticut Office of the State Comptroller,Letter of Kevin Lembo to Governor Dannel P.Malloy, October 1, 2014. http://www.osc.ct.gov/reports/monthly/2014/LetOct1.pdf.17 OPM, Letter of Benjamin Barnes and AlanCalandro, “State of Connecticut ConsensusRevenue” Pursuant to Section 2-36c of theC.G.S for current FY 13-15 biennium and nextthree ensuing fiscal years, November 10,2014.18 Table extracted from OFA, “FiscalAccountability Report to the Appropriationsand Finance Committees as required by CGSSec. 2-36b,” November 14, 2014, p. 2.19 Kolie Sun, “State Housing Market ContinuedIts Recovery in 2013,” The ConnecticutEconomic Digest, Vol. 19, No. 7, July 2014, p.5.20 NEEP, See Note 2, p. 12.
THE CONNECTICUT ECONOMIC DIGEST6 January 2015
EMPLOYMENT BY INDUSTRY SECTOR
INCOME
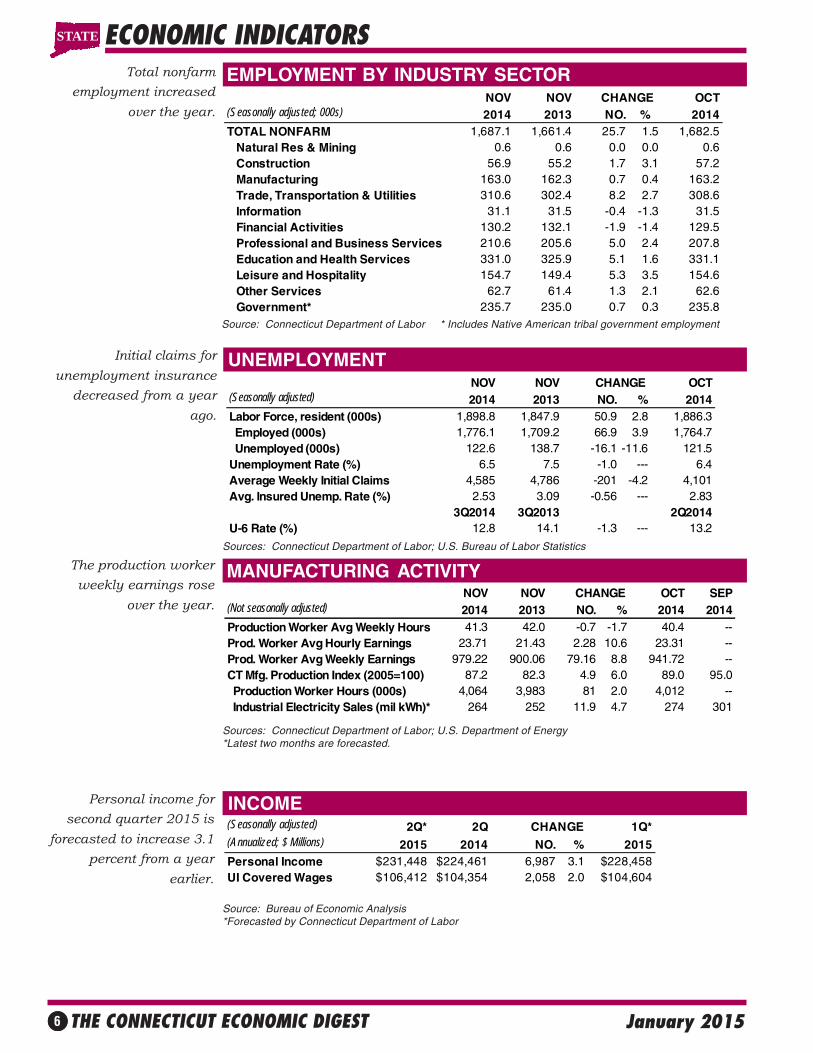
Initial claims forunemployment insurance
decreased from a yearago.
UNEMPLOYMENT
The production workerweekly earnings rose
over the year.
MANUFACTURING ACTIVITY
ECONOMIC INDICATORSTotal nonfarm
employment increasedover the year.
Personal income forsecond quarter 2015 is
forecasted to increase 3.1percent from a year
earlier.
Source: Connecticut Department of Labor * Includes Native American tribal government employment
Sources: Connecticut Department of Labor; U.S. Bureau of Labor Statistics
Sources: Connecticut Department of Labor; U.S. Department of Energy*Latest two months are forecasted.
Source: Bureau of Economic Analysis*Forecasted by Connecticut Department of Labor
(Seasonally adjusted) 2Q* 2Q CHANGE 1Q*(Annualized; $ Millions) 2015 2014 NO. % 2015Personal Income $231,448 $224,461 6,987 3.1 $228,458UI Covered Wages $106,412 $104,354 2,058 2.0 $104,604
NOV NOV CHANGE OCT SEP(Not seasonally adjusted) 2014 2013 NO. % 2014 2014Production Worker Avg Weekly Hours 41.3 42.0 -0.7 -1.7 40.4 --Prod. Worker Avg Hourly Earnings 23.71 21.43 2.28 10.6 23.31 --Prod. Worker Avg Weekly Earnings 979.22 900.06 79.16 8.8 941.72 --CT Mfg. Production Index (2005=100) 87.2 82.3 4.9 6.0 89.0 95.0 Production Worker Hours (000s) 4,064 3,983 81 2.0 4,012 -- Industrial Electricity Sales (mil kWh)* 264 252 11.9 4.7 274 301
NOV NOV CHANGE OCT(Seasonally adjusted; 000s) 2014 2013 NO. % 2014TOTAL NONFARM 1,687.1 1,661.4 25.7 1.5 1,682.5 Natural Res & Mining 0.6 0.6 0.0 0.0 0.6 Construction 56.9 55.2 1.7 3.1 57.2 Manufacturing 163.0 162.3 0.7 0.4 163.2 Trade, Transportation & Utilities 310.6 302.4 8.2 2.7 308.6 Information 31.1 31.5 -0.4 -1.3 31.5 Financial Activities 130.2 132.1 -1.9 -1.4 129.5 Professional and Business Services 210.6 205.6 5.0 2.4 207.8 Education and Health Services 331.0 325.9 5.1 1.6 331.1 Leisure and Hospitality 154.7 149.4 5.3 3.5 154.6 Other Services 62.7 61.4 1.3 2.1 62.6 Government* 235.7 235.0 0.7 0.3 235.8
STATE
NOV NOV CHANGE OCT(Seasonally adjusted) 2014 2013 NO. % 2014Labor Force, resident (000s) 1,898.8 1,847.9 50.9 2.8 1,886.3 Employed (000s) 1,776.1 1,709.2 66.9 3.9 1,764.7 Unemployed (000s) 122.6 138.7 -16.1 -11.6 121.5Unemployment Rate (%) 6.5 7.5 -1.0 --- 6.4Average Weekly Initial Claims 4,585 4,786 -201 -4.2 4,101Avg. Insured Unemp. Rate (%) 2.53 3.09 -0.56 --- 2.83
3Q2014 3Q2013 2Q2014U-6 Rate (%) 12.8 14.1 -1.3 --- 13.2
THE CONNECTICUT ECONOMIC DIGEST 7January 2015
TOURISM AND TRAVEL
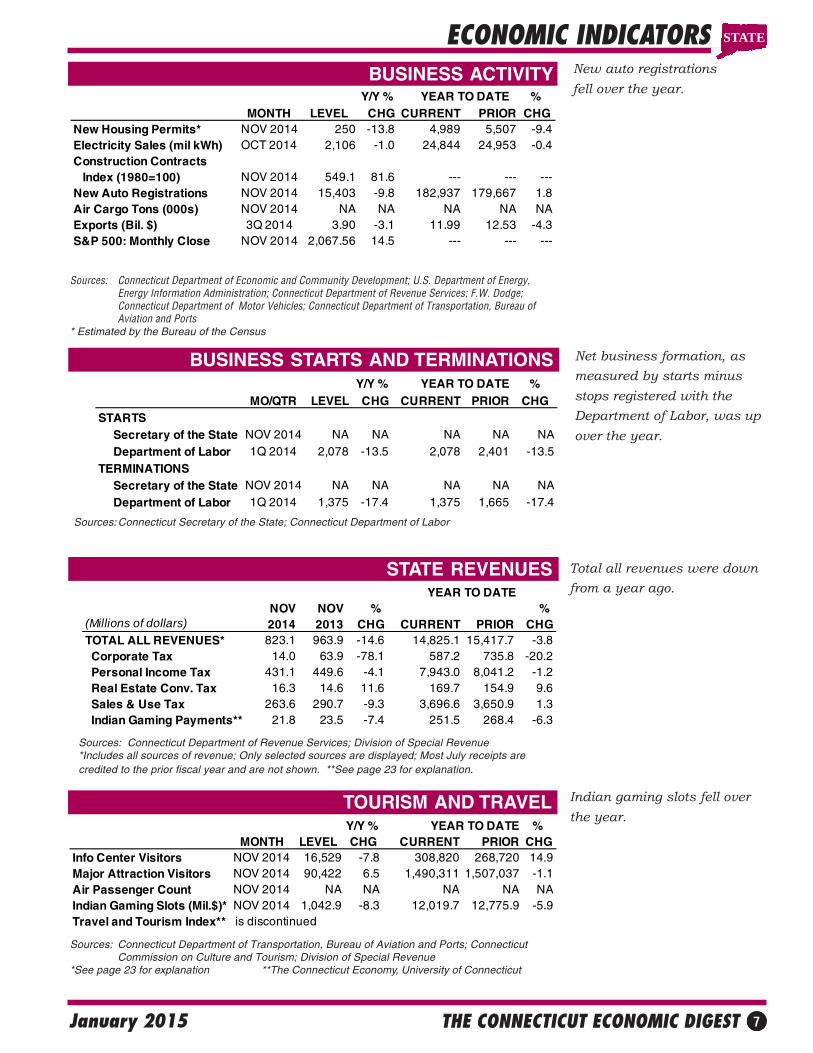
ECONOMIC INDICATORSBUSINESS ACTIVITY New auto registrations
fell over the year.
Indian gaming slots fell overthe year.
BUSINESS STARTS AND TERMINATIONS Net business formation, asmeasured by starts minusstops registered with theDepartment of Labor, was upover the year.
STATE REVENUES
Sources: Connecticut Department of Economic and Community Development; U.S. Department of Energy,Energy Information Administration; Connecticut Department of Revenue Services; F.W. Dodge;Connecticut Department of Motor Vehicles; Connecticut Department of Transportation, Bureau ofAviation and Ports
* Estimated by the Bureau of the Census
Sources: Connecticut Secretary of the State; Connecticut Department of Labor
NOV NOV % % (Millions of dollars) 2014 2013 CHG CURRENT PRIOR CHGTOTAL ALL REVENUES* 823.1 963.9 -14.6 14,825.1 15,417.7 -3.8 Corporate Tax 14.0 63.9 -78.1 587.2 735.8 -20.2 Personal Income Tax 431.1 449.6 -4.1 7,943.0 8,041.2 -1.2 Real Estate Conv. Tax 16.3 14.6 11.6 169.7 154.9 9.6 Sales & Use Tax 263.6 290.7 -9.3 3,696.6 3,650.9 1.3 Indian Gaming Payments** 21.8 23.5 -7.4 251.5 268.4 -6.3
YEAR TO DATE
Sources: Connecticut Department of Revenue Services; Division of Special Revenue*Includes all sources of revenue; Only selected sources are displayed; Most July receipts arecredited to the prior fiscal year and are not shown. **See page 23 for explanation.
Sources: Connecticut Department of Transportation, Bureau of Aviation and Ports; ConnecticutCommission on Culture and Tourism; Division of Special Revenue
*See page 23 for explanation **The Connecticut Economy, University of Connecticut
Y/Y % YEAR TO DATE % MONTH LEVEL CHG CURRENT PRIOR CHG
Info Center Visitors NOV 2014 16,529 -7.8 308,820 268,720 14.9Major Attraction Visitors NOV 2014 90,422 6.5 1,490,311 1,507,037 -1.1Air Passenger Count NOV 2014 NA NA NA NA NAIndian Gaming Slots (Mil.$)* NOV 2014 1,042.9 -8.3 12,019.7 12,775.9 -5.9Travel and Tourism Index** is discontinued
Y/Y % %MO/QTR LEVEL CHG CURRENT PRIOR CHG
STARTS Secretary of the State NOV 2014 NA NA NA NA NA Department of Labor 1Q 2014 2,078 -13.5 2,078 2,401 -13.5TERMINATIONS Secretary of the State NOV 2014 NA NA NA NA NA Department of Labor 1Q 2014 1,375 -17.4 1,375 1,665 -17.4
YEAR TO DATE
STATE
Total all revenues were downfrom a year ago.
Y/Y % YEAR TO DATE % MONTH LEVEL CHG CURRENT PRIOR CHG
New Housing Permits* NOV 2014 250 -13.8 4,989 5,507 -9.4Electricity Sales (mil kWh) OCT 2014 2,106 -1.0 24,844 24,953 -0.4Construction Contracts Index (1980=100) NOV 2014 549.1 81.6 --- --- ---New Auto Registrations NOV 2014 15,403 -9.8 182,937 179,667 1.8Air Cargo Tons (000s) NOV 2014 NA NA NA NA NAExports (Bil. $) 3Q 2014 3.90 -3.1 11.99 12.53 -4.3S&P 500: Monthly Close NOV 2014 2,067.56 14.5 --- --- ---
THE CONNECTICUT ECONOMIC DIGEST8 January 2015
CONSUMER NEWS
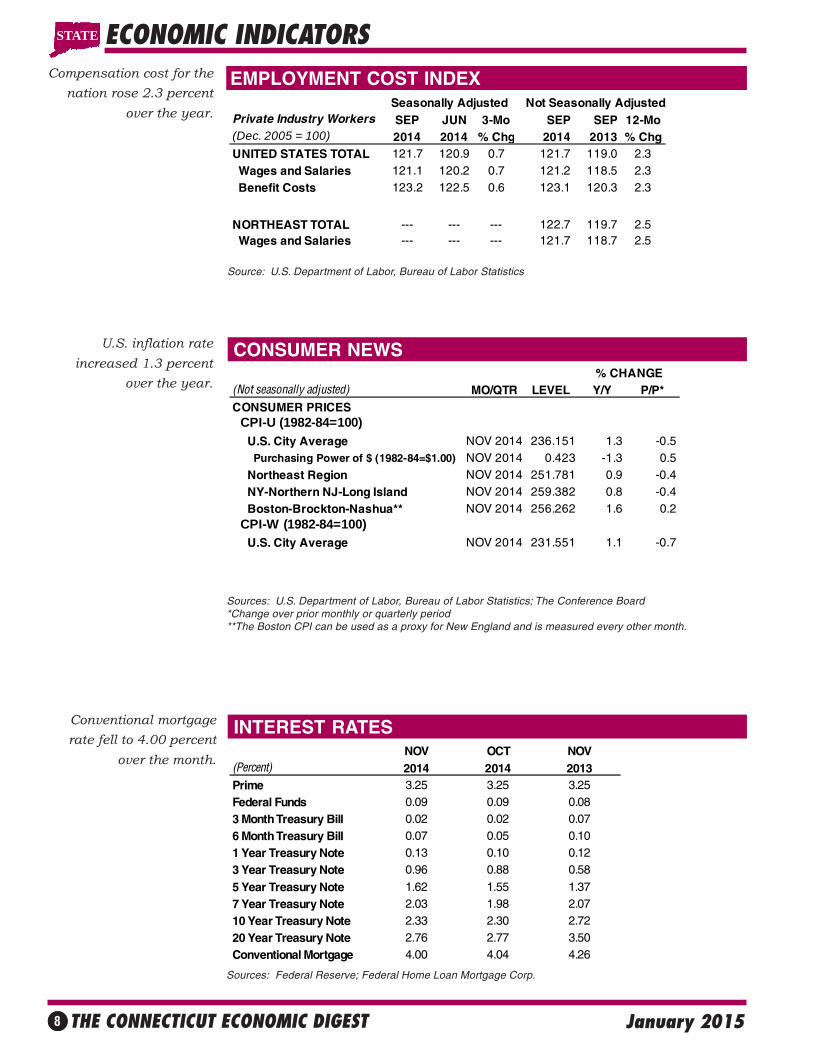
EMPLOYMENT COST INDEXCompensation cost for thenation rose 2.3 percent
over the year.
Conventional mortgagerate fell to 4.00 percent
over the month.
INTEREST RATES
ECONOMIC INDICATORS
U.S. inflation rateincreased 1.3 percent
over the year.
Source: U.S. Department of Labor, Bureau of Labor Statistics
Sources: U.S. Department of Labor, Bureau of Labor Statistics; The Conference Board*Change over prior monthly or quarterly period**The Boston CPI can be used as a proxy for New England and is measured every other month.
Sources: Federal Reserve; Federal Home Loan Mortgage Corp.
NOV OCT NOV(Percent) 2014 2014 2013Prime 3.25 3.25 3.25Federal Funds 0.09 0.09 0.083 Month Treasury Bill 0.02 0.02 0.076 Month Treasury Bill 0.07 0.05 0.101 Year Treasury Note 0.13 0.10 0.123 Year Treasury Note 0.96 0.88 0.58
5 Year Treasury Note 1.62 1.55 1.377 Year Treasury Note 2.03 1.98 2.0710 Year Treasury Note 2.33 2.30 2.7220 Year Treasury Note 2.76 2.77 3.50Conventional Mortgage 4.00 4.04 4.26
Seasonally Adjusted Not Seasonally AdjustedPrivate Industry Workers SEP JUN 3-Mo SEP SEP 12-Mo(Dec. 2005 = 100) 2014 2014 % Chg 2014 2013 % ChgUNITED STATES TOTAL 121.7 120.9 0.7 121.7 119.0 2.3 Wages and Salaries 121.1 120.2 0.7 121.2 118.5 2.3 Benefit Costs 123.2 122.5 0.6 123.1 120.3 2.3
NORTHEAST TOTAL --- --- --- 122.7 119.7 2.5 Wages and Salaries --- --- --- 121.7 118.7 2.5
STATE
(Not seasonally adjusted) MO/QTR LEVEL Y/Y P/P*CONSUMER PRICES CPI-U (1982-84=100) U.S. City Average NOV 2014 236.151 1.3 -0.5 Purchasing Power of $ (1982-84=$1.00) NOV 2014 0.423 -1.3 0.5 Northeast Region NOV 2014 251.781 0.9 -0.4 NY-Northern NJ-Long Island NOV 2014 259.382 0.8 -0.4 Boston-Brockton-Nashua** NOV 2014 256.262 1.6 0.2 CPI-W (1982-84=100) U.S. City Average NOV 2014 231.551 1.1 -0.7
% CHANGE
THE CONNECTICUT ECONOMIC DIGEST 9January 2015
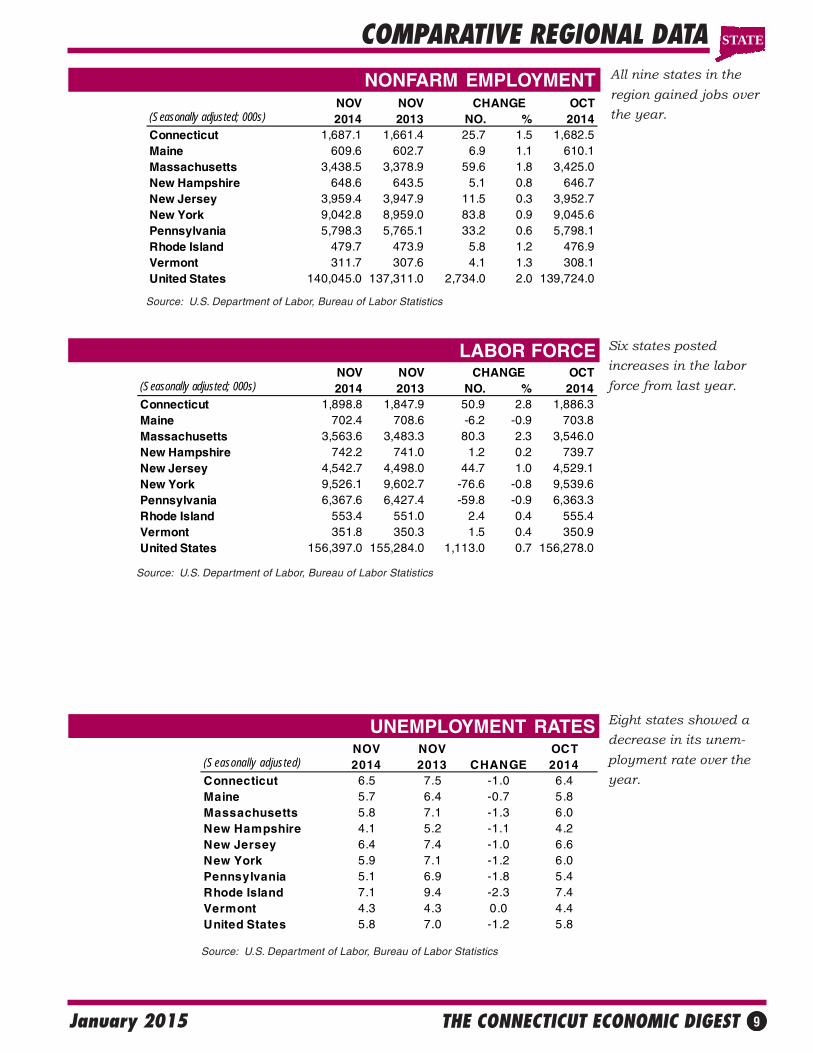
UNEMPLOYMENT RATES
LABOR FORCE
NONFARM EMPLOYMENT
Eight states showed adecrease in its unem-ployment rate over theyear.
All nine states in theregion gained jobs overthe year.
Six states postedincreases in the laborforce from last year.
COMPARATIVE REGIONAL DATA
Source: U.S. Department of Labor, Bureau of Labor Statistics
Source: U.S. Department of Labor, Bureau of Labor Statistics
Source: U.S. Department of Labor, Bureau of Labor Statistics
NOV NOV CHANGE OCT(Seasonally adjusted; 000s) 2014 2013 NO. % 2014Connecticut 1,687.1 1,661.4 25.7 1.5 1,682.5Maine 609.6 602.7 6.9 1.1 610.1Massachusetts 3,438.5 3,378.9 59.6 1.8 3,425.0New Hampshire 648.6 643.5 5.1 0.8 646.7New Jersey 3,959.4 3,947.9 11.5 0.3 3,952.7New York 9,042.8 8,959.0 83.8 0.9 9,045.6Pennsylvania 5,798.3 5,765.1 33.2 0.6 5,798.1Rhode Island 479.7 473.9 5.8 1.2 476.9Vermont 311.7 307.6 4.1 1.3 308.1United States 140,045.0 137,311.0 2,734.0 2.0 139,724.0
NOV NOV CHANGE OCT(Seasonally adjusted; 000s) 2014 2013 NO. % 2014Connecticut 1,898.8 1,847.9 50.9 2.8 1,886.3Maine 702.4 708.6 -6.2 -0.9 703.8Massachusetts 3,563.6 3,483.3 80.3 2.3 3,546.0New Hampshire 742.2 741.0 1.2 0.2 739.7New Jersey 4,542.7 4,498.0 44.7 1.0 4,529.1New York 9,526.1 9,602.7 -76.6 -0.8 9,539.6Pennsylvania 6,367.6 6,427.4 -59.8 -0.9 6,363.3Rhode Island 553.4 551.0 2.4 0.4 555.4Vermont 351.8 350.3 1.5 0.4 350.9United States 156,397.0 155,284.0 1,113.0 0.7 156,278.0
NOV NOV OCT(Seasonally adjusted) 2014 2013 CHANGE 2014Connecticut 6.5 7.5 -1.0 6.4Maine 5.7 6.4 -0.7 5.8Massachusetts 5.8 7.1 -1.3 6.0New Hampshire 4.1 5.2 -1.1 4.2New Jersey 6.4 7.4 -1.0 6.6New York 5.9 7.1 -1.2 6.0Pennsylvania 5.1 6.9 -1.8 5.4Rhode Island 7.1 9.4 -2.3 7.4Vermont 4.3 4.3 0.0 4.4United States 5.8 7.0 -1.2 5.8
STATE
THE CONNECTICUT ECONOMIC DIGEST10 January 2015
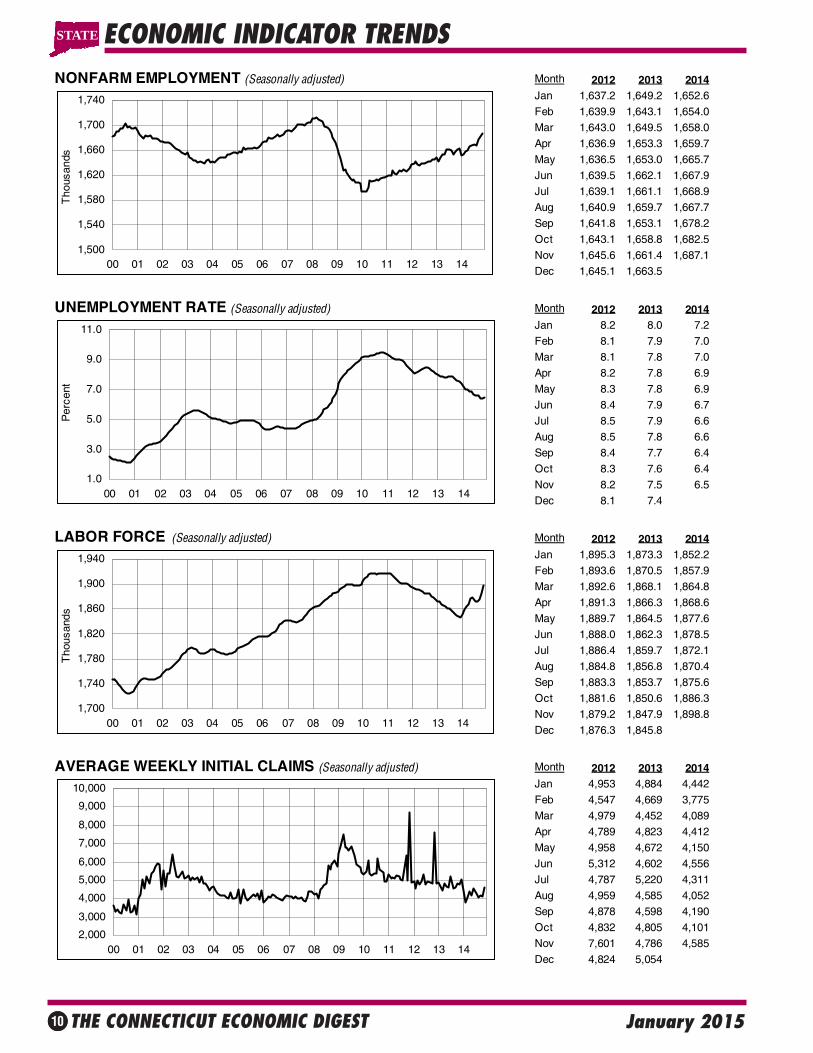
ECONOMIC INDICATOR TRENDSSTATE
NONFARM EMPLOYMENT (Seasonally adjusted) Month 2012 2013 2014Jan 1,637.2 1,649.2 1,652.6
Feb 1,639.9 1,643.1 1,654.0
Mar 1,643.0 1,649.5 1,658.0
Apr 1,636.9 1,653.3 1,659.7
May 1,636.5 1,653.0 1,665.7
Jun 1,639.5 1,662.1 1,667.9
Jul 1,639.1 1,661.1 1,668.9
Aug 1,640.9 1,659.7 1,667.7
Sep 1,641.8 1,653.1 1,678.2
Oct 1,643.1 1,658.8 1,682.5
Nov 1,645.6 1,661.4 1,687.1
Dec 1,645.1 1,663.5
UNEMPLOYMENT RATE (Seasonally adjusted) Month 2012 2013 2014Jan 8.2 8.0 7.2
Feb 8.1 7.9 7.0
Mar 8.1 7.8 7.0
Apr 8.2 7.8 6.9
May 8.3 7.8 6.9
Jun 8.4 7.9 6.7
Jul 8.5 7.9 6.6
Aug 8.5 7.8 6.6
Sep 8.4 7.7 6.4
Oct 8.3 7.6 6.4
Nov 8.2 7.5 6.5
Dec 8.1 7.4
LABOR FORCE (Seasonally adjusted) Month 2012 2013 2014Jan 1,895.3 1,873.3 1,852.2
Feb 1,893.6 1,870.5 1,857.9
Mar 1,892.6 1,868.1 1,864.8
Apr 1,891.3 1,866.3 1,868.6
May 1,889.7 1,864.5 1,877.6
Jun 1,888.0 1,862.3 1,878.5
Jul 1,886.4 1,859.7 1,872.1
Aug 1,884.8 1,856.8 1,870.4
Sep 1,883.3 1,853.7 1,875.6
Oct 1,881.6 1,850.6 1,886.3
Nov 1,879.2 1,847.9 1,898.8
Dec 1,876.3 1,845.8
AVERAGE WEEKLY INITIAL CLAIMS (Seasonally adjusted) Month 2012 2013 2014Jan 4,953 4,884 4,442
Feb 4,547 4,669 3,775
Mar 4,979 4,452 4,089
Apr 4,789 4,823 4,412
May 4,958 4,672 4,150
Jun 5,312 4,602 4,556
Jul 4,787 5,220 4,311
Aug 4,959 4,585 4,052
Sep 4,878 4,598 4,190
Oct 4,832 4,805 4,101
Nov 7,601 4,786 4,585
Dec 4,824 5,054
1.0
3.0
5.0
7.0
9.0
11.0
00 01 02 03 04 05 06 07 08 09 10 11 12 13 14
Per
cent
1,500
1,540
1,580
1,620
1,660
1,700
1,740
00 01 02 03 04 05 06 07 08 09 10 11 12 13 14
Tho
usan
ds
2,000
3,000
4,000
5,000
6,000
7,000
8,000
9,000
10,000
00 01 02 03 04 05 06 07 08 09 10 11 12 13 14
1,700
1,740
1,780
1,820
1,860
1,900
1,940
00 01 02 03 04 05 06 07 08 09 10 11 12 13 14
Tho
usan
ds
THE CONNECTICUT ECONOMIC DIGEST 11January 2015
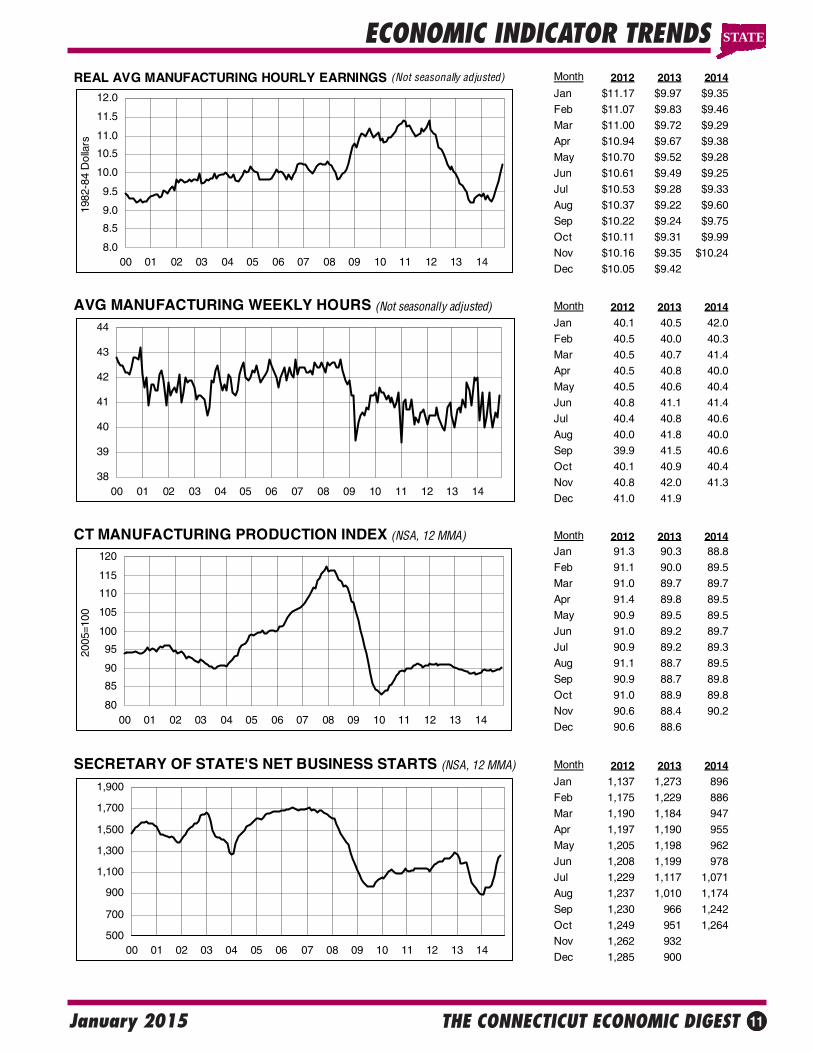
ECONOMIC INDICATOR TRENDS STATE
REAL AVG MANUFACTURING HOURLY EARNINGS (Not seasonally adjusted) Month 2012 2013 2014Jan $11.17 $9.97 $9.35
Feb $11.07 $9.83 $9.46
Mar $11.00 $9.72 $9.29
Apr $10.94 $9.67 $9.38
May $10.70 $9.52 $9.28
Jun $10.61 $9.49 $9.25
Jul $10.53 $9.28 $9.33
Aug $10.37 $9.22 $9.60
Sep $10.22 $9.24 $9.75
Oct $10.11 $9.31 $9.99
Nov $10.16 $9.35 $10.24
Dec $10.05 $9.42
AVG MANUFACTURING WEEKLY HOURS (Not seasonally adjusted) Month 2012 2013 2014Jan 40.1 40.5 42.0
Feb 40.5 40.0 40.3
Mar 40.5 40.7 41.4
Apr 40.5 40.8 40.0
May 40.5 40.6 40.4
Jun 40.8 41.1 41.4
Jul 40.4 40.8 40.6
Aug 40.0 41.8 40.0
Sep 39.9 41.5 40.6
Oct 40.1 40.9 40.4
Nov 40.8 42.0 41.3
Dec 41.0 41.9
CT MANUFACTURING PRODUCTION INDEX (NSA, 12 MMA) Month 2012 2013 2014Jan 91.3 90.3 88.8
Feb 91.1 90.0 89.5
Mar 91.0 89.7 89.7
Apr 91.4 89.8 89.5
May 90.9 89.5 89.5
Jun 91.0 89.2 89.7
Jul 90.9 89.2 89.3
Aug 91.1 88.7 89.5
Sep 90.9 88.7 89.8
Oct 91.0 88.9 89.8
Nov 90.6 88.4 90.2
Dec 90.6 88.6
SECRETARY OF STATE'S NET BUSINESS STARTS (NSA, 12 MMA) Month 2012 2013 2014Jan 1,137 1,273 896
Feb 1,175 1,229 886
Mar 1,190 1,184 947
Apr 1,197 1,190 955
May 1,205 1,198 962
Jun 1,208 1,199 978
Jul 1,229 1,117 1,071
Aug 1,237 1,010 1,174
Sep 1,230 966 1,242
Oct 1,249 951 1,264
Nov 1,262 932
Dec 1,285 900
38
39
40
41
42
43
44
00 01 02 03 04 05 06 07 08 09 10 11 12 13 14
8.0
8.5
9.0
9.5
10.0
10.5
11.0
11.5
12.0
00 01 02 03 04 05 06 07 08 09 10 11 12 13 14
1982
-84
Dol
lars
80
85
90
95
100
105
110
115
120
00 01 02 03 04 05 06 07 08 09 10 11 12 13 14
2005
=100
500
700
900
1,100
1,300
1,500
1,700
1,900
00 01 02 03 04 05 06 07 08 09 10 11 12 13 14
THE CONNECTICUT ECONOMIC DIGEST12 January 2015
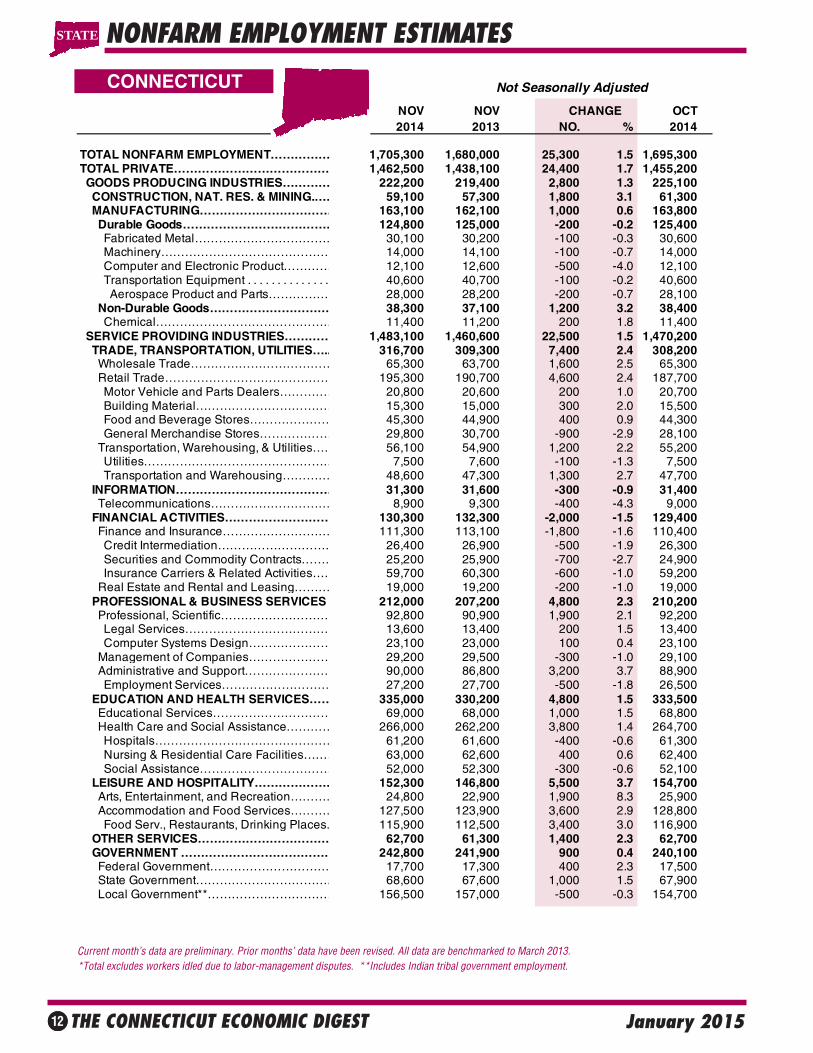
Not Seasonally Adjusted
NOV NOV CHANGE OCT2014 2013 NO. % 2014
TOTAL NONFARM EMPLOYMENT…………… 1,705,300 1,680,000 25,300 1.5 1,695,300TOTAL PRIVATE………………………………… 1,462,500 1,438,100 24,400 1.7 1,455,200 GOODS PRODUCING INDUSTRIES………… 222,200 219,400 2,800 1.3 225,100 CONSTRUCTION, NAT. RES. & MINING.…… 59,100 57,300 1,800 3.1 61,300 MANUFACTURING…………………………… 163,100 162,100 1,000 0.6 163,800 Durable Goods………………………………… 124,800 125,000 -200 -0.2 125,400 Fabricated Metal……………………………… 30,100 30,200 -100 -0.3 30,600 Machinery…………………………………… 14,000 14,100 -100 -0.7 14,000 Computer and Electronic Product………… 12,100 12,600 -500 -4.0 12,100 Transportation Equipment . . . . . . . . . . . . . . 40,600 40,700 -100 -0.2 40,600 Aerospace Product and Parts…………… 28,000 28,200 -200 -0.7 28,100 Non-Durable Goods………………………… 38,300 37,100 1,200 3.2 38,400 Chemical……………………………………… 11,400 11,200 200 1.8 11,400 SERVICE PROVIDING INDUSTRIES………… 1,483,100 1,460,600 22,500 1.5 1,470,200 TRADE, TRANSPORTATION, UTILITIES….. 316,700 309,300 7,400 2.4 308,200 Wholesale Trade……………………………… 65,300 63,700 1,600 2.5 65,300 Retail Trade…………………………………… 195,300 190,700 4,600 2.4 187,700 Motor Vehicle and Parts Dealers…………… 20,800 20,600 200 1.0 20,700 Building Material……………………………… 15,300 15,000 300 2.0 15,500 Food and Beverage Stores………………… 45,300 44,900 400 0.9 44,300 General Merchandise Stores……………… 29,800 30,700 -900 -2.9 28,100 Transportation, Warehousing, & Utilities…… 56,100 54,900 1,200 2.2 55,200 Utilities………………………………………… 7,500 7,600 -100 -1.3 7,500 Transportation and Warehousing………… 48,600 47,300 1,300 2.7 47,700 INFORMATION………………………………… 31,300 31,600 -300 -0.9 31,400 Telecommunications………………………… 8,900 9,300 -400 -4.3 9,000 FINANCIAL ACTIVITIES……………………… 130,300 132,300 -2,000 -1.5 129,400 Finance and Insurance……………………… 111,300 113,100 -1,800 -1.6 110,400 Credit Intermediation………………………… 26,400 26,900 -500 -1.9 26,300 Securities and Commodity Contracts……… 25,200 25,900 -700 -2.7 24,900 Insurance Carriers & Related Activities…… 59,700 60,300 -600 -1.0 59,200 Real Estate and Rental and Leasing……… 19,000 19,200 -200 -1.0 19,000 PROFESSIONAL & BUSINESS SERVICES 212,000 207,200 4,800 2.3 210,200 Professional, Scientific……………………… 92,800 90,900 1,900 2.1 92,200 Legal Services……………………………… 13,600 13,400 200 1.5 13,400 Computer Systems Design………………… 23,100 23,000 100 0.4 23,100 Management of Companies………………… 29,200 29,500 -300 -1.0 29,100 Administrative and Support………………… 90,000 86,800 3,200 3.7 88,900 Employment Services……………………… 27,200 27,700 -500 -1.8 26,500 EDUCATION AND HEALTH SERVICES…… 335,000 330,200 4,800 1.5 333,500 Educational Services………………………… 69,000 68,000 1,000 1.5 68,800 Health Care and Social Assistance………… 266,000 262,200 3,800 1.4 264,700 Hospitals……………………………………… 61,200 61,600 -400 -0.6 61,300 Nursing & Residential Care Facilities……… 63,000 62,600 400 0.6 62,400 Social Assistance…………………………… 52,000 52,300 -300 -0.6 52,100 LEISURE AND HOSPITALITY………………… 152,300 146,800 5,500 3.7 154,700 Arts, Entertainment, and Recreation………… 24,800 22,900 1,900 8.3 25,900 Accommodation and Food Services………… 127,500 123,900 3,600 2.9 128,800 Food Serv., Restaurants, Drinking Places… 115,900 112,500 3,400 3.0 116,900 OTHER SERVICES…………………………… 62,700 61,300 1,400 2.3 62,700 GOVERNMENT ………………………………… 242,800 241,900 900 0.4 240,100 Federal Government………………………… 17,700 17,300 400 2.3 17,500 State Government……………………………. 68,600 67,600 1,000 1.5 67,900 Local Government**…………………………… 156,500 157,000 -500 -0.3 154,700
CONNECTICUT
NONFARM EMPLOYMENT ESTIMATES
Current month’s data are preliminary. Prior months’ data have been revised. All data are benchmarked to March 2013. *Total excludes workers idled due to labor-management disputes. **Includes Indian tribal government employment.
STATE
THE CONNECTICUT ECONOMIC DIGEST 13January 2015
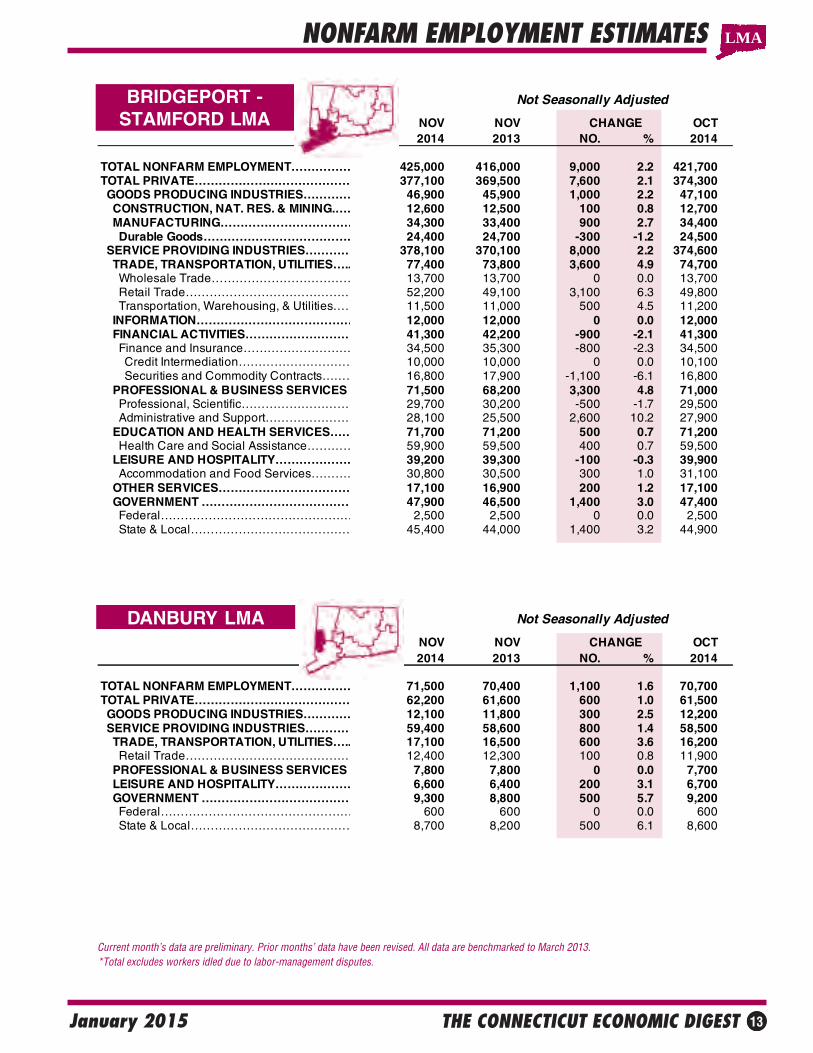
DANBURY LMA
BRIDGEPORT -STAMFORD LMA
NONFARM EMPLOYMENT ESTIMATES
Current month’s data are preliminary. Prior months’ data have been revised. All data are benchmarked to March 2013. *Total excludes workers idled due to labor-management disputes.
LMA
Not Seasonally Adjusted
NOV NOV CHANGE OCT2014 2013 NO. % 2014
TOTAL NONFARM EMPLOYMENT…………… 425,000 416,000 9,000 2.2 421,700TOTAL PRIVATE………………………………… 377,100 369,500 7,600 2.1 374,300 GOODS PRODUCING INDUSTRIES………… 46,900 45,900 1,000 2.2 47,100 CONSTRUCTION, NAT. RES. & MINING.…… 12,600 12,500 100 0.8 12,700 MANUFACTURING…………………………… 34,300 33,400 900 2.7 34,400 Durable Goods………………………………… 24,400 24,700 -300 -1.2 24,500 SERVICE PROVIDING INDUSTRIES………… 378,100 370,100 8,000 2.2 374,600 TRADE, TRANSPORTATION, UTILITIES….. 77,400 73,800 3,600 4.9 74,700 Wholesale Trade……………………………… 13,700 13,700 0 0.0 13,700 Retail Trade…………………………………… 52,200 49,100 3,100 6.3 49,800 Transportation, Warehousing, & Utilities…… 11,500 11,000 500 4.5 11,200 INFORMATION………………………………… 12,000 12,000 0 0.0 12,000 FINANCIAL ACTIVITIES……………………… 41,300 42,200 -900 -2.1 41,300 Finance and Insurance……………………… 34,500 35,300 -800 -2.3 34,500 Credit Intermediation………………………… 10,000 10,000 0 0.0 10,100 Securities and Commodity Contracts……… 16,800 17,900 -1,100 -6.1 16,800 PROFESSIONAL & BUSINESS SERVICES 71,500 68,200 3,300 4.8 71,000 Professional, Scientific……………………… 29,700 30,200 -500 -1.7 29,500 Administrative and Support………………… 28,100 25,500 2,600 10.2 27,900 EDUCATION AND HEALTH SERVICES…… 71,700 71,200 500 0.7 71,200 Health Care and Social Assistance………… 59,900 59,500 400 0.7 59,500 LEISURE AND HOSPITALITY………………… 39,200 39,300 -100 -0.3 39,900 Accommodation and Food Services………… 30,800 30,500 300 1.0 31,100 OTHER SERVICES…………………………… 17,100 16,900 200 1.2 17,100 GOVERNMENT ………………………………… 47,900 46,500 1,400 3.0 47,400 Federal………………………………………… 2,500 2,500 0 0.0 2,500 State & Local…………………………………… 45,400 44,000 1,400 3.2 44,900
Not Seasonally Adjusted
NOV NOV CHANGE OCT2014 2013 NO. % 2014
TOTAL NONFARM EMPLOYMENT…………… 71,500 70,400 1,100 1.6 70,700TOTAL PRIVATE………………………………… 62,200 61,600 600 1.0 61,500 GOODS PRODUCING INDUSTRIES………… 12,100 11,800 300 2.5 12,200 SERVICE PROVIDING INDUSTRIES………… 59,400 58,600 800 1.4 58,500 TRADE, TRANSPORTATION, UTILITIES….. 17,100 16,500 600 3.6 16,200 Retail Trade…………………………………… 12,400 12,300 100 0.8 11,900 PROFESSIONAL & BUSINESS SERVICES 7,800 7,800 0 0.0 7,700 LEISURE AND HOSPITALITY………………… 6,600 6,400 200 3.1 6,700 GOVERNMENT ………………………………… 9,300 8,800 500 5.7 9,200 Federal………………………………………… 600 600 0 0.0 600 State & Local…………………………………… 8,700 8,200 500 6.1 8,600
THE CONNECTICUT ECONOMIC DIGEST14 January 2015
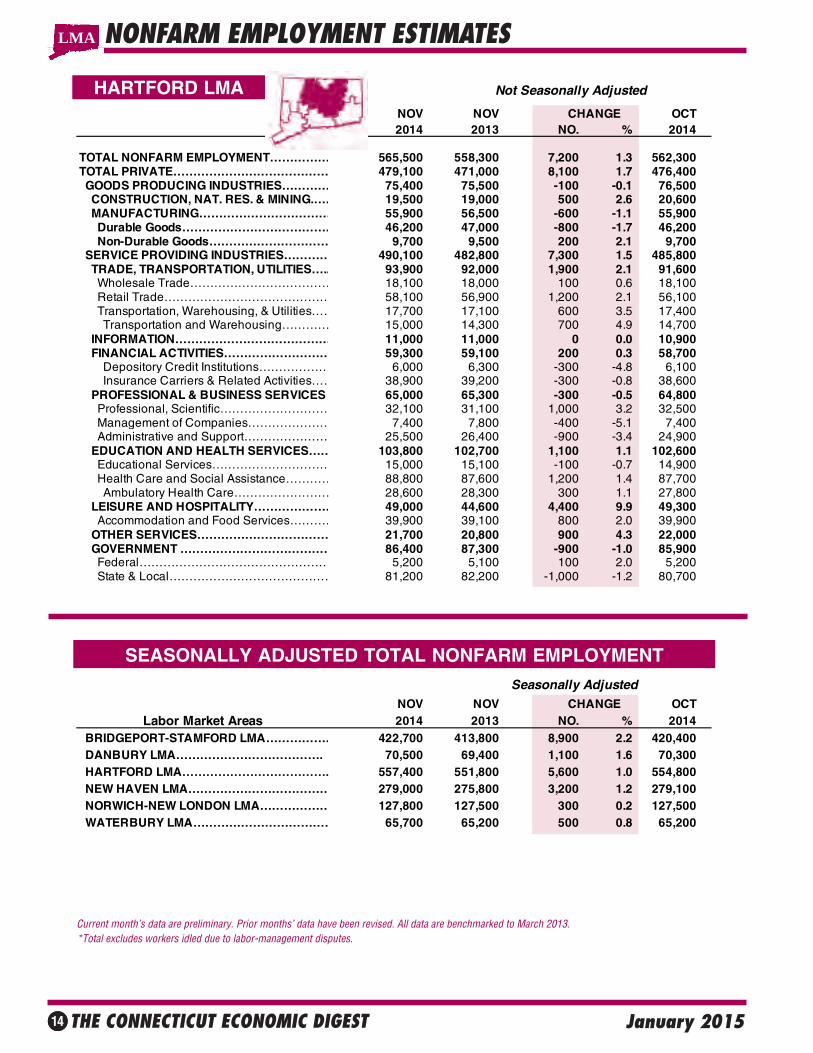
HARTFORD LMA
NONFARM EMPLOYMENT ESTIMATESLMA
SEASONALLY ADJUSTED TOTAL NONFARM EMPLOYMENT
Current month’s data are preliminary. Prior months’ data have been revised. All data are benchmarked to March 2013. *Total excludes workers idled due to labor-management disputes.
Not Seasonally Adjusted
NOV NOV CHANGE OCT2014 2013 NO. % 2014
TOTAL NONFARM EMPLOYMENT…………… 565,500 558,300 7,200 1.3 562,300TOTAL PRIVATE………………………………… 479,100 471,000 8,100 1.7 476,400 GOODS PRODUCING INDUSTRIES………… 75,400 75,500 -100 -0.1 76,500 CONSTRUCTION, NAT. RES. & MINING.…… 19,500 19,000 500 2.6 20,600 MANUFACTURING…………………………… 55,900 56,500 -600 -1.1 55,900 Durable Goods………………………………… 46,200 47,000 -800 -1.7 46,200 Non-Durable Goods………………………… 9,700 9,500 200 2.1 9,700 SERVICE PROVIDING INDUSTRIES………… 490,100 482,800 7,300 1.5 485,800 TRADE, TRANSPORTATION, UTILITIES….. 93,900 92,000 1,900 2.1 91,600 Wholesale Trade……………………………… 18,100 18,000 100 0.6 18,100 Retail Trade…………………………………… 58,100 56,900 1,200 2.1 56,100 Transportation, Warehousing, & Utilities…… 17,700 17,100 600 3.5 17,400 Transportation and Warehousing………… 15,000 14,300 700 4.9 14,700 INFORMATION………………………………… 11,000 11,000 0 0.0 10,900 FINANCIAL ACTIVITIES……………………… 59,300 59,100 200 0.3 58,700 Depository Credit Institutions……………… 6,000 6,300 -300 -4.8 6,100 Insurance Carriers & Related Activities…… 38,900 39,200 -300 -0.8 38,600 PROFESSIONAL & BUSINESS SERVICES 65,000 65,300 -300 -0.5 64,800 Professional, Scientific……………………… 32,100 31,100 1,000 3.2 32,500 Management of Companies………………… 7,400 7,800 -400 -5.1 7,400 Administrative and Support………………… 25,500 26,400 -900 -3.4 24,900 EDUCATION AND HEALTH SERVICES…… 103,800 102,700 1,100 1.1 102,600 Educational Services………………………… 15,000 15,100 -100 -0.7 14,900 Health Care and Social Assistance………… 88,800 87,600 1,200 1.4 87,700 Ambulatory Health Care…………………… 28,600 28,300 300 1.1 27,800 LEISURE AND HOSPITALITY………………… 49,000 44,600 4,400 9.9 49,300 Accommodation and Food Services………… 39,900 39,100 800 2.0 39,900 OTHER SERVICES…………………………… 21,700 20,800 900 4.3 22,000 GOVERNMENT ………………………………… 86,400 87,300 -900 -1.0 85,900 Federal………………………………………… 5,200 5,100 100 2.0 5,200 State & Local…………………………………… 81,200 82,200 -1,000 -1.2 80,700
Seasonally AdjustedNOV NOV CHANGE OCT
Labor Market Areas 2014 2013 NO. % 2014 BRIDGEPORT-STAMFORD LMA……………… 422,700 413,800 8,900 2.2 420,400 DANBURY LMA………………………………. 70,500 69,400 1,100 1.6 70,300 HARTFORD LMA………………………………. 557,400 551,800 5,600 1.0 554,800 NEW HAVEN LMA……………………………… 279,000 275,800 3,200 1.2 279,100 NORWICH-NEW LONDON LMA……………… 127,800 127,500 300 0.2 127,500 WATERBURY LMA……………………………… 65,700 65,200 500 0.8 65,200
THE CONNECTICUT ECONOMIC DIGEST 15January 2015
NOV NOV OCT(Seasonally adjusted) 2014 2013 2014CT Vacancies (000s) 72.5 67.1 69.2 Hartford Vac. (000s) 29.0 26.5 26.5
Connecticut 3.84 3.63 3.67 Hartford 4.92 4.54 4.49
United States 3.36 3.15 3.25Maine 4.25 3.22 4.33Massachusetts 4.46 4.26 4.31New Hampshire 4.10 3.54 4.02Rhode Island 3.65 3.34 3.57Vermont 3.87 3.24 3.76
Labor Demand Rate *
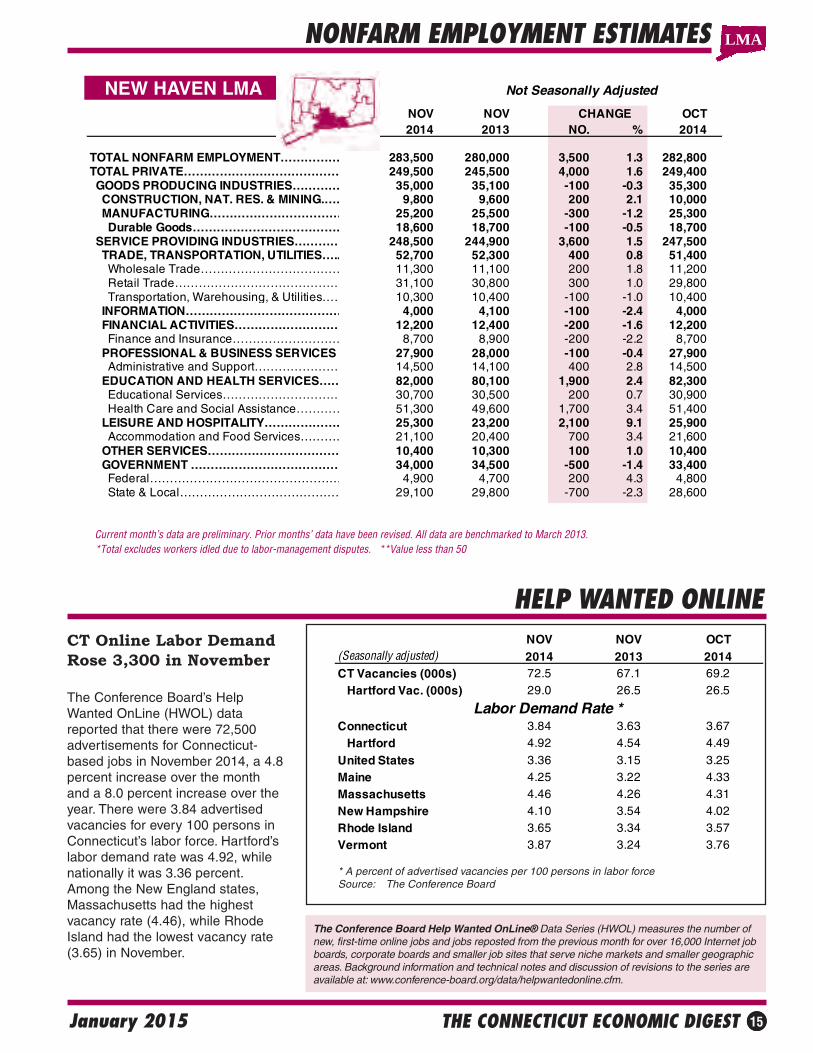
NEW HAVEN LMA
NONFARM EMPLOYMENT ESTIMATES
Current month’s data are preliminary. Prior months’ data have been revised. All data are benchmarked to March 2013. *Total excludes workers idled due to labor-management disputes. **Value less than 50
LMA
HELP WANTED ONLINE
* A percent of advertised vacancies per 100 persons in labor forceSource: The Conference Board
CT Online Labor DemandRose 3,300 in November
The Conference Board’s HelpWanted OnLine (HWOL) datareported that there were 72,500advertisements for Connecticut-based jobs in November 2014, a 4.8percent increase over the monthand a 8.0 percent increase over theyear. There were 3.84 advertisedvacancies for every 100 persons inConnecticut’s labor force. Hartford’slabor demand rate was 4.92, whilenationally it was 3.36 percent.Among the New England states,Massachusetts had the highestvacancy rate (4.46), while RhodeIsland had the lowest vacancy rate(3.65) in November.
The Conference Board Help Wanted OnLine® Data Series (HWOL) measures the number ofnew, first-time online jobs and jobs reposted from the previous month for over 16,000 Internet jobboards, corporate boards and smaller job sites that serve niche markets and smaller geographicareas. Background information and technical notes and discussion of revisions to the series areavailable at: www.conference-board.org/data/helpwantedonline.cfm.
Not Seasonally Adjusted
NOV NOV CHANGE OCT2014 2013 NO. % 2014
TOTAL NONFARM EMPLOYMENT…………… 283,500 280,000 3,500 1.3 282,800 TOTAL PRIVATE………………………………… 249,500 245,500 4,000 1.6 249,400 GOODS PRODUCING INDUSTRIES………… 35,000 35,100 -100 -0.3 35,300 CONSTRUCTION, NAT. RES. & MINING.…… 9,800 9,600 200 2.1 10,000 MANUFACTURING…………………………… 25,200 25,500 -300 -1.2 25,300 Durable Goods………………………………… 18,600 18,700 -100 -0.5 18,700 SERVICE PROVIDING INDUSTRIES………… 248,500 244,900 3,600 1.5 247,500 TRADE, TRANSPORTATION, UTILITIES….. 52,700 52,300 400 0.8 51,400 Wholesale Trade……………………………… 11,300 11,100 200 1.8 11,200 Retail Trade…………………………………… 31,100 30,800 300 1.0 29,800 Transportation, Warehousing, & Utilities…… 10,300 10,400 -100 -1.0 10,400 INFORMATION………………………………… 4,000 4,100 -100 -2.4 4,000 FINANCIAL ACTIVITIES……………………… 12,200 12,400 -200 -1.6 12,200 Finance and Insurance……………………… 8,700 8,900 -200 -2.2 8,700 PROFESSIONAL & BUSINESS SERVICES 27,900 28,000 -100 -0.4 27,900 Administrative and Support………………… 14,500 14,100 400 2.8 14,500 EDUCATION AND HEALTH SERVICES…… 82,000 80,100 1,900 2.4 82,300 Educational Services………………………… 30,700 30,500 200 0.7 30,900 Health Care and Social Assistance………… 51,300 49,600 1,700 3.4 51,400 LEISURE AND HOSPITALITY………………… 25,300 23,200 2,100 9.1 25,900 Accommodation and Food Services………… 21,100 20,400 700 3.4 21,600 OTHER SERVICES…………………………… 10,400 10,300 100 1.0 10,400 GOVERNMENT ………………………………… 34,000 34,500 -500 -1.4 33,400 Federal………………………………………… 4,900 4,700 200 4.3 4,800 State & Local…………………………………… 29,100 29,800 -700 -2.3 28,600
THE CONNECTICUT ECONOMIC DIGEST16 January 2015
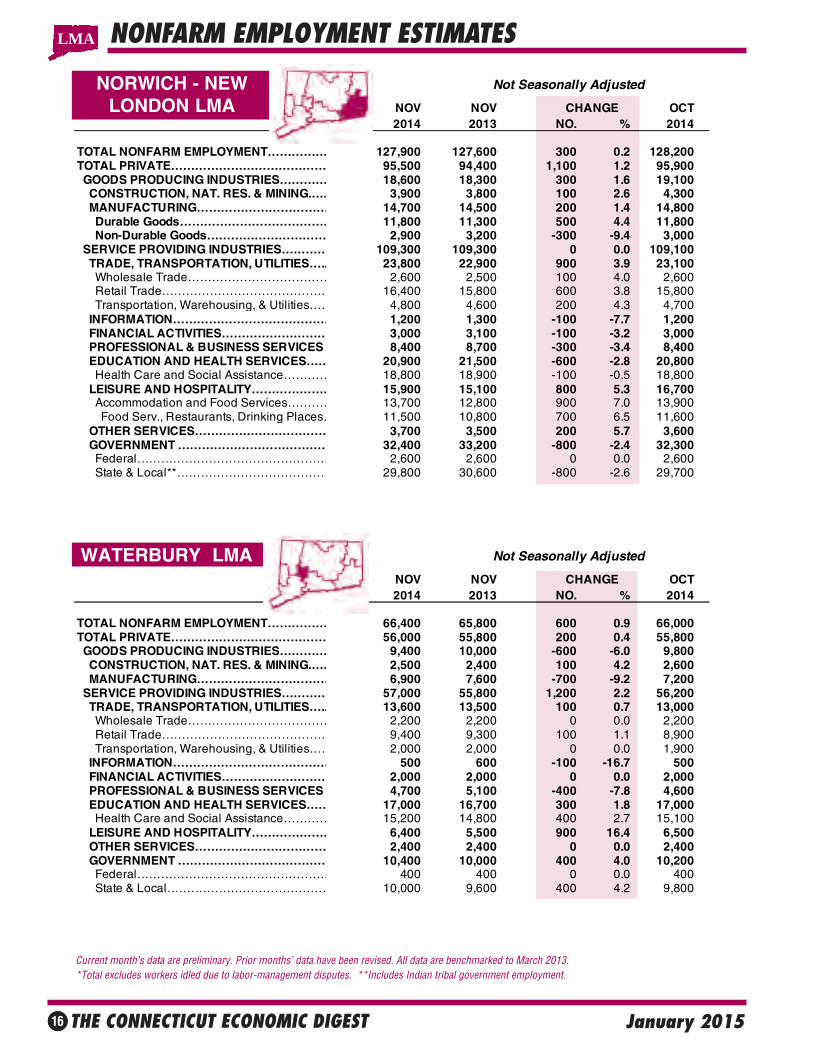
NORWICH - NEWLONDON LMA
Current month’s data are preliminary. Prior months’ data have been revised. All data are benchmarked to March 2013. *Total excludes workers idled due to labor-management disputes. **Includes Indian tribal government employment.
NONFARM EMPLOYMENT ESTIMATES
WATERBURY LMA
LMA
Not Seasonally Adjusted
NOV NOV CHANGE OCT2014 2013 NO. % 2014
TOTAL NONFARM EMPLOYMENT…………… 127,900 127,600 300 0.2 128,200TOTAL PRIVATE………………………………… 95,500 94,400 1,100 1.2 95,900 GOODS PRODUCING INDUSTRIES………… 18,600 18,300 300 1.6 19,100 CONSTRUCTION, NAT. RES. & MINING.…… 3,900 3,800 100 2.6 4,300 MANUFACTURING…………………………… 14,700 14,500 200 1.4 14,800 Durable Goods………………………………… 11,800 11,300 500 4.4 11,800 Non-Durable Goods………………………… 2,900 3,200 -300 -9.4 3,000 SERVICE PROVIDING INDUSTRIES………… 109,300 109,300 0 0.0 109,100 TRADE, TRANSPORTATION, UTILITIES….. 23,800 22,900 900 3.9 23,100 Wholesale Trade……………………………… 2,600 2,500 100 4.0 2,600 Retail Trade…………………………………… 16,400 15,800 600 3.8 15,800 Transportation, Warehousing, & Utilities…… 4,800 4,600 200 4.3 4,700 INFORMATION………………………………… 1,200 1,300 -100 -7.7 1,200 FINANCIAL ACTIVITIES……………………… 3,000 3,100 -100 -3.2 3,000 PROFESSIONAL & BUSINESS SERVICES 8,400 8,700 -300 -3.4 8,400 EDUCATION AND HEALTH SERVICES…… 20,900 21,500 -600 -2.8 20,800 Health Care and Social Assistance………… 18,800 18,900 -100 -0.5 18,800 LEISURE AND HOSPITALITY………………… 15,900 15,100 800 5.3 16,700 Accommodation and Food Services………… 13,700 12,800 900 7.0 13,900 Food Serv., Restaurants, Drinking Places… 11,500 10,800 700 6.5 11,600 OTHER SERVICES…………………………… 3,700 3,500 200 5.7 3,600 GOVERNMENT ………………………………… 32,400 33,200 -800 -2.4 32,300 Federal………………………………………… 2,600 2,600 0 0.0 2,600 State & Local**………………………………… 29,800 30,600 -800 -2.6 29,700
Not Seasonally Adjusted
NOV NOV CHANGE OCT 2014 2013 NO. % 2014
TOTAL NONFARM EMPLOYMENT…………… 66,400 65,800 600 0.9 66,000TOTAL PRIVATE………………………………… 56,000 55,800 200 0.4 55,800 GOODS PRODUCING INDUSTRIES………… 9,400 10,000 -600 -6.0 9,800 CONSTRUCTION, NAT. RES. & MINING.…… 2,500 2,400 100 4.2 2,600 MANUFACTURING…………………………… 6,900 7,600 -700 -9.2 7,200 SERVICE PROVIDING INDUSTRIES………… 57,000 55,800 1,200 2.2 56,200 TRADE, TRANSPORTATION, UTILITIES….. 13,600 13,500 100 0.7 13,000 Wholesale Trade……………………………… 2,200 2,200 0 0.0 2,200 Retail Trade…………………………………… 9,400 9,300 100 1.1 8,900 Transportation, Warehousing, & Utilities…… 2,000 2,000 0 0.0 1,900 INFORMATION………………………………… 500 600 -100 -16.7 500 FINANCIAL ACTIVITIES……………………… 2,000 2,000 0 0.0 2,000 PROFESSIONAL & BUSINESS SERVICES 4,700 5,100 -400 -7.8 4,600 EDUCATION AND HEALTH SERVICES…… 17,000 16,700 300 1.8 17,000 Health Care and Social Assistance………… 15,200 14,800 400 2.7 15,100 LEISURE AND HOSPITALITY………………… 6,400 5,500 900 16.4 6,500 OTHER SERVICES…………………………… 2,400 2,400 0 0.0 2,400 GOVERNMENT ………………………………… 10,400 10,000 400 4.0 10,200 Federal………………………………………… 400 400 0 0.0 400 State & Local…………………………………… 10,000 9,600 400 4.2 9,800
THE CONNECTICUT ECONOMIC DIGEST 17January 2015
NONFARM EMPLOYMENT ESTIMATES
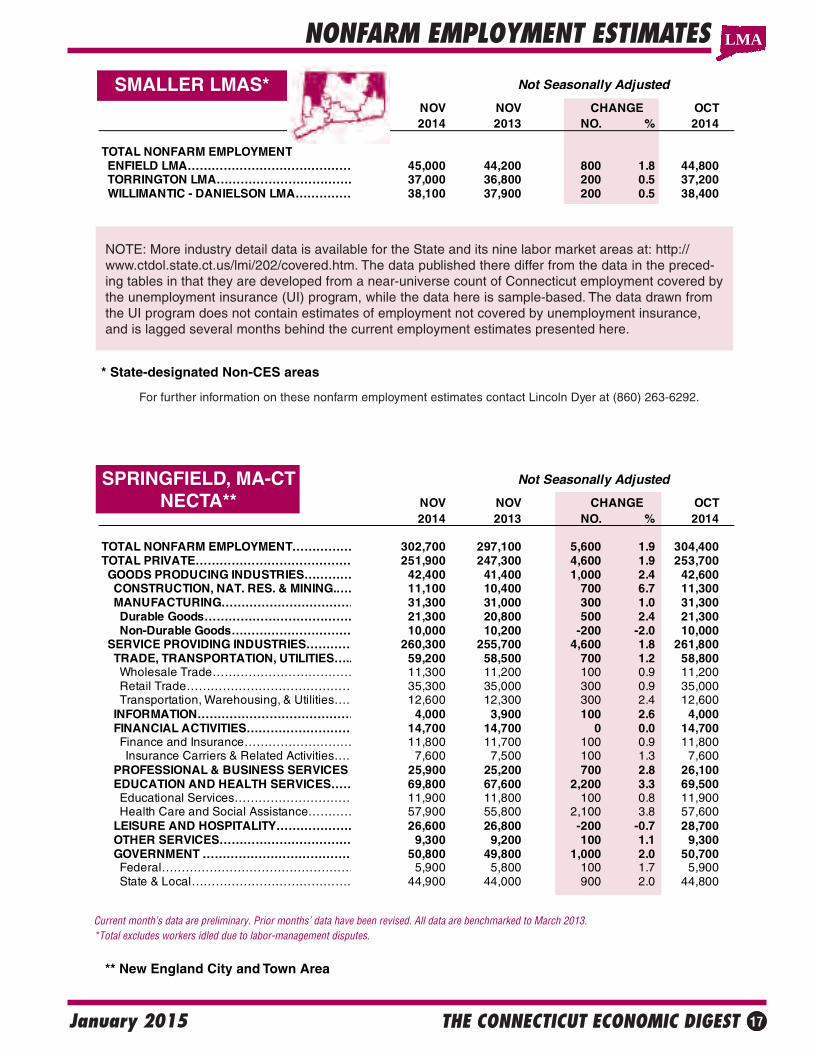
NOTE: More industry detail data is available for the State and its nine labor market areas at: http://www.ctdol.state.ct.us/lmi/202/covered.htm. The data published there differ from the data in the preced-ing tables in that they are developed from a near-universe count of Connecticut employment covered bythe unemployment insurance (UI) program, while the data here is sample-based. The data drawn fromthe UI program does not contain estimates of employment not covered by unemployment insurance,and is lagged several months behind the current employment estimates presented here.
SMALLER LMAS*
Current month’s data are preliminary. Prior months’ data have been revised. All data are benchmarked to March 2013. *Total excludes workers idled due to labor-management disputes.
SPRINGFIELD, MA-CTNECTA**
** New England City and Town Area
LMA
For further information on these nonfarm employment estimates contact Lincoln Dyer at (860) 263-6292.
Not Seasonally Adjusted
NOV NOV CHANGE OCT 2014 2013 NO. % 2014
TOTAL NONFARM EMPLOYMENT ENFIELD LMA…………………………………… 45,000 44,200 800 1.8 44,800 TORRINGTON LMA……………………………… 37,000 36,800 200 0.5 37,200 WILLIMANTIC - DANIELSON LMA…………… 38,100 37,900 200 0.5 38,400
Not Seasonally Adjusted
NOV NOV CHANGE OCT2014 2013 NO. % 2014
TOTAL NONFARM EMPLOYMENT…………… 302,700 297,100 5,600 1.9 304,400TOTAL PRIVATE………………………………… 251,900 247,300 4,600 1.9 253,700 GOODS PRODUCING INDUSTRIES………… 42,400 41,400 1,000 2.4 42,600 CONSTRUCTION, NAT. RES. & MINING.…… 11,100 10,400 700 6.7 11,300 MANUFACTURING…………………………… 31,300 31,000 300 1.0 31,300 Durable Goods………………………………… 21,300 20,800 500 2.4 21,300 Non-Durable Goods………………………… 10,000 10,200 -200 -2.0 10,000 SERVICE PROVIDING INDUSTRIES………… 260,300 255,700 4,600 1.8 261,800 TRADE, TRANSPORTATION, UTILITIES….. 59,200 58,500 700 1.2 58,800 Wholesale Trade……………………………… 11,300 11,200 100 0.9 11,200 Retail Trade…………………………………… 35,300 35,000 300 0.9 35,000 Transportation, Warehousing, & Utilities…… 12,600 12,300 300 2.4 12,600 INFORMATION………………………………… 4,000 3,900 100 2.6 4,000 FINANCIAL ACTIVITIES……………………… 14,700 14,700 0 0.0 14,700 Finance and Insurance……………………… 11,800 11,700 100 0.9 11,800 Insurance Carriers & Related Activities…… 7,600 7,500 100 1.3 7,600 PROFESSIONAL & BUSINESS SERVICES 25,900 25,200 700 2.8 26,100 EDUCATION AND HEALTH SERVICES…… 69,800 67,600 2,200 3.3 69,500 Educational Services………………………… 11,900 11,800 100 0.8 11,900 Health Care and Social Assistance………… 57,900 55,800 2,100 3.8 57,600 LEISURE AND HOSPITALITY………………… 26,600 26,800 -200 -0.7 28,700 OTHER SERVICES…………………………… 9,300 9,200 100 1.1 9,300 GOVERNMENT ………………………………… 50,800 49,800 1,000 2.0 50,700 Federal………………………………………… 5,900 5,800 100 1.7 5,900 State & Local…………………………………… 44,900 44,000 900 2.0 44,800
* State-designated Non-CES areas
THE CONNECTICUT ECONOMIC DIGEST18 January 2015
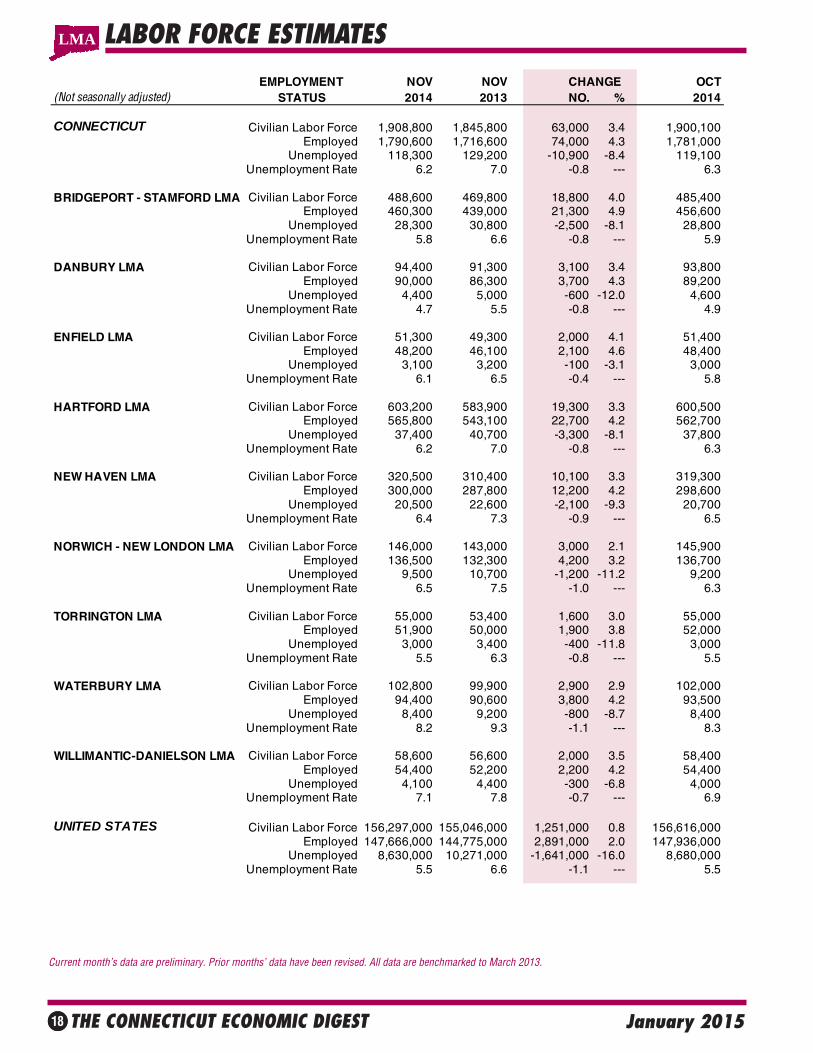
LABOR FORCE ESTIMATES
Current month’s data are preliminary. Prior months’ data have been revised. All data are benchmarked to March 2013.
EMPLOYMENT NOV NOV CHANGE OCT(Not seasonally adjusted) STATUS 2014 2013 NO. % 2014
CONNECTICUT Civilian Labor Force 1,908,800 1,845,800 63,000 3.4 1,900,100Employed 1,790,600 1,716,600 74,000 4.3 1,781,000
Unemployed 118,300 129,200 -10,900 -8.4 119,100Unemployment Rate 6.2 7.0 -0.8 --- 6.3
BRIDGEPORT - STAMFORD LMA Civilian Labor Force 488,600 469,800 18,800 4.0 485,400Employed 460,300 439,000 21,300 4.9 456,600
Unemployed 28,300 30,800 -2,500 -8.1 28,800Unemployment Rate 5.8 6.6 -0.8 --- 5.9
DANBURY LMA Civilian Labor Force 94,400 91,300 3,100 3.4 93,800Employed 90,000 86,300 3,700 4.3 89,200
Unemployed 4,400 5,000 -600 -12.0 4,600Unemployment Rate 4.7 5.5 -0.8 --- 4.9
ENFIELD LMA Civilian Labor Force 51,300 49,300 2,000 4.1 51,400Employed 48,200 46,100 2,100 4.6 48,400
Unemployed 3,100 3,200 -100 -3.1 3,000Unemployment Rate 6.1 6.5 -0.4 --- 5.8
HARTFORD LMA Civilian Labor Force 603,200 583,900 19,300 3.3 600,500Employed 565,800 543,100 22,700 4.2 562,700
Unemployed 37,400 40,700 -3,300 -8.1 37,800Unemployment Rate 6.2 7.0 -0.8 --- 6.3
NEW HAVEN LMA Civilian Labor Force 320,500 310,400 10,100 3.3 319,300Employed 300,000 287,800 12,200 4.2 298,600
Unemployed 20,500 22,600 -2,100 -9.3 20,700Unemployment Rate 6.4 7.3 -0.9 --- 6.5
NORWICH - NEW LONDON LMA Civilian Labor Force 146,000 143,000 3,000 2.1 145,900Employed 136,500 132,300 4,200 3.2 136,700
Unemployed 9,500 10,700 -1,200 -11.2 9,200Unemployment Rate 6.5 7.5 -1.0 --- 6.3
TORRINGTON LMA Civilian Labor Force 55,000 53,400 1,600 3.0 55,000Employed 51,900 50,000 1,900 3.8 52,000
Unemployed 3,000 3,400 -400 -11.8 3,000Unemployment Rate 5.5 6.3 -0.8 --- 5.5
WATERBURY LMA Civilian Labor Force 102,800 99,900 2,900 2.9 102,000Employed 94,400 90,600 3,800 4.2 93,500
Unemployed 8,400 9,200 -800 -8.7 8,400Unemployment Rate 8.2 9.3 -1.1 --- 8.3
WILLIMANTIC-DANIELSON LMA Civilian Labor Force 58,600 56,600 2,000 3.5 58,400Employed 54,400 52,200 2,200 4.2 54,400
Unemployed 4,100 4,400 -300 -6.8 4,000Unemployment Rate 7.1 7.8 -0.7 --- 6.9
UNITED STATES Civilian Labor Force 156,297,000 155,046,000 1,251,000 0.8 156,616,000Employed 147,666,000 144,775,000 2,891,000 2.0 147,936,000
Unemployed 8,630,000 10,271,000 -1,641,000 -16.0 8,680,000Unemployment Rate 5.5 6.6 -1.1 --- 5.5
LMA
THE CONNECTICUT ECONOMIC DIGEST 19January 2015
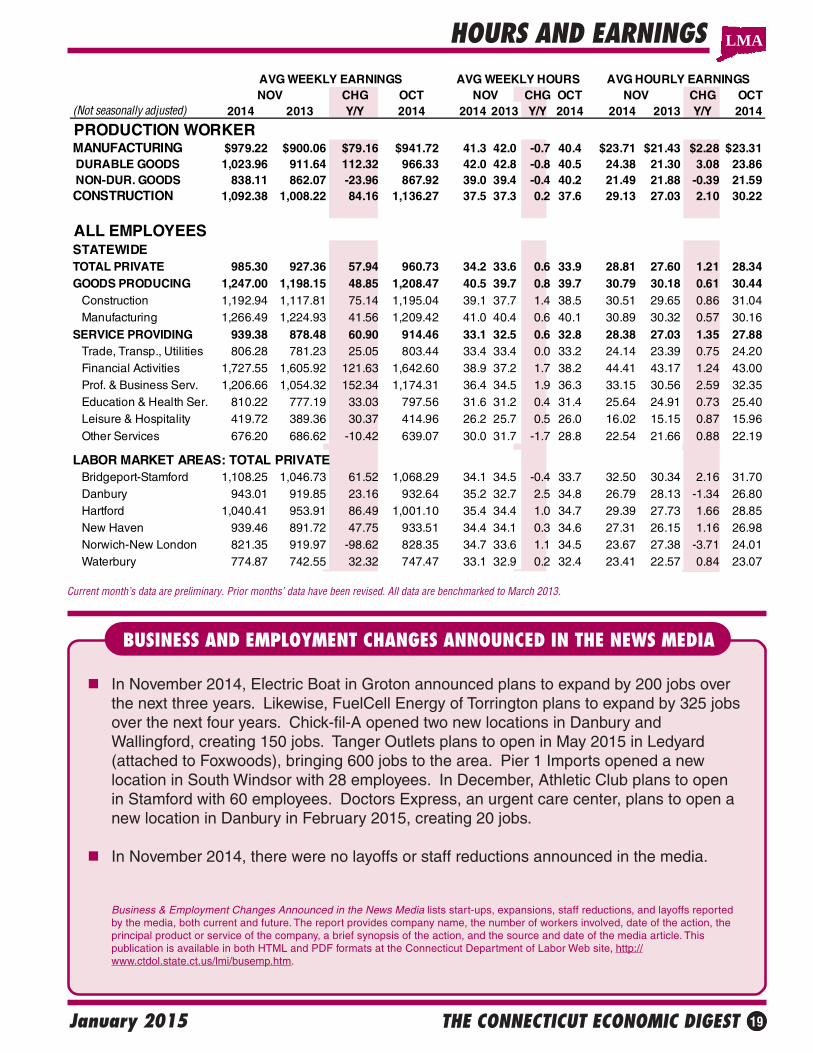
HOURS AND EARNINGS
Current month’s data are preliminary. Prior months’ data have been revised. All data are benchmarked to March 2013.
BUSINESS AND EMPLOYMENT CHANGES ANNOUNCED IN THE NEWS MEDIA
In November 2014, Electric Boat in Groton announced plans to expand by 200 jobs overthe next three years. Likewise, FuelCell Energy of Torrington plans to expand by 325 jobsover the next four years. Chick-fil-A opened two new locations in Danbury andWallingford, creating 150 jobs. Tanger Outlets plans to open in May 2015 in Ledyard(attached to Foxwoods), bringing 600 jobs to the area. Pier 1 Imports opened a newlocation in South Windsor with 28 employees. In December, Athletic Club plans to openin Stamford with 60 employees. Doctors Express, an urgent care center, plans to open anew location in Danbury in February 2015, creating 20 jobs.
In November 2014, there were no layoffs or staff reductions announced in the media.
Business & Employment Changes Announced in the News Media lists start-ups, expansions, staff reductions, and layoffs reportedby the media, both current and future. The report provides company name, the number of workers involved, date of the action, theprincipal product or service of the company, a brief synopsis of the action, and the source and date of the media article. Thispublication is available in both HTML and PDF formats at the Connecticut Department of Labor Web site, http://www.ctdol.state.ct.us/lmi/busemp.htm.
LMA
AVG WEEKLY EARNINGS AVG WEEKLY HOURS AVG HOURLY EARNINGSNOV CHG OCT NOV CHG OCT NOV CHG OCT
(Not seasonally adjusted) 2014 2013 Y/Y 2014 2014 2013 Y/Y 2014 2014 2013 Y/Y 2014
PRODUCTION WORKERMANUFACTURING $979.22 $900.06 $79.16 $941.72 41.3 42.0 -0.7 40.4 $23.71 $21.43 $2.28 $23.31 DURABLE GOODS 1,023.96 911.64 112.32 966.33 42.0 42.8 -0.8 40.5 24.38 21.30 3.08 23.86 NON-DUR. GOODS 838.11 862.07 -23.96 867.92 39.0 39.4 -0.4 40.2 21.49 21.88 -0.39 21.59CONSTRUCTION 1,092.38 1,008.22 84.16 1,136.27 37.5 37.3 0.2 37.6 29.13 27.03 2.10 30.22
ALL EMPLOYEESSTATEWIDETOTAL PRIVATE 985.30 927.36 57.94 960.73 34.2 33.6 0.6 33.9 28.81 27.60 1.21 28.34GOODS PRODUCING 1,247.00 1,198.15 48.85 1,208.47 40.5 39.7 0.8 39.7 30.79 30.18 0.61 30.44 Construction 1,192.94 1,117.81 75.14 1,195.04 39.1 37.7 1.4 38.5 30.51 29.65 0.86 31.04 Manufacturing 1,266.49 1,224.93 41.56 1,209.42 41.0 40.4 0.6 40.1 30.89 30.32 0.57 30.16SERVICE PROVIDING 939.38 878.48 60.90 914.46 33.1 32.5 0.6 32.8 28.38 27.03 1.35 27.88 Trade, Transp., Utilities 806.28 781.23 25.05 803.44 33.4 33.4 0.0 33.2 24.14 23.39 0.75 24.20 Financial Activities 1,727.55 1,605.92 121.63 1,642.60 38.9 37.2 1.7 38.2 44.41 43.17 1.24 43.00 Prof. & Business Serv. 1,206.66 1,054.32 152.34 1,174.31 36.4 34.5 1.9 36.3 33.15 30.56 2.59 32.35 Education & Health Ser. 810.22 777.19 33.03 797.56 31.6 31.2 0.4 31.4 25.64 24.91 0.73 25.40 Leisure & Hospitality 419.72 389.36 30.37 414.96 26.2 25.7 0.5 26.0 16.02 15.15 0.87 15.96 Other Services 676.20 686.62 -10.42 639.07 30.0 31.7 -1.7 28.8 22.54 21.66 0.88 22.19
LABOR MARKET AREAS: TOTAL PRIVATE Bridgeport-Stamford 1,108.25 1,046.73 61.52 1,068.29 34.1 34.5 -0.4 33.7 32.50 30.34 2.16 31.70 Danbury 943.01 919.85 23.16 932.64 35.2 32.7 2.5 34.8 26.79 28.13 -1.34 26.80 Hartford 1,040.41 953.91 86.49 1,001.10 35.4 34.4 1.0 34.7 29.39 27.73 1.66 28.85 New Haven 939.46 891.72 47.75 933.51 34.4 34.1 0.3 34.6 27.31 26.15 1.16 26.98 Norwich-New London 821.35 919.97 -98.62 828.35 34.7 33.6 1.1 34.5 23.67 27.38 -3.71 24.01 Waterbury 774.87 742.55 32.32 747.47 33.1 32.9 0.2 32.4 23.41 22.57 0.84 23.07
THE CONNECTICUT ECONOMIC DIGEST20 January 2015
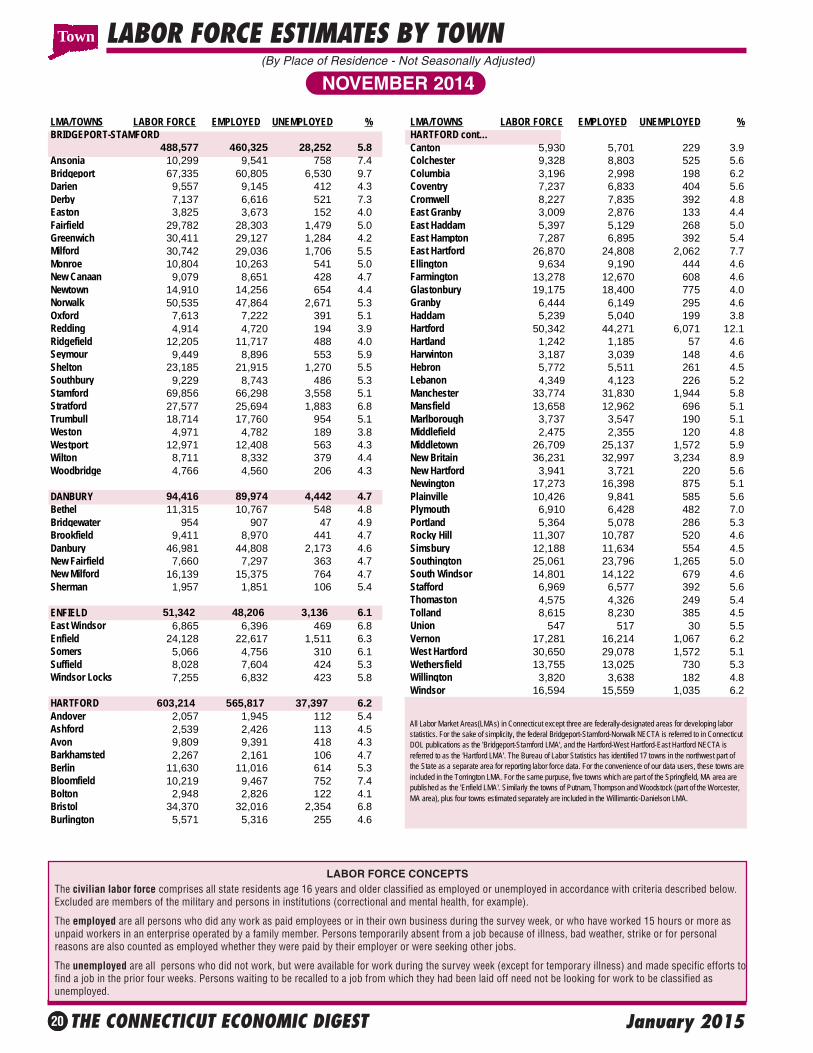
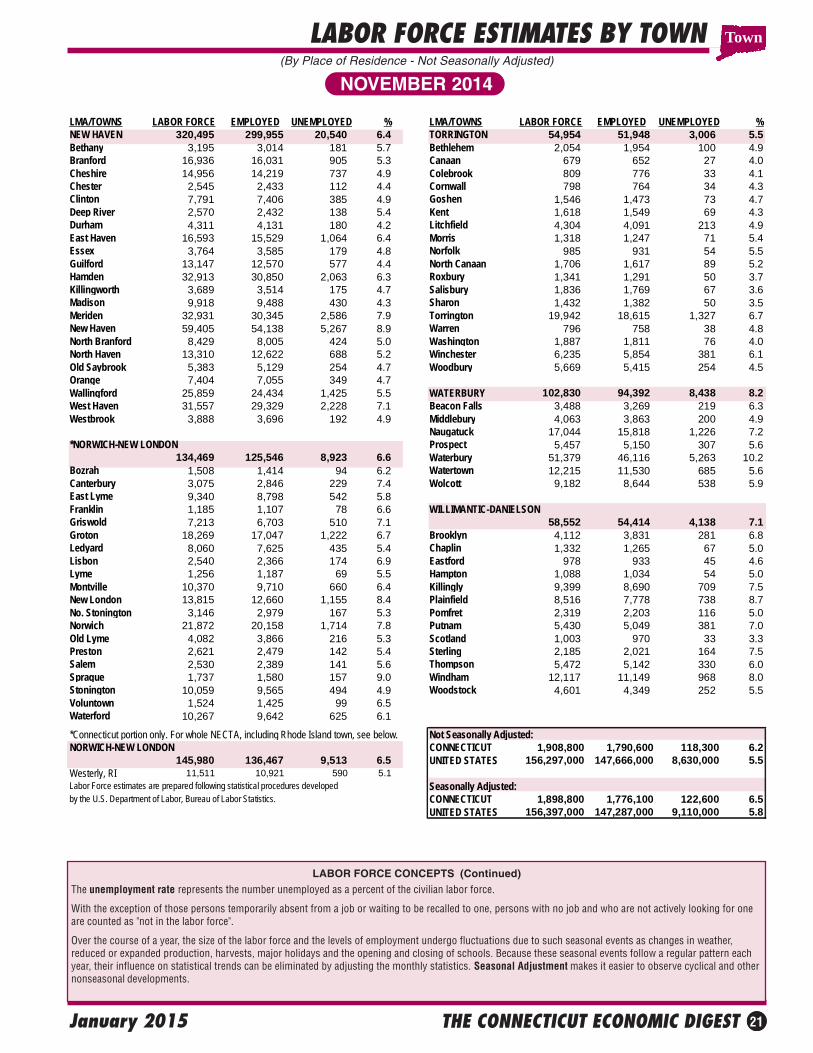
LABOR FORCE ESTIMATES BY TOWN
NOVEMBER 2014(By Place of Residence - Not Seasonally Adjusted)
The civilian labor force comprises all state residents age 16 years and older classified as employed or unemployed in accordance with criteria described below.Excluded are members of the military and persons in institutions (correctional and mental health, for example).
The employed are all persons who did any work as paid employees or in their own business during the survey week, or who have worked 15 hours or more asunpaid workers in an enterprise operated by a family member. Persons temporarily absent from a job because of illness, bad weather, strike or for personalreasons are also counted as employed whether they were paid by their employer or were seeking other jobs.
The unemployed are all persons who did not work, but were available for work during the survey week (except for temporary illness) and made specific efforts tofind a job in the prior four weeks. Persons waiting to be recalled to a job from which they had been laid off need not be looking for work to be classified asunemployed.
LABOR FORCE CONCEPTS
Town
LMA/TOWNS LABOR FORCE EMPLOYED UNEMPLOYED % LMA/TOWNS LABOR FORCE EMPLOYED UNEMPLOYED %BRIDGEPORT-STAMFORD HARTFORD cont…
488,577 460,325 28,252 5.8 Canton 5,930 5,701 229 3.9Ansonia 10,299 9,541 758 7.4 Colchester 9,328 8,803 525 5.6Bridgeport 67,335 60,805 6,530 9.7 Columbia 3,196 2,998 198 6.2Darien 9,557 9,145 412 4.3 Coventry 7,237 6,833 404 5.6Derby 7,137 6,616 521 7.3 Cromwell 8,227 7,835 392 4.8Easton 3,825 3,673 152 4.0 East Granby 3,009 2,876 133 4.4Fairfield 29,782 28,303 1,479 5.0 East Haddam 5,397 5,129 268 5.0Greenwich 30,411 29,127 1,284 4.2 East Hampton 7,287 6,895 392 5.4Milford 30,742 29,036 1,706 5.5 East Hartford 26,870 24,808 2,062 7.7Monroe 10,804 10,263 541 5.0 Ellington 9,634 9,190 444 4.6New Canaan 9,079 8,651 428 4.7 Farmington 13,278 12,670 608 4.6Newtown 14,910 14,256 654 4.4 Glastonbury 19,175 18,400 775 4.0Norwalk 50,535 47,864 2,671 5.3 Granby 6,444 6,149 295 4.6Oxford 7,613 7,222 391 5.1 Haddam 5,239 5,040 199 3.8Redding 4,914 4,720 194 3.9 Hartford 50,342 44,271 6,071 12.1Ridgefield 12,205 11,717 488 4.0 Hartland 1,242 1,185 57 4.6Seymour 9,449 8,896 553 5.9 Harwinton 3,187 3,039 148 4.6Shelton 23,185 21,915 1,270 5.5 Hebron 5,772 5,511 261 4.5Southbury 9,229 8,743 486 5.3 Lebanon 4,349 4,123 226 5.2Stamford 69,856 66,298 3,558 5.1 Manchester 33,774 31,830 1,944 5.8Stratford 27,577 25,694 1,883 6.8 Mansfield 13,658 12,962 696 5.1Trumbull 18,714 17,760 954 5.1 Marlborough 3,737 3,547 190 5.1Weston 4,971 4,782 189 3.8 Middlefield 2,475 2,355 120 4.8Westport 12,971 12,408 563 4.3 Middletown 26,709 25,137 1,572 5.9Wilton 8,711 8,332 379 4.4 New Britain 36,231 32,997 3,234 8.9Woodbridge 4,766 4,560 206 4.3 New Hartford 3,941 3,721 220 5.6
Newington 17,273 16,398 875 5.1DANBURY 94,416 89,974 4,442 4.7 Plainville 10,426 9,841 585 5.6Bethel 11,315 10,767 548 4.8 Plymouth 6,910 6,428 482 7.0Bridgewater 954 907 47 4.9 Portland 5,364 5,078 286 5.3Brookfield 9,411 8,970 441 4.7 Rocky Hill 11,307 10,787 520 4.6Danbury 46,981 44,808 2,173 4.6 Simsbury 12,188 11,634 554 4.5New Fairfield 7,660 7,297 363 4.7 Southington 25,061 23,796 1,265 5.0New Milford 16,139 15,375 764 4.7 South Windsor 14,801 14,122 679 4.6Sherman 1,957 1,851 106 5.4 Stafford 6,969 6,577 392 5.6
Thomaston 4,575 4,326 249 5.4ENFIELD 51,342 48,206 3,136 6.1 Tolland 8,615 8,230 385 4.5East Windsor 6,865 6,396 469 6.8 Union 547 517 30 5.5Enfield 24,128 22,617 1,511 6.3 Vernon 17,281 16,214 1,067 6.2Somers 5,066 4,756 310 6.1 West Hartford 30,650 29,078 1,572 5.1Suffield 8,028 7,604 424 5.3 Wethersfield 13,755 13,025 730 5.3Windsor Locks 7,255 6,832 423 5.8 Willington 3,820 3,638 182 4.8
Windsor 16,594 15,559 1,035 6.2HARTFORD 603,214 565,817 37,397 6.2Andover 2,057 1,945 112 5.4Ashford 2,539 2,426 113 4.5Avon 9,809 9,391 418 4.3Barkhamsted 2,267 2,161 106 4.7Berlin 11,630 11,016 614 5.3Bloomfield 10,219 9,467 752 7.4Bolton 2,948 2,826 122 4.1Bristol 34,370 32,016 2,354 6.8Burlington 5,571 5,316 255 4.6
All Labor Market Areas(LMAs) in Connecticut except three are federally-designated areas for developing labor statistics. For the sake of simplicity, the federal Bridgeport-Stamford-Norwalk NECTA is referred to in Connecticut DOL publications as the 'Bridgeport-Stamford LMA', and the Hartford-West Hartford-East Hartford NECTA is referred to as the 'Hartford LMA'. The Bureau of Labor Statistics has identified 17 towns in the northwest part of the State as a separate area for reporting labor force data. For the convenience of our data users, these towns are included in the Torrington LMA. For the same purpuse, five towns which are part of the Springfield, MA area are published as the 'Enfield LMA'. Similarly the towns of Putnam, Thompson and Woodstock (part of the Worcester, MA area), plus four towns estimated separately are included in the Willimantic-Danielson LMA.
THE CONNECTICUT ECONOMIC DIGEST 21January 2015
LABOR FORCE ESTIMATES BY TOWN
The unemployment rate represents the number unemployed as a percent of the civilian labor force.
With the exception of those persons temporarily absent from a job or waiting to be recalled to one, persons with no job and who are not actively looking for oneare counted as "not in the labor force".
Over the course of a year, the size of the labor force and the levels of employment undergo fluctuations due to such seasonal events as changes in weather,reduced or expanded production, harvests, major holidays and the opening and closing of schools. Because these seasonal events follow a regular pattern eachyear, their influence on statistical trends can be eliminated by adjusting the monthly statistics. Seasonal Adjustment makes it easier to observe cyclical and othernonseasonal developments.
(By Place of Residence - Not Seasonally Adjusted)
NOVEMBER 2014
LABOR FORCE CONCEPTS (Continued)
Town
LMA/TOWNS LABOR FORCE EMPLOYED UNEMPLOYED % LMA/TOWNS LABOR FORCE EMPLOYED UNEMPLOYED %NEW HAVEN 320,495 299,955 20,540 6.4 TORRINGTON 54,954 51,948 3,006 5.5Bethany 3,195 3,014 181 5.7 Bethlehem 2,054 1,954 100 4.9Branford 16,936 16,031 905 5.3 Canaan 679 652 27 4.0Cheshire 14,956 14,219 737 4.9 Colebrook 809 776 33 4.1Chester 2,545 2,433 112 4.4 Cornwall 798 764 34 4.3Clinton 7,791 7,406 385 4.9 Goshen 1,546 1,473 73 4.7Deep River 2,570 2,432 138 5.4 Kent 1,618 1,549 69 4.3Durham 4,311 4,131 180 4.2 Litchfield 4,304 4,091 213 4.9East Haven 16,593 15,529 1,064 6.4 Morris 1,318 1,247 71 5.4Essex 3,764 3,585 179 4.8 Norfolk 985 931 54 5.5Guilford 13,147 12,570 577 4.4 North Canaan 1,706 1,617 89 5.2Hamden 32,913 30,850 2,063 6.3 Roxbury 1,341 1,291 50 3.7Killingworth 3,689 3,514 175 4.7 Salisbury 1,836 1,769 67 3.6Madison 9,918 9,488 430 4.3 Sharon 1,432 1,382 50 3.5Meriden 32,931 30,345 2,586 7.9 Torrington 19,942 18,615 1,327 6.7New Haven 59,405 54,138 5,267 8.9 Warren 796 758 38 4.8North Branford 8,429 8,005 424 5.0 Washington 1,887 1,811 76 4.0North Haven 13,310 12,622 688 5.2 Winchester 6,235 5,854 381 6.1Old Saybrook 5,383 5,129 254 4.7 Woodbury 5,669 5,415 254 4.5Orange 7,404 7,055 349 4.7Wallingford 25,859 24,434 1,425 5.5 WATERBURY 102,830 94,392 8,438 8.2West Haven 31,557 29,329 2,228 7.1 Beacon Falls 3,488 3,269 219 6.3Westbrook 3,888 3,696 192 4.9 Middlebury 4,063 3,863 200 4.9
Naugatuck 17,044 15,818 1,226 7.2*NORWICH-NEW LONDON Prospect 5,457 5,150 307 5.6
134,469 125,546 8,923 6.6 Waterbury 51,379 46,116 5,263 10.2Bozrah 1,508 1,414 94 6.2 Watertown 12,215 11,530 685 5.6Canterbury 3,075 2,846 229 7.4 Wolcott 9,182 8,644 538 5.9East Lyme 9,340 8,798 542 5.8Franklin 1,185 1,107 78 6.6 WILLIMANTIC-DANIELSONGriswold 7,213 6,703 510 7.1 58,552 54,414 4,138 7.1Groton 18,269 17,047 1,222 6.7 Brooklyn 4,112 3,831 281 6.8Ledyard 8,060 7,625 435 5.4 Chaplin 1,332 1,265 67 5.0Lisbon 2,540 2,366 174 6.9 Eastford 978 933 45 4.6Lyme 1,256 1,187 69 5.5 Hampton 1,088 1,034 54 5.0Montville 10,370 9,710 660 6.4 Killingly 9,399 8,690 709 7.5New London 13,815 12,660 1,155 8.4 Plainfield 8,516 7,778 738 8.7No. Stonington 3,146 2,979 167 5.3 Pomfret 2,319 2,203 116 5.0Norwich 21,872 20,158 1,714 7.8 Putnam 5,430 5,049 381 7.0Old Lyme 4,082 3,866 216 5.3 Scotland 1,003 970 33 3.3Preston 2,621 2,479 142 5.4 Sterling 2,185 2,021 164 7.5Salem 2,530 2,389 141 5.6 Thompson 5,472 5,142 330 6.0Sprague 1,737 1,580 157 9.0 Windham 12,117 11,149 968 8.0Stonington 10,059 9,565 494 4.9 Woodstock 4,601 4,349 252 5.5Voluntown 1,524 1,425 99 6.5Waterford 10,267 9,642 625 6.1
*Connecticut portion only. For whole NECTA, including Rhode Island town, see below. Not Seasonally Adjusted:NORWICH-NEW LONDON CONNECTICUT 1,908,800 1,790,600 118,300 6.2
145,980 136,467 9,513 6.5 UNITED STATES 156,297,000 147,666,000 8,630,000 5.5Westerly, RI 11,511 10,921 590 5.1Labor Force estimates are prepared following statistical procedures developed Seasonally Adjusted:by the U.S. Department of Labor, Bureau of Labor Statistics. CONNECTICUT 1,898,800 1,776,100 122,600 6.5
UNITED STATES 156,397,000 147,287,000 9,110,000 5.8
THE CONNECTICUT ECONOMIC DIGEST22 January 2015
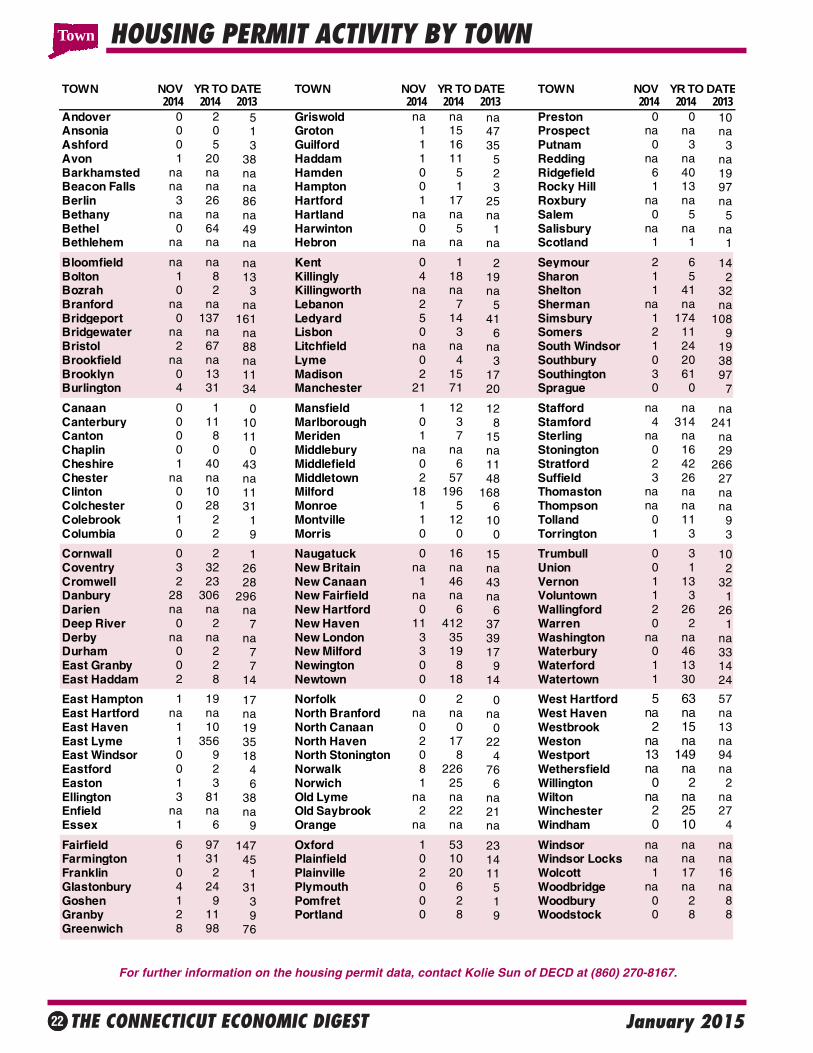
HOUSING PERMIT ACTIVITY BY TOWN
For further information on the housing permit data, contact Kolie Sun of DECD at (860) 270-8167.
TOWN NOV YR TO DATE TOWN NOV YR TO DATE TOWN NOV YR TO DATE2014 2014 2013 2014 2014 2013 2014 2014 2013
Andover 0 2 5 Griswold na na na Preston 0 0 10Ansonia 0 0 1 Groton 1 15 47 Prospect na na naAshford 0 5 3 Guilford 1 16 35 Putnam 0 3 3Avon 1 20 38 Haddam 1 11 5 Redding na na naBarkhamsted na na na Hamden 0 5 2 Ridgefield 6 40 19Beacon Falls na na na Hampton 0 1 3 Rocky Hill 1 13 97Berlin 3 26 86 Hartford 1 17 25 Roxbury na na naBethany na na na Hartland na na na Salem 0 5 5Bethel 0 64 49 Harwinton 0 5 1 Salisbury na na naBethlehem na na na Hebron na na na Scotland 1 1 1
Bloomfield na na na Kent 0 1 2 Seymour 2 6 14Bolton 1 8 13 Killingly 4 18 19 Sharon 1 5 2Bozrah 0 2 3 Killingworth na na na Shelton 1 41 32Branford na na na Lebanon 2 7 5 Sherman na na naBridgeport 0 137 161 Ledyard 5 14 41 Simsbury 1 174 108Bridgewater na na na Lisbon 0 3 6 Somers 2 11 9Bristol 2 67 88 Litchfield na na na South Windsor 1 24 19Brookfield na na na Lyme 0 4 3 Southbury 0 20 38Brooklyn 0 13 11 Madison 2 15 17 Southington 3 61 97Burlington 4 31 34 Manchester 21 71 20 Sprague 0 0 7
Canaan 0 1 0 Mansfield 1 12 12 Stafford na na naCanterbury 0 11 10 Marlborough 0 3 8 Stamford 4 314 241Canton 0 8 11 Meriden 1 7 15 Sterling na na naChaplin 0 0 0 Middlebury na na na Stonington 0 16 29Cheshire 1 40 43 Middlefield 0 6 11 Stratford 2 42 266Chester na na na Middletown 2 57 48 Suffield 3 26 27Clinton 0 10 11 Milford 18 196 168 Thomaston na na naColchester 0 28 31 Monroe 1 5 6 Thompson na na naColebrook 1 2 1 Montville 1 12 10 Tolland 0 11 9Columbia 0 2 9 Morris 0 0 0 Torrington 1 3 3
Cornwall 0 2 1 Naugatuck 0 16 15 Trumbull 0 3 10Coventry 3 32 26 New Britain na na na Union 0 1 2Cromwell 2 23 28 New Canaan 1 46 43 Vernon 1 13 32Danbury 28 306 296 New Fairfield na na na Voluntown 1 3 1Darien na na na New Hartford 0 6 6 Wallingford 2 26 26Deep River 0 2 7 New Haven 11 412 37 Warren 0 2 1Derby na na na New London 3 35 39 Washington na na naDurham 0 2 7 New Milford 3 19 17 Waterbury 0 46 33East Granby 0 2 7 Newington 0 8 9 Waterford 1 13 14East Haddam 2 8 14 Newtown 0 18 14 Watertown 1 30 24
East Hampton 1 19 17 Norfolk 0 2 0 West Hartford 5 63 57East Hartford na na na North Branford na na na West Haven na na naEast Haven 1 10 19 North Canaan 0 0 0 Westbrook 2 15 13East Lyme 1 356 35 North Haven 2 17 22 Weston na na naEast Windsor 0 9 18 North Stonington 0 8 4 Westport 13 149 94Eastford 0 2 4 Norwalk 8 226 76 Wethersfield na na naEaston 1 3 6 Norwich 1 25 6 Willington 0 2 2Ellington 3 81 38 Old Lyme na na na Wilton na na naEnfield na na na Old Saybrook 2 22 21 Winchester 2 25 27Essex 1 6 9 Orange na na na Windham 0 10 4
Fairfield 6 97 147 Oxford 1 53 23 Windsor na na naFarmington 1 31 45 Plainfield 0 10 14 Windsor Locks na na naFranklin 0 2 1 Plainville 2 20 11 Wolcott 1 17 16Glastonbury 4 24 31 Plymouth 0 6 5 Woodbridge na na naGoshen 1 9 3 Pomfret 0 2 1 Woodbury 0 2 8Granby 2 11 9 Portland 0 8 9 Woodstock 0 8 8Greenwich 8 98 76
Town
THE CONNECTICUT ECONOMIC DIGEST 23January 2015
TECHNICAL NOTESBUSINESS STARTS AND TERMINATIONSRegistrations and terminations of business entities as recorded with the Secretary of the State and the ConnecticutDepartment of Labor (DOL) are an indication of new business formation and activity. DOL business starts include newemployers which have become liable for unemployment insurance taxes during the quarter, as well as new establish-ments opened by existing employers. DOL business terminations are those accounts discontinued due to inactivity (noemployees) or business closure, and accounts for individual business establishments that are closed by still activeemployers. The Secretary of the State registrations include limited liability companies, limited liability partnerships, andforeign-owned (out-of-state) and domestic-owned (in-state) corporations.
CONSUMER PRICE INDEXThe Consumer Price Index (CPI), computed and published by the U.S. Bureau of Labor Statistics, is a measure of theaverage change in prices over time in a fixed market basket of goods and services. It is based on prices of food, clothing,shelter, fuels, transportation fares, charges for doctors’ and dentists’ services, drugs and other goods and services thatpeople buy for their day-to-day living. The Northeast region is comprised of the New England states, New York, NewJersey and Pennsylvania.
EMPLOYMENT COST INDEXThe Employment Cost Index (ECI) covers both wages and salaries and employer costs for employee benefits for alloccupations and establishments in both the private nonfarm sector and state and local government. The ECI measuresemployers’ labor costs free from the influences of employment shifts among industries and occupations. The base periodfor all data is June 1989 when the ECI is 100.
HOURS AND EARNINGS ESTIMATESProduction worker earnings and hours estimates include full- and part-time employees working within manufacturingindustries. Hours worked and earnings data are computed based on payroll figures for the week including the 12th of themonth. Average hourly earnings are affected by such factors as premium pay for overtime and shift differential as well aschanges in basic hourly and incentive rates of pay. Average weekly earnings are the product of weekly hours worked andhourly earnings. These data are developed in cooperation with the U.S. Department of Labor, Bureau of Labor Statistics.
INDIAN GAMING DATAIndian Gaming Payments are amounts received by the State as a result of the slot compact with the two Federallyrecognized tribes in Connecticut, which calls for 25 percent of net slot receipts to be remitted to the State. IndianGaming Slots are the total net revenues from slot machines only received by the two Federally recognized Indian tribes.
INITIAL CLAIMSAverage weekly initial claims are calculated by dividing the total number of new claims for unemployment insurancereceived in the month by the number of weeks in the month. A minor change in methodology took effect with datapublished in the March 1997 issue of the DIGEST. Data have been revised back to January 1980.
INSURED UNEMPLOYMENT RATEPrimarily a measure of unemployment insurance program activity, the insured unemployment rate is the 13-weekaverage of the number of people claiming unemployment benefits divided by the number of workers covered by theunemployment insurance system.
LABOR FORCE ESTIMATESLabor force estimates are a measure of the work status of people who live in Connecticut. Prepared under the direction ofthe U.S. Bureau of Labor Statistics, the statewide estimates are the product of a signal-plus noise model, which usesresults from the Current Population Survey (CPS), a monthly survey of Connecticut households, counts of claimants forunemployment benefits, and establishment employment estimates. Beginning with the publication of January 2005 data,an improved methodology is being used to develop labor force estimates, by which monthly state model-based employ-ment and unemployment estimates are controlled to add to the national CPS levels. This will ensure that nationaleconomic events are reflected in the state estimates, and it will significantly reduce end-of-year revisions. (For moreinformation, please see the Connecticut Economic Digest, December 2004 issue.) Labor force data, reflecting personsemployed by place of residence, are not directly comparable to the place-of-work industry employment series. In thelabor force estimates, workers involved in labor disputes are counted as employed. The labor force data also includesagricultural workers, unpaid family workers, domestics and the self-employed. Because of these conceptual differences,total labor force employment is almost always different from nonfarm wage and salary employment.
LABOR MARKET AREASAll Labor Market Areas (LMAs) in Connecticut except three are federally-designated areas for developing labor statistics.For the sake of simplicity, the federal Bridgeport-Norwalk-Stamford Metropolitan Statistical Area (MSA) is referred to inConnecticut Department of Labor publications as the Bridgeport-Stamford LMA, and the Hartford-West Hartford-EastHartford MSA is called the Hartford LMA. The Bureau of Labor Statistics has identified the 17 towns in the in the north-western part of the state as a separate area for reporting labor force data. For the convenience of our data users, data forthese towns are included in the Torrington LMA. For the same purpose, data for the towns of East Windsor, Enfield,Somers, Suffield and Windsor Locks, which are officially part of the Springfield MSA, are published as the Enfield LMA.Similarly, the towns of Putnam, Thompson and Woodstock - part of the Worcester MSA - are included in the Willimantic-Danielson LMA. Also, data for Westerly, Rhode Island are included in the Norwich-New London LMA. Industry employ-ment and labor force data estimates contained in Connecticut Department of Labor publications are prepared followingthe same statistical procedures developed by the U.S. Department of Labor, Bureau of Labor Statistics, whether forfederally designated or state-determined areas.
NONFARM EMPLOYMENT ESTIMATESNonfarm employment estimates are derived from a survey of businesses to measure jobs by industry. The estimatesinclude all full- and part-time wage and salary employees who worked during or received pay for the pay period whichincludes the 12th of the month. Excluded from these estimates are proprietors, self-employed workers, private householdemployees and unpaid family workers. In some cases, due to space constraints, all industry estimates are not shown.Call (860) 263-6275 for a more comprehensive breakout of nonfarm employment estimates. These data are developed incooperation with the U.S. Department of Labor, Bureau of Labor Statistics.
UI COVERED WAGESUI covered wages is the total amount paid to those employees who are covered under the Connecticut’s UnemploymentInsurance (UI) law for services performed during the quarter. The fluctuations in the 1992-93 period reflect the effect ofthe changes in the tax law and the massive restructuring in the state’s economy.
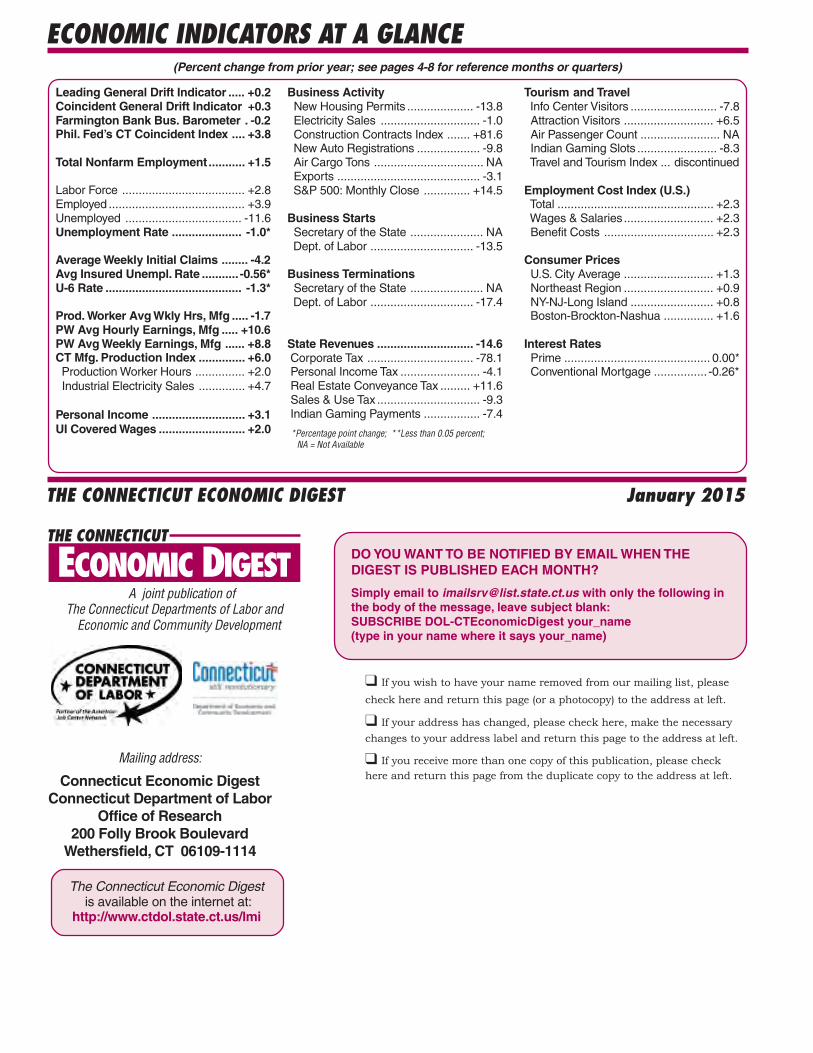
ECONOMIC INDICATORS AT A GLANCE
Leading General Drift Indicator ..... +0.2Coincident General Drift Indicator +0.3Farmington Bank Bus. Barometer . -0.2Phil. Fed’s CT Coincident Index .... +3.8
Total Nonfarm Employment........... +1.5
Labor Force ..................................... +2.8Employed ......................................... +3.9Unemployed ................................... -11.6Unemployment Rate ..................... -1.0*
Average Weekly Initial Claims ........ -4.2Avg Insured Unempl. Rate ........... -0.56*U-6 Rate ......................................... -1.3*
Prod. Worker Avg Wkly Hrs, Mfg ..... -1.7PW Avg Hourly Earnings, Mfg ..... +10.6PW Avg Weekly Earnings, Mfg ...... +8.8CT Mfg. Production Index .............. +6.0 Production Worker Hours ............... +2.0 Industrial Electricity Sales .............. +4.7
Personal Income ............................ +3.1UI Covered Wages .......................... +2.0
Business Activity New Housing Permits .................... -13.8 Electricity Sales .............................. -1.0 Construction Contracts Index ....... +81.6 New Auto Registrations ................... -9.8 Air Cargo Tons ................................. NA Exports ........................................... -3.1 S&P 500: Monthly Close .............. +14.5
Business Starts Secretary of the State ...................... NA Dept. of Labor ............................... -13.5
Business Terminations Secretary of the State ...................... NA Dept. of Labor ............................... -17.4
State Revenues ............................. -14.6 Corporate Tax ................................ -78.1 Personal Income Tax ........................ -4.1 Real Estate Conveyance Tax ......... +11.6 Sales & Use Tax ............................... -9.3 Indian Gaming Payments ................. -7.4
Tourism and Travel Info Center Visitors .......................... -7.8 Attraction Visitors ........................... +6.5 Air Passenger Count ........................ NA Indian Gaming Slots ........................ -8.3 Travel and Tourism Index ... discontinued
Employment Cost Index (U.S.) Total ............................................... +2.3 Wages & Salaries........................... +2.3 Benefit Costs ................................. +2.3
Consumer Prices U.S. City Average ........................... +1.3 Northeast Region ........................... +0.9 NY-NJ-Long Island ......................... +0.8 Boston-Brockton-Nashua ............... +1.6
Interest Rates Prime ............................................ 0.00* Conventional Mortgage ................ -0.26*
Mailing address:
Connecticut Economic DigestConnecticut Department of Labor
Office of Research200 Folly Brook Boulevard
Wethersfield, CT 06109-1114
THE CONNECTICUT ECONOMIC DIGEST
*Percentage point change; **Less than 0.05 percent; NA = Not Available
The Connecticut Economic Digest is available on the internet at:
http://www.ctdol.state.ct.us/lmi
January 2015
(Percent change from prior year; see pages 4-8 for reference months or quarters)
THE CONNECTICUT
A joint publication of The Connecticut Departments of Labor and Economic and Community Development
ECONOMIC DIGEST
If you wish to have your name removed from our mailing list, pleasecheck here and return this page (or a photocopy) to the address at left.
If your address has changed, please check here, make the necessarychanges to your address label and return this page to the address at left.
If you receive more than one copy of this publication, please checkhere and return this page from the duplicate copy to the address at left.
DO YOU WANT TO BE NOTIFIED BY EMAIL WHEN THEDIGEST IS PUBLISHED EACH MONTH?
Simply email to [email protected] with only the following inthe body of the message, leave subject blank:SUBSCRIBE DOL-CTEconomicDigest your_name(type in your name where it says your_name)