economic crisis and agricultural trade: impacts of price
TRANSCRIPT

Economic Crisis and Agricultural Trade: Impacts of Price Instability and Exchange Rates
Bruno Larue Titulaire de la Chaire de Recherche du Canada en Commerce International Agroalimentaire et directeur du CRÉA
Colloquium “Agricultural Trade in the Americas” CEI/CRÉA, Québec ,May 16, 2009.

The decline of housing prices triggered the current economic crisisthe current economic crisis
The S&P Case-Shiller index (20 US cities )
200,00
250,00
100,00
150,00
0,00
50,00
2000
2000
2000
2001
2001
2002
2002
2002
2003
2003
2004
2004
2005
2005
2005
2006
2006
2007
2007
2007
2008
2008
janvi
er 2
juin
2
nove
mbre
2
avril 2
septe
mbre
2
févr
ier
2
juill
et 2
déc
embre
2
mai
2
oct
obre
2
mar
s 2
août
2
janvi
er 2
juin
2
nove
mbre
2
avril 2
septe
mbre
2
févr
ier
2
juill
et 2
déc
embre
2
mai
2
oct
obre
2

The DJIA index dropped…. but some in the food business are OK (06/2006-05/2009)the food business are OK (06/2006-05/2009)

Commodity Prices Exploded!Commodity Prices Exploded!
16
Commodity prices
10
12
14
16
/bu
C
6
8
10
Pric
e in
$U
S/ Corn
Soybeans
Barley
Wheat
0
2
4
0 0 1 2 2 3 4 4 5 6 6 7 8 8
2000
2000
2001
2002
2002
2003
2004
2004
2005
2006
2006
2007
2008
2008

Quebec Average Hog Prices
200
250
Q g g
100
150
200
0
50
100
Hog Price
0 2000‐01
2000‐09
2001‐05
2002‐01
2002‐09
2003‐05
2004‐01
2004‐09
2005‐05
2006‐01
2006‐09
2007‐05
2008‐01
2008‐09
2009‐051‐08
9‐08
5‐08
1‐08
9‐08
5‐08
1‐08
9‐08
5‐08
1‐08
9‐08
5‐08
1‐08
9‐08
5‐08

Farm Input Prices Peaked After Commodity PricesFarm Input Prices Peaked After Commodity Prices

Canadian Food Retail Prices Were Slow to React (January 1999-March 2009)(January 1999-March 2009)
130
Consumer Price Indices: Canada
115
120
125
Food
105
110
115All
90
95
100
90
1999
1999
2000
2000
2001
2001
2002
2003
2003
2004
2004
2005
2006
2006
2007
2007
2008
2008

Why Did Commodity Prices Explode?Why Did Commodity Prices Explode?
-Economic development : when per capita income increases, demand for meat increases in low-income countries.
-Ethanolt a o
-Climate shocks and the inelastic nature of crops and livestock supply curves in the short runlivestock supply curves in the short run.


Ethanol was booming…Ethanol was booming…

US Ethnanol Production 1980-2008(in millions of gallons)(in millions of gallons)
6000
7000
4000
5000
2000
3000 Production
0
1000
1980
1981
1982
1983
1984
1985
1986
1987
1988
1989
1990
1991
1992
1993
1994
1995
1996
1997
1998
1999
2000
2001
2002
2003
2004
2005
2006
2007

8
Corn and Crude Oil Prices
6
7
u
4
5
ices
in $
US/
bu
Corn
2
3Pri Crude Oil
0
1
000
000
001
002
002
003
003
004
004
005
006
006
007
007
008
009
20 20 20 20 20 20 20 20 20 20 20 20 20 20 20 20

Some Say That the Price of Crude Oil is NOW Driving the Price of Corn…is NOW Driving the Price of Corn…
We found evidence of multiple cointegration regimes p g gbetween the two series.
We identified structural breaks in June of 2004 andWe identified structural breaks in June of 2004 and September 2006.
Pl i l h h b h i h l i hiPlainly put, there has been changes in the relationship between these prices, but they have been linked prior to 2006.

Inelastic Supply in the Short Term and Demand Shocksand Demand Shocks
pO
O’O
pD’O
p0
pD’O’
DD’
QQ0 QD’O’

Exchange Rates Trends
1 2
1,4
1,6
0,8
1
1,2
e chan
ge de $ CA CA/USA
CA/MEX
CA/CHILI
0,4
0,6Taux
d
CA/BRÉSIL
CA/Argentine
0
0,2
v.‐04
s‐04 i‐04
.‐04
t.‐04
v.‐04
v.‐05
s‐05 i‐05
.‐05
t.‐05
v.‐05
v.‐06
s‐06 i‐06
.‐06
t.‐06
v.‐06
v.‐07
s‐07 i‐07
.‐07
t.‐07
v.‐07
v.‐08
s‐08 i‐08
.‐08
t.‐08
v.‐08
v.‐09
s‐09 i‐09
01‐ja
nv
01‐m
ars
01‐m
a
01‐ju
il
01‐sep
t
01‐nov
01‐ja
nv
01‐m
ars
01‐m
a
01‐ju
il
01‐sep
t
01‐nov
01‐ja
nv
01‐m
ars
01‐m
a
01‐ju
il
01‐sep
t
01‐nov
01‐ja
nv
01‐m
ars
01‐m
a
01‐ju
il
01‐sep
t
01‐nov
01‐ja
nv
01‐m
ars
01‐m
a
01‐ju
il
01‐sep
t
01‐nov
01‐ja
nv
01‐m
ars
01‐m
a

Which currencies are most undervalued?
Mexico -35Mexico 35Chili -29Peru -28A ti 7Argentina -7Canada -5Brazil -2
Source: The Economist’s Bic Mac index

What are we to make of all this?
Are we in a new era in terms of commodity pricing?
What are we to make of all this?
Do we have sufficiently potent market and policy instruments to deal with price volatility?st u e ts to dea w t p ce vo at ty?
-Ethanol industry-Quebec’s ASRA program public vs private pricing of risk-public vs private pricing of risk
What are the consequences for production and trade?

Market Size and the Importance of Agricultural Exports and Imports in Total Imports and Exports
Country Population GNP/cap Ag Exp Ag Imp
Exports and Imports in Total Imports and Exports
Country Population GNP/cap Ag. Exp Ag.Imp(millions) (ppp US$)
Argentina 39.7 14406 51.5% 5%Brazil 191 9 10325 30% 6%Brazil 191.9 10325 30% 6%Canada 33.4 38834 11.6% 7.2%Chili 16.8 14486 20% 7.3%Mexico 108 7 13720 5 7% 7 8%Mexico 108.7 13720 5.7% 7.8%Peru 29.1 8453 15% 12.2%USA 303.9 46946 9.8% 5.4%

To What Extent Are Countries in the Americas Trading with One Another?Americas Trading with One Another?
Country Exp.Dest. Ag Imp.SourcesArgentina Brazil 17.4% EU Brazil 31.7%g
China 9.6% China USA 14.4%USA 7.8% BZ China 8.7%
Brazil USA 15.6% EU USA 15.5%Argen. 9% China China 12.5%Chi 6 7% USA A 8 6%China 6.7% USA Argen.8.6%
CanadaUSA 79.9% USA USA 59.8%UK 2.9% JP China 10.4%China 2.1% EU Mexico 4.7%
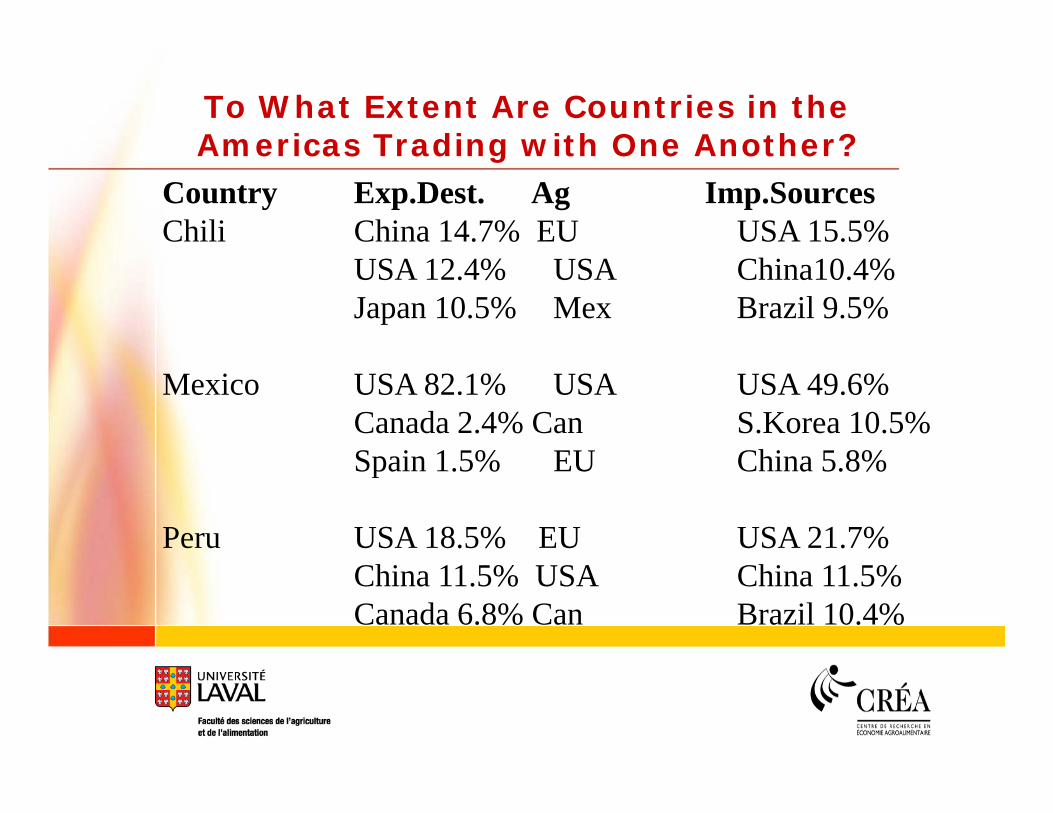
To What Extent Are Countries in the Americas Trading with One Another?
Country Exp.Dest. Ag Imp.SourcesChili China 14.7% EU USA 15.5%
Americas Trading with One Another?
USA 12.4% USA China10.4%Japan 10.5% Mex Brazil 9.5%
Mexico USA 82.1% USA USA 49.6%Canada 2.4% Can S.Korea 10.5%Spain 1 5% EU China 5 8%Spain 1.5% EU China 5.8%
Peru USA 18.5% EU USA 21.7%China 11.5% USA China 11.5%Canada 6.8% Can Brazil 10.4%

Other Evidence About Trade PotentialOther Evidence About Trade Potential
Brazilian border effects: Failly, Perracar and Terra (2008): NB=13, IB=75Daumal and Zignago (2008): NB=13.7, IB=290
Probability to trade/Extensive margin analysis:Ghazalian, Larue and Gervais (2009): Ecuador and Peru have more to gain from Columbianand Peru have more to gain from Columbian tariff reductions on livestock than Brazil and Argentina. Distance matters!

Thank you for you ATTENTION!Thank you for you ATTENTION!