economic and social statistics of sri lanka 2018 … · economic and social statistics of sri lanka...
TRANSCRIPT

2018
ECO
NO
MIC
AN
D SO
CIA
L STATISTIC
S OF SR
I LAN
KA
2018 VO
L. XL
Rs.
300
ISBN 978-955-575-368-5


ii
Printed at Central Bank Printing Press, 58, Sri Jayewardenepura Mawatha, Rajagiriya, Sri Lanka.Published by Statistics Department
Central Bank of Sri Lanka, 30, Janadhipathi Mawatha, Colombo 01, Sri Lanka.
Central Bank of Sri LankaStatistics Department
Tel. : 2477377Fax : 2477728E-mail : [email protected] site : http://www.cbsl.gov.lk
Volume XL
ISSN 1391 - 3611
ISBN 978 - 955 - 575 - 368 - 5
July 2018
Price : Rs. 300/-

iii
1 KEY SOCIO-ECONOMIC INDICATORS
SriLanka–CountryProfile 1
1.1 RealSector 2
1.2 AgricultureandIndustry 3
1.3 PriceandWages 4
1.4 Infrastructure 4
1.5 ExternalSector 5
1.6 MoneyandInterestRates 6
1.7 MoneyandCapitalMarkets 7
1.8 GovernmentFinance 8
1.9 FinancialInstitutions 8
SelectedSocio-EconomicIndicators –GraphicalIllustrations 9
2 CLIMATE
2.1 MeanTemperature 11
2.2 RainfallandRainyDays –Hydro-CatchmentAreas 11
2.3 RainfallandRainyDays –SelectedStations 12
2.4 Humidity 13
3 POPULATION AND LABOUR FORCE
3.1 PopulationbyDistrictandSector 2001and2012 14
3.2 PopulationbyReligionandEthnicity –CensusYears 14
3.3 PopulationbyDistrict,ReligionandEthnicity –2012Census 15
3.4 MidYearPopulationbyAgeGroup 15
3.5 MidYearPopulationbyProvinceandDistrict 16
3.6 PopulationDensity 17
3.7 VitalStatistics 17
3.8 CrudeBirthRatesandDeathRatesbyDistrict 18
3.9 LabourForce 19
3.10 Employment 20
3.11 Unemployment 21
3.12 PublicSectorEmployment 22
3.13 MigrationforForeignEmployment 23
3.14 DeparturesforForeignEmployment byCountry 24
3.15 DeparturesforForeignEmployment bySkillLevel,AgeGroupandGender 25
3.16 DeparturesforForeignEmployment byDistrict,ProvinceandGender 26
(Continued)
CONTENTS
4 NATIONAL ACCOUNTS
4.1 SummaryofNationalAccounts 27
4.2 GDP,GNIandDeflators(FactorCostPrices) 1970–2017 28
4.3 GrossDomesticProductatConstantPrices 1970–2017 29
4.4 GrossDomesticProductatCurrentPrices 1970–2017 30
4.5 GrossNationalIncomebyIndustrialOrigin atConstant(2010)Prices 31
4.6 GrossNationalIncomebyIndustrialOrigin atCurrentMarketPrices 32
4.7 CompositionofGrossDomesticProduct atCurrentMarketPrices 33
4.8 InvestmentandSavings (CurrentMarketPrices) 34
4.9 QuarterlyEstimatesofGDP [at(2010)ConstantPrices] 34
4.10 AggregateDemand 35
4.11 ProvincialGrossDomesticProduct
byIndustrialOriginatCurrentMarketPrices 36
4.12 ProvincialGrossDomesticProductbyIndustrialOriginatCurrentMarketPrices–2015 37
4.13 ProvincialGrossDomesticProductbyIndustrialOriginatCurrentMarketPrices–2016 39
5 AGRICULTURE
5.1 Tea 41
5.2 Rubber 42
5.3 Coconut 43
5.4 MinorExportCrops 44
5.5 Paddy 45
5.6 SubsidiaryFoodCrops 46
5.7 PrincipalCropsbyProvince 47
5.8 AgriculturalCrops–Yields,FarmgatePrices andCostsofCultivation–2016 48
5.9 AgriculturalCrops–Yields,FarmgatePrices andCostsofCultivation–2017 49
5.10 FishandLivestock 50
5.11 NationalLivestockStatisticsbyDistrict–2016 51
5.12 NationalLivestockStatisticsbyDistrict–2017 51
5.13 LivestockandPoultry –AverageProducerPrices–2016 52
5.14 LivestockandPoultry –AverageProducerPrices–2017 52
5.15 FishProduction 53
5.16 OperatingFishingCraftbyProvinceandType 53
5.17 CultivationLoans–RefinanceCreditSchemes 54

iv
5.18 PlantationSector –Manpower,Extent,ProductionandYield 55
5.19 SettlementsandLandCultivated underMahaweliProgramme 56
6 INDUSTRY
6.1 Sugar 57
6.2 MilkandMilkProducts 57
6.3 Textiles 58
6.4 Petroleum 59
6.5 Minerals 59
6.6 Cement 60
6.7 Electricity 60
6.8 GrossGenerationofElectricity byPowerStations–2016and2017 61
6.9 ElectricitySalesbyProvince 62
6.10 Water–Consumers,Consumption andRevenuebyProvince 63
6.11 BoardofInvestment(BOI)Enterprises 65
7 PRICES AND WAGES
7.1 ConsumerPriceIndices 66
7.2 ConsumerPriceIndices –NationalConsumerPriceIndex 67
7.3 Producer’sPriceIndex 67
7.4 ColomboConsumers’PriceIndex(1952=100) 68
7.5 AverageRetailPricesof SelectedConsumerItems 69
7.6 AverageRetailPricesofSelectedFoodItems byProvinces 71
7.7 AverageProducerPricesofSelectedItems 72
7.8 AverageProducerPricesof SelectedFoodItemsbyProvinces 73
7.9 RetailPricesofSelectedFoodItems inSelectedDistricts–2016 74
7.10 RetailPricesofSelectedFoodItemsinSelectedDistricts–2017 75
7.11 NominalWageRateIndices1965–2017 76
7.12 AverageDailyWageRates inSelectedActivities 77
7.13 MinimumWageRateIndicesofWorkers inWagesBoardTrades 78
7.14 WageRateIndices ofGovernmentEmployees 79
7.15 WageRateIndicesofInformalPrivateSectorEmployees 80
7.16 AllIslandAverageWagesintheInformalSector –2016 80
CONTENTS
(Continued)
7.17 AllIslandAverageWagesintheInformalSector –2017 81
7.18 CostIndicesforConstruction 82
8 EXTERNAL TRADE AND FINANCE
8.1 SummaryofExternalTrade 83
8.2 SelectedExports 84
8.3 SelectedImports 84
8.4 ImportsbyMajorCategories 85
8.5 DirectionofTrade–Exports 86
8.6 DirectionofTrade–Imports 87
8.7 CentralBankTradeIndices–Value 88
8.8 CentralBankTradeIndices–Volume 88
8.9 CentralBankTradeIndices–UnitValue 89
8.10 ExchangeRates–YearEnd 89
8.11 BalanceofPayments 90
8.12 Workers’Remittances 93
8.13 Tourism 94
8.14 ExternalDebtandDebtServicePayments 95
9 MONEY AND CAPITAL MARKETS
9.1 ReserveMoney 96
9.2 MoneySupply 97
9.3 BroadMoneySupply(M2b) 98
9.4 InterestRates 99
9.5 GovernmentDebtSecuritiesMarket 100
9.6 ShareMarketIndicators 101
9.7 ShareTradingIndicators byBusinessSector 102
9.8 ShareTradingIndicators byMajorCompanies 106
9.9 ShareIssues 108
10 GOVERNMENT FINANCE
10.1 SummaryofFiscalOperations 109
10.2 FunctionalClassification ofRecurrentExpenditure 110
10.3 FunctionalClassification ofCapitalExpenditureandLending 110
10.4 GovernmentRevenue 111
10.5 CentralGovernmentDomesticDebt 112
10.6 CentralGovernmentForeignDebt 113
10.7 RevenueandExpenditure ofProvincialCouncils 114

v
11 BANKING AND FINANCIAL INSTITUTIONS
11.1 AssetsandLiabilitiesoftheCentralBank 115
11.2 SelectedFinancialHighlights ofCommercialBanks 116
11.3 AssetsandLiabilitiesofCommercialBanks 117
11.4 MobilizationofDepositsbyTypeofDeposit 118
11.5 DepositsofCommercialBanksbyOwnership 118
11.6 CommercialBanks’LoansandAdvances tothePrivateSector 119
11.7 NumberofBankBranchesbyProvince 120
11.8 BankBranchesandBankingDensitybyDistrict 121
11.9 BankBranchNetwork 122
11.10 Non-BankFinancialInstitutions 123
11.11 UnitTrusts 124
11.12 SummaryofCo-operativeRuralBanks andCreditSocieties 124
12 TRANSPORTATION
12.1 RoadNetwork 125
12.2 RoadKilometeragebyProvince andDistrict–2017 125
12.3 RoadKilometeragebyProvince 126
12.4 MotorVehiclesbyProvince 127
12.5 NewRegistrationofMotorVehicles 128
12.6 SLTB/RegionalBusCompanies 128
12.7 SriLankaRailways 129
12.8 Aviation–SriLankanAirlines 130
12.9 PortServices 130
12.10 SelectedPublicTransportIndicators byProvince 131
13 SOCIO – ECONOMIC SERVICES
13.1 NationalLevelFindingsofthe HouseholdIncomeandExpenditureSurvey(HIES) bySurveyPeriod–SriLanka 132
13.2 AverageMonthlyHouseholdExpenditureonSelectedFood/Non-FoodItems byHIESSurveyPeriod–SriLanka 133
13.3 PovertyIndicatorsbySector,Province andDistrict 134
13.4 DailyAverageDietaryEnergyConsumption perPersonbyPovertyStatus,Sector,Province andDistrict–2012/13and2016 135
13.5 HousingConditionsandOwnershipofDurableGoods–2009/10,2012/13and2016 136
13.6 KeySocio-EconomicIndicators –2009/10,2012/13and2016 139
13.7 GeneralEducation 142
CONTENTS
(Continued)
13.8 GovernmentSchoolTeachersandPupils byProvinceandDistrict 143
13.9 GovernmentSchools bySizeofStudentPopulation 144
13.10 GovernmentSchoolTeachers byCategoryofAppointment 146
13.11 NewAdmissionsinGovernmentSchools 148
13.12 GovernmentSchools byType,PupilsandTeachers 149
13.13 PerformanceofCandidates –GCE(O/L)andGCE(A/L) 149
13.14 GCE(O/L)Examination –PerformanceofSchoolCandidates 150
13.15 GCE(A/L)Examination –PerformanceofSchoolCandidates 150
13.16 UniversityEducation 151
13.17 Eligibility,AdmissionandEnrollment ofStudentsforUniversityEducation 152
13.18 UniversityAdmissionbyProvinceandDistrict 153
13.19 UniversityAdmission byAcademicStreamandDistrict 154
13.20 UniversityAdmission byAcademicStreamandEthnicity 156
13.21 TechnicalColleges 157
13.22 HealthServices 158
13.23 SelectedPublicHealthPersonnel 159
13.24 PublicHealthPersonnelbyDistrict–2016 160
13.25 ActivitiesofHealthCampaigns 161
13.26 PostalServices 162
13.27 TelecommunicationServices 163
13.28 MassMedia 163
13.29 Prisoners 164
13.30 PrisonersbyDistrict 165
13.31 SelectedDemographyofPrisoners 166
14 SRI LANKA AND ASIA
14.1 DemographicIndicators: SAARCCountries 167
14.2 DemographicIndicators: SelectedEastAsianCountries 167
14.3 NationalAccountsIndicators: SAARCCountries 168
14.4 NationalAccountsIndicators: SelectedEastAsianCountries 169
14.5 Inflation:SriLankaandSelectedCountries 170
14.6 ExternalTradeandFinanceIndicators: SAARCCountries 171
14.7 ExternalTradeandFinanceIndicators: SelectedEastAsianCountries 172

vi
14.8 MonetaryandFiscalOperations: SAARCCountries 173
14.9 MonetaryandFiscalOperations: SelectedEastAsianCountries 174
14.10 SocialIndicators: SAARCCountries 175
14.11 SocialIndicators: SelectedEastAsianCountries 175
14.12 DoingBusinessRanking–2018: SAARCCountries 176
14.13 DoingBusinessRanking–2018: SelectedEastAsianCountries 176
CONTENTS
15 WORLD TABLES
15.1 WorldTeaProduction –LandArea,ExportsandImports 177
15.2 GrowthofRealGDP 179
15.3 ConsumerPriceChanges 180
15.4 Exports 181
15.5 Imports 182
15.6 HumanDevelopmentIndex(HDI) andSubIndicesofHDI–2015 183
15.7 HumanDevelopmentIndex 184

KEY SOCIO-ECONOMIC INDICATORS1
Sri Lanka – Country Profile
ECONOMYREAL SECTOR
GDP at Market Prices(d) Rs Bn. US$ Bn.2015(e) 10,951 80.62016(b)(e) 11,907 81.82017(b)(e) 13,317 87.4
Per Capita GDP(d) Rs. US$2015(e) 522,304 3,8422016(b)(e) 561,560 3,8572017(b)(e) 621,026 4,073
Growth of GDP (in Real Terms)(d) %2015(e) 5.02016(b)(e) 4.52017(b)(e) 3.3
Sectoral Composition of GDP(d), %
Agri- Indus- Servi- Taxesless culture try ces Subsidies onProducts2015(e) 7.7 26.2 56.6 9.42016(b)(e) 7.1 26.6 56.7 9.62017(b)(e) 6.8 26.9 56.7 9.6
Unemployment(a), % of Labour Force2015 4.72016 4.42017 4.2
Inflation : Change of CCPI(f)
(Annual Avg.) %2015 2.22016 4.02017 6.6
MONETARY SECTOR
Reserve Money Rs.Bn. Growth %2015 673.4 16.52016 856.1 27.12017(b) 939.8 9.8
Narrow Money (M1) Rs.Bn. Growth %2015 715.0 16.82016 776.6 8.62017(b) 793.3 2.1
Broad Money (M2) Rs.Bn. Growth %2015 4,057.2 17.22016 4,823.6 18.92017(b) 5,665.3 17.5
Broad Money (M2b) Rs.Bn. Growth %2015 4,565.9 17.82016 5,405.6 18.42017(b) 6,308.1 16.7
2015 2016 2017(b)
Exports(Goods,Services) Rs.Bn. 2,301 2,540 2,915 US$Mn. 16,943 17,448 19,120
Imports(Goods,Services) Rs.Bn. 3,126 3,414 3,873 US$Mn. 23,006 23,442 25,401
ExternalAssets(g) Rs.Bn. 1,345 1,263 1,595 US$Mn. 9,337 8,433 10,436
ExternalDebt Rs.Bn. 6,460 6,899 7,922 US$Mn. 44,839 46,418 51,824 %ofGDP 55.7 56.8 59.5
ExchangeRate(Avg.) Rs./US$ 135.94 145.60 152.46 Rs./SDR 190.16 202.39 211.49
RevenueandGrants Rs.Bn. 1,460.9 1,693.6 1,839.6
Expenditure&NetLending Rs.Bn. 2,290.4 2,333,9 2,573.1
BudgetDeficit Rs.Bn. -829.5 -640.3 -733.5 %ofGDP -7.6(h) -5.4(h) -5.5(i)
CentralGovernmentDebt Rs.Bn. 8,503.2 9,387.3 10,313.0 %ofGDP 77.7(h) 78.8(h) 77.4
SOCIAL INDICATORS
Human Development Index (2015) – 0.766(min.0.0,max.1.0)
Life Expectancy, Years (2015) – 75.0(Average)
Literacy Rate(a), % (2016)
Average 93.1
Male 94.1Female 92.2
Sq.km. ’000ha. Mn.acres
Gross 65,610 6,561.0 16.2ExcludingInlandWaters 62,705 6,270.5 15.5
CLIMATE
AREAD
EMO
GRA
PHY
Mid-yearPopulation(b)(c)(’000) 21,203(2016) 21,444(2017)
PopulationGrowth(%) 1.1(2016) 1.1(2017)
ProvinceMid Year
Population(2017) ’000
Land Area(Sq.km.)
Density ofPopulation
Western 6,081 3,593 1,692Central 2,722 5,575 488Southern 2,611 5,383 485Northern 1,119 8,290 135Eastern 1,677 9,361 179NorthWestern 2,508 7,506 334NorthCentral 1,349 9,741 138Uva 1,349 8,335 162Sabaragamuwa 2,028 4,921 412
Total 21,444 62,705 342
Composition of Population (Census of Population and Housing – 2012)
By Religion %Buddhist 70.1Hindu 12.6Islam 9.7Christian&Roman Catholic 7.6Other 0.0
By Age Groups % 0–14 25.215–59 62.460&above 12.4
By Ethnicity %Sinhalese 74.9SriLankanTamil 11.2IndianTamil 4.1SriLankanMoor 9.3Other 0.5
By Sector %Urban 18.2Rural 77.4Estate 4.4
Temperature(2017) LowCountry, min. 24.4ºC max.32.0ºC (75.9)ºF (89.6)ºF
HillCountry, min. 16.6ºC max. 26.1ºC (61.9)ºF (79.0)ºF
AnnualRainfall(Avg.)(2017)–1,757mm
FISC
AL
SEC
TOR
EXTE
RNA
L SE
CTO
R
(a) Based on Quarter ly Labour Force Survey,DepartmentofCensusandStatistics.
(b) Provisional. (c) BasedonCensusofPopulationandHousing–2012.
(g) CalculatedatmarketvalueandincludesAsianClearingUnionreceipts. (h) Based on revisedGDP estimates for 2015 and 2016made available on
20March2018bytheDepartmentofCensusandStatistics. (i) Based on revised GDP estimates for 2017 made available on
18June2018bytheDepartmentofCensusandStatistics.
(d) The data is based on the base year 2010 GDPestimatesoftheDepartmentofCensusandStatistics.
(e) Revised (f) BasedonCCPI(2013=100)
KEY SOCIO-ECONOMIC INDICATORS2
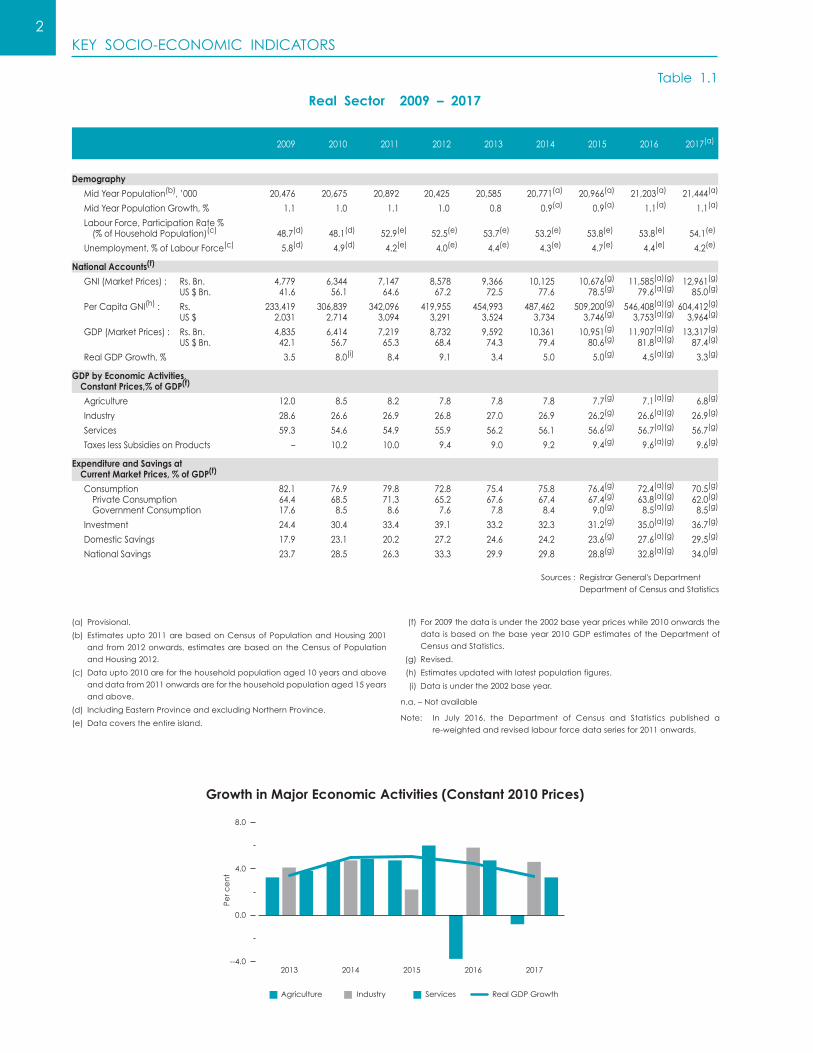
Real Sector 2009 – 2017
Table 1.1
2009 2010 2011 2012 2013 2014 2015 2016 2017(a)
20,476 20,675 20,892 20,425 20,585 20,771(a) 20,966(a) 21,203(a) 21,444(a)
1.1 1.0 1.1 1.0 0.8 0.9(a) 0.9(a) 1.1(a) 1.1(a)
48.7(d) 48.1(d) 52.9(e) 52.5(e) 53.7(e) 53.2(e) 53.8(e) 53.8(e) 54.1(e)
5.8(d) 4.9(d) 4.2(e) 4.0(e) 4.4(e) 4.3(e) 4.7(e) 4.4(e) 4.2(e)
4,779 6,344 7,147 8,578 9,366 10,125 10,676(g) 11,585(a)(g) 12,961(g)
41.6 56.1 64.6 67.2 72.5 77.6 78.5(g) 79.6(a)(g) 85.0(g)
233,419 306,839 342,096 419,955 454,993 487,462 509,200(g) 546,408(a)(g) 604,412(g)
2,031 2,714 3,094 3,291 3,524 3,734 3,746(g) 3,753(a)(g) 3,964(g)
4,835 6,414 7,219 8,732 9,592 10,361 10,951(g) 11,907(a)(g) 13,317(g)
42.1 56.7 65.3 68.4 74.3 79.4 80.6(g) 81.8(a)(g) 87.4(g)
3.5 8.0(i) 8.4 9.1 3.4 5.0 5.0(g) 4.5(a)(g) 3.3(g)
12.0 8.5 8.2 7.8 7.8 7.8 7.7(g) 7.1(a)(g) 6.8(g)
28.6 26.6 26.9 26.8 27.0 26.9 26.2(g) 26.6(a)(g) 26.9(g)
59.3 54.6 54.9 55.9 56.2 56.1 56.6(g) 56.7(a)(g) 56.7(g)
– 10.2 10.0 9.4 9.0 9.2 9.4(g) 9.6(a)(g) 9.6(g)
82.1 76.9 79.8 72.8 75.4 75.8 76.4(g) 72.4(a)(g) 70.5(g)
64.4 68.5 71.3 65.2 67.6 67.4 67.4(g) 63.8(a)(g) 62.0(g)
17.6 8.5 8.6 7.6 7.8 8.4 9.0(g) 8.5(a)(g) 8.5(g)
24.4 30.4 33.4 39.1 33.2 32.3 31.2(g) 35.0(a)(g) 36.7(g)
17.9 23.1 20.2 27.2 24.6 24.2 23.6(g) 27.6(a)(g) 29.5(g)
23.7 28.5 26.3 33.3 29.9 29.8 28.8(g) 32.8(a)(g) 34.0(g)
Demography
MidYearPopulation(b),’000
MidYearPopulationGrowth,%
LabourForce,ParticipationRate% (%ofHouseholdPopulation)(c)
Unemployment,%ofLabourForce(c)
National Accounts(f)
GNI(MarketPrices): Rs.Bn. US$Bn.
PerCapitaGNI(h): Rs. US$
GDP(MarketPrices): Rs.Bn. US$Bn.
RealGDPGrowth,%
GDP by Economic Activities, Constant Prices,% of GDP(f)
Agriculture
Industry
Services
TaxeslessSubsidiesonProducts
Expenditure and Savings at Current Market Prices, % of GDP(f)
Consumption PrivateConsumption GovernmentConsumption
Investment
DomesticSavings
NationalSavings
(a) Provisional.
(b) Estimatesupto2011arebasedonCensusofPopulationandHousing2001
andfrom2012onwards,estimatesarebasedontheCensusofPopulation
andHousing2012.
(c) Dataupto2010areforthehouseholdpopulationaged10yearsandabove
anddatafrom2011onwardsareforthehouseholdpopulationaged15years
andabove.
(d) IncludingEasternProvinceandexcludingNorthernProvince.
(e) Datacoverstheentireisland.
(f) For2009thedataisunderthe2002baseyearpriceswhile2010onwardsthe
data isbasedonthebaseyear2010GDPestimatesof theDepartmentof
CensusandStatistics.
(g) Revised.
(h) Estimatesupdatedwithlatestpopulationfigures.
(i) Dataisunderthe2002baseyear.
n.a.–Notavailable
Note: In July 2016, the Department of Census and Statistics published a
re-weightedandrevisedlabourforcedataseriesfor2011onwards.
Sources : RegistrarGeneral'sDepartment
DepartmentofCensusandStatistics
Growth in Major Economic Activities (Constant 2010 Prices)
Per c
en
t
--4.0
0.0
4.0
8.0
2017 2013 2014 2015 2016
Agriculture Industry Services Real GDP Growth

KEY SOCIO-ECONOMIC INDICATORS3
Agriculture and Industry
Table 1.2
2009 2010 2011 2012 2013 2014 2015 2016 2017(a)
3,652 4,301 3,894 3,846 4,621 3,381 4,819 4,420 2,383 175 206 187 184 221 162 231 212 114
291 331 328 328 340 338 329 293 308
137 153 158 152 130 99 89 79 83
2,853 2,584 2,808 2,940 2,513 2,870 3,056 3,011 2,450
210.1 260.6 279.5 297.7 333.9 364.8 337.0 338.7 422.0
136.2 162.8 164.9 180.4 199.4 212.6 182.1 184.8 233.3 11.3 19.6 22.8 15.7 9.2 5.9 3.5 4.8 5.9 18.6 18.7 29.4 26.6 26.5 46.5 47.7 53.3 53.0 43.9 59.5 62.4 75.0 98.8 99.7 103.7 95.9 129.7
86.6 100.0 107.2 108.8 108.3 114.9 125.4 122.0 n.a.
600.6 688.8 883.8 938.8 1,001.8 1,078.7 1,087.9 1,155.7 1,302.6
374.6 379.2 463.5 508.6 583.0 643.7 654.8 710.8 767.3 15.4 29.8 61.2 58.9 55.1 44.1 50.5 41.8 66.3 210.5 279.8 359.1 371.3 363.6 390.9 382.7 403.1 469.0
1,828 1,589 1,814 1,432 1,526 1,640 1,581 1,624 1,540
179 158 206 152 144 152 154 166 165 485 442 501 411 390 496 510 583 506 83 93 93 75 57 65 75 104 60 781 686 779 648 724 641 552 479 431 195 126 155 93 125 168 155 148 236 105 84 80 71 87 117 135 144 142
774.2 861.1 1,032.6 1,280.8 1,512.0 1,755.7 1,991.8 2,179.8 2,571.4 478 426 451 476 483 485 n.a. n.a. n.a.
Principal Agricultural Production
Paddy,M.T.’000 Bushels,Mn.
Tea,Mn.Kgs.
Rubber,Mn.Kgs.
Coconut,Mn.Nuts
Agricultural Exports, Rs. Bn.
TeaRubberCoconutOtherAgriculturalCrops
FactoryIndustryProductionIndex(b) (2010=100)
Industrial Exports, Rs. Bn.
Textiles&GarmentsPetroleumProductsOtherIndustrialProducts
Petroleum Local Refined Products, MT ’000
PetrolAutoDieselKeroseneFurnaceOilAviationFuelNaphtha
BOI Enterprises Investments,Rs.Bn.Employment,’000
Sources : DepartmentofCensusandStatistics
SriLankaCustoms
CeylonPetroleumCorporationand
otherExportersofPetroleum
NationalGemandJewelleryAuthority
CentralBankofSriLanka
(a) Provisional
(b) FIPIbasedonISICRevision4classification.
n.a.–Notavailable
Note: IndustrialProductionIndex(IPI)hasbeenrenamedas
theFactoryIndustryProductionIndex(FIPI)in2013.
Plantation Sector Production
Mill
ion
kg
s.
Mill
ion
Nu
ts
2,000
2,250
2,500
2,750
3,000
3,250
0
100
200
300
400
2017 2009 2010 2011 2012 2013 2014 2015 2016
Tea Rubber Coconut (Right)
KEY SOCIO-ECONOMIC INDICATORS4
Price and Wages
Infrastructure
Table 1.3
Table 1.4
2009 2010 2011 2012 2013 2014 2015 2016 2017(a)
2009 2010 2011 2012 2013 2014 2015 2016 2017(a)
206.8 219.1 – – – – – – – 3.4 5.9 – – – – – – – 133.6 141.9 151.5 162.9 174.2 179.9 181.5 188.3 – 3.5 6.2 6.7 7.6 6.9 3.3 0.9 3.7 – – – – – – 105.1 107.4 111.7 119.0 – – – – – – 2.2 4.0 6.6 – – – – – 105.5 109.5 113.8 122.6 – – – – – – 3.8 4.0 7.7 – – – – – 101.6 105.3 107.1 125.3 – – – – – – 3.6 1.7 17.0 315.8 338.9 351.8 389.9 414.3 426.3 429.1(f) 446.6(a)(f) 483.5(f) 5.9 7.3 3.8 10.8 6.2 2.9 0.6(f) 4.1(a)(f) 8.3(f)
456.3 465.9 490.9 550.9 590.4 604.9 621.3 643.4 677.0 2.6 2.1 5.4 12.2 7.2 2.5 2.7 3.6 5.2
– – – – 106.3 117.5 154.8 160.8 160.8 – – – – – 10.5 31.7 3.9 0.0 2,171.4 2,865.3 2,996.1 3,662.0 3,869.2 4,012.2 4,127.1 4,127.9 4,128.6 4.9 32.0 4.6 22.2 5.7 3.7 2.9 0.0 0.0 – – – – 109.8 118.1 126.7 136.7 149.7 – – – – – 7.6 7.3 7.9 9.5
2,684 2,817 3,148 3,312 3,362 3,932 3,847 4,018 4,138 9,882 10,714 11,528 11,801 11,898 12,357 13,090 14,149 14,671
872,120 896,710 941,780 999,354 1,062,065 1,123,126 1,128,291 1,166,348 1,198,48314,264,442 17,267,407 18,319,447 20,324,070 20,315,150(b)22,123,000 24,384,544 26,227,631 28,199,083 2,563,838 2,637,865 2,666,612 2,450,037(c) 1,644,722(b) 1,586,722 1,472,905 1,384,084 1,404,695
7,378 6,958 6,458 6,983 6,773 6,642 5,809 5,301 5,137
866 1007 1,051 1,164 1,119 1,196 1,287 1,357 1,436
240,000 502,000 844,749 1,365,655 2,009,456 3,396,295 4,090,920 4,920,554 5,904,260
4,114 3,910 4,124 3,870 3,667 3,742 4,197 4,405 4,329 27,214 34,307 36,642 36,721 37,453 41,540 43,271 47,982 51,955 19,159 24,461 25,373 24,949 26,029 29,254 30,447 33,896 37,079 3,464 4,137 4,263 4,187 4,306 4,908 5,185 5,735 6,209
11,923 12,019 12,019 12,165 12,169 12,208 12,210 12,210 12,210
204,075 359,243 525,421 397,295 326,651 429,556 668,907 493,328 451,653
4,482 4,441 4,365 4,314 4,373 4,226 5,284 5,314 5,266 11,233 11,815 11,907 11,909 12,201 12,717 15,210 16,101 15,810
18,665 19,805 19,699 20,444 19,651 20,421 19,397 19,614 19,998
4,568 4,353 4,574 5,039 6,257 6,842 7,407 7,413 7,495 113 163 154 142 133 130 130 140 145
2,255 2,808 3,010 4,164 4,019 4,169 4,314 4,476 5,355 69 83 90 98 100 96 103 113 124
Price Indices – Twelve Month Average ColomboConsumers’PriceIndex(2002=100)(b) Change(%) ColomboConsumerPriceIndex(2006/07=100)(c)(d) Change(%) ColomboConsumerPriceIndex(2013=100)(e) Change(%) NationalConsumerPriceIndex(2013=100) Change(%) Producer’sPriceIndex(2013Quarter4=100) Change(%) ImplicitGDPDeflator(1996=100) Change(%) ConstructionCostIndex(1990=100) Change(%)
Wage Rate Indices – Twelve Month Average CentralGovt.Employees(2012=100) Change(%) WorkersinWagesBoardTrades(1978Dec.=100) Change(%) InformalPrivateSectorEmployees(2012=100) Change(%)
(a) Provisional(b) DiscontinuedfromJune2011.(c) TherebasedCCPI(2006/07=100)has replacedCCPI(2002=100)fromJune2011.
Sources :DepartmentofCensusandStatistics ConstructionIndustryDevelopmentAuthority CentralBankofSriLanka
Electricity
AvailableCapacity,MW Generation,GWh
Telecommunication
Telephones– WirelineTelephones CellularPhones WirelessLocalLoop
PublicPayPhones(No.ofBooths)
TelephoneDensity(Telephonesper1,000 persons,includingcellularphones)
InternetConnections(d)
Port Services (Colombo)
VesselsArrived CargoDischarged,MT’000 CargoLoaded,MT’000 ContainerThroughput,TEU’000
Transportation
RoadKilometerage(A&BClass)
NewRegistrationofMotorVehicles,No.
SLTB/RegionalBusCompanies BusesOperated(DailyAverage) PassengerKilometers,Mn.
PrivateOperatorBuses
SriLankaRailways PassengerKilometers,Mn. FreightTonKilometers,Mn.
SriLankanAirLines Passengers,’000 Freight,MT’000
(a) Provisional(b) WirelessLocalLooptelephonesandCellularphonesdeclinedin2013dueto
arevisionintheclassificationofactivesubscribersinJanuary2013.
(c) WirelessLocalLooptelephonesdeclinedin2012duetherectificationofstatisticalreportingssubsequenttothemergeroftwocompanies.
(d) Includingmobileinternetconnectionsfrom2010onwards.
(d) DiscontinuedfromJanuary2017.(e) TherebasedCCPI(2013=100)has replacedCCPI(2006/07=100)fromJanuary2017(f) Revised
KEY SOCIO-ECONOMIC INDICATORS5
External Sector
Table 1.5
2009 2010 2011 2012 2013 2014 2015 2016 2017(a)
(Billions of Rupees)
-358.7 -545.3 -1,073.9 -1,196.3 -979.1 -1,082.0 -1,141.0 -1,293.6(b) -1,466.1 44.8 79.8 121.6 160.8 152.5 245.5 316.2 419.3 508.8 -55.8 -69.8 -72.0 -154.9 -226.1 -236.1 -274.7 -319.7 -357.7 345.5 413.9 513.2 688.6 728.7 813.1 842.1 939.8 964.3 -24.2 -121.5 -511.1 -501.9 -324.0 -259.4 -257.5 -254.2 -350.7 315.2 88.0 -105.8 72.6 143.6 180.9 -129.7 -46.0 330.0
(Millions of US Dollars)
-3,122 -4,825 -9,710 -9,417 -7,609 -8,287 -8,388 -8,873(b) -9,619 391 707 1099 1262 1,180 1,880 2,325 2,879 3,338 -488 -617 -647 -1219 -1,751 -1,808 -2,013 -2,202 -2,355 3,005 3,660 4,643 5,392 5,639 6,227 6,193 6,453 6,327 -214 -1,075 -4,615 -3,982 -2,541 -1,988 -1,883 -1,742 -2,309 2,725 921 -1,059 151 985 1,369 -1,489 -500 2,068
(Per cent of GDP)(c)
-7.4 -8.5 -14.9 -13.8 -10.2 -10.4 -10.4 -10.9(b) -11.0 7.1 6.5 7.1 7.9 7.6 7.8 7.7 7.9 7.3 -0.5 -1.9 -7.1 -5.8 -3.4 -2.5 -2.3 -2.1 -2.6
78.3 100.0 90.9 89.6 93.8 97.6 100.2 104.2(b) 105.6
804.2 956.5 910.0 1,091.8 1,121.0 1,295.3 1,345.1 1,263.3 1,595.3 7,030 8,621 7,991 8,586 8,574 9,884 9,337 8,433 10,436 8.3 7.7 4.7 5.4 5.7 6.1 5.9 5.3 6.0
2,392.2 2,755.0 3,730.0 4,717.3 5,217.7 5,623.8 6,459.7 6,899.3 7,921.5 18,662 21,438 32,748 37,098 39,905 42,914 44,839 46,418 51,824 44.4 37.8 50.2 54.2 53.7 54.1 55.7 56.8 59.5 16.1 11.9 9.3 13.5 18.7 15.2 19.8 18.0 17.2
447.9 654.5 856.0 1,005.6 1,274.6 1,527.2 1,798.4 2,050.8 2,116.4
114.94 113.06 110.57 127.60 129.11 130.56 135.94 145.60 152.46 177.22 172.50 174.54 195.38 196.19 198.35 190.16 202.39 211.49 179.87 174.81 177.23 202.28 202.08 215.16 207.99 197.15 196.47 160.21 150.10 153.86 164.01 171.51 173.47 150.84 161.16 171.73 1.23 1.29 1.39 1.60 1.32 1.24 1.12 1.34 1.36 2.39 2.49 2.39 2.39 2.21 2.14 2.12 2.17 2.34
Balance of Payments
TradeBalance ServicesAccount(net) PrimaryIncomeAccount(net) SecondaryIncomeAccount(net) CurrentAccountBalance OverallBalance
Balance of Payments
TradeBalance ServicesAccount(net) PrimaryIncomeAccount(net) SecondaryIncomeAccount(net) CurrentAccountBalance OverallBalance
Balance of Payments
TradeBalance SecondaryIncomeAccount(net) CurrentAccountBalance
Terms of Trade (2010=100)
Total External Assets
Rs.Bn. US$Mn. InMonthsofImports
External Debt
Rs.Bn. US$Mn. %ofGDP(c)
DebtServiceasa%ofExportsof MerchandiseandServices,Income& CurrentTransfers(d)(e)
Tourist Arrivals, ’000
Exchange Rates (Annual Average)
Rs./USdollar Rs./SDR Rs./Poundsterling Rs./Euro Rs./Yen Rs./Indianrupees
Sources:SriLankaCustoms CentralBankofSriLanka SriLankaTourismDevelopmentAuthority
(a) Provisional
(b) Revised
(c) BasedonGDPatcurrentmarketprices in rupees,aspublishedbytheDepartmentofCensusandStatistics.
(d) Externaldebt servicepaymentswere reclassified from2008onwards tocapturedebtservicingofgovernmentsecurities(i.e.,foreignholdingofTreasuryBonds)inaccordancewiththeExternalDebtStatisticsManual(2003)oftheInternationalMonetaryFund.
(e) BasedonExternaldebtservicepaymentfiguresinUSdollar.
KEY SOCIO-ECONOMIC INDICATORS6
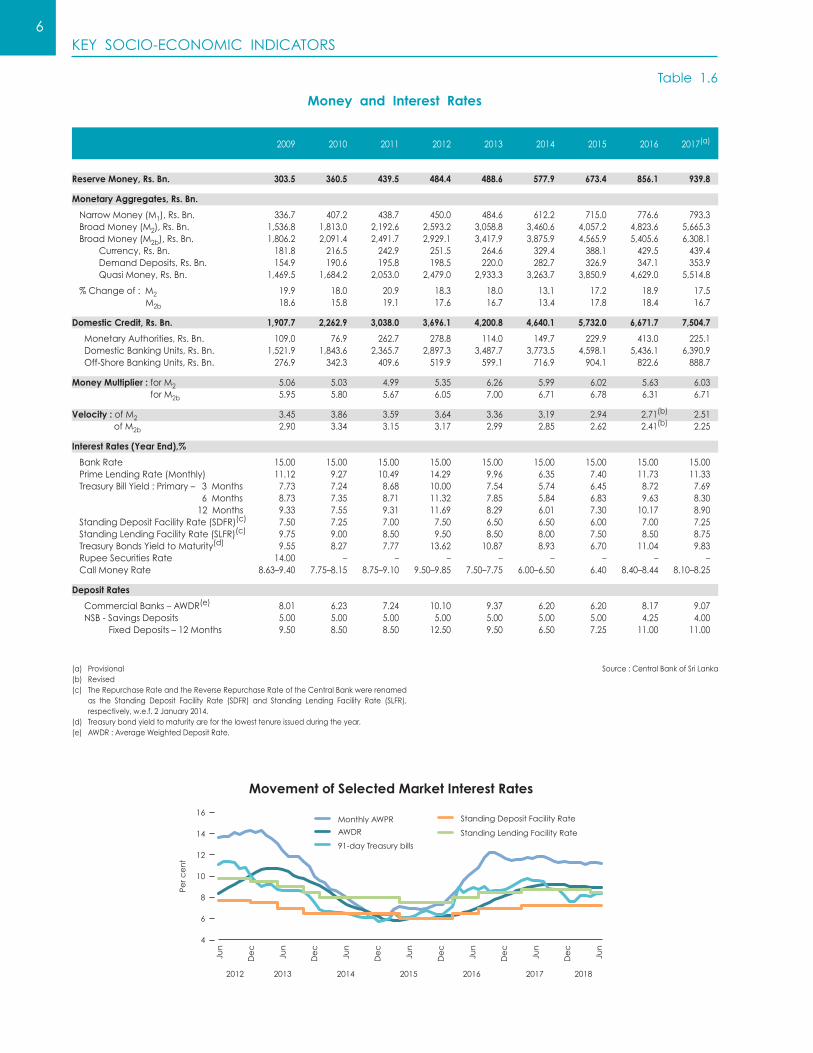
Money and Interest Rates
Table 1.6
2009 2010 2011 2012 2013 2014 2015 2016 2017(a)
303.5 360.5 439.5 484.4 488.6 577.9 673.4 856.1 939.8
336.7 407.2 438.7 450.0 484.6 612.2 715.0 776.6 793.3 1,536.8 1,813.0 2,192.6 2,593.2 3,058.8 3,460.6 4,057.2 4,823.6 5,665.3 1,806.2 2,091.4 2,491.7 2,929.1 3,417.9 3,875.9 4,565.9 5,405.6 6,308.1 181.8 216.5 242.9 251.5 264.6 329.4 388.1 429.5 439.4 154.9 190.6 195.8 198.5 220.0 282.7 326.9 347.1 353.9 1,469.5 1,684.2 2,053.0 2,479.0 2,933.3 3,263.7 3,850.9 4,629.0 5,514.8
19.9 18.0 20.9 18.3 18.0 13.1 17.2 18.9 17.5 18.6 15.8 19.1 17.6 16.7 13.4 17.8 18.4 16.7
1,907.7 2,262.9 3,038.0 3,696.1 4,200.8 4,640.1 5,732.0 6,671.7 7,504.7
109.0 76.9 262.7 278.8 114.0 149.7 229.9 413.0 225.1 1,521.9 1,843.6 2,365.7 2,897.3 3,487.7 3,773.5 4,598.1 5,436.1 6,390.9 276.9 342.3 409.6 519.9 599.1 716.9 904.1 822.6 888.7
5.06 5.03 4.99 5.35 6.26 5.99 6.02 5.63 6.03 5.95 5.80 5.67 6.05 7.00 6.71 6.78 6.31 6.71
3.45 3.86 3.59 3.64 3.36 3.19 2.94 2.71(b) 2.51 2.90 3.34 3.15 3.17 2.99 2.85 2.62 2.41(b) 2.25
15.00 15.00 15.00 15.00 15.00 15.00 15.00 15.00 15.00 11.12 9.27 10.49 14.29 9.96 6.35 7.40 11.73 11.33 7.73 7.24 8.68 10.00 7.54 5.74 6.45 8.72 7.69 8.73 7.35 8.71 11.32 7.85 5.84 6.83 9.63 8.30 9.33 7.55 9.31 11.69 8.29 6.01 7.30 10.17 8.90 7.50 7.25 7.00 7.50 6.50 6.50 6.00 7.00 7.25 9.75 9.00 8.50 9.50 8.50 8.00 7.50 8.50 8.75 9.55 8.27 7.77 13.62 10.87 8.93 6.70 11.04 9.83 14.00 – – – – – – – – 8.63–9.40 7.75–8.15 8.75–9.10 9.50–9.85 7.50–7.75 6.00–6.50 6.40 8.40–8.44 8.10–8.25
8.01 6.23 7.24 10.10 9.37 6.20 6.20 8.17 9.07 5.00 5.00 5.00 5.00 5.00 5.00 5.00 4.25 4.00 9.50 8.50 8.50 12.50 9.50 6.50 7.25 11.00 11.00
Reserve Money, Rs. Bn.
Monetary Aggregates, Rs. Bn.
NarrowMoney(M1),Rs.Bn.BroadMoney(M2),Rs.Bn.BroadMoney(M2b),Rs.Bn.Currency,Rs.Bn.DemandDeposits,Rs.Bn.QuasiMoney,Rs.Bn.
%Changeof:M2M2b
Domestic Credit, Rs. Bn.
MonetaryAuthorities,Rs.Bn.DomesticBankingUnits,Rs.Bn.Off-ShoreBankingUnits,Rs.Bn.
Money Multiplier : forM2forM2b
Velocity : ofM2 ofM2b
Interest Rates (Year End),%
BankRatePrimeLendingRate(Monthly)TreasuryBillYield:Primary– 3MonthsTreasuryBillYield:Primary– 6MonthsTreasuryBillYield:Primary– 12MonthsStandingDepositFacilityRate(SDFR)(c)
StandingLendingFacilityRate(SLFR)(c)
TreasuryBondsYieldtoMaturity(d)
RupeeSecuritiesRateCallMoneyRate
Deposit Rates
CommercialBanks–AWDR(e)
NSB-SavingsDepositsFixedDeposits–12Months
(a) Provisional(b) Revised(c) TheRepurchaseRateandtheReverseRepurchaseRateoftheCentralBankwererenamed
as the Standing Deposit Facility Rate (SDFR) and Standing Lending Facility Rate (SLFR),respectively,w.e.f.2January2014.
(d) Treasurybondyieldtomaturityareforthelowesttenureissuedduringtheyear.(e) AWDR:AverageWeightedDepositRate.
Source:CentralBankofSriLanka
Movement of Selected Market Interest Rates
14
16
12
10
8
6
2012 2013 2014 2015 20172016 2018
4
Jun
Jun
Jun
De
c
De
c
De
c
Jun
De
c
Jun
De
c
Jun
De
c
Jun
Monthly AWPR
AWDR
91-day Treasury bills
Standing Deposit Facility Rate
Standing Lending Facility Rate
Per c
en
t

KEY SOCIO-ECONOMIC INDICATORS7
Money and Capital Markets
Table 1.7
2009 2010 2011 2012 2013 2014 2015 2016 2017(a)
Call Money, Rs. Bn.
Treasury Bills, Rs. Bn. PrimaryMarketIssues Outstanding(YearEnd)(b)
Central Bank Secondary Market Rs. Bn. Repurchases(Repo) ReverseRepurchases(ReverseRepo) Other– Sales(c)
Purchases(c)
CentralBankT-BillHoldings (NetofRepoBookValue)(d)
OutstandingCBSLSecurities(e)
StandingDepositFacility(f)
StandingLendingFacility(f)
Issuing of CBSL Securities CBSLSecurities–Overnight CBSLSecurities–Term
Treasury Bonds, Rs. Bn. PrimaryMarketIssues Outstanding(YearEnd)(b)(g)
Foreign Exchange SWAP Transactions Buy–Sell US$Mn.(h)
Rs.Bn.
Sell–Buy US$Mn.(h)
Rs.Bn.
Foreign Exchange SWAP Outstanding FXSWAP US$Mn. Rs.Bn.
Rupee Securities, Rs. Bn. PrimaryMarketIssues Outstanding(YearEnd)
Commercial Papers, Rs. Bn. Issued Outstanding
Share Market No.ofListedCompanies TradingTurnover,Rs.Bn. Non-NationalTransactions(Net),Rs.Bn. MarketCapitalisation,Rs.Bn. AllSharePriceIndex(1985=100) MilankaPriceIndex(1998=1,000) S&PSriLanka20Index(2004=1,000)(i)
MarketPriceEarningsRatio MarketDividendYield,%
2,040.2 996.1 2433.8 3,179.1 2,079.2 2,198.4 2,827.9 3,493.4 3,900.4
821.2 1,000.1 1,164.6 1,650.0 1,235.3 1,121.7 1,589.5 1,635.4 1,624.3 481.4 571.8 661.0 709.3 774.1 750.3 663.3 792.4 724.7
1,715.3 10,722.8 14,489.8 2,721.9 5,677.4 3,457.5 750.2 251.9 3,327.7 851.9 0.0 141.0 797.9 187.4 4.0 44.4 3937.7 1,049.6 70.2 13.3 – 18.4 128.8 – 127.9 39.6 110.3 – – – – – – – 15.77 –
36.0 2.3 167.3 163.3 13.3 3.1 79.1 330.1 25.6 78.6 95.1 – – – – – – – – – – – – 5,181.6 17,989.8 5,572.7 3,954.9 – – – – – 9.8 23.1 3,208.3 2,129.5
1,611.8 313.9 – – – – – – – 169.3 1,153.1 – – – – – – –
701.4 508.6 603.0 847.9 1,017.1 860.7 869.9 663.6 548.8 1,658.6 1,827.4 2,018.8 2,412.7 2,855.8 3,245.8 3,699.9 4,053.6 4,187.5
– – 333 2,217.0 3,422.0 4,636.2 6,974.4 6,123.0 2,838.5 – – 37.7 275.5 442.1 605.4 952.6 891.7 431.4
502.0 2,147.2 98.0 0.0 0.0 0.0 – 0.0 0.0 57.5 243.3 10.9 0.0 0.0 0.0 – 0.0 0.0
245.0 97.0 303.0 1,368.0 2,338.0 2,195.9 2,134.8 2,498.7 1,495.2 28.0 10.8 34.4 177.9 312.2 291.0 300.1 291.4 235.9
1.9 – – – – – – – – 112.3 87.7 62.0 58.4 55.5 55.5 24.1 24.1 24.1
21.5 12.3 13.5 36.9 28.3 8.2 7.9 7.0 6.5 5.8 4.3 8.1 10.6 7.4 3.5 4.5 2.2 1.7
231 241 272 287 289 294 294 295 296 142.5 570.3 546.3 213.8 200.5 340.9 253.3 176.9 220.6 -0.8 -26.3 -19.0 38.7 22.8 21.2 -5.4 0.3 17.7 1,092.1 2,210.5 2,213.9 2,167.6 2,459.9 3,104.9 2,938.0 2,745.4 2,899.3 3,385.6 6,635.9 6,074.4 5,643.0 5,912.8 7,299.0 6,894.5 6,228.3 6,369.3 3,849.4 7,061.5 5,229.2 5,119.1 – – – – – – – – 3,085.3 3,263.9 4,089.1 3,625.7 3,496.4 3,671.7 16.6 25.2 15.8 15.9 15.9 19.7 18.0 12.4 10.6 3.0 1.2 1.8 2.4 2.9 2.1 2.2 2.8 3.2
(a) Provisional
(b) IncludesforeignholdingsofTreasurybillsandTreasurybonds.
(c) FiguressinceMarch2003refertotheoutrightsalesandpurchasesofTreasurybills.
(d) Asat31stDecember.
(e) IncludeCBSLsecuritiesissuedonanovernightbasis&termbasis.
(f) Implementedfrom2ndJanuary2014.
(g) IncludesGovernmentTreasurybondsofRs.4,397millionissuedtoCWEinNovember2003
(maturedin14November2016),Rs.78,441millionissuedtoCPCinJanuary2012(ofwhich
Rs.21,779millionmatured in01January2017and thecurrentoutstanding isRs.56,662
million)andRs.13,125millionissuedtocapitalizeSriLankaAirlinesinMarch2013.
(h) Includenewandroll-overSWAPtransactions.
(i) TheS&PSriLanka20Index(S&PSL20)wasintroducedinJune2012.

KEY SOCIO-ECONOMIC INDICATORS8
Government Finance
Financial Institutions
Table 1.8
Table 1.9
2009 2010 2011 2012 2013 2014 2015 2016 2017(a)
2009 2010 2011 2012 2013 2014(a) 2015 2016 2017(b)
(Billions of Rupees)
725.6 834.2 983.0 1,067.5 1,153.3 1,204.6 1,460.9 1,693.6 1,839.6 699.6 817.3 967.9 1,051.5 1,137.4 1,195.2 1,454.9 1,686.1 1,831.5 25.9 16.9 15.1 16.1 15.9 9.4 6.0 7.5 8.0 1,201.9 1,280.2 1,433.2 1,556.5 1,669.4 1,795.9 2,290.4 2,333.9 2,573.1 879.6 937.1 1,024.9 1,131.0 1,205.2 1,322.9 1,701.7 1,757.8 1,927.7 322.4 343.1 408.3 425.5 464.2 473.0 588.7 576.1 645.4 -179.9 -119.8 -57.0 -79.6 -67.7 -127.7 -246.8 -71.7 -96.2 -476.4 -446.0 -450.2 -489.0 -516.1 -591.2 -829.5 -640.3 -733.5 476.4 446.0 450.2 489.0 516.1 591.2 829.5 640.3 733.5 230.8 243.8 219.0 286.5 123.7 212.5 236.8 391.9 439.2 245.6 202.2 231.2 202.5 392.4 378.7 592.7 248.4 294.3 – – – – – – – – – 4,161.4 4,590.2 5,133.4 6,000.1 6,793.2 7,390.9 8,503.2 9,387.3 10,313.0
(As a Per cent of GDP)
15.0 13.0 13.6 12.2 12.0 11.6 13.3 14.2 13.8(b)
14.5 12.7 13.4 12.0 11.9 11.5 13.3 14.2 13.8(b)
0.5 0.3 0.2 0.2 0.2 0.1 0.1 0.1 0.1(b)
24.9 20.0 19.9 17.8 17.4 17.3 20.9 19.6 19.3(b)
18.2 14.6 14.2 13.0 12.6 12.8 15.5 14.8 14.5(b)
6.7 5.3 5.7 4.9 4.8 4.6 5.4 4.8 4.8(b)
-3.7 -1.9 -0.8 -0.9 -0.7 -1.2 -2.3 -0.6 -0.7(b)
-9.9 -7.0 -6.2 -5.6 -5.4 -5.7 -7.6 -5.4 -5.5(b)
86.2 71.6 71.1 68.7 70.8 71.3 77.7 78.8 77.4(b)
49.7 40.0 38.8 37.0 40.0 41.3 45.3 44.9 42.0(b)
36.5 31.6 32.3 31.7 30.9 30.0 32.4 34.0 35.4(b)
17.1 12.8 12.4 11.7 12.1 10.4 12.0 11.4 12.0(b)
6.4 5.5 4.9 4.7 4.8 4.3 4.7 5.1 5.5(b)
Revenue and Grants Revenue GrantsTotal Expenditure and Net Lending RecurrentExpenditure CapitalExpenditureandNetLendingCurrent Account Surplus (+) / Deficit (-)Overall Budget Surplus (+) / Deficit (-)Total Financing Foreign Domestic PrivatizationProceedsOutstanding Central Government Debt
Revenue and Grants Revenue GrantsExpenditure and Net Lending RecurrentExpenditure CapitalExpenditureandNetLendingCurrent Account Surplus (+) / Deficit (-)Overall Budget Surplus (+) / Deficit (-)Outstanding Central Government Debt DomesticDebt ForeignDebtDebt Service Payments InterestPayments
(a) Provisional(b) BasedonrevisedGDPestimatesmadeavailableon 18June2018bytheDepartmentofCensusandStatistics.
Central Bank Assets,Rs.Bn. InternationalReserves CredittoGovernment CredittoFinancialInstitutions CurrencyinCirculation,Rs.Bn. Deposits,Rs.Bn.
Licensed Commercial Banks No.ofBanks Branches(c)
Assets,Rs.Bn. Loans,Rs.Bn. Investments,Rs.Bn. Capital,Rs.Bn. Deposits,Rs.Bn.
Non-Bank Financial Institutions Assets(net),Rs.Bn. Investments,Rs.Bn. LoansandAdvances(net),Rs.Bn. Deposits,Rs.Bn.
Selected Other Institutions – Assets, Rs. Bn. RuralBanks(d)
LicensedSpecialisedBanks(e)
UnitTrusts
Employees’ Provident Fund, Rs. Bn.
Employees’ Trust Fund, Rs. Bn.
821.9 985.4 1,141.7 1,284.4 1,246.0 1,464.3 1,426.3 1,529.2 1,604.8 685.7 862.5 838.6 965.9 1,058.4 1,130.0 1,126.7 1,049.8 1,328.4 111.3 80.0 264.5 279.5 114.4 150.0 230.3 413.3 225.4 1.1 2.5 2.3 1.8 1.4 1.5 0.9 0.5 0.2 217.4 255.7 293.2 318.1 339.8 416.9 491.7 552.8 598.1 361.9 465.0 646.6 736.4 678.5 603.3 732.7 794.9 824.4
23 23 24 24 24 25 25 25 25 1,948 2,114 2,381 2,530 2,651 2,724 2,781 2,841 2,861 2,506.6 2,974.6 3,578.5 4,355.7 5,022.1 5,884.4 6,974.3 7,843.3 8,926.4 1,407.0 1,764.2 2,329.1 2,830.7 3,079.4 3,453.9 4,258.3 5,007.5 5,791.2 652.8 763.8 717.2 869.0 1,224.0 1,394.0 1,813.1 1,735.3 1,986.6 197.9 236.4 305.4 366.9 418.9 490.7 574.1 645.9 793.5 1,850.6 2,153.4 2,558.7 3,061.3 3,552.4 3,976.6 4,639.0 5,449.4 6,424.4
284.0 370.8 474.2 573.4 684.6 814.6 996.1 1,211.9 1,355.0 25.7 51.6 30.7 40.0 51.8 109.7 99.6 111.7 118.1 183.1 248.7 373.1 448.9 521.3 603.7 795.8 962.7 1,057.1 119.8 146.1 186.0 254.1 337.3 414.1 480.6 530.7 686.7
41.6 54.7 67.6 77.2 94.9 103.5 117.6 122.2 132.7 506.7 576.0 673.7 742.5 919.3 1,087.5 1,103.2 1,203.2 1,366.2 10.0 22.2 22.7 31.1 54.3 126.5 130.3 106.7 131.7
772.0 899.7 1,018.0 1,144.0 1,300.0 1,488.2 1,664.9 1,841.5 2,066.3
107.3 125.9 142.4 158.4 178.5 199.1 223.5 248.9 279.0
(a) Revised.(b) Provisional.
(c) AllBankingOutletsexceptStudentsSavingsUnits.(d) RegisteredwithDepartmentofLabour.
(e) ExcludingRuralBanks.
Sources :MinistryofFinanceandMassMedia CentralBankofSriLanka

KEY SOCIO-ECONOMIC INDICATORS9
Domestic Expenditure and Savings(Per cent of GDP)
Fiscal Operations(Per cent of GDP)
Selected Socio-Economic Indicators – Graphical Illustrations
Selected Macroeconomic IndicatorsM
illio
n
18.0
20.0
19.0
21.0
2016 2008 2009 2010 2011 2012 2013 2014 2015 2017
0.6
0.8
1.0
1.2
1.4
Per c
en
t
2016 2008 2009 2010 2011 2012 2013 2014 2015 2017
Population Growth, %
20120
2,000
4,000
6,000
8,000
12,000
14,000
10,000
2013 2014 2015 2016 2017
Rs.
Bill
ion
GVA
Industry
Agriculture
↓
Services
Population
2012 2013
Per c
en
t
GDP GrowthInflation (NCPI Change: 2013=100)Inflation (CCPI Change: 2013=100)
Money Supply (M2b) Growth
Unemployment Rate
0
5
10
15
20
25
2014 2015 2016 2017
Gross Value Added at Basic Prices(Current)
Savings - Investment GapConsumption
InvestmentDomestic Savings
Per c
en
t
-15.0
25.0
5.0
45.0
65.0
85.0
20172012 2013 2014 2015 2016
Current Account Balance
Overall BalanceExportsImports
Pe
r ce
nt
20172012 2013 2014 2015 2016-10
0
10
20
30
40
Balance of Payments(Per cent of GDP)
Current AccountBudget Deficit
RevenueRecurrent ExpenditureCapital Expenditure and Net Lending
Per c
en
t
-10
-5
0
5
10
15
20
20172012 2013 2014 2015 2016

KEY SOCIO-ECONOMIC INDICATORS10
Money Supply(Per cent of GDP)
Social IndicatorsSelected Asian Countries
World GDP GrowthSelected Regions
Selected Socio-Economic Indicators – Graphical Illustrations
Selected Interest Rates
Selected Socio-Economic Indicators
GDP Per Capita/GDP Per Capita PPPSelected Regions
Currency
Reserve Money (M0)
Narrow Money (M1)
Broad Money (M2b)
Per c
en
t
0
10
20
30
40
50
20172008 2009 2010 2011 2012 2013 2014 2015 2016
Treasury Bill Yield - 3 Months
Prime Lending
Average Weighted Deposit Rate (Com. Banks)
LIBOR - US$ - 3 Months
Per c
en
t
0
5
10
15
20
25
20172008 2009 2010 2011 2012 2013 2014 2015 2016
Telephones, per 100 Persons
Hospital Beds, per 10,000 Persons
Doctors, per 100,000 Persons
Nu
mb
er
0
30
60
90
120
150
180
20172009 2010 2011 2012 2013 2014 2015 2016
SriLanka
Pakistan India Bangla-desh
Philip-pines
Indonesia Thai-land
Malaysia
Literacy Rate, % (2015)
Life Expectancy, Years (2015)
0
20
40
60
80
100
SriLanka
Pakistan India Bangla-desh
Philip-pines
Indo-nesia
Thai-land
Malaysia
GDP Per Capita (2016)
GDP Per Capita PPP (2016)
US
$
0
6,000
12,000
18,000
24,000
30,000
Emer-ging &Deve-lopingAsia
Emer-ging & Deve-loping
Economies
MiddleEast,NorthAfrica,
Afghani-stan &
Pakistan
SriLanka
World
GDP Growth, % 2016
GDP Growth, % 2017
Per c
en
t
LatinAmericanand the
Caribbean
AdvancedEcono-
mies
Emer-ging &Deve-lopingEurope
0.0
2.0
4.0
6.0
8.0

CLIMATE11
Mean Temperature 2008 – 2017
Rainfall and Rainy Days – Hydro Catchment Areas 2008 – 2017
Table 2.1
Table 2.2
MeteorologicalStation 2008 2009 2010 2011 2012 2013 2014 2015 2016 2017
Station 2008 2009 2010 2011 2012 2013 2014 2015 2016 2017
28.1 28.6 28.5 28.3 28.6 28.3 28.3 28.4 28.7 28.4 23.1 23.5 23.5 23.2 23.5 23.2 23.3 23.3 23.8 23.6 20.7 21.1 21.1 20.7 21.0 20.7 20.9 20.9 21.6 21.2 28.2 28.6 28.5 28.2 28.5 28.4 28.3 28.4 28.9 28.4 27.5 27.9 28.0 27.9 28.0 28.0 28.0 28.0 28.6 28.2 27.2 27.5 27.4 27.3 27.3 27.3 27.4 27.5 27.8 27.6 27.6 27.8 24.1 28.0 28.0 28.0 28.4 28.1 28.6 28.1 28.1 28.5 28.4 28.2 28.5 28.2 28.7 28.4 28.7 28.5 24.9 25.2 25.2 24.9 25.1 24.9 25.1 25.1 25.5 26.4 27.6 27.9 27.9 27.8 27.8 27.7 27.9 27.9 28.4 28.0 27.3 27.3 27.3 26.9 27.7 27.5 27.6 27.9 28.5 27.9 27.3 27.8 27.7 27.7 27.9 27.6 27.6 27.7 28.1 28.7 28.3 28.3 28.3 28.0 28.3 28.1 28.2 28.4 28.7 28.5 16.2 15.9 16.5 16.5 16.1 16.0 16.3 16.4 16.5 16.3 28.1 28.6 28.6 28.2 28.6 28.4 28.4 28.5 28.9 28.4 27.7 27.9 28.0 27.8 30.6 27.9 27.9 27.5 28.3 28.7 27.9 28.3 28.4 28.2 28.3 28.3 27.3 28.6 28.9 28.6 27.1 27.3 27.5 27.4 27.6 27.6 27.7 27.9 27.9 27.6 28.6 29.1 28.0 29.9 29.2 28.5 28.8 28.8 29.1 28.7 28.0 28.3 28.4 28.0 28.4 27.9 28.2 28.1 28.7 28.2
Annual Rainfall, Millimetres
3,244.6 4,206.4 4,419.3 3,283.4 2,753.1 5,263.2 4,049.7 2,689.3 2,789.7 3,515.8 2,751.7 3,631.2 3,920.0 2,412.8 2,169.3 4,155.8 3,175.3 2,801.9 2,424.8 2,967.2 2,073.5 1,989.9 2,969.9 1,974.4 1,054.4 2,740.4 2,381.3 2,064.5 1,311.4 2,105.2 3,764.9 4,091.0 5,010.8 4,009.7 3,215.8 5,224.5 4,341.5 3,431.9 3,795.2 4,396.3 2,461.4 3,398.4 3,240.7 2,273.9 2,237.8 4,017.8 3,193.1 2,247.1 2,051.0 2,403.7 3,638.4 3,704.3 5,199.3 3,829.6 3,186.8 5,783.4 4,667.9 3,624.7 4,119.7 4,566.5 4,803.8 4,476.6 5,513.7 4,159.4 3,444.9 4,903.7 3,573.6 4,355.3 3,474.9 4,493.2 3,613.1 2,842.9 4,388.4 3,793.0 2,871.8 5,714.0 4,070.9 3,952.8 4,043.5 4,840.8
Annual Rainy Days
212 214 220 208 196 219 222 181 195 215 198 198 206 182 158 184 193 183 207 221 166 133 168 159 74 142 132 146 134 162 218 224 218 204 179 209 218 189 184 218 170 183 201 189 178 194 192 160 160 197 230 183 218 208 181 220 229 191 203 229 213 202 201 191 189 207 187 225 182 205 217 162 174 206 168 220 201 212 198 226
AnuradhapuraBadullaBandarawelaBatticaloaColomboGalleHambantotaJaffnaKatugastotaKatunayakeKurunegalaMahailuppallamaMannarNuwaraEliyaPottuvilPuttalamRatmalanaRatnapuraTrincomaleeVavuniya
CanyonCastlereighKothmalePowerStationLaxapanaMaussakeleNortonSamanalaPowerStationWimalasurendra PowerStation
CanyonCastlereighKothmalePowerStationLaxapanaMaussakeleNortonSamanalaPowerStationWimalasurendra PowerStation
DegreeCelsius
Source :DepartmentofMeteorology
Source :DepartmentofMeteorology

CLIMATE12
Table 2.3
Source :DepartmentofMeteorology
Rainfall and Rainy Days – Selected Stations 2008 – 2017
MeteorologicalStation 2008 2009 2010 2011 2012 2013 2014 2015 2016 2017
Annual Rainfall, Millimetres
1,485.5 1,075.1 1,665.4 1,815.9 1,878.1 1,193.9 2,483.5 2,220.6 1,034.6 1,629.7 1,864.3 1,582.9 2,176.0 2,525.1 1,516.2 1,865.1 2,164.4 2,433.7 1,034.7 1,924.5 2,103.6 1,319.5 1,687.7 1,947.5 1,895.5 1,559.0 1,807.8 2,014.9 862.4 1,999.3 1,987.3 2,056.0 1,760.6 3,581.3 1,786.4 1,973.7 2,518.3 1,982.2 1,263.8 1,677.8 2,622.1 2,134.4 3,369.9 1,774.2 2,464.6 1,990.6 2,635.0 2,948.0 2,357.1 2,281.2 2,776.8 2,303.5 3,049.1 2,308.5 2,367.2 1,799.1 2,677.7 2,577.2 1,981.4 2,432.8 1,139.8 880.6 875.2 1,014.8 1,294.4 966.3 1095.7 1,316.4 666.2 1,168.6 1,811.8 1,270.9 1,496.6 1,470.7 943.2 1,033.3 1,368.6 1,338.9 1,010.8 1,342.6 1,848.6 1,944.0 2,665.6 1,776.6 1,990.9 1,925.5 2,539.1 1,976.6 1,300.1 1,565.7 2,516.1 1,690.9 2,585.6 1,446.1 1,945.2 2,057.1 2,276.3 2,364.5 1,422.9 1,880.8 2,404.8 2,050.8 2,434.3 1,958.0 1,961.9 1,805.4 2,737.4 2,050.2 1,916.5 1,794.0 1,545.7 1,010.7 1,600.9 1,706.4 1,486.0 1,161.7 2,064.9 1,844.1 1,125.5 1,525.9 1,219.2 964.5 1,074.9 1,203.2 923.5 918.6 1,052.5 1,548.0 714.3 707.8 1,587.0 1,639.9 2,181.4 1,699.6 1,771.1 2,157.7 1,857.7 2,021.2 1,138.2 1,707.6 1,727.5 1,473.1 1,224.9 2,196.8 1,400.2 1,613.0 1,861.0 1,610.7 973.0 1,474.7 1,341.7 956.9 1,333.9 826.3 1,141.2 905.1 1,696.6 1,664.3 939.0 819.2 2,967.2 2,476.2 3,404.9 2,042.9 2,272.3 2,128.2 2,222.7 3,013.1 2,371.4 2,228.7 3,883.5 3,394.2 4,561.1 3,430.0 3,380.3 3,575.7 4,710.6 3,462.5 2,832.6 4,308.4 1,844.5 1,888.9 1,419.5 2,906.5 1,810.4 1,492.5 1,691.5 2,030.3 996.3 1,778.8 1,224.3 1,369.0 1,359.6 1,869.2 1,559.3 1,304.5 2,106.0 1,795.7 1,153.9 1,571.3
Annual Rainy Days
112 87 103 104 92 93 138 131 76 95 168 158 148 350 135 151 175 181 109 142 180 162 146 167 135 158 138 180 101 151 112 95 94 117 85 98 118 124 72 96 184 179 158 161 167 167 211 208 133 158 182 191 193 177 162 172 216 207 168 184 109 122 104 108 111 110 108 118 74 108 91 59 84 95 69 82 103 105 48 77 170 186 174 175 146 171 220 192 131 158 156 164 159 151 151 149 183 175 105 147 158 159 158 148 141 153 204 155 120 158 134 103 114 111 98 98 150 122 85 109 82 69 70 86 65 55 96 86 44 65 198 204 204 198 167 196 225 207 154 182 110 99 83 108 86 94 120 109 72 94 116 110 106 102 96 81 112 124 68 103 206 186 181 173 181 163 206 205 158 168 243 227 233 219 207 228 257 236 204 238 104 104 105 130 86 82 124 110 73 99 86 82 103 114 85 85 128 116 70 106
AnuradhapuraBadullaBandarawelaBatticaloaColomboGalleHambantotaJaffnaKatugastotaKatunayakeKurunegalaMahailuppallamaMannarNuwaraEliyaPottuvilPuttalamRatmalanaRatnapuraTrincomaleeVavuniya
AnuradhapuraBadullaBandarawelaBatticaloaColomboGalleHambantotaJaffnaKatugastotaKatunayakeKurunegalaMahailuppallamaMannarNuwaraEliyaPottuvilPuttalamRatmalanaRatnapuraTrincomaleeVavuniya

CLIMATE13
Humidity 2016 – 2017
Table 2.4
MeteorologicalStation
Jan Feb Mar Apr May Jun Jul Aug Sep Oct Nov Dec
D N D N D N D N D N D N D N D N D N D N D N D N
Year 2016
72 91 68 91 58 88 61 88 74 92 69 87 65 86 61 84 58 83 61 87 77 93 71 93 80 n.a. 74 n.a. 65 n.a. 67 n.a. 73 n.a. n.a. n.a. 66 n.a. 65 n.a. 58 n.a. 59 n.a. 81 n.a. 75 n.a. 76 n.a. 71 n.a. 61 n.a. 71 n.a. 74 n.a. 61 n.a. 61 n.a. 60 n.a. 55 n.a. 66 n.a. 81 n.a. 71 n.a. 77 83 76 82 73 84 71 85 72 86 60 76 61 80 60 77 63 79 68 84 80 88 76 86 68 84 69 85 70 86 71 86 79 90 77 85 77 85 74 83 75 83 74 86 77 91 69 85 76 87 76 85 73 84 74 86 83 89 85 87 84 89 83 87 83 88 81 85 81 89 77 87 72 86 73 86 73 87 75 87 83 91 78 89 71 87 72 88 78 91 77 89 82 91 77 90 71 n.a. 69 n.a. 64 n.a. 64 n.a. 73 n.a. 73 n.a. 72 n.a. 71 n.a. 73 n.a. 72 n.a. 79 n.a. 76 n.a. 70 92 64 91 62 91 72 95 82 96 75 88 74 89 72 86 69 88 66 93 78 95 69 94 64 87 66 88 67 87 69 90 79 91 78 86 76 85 74 83 74 83 73 86 79 93 67 87 63 n.a. 59 n.a. 57 n.a. 69 n.a. 80 n.a. 76 n.a. 72 n.a. 66 n.a. 62 n.a. 64 n.a. 74 n.a. 65 n.a. 75 n.a. 69 n.a. 60 n.a. 63 n.a. 77 n.a. 73 n.a. 67 n.a. 62 n.a. 59 n.a. 63 n.a. 79 n.a. 73 n.a. 76 86 73 88 71 88 71 85 80 87 77 83 79 86 77 86 78 86 77 86 85 92 80 88 67 89 66 89 60 90 65 92 75 93 63 85 57 81 55 81 54 84 60 87 78 93 82 92 71 n.a. 69 n.a. 64 n.a. 66 n.a. 71 n.a. 58 n.a. 57 n.a. 60 n.a. 57 n.a. 61 n.a. 76 n.a. 68 n.a. 72 83 68 79 59 74 71 92 86 94 87 93 85 91 85 92 82 89 78 93 80 88 73 84 78 n.a. 75 n.a. 66 n.a. 64 n.a. 70 n.a. 58 n.a. 58 n.a. 53 n.a. 47 n.a. 50 n.a. 79 n.a. 74 n.a. 75 n.a. 73 n.a. 72 n.a. 73 n.a. 71 n.a. 62 n.a. 66 n.a. 65 n.a. 65 n.a. 68 n.a. 81 n.a. 75 n.a. 74 95 71 94 71 93 70 91 79 89 78 87 76 88 74 86 74 85 71 86 79 94 73 93 67 84 67 84 66 85 69 88 77 89 74 83 74 83 73 82 73 82 71 85 74 91 67 86 75 96 70 94 68 94 77 97 87 98 77 90 75 89 75 89 73 91 75 96 81 97 72 95 76 81 73 83 69 86 68 87 69 85 63 80 62 81 59 78 55 75 61 83 81 90 78 88 77 n.a. 73 n.a. 69 n.a. 63 n.a. 77 n.a. 75 n.a. 68 n.a. 65 n.a. 60 n.a. 66 n.a. 82 n.a. 75 n.a.
Year 2017
70 92 65 92 66 91 62 90 69 90 65 88 61 85 67 87 72 92 71 92 80 95 75 94 77 n.a. 74 n.a. 73 n.a. 63 n.a. 70 n.a. n.a. n.a. 62 n.a. 69 n.a. 70 n.a. 74 n.a. 80 n.a. 83 n.a. 73 n.a. 72 n.a. 71 n.a. 64 n.a. 71 n.a. 65 n.a. 59 n.a. 68 n.a. 70 n.a. 76 n.a. 80 n.a. 82 n.a. 77 85 74 82 74 86 72 86 66 81 64 79 n.a. n.a. 70 83 73 88 76 90 83 93 80 88 67 81 67 82 71 88 72 83 76 85 79 87 76 83 76 84 79 87 81 91 77 91 70 86 76 87 76 84 75 86 80 87 82 87 86 89 83 86 85 89 83 87 83 89 82 90 80 88 75 87 76 88 80 91 82 92 80 89 82 92 75 90 80 91 83 91 80 91 82 92 79 90 75 n.a. 69 n.a. 71 n.a. 69 n.a. 72 n.a. 73 n.a. 68 n.a. 73 n.a. 76 n.a. 79 n.a. 85 n.a. 77 n.a. 68 92 65 91 71 94 69 94 76 94 76 91 72 88 75 90 76 93 76 94 79 96 75 94 66 86 62 84 72 92 72 87 78 88 n.a. 89 77 84 77 85 81 89 81 92 79 95 72 91 63 n.a. 60 n.a. 66 n.a. 67 n.a. 73 n.a. 75 n.a. 70 n.a. 71 n.a. 76 n.a. 78 n.a. 77 n.a. 71 n.a.n.a. n.a. 69 n.a. 70 n.a. 65 n.a. 71 n.a. 68 n.a. 60 n.a. 66 n.a. 74 n.a. 74 n.a. 80 n.a. 77 n.a. 75 86 71 85 75 89 73 84 75 84 85 94 77 84 78 85 80 87 80 87 82 89 77 86 68 89 70 89 71 94 70 93 68 91 68 89 59 85 62 86 68 91 66 91 78 95 77 91 67 n.a. 67 n.a. 68 n.a. 65 n.a. 68 n.a. n.a. n.a. 59 n.a. 62 n.a. 62 n.a. 68 n.a. 74 n.a. 71 n.a. 73 84 63 70 70 85 60 83 80 94 n.a. n.a. 80 90 85 93 85 92 86 95 82 92 83 93 76 n.a. 73 n.a. 72 n.a. 60 n.a. 62 n.a. 55 n.a. 53 n.a. 59 n.a. 63 n.a. 66 n.a. 81 n.a. 78 n.a. 75 n.a. 76 n.a. 76 n.a. 72 n.a. 68 n.a. 65 n.a. 68 n.a. 67 n.a. 69 n.a. 73 n.a. 78 n.a. 76 n.a. 73 94 68 91 69 92 70 86 72 85 73 83 70 83 74 85 77 88 79 91 81 95 77 96 66 83 65 82 68 88 70 84 73 85 77 86 73 82 74 83 77 88 78 90 75 91 69 86 68 92 66 91 75 96 75 96 83 97 82 95 77 91 80 94 82 96 84 97 81 96 77 96 76 85 71 82 75 89 65 86 63 83 57 79 62 80 68 84 70 88 72 90 84 92 78 87 78 n.a. 70 n.a. 71 n.a. 67 n.a. 71 n.a. 65 n.a. 61 n.a. 70 n.a. 75 n.a. 78 n.a. 84 n.a. 79 n.a.
AnuradhapuraBadullaBandarawelaBatticaloaColomboGalleHambantotaJaffnaKatugastotaKatunayakeKurunegalaMahailuppallamaMannarMattalaMoneragalaNuwaraEliyaPolonnaruwaPottuvilPuttalamRatmalanaRatnapuraTrincomaleeVavuniya
AnuradhapuraBadullaBandarawelaBatticaloaColomboGalleHambantotaJaffnaKatugastotaKatunayakeKurunegalaMahailuppallamaMannarMattalaMoneragalaNuwaraEliyaPolonnaruwaPottuvilPuttalamRatmalanaRatnapuraTrincomaleeVavuniya
Percent
D–Day Source : DepartmentofMeteorology
N–Night
n.a.–Notavailable

POPULATION AND LABOUR FORCE14
Population by District and Sector 2001 and 2012
Population by Religion and Ethnicity – Census Years
Table 3.1
Table 3.2
(a) CensusofPopulationandHousing–2001whichcovered18districts.(b) CensusofPopulationandHousingofSriLanka–2012…-Negligible
Source :DepartmentofCensusandStatistics
2,251.3 1,229.6 1,014.4 7.3 54.6 45.1 0.3 2,324.3 1,802.9 513.5 7.9 77.6 22.1 0.3 2,063.7 300.9 1,762.0 0.7 14.6 85.4 0.0 2,304.8 360.2 1,943.4 1.2 15.6 84.3 0.1 1,066.2 113.2 915.5 37.6 10.6 85.9 3.5 1,221.9 109.1 1,075.2 37.6 8.9 88.0 3.1 1,279.0 156.0 1,030.2 92.9 12.2 80.5 7.3 1,375.4 170.5 1,119.2 85.6 12.4 81.4 6.2 441.3 36.1 383.5 21.8 8.2 86.9 4.9 484.5 60.3 405.2 19.1 12.4 83.6 3.9 703.6 43.1 283.7 376.9 6.1 40.3 53.6 711.6 40.2 290.9 380.6 5.6 40.9 53.5 990.5 109.9 863.3 17.3 11.1 87.2 1.7 1,063.3 133.4 911.2 18.8 12.5 85.7 1.8 761.4 64.4 676.5 20.5 8.5 88.9 2.7 814.0 96.6 694.9 22.5 11.9 85.4 2.8 526.4 21.6 503.4 1.4 4.1 95.6 0.3 599.9 31.7 568.2 – 5.3 94.7 – 490.6 – – – – – – 583.9 117.6 466.3 – 20.1 79.9 – 151.6 – – – – – – 99.6 24.4 75.2 – 24.5 75.5 – 149.8 – – – – – – 172.1 34.8 137.3 – 20.2 79.8 – 121.7 – – – – – – 92.2 – 92.2 – – 100.0 – 127.3 – – – – – – 113.5 – 113.5 – – 100.0 – 486.4 – – – – – – 526.6 151.2 375.3 – 28.7 71.3 – 593.0 112.5 480.5 – 19.0 81.0 – 649.4 153.3 496.1 – 23.6 76.4 – 340.2 – – – – – – 379.5 85.1 294.4 – 22.4 77.6 – 1,460.2 34.7 1,418.9 6.6 2.4 97.2 0.5 1,618.5 30.3 1,580.6 7.6 1.9 97.7 0.5 709.7 65.3 642.2 2.2 9.2 90.5 0.3 762.4 67.0 693.8 1.6 8.8 91.0 0.2 745.7 53.2 691.6 1.0 7.1 92.7 0.1 860.6 50.6 810.0 – 5.9 94.1 – 359.0 – 358.7 0.3 – 99.9 0.1 406.1 – 406.1 … – 100.0 – 780.0 51.5 567.2 161.3 6.6 72.7 20.7 815.4 69.8 591.7 153.9 8.6 72.6 18.9 397.4 – 388.2 9.1 – 97.7 2.3 451.1 – 442.7 8.3 – 98.1 1.9 1,015.8 58.2 855.2 102.4 5.7 84.2 10.1 1,088.0 99.5 888.8 99.7 9.1 81.7 9.2 785.5 17.1 712.9 55.5 2.2 90.8 7.1 840.6 16.0 767.5 57.2 1.9 91.3 6.8
18,797.3 2,467.3 13,547.7 914.7 14.6 80.0 5.4 20,359.4 3,704.5 15,753.3 901.6 18.2 77.4 4.4
ColomboGampahaKalutaraKandyMataleNuwaraEliyaGalleMataraHambantotaJaffnaMannarVavuniyaMullaitivuKilinochchiBatticaloaAmparaTrincomaleeKurunegalaPuttalamAnuradhapuraPolonnaruwaBadullaMonaragalaRatnapuraKegalle
Total
District
2001Census(a) 2012Census(b)
No.’000 Percent No.’000 Percent
Total Urban Rural Estate Urban Rural Estate Total Urban Rural Estate Urban Rural Estate
1881 2,759.7 61.5 21.5 7.2 9.7 0.1 66.9 24.9 6.7 0.6 0.3 0.51891 3,007.8 62.4 20.5 7.0 10.0 ... 67.9 24.1 6.6 0.7 0.3 0.51901 3,566.0 60.1 23.2 6.9 9.8 0.1 65.4 26.7 6.4 0.7 0.3 0.61911 4,106.4 60.3 22.8 6.9 10.0 ... 66.1 12.9 12.9 6.5 0.7 0.3 0.61921 4,498.6 61.6 21.8 6.7 9.9 ... 67.1 11.5 13.4 6.3 0.7 0.3 0.81931 5,306.9 61.6 22.0 6.7 9.8 ... 65.4 11.3 15.4 6.1 0.6 0.3 0.81946 6,657.3 64.5 19.8 6.6 9.1 ... 69.4 11.0 11.7 6.1 0.6 0.3 0.71953 8,097.9 64.3 19.9 6.7 8.9 0.1 69.4 10.9 12.0 6.3 0.6 0.3 0.51963 10,582.0 66.2 18.5 6.8 8.4 0.1 71.0 11.0 10.6 6.4 0.4 0.3 0.21971 12,689.8 67.3 17.6 7.1 7.9 0.1 72.0 11.2 9.3 6.7 0.4 0.3 0.11981 14,846.8 69.3 15.5 7.5 7.6 0.1 74.0 12.7 5.5 7.0 0.3 0.3 0.22001(a) 18,797.3 76.7 7.8 8.5 7.0 ... 82.0 4.3 5.1 7.9 0.2 0.3 0.22012(b) 20,359.4 70.1 12.6 9.7 7.6 ... 74.9 11.2 4.1 9.3 0.2 0.2 0.1
… Negligible(a)CensusofPopulationandHousing–2001whichcovered18districts.(b)BasedonCensusofPopulationandHousing–2012.
CensusYear
TotalPopulation
'000
ByReligion(%) ByEthnicity(%)
Buddhist Hindu Islam Christian Other Sinhalese Sri
LankanTamil
IndianTamil
Sri Lankan Moor
Burgher Malay Other
Source :DepartmentofCensusandStatistics

POPULATION AND LABOUR FORCE15
Mid-year Population by Age Group 2001 and 2010 – 2017Thousands
AgeGroup2001(a) 2010(a) 2011(a) 2012(b) 2013(b) 2014(b)(c) 2015(b)(c) 2016(b)(c) 2017(b)(c)
M F M F M F M F M F M F M F M F M F
0 – 4 814 783 895 864 904 873 882 868 889 874 897 882 906 891 917 901 927 912 5 – 9 842 812 920 892 930 901 885 868 892 875 900 883 909 892 919 902 930 91310 – 14 861 830 948 915 958 925 831 814 838 820 846 827 854 836 864 845 874 85515 – 19 927 897 1,018 993 1,028 1,004 823 827 829 834 836 841 845 849 854 859 864 86920 – 24 889 878 973 970 984 980 745 793 751 799 757 807 764 814 773 823 782 83225 – 29 730 755 805 831 814 840 746 812 752 818 759 825 766 833 774 843 783 85330 – 34 711 727 776 799 785 808 799 846 806 852 813 860 820 868 830 877 839 88835 – 39 693 708 760 777 768 785 688 725 694 731 700 738 706 745 714 753 723 76140 – 44 646 651 712 718 719 726 663 700 669 705 675 712 681 718 689 726 697 73445 – 49 562 576 621 638 627 644 620 670 625 675 631 681 637 687 644 695 651 70350 – 54 505 519 552 569 557 574 583 640 588 645 593 651 599 657 605 665 612 67255 – 59 356 387 395 425 399 429 503 565 506 570 511 575 516 580 521 587 527 59360 – 64 271 283 294 312 297 315 427 494 430 498 434 502 438 507 443 512 448 51865 – 69 206 236 229 265 232 268 284 351 287 353 289 357 292 360 295 364 298 36870 – 74 159 179 173 197 175 200 183 231 184 233 186 235 187 237 189 240 191 24275&over 187 217 202 237 204 239 226 333 226 337 229 339 231 341 234 346 236 349
Total 9,359 9,438 10,273 10,402 10,381 10,511 9,888 10,537 9,966 10,619 10,056 10,715 10,151 10,815 10,265 10,938 10,382 11,062
Total Population 18,797 20,675 20,892 20,425 20,585 20,771 20,966 21,203 21,444
Source :RegistrarGeneral’sDepartmentM–MaleF–Female
(a) BasedonCensusofPopulationandHousing–2001(b) BasedonCensusofPopulationandHousing–2012(c) Provisional
Table 3.3
Table 3.4
ColomboGampahaKalutaraKandyMataleNuwaraEliyaGalleMataraHambantotaJaffnaMannarVavuniyaMullaitivuKilinochchiBatticaloaAmparaTrincomaleeKurunegalaPuttalamAnuradhapuraPolonnaruwaBadullaMonaragalaRatnapuraKegalle
Total
2,324.3 70.2 8.0 11.8 7.0 2.9 0.1 76.5 10.1 1.0 10.7 1.6 2,304.8 71.3 2.3 4.9 19.5 2.0 0.0 90.5 3.5 0.4 4.2 1.3 1,221.9 83.4 3.2 9.4 3.3 0.7 0.0 86.8 1.9 1.9 9.3 0.2 1,375.4 73.4 9.7 14.3 1.6 0.9 0.0 74.4 5.0 6.2 13.9 0.4 484.5 79.5 9.0 9.4 1.6 0.5 0.0 80.8 5.0 4.8 9.2 0.2 711.6 39.1 51.0 3.0 4.7 2.2 0.0 39.6 4.6 53.1 2.5 0.2 1,063.3 93.9 1.5 3.7 0.4 0.5 0.0 94.4 1.3 0.6 3.6 0.1 814.0 94.1 2.0 3.1 0.3 0.4 0.0 94.3 1.1 1.5 3.1 0.0 599.9 96.7 0.2 2.5 0.2 0.3 0.1 97.1 0.4 0.0 1.1 1.5 583.9 0.4 82.8 0.4 12.9 3.5 0.0 0.4 98.9 0.3 0.4 0.0 99.6 1.8 24.1 16.6 52.6 4.8 0.0 2.3 80.4 0.7 16.5 0.0 172.1 9.8 69.4 7.0 8.9 4.9 0.0 10.0 82.0 1.1 6.8 0.1 92.2 8.9 75.2 2.0 9.8 4.0 0.1 9.7 85.8 2.5 2.0 0.1 113.5 1.1 81.9 0.6 10.6 5.7 0.0 1.2 97.3 0.9 0.6 0.0 526.6 1.2 64.4 25.5 4.6 4.3 0.0 1.3 72.3 0.4 25.4 0.6 649.4 38.7 15.8 43.4 1.2 0.9 0.0 38.9 17.3 0.1 43.4 0.3 379.5 26.2 25.9 42.0 3.8 2.0 0.0 26.7 30.7 0.3 41.8 0.4 1,618.5 88.5 0.9 7.3 2.7 0.6 0.0 91.4 1.1 0.2 7.1 0.2 762.4 43.2 3.8 19.7 31.5 1.6 0.2 73.6 6.3 0.3 19.4 0.5 860.6 90.1 0.4 8.3 0.8 0.4 0.0 91.0 0.5 0.1 8.2 0.2 406.1 89.7 1.7 7.5 0.8 0.3 0.0 90.7 1.8 0.0 7.4 0.1 815.4 72.6 19.3 5.8 1.5 0.8 0.0 73.0 2.7 18.5 5.5 0.4 451.1 94.6 2.7 2.2 0.4 0.2 0.0 94.9 1.8 1.1 2.1 0.1 1,088.0 86.7 9.4 2.2 1.0 0.7 0.0 87.1 5.0 5.7 2.1 0.1 840.6 84.4 6.5 7.3 1.0 0.8 0.0 85.5 2.1 5.2 7.1 0.1
20,359.4 70.1 12.6 9.7 6.2 1.4 0.0 74.9 11.2 4.1 9.3 0.5
(a)BasedonCensusofPopulationandHousing–2012 Source :DepartmentofCensusandStatistics
Population by District, Religion and Ethnicity – 2012 Census(a)
DistrictPopulation
'000
PopulationbyReligion,% PopulationbyEthnicity,%
Buddhist Hindu IslamRomanCatholic
Christian Other Sinhalese Sri
LankanTamil
IndianTamil
Sri Lankan Moor
Other

POPULATION AND LABOUR FORCE16
Source :RegistrarGeneral’sDepartment(a)BasedonCensusofPopulationandHousing–2001(b)BasedonCensusofPopulationandHousing–2012(c)Provisional
Mid-year Population by Province and District 2001 and 2009 – 2017
Table 3.5
Province/District 2001(a) 2009(a) 2010(a) 2011(a) 2012(b) 2013(b) 2014(b)(c) 2015(b)(c) 2016(b)(c) 2017(b)(c)
Thousands
Western
Colombo Gampaha Kalutara
Central
Kandy Matale NuwaraEliya
Southern
Galle Matara Hambantota
Northern
Jaffna Kilinochchi Mannar Vavuniya Mullaitivu
Eastern
Batticaloa Ampara Trincomalee
North Western
Kurunegala Puttalam
North Central
Anuradhapura Polonnaruwa
Uva
Badulla Moneragala
Sabaragamuwa
Ratnapura Kegalle
Total
5,381 5,841 5,891 5,946 5,865 5,896 5,936 5,979 6,028 6,081
2,251 2,543 2,573 2,606 2,330 2,339 2,357 2,375 2,395 2,419 2,064 2,163 2,176 2,189 2,310 2,324 2,338 2,354 2,372 2,391 1,066 1,135 1,142 1,151 1,225 1,233 1,241 1,250 1,261 1,271
2,424 2,668 2,696 2,727 2,582 2,606 2,631 2,658 2,690 2,722
1,279 1,422 1,437 1,455 1,381 1,391 1,402 1,416 1,434 1,452 441 489 496 503 486 491 496 502 508 514 704 757 763 769 715 724 733 740 748 756
2,278 2,470 2,495 2,518 2,485 2,508 2,532 2,556 2,584 2,611
991 1,074 1,084 1,094 1,066 1,074 1,082 1,091 1,102 1,113 761 830 839 847 817 824 831 837 845 851 526 566 572 577 602 610 619 628 637 647
1,041 1,145 1,149 1,160 1,065 1,074 1,085 1,094 1,107 1,119
491 532 536 542 585 589 593 597 602 608 127 149 150 154 114 116 118 120 122 124 152 161 162 163 100 101 103 104 106 107 150 167 172 176 173 175 177 179 182 184 121 136 129 125 93 93 94 94 95 96
1,419 1,540 1,561 1,584 1,561 1,574 1,593 1,615 1,645 1,677
486 537 543 549 528 531 535 541 550 560 593 635 644 654 652 658 667 677 691 705 340 368 374 381 381 385 391 397 404 412
2,170 2,332 2,353 2,377 2,389 2,405 2,425 2,448 2,477 2,508
1,460 1,556 1,569 1,583 1,624 1,634 1,645 1,658 1,676 1,694 710 776 784 794 765 771 780 790 801 814
1,104 1,224 1,238 1,254 1,272 1,285 1,298 1,312 1,330 1,349
745 819 829 839 864 874 883 893 905 918 359 405 409 415 408 411 415 419 425 431
1,178 1,316 1,333 1,349 1,271 1,286 1,301 1,316 1,333 1,349
780 879 891 902 818 826 835 844 854 864 398 437 442 447 453 460 466 472 479 485
1,802 1,940 1,959 1,977 1,935 1,951 1,970 1,988 2,009 2,028
1,016 1,122 1,136 1,149 1,092 1,102 1,115 1,127 1,140 1,151 786 818 823 828 843 849 855 861 869 877
18,797 20,476 20,675 20,892 20,425 20,585 20,771 20,966 21,203 21,444

POPULATION AND LABOUR FORCE17
Population Density 2016 and 2017
Table 3.6
Province/DistrictTotalArea
Sq.km.
InlandWaters
Sq.km.
Forests
Sq.km.
LandArea(a)
Sq.km.
Mid-yearPopulation,'000 Density,PersonsperSq.km.
2016(b)(c) 2017(b)(c) 2016(b)(c) 2017(b)(c)
Western Colombo Gampaha KalutaraCentral Kandy Matale NuwaraEliyaSouthern Galle Matara HambantotaNorthern Jaffna Kilinochchi Mannar Vavuniya MullaitivuEastern Batticaloa Ampara TrincomaleeNorth Western Kurunegala PuttalamNorth Central Anuradhapura PolonnaruwaUva Badulla MoneragalaSabaragamuwa Ratnapura KegalleTotal
3,684 91 195 3,593 6,028 6,081 1,678 1,692 699 23 15 676 2,395 2,419 3,543 3,578 1,387 46 14 1,341 2,372 2,391 1,769 1,783 1,598 22 166 1,576 1,261 1,271 800 806 5,674 99 1,402 5,575 2,690 2,722 483 488 1,940 23 317 1,917 1,434 1,452 748 757 1,993 41 599 1,952 508 514 260 263 1,741 35 486 1,706 748 756 438 443 5,544 161 932 5,383 2,584 2,611 480 485 1,652 35 236 1,617 1,102 1,113 682 688 1,283 13 187 1,270 845 851 665 670 2,609 113 509 2,496 637 647 255 259 8,884 594 3,946 8,290 1,107 1,119 134 135 1,025 96 3 929 602 608 648 654 1,279 74 351 1,205 122 124 101 103 1,996 116 1,024 1,880 106 107 56 57 1,967 106 889 1,861 182 184 98 99 2,617 202 1,679 2,415 95 96 39 40 9,996 635 3,030 9,361 1,645 1,677 176 179 2,854 244 517 2,610 550 560 211 215 4,415 193 1,696 4,222 691 705 164 167 2,727 198 817 2,529 404 412 160 163 7,888 382 1,002 7,506 2,477 2,508 330 334 4,816 192 185 4,624 1,676 1,694 362 366 3,072 190 817 2,882 801 814 278 282 10,472 731 3,326 9,741 1,330 1,349 137 138 7,179 515 1,979 6,664 905 918 136 138 3,293 216 1,347 3,077 425 431 138 140 8,500 165 2,000 8,335 1,333 1,349 160 162 2,861 34 683 2,827 854 864 302 306 5,639 131 1,317 5,508 479 485 87 88 4,968 47 765 4,921 2,009 2,028 408 412 3,275 39 648 3,236 1,140 1,151 352 356 1,693 8 117 1,685 869 877 516 520 65,610 2,905 16,598 62,705 21,203 21,444 338 342
Sources :SurveyorGeneral'sOffice RegistrarGeneral’sDepartment
(a) Totallandareaexcludinginlandwaters(b) BasedonCensusofPopulationandHousing–2012(c) Provisional
VItal Statistics 2008 – 2017
Table 3.7
Item 2008 2009 2010 2011 2012 2013 2014(a) 2015(a) 2016(a) 2017(a)
Mid-yearPopulation,’000(b)
0–14years 15–54years 55years&over
Mid-yearPopulationGrowthRate,%CrudeBirthRateper1,000CrudeDeathRateper1,000RateofNaturalIncreaseper1,000Mid-yearIn-Migration,’000Mid-yearOut-Migration,’000Mid-yearNetMigrationRateper1,000DensityofPopulation, (PersonsperSq.km.)InfantMortalityper1,000LiveBirths
20,246 20,476 20,675 20,892 20,425 20,585 20,771 20,966 21,203 21,444
5,320 5,380 5,434 5,491 5,148 5,188 5,235 5,288 5,348 5,411 12,253 12,391 12,512 12,643 11,680 11,773 11,879 11,989 12,124 12,263 2,673 2,705 2,729 2,758 3,597 3,624 3,657 3,689 3,731 3,770
1.0 1.1 1.0 1.1 1.0 0.8 0.9 0.9 1.1 1.1 18.5 18.0 17.6 17.3 17.6 17.8 16.9 16.0 15.6 15.2 6.1 6.2 6.3 5.9 6.0 6.2 6.2 6.3 6.2 6.5 12.3 11.8 11.3 11.4 11.6 11.6 10.7 9.7 9.4 8.7 1,644 1,645 2,106 2,433 2,496 2,629 2,875 3,252 3,652 3,730 1,688 1,673 2,129 2,479 2,548 2,677 2,917 3,238 3,608 3,680 -2.2 -1.4 -1.1 -2.2 -2.5 -2.3 -2.0 0.7 2.1 2.3 323 327 330 333 326 328 331 334 338 342 9.0 9.7 9.9 9.1(a) 8.5(a) 8.3 8.0 8.5 n.a. n.a.
(a) Provisionaln.a.–Notavailable
(b) Until2011,mid-yearpopulationestimateswerepreparedbasedontheCensusof Population andHousing of 2001.Mid-year population estimates from 2012onwardswerebasedonCensusofPopulationandHousing–2012.
Source :DepartmentofCensusandStatistics RegistrarGeneral’sDepartment

POPU
LATIO
N A
ND
LABO
UR
FOR
CE
18
2011(a) 2012(b) 2013(b) 2014(b)(c) 2015(b)(c) 2016(b)(c) 2017(b)(c)
ColomboGampahaKalutaraKandyMataleNuwaraEliyaGalleMataraHambantotaJaffnaKilinochchiMannarVavuniyaMullaitivuBatticaloaAmparaTrincomaleeKurunegalaPuttalamAnuradhapuraPolonnaruwaBadullaMoneragalaRatnapuraKegalle
Sri Lanka
Crude Crude Crude Crude Crude Crude Crude Crude Crude Crude Crude Crude Crude CrudeBirth Death Birth Death Birth Death Birth Death Birth Death Birth Death Birth DeathRate Rate Rate Rate Rate Rate Rate Rate Rate Rate Rate Rate Rate Rate
District
(a)Figuresarebasedonplaceofoccurrence.
(b)Figuresarebasedonusualresidence.
(c)Provisional
21.4 7.9 15.1 8.9 15.0 6.8 15.4 6.8 14.4 7.0 14.0 7.1 13.7 7.4 12.3 5.2 14.4 5.1 14.6 6.0 13.7 6.0 13.1 6.2 12.8 6.2 12.4 6.5 14.5 5.9 15.7 5.7 16.0 6.6 14.8 6.5 14.2 6.8 13.3 6.5 13.0 7.1 20.3 7.2 19.0 7.7 19.6 6.6 18.8 7.2 17.5 7.0 16.4 6.8 15.9 7.2 20.8 5.5 19.9 5.8 19.2 6.1 19.1 6.5 17.4 6.4 16.9 6.1 14.8 6.5 13.5 4.8 20.9 5.0 20.9 6.7 17.5 6.2 16.5 6.3 17.0 6.1 15.2 6.1 17.8 6.8 17.0 7.2 17.0 6.8 16.7 7.3 16.4 7.6 15.9 7.1 15.2 7.7 14.5 5.8 18.8 6.1 17.0 6.5 15.2 6.3 14.2 6.6 13.9 6.3 13.3 6.5 15.4 4.7 19.7 4.7 19.7 5.5 20.9 5.4 19.7 5.6 19.3 5.3 17.6 5.5 18.5 7.2 15.1 7.1 16.6 7.2 14.9 7.1 13.6 6.9 14.1 7.3 14.9 7.4 21.5 2.1 22.3 2.7 22.3 5.0 19.1 2.9 16.9 3.1 19.5 3.6 21.8 4.1 9.0 2.1 18.9 3.5 18.1 4.6 15.4 3.7 18.1 3.8 18.5 3.9 19.6 4.0 24.5 5.1 17.6 5.1 24.3 5.7 19.6 4.9 17.6 4.7 16.1 4.2 17.8 4.8 8.6 16.1 18.9 8.4 16.4 5.2 11.6 4.2 12.2 3.8 10.5 3.8 11.4 3.9 17.9 5.2 18.7 5.7 20.4 4.8 18.1 4.8 17.3 4.9 16.9 5.6 17.8 4.9 21.6 4.3 20.7 4.5 21.0 4.5 21.1 4.6 20.5 4.7 20.5 4.6 20.2 4.8 23.2 3.9 22.2 3.7 20.7 4.4 22.1 4.1 20.5 4.4 20.2 4.4 20.4 4.5 16.2 6.5 17.8 5.9 17.3 6.6 16.0 6.6 15.4 6.7 15.2 6.3 14.6 6.9 18.2 4.7 18.5 4.8 19.2 5.4 19.2 5.4 18.4 5.5 17.6 5.5 17.4 5.9 18.9 5.7 20.5 5.4 20.8 5.5 17.8 5.5 17.3 5.8 17.1 5.1 16.9 6.1 18.2 4.7 18.9 4.6 19.4 5.5 17.7 5.5 16.9 5.2 16.8 5.1 16.4 5.9 18.6 5.4 18.7 5.9 18.4 6.1 18.4 6.4 16.2 6.1 16.8 6.2 16.6 6.3 15.8 3.9 20.2 3.9 21.2 4.7 19.5 4.7 18.4 4.8 17.5 4.9 17.0 5.1 18.2 5.1 17.3 5.6 18.1 6.3 18.0 6.1 16.7 6.1 15.9 6.1 15.7 6.5 12.6 5.6 16.8 5.6 16.7 7.2 16.0 6.9 14.9 6.9 14.4 6.8 13.8 7.4
17.3 5.9 17.6 6.0 17.8 6.2 16.9 6.2 16.0 6.3 15.6 6.2 15.2 6.5
Crude Birth Rates and Death Rates by District 2011 – 2017
Table 3.8
Per1,000Persons
Source:RegistrarGeneral’sDepartment

POPULATION AND LABOUR FORCE19
Labour Force 2009 – 2017
Table 3.9
Item 2009(a) 2010(a) 2011(b) 2012(b) 2013(b) 2014(b) 2015(b) 2016(b) 2017(b)
(a)IncludingEasternProvinceandexcludingNorthernProvince.(b)Datacoverstheentireisland.
Notes: 1. Dataupto2010areforthehouseholdpopulationaged10yearsandaboveanddatafrom2011onwardsareforthehouseholdpopulationaged15yearsandabove.
2. InJuly2016,theDepartmentofCensusandStatisticspublishedare-weightedandrevisedlabourforcedataseriesfor2011onwards.
Labour Force :Thelabourforcecomprisesoftheeconomicallyactivepopulationaged15yearsandabove.
Labour Force Participation Rate :Percentageofthecurrent“economicallyactivepopulation”orthe“labourforce”tothetotalworkingagepopulation.
Employed : Persons,whoworkaspaidemployees,employers,ownaccountworkers(self-employed),orunpaidfamilyworkersduringthereferenceperiodaresaidtobeemployed.Thisincludespersonswithajobbutnotatworkduringthereferenceperiod.
Unemployed : Personswhoareseekingandavailableforwork,buthadnoemploymentduringthereferenceperiod.
Source :DepartmentofCensusandStatistics
HouseholdPopulation’000
LabourForce’000
Employed’000Unemployed’000
Labour Force Participation Rates, %
By Age Groups
15–19 20–24 25–29 30–39 40&above
AllAges(15years&above) By Sector and Sex
Urban
Male Female
Total
Rural
Male Female
Total
All Island
Male Female
Total
16,578 16,862 14,976 14,858 14,959 15,134 15,282 15,449 15,844
8,074 8,108 7,926 7,798 8,034 8,049 8,214 8,311 8,567
7,602 7,707 7,592 7,489 7,681 7,700 7,831 7,948 8,208 471 401 335 310 353 348 383 363 358
19.0 17.2 16.2 14.7 16.2 15.2 15.0 13.8 13.3 58.7 55.9 54.4 54.5 55.0 52.7 55.5 55.6 57.4 66.2 64.2 66.1 64.4 64.7 63.8 65.4 65.8 67.6 68.3 67.2 67.4 65.7 67.9 68.0 67.4 67.6 68.1 53.7 53.8 53.1 52.7 54.1 53.4 54.0 54.4 54.6
48.7 48.1 52.9 52.5 53.7 53.2 53.8 53.8 54.1
63.1 63.6 69.8 70.7 70.2 70.4 70.0 72.6 72.5 26.2 23.8 28.0 28.9 27.5 29.4 30.0 30.2 31.6
43.5 42.0 47.8 48.3 47.7 48.7 48.6 49.8 50.5
67.1 67.7 74.7 75.8 75.9 75.4 75.6 75.6 75.0 33.7 32.3 35.3 33.8 37.0 35.7 37.1 37.0 37.7
49.4 49.0 53.8 53.4 54.9 54.1 54.8 54.6 54.8
66.6 67.1 74.0 74.9 74.9 74.6 74.7 75.1 74.5 32.8 31.2 34.3 32.9 35.4 34.6 35.9 35.9 36.6
48.7 48.1 52.9 52.5 53.7 53.2 53.8 53.8 54.1

POPULATION AND LABOUR FORCE20
By Industrial Category(d)
Agriculture Manufacturing Construction(e)
Trade&Hotels Transport,Storage&Communication Insurance&RealEstate PersonalServices
Total By Industrial Category(f)
Agriculture MiningandQuarrying Manufacturing Construction,Electricity,Gas,Steamand AirConditioningSupply,WaterSupply, Sewerage,Wastemanagementand Remediationactivities WholesaleandRetailTrade,Repairof MotorVehiclesandMotorCycles TransportandStorage AccommodationandFoodServicesActivities InformationandCommunication FinancialandInsuranceActivities Professional,ScientificandTechnicalActivities AdministrativeandSupportServiceActivities PublicAdministrationandDefence, CompulsorySocialSecurity Education HumanHealthandSocialWorkActivities Other(g)
Total
By Occupational Groups
SeniorOfficialsandManagers Professionals Technicians&AssociateProfessionals Clerks Sales&ServiceWorkers;Proprietors& ManagersofEnterprises SkilledAgriculturalandFisheryWorkers Craft&RelatedWorkers Plant&MachineOperators&Assemblers ElementaryOccupations NotIdentified
Total
By Employment Status
PublicEmployees PrivateEmployees Employers OwnAccountWorkers UnpaidFamilyWorkers
Total
32.6 32.6 32.7 33.1 31.2 – – – – – 18.5 17.7 17.1 16.7 17.5 – – – – – 7.7 7.4 7.1 7.2 8.4 – – – – – 14.3 14.7 15.5 15.1 15.6 – – – – – 5.8 5.9 6.3 6.2 6.5 – – – – – 3.2 3.0 3.4 3.5 3.5 – – – – – 17.9 18.8 17.9 18.2 17.4 – – – – –
100.0 100.0 100.0 100.0 100.0 – – – – –
– – – – – 30.2 28.9 28.7 27.1 26.1 – – – – – 1.2 1.0 0.8 0.8 0.8 – – – – – 17.8 18.0 18.0 17.9 19.3 – – – – – 7.0 7.3 7.0 7.8 8.4 – – – – – 13.6 13.1 13.5 13.9 14.1 – – – – – 6.1 6.3 6.1 6.5 6.3 – – – – – 2.2 2.4 2.6 2.6 2.6 – – – – – 0.7 0.8 0.7 0.8 0.9 – – – – – 1.8 1.9 1.8 2.0 1.9 – – – – – 0.8 0.6 0.8 0.7 0.8 – – – – – 1.2 1.3 1.5 1.4 1.9 – – – – – 7.4 7.7 7.7 7.7 6.4 – – – – – 3.9 4.1 4.1 4.3 4.6 – – – – – 1.7 1.6 1.8 1.8 1.8 – – – – – 4.3 5.0 4.9 5.0 4.2
– – – – – 100.0 100.0 100.0 100.0 100.0
1.7 1.6 1.5 1.7 1.7 4.8 4.6 6.1 6.0 6.8 5.9 6.0 5.6 6.2 6.4 6.3 6.4 6.5 6.5 6.8 5.5 5.2 5.1 5.0 5.7 5.8 5.8 6.0 6.1 6.8 4.0 4.1 4.1 4.1 4.4 3.7 4.3 4.0 4.0 4.0 14.4 14.7 14.9 15.3 14.4 11.0 11.7 10.9 11.2 10.0 22.2 22.5 22.3 23.0 21.5 19.4 20.3 18.6 18.1 17.1 16.4 15.5 15.7 15.9 16.9 17.0 17.1 16.2 16.0 16.7 7.3 7.0 7.3 7.1 8.6 8.3 8.3 8.6 8.8 9.0 21.9 22.6 22.6 20.7 19.8 23.1 21.2 22.6 22.6 22.4 0.7 1.0 1.0 0.9 0.5 0.6 0.4 0.5 0.6 0.4
100.0 100.0 100.0 100.0 100.0 100.0 100.0 100.0 100.0 100.0
15.2 15.5 14.3 14.6 15.3 15.2 15.5 15.1 14.6 14.4 41.2 42.1 41.2 40.5 41.2 40.5 40.9 41.0 43.3 43.3 2.9 2.6 2.6 2.9 2.8 3.0 2.7 3.1 2.7 3.0 30.2 29.2 31.5 31.5 31.9 32.2 32.0 32.3 31.6 31.3 10.5 10.6 10.4 10.6 8.7 9.1 8.9 8.4 7.8 8.0
100.0 100.0 100.0 100.0 100.0 100.0 100.0 100.0 100.0 100.0
Employment 2008 – 2017(a)
Table 3.10
Item 2008(b) 2009(b) 2010(b) 2011(c) 2012(c) 2013(c) 2014(c) 2015(c) 2016(c) 2017(c)
Percent
(a) Dataupto2010are for thehouseholdpopulationaged10 yearsandaboveanddatafrom2011onwardsareforthehouseholdpopulationaged15yearsandabove.
(b) IncludingEasternProvinceandexcludingNorthernProvince.
(c) Datacoverstheentireisland.
(d) BasedontheInternationalStandardIndustrialClassification(ISIC)–Revision3.
(e) Mining&Quarrying,Electricity,Gas&Wateralsoincluded.
(f) BasedonISIC–Revision4.
(g) This includesactivitiesofhouseholdsasEmployers; Realestate;Arts,EntertainmentandRecreation;andExtraTerritorialOrganisationsandBodies.
Note:InJuly2016,theDepartmentofCensusandStatisticspublisheda re-weightedandrevisedlabourforcedataseriesfor2011onwards.
Source :DepartmentofCensusandStatistics
POPULATION AND LABOUR FORCE21
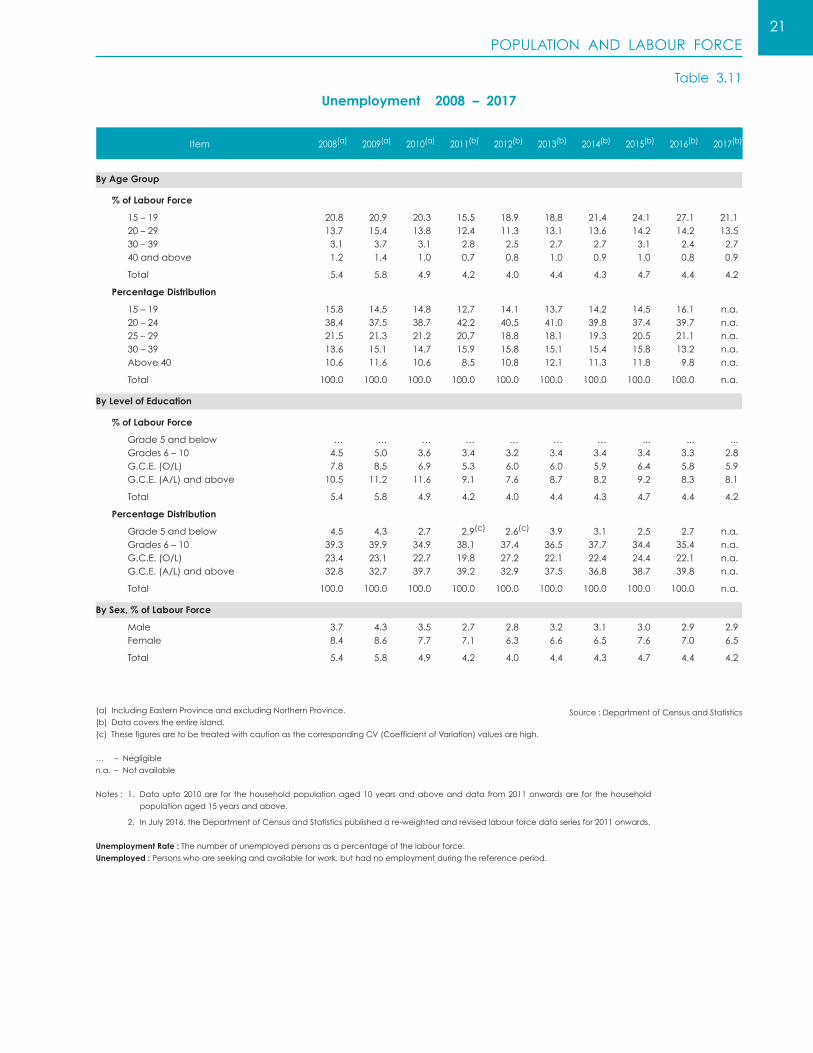
By Age Group
% of Labour Force
15–19 20–29 30–39 40andabove
Total
Percentage Distribution
15–19 20–24 25–29 30–39 Above40
Total
By Level of Education
% of Labour Force
Grade5andbelow Grades6–10 G.C.E.(O/L) G.C.E.(A/L)andabove
Total
Percentage Distribution
Grade5andbelow Grades6–10 G.C.E.(O/L) G.C.E.(A/L)andabove
Total
By Sex, % of Labour Force
Male Female
Total
(a)IncludingEasternProvinceandexcludingNorthernProvince.
(b)Datacoverstheentireisland.
(c)ThesefiguresaretobetreatedwithcautionasthecorrespondingCV(CoefficientofVariation)valuesarehigh.
… –Negligible
n.a. –Notavailable
Notes: 1. Dataupto2010are for thehouseholdpopulationaged10yearsandaboveanddata from2011onwardsare for thehousehold
populationaged15yearsandabove.
2. InJuly2016,theDepartmentofCensusandStatisticspublishedare-weightedandrevisedlabourforcedataseriesfor2011onwards.
Unemployment Rate :Thenumberofunemployedpersonsasapercentageofthelabourforce.
Unemployed :Personswhoareseekingandavailableforwork,buthadnoemploymentduringthereferenceperiod.
Source :DepartmentofCensusandStatistics
20.8 20.9 20.3 15.5 18.9 18.8 21.4 24.1 27.1 21.1 13.7 15.4 13.8 12.4 11.3 13.1 13.6 14.2 14.2 13.5 3.1 3.7 3.1 2.8 2.5 2.7 2.7 3.1 2.4 2.7 1.2 1.4 1.0 0.7 0.8 1.0 0.9 1.0 0.8 0.9
5.4 5.8 4.9 4.2 4.0 4.4 4.3 4.7 4.4 4.2
15.8 14.5 14.8 12.7 14.1 13.7 14.2 14.5 16.1 n.a. 38.4 37.5 38.7 42.2 40.5 41.0 39.8 37.4 39.7 n.a. 21.5 21.3 21.2 20.7 18.8 18.1 19.3 20.5 21.1 n.a. 13.6 15.1 14.7 15.9 15.8 15.1 15.4 15.8 13.2 n.a. 10.6 11.6 10.6 8.5 10.8 12.1 11.3 11.8 9.8 n.a.
100.0 100.0 100.0 100.0 100.0 100.0 100.0 100.0 100.0 n.a.
… … … … … … … ... ... ... 4.5 5.0 3.6 3.4 3.2 3.4 3.4 3.4 3.3 2.8 7.8 8.5 6.9 5.3 6.0 6.0 5.9 6.4 5.8 5.9 10.5 11.2 11.6 9.1 7.6 8.7 8.2 9.2 8.3 8.1
5.4 5.8 4.9 4.2 4.0 4.4 4.3 4.7 4.4 4.2
4.5 4.3 2.7 2.9(c) 2.6(c) 3.9 3.1 2.5 2.7 n.a. 39.3 39.9 34.9 38.1 37.4 36.5 37.7 34.4 35.4 n.a. 23.4 23.1 22.7 19.8 27.2 22.1 22.4 24.4 22.1 n.a. 32.8 32.7 39.7 39.2 32.9 37.5 36.8 38.7 39.8 n.a.
100.0 100.0 100.0 100.0 100.0 100.0 100.0 100.0 100.0 n.a.
3.7 4.3 3.5 2.7 2.8 3.2 3.1 3.0 2.9 2.9 8.4 8.6 7.7 7.1 6.3 6.6 6.5 7.6 7.0 6.5
5.4 5.8 4.9 4.2 4.0 4.4 4.3 4.7 4.4 4.2
Unemployment 2008 – 2017
Table 3.11
Item 2008(a) 2009(a) 2010(a) 2011(b) 2012(b) 2013(b) 2014(b) 2015(b) 2016(b) 2017(b)

POPULATION AND LABOUR FORCE22
Public Sector Employment 2015 – 2017(a)
Table 3.12
ServiceLevel2015 2016(b) 2017(c)
Regular Other(d) Total Regular Other(d) Total Regular Other(d) Total
Government Institutions SeniorLevel(e)
TertiaryLevel(f)
SecondaryLevel(g)
PrimaryLevel(h)
Total
Semi-Government Institutions SeniorLevel(e)
TertiaryLevel(f)
SecondaryLevel(g)
PrimaryLevel(h)
Total
Public Sector (Total) SeniorLevel(e)
TertiaryLevel(f)
SecondaryLevel(g)
PrimaryLevel(h)
Total
Government Institutions SeniorLevel(e)
TertiaryLevel(f)
SecondaryLevel(g)
PrimaryLevel(h)
Total
Semi-Government Institutions SeniorLevel(e)
TertiaryLevel(f)
SecondaryLevel(g)
PrimaryLevel(h)
Total
Public Sector (Total) SeniorLevel(e)
TertiaryLevel(f)
SecondaryLevel(g)
PrimaryLevel(h)
Total
44,926 3,348 48,274 46,117 3,220 49,337 47,701 3,400 51,101 163,431 37,183 200,614 74,908 13,521 88,429 76,381 13,224 89,605 605,086 40,633 645,719 701,889 62,229 764,118 704,304 59,993 764,297 229,852 12,197 242,049 232,871 12,240 245,111 232,376 12,488 244,864
1,043,295 93,361 1,136,656 1,055,785 91,210 1,146,995 1,060,762 89,105 1,149,867 14,812 1,489 16,301 16,238 1,838 18,076 17,818 2,238 20,056 28,600 2,730 31,330 28,539 2,596 31,135 29,408 2,575 31,983 79,385 6,665 86,050 77,866 6,040 83,906 75,611 6,065 81,676 89,312 15,481 104,793 91,722 17,933 109,655 92,115 18,475 110,590
212,109 26,365 238,474 214,365 28,407 242,772 214,952 29,353 244,305 59,738 4,837 64,575 62,355 5,058 67,413 65,519 5,638 71,157 192,031 39,913 231,944 103,447 16,117 119,564 105,789 15,799 121,588 684,471 47,298 731,769 779,755 68,269 848,024 779,915 66,058 845,973 319,164 27,678 346,842 324,593 30,173 354,766 324,491 30,963 355,454
1,255,404 119,726 1,375,130 1,270,150 119,617 1,389,767 1,275,714 118,458 1,394,172
Per cent
4.3 3.6 4.3 4.4 3.5 4.3 4.5 3.8 4.4 15.7 39.8 17.7 7.1 14.8 7.7 7.2 14.8 7.8 58.0 43.5 56.8 66.5 68.2 66.6 66.4 67.3 66.5 22.0 13.1 21.3 22.1 13.4 21.4 21.9 14.0 21.3
100.0 100.0 100.0 100.0 100.0 100.0 100.0 100.0 100.0 7.0 5.6 6.8 7.6 6.5 7.4 8.3 7.6 8.2 13.5 10.4 13.1 13.3 9.1 12.8 13.7 8.8 13.1 37.4 25.3 36.1 36.3 21.3 34.6 35.2 20.7 33.4 42.1 58.7 43.9 42.8 63.1 45.2 42.9 62.9 45.3
100.0 100.0 100.0 100.0 100.0 100.0 100.0 100.0 100.0 4.8 4.0 4.7 4.9 4.2 4.9 5.1 4.8 5.1 15.3 33.3 16.9 8.1 13.5 8.6 8.3 13.3 8.7 54.5 39.5 53.2 61.4 57.1 61.0 61.1 55.8 60.7 25.4 23.1 25.2 25.6 25.2 25.5 25.4 26.1 25.5
100.0 100.0 100.0 100.0 100.0 100.0 100.0 100.0 100.0
(a) Re-categorizedinaccordancewiththedefinitionsgiveninthePublicAdministration
CircularNo.06/2006issuedon25thApril2006.
(b) Revised
(c) Provisional
(d) Employeesoncontractandcasualbasis.
(e) RepresentsExecutives/SeniorExecutives;Judicial/LawOfficersandMedicalOfficers.
Source :CentralBankofSriLanka
(f) RepresentsField/OfficebasedOfficers;Supra/SpecialClassManagementAssistants;SriLankaPrincipals’Service;PoliceInspectors/ChiefInspectorsandsimilarposts
inotherRegulatoryServices;SpecialGradesofNurses/ProfessionsSupplementarytoMedicalServicesandPara-MedicalServices;andMedicalPractitioners.
(g) RepresentsManagementAssistant(TechnicalandNon-Technical);AssociateOfficers;SriLankaTeachers’Service;PoliceConstables/Sergeants/SergeantMajor/
Sub-InspectorsandsimilarpostsinotherRegulatoryServices;SupervisoryManagementAssistants;andNurses/PSMServicesandPara-MedicalServicesexceptthe
SpecialGradesoftheseservices.
(h) Representsprimarylevelun-skilled,semi-skilledandskilledemployees.

POPULATION AND LABOUR FORCE23
Migration for Foreign Employment 2009 – 2017
Table 3.13
Category 2009 2010 2011 2012 2013 2014 2015 2016(a) 2017(b)
247,126 267,507 262,961 282,447 293,218 300,703 263,443 242,816 212,162
119,381 148,001 136,307 144,135 175,185 190,217 172,788 160,306 139,271 48.3 55.3 51.8 51.0 59.7 63.3 65.6 66.0 65.6
127,745 119,506 126,654 138,312 118,033 110,486 90,655 82,510 72,891 51.7 44.7 48.2 49.0 40.3 36.7 34.4 34.0 34.4
677 733 720 774 803 824 721 665 581
14.9 12.6 10.7 22.6 23.2 22.9 19.4 16.8 14.7
1.1 1.1 1.5 1.6 1.8 1.8 2.4 2.7 3.0 2.6 2.6 2.3 3.3 5.6 6.9 2.6 3.4 3.4 2.7 3.0 3.8 5.7 9.1 9.7 4.7 4.5 4.4 27.2 28.5 27.4 25.0 26.3 25.7 32.8 33.1 34.1 20.3 22.6 24.2 22.3 24.2 26.4 29.6 29.5 28.8 46.0 42.1 40.9 42.1 33.0 29.5 27.8 26.8 26.4
229,298 279,688 335,201 428,593 460,195 509,487 512,437 566,260 565,642
153,503 185,684 233,902 335,387 367,494 406,857 436,520 488,229 526,330
59.9 60.1 58.9 56.1 55.6 55.6 54.0 53.7 51.8
47.0 47.8 48.7 61.3 61.6 63.1 66.3 70.3 63.0
Total Migration for Employment (No.)
Male(No.) %
Female(No.) %
AverageNo.ofMigranttravellersfor employmentperday
Migrationforemployment asa%ofalldepartures
MigrantEmploymentbyskills(%)
Professional Middlelevel Clerical&related SkilledLabour UnskilledLabour Housemaids
Migrantremittances(Rs.Mn.)
Middle-East
Other
Middle-Eastremittancesasa%of totalremittances
Totalremittancesasa%of exportearnings
(a)Revised(b)Provisional
Sources : SriLankaBureauofForeignEmployment DepartmentofImmigrationandEmigration
Migrant Employment by Skills (%) Migrant Employment by Gender (%)
0.0
20.0
40.0
60.0
80.0
100.0
2016 2017
Housemaids
Unskilled Labour
Skilled Labour
Clerical & Related
Middle level
Professional 2016 2017
Male
Female
34.0
66.0
34.4
65.6
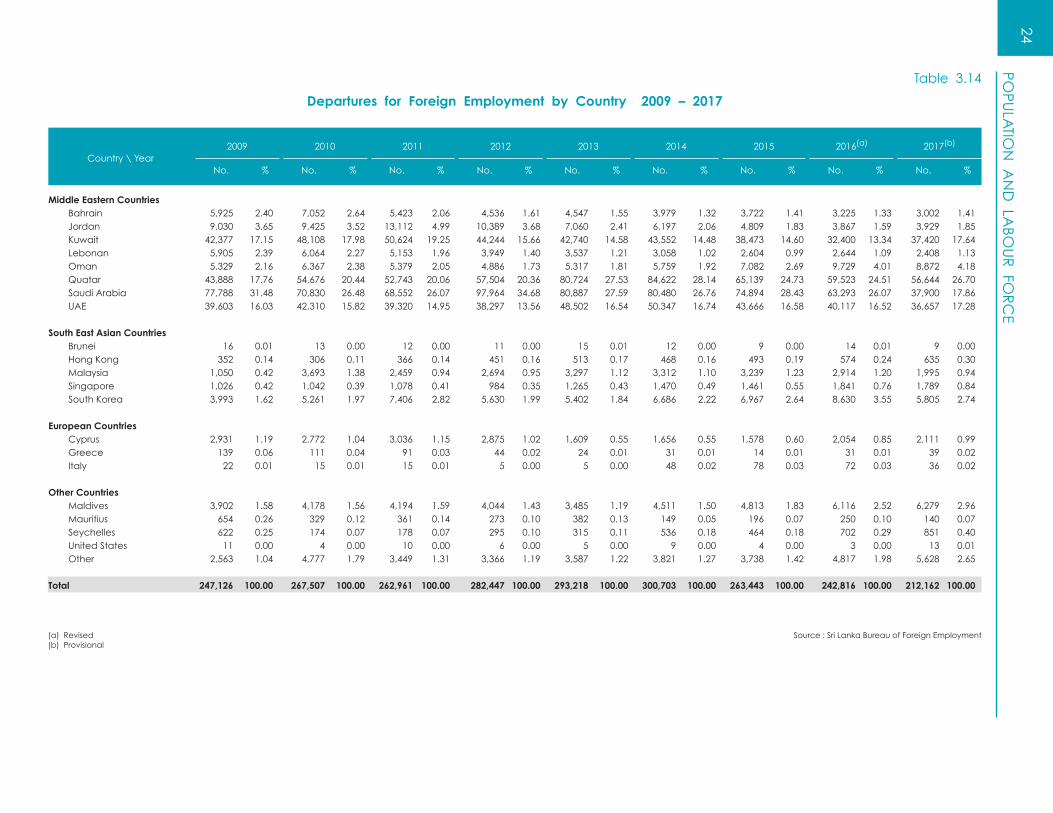
POPU
LATIO
N A
ND
LABO
UR
FOR
CE
24
Source:SriLankaBureauofForeignEmployment(a)Revised(b)Provisional
Departures for Foreign Employment by Country 2009 – 2017
Table 3.14
Country\Year2009 2010 2011 2012 2013 2014 2015 2016(a) 2017(b)
No. % No. % No. % No. % No. % No. % No. % No. % No. %
Middle Eastern Countries Bahrain Jordan Kuwait Lebonan Oman Quatar SaudiArabia UAE South East Asian Countries Brunei HongKong Malaysia Singapore SouthKorea European Countries Cyprus Greece Italy Other Countries Maldives Mauritius Seychelles UnitedStates Other Total
5,925 2.40 7,052 2.64 5,423 2.06 4,536 1.61 4,547 1.55 3,979 1.32 3,722 1.41 3,225 1.33 3,002 1.41 9,030 3.65 9,425 3.52 13,112 4.99 10,389 3.68 7,060 2.41 6,197 2.06 4,809 1.83 3,867 1.59 3,929 1.85 42,377 17.15 48,108 17.98 50,624 19.25 44,244 15.66 42,740 14.58 43,552 14.48 38,473 14.60 32,400 13.34 37,420 17.64 5,905 2.39 6,064 2.27 5,153 1.96 3,949 1.40 3,537 1.21 3,058 1.02 2,604 0.99 2,644 1.09 2,408 1.13 5,329 2.16 6,367 2.38 5,379 2.05 4,886 1.73 5,317 1.81 5,759 1.92 7,082 2.69 9,729 4.01 8,872 4.18 43,888 17.76 54,676 20.44 52,743 20.06 57,504 20.36 80,724 27.53 84,622 28.14 65,139 24.73 59,523 24.51 56,644 26.70 77,788 31.48 70,830 26.48 68,552 26.07 97,964 34.68 80,887 27.59 80,480 26.76 74,894 28.43 63,293 26.07 37,900 17.86 39,603 16.03 42,310 15.82 39,320 14.95 38,297 13.56 48,502 16.54 50,347 16.74 43,666 16.58 40,117 16.52 36,657 17.28 16 0.01 13 0.00 12 0.00 11 0.00 15 0.01 12 0.00 9 0.00 14 0.01 9 0.00 352 0.14 306 0.11 366 0.14 451 0.16 513 0.17 468 0.16 493 0.19 574 0.24 635 0.30 1,050 0.42 3,693 1.38 2,459 0.94 2,694 0.95 3,297 1.12 3,312 1.10 3,239 1.23 2,914 1.20 1,995 0.94 1,026 0.42 1,042 0.39 1,078 0.41 984 0.35 1,265 0.43 1,470 0.49 1,461 0.55 1,841 0.76 1,789 0.84 3,993 1.62 5,261 1.97 7,406 2.82 5,630 1.99 5,402 1.84 6,686 2.22 6,967 2.64 8,630 3.55 5,805 2.74 2,931 1.19 2,772 1.04 3,036 1.15 2,875 1.02 1,609 0.55 1,656 0.55 1,578 0.60 2,054 0.85 2,111 0.99 139 0.06 111 0.04 91 0.03 44 0.02 24 0.01 31 0.01 14 0.01 31 0.01 39 0.02 22 0.01 15 0.01 15 0.01 5 0.00 5 0.00 48 0.02 78 0.03 72 0.03 36 0.02 3,902 1.58 4,178 1.56 4,194 1.59 4,044 1.43 3,485 1.19 4,511 1.50 4,813 1.83 6,116 2.52 6,279 2.96 654 0.26 329 0.12 361 0.14 273 0.10 382 0.13 149 0.05 196 0.07 250 0.10 140 0.07 622 0.25 174 0.07 178 0.07 295 0.10 315 0.11 536 0.18 464 0.18 702 0.29 851 0.40 11 0.00 4 0.00 10 0.00 6 0.00 5 0.00 9 0.00 4 0.00 3 0.00 13 0.01 2,563 1.04 4,777 1.79 3,449 1.31 3,366 1.19 3,587 1.22 3,821 1.27 3,738 1.42 4,817 1.98 5,628 2.65 247,126 100.00 267,507 100.00 262,961 100.00 282,447 100.00 293,218 100.00 300,703 100.00 263,443 100.00 242,816 100.00 212,162 100.00

POPULATION AND LABOUR FORCE25
Departures for Foreign Employment by Skill Level, Age Group and Gender 2016 – 2017
Table 3.15
Year\AgeGroup Below25 25–29 30–34 35–39 40–44 45–49 Above49 Total
Departures for Professional, Middle and Clerical Level Jobs
2016(a) Male 2,597 4,738 4,830 3,810 2,587 1,905 2,241 22,708 Female 342 785 597 455 281 222 284 2,966
Total 2,939 5,523 5,427 4,265 2,868 2,127 2,525 25,674
2017(b) Male 1,840 4,230 4,189 3,369 2,369 1,751 2,111 19,859 Female 307 747 604 399 296 263 285 2,901
Total 2,147 4,977 4,793 3,768 2,665 2,014 2,396 22,760
Departures for Skilled Level Jobs
2016(a) Male 10,967 12,550 12,668 12,773 9,290 7,052 7,248 72,548 Female 1,040 780 624 612 399 264 278 3,997
Total 12,007 13,330 13,292 13,385 9,689 7,316 7,526 76,545
2017(b) Male 9,098 11,537 11,163 11,631 8,274 6,531 6,846 65,080 Female 951 732 556 607 416 325 326 3,913
Total 10,049 12,269 11,719 12,238 8,690 6,856 7,172 68,993
Departures for Semi Skilled Level Jobs
2016(a) Male 705 842 689 537 326 239 181 3,519 Female 56 88 60 68 54 44 37 407
Total 761 930 749 605 380 283 218 3,926
2017(b) Male 536 776 568 490 275 173 137 2,955 Female 43 68 66 45 41 40 37 340
Total 579 844 634 535 316 213 174 3,295
Departures for Unskilled Level Jobs
2016(a) Male 14,001 13,494 11,529 9,716 5,668 3,895 3,228 61,531 Female 838 1,138 1,364 1,700 1,712 1,665 1,708 10,125
Total 14,839 14,632 12,893 11,416 7,380 5,560 4,936 71,656
2017(b) Male 9,796 11,381 9,324 8,539 5,231 3,677 3,429 51,377 Female 764 970 1,154 1,550 1,625 1,684 1,933 9,680
Total 10,560 12,351 10,478 10,089 6,856 5,361 5,362 61,057
Departures for Housemaid Jobs (Female only)
2016(a) Total 770 5,911 9,020 12,601 12,558 12,746 11,409 65,0152017(b) Total 646 4,262 6,782 10,543 10,631 11,886 11,307 56,057
Departures for all Occupations
2016(a) Male 28,270 31,624 29,716 26,836 17,871 13,091 12,898 160,306 Female 3,046 8,702 11,665 15,436 15,004 14,941 13,716 82,510
Total 31,316 40,326 41,381 42,272 32,875 28,032 26,614 242,816
2017(b) Male 21,270 27,924 25,244 24,029 16,149 12,132 12,523 139,271 Female 2,711 6,779 9,162 13,144 13,009 14,198 13,888 72,891
Total 23,981 34,703 34,406 37,173 29,158 26,330 26,411 212,162
Departures for all Occupations as a % of Total Departures
2016(a) Male 18.5 28.3 23.4 21.5 16.5 14.5 6.5 17.6 Female 3.0 16.5 22.0 28.7 28.8 29.4 8.1 15.4
Total 12.2 24.5 23.0 23.6 20.5 19.9 7.3 16.8
2017(b) Male 14.5 25.2 20.7 19.4 15.1 13.1 6.2 15.4 Female 2.6 12.8 17.9 24.9 25.7 27.1 8.0 13.6
Total 9.6 21.2 19.9 21.1 18.5 18.2 7.0 14.7
(a)Revised(b)Provisional
Sources : SriLankaBureauofForeignEmployment
DepartmentofImmigrationandEmigration

POPU
LATIO
N A
ND
LABO
UR
FOR
CE
26
Departures for Foreign Employment by District, Province and Gender 2010 – 2017
Table 3.16
Year
Province/District
2010 2011 2012 2013 2014 2015 2016(a) 2017(b)
Male Female Male Female Male Female Male Female Male Female Male Female Male Female Male Female
Western Colombo Gampaha Kalutara
Central Kandy Matale NuwaraEliya
Southern Galle Matara Hambanthota
Northern Jaffna Kilinochchi Mannar Mullaitivu Vavuniya
Eastern Batticaloa Ampara Trincomalee
North Western Kurunegala Puttalam
North Central Anuradhapura Polonnaruwa
Uva Badulla Moneragala
Sabaragamuwa Ratnapura Kegalle
Not Indicated
Total
40,550 29,937 38,833 28,729 40,622 30,636 47,212 28,114 52,969 27,253 49,951 21,997 47,022 22,873 40,790 20,944 18,834 12,761 18,150 12,837 19,036 13,316 22,365 12,493 23,925 11,731 22,504 8,935 21,682 10,086 18,561 9,261 14,391 11,104 13,707 10,292 14,212 10,952 15,903 9,782 18,892 9,802 17,735 8,309 16,810 8,290 14,837 7,718 7,325 6,072 6,976 5,600 7,374 6,368 8,944 5,839 10,152 5,720 9,712 4,753 8,530 4,497 7,392 3,965
17,614 18,396 15,301 16,838 17,139 20,573 20,746 17,370 22,716 15,256 21,221 13,396 20,440 11,732 16,570 9,254 13,213 11,988 11,010 10,415 12,344 11,781 15,923 12,421 17,595 11,355 16,642 10,037 15,733 7,531 13,257 6,235 2,979 3,808 2,689 3,437 2,976 3,809 3,986 3,878 4,396 3,478 3,898 2,850 3,659 2,675 2,663 1,894 1,422 2,600 1,602 2,986 1,819 4,983 837 1,071 725 423 681 509 1,048 1,526 650 1,125
11,622 12,097 11,201 11,049 12,148 12,264 12,192 9,173 14,424 8,611 14,113 7,357 13,552 6,920 11,526 6,070 6,201 6,681 6,195 6,233 6,720 6,938 6,828 5,174 7,968 4,986 7,786 4,310 7,336 4,039 6,559 3,578 3,222 2,812 3,029 2,515 3,251 2,818 3,014 2,015 3,782 1,899 3,917 1,612 3,776 1,422 3,008 1,149 2,199 2,604 1,977 2,301 2,177 2,508 2,350 1,984 2,674 1,726 2,410 1,435 2,440 1,459 1,959 1,343
4,850 1,699 4,597 1,799 5,042 2,278 7,668 1,926 10,722 1,902 7,717 1,228 7,940 1,590 6,160 1,065 3,641 645 3,550 683 3,621 707 5,616 565 7,817 473 5,632 257 5875 338 4,492 348 0 0 0 0 139 198 311 101 447 85 296 83 292 70 187 43 370 267 324 299 484 355 625 375 835 366 666 382 672 684 602 258 111 28 123 49 88 72 25 15 11 0 14 0 10 2 37 24 728 759 600 768 710 946 1091 870 1,612 978 1,109 506 1,091 496 842 392
23,466 11,385 26,404 12,676 31,042 14,885 37,302 12,097 43,232 13,250 37,034 9,798 32,827 7,622 29,951 6,178 9,885 4,823 11,224 5,102 13,548 6,143 15,693 4,723 18,786 4,821 15,881 4,111 13,921 2,856 12,873 2,366 10,352 2,748 11,284 3,066 12,677 3,538 15,618 2,989 17,442 2,950 15,501 3,090 14,017 2,247 12,971 1,550 3,229 3,814 3,896 4,508 4,817 5,204 5,991 4,385 7,004 5,479 5,652 2,597 4,889 2,519 4,107 2,262
14,196 22,064 15,416 22,288 16,789 24,500 23,270 24,408 23,502 20,795 21,594 16,972 18,159 14,449 16,538 14,121 7,893 13,965 9,335 15,103 9,635 15,821 12,798 14,992 14,206 13,791 13,238 11,261 10,472 9,016 9,923 9,140 6,303 8,099 6,081 7,185 7,154 8,679 10,472 9,416 9,296 7,004 8,356 5,711 7,687 5,433 6,615 4,981
5,719 12,740 5,751 11,772 6,197 13,168 5,620 8,647 9,262 11,732 8,107 9,129 7,907 7,847 7,415 7,525 3,615 8,874 3,623 8,219 3,781 8,682 2,849 4,767 6,074 7,850 5,382 6,312 5,247 5,196 5,181 5,254 2,104 3,866 2,128 3,553 2,416 4,486 2,771 3,880 3,188 3,882 2,725 2,817 2,660 2,651 2,234 2,271
3,334 5,618 2,910 5,146 3,524 6,662 4,093 5,048 4,359 4,444 4,033 4,294 3,673 3,631 3,205 2,689 2,342 4,474 2,127 4,159 2,664 5,372 3,059 4,026 3,105 3,444 2,899 3,482 2,655 2,856 2,041 2,055 992 1,144 783 987 860 1290 1034 1,022 1,254 1,000 1,134 812 1,018 775 1,164 634
8,239 10,549 7,958 9,799 8,326 11,015 8,127 7,490 9,030 7,239 8,839 6,285 8,756 5,837 7,094 5,040 3,037 4,598 3,064 4,408 3,192 5,166 2,781 3,443 3,319 3,303 3,297 2,874 3,616 2,711 2,740 2,339 5,202 5,951 4,894 5,391 5,134 5,849 5,346 4,047 5,711 3,936 5,542 3,411 5,140 3,126 4,354 2,701
7,260 6,172 7,936 6,558 3,306 2,331 8,955 3,760 1 4 179 199 30 9 22 5
136,850 130,657 136,307 126,654 144,135 138,312 175,185 118,033 190,217 110,486 172,788 90,655 160,306 82,510 139,271 72,891
Source:SriLankaBureauofForeignEmployment(a)Revised(b)Provisional

NATIONAL ACCOUNTS27
Summary of National Accounts 2012 – 2017(a)
Table 4.1
Item 2012 2013 2014 2015(b) 2016(b)(c) 2017(b)(c)
Gross National Income (GNI), Rs. Mn.
GNIatConstant(2010)Prices
GNIatCurrentMarketPrices
Gross Domestic Product (GDP), Rs. Mn.
GDPatConstant(2010)Prices
GDPatCurrentMarketPrices
Real National Income at Constant (2010) Prices (RNI), Rs. Mn.
Economic Growth Rates (In Real Terms), %
GrowthofGDP
GrowthofGNI
GrowthofRNI
Per Capita Income, (Current Market Prices)(d)
GDPPerCapita, Rs. US$
GNIPerCapita, Rs. US$
Expenditure (Current Market Prices), Rs. Mn.
GrossDomesticExpenditure
Consumption
Investment
Savings (Current Market Prices), Rs. Mn.
DomesticSavings
NationalSavings
Net Exports of Goods and Services (Current Market Prices), Rs. Mn.
ExportofGoodsandServices
ImportofGoodsandServices
Primary Income from Rest of the World (net) (Current Market Prices), Rs. Mn.
(a) Thedataisbasedonthebaseyear2010GDPestimates(b) Revised(c) Provisional(d) Estimatesupdatedwithlatestpopulationfigures.(e) ThedifferencewiththeBOPestimatesisduetothetimelagincompilation.
Sources :DepartmentofCensusandStatistics CentralBankofSriLanka
7,453,571 7,662,004 8,049,085 8,432,998 8,795,027 9,081,177
8,577,574 9,366,039 10,125,078 10,675,880 11,585,492 12,961,010
7,588,517 7,846,202 8,235,429 8,647,833 9,034,290 9,333,217
8,732,463 9,592,125 10,361,151 10,950,621 11,906,752 13,317,292 7,342,055 7,591,186 8,020,973 8,435,489 8,847,244 9,155,229
9.1 3.4 5.0 5.0 4.5 3.3
8.3 2.8 5.1 4.8 4.3 3.3
8.2 3.4 5.7 5.2 4.9 3.5
427,538 465,976 498,828 522,304 561,560 621,026 3,351 3,609 3,821 3,842 3,857 4,073
419,955 454,993 487,462 509,200 546,408 604,412 3,291 3,524 3,734 3,746 3,753 3,964
9,768,056 10,418,678 11,197,644 11,775,486 12,781,040 14,274,635
6,357,545 7,229,352 7,850,006 8,360,930 8,616,150 9,393,491
3,410,511 3,189,326 3,347,638 3,414,556 4,164,890 4,881,144
2,374,918 2,362,773 2,511,145 2,589,690 3,290,601 3,923,801
2,908,642 2,865,365 3,088,201 3,157,031 3,909,124 4,530,476 -1,035,593 -826,553 -836,493 -824,865 -874,289 -957,343
1,730,467 1,949,158 2,185,039 2,301,065 2,540,049 2,915,178
2,766,060 2,775,711 3,021,531 3,125,931 3,414,338 3,872,521 -154,889 -226,086 -236,073 -274,740 -321,260(e) -356,282(e)

NATIONAL ACCOUNTS28
GDP, GNI and Deflators (Factor Cost Prices) 1970 – 2017
Table 4.2
GrossDomesticProduct GrossNationalIncome
Rs.Mn. Growth Rs.Mn. Growth GDP Rs.Mn. Growth Rs.Mn. Growth GNI at Rate at Rate Deflator at Rate at Rate Deflator Current % Constant % Current % Constant % Prices Prices(a) Prices Prices(a)
Adjusted Adjusted GDP GNI Deflator Deflator (1959=100)(b) (1959=100)
Year
Note:Baseyear1959seriesfrom1960to1970canbeobtainedfrompreviouspublications.
(a) ThecontinuousseriesonGDPandGNI(at1996FactorCostPrices)fortheperiod1959–2002aregiven
inTable7ofthespecialstatisticalappendixoftheCentralBank2002AnnualReport.
(b) ThecontinuousGDPdeflatorseries(1996=100)aregiveninTable2ofthespecialstatisticalappendix
oftheCentralBankAnnualReport.
(c) Figuresfrom2002onwardsarebasedontheestimatesoftheDepartmentofCensusandStatistics.
(d) Revised.
(e) Provisional.
Sources:CentralBankofSriLanka
DepartmentofCensusandStatistics
BASE YEAR 1970
1970 13,187 – 13,187 4.3 100.0 12,967 – 12,967 4.8 100.0 119.8 119.41971 13,674 3.7 13,209 0.2 103.5 13,486 4.0 13,034 0.5 103.5 124.1 123.61972 14,720 7.6 13,631 3.2 108.0 14,542 7.8 13,474 3.4 107.9 129.4 128.41973 17,920 21.7 14,138 3.7 126.8 17,737 22.0 14,016 4.0 126.3 151.9 151.11974 23,302 30.0 14,585 3.2 159.8 23,119 30.3 14,449 3.1 160.0 191.5 191.11975 25,691 10.3 14,987 2.8 171.4 25,478 10.2 14,837 2.7 171.7 205.4 205.11976 28,032 9.1 15,431 3.0 181.7 27,750 8.9 15,258 2.8 181.9 217.7 217.21977 34,684 23.7 16,078 4.2 215.7 34,432 24.1 15,934 4.4 216.1 258.5 258.11978 40,479 16.7 17,401 8.2 232.6 40,242 16.9 17,329 8.8 232.2 278.8 277.31979 49,782 23.0 18,501 6.3 269.1 49,542 23.1 18,430 6.4 268.8 322.5 321.01980 62,246 25.0 19,575 5.8 318.0 61,814 24.8 19,456 5.6 317.7 381.1 379.41981 79,337 27.5 20,706 5.8 383.2 77,625 25.6 20,257 4.1 383.2 459.2 457.71982 91,643 15.5 21,756 5.1 421.2 89,609 15.4 21,229 4.8 422.1 504.8 504.1
BASE YEAR 1982
1982 94,679 – 94,679 5.1 100.0 92,720 – 92,720 4.8 100.0 504.8 504.11983 113,878 20.3 99,375 5.0 114.6 110,664 19.4 96,439 4.0 114.8 578.5 579.51984 140,039 23.0 104,395 5.1 134.1 136,638 23.5 101,399 5.1 134.8 677.1 679.31985 148,321 5.9 109,570 5.0 135.4 144,921 6.1 106,741 5.3 135.8 683.4 684.51986 163,713 10.4 114,261 4.3 143.3 159,852 10.3 111,565 4.5 143.3 723.3 722.31987 177,731 8.6 115,922 1.5 153.3 173,395 8.5 113,307 1.6 153.0 774.0 771.51988 203,516 14.5 119,050 2.7 171.0 198,250 14.3 116,214 2.6 170.6 863.0 860.01989 228,138 12.1 121,729 2.3 187.4 222,399 12.2 118,874 2.3 187.1 946.1 943.21990 290,615 27.4 129,244 6.2 224.9 283,930 27.7 126,426 6.4 224.6 1,135.1 1,132.21991 337,399 16.1 135,204 4.6 249.6 330,032 16.2 132,214 4.6 249.6 1,259.7 1,258.41992 386,999 14.7 140,990 4.3 274.5 379,179 14.9 138,074 4.4 274.6 1,385.6 1,384.41993 453,092 17.1 150,783 6.9 300.5 447,113 17.9 148,744 7.7 300.6 1,516.9 1,515.31994 523,300 15.5 159,269 5.6 328.6 514,990 15.2 156,571 5.3 328.9 1,658.6 1,658.11995 598,327 14.3 167,953 5.5 356.2 591,369 14.8 165,897 6.0 356.5 1,798.3 1,797.01996 695,934 16.3 174,261 3.8 399.4 684,741 15.8 171,056 3.2 400.0 2,016.0 2,016.4
BASE YEAR 1996
1996 695,934 – 695,934 3.8 100.0 684,676 – 684,676 – 100.0 2,016.0 2,016.41997 803,698 15.5 739,763 6.3 108.6 794,289 16.0 730,947 6.8 108.7 2,189.4 2,191.11998 912,839 13.6 774,796 4.7 117.8 901,283 13.5 764,908 4.6 117.8 2,374.8 2,374.51999 994,730 9.0 808,340 4.3 123.0 976,899 8.4 794,340 3.8 123.1 2,481.7 2,482.72000 1,125,259 13.1 857,035 6.0 131.3 1,102,177 12.8 840,200 5.8 131.2 2,647.0 2,645.52001 1,245,599 10.7 843,794 -1.5 147.6 1,221,768 10.9 829,055 -1.3 147.4 2,975.6 2,972.2
BASE YEAR 2002
2002(c) 1,636,037 – 1,636,037 – 100.0 1,611,994 – 1,611,994 – 100.0 3,225.6 3,220.22003 1,822,468 11.4 1,733,222 5.9 105.1 1,805,933 12.0 1,717,497 6.5 105.1 3,391.7 3,386.02004 2,090,841 14.7 1,827,597 5.4 114.4 2,070,109 14.6 1,809,475 5.4 114.4 3,690.2 3,684.02005 2,452,782 17.3 1,941,671 6.2 126.3 2,422,733 17.0 1,917,884 6.0 126.3 4,074.7 4,067.92006 2,938,680 19.8 2,090,564 7.7 140.6 2,898,256 19.6 2,061,806 7.5 140.6 4,534.2 4,526.62007 3,578,688 21.8 2,232,656 6.8 160.3 3,539,634 22.1 2,208,291 7.1 160.3 5,170.2 5,161.62008 4,410,682 23.2 2,365,501 6.0 186.5 4,305,650 21.6 2,309,171 4.6 186.5 6,014.4 6,004.32009 4,835,293 9.6 2,449,214 3.5 197.4 4,779,498 11.0 2,420,952 4.8 197.4 6,368.0 6,357.4
BASE YEAR 2010
2010 6,413,668 – 6,413,668 – 100.0 6,343,892 – 6,343,892 – 100.0 6,832.8 6,821.42011 7,219,106 12.6 6,952,720 8.4 103.8 7,147,065 12.7 6,885,232 8.5 103.8 7,094.6 7,080.82012 8,732,463 21.0 7,588,517 9.1 115.1 8,577,574 20.0 7,453,571 8.3 115.1 7,862.9 7,850.12013 9,592,125 9.8 7,846,202 3.4 122.3 9,366,039 9.2 7,662,004 2.8 122.2 8,353.3 8,338.52014 10,361,151 8.0 8,235,429 5.0 125.8 10,125,078 8.1 8,049,085 5.1 125.8 8,596.5 8,580.82015(d) 10,950,621 5.7 8,647,833 5.0 126.6 10,675,880 5.4 8,432,998 4.8 126.6 8,652.3 8,635.72016(d)(e)11,906,752 8.7 9,034,290 4.5 131.8 11,585,492 8.5 8,795,027 4.3 131.7 9,005.3 8,985.7
2017(d)(e)13,317,292 11.8 9,333,217 3.3 142.7 12,961,010 11.9 9,081,177 3.3 142.7 9,749.6 9,735.8

NATIONAL ACCOUNTS29
Gross Domestic Product at Constant Prices 1970 – 2017(a)
Table 4.3
Rs.Million
Agriculture, Mining Manu- Cons- Electri- Transport, Trade Banking, Owner- Public Services GrossForestry & factu- truction city Storage& Insurance ship Adminis- (n.e.s.) Domestic
Year & Quarry- ring Gas& Communi- &Real of tration& ProductFishing ing Water cation Estate Dwellings Defence
Base Year 19701970 3,732 95 2,197 744 101 1,258 2,533 152 399 517 1,459 13,1871971 3,642 96 2,279 708 90 1,219 2,456 166 407 548 1,598 13,2091972 3,755 103 2,321 651 101 1,335 2,548 175 415 583 1,644 13,6311973 3,725 472 2,266 665 107 1,354 2,607 182 419 641 1,700 14,1381974 3,942 295 2,163 712 108 1,462 2,771 213 455 688 1,776 14,5851975 3,847 395 2,263 649 117 1,497 2,886 276 463 729 1,865 14,9871976 3,894 571 2,371 685 122 1,425 2,928 246 467 760 1,962 15,4311977 4,299 515 2,357 619 131 1,498 2,999 295 475 791 2,099 16,0781978 4,532 619 2,541 794 158 1,607 3,267 318 499 854 2,212 17,4011979 4,622 652 2,659 960 190 1,716 3,551 350 518 905 2,378 18,5011980 4,766 684 2,681 1,066 209 1,838 3,849 402 549 959 2,572 19,5751981 5,097 713 2,820 1,034 234 1,957 4,034 462 579 997 2,779 20,7061982 5,231 742 2,955 1,013 257 2,079 4,275 517 611 1,102 2,974 21,756
Base Year 19821982 24,964 2,238 13,601 7,959 1,089 10,666 19,694 3,715 3,250 2,899 4,604 94,6791983 26,212 2,413 13,710 8,039 1,161 11,281 20,738 4,130 3,315 3,786 4,590 99,3751984 26,113 2,449 15,390 8,030 1,239 12,437 22,029 4,526 3,381 4,165 4,636 104,3951985 28,366 2,486 16,193 8,070 1,313 12,959 22,925 4,975 3,432 4,432 4,419 109,5701986 29,106 2,615 17,558 8,191 1,406 13,377 23,821 5,174 3,497 5,274 4,242 114,2611987 27,409 3,112 18,748 8,338 1,448 13,538 24,496 5,490 3,550 5,435 4,358 115,9221988 27,984 3,392 19,622 8,463 1,499 13,619 25,164 5,819 3,603 5,462 4,423 119,0501989 27,666 3,576 20,488 8,514 1,526 13,883 25,588 6,168 3,650 6,140 4,530 121,7291990 30,011 3,901 22,427 8,761 1,681 14,410 26,497 6,556 3,705 6,355 4,940 129,2441991 30,570 3,511 23,949 9,033 1,800 15,534 28,556 6,831 3,761 6,304 5,355 135,2041992 30,090 3,300 26,059 9,765 1,897 16,606 30,074 7,241 3,795 6,449 5,714 140,9901993 31,554 3,693 28,806 10,400 2,125 17,287 32,584 8,023 3,841 6,642 5,828 150,7831994 32,593 3,915 31,418 11,024 2,335 17,823 34,667 8,785 3,887 6,848 5,974 159,2691995 33,659 4,048 34,294 11,564 2,573 18,803 35,906 9,707 3,938 7,218 6,243 167,9531996 32,109 4,408 36,539 11,957 2,522 20,213 37,765 10,687 3,989 7,579 6,493 174,261
Base Year 19961996 156,108 13,927 112,724 48,234 9,171 74,502 159,751 68,316 53,203 695,9341997 160,753 14,460 122,929 50,842 9,918 81,074 170,148 73,951 55,698 739,7631998 164,804 13,677 130,702 54,461 10,921 87,266 177,611 77,944 57,411 774,7961999 172,238 14,238 136,498 57,075 11,958 94,303 179,940 81,259 60,851 808,3402000 175,317 14,921 149,115 59,815 12,496 101,670 195,233 85,766 62,702 857,0352001 169,377 15,019 142,909 61,292 12,130 105,497 181,733 91,457 64,381 843,7952002 173,623 14,858 145,864 60,796 12,044 113,525 191,505 99,820 65,213 877,248
Agri- Mining Manu- Cons- Electri- Transport, Wholesale Financial Public Grossculture, & factu- truction city,Gas Storage& andRetail Services,Real Administration, Domestic
Year Forestry Quarry- ring & Commu- Trade, Estateand OtherGovt. Product& ing Water nication Hotelsand Business Services
Fishing Resturants Services andDefence
Agri- Mining Manu- Cons- Electri- Transport Whole- Hotels Banking, Owner- Govern- Private Grossculture, & factu- truction city, & sale & Insu- shipof ment Services Domestic
Year Forestry Quarry- ring Gas Commu- & Restau- rence& Dwell- Services Product& ing & nication Retail rants Real ings
Fishing Water Trade Estate
Base Year 2002(b)
2002 233,615 19,888 302,365 100,404 35,608 173,745 389,332 3,460 130,465 68,371 139,094 39,691 1,636,0372003 237,531 23,156 314,204 104,136 38,151 191,872 420,478 8,802 144,816 69,252 140,234 40,592 1,733,2222004 237,536 24,439 330,459 110,259 40,445 210,495 451,633 10,691 153,143 70,008 146,030 42,460 1,827,5972005 241,851 28,791 350,886 120,196 46,108 230,597 480,402 9,186 163,863 70,749 153,866 45,177 1,941,6712006 257,147 35,769 370,355 131,248 52,926 259,546 514,511 9,411 177,817 71,533 161,611 48,689 2,090,5642007 265,870 42,631 394,233 142,996 55,339 286,764 546,145 9,199 193,375 72,345 171,259 52,500 2,232,6562008 285,897 48,090 413,681 154,173 56,847 310,029 571,911 8,741 206,048 73,137 181,051 55,896 2,365,5012009 295,097 52,030 427,334 162,790 58,974 329,578 570,698 9,901 217,819 74,051 191,778 59,164 2,449,2142010 315,610 60,079 458,660 177,912 63,682 368,643 613,358 13,845 234,255 74,692 202,187 62,617 2,645,542
(a) ThecontinuousseriesonGDP(at1996FactorCostPrices)fortheperiod1959–2002aregiveninTable7ofthe specialstatisticalappendixoftheCentralBank2002AnnualReport.(b) Figuresfrom2002onwardsareconstantpricesbasedontheestimatesoftheDepartmentofCensusandStatistics.(c) Revised.(d)Provisional.
Base Year 2010(b)
2010 544,914 124,926 1,157,975 336,381 89,584 666,220 705,778 87,693 342,763 307,112 31,650 658,950 704,156 6,413,6682011 569,954 148,100 1,198,135 424,798 95,914 749,959 788,048 105,372 382,274 328,076 33,813 659,260 770,353 6,952,7202012 592,443 184,468 1,235,988 514,757 100,388 809,833 848,686 134,160 433,714 369,719 36,674 726,619 886,056 7,588,5172013 611,676 198,447 1,263,921 553,438 103,274 853,903 859,977 126,392 456,863 417,024 39,510 686,499 965,476 7,846,2022014 639,696 201,613 1,296,100 611,842 109,156 889,562 884,094 131,481 495,201 444,049 44,078 723,918 1,006,119 8,235,4292015(c) 669,725 191,145 1,360,977 596,697 118,906 935,581 933,216 134,017 575,798 489,352 48,917 750,036 1,027,800 8,647,8332016(c)(d) 644,262 218,587 1,403,905 645,933 130,861 986,903 956,918 139,442 643,520 520,080 52,827 786,812 1,037,514 9,034,2902017(c)(d) 639,279 240,699 1,459,140 674,035 135,955 996,151 993,501 146,431 700,556 544,728 58,204 777,519 1,072,317 9,333,217
Agri- Mining Manu- Cons- Electri- Transpor- Whole- Accom- Financial Real Informa- Public Profes- Grossculture, & factu- truction city, tation, sale modation, Services, Estate tion Adminis- sional& Domestic
Year Forestry Quarry- ring Gas, Storage, & Food Insurance including & tration, Other Product& ing Water& Postal& Retail and & Ownership Commu- Defence, Personal
Fishing Sewerage Courier Trade Beverage Reinsu- of nication Education ServicesActivities Services rance Dwelling &Human
Health
Sources :CentralBankofSriLanka DepartmentofCensus andStatistics
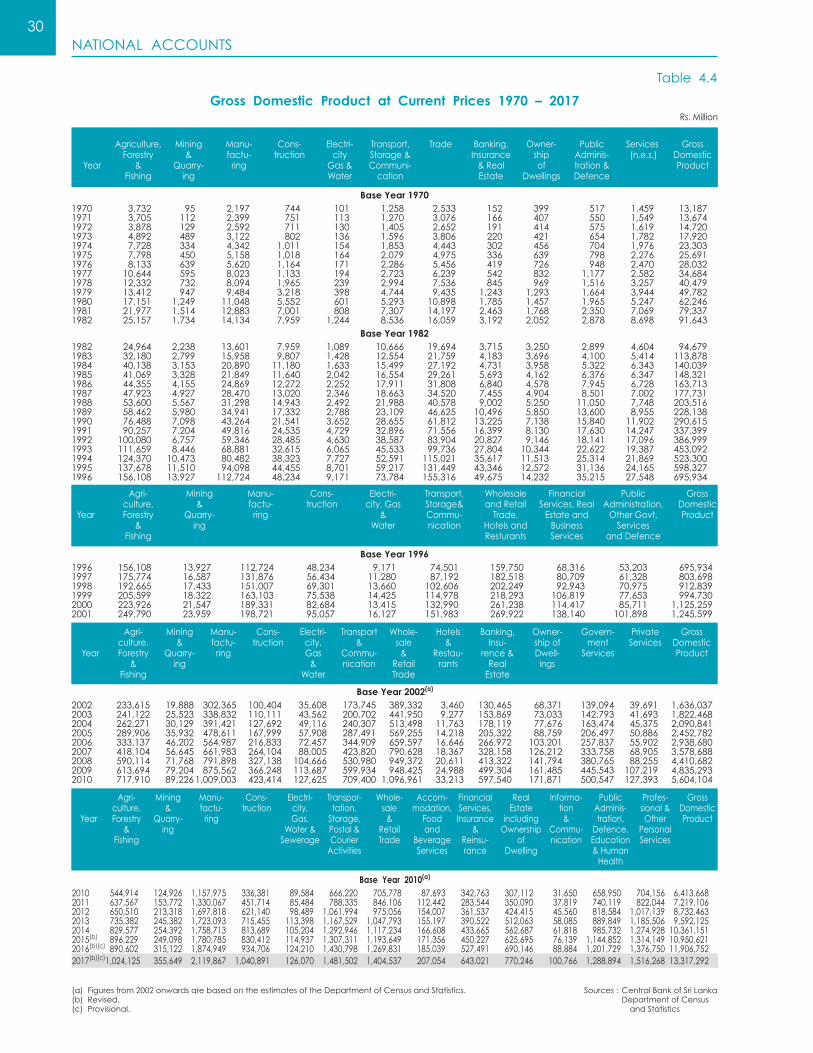
NATIONAL ACCOUNTS30
Agri- Mining Manu- Cons- Electri- Transport Whole- Hotels Banking, Owner- Govern- Private Grossculture, & factu- truction city, & sale & Insu- shipof ment Services Domestic
Year Forestry Quarry- ring Gas Commu- & Restau- rence& Dwell- Services Product& ing & nication Retail rants Real ings
Fishing Water Trade Estate
Base Year 2002(a)
2002 233,615 19,888 302,365 100,404 35,608 173,745 389,332 3,460 130,465 68,371 139,094 39,691 1,636,0372003 241,122 25,523 338,832 110,111 43,562 200,702 441,950 9,277 153,869 73,033 142,793 41,693 1,822,4682004 262,271 30,129 391,421 127,692 49,116 240,307 513,498 11,763 178,119 77,676 163,474 45,375 2,090,8412005 289,906 35,932 478,611 167,999 57,908 287,491 569,255 14,218 205,322 88,759 206,497 50,886 2,452,7822006 333,137 46,202 564,987 216,833 72,457 344,909 659,597 16,646 266,972 103,201 257,837 55,902 2,938,6802007 418,104 56,645 661,983 264,104 88,005 423,820 790,628 18,367 328,158 126,212 333,758 68,905 3,578,6882008 590,114 71,768 791,898 327,138 104,666 530,980 949,372 20,611 413,322 141,794 380,765 88,255 4,410,6822009 613,694 79,204 875,562 366,248 113,687 599,934 948,425 24,988 499,304 161,485 445,543 107,219 4,835,2932010 717,910 89,2261,009,003 423,414 127,625 709,400 1,096,961 33,213 597,540 171,871 500,547 127,393 5,604,104
Gross Domestic Product at Current Prices 1970 – 2017
Table 4.4
Rs.Million
Agriculture, Mining Manu- Cons- Electri- Transport, Trade Banking, Owner- Public Services GrossForestry & factu- truction city Storage& Insurance ship Adminis- (n.e.s.) Domestic
Year & Quarry- ring Gas& Communi- &Real of tration& ProductFishing ing Water cation Estate Dwellings Defence
Base Year 19701970 3,732 95 2,197 744 101 1,258 2,533 152 399 517 1,459 13,1871971 3,705 112 2,399 751 113 1,270 3,076 166 407 550 1,549 13,6741972 3,878 129 2,592 711 130 1,405 2,652 191 414 575 1,619 14,7201973 4,892 489 3,122 802 136 1,596 3,806 220 421 654 1,782 17,9201974 7,728 334 4,342 1,011 154 1,853 4,443 302 456 704 1,976 23,3031975 7,798 450 5,158 1,018 164 2,079 4,975 336 639 798 2,276 25,6911976 8,133 639 5,620 1,164 171 2,286 5,456 419 726 948 2,470 28,0321977 10,644 595 8,023 1,133 194 2,723 6,239 542 832 1,177 2,582 34,6841978 12,332 732 8,094 1,965 239 2,994 7,536 845 969 1,516 3,257 40,4791979 13,412 947 9,484 3,218 398 4,744 9,435 1,243 1,293 1,664 3,944 49,7821980 17,151 1,249 11,048 5,552 601 5,293 10,898 1,785 1,457 1,965 5,247 62,2461981 21,977 1,514 12,883 7,001 808 7,307 14,197 2,463 1,768 2,350 7,069 79,3371982 25,157 1,734 14,134 7,959 1,244 8,536 16,059 3,192 2,052 2,878 8,698 91,643
Base Year 19821982 24,964 2,238 13,601 7,959 1,089 10,666 19,694 3,715 3,250 2,899 4,604 94,6791983 32,180 2,799 15,958 9,807 1,428 12,554 21,759 4,183 3,696 4,100 5,414 113,8781984 40,138 3,153 20,890 11,180 1,633 15,499 27,192 4,731 3,958 5,322 6,343 140,0391985 41,069 3,328 21,849 11,640 2,042 16,554 29,261 5,693 4,162 6,376 6,347 148,3211986 44,355 4,155 24,869 12,272 2,252 17,911 31,808 6,840 4,578 7,945 6,728 163,7131987 47,923 4,927 28,470 13,020 2,346 18,663 34,520 7,455 4,904 8,501 7,002 177,7311988 53,600 5,567 31,298 14,943 2,492 21,988 40,578 9,002 5,250 11,050 7,748 203,5161989 58,462 5,980 34,941 17,332 2,788 23,109 46,625 10,496 5,850 13,600 8,955 228,1381990 76,488 7,098 43,264 21,541 3,652 28,655 61,812 13,225 7,138 15,840 11,902 290,6151991 90,257 7,204 49,816 24,535 4,729 32,896 71,556 16,399 8,130 17,630 14,247 337,3991992 100,080 6,757 59,346 28,485 4,630 38,587 83,904 20,827 9,146 18,141 17,096 386,9991993 111,659 8,446 68,881 32,615 6,065 45,533 99,736 27,804 10,344 22,622 19,387 453,0921994 124,370 10,473 80,482 38,323 7,727 52,591 115,021 35,617 11,513 25,314 21,869 523,3001995 137,678 11,510 94,098 44,455 8,701 59,217 131,449 43,346 12,572 31,136 24,165 598,3271996 156,108 13,927 112,724 48,234 9,171 73,784 155,316 49,675 14,232 35,215 27,548 695,934
Base Year 19961996 156,108 13,927 112,724 48,234 9,171 74,501 159,750 68,316 53,203 695,9341997 175,774 16,587 131,876 56,434 11,280 87,192 182,518 80,709 61,328 803,6981998 192,665 17,433 151,007 69,301 13,660 102,606 202,249 92,943 70,975 912,8391999 205,599 18,322 163,103 75,538 14,425 114,978 218,293 106,819 77,653 994,7302000 223,926 21,547 189,331 82,684 13,415 132,990 261,238 114,417 85,711 1,125,2592001 249,790 23,959 198,721 95,057 16,127 151,983 269,922 138,140 101,898 1,245,599
Agri- Mining Manu- Cons- Electri- Transport, Wholesale Financial Public Grossculture, & factu- truction city,Gas Storage& andRetail Services,Real Administration, Domestic
Year Forestry Quarry- ring & Commu- Trade, Estateand OtherGovt. Product& ing Water nication Hotelsand Business Services
Fishing Resturants Services andDefence
(a) Figuresfrom2002onwardsarebasedontheestimatesoftheDepartmentofCensusandStatistics.(b) Revised.(c) Provisional.
Base Year 2010(a)
2010 544,914 124,926 1,157,975 336,381 89,584 666,220 705,778 87,693 342,763 307,112 31,650 658,950 704,156 6,413,6682011 637,567 153,772 1,330,067 451,714 85,484 788,335 846,106 112,442 283,544 350,090 37,819 740,119 822,044 7,219,1062012 650,510 213,318 1,697,818 621,140 98,489 1,061,994 975,056 154,007 361,537 424,415 45,560 818,584 1,017,139 8,732,4632013 735,382 245,382 1,723,093 715,455 113,398 1,167,529 1,047,793 155,197 390,522 512,063 58,085 889,849 1,185,506 9,592,1252014 829,577 254,392 1,758,713 813,689 105,204 1,292,946 1,117,234 166,608 433,665 562,687 61,818 985,732 1,274,928 10,361,1512015(b) 896,229 249,098 1,780,785 830,412 114,937 1,307,311 1,193,649 171,356 450,227 625,695 76,139 1,144,852 1,314,149 10,950,6212016(b)(c) 890,602 315,122 1,874,949 934,706 124,210 1,430,798 1,269,831 185,039 527,491 690,146 88,884 1,201,729 1,376,750 11,906,7522017(b)(c)1,024,125 355,649 2,119,867 1,040,891 126,070 1,481,502 1,404,537 207,054 643,021 770,246 100,766 1,288,894 1,516,268 13,317,292
Agri- Mining Manu- Cons- Electri- Transpor- Whole- Accom- Financial Real Informa- Public Profes- Grossculture, & factu- truction city, tation, sale modation, Services, Estate tion Adminis- sional& Domestic
Year Forestry Quarry- ring Gas, Storage, & Food Insurance including & tration, Other Product& ing Water& Postal& Retail and & Ownership Commu- Defence, Personal
Fishing Sewerage Courier Trade Beverage Reinsu- of nication Education ServicesActivities Services rance Dwelling &Human
Health
Sources :CentralBankofSriLanka DepartmentofCensus andStatistics

NATIONAL ACCOUNTS31
Gross National Income by Industrial Origin at Constant (2010) Prices 2012 – 2017
(a)
Table 4.5
EconomicActivity 2012 2013 2014 2015(b) 2016(b)(c) 2017(b)(c)
Agriculture, Forestry and Fishing GrowingofCereals(exceptRice) GrowingofRice GrowingofVegetables GrowingofSugarCane,Tobaccoand OtherNon-perennialCrops GrowingofFruits GrowingofOleaginousFruits(Coconut,KingCoconut,OilPalm) GrowingofTea(GreenLeaves) GrowingofOtherBeverageCrops(Coffee,Cocoaetc.) GrowingofSpices,Aromatic,DrugandPharmaceuticalCrops GrowingofRubber GrowingofOtherPerennialCrops AnimalProduction PlantPropagationandSupportActivitiestoAgriculture ForestryandLogging MarineFishingandMarineAquaculture FreshWaterFishingandFreshWaterAquaculture
Industries MiningandQuarrying ManufactureofFood,Beverages&TobaccoProducts ManufactureofTextiles,WearingAppareland LeatherRelatedProducts ManufactureofWoodandofProductsofWoodandCork, exceptFurniture ManufactureofPaperProducts,Printingand ReproductionofMediaProducts ManufactureofCokeandRefinedPetroleumProducts ManufactureofChemicalProductsand BasicPharmaceuticalProducts ManufactureofRubberandPlasticProducts ManufactureofOtherNon-metallicMineralProducts ManufactureofBasicMetalsandFabricatedMetalProducts ManufactureofMachineryandEquipment ManufactureofFurniture OtherManufacturingandRepairand InstallationofMachineryandEquipment Electricity,Gas,SteamandAirConditioningSupply WaterCollection,TreatmentandSupply Sewerage,Waste,TreatmentandDisposalActivities Construction
Services WholesaleandRetailTrade TransportationofGoodsandPassengersincludingWarehousing PostalandCourierActivities Accommodation,FoodandBeverageServiceActivities ProgrammingandBroadcastingActivitiesandAudioVideoProductions Telecommunication ITProgrammingConsultancyandRelatedActivities FinancialServiceActivitiesandAuxiliaryFinancialServices Insurance,ReinsuranceandPensionFunding RealEstateActivities,includingOwnershipofDwelling ProfessionalServices PublicAdministrationandDefence;CompulsorySocialSecurity Education HumanHealthActivities,ResidentialCareandSocialWorkActivities OtherPersonalServiceActivities
Equals Gross Value Added (GVA) at Basic Prices
TaxesLessSubsidiesonProducts
Equals Gross Domestic Product (GDP) at Market Price
NetPrimaryIncomefromRestoftheWorld
Gross National Income at Market Price
(a)Thedataisbasedonthebaseyear2010GDPestimates(b)Revised(c)Provisional
Source :DepartmentofCensusandStatistics
592,443 611,676 639,696 669,725 644,262 639,279 12,521 14,307 13,969 14,984 13,149 11,799 62,289 65,607 61,019 76,293 52,387 50,269 51,244 54,153 55,244 56,730 58,705 49,198 2,254 2,441 2,287 1,882 2,168 1,863 38,248 37,385 40,888 48,038 46,511 49,960 62,201 53,424 64,158 67,514 66,970 53,929 72,100 74,734 73,936 72,051 63,970 67,021 1,319 1,321 1,538 1,259 1,354 1,268 44,426 50,833 57,505 60,797 62,197 62,500 44,249 37,987 28,688 25,783 23,028 24,167 15,167 14,344 15,402 16,839 16,484 16,739 29,511 36,599 47,950 51,857 55,629 57,810 9,105 9,183 9,767 10,421 10,210 10,250 38,188 43,044 47,450 48,362 52,669 64,261 97,063 103,879 105,822 104,413 105,094 103,038 12,560 12,435 14,072 12,503 13,735 15,208
2,035,601 2,119,080 2,218,711 2,267,725 2,399,285 2,509,829 184,468 198,447 201,613 191,145 218,587 240,699 507,121 507,127 513,960 528,821 527,794 535,983 244,496 264,527 276,800 282,719 287,760 304,291 23,472 25,258 23,139 27,320 31,666 31,556 24,738 24,925 24,968 27,728 30,504 33,236 28,858 27,514 28,723 29,075 31,245 29,743 75,582 81,982 82,243 83,179 86,929 89,175 83,307 82,187 71,909 76,144 88,635 96,367 87,090 81,037 78,671 75,191 67,168 72,784 24,591 26,589 24,882 28,953 36,186 39,312 30,849 30,845 32,064 38,848 45,087 48,104 63,922 67,488 82,748 94,489 97,958 102,715 41,962 44,443 55,993 68,509 72,973 75,874 75,262 76,789 80,298 85,202 92,350 94,819 10,554 10,975 11,504 12,023 12,971 13,569 14,572 15,511 17,355 21,681 25,539 27,567 514,757 553,438 611,842 596,697 645,933 674,035
4,245,461 4,405,644 4,618,501 4,894,717 5,124,016 5,289,407 848,686 859,977 884,094 933,216 956,918 993,501 805,391 849,539 885,506 931,529 982,643 991,727 4,441 4,364 4,056 4,052 4,260 4,425 134,160 126,392 131,481 134,017 139,442 146,431 2,252 2,422 2,513 2,624 2,831 3,205 26,450 27,395 30,986 34,146 36,982 41,435 7,972 9,693 10,579 12,148 13,015 13,564 364,688 386,009 420,223 493,785 554,521 606,468 69,026 70,854 74,978 82,013 88,999 94,088 369,719 417,024 444,049 489,352 520,080 544,728 155,741 161,963 166,486 154,266 152,228 158,720 385,615 382,470 402,205 430,105 452,586 430,671 167,107 157,477 173,751 159,875 171,826 172,698 173,898 146,551 147,962 160,056 162,400 174,150 730,316 803,514 839,633 873,534 885,286 913,597
6,873,506 7,136,401 7,476,908 7,832,167 8,167,563 8,438,515
715,011 709,801 758,521 815,667 866,727 894,702
7,588,517 7,846,202 8,235,429 8,647,833 9,034,290 9,333,217
-134,946 -184,198 -186,344 -214,835 -239,263 -252,040
7,453,571 7,662,004 8,049,085 8,432,998 8,795,027 9,081,177
Rs.Million

NATIONAL ACCOUNTS32
Gross National Income by Industrial Origin at Current Market Prices 2012 – 2017
(a)
Table 4.6
EconomicActivity 2012 2013 2014(b) 2015(b) 2016(b)(c) 2017(b)(c)
Agriculture, Forestry and Fishing GrowingofCereals(exceptRice) GrowingofRice GrowingofVegetables GrowingofSugarCane,Tobaccoand OtherNon-perennialCrops GrowingofFruits GrowingofOleaginousFruits(Coconut,KingCoconut,OilPalm) GrowingofTea(GreenLeaves) GrowingofOtherBeverageCrops(Coffee,Cocoaetc.) GrowingofSpices,Aromatic,DrugandPharmaceuticalCrops GrowingofRubber GrowingofOtherPerennialCrops AnimalProduction PlantPropagationandSupportActivitiestoAgriculture ForestryandLogging MarineFishingandMarineAquaculture FreshWaterFishingandFreshWaterAquaculture
Industries MiningandQuarrying ManufactureofFood,Beverages&TobaccoProducts ManufactureofTextiles,WearingAppareland LeatherRelatedProducts ManufactureofWoodandofProductsofWoodandCork, exceptFurniture ManufactureofPaperProducts,Printingand ReproductionofMediaProducts ManufactureofCokeandRefinedPetroleumProducts ManufactureofChemicalProductsand BasicPharmaceuticalProducts ManufactureofRubberandPlasticProducts ManufactureofOtherNon-metallicMineralProducts ManufactureofBasicMetalsandFabricatedMetalProducts ManufactureofMachineryandEquipment ManufactureofFurniture OtherManufacturingandRepairand InstallationofMachineryandEquipment Electricity,Gas,SteamandAirConditioningSupply WaterCollection,TreatmentandSupply Sewerage,Waste,TreatmentandDisposalActivities Construction
Services WholesaleandRetailTrade TransportationofGoodsandPassengersincludingWarehousing PostalandCourierActivities Accommodation,FoodandBeverageServiceActivities ProgrammingandBroadcastingActivitiesandAudioVideoProductions Telecommunication ITProgrammingConsultancyandRelatedActivities FinancialServiceActivitiesandAuxiliaryFinancialServices Insurance,ReinsuranceandPensionFunding RealEstateActivities,includingOwnershipofDwelling ProfessionalServices PublicAdministrationandDefence;CompulsorySocialSecurity Education HumanHealthActivities,ResidentialCareandSocialWorkActivities OtherPersonalServiceActivities
Equals Gross Value Added (GVA) at Basic Prices
TaxesLessSubsidiesonProducts
Equals Gross Domestic Product (GDP) at Market Price
NetPrimaryIncomefromRestoftheWorld
Gross National Income at Market Price
(a)Thedataisbasedonthebaseyear2010GDPestimatesoftheDepartmentofCensusandStatistics.(b)Revised(c)Provisional(d)ThedifferencewiththeBOPestimatesisduetothetimelagincompilation.
Source :DepartmentofCensusandStatistics
650,510 735,382 829,577 896,229 890,602 1,024,125 14,196 17,592 18,454 20,385 16,503 14,640 61,921 66,851 100,931 118,098 72,809 110,419 58,219 69,065 73,091 90,546 85,842 66,363 2,623 3,263 3,431 2,801 3,194 3,200 40,185 44,839 45,697 55,258 64,559 84,328 59,795 74,654 79,820 95,586 75,804 104,575 76,362 90,921 91,533 75,789 82,133 116,696 1,488 1,263 1,622 1,366 2,096 2,044 48,960 49,507 75,735 80,564 86,459 87,677 46,938 31,493 17,437 14,226 10,717 17,788 18,474 19,251 22,636 24,507 25,674 24,227 28,956 40,334 57,284 65,517 92,499 99,487 10,504 11,166 12,110 13,808 14,889 14,852 51,152 64,072 71,767 75,549 83,816 100,094 117,495 137,651 141,987 146,923 159,302 159,133 13,244 13,460 16,043 15,305 14,307 18,603
2,630,766 2,797,328 2,931,998 2,975,232 3,248,987 3,642,478 213,318 245,382 254,392 249,098 315,122 355,649 798,849 801,748 759,354 823,461 866,921 976,844 346,377 365,685 415,363 399,291 402,540 477,476 23,397 27,365 22,269 29,023 27,771 24,794 26,989 28,261 36,585 39,575 43,487 44,682 40,339 66,064 66,690 20,399 5,049 4,688 54,254 62,740 74,134 73,804 87,444 87,769 85,188 74,995 77,754 81,853 94,206 107,078 143,788 124,831 110,571 92,862 97,618 102,962 32,086 34,300 33,635 39,298 53,537 68,944 33,735 34,584 33,421 46,309 51,049 62,953 59,516 57,966 78,967 78,569 80,714 87,216 53,300 44,553 49,971 56,342 64,615 74,461 78,833 90,539 77,639 82,966 86,874 88,106 9,413 11,189 14,425 15,098 17,819 17,733 10,244 11,671 13,140 16,873 19,517 20,231 621,140 715,455 813,689 830,412 934,706 1,040,891
4,858,292 5,406,544 5,895,618 6,283,379 6,770,667 7,412,288 975,056 1,047,793 1,117,234 1,193,649 1,269,831 1,404,537 1,057,477 1,162,834 1,288,124 1,302,310 1,425,908 1,476,466 4,517 4,695 4,821 5,001 4,890 5,036 154,007 155,197 166,608 171,356 185,039 207,054 3,151 4,198 3,680 4,426 4,809 4,883 33,257 41,986 44,733 56,181 66,805 76,703 9,151 11,902 13,405 15,532 17,271 19,180 282,003 308,810 340,727 347,909 406,769 499,177 79,534 81,712 92,938 102,319 120,722 143,844 424,415 512,063 562,687 625,695 690,146 770,246 178,781 198,873 210,966 197,247 201,975 224,430 455,798 501,755 563,280 637,473 678,675 746,439 171,532 189,298 212,148 250,174 256,884 266,319 191,255 198,796 210,304 257,206 266,170 276,135 838,358 986,633 1,063,962 1,116,902 1,174,775 1,291,839
8,139,568 8,939,254 9,657,194 10,154,839 10,910,257 12,078,890
592,895 652,871 703,957 795,782 996,495 1,238,401
8,732,463 9,592,125 10,361,151 10,950,621 11,906,752 13,317,292
-154,889 -226,086 236,073 -274,740 -321,260(d) -356,282(d)
8,577,574 9,366,039 10,125,078 10,675,880 11,585,492 12,961,010
Rs.Million

NATIONAL ACCOUNTS33
Composition of Gross Domestic Product at Current Market Prices 2012 – 2017(a)
Table 4.7
RupeesMillion GrowthRates(%)
2012 2013 2014 2015(b) 2016(b)(c) 2017(b)(c) 2012 2013 2014 2015(b) 2016(b)(c)2017(b)(c)Item
Gross Domestic Product
Agriculture,Forestry&Fishing
Mining&Quarrying
Manufacturing
Construction
Electricity,Gas,WaterandSewerage
Transportation&Storage, Postal&CourierActivities
Wholesale&RetailTrade
Accommodation
FinancialServices,Insurance&Reinsurance
RealEstateincludingOwnershipofDwellings
Information&Communication
PublicAdministration,Defence, Education&HumanHealth
Professional&OtherPersonalServices
TaxeslessSubsidiesonProducts
Gross Domestic Product by Expenditure
Consumption
Government Private
GrossDomesticCapitalFormation
NetExportofGoodsandServices
ExportofGoodsandServices ImportofGoodsandServices
8,732,463 9,592,125 10,361,151 10,950,621 11,906,752 13,317,292 21.0 9.8 8.0 5.7 8.7 11.8
650,510 735,382 829,577 896,229 890,602 1,024,125 2.0 13.0 12.8 8.0 -0.6 15.0
213,318 245,382 254,392 249,098 315,122 355,649 38.7 15.0 3.7 -2.1 26.5 12.9
1,697,818 1,723,093 1,758,713 1,780,785 1,874,949 2,119,867 27.6 1.5 2.1 1.3 5.3 13.1
621,140 715,455 813,689 830,412 934,706 1,040,891 37.5 15.2 13.7 2.1 12.6 11.4
98,489 113,398 105,204 114,937 124,210 126,070 15.2 15.1 -7.2 9.3 8.1 1.5
1,061,994 1,167,529 1,292,946 1,307,311 1,430,798 1,481,502 34.7 9.9 10.7 1.1 9.4 3.5
975,056 1,047,793 1,117,234 1,193,649 1,269,831 1,404,537 15.2 7.5 6.6 6.8 6.4 10.6
154,007 155,197 166,608 171,356 185,039 207,054 37.0 0.8 7.4 2.8 8.0 11.9
361,537 390,522 433,665 450,227 527,491 643,021 27.5 8.0 11.0 3.8 17.2 21.9
424,415 512,063 562,687 625,695 690,146 770,246 21.2 20.7 9.9 11.2 10.3 11.6
45,560 58,085 61,818 76,139 88,884 100,766 20.5 27.5 6.4 23.2 16.7 13.4
818,584 889,849 985,732 1,144,852 1,201,729 1,288,894 10.6 8.7 10.8 16.1 5.0 7.3
1,017,139 1,185,506 1,274,928 1,314,149 1,376,750 1,516,268 23.7 16.6 7.5 3.1 4.8 10.1
592,895 652,871 703,957 795,782 996,495 1,238,401 2.2 10.1 7.8 13.0 25.2 24.3 8,732,463 9,592,125 10,361,151 10,950,621 11,906,752 13,317,292 21.0 9.8 8.0 5.7 8.7 11.8
6,357,545 7,229,352 7,850,006 8,360,930 8,616,150 9,393,491 10.3 13.7 8.6 6.5 3.1 9.0
665,831 745,684 868,059 984,755 1,014,746 1,130,674 7.8 12.0 16.4 13.4 3.0 11.4 5,691,714 6,483,669 6,981,947 7,376,176 7,601,405 8,262,817 10.6 13.9 7.7 5.6 3.1 8.7
3,410,511 3,189,326 3,347,638 3,414,556 4,164,890 4,881,144 41.6 -6.5 5.0 2.0 22.0 17.2 -1,035,593 -826,553 -836,493 -824,865 -874,289 -957,343 -8.8 20.2 -1.2 1.4 -6.0 -9.5
1,730,467 1,949,158 2,185,039 2,301,065 2,540,049 2,915,178 14.7 12.6 12.1 5.3 10.4 14.8 2,766,060 2,775,711 3,021,531 3,125,931 3,414,338 3,872,521 12.4 0.3 8.9 3.5 9.2 13.4
(a)Thedataisbasedonthebaseyear2010GDPestimates(b)Revised(c)Provisional
Source :DepartmentofCensusandStatistics
Consumption, Investment and National Savings (Current Prices)
0
20
40
60
80
20172013 2014 2015 2016
Pe
rce
nta
ge
of G
DP
Consumption Investment National Savings

NATIONAL ACCOUNTS34
Quarterly Estimates of GDP [at (2010) Constant Prices](a)
Table 4.9
2016(b)(c) 2017(b)(c)
1stQtr 2ndQtr 3rdQtr 4thQtr 1stQtr 2ndQtr 3rdQtr 4thQtrSector
AgricultureIndustryServicesGrossDomesticProduct(GDP)GrossNationalIncome(GNI)
AgricultureIndustryServicesGrossDomesticProduct(GDP)GrossNationalIncome(GNI)
Rs. Million
154,640 158,749 164,358 166,515 147,784 153,752 159,478 178,265 666,641 523,134 595,941 613,569 691,150 552,373 627,505 638,8011,165,176 1,272,550 1,324,877 1,361,414 1,215,419 1,307,232 1,361,395 1,405,3612,085,071 2,118,694 2,288,436 2,542,090 2,155,247 2,183,122 2,362,698 2,632,1502,027,276 2,069,844 2,231,307 2,466,601 2,092,502 2,137,125 2,303,506 2,548,043
Growth, %
-4.4 -5.6 1.4 -6.2 -4.4 -3.1 -3.0 7.1 13.9 0.7 2.4 5.6 3.7 5.6 5.3 4.1 3.3 3.3 5.7 6.2 4.3 2.7 2.8 3.2 5.9 1.9 4.5 5.4 3.4 3.0 3.2 3.5 5.9 1.4 4.3 5.5 3.2 3.3 3.2 3.3
(a)Thedataisbasedonthebaseyear2010GDPestimates.(b)Revised(c)Provisional
Source :DepartmentofCensusandStatistics
Investment and Savings (Current Market Prices) 2014 – 2017(a)
Table 4.8
Item 2014 2015(b) 2016(b)(c) 2017(b)(c)
GrossDomesticProduct(GDP)
Consumption Investment
NetExportofGoods&Services
DomesticSavings(GDP–Consumption)
NetPrimaryIncomefromRestoftheWorld
NetCurrentTransfersfromRestoftheWorld
NationalSavings
NationalSavings–InvestmentGap
Financing the Gap
CapitalTransfers
FinancialAccount
FinancialAccount–Assets
DirectInvestment PortfolioInvestment OtherInvestment ReserveAssets
FinancialAccount–Liabilities
DirectInvestment PortfolioInvestment OtherInvestment
ErrorsandOmissions
InvestmentDomesticSavingsNationalSavingsNationalSavings–InvestmentGap
10,361,151 10,950,621 11,906,752 13,317,292
7,850,006 8,360,930 8,616,150 9,393,491 3,347,638 3,414,556 4,164,890 4,881,144
-836,493 -824,865 -874,289 -957,343
2,511,145 2,589,690 3,290,601 3,923,801
-236,073 -274,740 -321,260(d) -356,282(d)
813,128 842,082 939,782 962,957(d)
3,088,201 3,157,031 3,909,124 4,530,475
-259,437 -257,524 -255,767 -350,668
-259,436 -257,524 -254,159 -350,695
7,684 6,256 3,745 1,667
-200,261 -346,198 -317,181 -336,145
338,335 121,053 7,128 448,927
8,725 7,199 34,476 8,162 -29 3 -1 -12 127,197 70,962 38,245 16,297 202,442 42,890 65,593 424,480
538,595 467,252 324,309 785,072
116,721 93,528 131,839 210,361 269,768 101,935 144,665 271,168 152,107 271,788 47,806 303,543 51,492 94,930 66,767 12,883
GDP (%)
32.3 31.2 35.0 36.7 24.2 23.6 27.6 29.5 29.8 28.8 32.8 34.0 -2.5 -2.4 -2.1 -2.6
(a)Thedataisbasedonthebaseyear2010GDPestimates.
(b)Revised
(c)Provisional
(d)ThedifferencewiththeBOPestimatesisduetothetimelagincompilation.
Sources :DepartmentofCensusandStatistics CentralBankofSriLanka
Rs.Million

NATIONAL ACCOUNTS35
Aggregate Demand(a)
Table 4.10
CurrentMarketPrices(Rs.Mn.) Constant(2010)Prices(Rs.Mn.)
2015(b) 2016(b)(c) 2017(b)(c) 2015(b) 2016(b)(c) 2017(b)(c)Item
(a) Thedataisbasedonthebaseyear2010GDPestimates.(b) Revised(c) Provisional
Sources :DepartmentofCensusandStatistics CentralBankofSriLanka
A. Domestic Demand
Consumption
(%Change)
GrossDomesticCapitalFormation
(%Change) Total Domestic Demand (% Change)
B. External Demand
ExportsofGoodsandServices
(%Change)
ImportsofGoodsandServices
(%Change)
Net External Demand (% Change)
C. Total Demand (% Change)
8,360,930 8,616,150 9,393,491 6,584,691 6,369,395 6,405,552
6.5 3.1 9.0 7.8 -3.3 0.6
3,414,556 4,164,890 4,881,144 3,006,450 3,821,310 4,496,122
2.0 22.0 17.2 3.8 27.1 17.7 11,775,486 12,781,040 14,274,635 9,591,141 10,190,705 10,901,674 5.2 8.5 11.7 6.5 6.3 7.0
2,301,065 2,540,049 2,915,178 1,605,147 1,593,234 1,712,567
5.3 10.4 14.8 4.7 -0.7 7.5
3,125,931 3,414,338 3,872,521 2,548,455 2,749,649 3,281,024
3.5 9.2 13.4 10.6 7.9 19.3
-824,865 -874,289 -957,343 -943,307 -1,156,414 -1,568,457 1.4 -6.0 -9.5 -22.4 -22.6 -35.6
10,950,621 11,906,752 13,317,292 8,647,833 9,034,290 9,333,217 5.7 8.7 11.8 5.0 4.5 3.3
Composition of Expenditure (Constant Prices)
0.0
2.0
3.0
4.0
5.0
-3,000,000
3,000,000
6,000,000
9,000,000
2015 2016 2017
Gro
wth
in T
ota
l De
ma
nd
(%
)
Rs.
Mill
ion
Domestic Demand External Demand
Total Demand GDP Growth
6.0
1.0
12,000,000
0
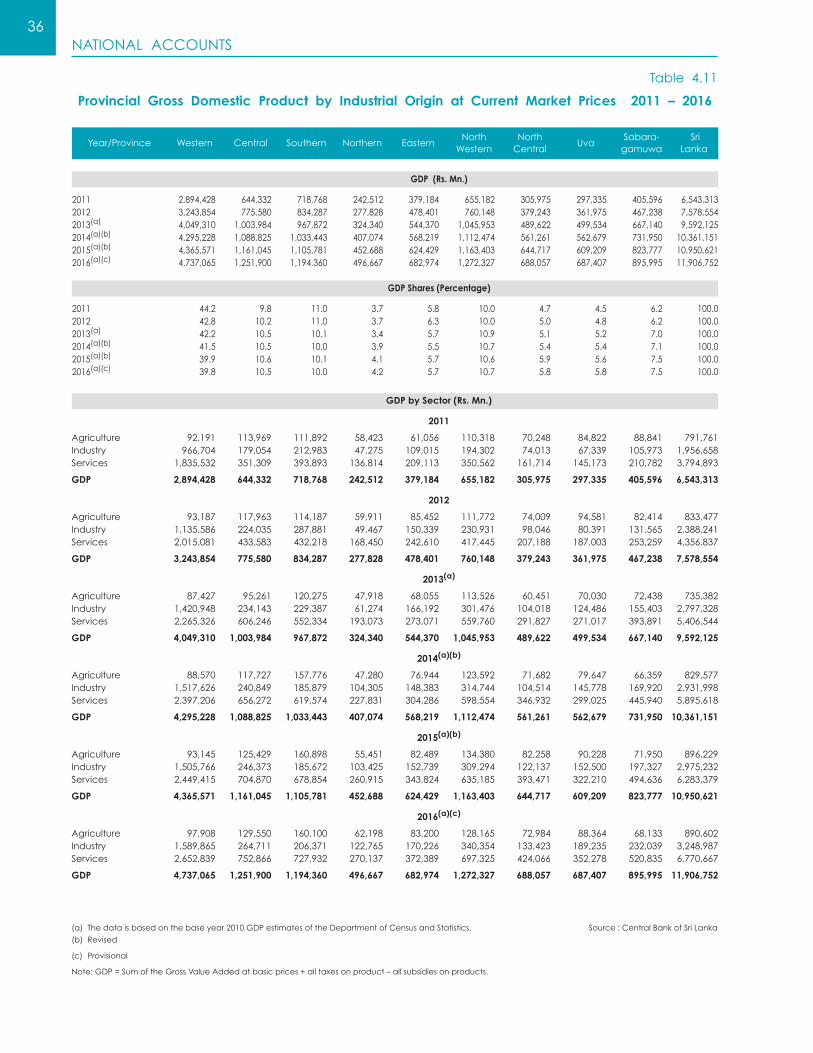
NATIONAL ACCOUNTS36
Provincial Gross Domestic Product by Industrial Origin at Current Market Prices 2011 – 2016
Table 4.11
Year/Province Western Central Southern Northern EasternNorth
WesternNorthCentral
UvaSabara-gamuwa
SriLanka
GDP (Rs. Mn.)
2011 2,894,428 644,332 718,768 242,512 379,184 655,182 305,975 297,335 405,596 6,543,3132012 3,243,854 775,580 834,287 277,828 478,401 760,148 379,243 361,975 467,238 7,578,5542013(a) 4,049,310 1,003,984 967,872 324,340 544,370 1,045,953 489,622 499,534 667,140 9,592,1252014(a)(b) 4,295,228 1,088,825 1,033,443 407,074 568,219 1,112,474 561,261 562,679 731,950 10,361,1512015(a)(b) 4,365,571 1,161,045 1,105,781 452,688 624,429 1,163,403 644,717 609,209 823,777 10,950,6212016(a)(c) 4,737,065 1,251,900 1,194,360 496,667 682,974 1,272,327 688,057 687,407 895,995 11,906,752
GDP Shares (Percentage)
2011 44.2 9.8 11.0 3.7 5.8 10.0 4.7 4.5 6.2 100.02012 42.8 10.2 11.0 3.7 6.3 10.0 5.0 4.8 6.2 100.02013(a) 42.2 10.5 10.1 3.4 5.7 10.9 5.1 5.2 7.0 100.02014(a)(b) 41.5 10.5 10.0 3.9 5.5 10.7 5.4 5.4 7.1 100.02015(a)(b) 39.9 10.6 10.1 4.1 5.7 10.6 5.9 5.6 7.5 100.02016(a)(c) 39.8 10.5 10.0 4.2 5.7 10.7 5.8 5.8 7.5 100.0
AgricultureIndustryServices
GDP
AgricultureIndustryServices
GDP
AgricultureIndustryServices
GDP
AgricultureIndustryServices
GDP
AgricultureIndustryServices
GDP
AgricultureIndustryServices
GDP
GDP by Sector (Rs. Mn.)
2011
92,191 113,969 111,892 58,423 61,056 110,318 70,248 84,822 88,841 791,761 966,704 179,054 212,983 47,275 109,015 194,302 74,013 67,339 105,973 1,956,658 1,835,532 351,309 393,893 136,814 209,113 350,562 161,714 145,173 210,782 3,794,893
2,894,428 644,332 718,768 242,512 379,184 655,182 305,975 297,335 405,596 6,543,313
2012
93,187 117,963 114,187 59,911 85,452 111,772 74,009 94,581 82,414 833,477 1,135,586 224,035 287,881 49,467 150,339 230,931 98,046 80,391 131,565 2,388,241 2,015,081 433,583 432,218 168,450 242,610 417,445 207,188 187,003 253,259 4,356,837
3,243,854 775,580 834,287 277,828 478,401 760,148 379,243 361,975 467,238 7,578,554
2013(a)
87,427 95,261 120,275 47,918 68,055 113,526 60,451 70,030 72,438 735,382 1,420,948 234,143 229,387 61,274 166,192 301,476 104,018 124,486 155,403 2,797,328 2,265,326 606,246 552,334 193,073 273,071 559,760 291,827 271,017 393,891 5,406,544
4,049,310 1,003,984 967,872 324,340 544,370 1,045,953 489,622 499,534 667,140 9,592,125
2014(a)(b)
88,570 117,727 157,776 47,280 76,944 123,592 71,682 79,647 66,359 829,577 1,517,626 240,849 185,879 104,305 148,383 314,744 104,514 145,778 169,920 2,931,998 2,397,206 656,272 619,574 227,831 304,286 598,554 346,932 299,025 445,940 5,895,618
4,295,228 1,088,825 1,033,443 407,074 568,219 1,112,474 561,261 562,679 731,950 10,361,151
2015(a)(b)
93,145 125,429 160,898 55,451 82,489 134,380 82,258 90,228 71,950 896,229 1,505,766 246,373 185,672 103,425 152,739 309,294 122,137 152,500 197,327 2,975,232 2,449,415 704,870 678,854 260,915 343,824 635,185 393,471 322,210 494,636 6,283,379
4,365,571 1,161,045 1,105,781 452,688 624,429 1,163,403 644,717 609,209 823,777 10,950,621
2016(a)(c)
97,908 129,550 160,100 62,198 83,200 128,165 72,984 88,364 68,133 890,602 1,589,865 264,711 206,371 122,765 170,226 340,354 133,423 189,235 232,039 3,248,987 2,652,839 752,866 727,932 270,137 372,389 697,325 424,066 352,278 520,835 6,770,667
4,737,065 1,251,900 1,194,360 496,667 682,974 1,272,327 688,057 687,407 895,995 11,906,752
(a) Thedataisbasedonthebaseyear2010GDPestimatesoftheDepartmentofCensusandStatistics.
(b) Revised
(c) Provisional
Note:GDP=SumoftheGrossValueAddedatbasicprices+alltaxesonproduct–allsubsidiesonproducts.
Source :CentralBankofSriLanka

NATIONAL ACCOUNTS37
Provincial Gross Domestic Product by Industrial Origin at Current Market Prices – 2015(a)(b)
Table 4.12
MajorDivision\Province Western Central Southern Northern EasternNorth
WesternNorthCentral
UvaSabara-gamuwa
Sri Lanka
Agriculture, Forestry and Fishing
GrowingofCereals(exceptrice) GrowingofRice GrowingofVegetables GrowingofSugarCane,Tobacco andOtherNon-PerennialCrops GrowingofFruits GrowingofOleaginousFruits (Coconut,Kingcoconut,OilPalm) GrowingofTea(GreenLeaves) GrowingofOtherBeverageCrops (Coffee,Cocoaetc.) GrowingofSpices,Aromatic,Drug andPharmaceuticalCrops GrowingofRubber GrowingofOtherPerennialCrops AnimalProduction PlantPropagationandSupportActivities toAgriculture ForestryandLogging MarineFishingandMarineAquaculture FreshWaterFishingand FreshWaterAquaculture
Industry
MiningandQuarrying ManufactureofFood,Beveragesand
TobaccoProducts ManufactureofTextiles,WearingAppareland
LeatherRelatedProducts ManufactureofWoodandofProductsof
WoodandCork,ExceptFurniture ManufactureofPaperProducts,Printingand
ReproductionofMediaProducts ManufactureofCokeand RefinedPetroleumProducts ManufactureofChemicalProductsand BasicPharmaceuticalProducts ManufactureofRubberandPlasticProducts ManufactureofOtherNon-Metallic MineralProducts ManufactureofBasicMetalsand FabricatedMetalProducts ManufactureofMachineryandEquipment ManufactureofFurniture OtherManufacturingandRepairand
InstallationofMachineryandEquipment Electricity,Gas,Steamand AirConditioningSupply WaterCollection,TreatmentandSupply Sewerage,Waste,Treatmentand DisposalActivities Construction
93,145 125,429 160,898 55,451 82,489 134,380 82,258 90,228 71,950 896,229
0 880 1,022 3,120 2,113 1,824 5,109 6,032 284 20,385 3,212 4,810 11,883 12,268 26,237 15,022 32,512 9,066 3,087 118,098 4,228 31,056 6,889 6,665 4,296 7,747 5,949 19,570 4,147 90,546
0 152 0 540 148 59 20 1,881 0 2,801 12,008 3,612 8,699 2,674 2,649 10,131 3,028 6,907 5,550 55,258
16,488 6,146 14,353 2,473 3,854 34,676 7,194 3,162 7,241 95,586 4,584 25,545 21,709 0 0 0 0 6,022 17,928 75,789
110 776 37 0 0 62 0 166 213 1,366
4,497 19,264 21,873 1,199 541 3,558 2,417 13,405 13,809 80,564 5,851 917 1,000 0 0 414 0 518 5,526 14,226 4,567 2,922 4,661 519 432 5,556 809 664 4,377 24,507 6,748 6,534 4,044 7,536 9,979 16,714 7,849 4,245 1,868 65,517
1,334 2,198 2,060 792 1,076 2,051 1,390 1,534 1,372 13,808 3,164 20,132 4,197 966 5,289 9,678 11,610 14,777 5,736 75,549 25,946 0 57,558 16,201 23,427 23,791 0 0 0 146,923
408 486 910 499 2,447 3,096 4,371 2,277 810 15,305
1,505,766 246,373 185,672 103,425 152,739 309,294 122,137 152,500 197,327 2,975,232
56,279 34,247 8,607 11,390 16,107 24,432 38,361 27,705 31,970 249,098
429,944 61,946 55,204 13,952 44,315 52,729 13,944 76,840 74,586 823,461
225,645 30,519 23,361 4,793 1,782 80,637 10,258 3,898 18,399 399,291
17,844 4,060 1,072 348 611 2,986 137 814 1,151 29,023
36,855 311 228 1,851 29 160 16 1 123 39,575
20,399 0 0 0 0 0 0 0 0 20,399
67,356 1,961 1,212 260 25 2,335 15 75 566 73,804 66,761 827 3,638 1 0 2,430 405 147 7,644 81,853
44,190 2,338 5,642 69 6,040 29,973 599 297 3,713 92,862
30,913 1,800 112 477 398 5,160 98 43 296 39,298 45,333 364 94 0 0 361 81 0 77 46,309 64,610 2,562 3,038 399 681 5,760 236 274 1,008 78,569
50,602 1,832 800 205 456 286 108 211 1,842 56,342
21,983 26,754 1,507 1,219 790 25,340 621 836 3,917 82,966 9,317 1,215 1,710 79 789 371 661 431 526 15,098
4,812 2,139 2,057 880 1,300 1,970 1,056 1,059 1,600 16,873 312,923 73,499 77,390 67,501 79,415 74,364 55,541 39,868 49,909 830,412
Rs.Million
(Contd.)

NATIONAL ACCOUNTS38
Provincial Gross Domestic Product by Industrial Origin at Current Market Prices – 2015(a)(b)
Table 4.12 (Contd.)
MajorDivision\Province Western Central Southern Northern EasternNorth
WesternNorthCentral
UvaSabara-gamuwa
SriLanka
Services
WholesaleandRetailTrade TransportationofGoodsandPassengers
includingWarehousing PostalandCourierActivities Accommodation,FoodandBeverageService
Activities ProgrammingandBroadcastingActivitiesand
AudioVideoProductions Telecommunication ITProgrammingConsultancyandRelated
Activities FinancialServiceActivitiesandAuxiliary
FinancialServices Insurance,ReinsuranceandPensionFunding RealEstateActivities,includingOwnershipof
Dwelling ProfessionalServices PublicAdministrationandDefence;
CompulsorySocialSecurity Education HumanHealthActivities,ResidentialCareand
SocialWorkActivities OtherPersonalServiceActivities
Gross Value Added, at Basic Prices
Taxes Less Subsidies on Products
Gross Domestic Product (GDP), at Current Market Prices
Percent of GDP Contribution
Per capita GDP by Current Market Prices (Rs.)(c)
2,449,415 704,870 678,854 260,915 343,824 635,185 393,471 322,210 494,636 6,283,379
363,259 127,275 135,358 53,419 88,291 144,869 104,145 67,915 109,117 1,193,649
540,075 134,073 136,814 50,871 56,142 133,469 71,920 67,830 111,116 1,302,310 1,589 683 610 311 271 492 311 320 415 5,001
73,567 27,826 33,967 5,756 4,482 1,145 10,667 12,228 1,718 171,356
1,262 561 540 231 341 517 277 278 420 4,426 12,448 6,292 5,728 5,375 4,117 6,170 5,934 4,833 5,285 56,181
10,061 977 647 748 438 1,737 320 72 532 15,532
243,692 21,639 19,411 9,480 7,606 17,864 8,834 7,179 12,204 347,909 69,783 5,956 6,159 2,516 2,419 6,043 3,588 2,781 3,074 102,319
311,791 69,975 64,328 11,170 21,651 54,241 25,562 23,162 43,815 625,695 82,194 25,886 17,638 9,603 11,303 15,890 8,547 9,092 17,094 197,247
177,399 91,689 68,308 37,426 53,321 65,059 53,164 40,463 50,645 637,473 72,445 32,346 28,031 15,170 18,686 28,554 15,107 17,183 22,652 250,174
96,323 26,824 27,303 12,971 16,450 27,416 13,708 15,250 20,961 257,206 393,529 132,869 134,013 45,869 58,306 131,718 71,385 53,624 95,589 1,116,902
4,048,325 1,076,672 1,025,424 419,792 579,052 1,078,859 597,865 564,937 763,913 10,154,839
317,246 84,373 80,357 32,897 45,377 84,545 46,852 44,271 59,864 795,782
4,365,571 1,161,045 1,105,781 452,688 624,429 1,163,403 644,717 609,209 823,777 10,950,621
39.9 10.6 10.1 4.1 5.7 10.6 5.9 5.6 7.5 100.0
730,151 436,812 432,622 413,792 386,643 475,246 491,400 462,925 414,375 522,304
(a) Thedataisbasedonthebaseyear2010GDPestimatesoftheDepartmentofCensusandStatistics.
(b) Revised.
(c) Estimatesasperthelatestpopulationfigures.
Source :CentralBankofSriLanka
Rs.Million
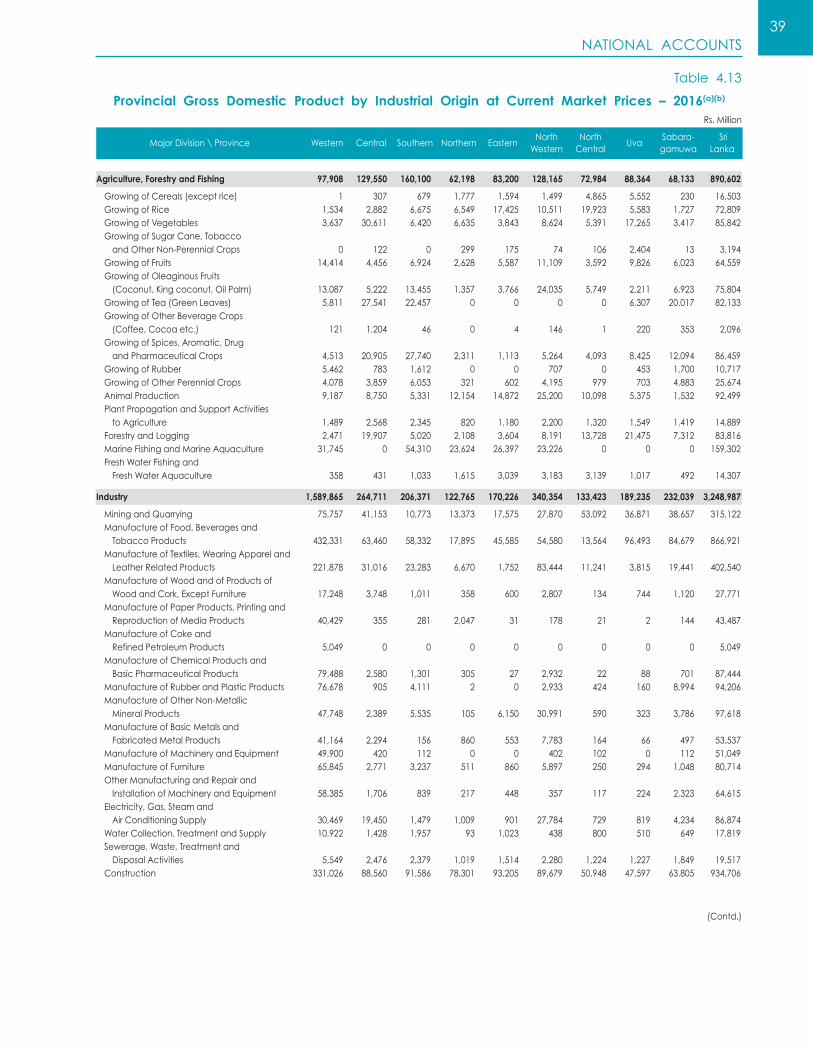
NATIONAL ACCOUNTS39
Provincial Gross Domestic Product by Industrial Origin at Current Market Prices – 2016(a)(b)
Table 4.13
MajorDivision\Province Western Central Southern Northern EasternNorth
WesternNorthCentral
UvaSabara-gamuwa
SriLanka
Agriculture, Forestry and Fishing
GrowingofCereals(exceptrice) GrowingofRice GrowingofVegetables GrowingofSugarCane,Tobacco andOtherNon-PerennialCrops GrowingofFruits GrowingofOleaginousFruits (Coconut,Kingcoconut,OilPalm) GrowingofTea(GreenLeaves) GrowingofOtherBeverageCrops (Coffee,Cocoaetc.) GrowingofSpices,Aromatic,Drug andPharmaceuticalCrops GrowingofRubber GrowingofOtherPerennialCrops AnimalProduction PlantPropagationandSupportActivities toAgriculture ForestryandLogging MarineFishingandMarineAquaculture FreshWaterFishingand FreshWaterAquaculture
Industry
MiningandQuarrying ManufactureofFood,Beveragesand
TobaccoProducts ManufactureofTextiles,WearingAppareland
LeatherRelatedProducts ManufactureofWoodandofProductsof
WoodandCork,ExceptFurniture ManufactureofPaperProducts,Printingand
ReproductionofMediaProducts ManufactureofCokeand RefinedPetroleumProducts ManufactureofChemicalProductsand BasicPharmaceuticalProducts ManufactureofRubberandPlasticProducts ManufactureofOtherNon-Metallic MineralProducts ManufactureofBasicMetalsand FabricatedMetalProducts ManufactureofMachineryandEquipment ManufactureofFurniture OtherManufacturingandRepairand
InstallationofMachineryandEquipment Electricity,Gas,Steamand AirConditioningSupply WaterCollection,TreatmentandSupply Sewerage,Waste,Treatmentand DisposalActivities Construction
97,908 129,550 160,100 62,198 83,200 128,165 72,984 88,364 68,133 890,602
1 307 679 1,777 1,594 1,499 4,865 5,552 230 16,503 1,534 2,882 6,675 6,549 17,425 10,511 19,923 5,583 1,727 72,809 3,637 30,611 6,420 6,635 3,843 8,624 5,391 17,265 3,417 85,842
0 122 0 299 175 74 106 2,404 13 3,194 14,414 4,456 6,924 2,628 5,587 11,109 3,592 9,826 6,023 64,559
13,087 5,222 13,455 1,357 3,766 24,035 5,749 2,211 6,923 75,804 5,811 27,541 22,457 0 0 0 0 6,307 20,017 82,133
121 1,204 46 0 4 146 1 220 353 2,096
4,513 20,905 27,740 2,311 1,113 5,264 4,093 8,425 12,094 86,459 5,462 783 1,612 0 0 707 0 453 1,700 10,717 4,078 3,859 6,053 321 602 4,195 979 703 4,883 25,674 9,187 8,750 5,331 12,154 14,872 25,200 10,098 5,375 1,532 92,499
1,489 2,568 2,345 820 1,180 2,200 1,320 1,549 1,419 14,889 2,471 19,907 5,020 2,108 3,604 8,191 13,728 21,475 7,312 83,816 31,745 0 54,310 23,624 26,397 23,226 0 0 0 159,302
358 431 1,033 1,615 3,039 3,183 3,139 1,017 492 14,307
1,589,865 264,711 206,371 122,765 170,226 340,354 133,423 189,235 232,039 3,248,987
75,757 41,153 10,773 13,373 17,575 27,870 53,092 36,871 38,657 315,122
432,331 63,460 58,332 17,895 45,585 54,580 13,564 96,493 84,679 866,921
221,878 31,016 23,283 6,670 1,752 83,444 11,241 3,815 19,441 402,540
17,248 3,748 1,011 358 600 2,807 134 744 1,120 27,771
40,429 355 281 2,047 31 178 21 2 144 43,487
5,049 0 0 0 0 0 0 0 0 5,049
79,488 2,580 1,301 305 27 2,932 22 88 701 87,444 76,678 905 4,111 2 0 2,933 424 160 8,994 94,206
47,748 2,389 5,535 105 6,150 30,991 590 323 3,786 97,618
41,164 2,294 156 860 553 7,783 164 66 497 53,537 49,900 420 112 0 0 402 102 0 112 51,049 65,845 2,771 3,237 511 860 5,897 250 294 1,048 80,714
58,385 1,706 839 217 448 357 117 224 2,323 64,615
30,469 19,450 1,479 1,009 901 27,784 729 819 4,234 86,874 10,922 1,428 1,957 93 1,023 438 800 510 649 17,819
5,549 2,476 2,379 1,019 1,514 2,280 1,224 1,227 1,849 19,517 331,026 88,560 91,586 78,301 93,205 89,679 50,948 47,597 63,805 934,706
Rs.Million
(Contd.)

NATIONAL ACCOUNTS40
Provincial Gross Domestic Product by Industrial Origin at Current Market Prices – 2016(a)(b)
Table 4.13 (Contd.)
MajorDivision\Province Western Central Southern Northern EasternNorth
WesternNorthCentral
UvaSabara-gamuwa
SriLanka
Services
WholesaleandRetailTrade TransportationofGoodsandPassengers
includingWarehousing PostalandCourierActivities Accommodation,FoodandBeverageService
Activities ProgrammingandBroadcastingActivitiesand
AudioVideoProductions Telecommunication ITProgrammingConsultancyandRelated
Activities FinancialServiceActivitiesandAuxiliary
FinancialServices Insurance,ReinsuranceandPensionFunding RealEstateActivities,includingOwnershipof
Dwelling ProfessionalServices PublicAdministrationandDefence;
CompulsorySocialSecurity Education HumanHealthActivities,ResidentialCareand
SocialWorkActivities OtherPersonalServiceActivities
Gross Value Added, at Basic Prices
Taxes Less Subsidies on Products
Gross Domestic Product (GDP), at Current Market Prices
Percent of GDP Contribution
Per capita GDP by Current Market Prices (Rs.)(c)
2,652,839 752,866 727,932 270,137 372,389 697,325 424,066 352,278 520,835 6,770,667
379,771 138,679 145,392 54,546 91,693 155,631 110,758 77,698 115,662 1,269,831
588,814 153,671 146,530 51,612 66,239 151,474 78,195 74,937 114,437 1,425,908 1,572 650 598 305 266 481 301 316 401 4,890
76,261 30,036 38,258 6,700 5,003 1,247 12,011 13,654 1,870 185,039
1,367 610 586 251 373 562 302 302 456 4,809 14,846 7,514 6,837 6,434 4,926 7,333 7,046 5,555 6,314 66,805
12,523 871 577 667 391 1,419 285 64 474 17,271
282,903 25,448 22,704 11,548 9,499 21,113 10,878 8,681 13,996 406,769 83,587 6,719 7,151 2,954 2,668 7,042 3,966 2,963 3,671 120,722
343,220 77,322 71,006 12,341 24,079 59,924 28,293 25,616 48,345 690,146 82,272 28,184 14,329 10,841 12,158 18,737 9,259 9,056 17,139 201,975
197,040 83,731 74,789 34,695 58,843 76,549 55,923 44,273 52,833 678,675 74,004 32,184 29,961 15,543 17,942 29,518 17,626 16,824 23,282 256,884
100,711 27,486 28,236 13,317 16,865 27,956 14,140 15,782 21,677 266,170 413,948 139,762 140,978 48,383 61,445 138,340 75,083 56,558 100,277 1,174,775
4,340,612 1,147,127 1,094,402 455,100 625,815 1,165,844 630,473 629,877 821,007 10,910,257
396,452 104,773 99,958 41,567 57,159 106,483 57,585 57,530 74,987 996,495
4,737,065 1,251,900 1,194,360 496,667 682,974 1,272,327 688,057 687,407 895,995 11,906,752
39.8 10.5 10.0 4.2 5.7 10.7 5.8 5.8 7.5 100.0
785,844 465,390 462,214 448,660 415,182 513,656 517,336 515,684 445,990 561,560
(a) Thedataisbasedonthebaseyear2010GDPestimatesoftheDepartmentofCensusandStatistics.
(b) Provisional
(c) Estimatesasperthelatestpopulationfigures.
Source :CentralBankofSriLanka
Rs.Million

AGRICULTURE41
Tea 2008 – 2017
Table 5.1
(a) Provisional(b) ExtentswasrevisedbasedonthecensusconductedbytheDCSin2005,incollaborationwithTeaSmall
HoldingsDevelopmentAuthority.(c) RegisteredintheTeaCommissioners’Division.(d) ClassificationofvalueaddedteaisonthebasisofSriLankaTeaBoardclassificationappliedin2011and
adjustedbackwards.Thesameapproachisappliedtothebulkteaclassification. Bags:lessthan4g,Packets:4g–10kg,Bulk:morethan10kg.(e) EstimatedDomesticConsumptioncalculatedbasedontheHouseholdIncomeandExpenditureSurveys
conductedbyDepartmentofCensusandStatistics.n.a.–Notavailable
Sources:SriLankaTeaBoard TheColomboTeaBrokers’Association SriLankaCustoms CentralBankofSriLanka
Area,'000Hectares(b)
ReplantedArea,Hectares(b)
FertiliserIssues(wholesale),MT’000
Factories,No.(c)
HighGrownMediumGrownLowGrown
Production,Mn.kgs.
HighGrownMediumGrownLowGrown
CostofProduction,Rs./kg.
ColomboAuctionPrice,Rs./kg.
HighGrownMediumGrownLowGrown
QuantitySoldatColomboAuctions,Mn.kgs.
HighGrownMediumGrownLowGrown
Exports
Value,Rs.Mn.Quantity,Mn.kgs.F.O.B.Price,Rs./kg.
ExportVolumebyDifferentType,Mn.kgs.(d)
BulkTeaPacketedTeaTeaBagsOther
Total
ExportValuebyDifferentType,Rs.Mn.(d)
BulkTeaPacketedTeaTeaBagsOther
Total
Valueadded,%ofGDP(Growing&Processing)
DomesticConsumption,Mn.kgs.(e)
222 222 222 222 222 222 222 203 202 203
1,452 1,418 1,683 1,851 1,832 1,748 1,293 1,226 1,060 1,067
132 188 n.a. n.a. n.a. n.a. 103 140 74 n.a.
864 876 702 695 700 716 713 711 712 734
202 205 172 169 167 166 n.a. 165 165 169 193 183 117 114 108 119 n.a. 121 121 139 469 488 413 412 425 431 n.a. 425 426 426
318.7 291.0 331.4 327.5 328.4 340.0 338.0 328.8 292.6 307.7
84.4 73.0 79.1 78.2 73.6 79.2 78.9 76.9 64.4 64.6 49.0 45.0 56.1 52.6 52.6 52.6 49.2 49.7 44.5 45.7 185.3 173.0 196.2 196.7 202.1 208.2 210.0 202.4 183.6 197.4
262.60 269.01 314.17 355.02 390.89 422.70 475.11 458.84 469.24 466.98
301.63 360.85 371.54 360.68 392.40 445.83 459.01 401.46 473.15 620.44
269.01 325.39 340.68 333.82 378.91 405.66 416.97 387.21 455.37 611.59 260.68 317.75 331.68 321.24 351.43 399.06 405.33 359.60 424.71 563.35 325.64 384.99 393.48 381.17 407.47 470.88 485.47 416.47 489.50 637.51 266.7 270.8 317.4 290.2 313.0 323.5 326.1 313.9 274.6 291.6
61.8 57.5 71.1 66.1 66.2 69.4 68.8 67.4 54.7 55.7 42.7 42.7 51.2 46.2 47.2 48.7 47.9 46.4 40.9 44.2 162.0 170.6 195.1 177.9 198.9 205.4 209.3 200.1 179.0 191.7
137,606 136,194 162,793 164,869 180,429 199,446 212,588 182,054 184,778 233,338 319.6 289.7 328.0 323.0 319.9 319.7 327.3 307.0 288.8 289.0 430.55 470.11 496.27 510.41 563.94 623.91 649.44 593.08 639.88 807.44
209.6 186.9 144.0 134.1 132.7 130.8 128.3 133.9 126.3 126.7 86.6 80.4 150.5 157.4 159.9 159.2 166.1 147.0 135.7 136.7 22.1 21.0 31.8 29.6 25.8 27.7 30.7 24.0 24.8 23.5 1.4 1.4 1.6 1.9 1.6 2.0 2.2 2.1 2.0 2.1
319.6 289.7 328.0 323.0 319.9 319.7 327.3 307.0 288.8 289.0
83,728 80,975 65,852 59,463 65,847 73,047 74,214 69,078 69,657 93,021 36,326 37,365 70,286 75,833 84,215 92,461 100,866 82,230 81,260 104,590 16,317 16,728 25,225 27,895 28,994 31,934 35,082 28,567 31,416 33,073 1,235 1,125 1,431 1,678 1,373 2,003 2,426 2,179 2,445 2,655
137,606 136,194 162,793 164,869 180,429 199,446 212,588 182,054 184,778 233,338 1.6 1.7 1.6 1.3 1.3 0.9 0.9 0.8 0.7 0.9
27.5 27.3 27.6 27.9 27.6 27.8 28.0 28.3 28.8 28.9
Item 2008 2009 2010 2011 2012 2013 2014 2015 2016 2017(a)

AGRICULTURE42
Rubber 2008 – 2017
Table 5.2
(a) Provisional
(b) ExtentscoveredbycultivationassistanceschemesoftheRubberDevelopmentDepartment.
n.a.–Notavailable
Sources:RubberDevelopmentDepartment
TheColomboRubberTraders’Association
SriLankaCustoms
CentralBankofSriLanka
Area,Hectares’000
UnderCultivation UnderTapping
AreaReplanted,Hectares(b)
AreaNewlyPlanted,Hectares(b)
SubsidiesforReplanting,Rs.’000perha.
FertilizerIssues(wholesale),MT
AverageYieldperHectare,kgs.
CostofProduction,Rs./kg.
TotalProduction,Mn.kgs.
SmokedSheet SoleCrepe ScrapCrepe LatexCrepe LatexandUnspecified TechnicallySpecifiedRubber
LocalConsumption,Mn.kgs.
Stocks,Mn.kgs.
Exports
Value,Rs.Mn. Volume,Mn.kgs. F.O.B.Price,Rs./kg.
ExportDistribution(Mn.kgs.)
EuropeanUnion India Japan Malaysia Pakistan USA OtherCountries
122 124 126 129 131 134 134 137 133 137 94 95 98 101 104 105 111 108 99, 103
6,105 1,002 5,941 3,050 2,161 2,024 2,096 1,917 1,467 1,841
2,436 715 1,413 3,004 2,476 2,979 1,428 769 615 701
125.0 125.0 125.0 175.0 175.0 175.0 175.0 175.0 175.0 175.0
10,488 8,277 n.a. n.a. n.a. n.a. 4,465 5,835 5,483 n.a.
1,382 1,437 1,561 1,566 1,459 1,247 889 819 800 809
114.00 115.50 119.83 129.56 136.00 150.00 160.00 170.00 180.00 195.00
129.2 136.9 153.0 158.2 152.0 130.4 98.6 88.6 79.1 83.1
55.0 54.6 59.3 60.7 59.2 62.8 48.5 44.4 39.8 41.5 3.9 5.4 6.7 3.4 1.9 2.4 2.4 1.9 1.6 1.5 2.7 3.5 1.8 1.3 1.3 2.4 1.0 0.9 0.8 0.8 21.0 31.7 52.5 59.9 36.5 15.4 11.8 8.3 12.6 9.2 35.6 29.9 24.3 24.9 44.4 37.9 27.2 25.5 20.5 28.9 11.0 11.8 8.3 8.0 8.7 9.6 7.6 7.6 3.8 1.2
80.1 84.9 107.2 111.7 110.0 107.3 85.6 73.2 51.0 57.0
11.5 7.4 1.7 5.5 10.2 9.8 5.0 10.0 4.0 3.5
13,535 11,327 19,580 22,811 15,726 9,194 5,916 3,548 4,758 5,920 48.6 56.0 51.9 42.6 37.4 23.6 16.3 10.4 16.2 17.2 278.39 202.30 377.54 535.40 420.74 389.81 362.83 342.03 294.33 343.56
8.1 5.0 6.6 5.8 4.9 4.1 4.2 3.0 4.1 4.0 7.0 14.1 10.0 3.9 7.1 2.6 2.0 0.4 0.8 1.2 2.4 1.5 1.8 2.3 1.4 1.7 1.7 1.6 1.5 1.7 6.5 10.9 13.7 12.6 11.6 5.0 1.1 0.4 2.6 1.6 10.3 9.5 7.8 7.6 5.4 4.7 2.4 1.4 3.0 3.3 4.8 2.7 2.9 3.3 1.7 1.0 0.7 0.5 0.9 0.5 9.6 12.3 9.1 7.2 5.2 4.6 4.2 3.1 3.3 5.1
Item 2008 2009 2010 2011 2012 2013 2014 2015 2016 2017(a)

AGRICULTURE43
Coconut 2008 – 2017
Table 5.3
Sources :CoconutDevelopmentAuthority DepartmentofCensusandStatistics NationalFertilizerSecretariat SriLankaCustoms CentralBankofSriLanka
(a) Provisional(b) Ingrowingandprocessingonly.(c) Estimatedhouseholdconsumption.n.a.–Notavailable
CoconutProduction,Mn.Nuts ManufactureofMajorCoconut Products,MT’000
Copra CoconutOil DesiccatedCoconut Poonac
CostofProduction,Rs.perNut
FertiliserIssues(wholesale),MT
ExportVolume
ThreeMajorCoconutProducts,Mn.Nuts
Copra,MT’000 CoconutOil,MT’000 DesiccatedCoconut,MT’000
CoconutNon-KernelProducts,MT’000
FreshCoconuts,MT’000 Fibres,MT’000 Yarn,MT’000 CoconutShellsandEkels,MT’000
ExportValue,Rs.Mn.
ThreeMajorCoconutProducts
Copra CoconutOil DesiccatedCoconut
CoconutNon-KernelProducts
FreshCoconuts Fibres Yarn CoconutShellsandEkels
F.O.B.Price,Rs.perkg.
Copra CoconutOil DesiccatedCoconut FreshCoconut Fibres Yarn CoconutShellsandEkels
LocalMarketPrice,Rs.perkg.
CopraNo.1 CoconutOil DesiccatedCoconut PriceofaFreshNut(Retail–Average),Rs.
ValueAdded,%ofGDP(b)
DomesticConsumption(c),Mn.Nuts
2,909 2,853 2,584 2,808 2,940 2,513 2,870 3,056 3,011 2,450
13.0 8.6 1.0 2.2 0.7 0.1 0.5 0.5 1.2 0.5 59.0 75.5 65.1 56.0 81.9 45.2 45.3 52.8 48.8 12.8 38.0 38.1 28.8 47.7 41.6 29.2 50.4 41.8 51.1 29.6 30.0 37.8 11.5 26.5 40.9 22.6 22.6 26.4 24.4 6.4 12.47 9.53 11.27 10.27 11.63 13.58 13.67 16.39 16.70 16.69 25,136 16,853 n.a. n.a. n.a. n.a. 24,276 28,483 25,498 n.a.
380 367 251 386 351 379 716 552 765 466
13.3 4.8 0.7 2.1 0.6 0.1 4.2 0.5 1.2 0.5 1.5 1.9 1.7 1.9 2.5 3.8 11.3 22.0 22.7 20.1 36.3 42.4 29.8 45.9 41.8 44.3 76.4 46.0 72.0 37.0
190.7 370.2 345.4 346.8 352.0 328.3 365.9 339.0 384.4 407.3
32.3 48.0 30.6 12.1 14.6 0.8 2.7 4.2 5.3 6.8 29.5 260.0 265.7 285.7 266.0 265.4 274.7 264.0 306.8 333.1 109.6 33.7 25.4 25.4 44.9 41.4 64.7 47.3 44.3 40.1 19.3 28.6 23.7 23.6 26.5 20.6 23.8 23.5 28.0 27.3
8,923 6,683 6,189 15,101 10,101 11,118 27,970 30,123 31,477 28,921
1,486 427 73 272 85 14 899 102 251 171 426 508 588 854 1,277 2,214 7,629 16,409 13,690 14,406 7,011 5,749 5,527 13,975 8,738 8,891 19,441 13,612 17,537 14,344
6,805 11,951 12,540 14,292 16,493 15,370 18,547 17,623 21,805 24,116
1,350 1,870 1,350 707 1,000 52 158 308 447 486 1,327 7,562 9,253 11,355 11,984 12,397 13,614 13,561 17,463 19,993 3,417 1,279 1,111 1,365 2,356 2,008 3,649 2,527 2,202 1,935 712 1,240 826 864 1,152 914 1,126 1,227 1,693 1,702
111.61 88.98 105.20 126.79 137.12 191.32 212.99 212.65 211.93 342.28 280.18 262.25 345.97 442.26 511.04 579.38 677.92 744.80 603.63 715.78 193.34 135.43 185.18 304.61 209.17 200.89 254.45 296.14 243.48 387.35 41.78 38.97 44.07 58.40 68.34 66.27 59.45 72.60 84.64 71.61 45.03 29.09 34.82 39.75 45.06 46.70 49.56 51.36 56.92 60.02 31.18 37.98 43.73 53.78 52.49 48.49 56.43 53.47 49.72 48.27 36.83 43.38 34.86 36.64 43.50 44.30 47.20 52.18 60.41 62.27
137.10 88.22 123.71 145.07 114.29 145.30 154.29 164.14 150.46 223.81 214.24 166.98 217.52 262.08 212.42 252.32 266.85 265.52 264.89 376.60 176.00 122.73 172.19 275.59 173.19 239.05 297.05 290.65 265.27 440.55
28.88 23.02 30.48 36.41 34.56 43.16 45.58 53.01 45.82 67.40
1.4 1.4 1.4 1.4 1.0 0.8 0.8 0.8 0.7 0.6
1,798 1,816 1,836 1,855 1,873 1,826 1,830 1,874 1,787 1,656
Item 2008 2009 2010 2011 2012 2013 2014 2015 2016 2017(a)

AGRICULTURE44
Minor Export Crops 2008 – 2017
Table 5.4
Sources:DepartmentofCensusandStatistics
SriLankaCustoms
CentralBankofSriLanka
(a) Provisional
Cultivated Area, Hectares
Cocoa Cinnamon Cardamom Clove Pepper Production, MT
Cocoa Cinnamon Cardamom Clove Pepper Exports – Quantity, MT
Cocoa Cardamoms Pepper Cloves Cinnamon Coffee CashewNuts NutmegandMace UnmanufacturedTobacco Exports – Value, Rs. Mn.
Cocoa Cardamoms Pepper Cloves Cinnamon Coffee CashewNuts NutmegandMace UnmanufacturedTobacco Export Price (F.O.B), Rs. per kg.
Cocoa Cardamoms Pepper Cloves Cinnamon Coffee CashewNuts NutmegandMace UnmanufacturedTobacco
2,513 2,253 2,279 2,300 2,336 2,365 2,375 2,517 2,240 1,987 28,971 29,486 30,106 30,523 31,049 31,551 31,867 32,342 32,682 32,985 2,790 2,794 2,795 2,795 2,798 2,800 2,801 2,801 1,242 1,257 7,595 7,613 7,603 7,605 7,612 7,622 7,627 7,643 6,842 7,177 30,156 30,528 30,931 31,296 31,667 31,997 32,291 32,527 39,515 42,989
1,695 467 520 525 513 515 500 457 650 471 14,899 15,765 16,435 18,250 17,165 17,500 17,600 17,707 18,945 22,341 71 61 48 57 80 50 87 91 120 113 8,203 3,032 9,551 5,533 4,009 6,190 3,225 5,253 1,823 6,428 12,897 15,767 17,332 10,800 18,604 28,000 18,660 28,177 18,476 29,546
64 292 1,644 4,343 2,524 102 334 93 43 164 12 9 12 12 10 4 8 120 779 839 6,253 6,580 12,971 5,065 10,532 21,703 8,353 17,027 8,383 13,778 7,413 2,917 8,535 5,208 2,918 5,483 1,233 5,529 1,849 7,815 12,459 12,234 13,682 13,747 14,762 14,148 13,949 13,828 14,946 16,967 86 60 26 10 10 19 57 24 14 14 206 195 337 311 146 51 129 113 63 60 1,793 1,640 2,314 1,911 1,620 2,306 2,065 2,258 2,387 2,491 1,278 686 695 708 861 1,142 1,162 880 897 918
9 18 634 2,350 1,648 34 140 33 17 77 29 28 38 65 32 21 40 147 843 871 2,853 2,398 5,121 3,543 9,192 16,693 9,447 20,215 11,147 13,462 3,610 1,391 4,357 3,957 2,373 6,400 1,834 6,444 2,013 7,247 9,368 8,794 11,057 14,244 17,397 17,992 18,255 19,099 24,973 33,342 26 15 15 9 8 15 30 24 21 29 153 127 253 288 170 77 186 189 112 144 1,016 1,022 2,044 3,112 2,875 4,051 3,886 4,534 5,815 5,366 4,280 3,856 3,643 4,241 5,374 6,149 5,397 4,310 4,536 5,566
141.76 63.11 385.58 541.22 652.70 332.18 419.92 356.94 396.28 469.56 2,405.14 3,025.52 3,101.32 5,681.13 3,080.31 5,252.77 4,797.83 1,223.33 1,081.94 1,037.36 456.31 364.44 394.76 699.38 872.79 769.16 1,130.87 1,187.25 1,329.69 974.04 487.00 476.78 510.47 759.76 813.20 1,167.40 1,487.21 1,165.66 1,088.55 927.28 751.91 718.80 808.12 1,036.18 1,178.48 1,271.68 1,308.67 1,381.18 1,670.83 1,965.15 301.03 254.75 573.76 836.98 836.57 801.38 522.84 1,018.36 1,498.13 2,121.21 742.94 651.06 751.30 928.03 1168.34 1,516.27 1,435.54 1,674.38 1,774.79 2,426.40 566.30 623.47 883.12 1,628.56 1,774.48 1,756.77 1,882.03 2,007.70 2,436.11 2,152.44 3,347.93 5,616.78 5,239.98 5,991.11 6,245.45 5,383.06 4,643.14 4,898.24 5,056.05 6,064.61
Item 2008 2009 2010 2011 2012 2013 2014 2015 2016 2017(a)

AGRICULTURE45
(a) Provisional
n.a.–NotavailableSources: DepartmentofCensusandStatistics
PaddyMarketingBoard
NationalFertilizerSecretariat
SriLankaCustoms
CentralBankofSriLanka
AreaSown,Ha.’000
Maha Yala IrrigatedArea,Ha.’000
Major Minor Rain–fedArea,Ha.’000 GrossAreaHarvested,Ha.’000
Maha Yala Production,MT’000
Maha Yala YieldperHectare,kgs.
Maha Yala FertilizerIssues,MT’000 CreditGrantedforPaddy Cultivation,Rs.Mn.
Maha Yala Prices,Rs.perBushel
GuaranteedPrice OpenMarketPrice Insurance
AreaInsured,Ha.’000 Collected,Rs.Mn.
TotalIndemnitiesPaid,Rs.Mn. RiceImports,MT’000
ImportPrice(C.I.F),Rs.perMT ValueAdded,Rs.Mn.
PercentofGDP
1,053 978 1,065 1,223 1,067 1,227 964 1,254 1,114 792
582 632 646 730 702 780 651 773 756 543 471 345 419 493 365 448 313 481 358 249 820 730 809 940 824 958 717 984 904 792
560 490 562 634 582 636 493 657 609 437 260 240 247 306 242 322 224 327 295 153 233 248 257 278 242 269 248 269 237 202 1,033 943 1,060 1,103 990 1,188 881 1,211 1,123 619
568 605 643 613 685 742 580 735 743 383 465 338 416 489 305 447 301 476 380 236 3,875 3,652 4,301 3,894 3,846 4,621 3,381 4,819 4,420 2,383
2,125 2,384 2,630 1,996 2,717 2,846 2,236 2,877 2,903 1,474 1,750 1,268 1,671 1,898 1,129 1,774 1,145 1,942 1,517 909 4,189 4,337 4,527 3,970 4,353 4,329 4,264 4,429 4,372 4,297
4,181 4,421 4,583 3,668 4,444 4,281 4,222 4,364 4,349 4,301 4,195 4,186 4,444 4,347 4,145 4,408 4,204 4,527 4,417 4,291 602 423 490 453 412 363 275 341 203 n.a. 1,644 1,918 2,541 4,418 5,527 5,427 4,762 5,582 5,851 5,305
807 1,158 1,402 2,443 3,752 3,527 3,174 3,261 3,701 3,232 837 760 1,139 1,975 1,775 1,900 1,588 2,321 2,683 2,073
605 605 605 605 605 699 699 939 793 814 658 676 598 635 618 637 843 787 772 1,044
29.6 29.6 26.6 36.2 49.4 30.9 25.7 30.2 46.3 30.2 24.5 30.2 43.8 66.4 100.8 77.8 61.8 81.8 74.3 47.1
21.8 15.4 15.3 184.6 78.3 136.2 55.2 154.7 67.7 141.7 84 52 126 28 36 23 600 286 30 748
56,425 50,202 53,598 73,003 85,229 100,028 61,322 62,870 63,398 61,355 43,406 41,179 48,377 44,325 43,596 52,084 43,386 76,256 52,649 50,269
1.8 1.7 1.8 1.5 1.4 1.6 1.2 0.9 0.6 0.5
Paddy 2008 – 2017
Table 5.5
Item 2008 2009 2010 2011 2012 2013 2014 2015 2016 2017(a)
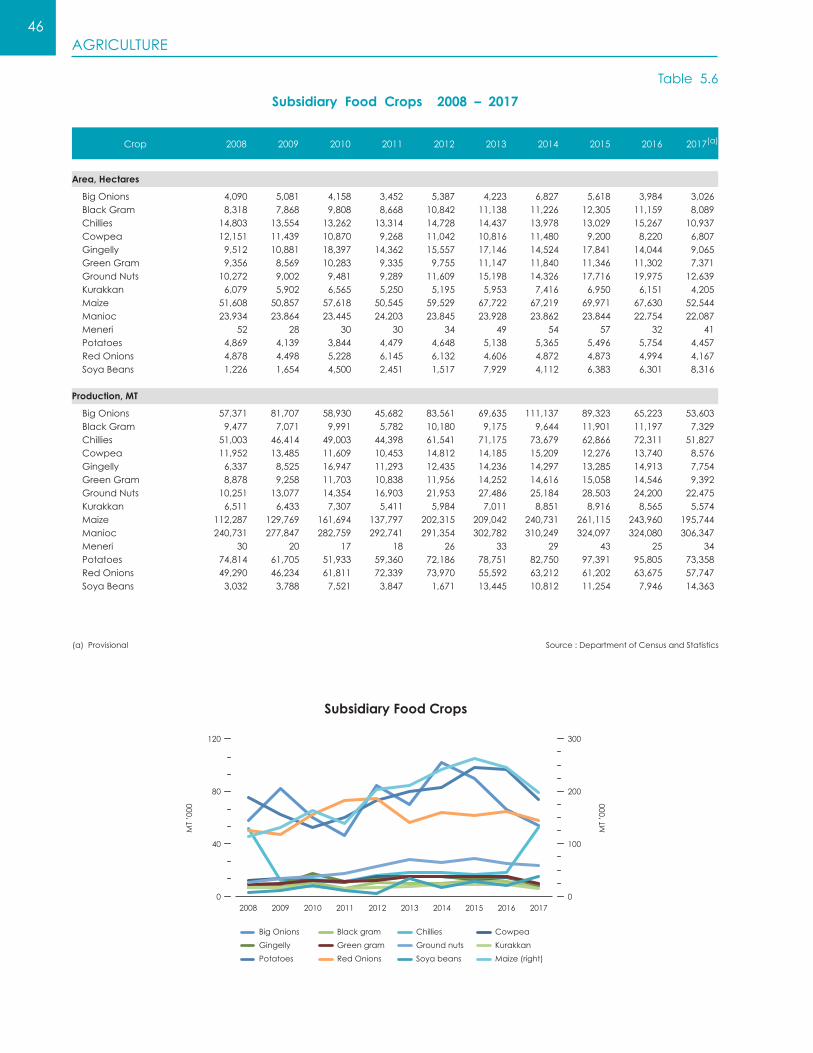
AGRICULTURE46
Subsidiary Food Crops 2008 – 2017
Table 5.6
(a)Provisional Source:DepartmentofCensusandStatistics
4,090 5,081 4,158 3,452 5,387 4,223 6,827 5,618 3,984 3,026 8,318 7,868 9,808 8,668 10,842 11,138 11,226 12,305 11,159 8,089 14,803 13,554 13,262 13,314 14,728 14,437 13,978 13,029 15,267 10,937 12,151 11,439 10,870 9,268 11,042 10,816 11,480 9,200 8,220 6,807 9,512 10,881 18,397 14,362 15,557 17,146 14,524 17,841 14,044 9,065 9,356 8,569 10,283 9,335 9,755 11,147 11,840 11,346 11,302 7,371 10,272 9,002 9,481 9,289 11,609 15,198 14,326 17,716 19,975 12,639 6,079 5,902 6,565 5,250 5,195 5,953 7,416 6,950 6,151 4,205 51,608 50,857 57,618 50,545 59,529 67,722 67,219 69,971 67,630 52,544 23,934 23,864 23,445 24,203 23,845 23,928 23,862 23,844 22,754 22,087 52 28 30 30 34 49 54 57 32 41 4,869 4,139 3,844 4,479 4,648 5,138 5,365 5,496 5,754 4,457 4,878 4,498 5,228 6,145 6,132 4,606 4,872 4,873 4,994 4,167 1,226 1,654 4,500 2,451 1,517 7,929 4,112 6,383 6,301 8,316
57,371 81,707 58,930 45,682 83,561 69,635 111,137 89,323 65,223 53,603 9,477 7,071 9,991 5,782 10,180 9,175 9,644 11,901 11,197 7,329 51,003 46,414 49,003 44,398 61,541 71,175 73,679 62,866 72,311 51,827 11,952 13,485 11,609 10,453 14,812 14,185 15,209 12,276 13,740 8,576 6,337 8,525 16,947 11,293 12,435 14,236 14,297 13,285 14,913 7,754 8,878 9,258 11,703 10,838 11,956 14,252 14,616 15,058 14,546 9,392 10,251 13,077 14,354 16,903 21,953 27,486 25,184 28,503 24,200 22,475 6,511 6,433 7,307 5,411 5,984 7,011 8,851 8,916 8,565 5,574 112,287 129,769 161,694 137,797 202,315 209,042 240,731 261,115 243,960 195,744 240,731 277,847 282,759 292,741 291,354 302,782 310,249 324,097 324,080 306,347 30 20 17 18 26 33 29 43 25 34 74,814 61,705 51,933 59,360 72,186 78,751 82,750 97,391 95,805 73,358 49,290 46,234 61,811 72,339 73,970 55,592 63,212 61,202 63,675 57,747 3,032 3,788 7,521 3,847 1,671 13,445 10,812 11,254 7,946 14,363
Area, Hectares
BigOnionsBlackGramChilliesCowpeaGingellyGreenGramGroundNutsKurakkanMaizeManiocMeneriPotatoesRedOnionsSoyaBeans
Production, MT
BigOnionsBlackGramChilliesCowpeaGingellyGreenGramGroundNutsKurakkanMaizeManiocMeneriPotatoesRedOnionsSoyaBeans
Crop 2008 2009 2010 2011 2012 2013 2014 2015 2016 2017(a)
Subsidiary Food Crops
MT
’000
MT
’000
201720092008 2010 2011 2012 2013 2014 2015 20160
100
200
300
0
40
80
120
Big Onions Black gram Chillies Cowpea
Gingelly Green gram Ground nuts Kurakkan
Potatoes Red Onions Soya beans Maize (right)

AGRICULTURE47
Principal Crops by Province 2013 – 2017
Table 5.7
Item Western Central Southern Northern EasternNorth
WesternNorthCentral
UvaSabara-gamuwa
AllIsland
Tea
EstimatedProduction,Mn.kg. 2013 2014 2015 2016 2017(a)
No.ofTeaFactories(inoperation) 2013 2014 2015 2016 2017(a)
Rubber
EstimatedProductionMn.kg. 2013 2014 2015 2016(b) 2017(a)
Coconut
EstimatedArea (2014Census),’000Ha.
EstimatedProduction,Mn.Nuts 2013 2014 2015 2016 2017(a)
AverageProducerPrice, Rs.per100nuts 2013 2014 2015 2016 2017(a)
Paddy
Production,MT’000 2013 2014 2015 2016 2017(a)
NetExtentHarvested,’000Ha. 2013 2014 2015 2016 2017(a)
Yield–BushelsperAcre 2013 2014 2015 2016 2017(a)
Yield–kg.perHectare 2013 2014 2015 2016 2017(a)
19.3 109.7 97.9 – – – – 30.4 82.8 340.0 18.9 109.2 96.8 – – – – 29.0 84.1 338.0 19.2 107.6 89.9 – – – – 29.1 83.0 328.8 19.1 95.4 77.2 – – – – 24.5 76.3 292.6 21.2 93.4 84.7 – – – – 28.1 80.3 307.7
33 227 229 – – – – 65 142 696 34 238 235 – – – – 67 140 714 32 237 240 – – – – 64 141 714 36 239 231 – – – – 68 138 712 37 245 232 – – – – 70 140 724
43.0 3.2 11.6 – – 2.6 – 2.5 67.4 130.2 32.4 2.6 8.7 – – 2.3 – 1.9 50.7 98.6 29.1 2.3 7.8 – – 2.0 – 1.7 45.6 88.6 25.8 1.8 6.8 – – 1.7 – 1.5 41.4 79.1 25.9 1.8 6.9 – – 1.7 – 1.7 45.0 83.1
72.21 18.27 32.24 10.60 7.74 244.98 14.19 12.70 30.50 443.53
465 125 319 93 64 972 168 115 193 2,513 477 154 332 84 104 1,180 216 143 217 2,905 495 161 355 82 103 1,265 226 96 247 3,027 443 178 353 82 121 1,196 255 108 273 3,011 326 126 312 73 98 991 234 91 200 2,450
3,060.74 3,464.15 3,105.96 3,245.39 3,511.32 2,816.10 3,208.16 3,208.09 2,988.75 3,109.29 3,280.26 3,239.08 3,483.98 2,846.46 3,277.46 2,854.74 2,905.29 2,606.21 3,091.60 3,110.10 3,487.84 3,752.87 3,880.64 3,309.40 3,716.82 3,161.43 3,415.72 3,485.69 3,276.01 3,467.76 3,075.79 3,066.04 3,483.76 2,457.36 3,151.11 2,742.86 2,742.86 2,644.12 2,876.71 2,922.25 4,707.49 5,100.03 4,679.59 4,408.72 5,141.51 4,552.15 4,532.62 4,921.87 4,696.47 4,680.11
117.5 203.8 402.2 313.6 1,039.5 688.0 1,225.7 381.2 249.3 4,620.7 106.6 164.0 429.5 124.5 935.9 496.9 721.4 289.0 113.1 3,380.8 127.5 201.6 507.5 403.3 1,067.2 630.0 1,376.6 379.5 126.2 4,819.4 90.1 181.6 414.7 352.7 1,112.6 627.3 1,190.9 344.4 105.8 4,420.1 74.6 113.5 329.8 160.6 759.9 152.3 535.1 201.2 56.2 2,383.2
36.9 47.5 82.3 75.1 268.4 158.6 260.4 87.3 50.8 1,067.3 34.8 40.7 91.0 33.2 217.7 129.6 152.2 64.8 29.0 792.9 36.4 47.6 99.4 93.9 254.0 170.4 268.6 86.5 31.6 1,088.4 26.3 43.5 83.1 86.0 263.5 160.8 240.1 82.4 25.3 1,011.6 22.5 26.4 70.5 41.4 186.1 35.9 110.0 46.2 15.7 554.6
62 83 95 81 75 84 91 85 95 84 59 78 91 73 83 74 92 86 76 82 68 82 99 83 81 72 99 85 77 86 67 81 97 80 82 76 96 81 81 82 64 83 91 75 79 82 94 84 70 80
3,183 4,294 4,884 4,175 3,873 4,337 4,707 4,364 4,908 4,329 3,064 4,032 4,717 3,748 4,299 3,834 4,741 4,457 3,905 4,264 3,501 4,238 5,108 4,295 4,201 3,697 5,125 4,388 3,995 4,428 3,433 4,176 4,988 4,099 4,222 3,902 4,961 4,178 4,179 4,238 3,317 4,297 4,680 3,883 4,083 4,247 4,863 4,354 3,592 4,146
Sources : SriLankaTeaBoard CoconutResearchInstitute RubberDevelopmentDepartment DepartmentofCensusandStatistics CentralBankofSriLanka
(a)Provisional(b)Revised
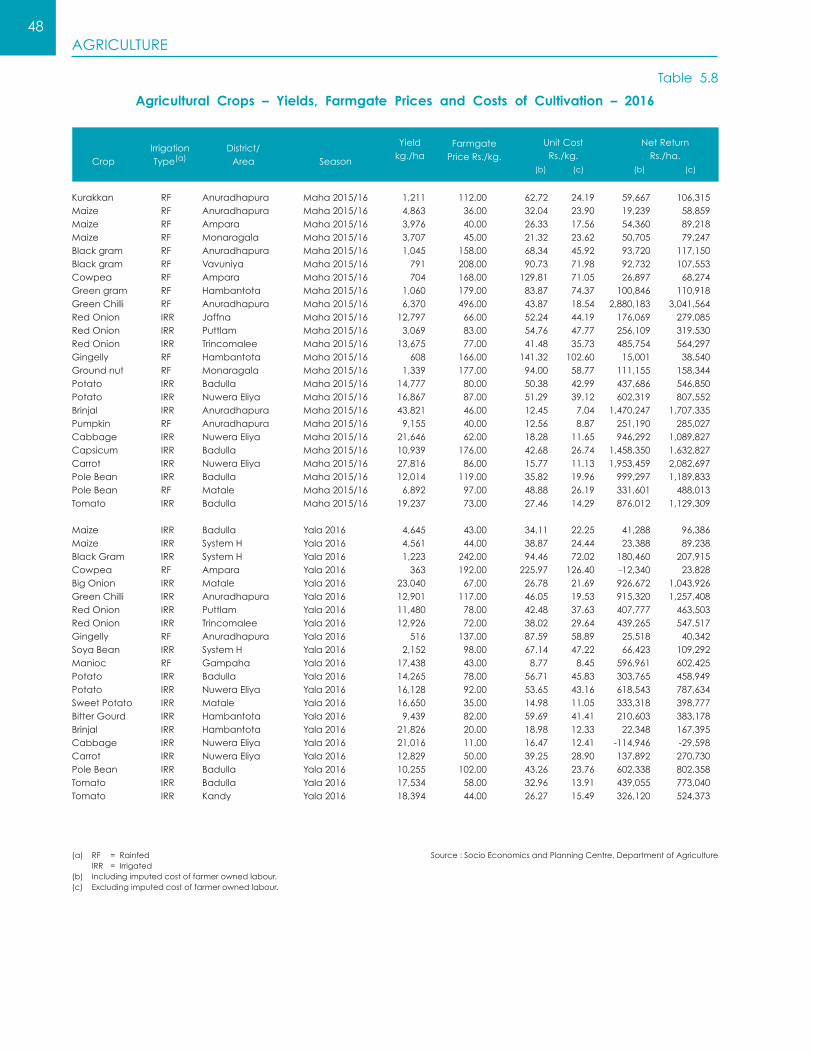
AGRICULTURE48
Agricultural Crops – Yields, Farmgate Prices and Costs of Cultivation – 2016
Table 5.8
CropIrrigationType(a)
District/Area Season
Yieldkg./ha
FarmgatePriceRs./kg.
UnitCostRs./kg.
(b) (c)
NetReturnRs./ha.
(b) (c)
Kurakkan RF Anuradhapura Maha2015/16 1,211 112.00 62.72 24.19 59,667 106,315Maize RF Anuradhapura Maha2015/16 4,863 36.00 32.04 23.90 19,239 58,859Maize RF Ampara Maha2015/16 3,976 40.00 26.33 17.56 54,360 89,218Maize RF Monaragala Maha2015/16 3,707 45.00 21.32 23.62 50,705 79,247Blackgram RF Anuradhapura Maha2015/16 1,045 158.00 68.34 45.92 93,720 117,150Blackgram RF Vavuniya Maha2015/16 791 208.00 90.73 71.98 92,732 107,553Cowpea RF Ampara Maha2015/16 704 168.00 129.81 71.05 26,897 68,274Greengram RF Hambantota Maha2015/16 1,060 179.00 83.87 74.37 100,846 110,918GreenChilli RF Anuradhapura Maha2015/16 6,370 496.00 43.87 18.54 2,880,183 3,041,564RedOnion IRR Jaffna Maha2015/16 12,797 66.00 52.24 44.19 176,069 279,085RedOnion IRR Puttlam Maha2015/16 3,069 83.00 54.76 47.77 256,109 319,530RedOnion IRR Trincomalee Maha2015/16 13,675 77.00 41.48 35.73 485,754 564,297Gingelly RF Hambantota Maha2015/16 608 166.00 141.32 102.60 15,001 38,540Groundnut RF Monaragala Maha2015/16 1,339 177.00 94.00 58.77 111,155 158,344Potato IRR Badulla Maha2015/16 14,777 80.00 50.38 42.99 437,686 546,850Potato IRR NuweraEliya Maha2015/16 16,867 87.00 51.29 39.12 602,319 807,552Brinjal IRR Anuradhapura Maha2015/16 43,821 46.00 12.45 7.04 1,470,247 1,707,335Pumpkin RF Anuradhapura Maha2015/16 9,155 40.00 12.56 8.87 251,190 285,027Cabbage IRR NuweraEliya Maha2015/16 21,646 62.00 18.28 11.65 946,292 1,089,827Capsicum IRR Badulla Maha2015/16 10,939 176.00 42.68 26.74 1,458,350 1,632,827Carrot IRR NuweraEliya Maha2015/16 27,816 86.00 15.77 11.13 1,953,459 2,082,697PoleBean IRR Badulla Maha2015/16 12,014 119.00 35.82 19.96 999,297 1,189,833PoleBean RF Matale Maha2015/16 6,892 97.00 48.88 26.19 331,601 488,013Tomato IRR Badulla Maha2015/16 19,237 73.00 27.46 14.29 876,012 1,129,309 Maize IRR Badulla Yala2016 4,645 43.00 34.11 22.25 41,288 96,386Maize IRR SystemH Yala2016 4,561 44.00 38.87 24.44 23,388 89,238BlackGram IRR SystemH Yala2016 1,223 242.00 94.46 72.02 180,460 207,915Cowpea RF Ampara Yala2016 363 192.00 225.97 126.40 -12,340 23,828BigOnion IRR Matale Yala2016 23,040 67.00 26.78 21.69 926,672 1,043,926GreenChilli IRR Anuradhapura Yala2016 12,901 117.00 46.05 19.53 915,320 1,257,408RedOnion IRR Puttlam Yala2016 11,480 78.00 42.48 37.63 407,777 463,503RedOnion IRR Trincomalee Yala2016 12,926 72.00 38.02 29.64 439,265 547,517Gingelly RF Anuradhapura Yala2016 516 137.00 87.59 58.89 25,518 40,342SoyaBean IRR SystemH Yala2016 2,152 98.00 67.14 47.22 66,423 109,292Manioc RF Gampaha Yala2016 17,438 43.00 8.77 8.45 596,961 602,425Potato IRR Badulla Yala2016 14,265 78.00 56.71 45.83 303,765 458,949Potato IRR NuweraEliya Yala2016 16,128 92.00 53.65 43.16 618,543 787,634SweetPotato IRR Matale Yala2016 16,650 35.00 14.98 11.05 333,318 398,777BitterGourd IRR Hambantota Yala2016 9,439 82.00 59.69 41.41 210,603 383,178Brinjal IRR Hambantota Yala2016 21,826 20.00 18.98 12.33 22,348 167,395Cabbage IRR NuweraEliya Yala2016 21,016 11.00 16.47 12.41 -114,946 -29,598Carrot IRR NuweraEliya Yala2016 12,829 50.00 39.25 28.90 137,892 270,730PoleBean IRR Badulla Yala2016 10,255 102.00 43.26 23.76 602,338 802,358Tomato IRR Badulla Yala2016 17,534 58.00 32.96 13.91 439,055 773,040Tomato IRR Kandy Yala2016 18,394 44.00 26.27 15.49 326,120 524,373
(a) RF =Rainfed IRR =Irrigated(b) Includingimputedcostoffarmerownedlabour.(c) Excludingimputedcostoffarmerownedlabour.
Source:SocioEconomicsandPlanningCentre,DepartmentofAgriculture

AGRICULTURE49
Agricultural Crops – Yields, Farmgate Prices and Costs of Cultivation – 2017(a)
Table 5.9
CropIrrigationType(b)
District/Area Season
Yieldkg./ha
FarmgatePriceRs./kg.
UnitCostRs./kg.
(c) (d)
NetReturnRs./ha.
(c) (d)
Paddy IRR Ampara-East Maha2016/17 5,757 42.00 19.46 16.11 129,784 149,061
Paddy IRR Ampara-West Maha2016/17 5,604 42.35 23.37 16.78 106,371 143,325
Paddy IRR Anuradhapura Maha2016/17 4,423 42.35 28.84 20.46 59,750 96,813
Paddy IRR Hambantota Maha2016/17 5,189 42.00 27.84 21.19 73,460 107,988
Paddy IRR Kurunegala Maha2016/17 4,999 45.94 26.33 17.72 98,031 141,064
Paddy IRR Mannar Maha2016/17 5,612 45.00 21.44 17.63 132,211 153,570
Paddy IRR Polonnaruwa Maha2016/17 5,708 45.30 22.49 16.88 130,199 162,236
Paddy IRR MahaweliB Maha2016/17 5,243 45.69 23.89 18.05 114,329 144,934
Paddy IRR MahaweliC Maha2016/17 5,234 46.20 26.00 18.89 105,696 142,954
Paddy IRR MahaweliH Maha2016/17 4,848 44.00 28.66 21.76 74,375 107,839
Paddy RF Gampaha Maha2016/17 2,533 36.73 44.70 33.85 -20,180 7,288
Paddy RF Kalutara Maha2016/17 2,854 40.00 40.19 27.66 -544 35,227
Paddy RF Kandy Maha2016/17 2,609 42.45 53.70 28.48 -29,367 36,460
Paddy RF Batticaloa Maha2016/17 2,041 39.48 40.08 35.25 -1,229 8,625
Paddy RF Kurunegala Maha2016/17 1,940 44.55 58.36 41.06 -26,791 6,772
Kurakkan RF Anuradhapura Maha2016/17 974 139.00 108.78 40.08 29,422 96,305
Maize RF Anuradhapura Maha2016/17 3,262 42.00 36.12 22.62 19,170 63,203
Maize RF Ampara Maha2016/17 3,716 41.00 34.85 23.80 22,844 63,925
Maize RF Monaragala Maha2016/17 3,496 46.00 34.64 29.81 39,716 56,623
Blackgram RF Anuradhapura Maha2016/17 489 158.00 141.18 98.53 8,228 29,096
Blackgram RF Vavuniya Maha2016/17 556 165.00 113.75 102.42 28,496 34,792
Cowpea RF Ampara Maha2016/17 729 198.00 116.12 56.36 59,687 103,251
Greengram RF Hambantota Maha2016/17 655 179.00 153.01 131.35 17,020 31,204
GreenChilli RF Anuradhapura Maha2016/17 4,628 101.00 75.74 32.29 116,930 317,998
RedOnion IRR Jaffna Maha2016/17 10,074 90.00 73.85 66.01 162,743 241,642
RedOnion IRR Puttlam Maha2016/17 9,338 82.00 51.58 44.68 284,049 348,460
Gingelly RF Hambantota Maha2016/17 497 259.00 174.63 115.03 41,906 71,506
Groundnut RF Monaragala Maha2016/17 806 180.00 176.42 100.48 2,884 64,053
Potato IRR Badulla Maha2016/17 17,287 82.00 52.03 41.59 518,104 698,492
Potato IRR NuweraEliya Maha2016/17 17,952 109.00 58.54 53.55 905,814 995,497
Brinjal IRR Anuradhapura Maha2016/17 25,268 43.00 17.62 13.84 641,192 736,805
Pumpkin RF Anuradhapura Maha2016/17 3,173 32.00 52.77 37.11 -65,889 -16,222
Cabbage IRR NuweraEliya Maha2016/17 22,036 55.00 19.29 15.54 786,902 869,622
Capsicum IRR Badulla Maha2016/17 8,779 186.00 70.05 46.56 1,017,956 1,224,212
Carrot IRR NuweraEliya Maha2016/17 14,144 89.00 36.96 29.25 736,084 845,168
PoleBean IRR Badulla Maha2016/17 9,746 82.00 51.34 34.12 298,791 466,579
PoleBean RF Matale Maha2016/17 3,926 89.00 122.74 66.65 -132,495 87,738
Tomato IRR Badulla Maha2016/17 23,719 51.00 27.20 14.75 564,530 859,920
(a) Provisional(b) RF =Rainfed IRR =Irrigated(c) Includingimputedcostoffarmerownedlabour.(d) Excludingimputedcostoffarmerownedlabour.
Source:SocioEconomicsandPlanningCentre,DepartmentofAgriculture

AGRICULTURE50
Sources: DepartmentofCensusandStatistics MinistryofFisheriesandAquaticResourcesDevelopment SriLankaCustoms CentralBankofSriLanka
Fish Production, MT Coastal DeepSeaandOff-shore Inland
Import of Fish Products Quantity,MT(’000)–DriedFish –Other
Value,Rs.Mn. –DriedFish –Other
Cattle Population,’000 Slaughtered,’000(b)
ProductionofMilk,LitresMn.
Buffaloes Population,’000 ProductionofMilk,LitresMn.
Sheep and Goats Population,’000 Sheep Goats Slaughtered,’000(b)
Pigs Population,’000 Slaughtered,’000(b)
Poultry Population,’000 Duck Chicken ProductionofEggs,’000
(a) Provisional(b) Onlythenumberofanimalsslaughteredatlicensed
slaughterhousesareincludedhere.
319,120 339,730 384,670 444,830 486,170 512,840 535,050 520,190 530,920 531,310 165,320 180,410 202,420 222,350 257,540 267,980 278,850 269,020 274,160 259,720 109,310 112,760 129,840 162,920 159,680 177,950 180,450 183,870 182,830 189,720 44,490 46,560 52,410 59,560 68,950 66,910 75,750 67,300 73,930 81,870
48 49 49 50 41 39 36 35 37 35 29 27 34 33 31 40 43 85 78 71
6,275 7,869 7,607 8,404 8,935 11,251 8,918 11,103 14,356 14,465 6,348 6,101 7,070 8,066 8,548 9,939 9,895 19,095 20,184 18,697
1,196 1,137 1,170 1,192 1,236 1,169 1,106 1,088 945 1,001 164 168 204 162 174 170 151 167 168 156 172 184 192 203 238 265 273 305 318 328
319 372 423 405 415 381 321 323 267 284 36 49 56 55 62 64 61 69 66 69
387 385 381 384 393 341 307 317 275 297 10 8 8 8 9 10 8 8 8 10 377 377 373 375 384 331 299 309 267 287 58 63 68 63 73 65 56 51 52 43
89 81 84 82 89 81 108 70 81 95 21 22 20 25 30 30 24 23 21 18
14,350 13,631 14,032 14,211 14,051 16,660 16,642 16,756 21,068 21,287 18 15 13 12 13 13 12 12 12 11 14,331 13,615 14,018 14,199 14,039 16,647 16,630 16,744 21,056 21,276 1,039,813 1,142,239 1,139,940 1,185,318 1,457,101 1,636,844 1,741,366 1,898,856 2,059,653 2,072,870
Fish and Livestock 2008 – 2017
Table 5.10
Item 2008 2009 2010 2011 2012 2013 2014 2015 2016 2017(a)
Fish Production
201720092008 2010 2011 2012 2013 2014 2015 2016
0
200,000
400,000
600,000
0
100,000
200,000
300,000
MT
MT
Off shore Coastal Inland Total Fish Production (right)

AGRICULTURE51
National Livestock Statistics by District 2016
National Livestock Statistics by District 2017(a)
Table 5.11
Table 5.12
District
Cattle Buffaloes Poultry Pigs GoatandSheep
CowsMilking
at Present
Ave.DailyMilkProduction,
Ltrs.
CowsMilking
at Present
Ave.DailyMilkProduction,
Ltrs.
Numberof
Chickens
Ave.MonthlyEggProduction,
'000
Numberof
Ducks
Numberof
Swine
Numberof
Cattle
Numberof
Buffaloes
NumberofGoatsandSheep
Source:DepartmentofCensusandStatistics
ColomboGampahaKalutaraKandyMataleNuwaraEliyaGalleMataraHambantotaJaffnaKilinochchiMannarVavuniyaMullaitivuBatticaloaAmparaTrincomaleeKurunegalaPuttalamAnuradhapuraPolonnaruwaBadullaMoneragalaRatnapuraKegalle
Total
7,200 2,460 8,480 5,040 1,590 5,390 1,173,750 9,210 665 6,460 2,260 27,020 7,650 23,600 6,040 1,150 3,620 1,931,520 4,927 1,195 26,410 8,340 13,940 4,030 10,280 10,310 3,090 8,990 830,020 9,274 335 5,110 6,250 20,810 8,850 49,980 3,130 110 400 881,800 4,197 750 1,710 13,770 17,950 6,070 29,270 3,920 200 610 530,250 2,805 210 3,850 5,500 34,850 14,490 118,110 2,690 100 190 302,010 6,176 370 510 9,820 10,330 3,420 9,200 8,110 2,920 8,900 203,810 2,253 270 960 3,510 7,840 2,240 5,180 4,920 1,590 3,800 103,530 1,145 130 270 2,030 27,520 10,310 23,200 38,150 13,600 22,770 118,970 1,508 190 430 1,510 48,400 15,390 34,330 280 20 60 351,270 3,210 590 20 47,980 31,420 9,600 13,320 780 240 290 148,250 1,102 305 200 7,560 48,610 11,870 19,820 1,610 470 1,340 111,790 1,222 665 70 10,540 48,700 13,870 25,720 2,170 540 1,030 148,900 1,221 565 230 11,810 35,580 11,230 16,900 6,640 2,140 3,680 107,320 913 70 90 5,200 74,030 23,670 31,950 22,560 7,420 10,760 192,200 1,322 1,230 210 21,820 85,650 20,530 36,190 20,300 7,040 16,390 289,850 2,010 750 230 11,190 42,540 12,830 23,430 29,600 11,160 23,300 177,840 1,936 880 280 16,930 102,820 32,140 137,180 14,590 2,970 9,090 9,172,780 91,399 605 11,410 25,730 45,830 10,910 36,110 6,100 1,560 6,810 2,290,890 18,937 810 14,760 21,670 81,910 25,880 83,420 24,040 7,770 18,980 491,630 1,417 690 2,200 14,470 32,810 11,370 35,830 14,810 4,940 10,930 355,530 1,647 150 1,620 4,630 40,910 11,510 72,720 1,950 320 580 181,980 1,447 170 200 9,480 39,430 8,760 20,980 29,170 10,030 21,360 199,250 693 100 2,700 2,540 11,130 3,010 10,080 7,430 2,090 4,200 300,700 696 130 820 5,130 7,920 2,310 7,720 2,410 90 220 460,180 971 145 670 5,380
945,150 284,400 883,000 266,750 83,150 183,690 21,056,020 171,638 11,970 81,420 275,050
7,930 2,360 8,260 4,760 1,500 4,980 841,090 8,356 335 13,450 2,050 26,110 7,470 22,950 5,460 1,210 3,520 1,813,630 5,219 1,040 27,170 7,940 13,730 3,930 9,240 10,930 3,320 8,350 1,181,420 8,323 310 5,230 5,610 22,410 8,790 53,110 3,790 60 200 900,000 4,874 490 2,040 14,760 19,130 6,660 35,960 3,680 280 900 653,070 5,224 250 3,500 5,479 40,220 15,200 156,560 2,710 120 150 330,430 5,276 345 450 10,230 10,710 3,430 8,990 7,540 2,590 7,650 175,010 2,254 215 870 3,200 8,850 2,520 5,390 5,620 1,830 4,150 95,440 1,139 115 170 2,140 31,700 11,740 25,590 41,100 13,850 27,700 106,510 1,290 175 720 2,450 57,320 16,130 32,640 0 0 0 374,950 3,707 340 0 48,610 35,090 10,100 13,670 950 230 320 158,650 1,785 350 200 8,360 49,160 12,270 20,180 1,530 450 1,440 110,840 1,231 1,150 150 10,460 53,420 16,210 29,790 2,150 580 1,040 141,760 1,343 505 510 13,610 37,380 11,450 15,710 7,470 2,330 3,960 107,280 976 110 90 5,740 78,000 24,550 29,460 23,170 7,860 12,970 185,600 1,294 670 0 25,910 78,120 19,900 32,840 20,230 6,190 13,620 333,930 2,118 770 170 14,020 48,570 15,460 25,090 32,600 13,140 26,080 179,200 2,307 1,170 460 20,690 102,680 31,160 130,030 17,830 3,250 11,620 8,580,520 87,870 680 11,260 24,340 56,650 12,120 38,960 7,400 1,700 5,950 2,924,850 19,785 610 19,990 28,190 85,250 26,170 74,700 26,990 8,510 20,680 589,330 1,815 410 2,550 15,170 44,050 12,990 43,150 17,150 5,090 11,710 389,480 2,408 190 2,190 8,170 36,120 11,110 58,500 2,270 470 890 182,710 1,382 165 220 7,570 35,720 8,040 17,470 26,290 8,880 17,220 180,300 698 140 2,520 2,130 14,550 4,110 12,470 9,750 2,960 5,180 319,270 1,013 100 610 5,610 8,010 2,380 9,310 2,180 90 250 420,550 1,051 145 600 5,140
1,000,880 296,250 910,020 283,550 86,490 190,530 21,275,820 172,739 10,780 95,120 297,579
(a)Provisional Source:DepartmentofCensusandStatistics
District
Cattle Buffaloes Poultry Pigs GoatandSheep
CowsMilking
at Present
Ave.DailyMilkProduction,
Ltrs.
CowsMilking
at Present
Ave.DailyMilkProduction,
Ltrs.
Numberof
Chickens
Ave.MonthlyEggProduction,
'000
Numberof
Ducks
Numberof
Swine
Numberof
Cattle
Numberof
Buffaloes
NumberofGoatsandSheep
ColomboGampahaKalutaraKandyMataleNuwaraEliyaGalleMataraHambantotaJaffnaKilinochchiMannarVavuniyaMullaitivuBatticaloaAmparaTrincomaleeKurunegalaPuttalamAnuradhapuraPolonnaruwaBadullaMoneragalaRatnapuraKegalle
Total

AGRICULTURE52
Livestock and Poultry – Average Producer Prices 2016
Livestock and Poultry – Average Producer Prices 2017(a)
Table 5.13
Table 5.14
Province District
Livestock Livestock–FullGrown
CowMilk1Ltr.
BuffaloMilk1Ltr.
Eggseach
(average)Buffaloes
NeatCattle
Goats Pigs PoultryHighBred Other
Province District
Livestock Livestock–FullGrown
CowMilk1Ltr.
BuffaloMilk1Ltr.
Eggseach
(average)Buffaloes
NeatCattle
Goats Pigs PoultryHighBred Other
ColomboWestern Gampaha Kalutara
KandyCentral Matale NuwaraEliya
GalleSouthern Matara Hambantota
Jaffna KilinochchiNorthern Mannar Vavuniya Mullaitivu
BatticaloaEastern Trincomalee Ampara
North Kurunegala Western Puttalam
North Anuradhapura Central Polonnaruwa
Uva Badulla Moneragala
Sabara- Ratnapura gamuwa Kegalle
Average Price
62.15 64.99 14.35 83,312.50 90,729.17 55,625.00 22,444.44 29,968.75 334.25 59.39 62.50 14.95 49,947.64 60,913.75 39,629.21 16,272.91 19,785.60 441.62 64.38 71.47 13.84 70,500.00 69,250.00 57,925.00 24,583.33 19,000.00 343.83
60.55 n.a. 14.83 50,500.00 58,513.72 16,391.65 10,962.48 n.a. 367.68 62.38 95.67 14.71 43,453.12 65,853.71 30,824.98 18,631.95 18,666.67 362.06 66.47 n.a. 14.20 n.a. 52,125.00 37,194.44 18,305.51 18,000.00 332.92
60.77 70.07 14.68 60,495.59 52,294.09 39,691.35 23,722.22 n.a. 696.48 68.30 74.86 14.96 40,599.84 67,333.00 21,710.41 10,444.33 n.a. 498.01 64.75 76.28 14.89 28,198.11 n.a. 18,854.17 7,720.83 10,000.00 342.01
66.80 60.00 15.14 n.a. 83,788.89 20,479.17 14,299.96 n.a. 555.93 62.29 60.00 15.55 95,666.67 92,083.58 37,972.33 23,694.33 n.a. 591.67 72.88 80.97 15.87 34,375.00 56,875.00 35,916.67 12,064.58 n.a. 470.00 57.43 66.73 13.98 52,243.06 29,666.67 20,844.75 13,686.42 40,555.56 713.54 69.21 80.00 15.54 n.a. n.a. 18,336.11 10,854.17 n.a. 656.13
68.35 78.31 16.57 51,419.31 46,027.81 33,682.31 11,906.25 n.a. 595.82 67.48 74.02 15.09 41,213.61 72,500.00 33,633.16 12,580.95 9,416.67 529.31 68.47 79.20 15.21 61,895.13 51,636.01 37,900.30 17,522.10 n.a. 473.99
64.22 70.33 13.76 48,313.51 67,958.13 39,251.56 17,392.51 30,225.74 340.81 64.88 75.29 13.89 63,175.60 63,270.83 33,990.00 10,669.40 14,855.18 353.42
64.15 68.25 68.79 41,316.78 53,567.94 28,965.48 12,409.56 15,635.37 335.93 63.63 69.32 14.72 55,919.63 64,525.78 44,375.46 14,042.41 27,552.08 354.50
58.73 80.00 15.26 31,000.00 38,345.78 23,966.65 16,742.78 n.a. 411.03 62.42 71.62 14.93 n.a. n.a. 29,791.67 20,487.50 n.a. 337.92
62.83 73.58 14.14 30,000.00 n.a. 23,687.50 15,333.33 n.a. 344.58 57.79 n.a. 15.01 n.a. n.a. n.a. 12,068.75 n.a. 394.42
64.03 72.88 16.99 51,677.26 61,862.94 32,526.64 15,553.72 21,138.47 447.11
70.29 74.79 11.95 90,000.00 100,000.00 40,000.00 n.a. 21,815.63 312.63 61.56 66.87 11.52 54,601.61 60,723.69 42,939.05 19,376.71 23,075.79 403.38 67.07 84.85 11.86 79,014.13 82,583.58 31,951.34 23,758.62 21,768.93 392.64
65.93 n.a. 12.90 59,677.08 65,896.55 31,891.67 13,681.44 n.a. 380.57 63.07 73.96 13.10 43,168.05 70,962.49 36,263.87 21,961.78 19,027.69 365.92 65.94 n.a. 12.19 n.a. n.a. 45,479.17 25,818.05 n.a. 379.19
67.16 82.94 12.36 66,880.32 50,968.96 40,046.47 21,916.67 n.a. 714.56 69.17 70.59 12.72 43,518.52 45,000.00 25,075.66 9,000.00 n.a. 512.78 69.74 80.50 12.21 32,105.41 40,000.00 22,470.56 17,833.33 n.a. 422.05
69.26 69.50 13.30 n.a. 79,127.08 15,986.03 17,057.56 n.a. 609.77 65.33 n.a. 14.58 150,000.00 89,027.79 34,645.83 30,097.25 n.a. 703.25 66.00 80.00 14.70 38,250.00 78,472.22 37,791.67 11,243.75 n.a. 464.58 61.83 68.93 12.19 53,749.83 n.a. 35,749.98 18,516.63 n.a. 719.71 69.61 79.83 14.57 n.a. n.a. n.a. n.a. n.a. n.a.
73.91 84.51 14.53 n.a. 59,044.42 n.a. n.a. n.a. n.a. 70.76 75.52 13.50 49,380.71 51,966.67 40,083.31 13,520.79 10,937.50 803.54 74.17 90.22 13.39 77,263.25 59,953.58 34,833.33 19,879.34 n.a. 590.83
66.42 75.61 12.21 50,466.26 77,261.72 39,264.25 16,868.70 25,888.96 350.37 69.50 78.01 11.82 64,083.33 73,656.25 34,361.99 13,775.58 16,098.86 392.22
65.89 69.48 13.37 44,521.69 55,638.29 29,376.96 12,452.35 16,097.95 457.76 72.29 77.81 12.03 64,451.39 76,752.67 46,393.80 17,199.97 32,102.08 349.91
59.90 65.00 13.27 n.a. 39,502.19 28,491.12 14,068.40 n.a. 419.40 67.75 80.02 13.03 n.a. n.a. 37,500.00 21,687.50 n.a. 343.80
65.05 79.18 13.04 29,500.00 45,000.00 27,500.00 14,625.00 n.a. 362.50 61.30 n.a. 12.99 n.a. 62,500.00 n.a. 13,902.08 10,167.00 404.30
67.29 77.48 12.77 56,901.29 66,151.31 34,579.34 17,833.78 20,338.47 487.82
n.a.–Notavailable Source:DepartmentofCensusandStatistics
(a)Provisionaln.a.–Notavailable Source:DepartmentofCensusandStatistics

AGRICULTURE53
Fish Production 2013 – 2017
Table 5.15
Year Category Western Central Southern Northern EasternNorth
WesternNorthCentral
UvaSabara-gamuwa
Total
Note:FreshWaterCraftsincludedtoCreftslistin2013(a)Revised(b)Provisional
2013 MarineFish InlandFish
Total
2014 MarineFish InlandFish
Total
2015 MarineFish InlandFish
Total
2016 MarineFish InlandFish
Total
2017(a) MarineFish InlandFish
Total
94,030 – 140,620 55,640 84,570 71,070 – – – 445,930 1,369 3,043 8,137 3,539 11,225 13,160 17,160 7,506 1,771 66,910
95,399 3,043 148,757 59,179 95,795 84,230 17,160 7,506 1,771 512,840
85,320 – 152,790 72,730 75,720 72,740 – – – 459,300 1,244 2,029 7,090 3,583 12,199 10,719 23,883 11,009 3,994 75,750
86,564 2,029 159,880 76,313 87,919 83,459 23,883 11,009 3,994 535,050
75,380 – 156,530 72,560 70,800 77,620 – – – 452,890 1,315 1,699 4,926 3,736 11,764 13,240 19,100 8,643 2,877 67,300
76,695 1,699 161,456 76,296 82,564 90,860 19,100 8,643 2,877 520,190
83,550 – 149,950 75,470 72,460 75,560 – – – 456,990 1,850 2,150 5,545 6,405 17,950 16,385 16,515 4,665 2,465 73,930
85,400 2,150 155,495 81,875 90,410 91,945 16,515 4,665 2,465 530,920
78,095 – 144,600 83,155 77,790 65,800 – – – 449,440 1,665 2,970 10,640 7,170 19,525 9,595 24,070 3,995 2,240 81,870
79,760 2,970 155,240 90,325 97,315 75,395 24,070 3,995 2,240 531,310
MetricTons
(a)Provisional Source:MinistryofFisheriesandAquaticResources
Operating Fishing Craft by Province and Type 2013 – 2017 Table 5.16
Type/Year Western Central Southern Northern EasternNorth
WesternNorthCentral
UvaSabara-gamuwa
Total
In board Engine – Multi Day 2013 2014 2015 2016(a)
2017(b)
In board Engine – Single Day 2013 2014 2015 2016 2017(b)
Out board Engine – Fibre Glass 2013 2014 2015 2016 2017(b)
Traditional Mechanized 2013 2014 2015 2016 2017(b)
Traditional Non-Mechanized 2013 2014 2015 2016 2017(b)
Total Craft 2013 2014 2015 2016 2017(b)
1,151 – 1,975 84 681 220 – – – 4,111 1,211 – 2,154 266 574 242 – – – 4,447 1,088 – 2,229 62 626 213 – – – 4,218 819 – 2,210 101 647 219 – – – 3,996 1,166 – 2,098 126 617 189 – – – 4,196
127 – 158 118 352 47 – – – 802 155 – 200 176 345 – – – – 876 120 – 168 151 277 3 – – – 719 75 – 148 309 254 – – – – 786 53 – 128 559 128 – – – – 868
2,764 – 2,394 5,596 7,425 4,955 – – – 23,134 3,034 – 2,654 9,844 3,411 5,039 – – – 23,982 4,142 – 2,695 6,831 4,608 5,752 – – – 24,028 3,985 – 2,472 7,291 4,866 5,668 – – – 24,282 2,328 – 2,058 8,159 4,752 5,097 – – – 22,394
283 – 542 777 666 246 – – – 2,514 299 – 585 1,062 512 262 – – – 2,720 12 – 696 769 233 162 – – – 1,872 6 – 632 797 232 172 – – – 1,839 7 – 600 1,155 207 216 – – – 2,185
2,657 467 3,352 4,467 11,068 4,619 2,151 741 161 29,703 2,755 505 3,257 7,723 8,529 4,629 2,151 805 145 30,499 2,453 505 3,713 4,773 9,358 4,253 2,226 853 145 28,279 2,167 578 2,994 5,814 10,330 4,255 2,334 784 171 29,427 1,977 590 2,616 5,045 9,507 3,877 2,405 795 180 26,992
6,928 467 8,421 11,042 20,212 10,087 2,151 741 161 60,264 7,454 505 8,850 19,071 13,371 10,172 2,151 805 145 62,524 7,815 505 9,501 12,586 15,102 10,383 2,226 853 145 59,116 7,052 578 8,456 14,312 16,329 10,314 2,334 784 171 60,330 5,531 590 7,500 15,044 15,211 9,379 2,405 795 180 56,635
Source:MinistryofFisheriesandAquaticResources
Numbers

AGRICULTURE54
Cultivation Loans – Refinance Credit Schemes(a)
(PositionasatEndofDecember)
(a) CreditSchemes:From1973toYala1986ComprehensiveRuralCreditScheme. SinceYala1986NewComprehensiveRuralCreditScheme.(b) Revised(c) Provisionaldata–Recoveryisinprogress.
Sources: BankofCeylon CommercialBank DFCCBank HattonNationalBank LankaputhraDevelopmentBank NationalDevelopmentBank People’sBank RegionalDevelopmentBank SampathBank SANASADevelopmentBank SeylanBank UnionBank
1989/90 372 181 553 328 156 484 88.2 86.4 87.61990/91 588 234 822 503 190 694 86.0 81.0 84.01991/92 595 235 830 465 161 626 78.2 68.5 75.41992/93 569 255 824 461 188 649 81.0 73.7 78.81993/94 624 293 917 418 189 607 67.0 64.5 66.21994/95 723 257 980 597 176 773 82.6 68.5 78.91995/96 476 192 668 318 153 471 66.8 79.7 70.51996/97 412 178 590 325 151 476 78.9 84.8 80.71997/98 327 152 479 244 67 311 74.6 44.1 64.91998/99 312 151 463 235 71 306 75.3 47.0 66.11999/2000 557 204 761 492 181 673 88.3 88.7 88.42000/01 517 244 761 484 201 685 93.6 82.4 92.42001/02 591 233 824 570 215 785 96.4 92.3 95.32002/03 893 270 1,163 832 232 1,064 93.2 85.9 91.52003/04 982 475 1,457 853 424 1,277 86.9 89.3 87.62004Yala 308 253 561 281 220 501 91.2 87.0 89.32004/2005Maha 691 325 1,016 592 285 877 85.7 87.7 86.32005Yala 467 303 770 421 265 686 90.2 87.5 89.12005/2006Maha 552 387 939 503 347 850 91.1 89.7 90.52006Yala 432 358 790 397 314 711 91.9 87.7 90.02006/2007Maha 559 520 1,079 525 460 985 93.9 88.5 91.32007Yala 598 472 1,070 543 421 964 90.8 89.2 90.12007/2008Maha 807 977 1,784 782 886 1,668 96.9 90.7 93.52008Yala 837 638 1,475 812 533 1,345 97.0 83.5 91.22008/2009Maha 1,158 970 2,128 1,096 787 1,883 94.7 81.1 88.52009Yala 760 599 1,359 710 549 1,259 93.4 91.7 92.62009/2010Maha 1,402 857 2,259 1,280 734 2,014 91.3 85.7 89.22010Yala 1,139 686 1,825 832 343 1,175 73.0 50.0 64.42010/2011Maha 2,443 1,503 3,946 2,396 977 3,373 98.1 65.0 85.52011Yala 1,975 1,250 3,224 1,796 1,102 2,897 90.9 88.1 89.92011/2012Maha 3,752 2,534 6,286 3,046 2,168 5,214 81.2 85.6 82.92012Yala 1,775 2,009 3,783 1,521 1,657 3,177 85.7 82.5 84.02012/2013Maha 3,527 3,117 6,644 2,625 2,209 4,833 74.4 70.9 72.82013Yala 1,900 1,328 3,228 1,830 1,202 3,031 96.3 90.5 93.92013/2014Maha 3,174 1,978 5,152 2,698 1,780 4,477 85.0 90.0 86.92014Yala 1,588 1,307 2,894 1,493 1,114 2,607 94.0 85.3 90.12014/2015Maha 3,261 3,390 6,650 2,872 2,416 5,287 88.1 71.3 79.52015Yala 2,321 2,839 5,160 1,918 1,505 3,423 82.6 53.0 66.32015/2016Maha(b) 3,701 3,637 7,337 3,228 1,816 5,044 87.2 49.9 68.72016Yala(b) 2,683 3,533 6,216 2,125 1,186 3,311 79.2 33.6 53.32016/2017Maha(c) 3,232 3,041 6,273 2,922 1,665 4,587 90.4 54.7 73.12017Yala(c) 2,073 2,351 4,424 1,608 934 2,542 77.6 39.7 57.5
Table 5.17
CultivationYear
LoansGranted(Rs.Mn.) Recoveries(Rs.Mn.) PercentofRecoveries
Paddy OtherCrops
AllCrops Paddy Other
CropsAll
Crops Paddy OtherCrops
AllCrops
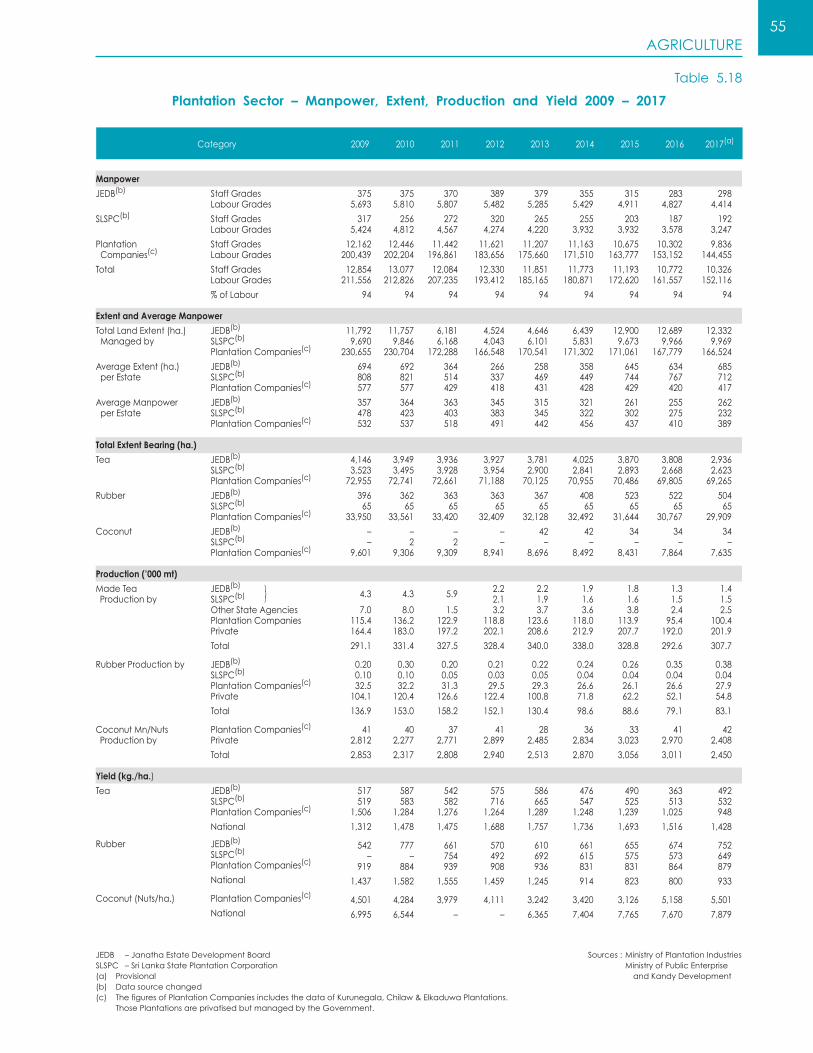
AGRICULTURE55
Plantation Sector – Manpower, Extent, Production and Yield 2009 – 2017
Table 5.18
Manpower
JEDB(b)
SLSPC(b)
PlantationCompanies(c)
Total
Extent and Average Manpower
TotalLandExtent(ha.)Managedby
AverageExtent(ha.)perEstate
AverageManpowerperEstate
Total Extent Bearing (ha.)
Tea
Rubber
Coconut
Production (’000 mt)
MadeTea Productionby
RubberProductionby
CoconutMn/Nuts Productionby
Yield (kg./ha.)
Tea
Rubber
Coconut(Nuts/ha.)
StaffGradesLabourGrades
StaffGradesLabourGrades
StaffGradesLabourGrades
StaffGradesLabourGrades
%ofLabour
JEDB(b)
SLSPC(b)
PlantationCompanies(c)
JEDB(b)
SLSPC(b)
PlantationCompanies(c)
JEDB(b)
SLSPC(b)
PlantationCompanies(c)
JEDB(b)
SLSPC(b)
PlantationCompanies(c)
JEDB(b)
SLSPC(b)
PlantationCompanies(c)
JEDB(b)
SLSPC(b)
PlantationCompanies(c)
JEDB(b)
SLSPC(b)
OtherStateAgenciesPlantationCompaniesPrivate
Total
JEDB(b)
SLSPC(b)
PlantationCompanies(c)
Private
Total
PlantationCompanies(c)
Private
Total
JEDB(b)
SLSPC(b)
PlantationCompanies(c)
National
JEDB(b)
SLSPC(b)
PlantationCompanies(c)
National
PlantationCompanies(c)
National
Category 2009 2010 2011 2012 2013 2014 2015 2016 2017(a)
375 375 370 389 379 355 315 283 298 5,693 5,810 5,807 5,482 5,285 5,429 4,911 4,827 4,414
317 256 272 320 265 255 203 187 192 5,424 4,812 4,567 4,274 4,220 3,932 3,932 3,578 3,247
12,162 12,446 11,442 11,621 11,207 11,163 10,675 10,302 9,836 200,439 202,204 196,861 183,656 175,660 171,510 163,777 153,152 144,455
12,854 13,077 12,084 12,330 11,851 11,773 11,193 10,772 10,326 211,556 212,826 207,235 193,412 185,165 180,871 172,620 161,557 152,116
94 94 94 94 94 94 94 94 94
11,792 11,757 6,181 4,524 4,646 6,439 12,900 12,689 12,332 9,690 9,846 6,168 4,043 6,101 5,831 9,673 9,966 9,969 230,655 230,704 172,288 166,548 170,541 171,302 171,061 167,779 166,524
694 692 364 266 258 358 645 634 685 808 821 514 337 469 449 744 767 712 577 577 429 418 431 428 429 420 417
357 364 363 345 315 321 261 255 262 478 423 403 383 345 322 302 275 232 532 537 518 491 442 456 437 410 389
4,146 3,949 3,936 3,927 3,781 4,025 3,870 3,808 2,936 3,523 3,495 3,928 3,954 2,900 2,841 2,893 2,668 2,623 72,955 72,741 72,661 71,188 70,125 70,955 70,486 69,805 69,265
396 362 363 363 367 408 523 522 504 65 65 65 65 65 65 65 65 65 33,950 33,561 33,420 32,409 32,128 32,492 31,644 30,767 29,909
– – – – 42 42 34 34 34 – 2 2 – – – – – – 9,601 9,306 9,309 8,941 8,696 8,492 8,431 7,864 7,635
4.3 4.3 5.9 2.2 2.2 1.9 1.8 1.3 1.4 2.1 1.9 1.6 1.6 1.5 1.5 7.0 8.0 1.5 3.2 3.7 3.6 3.8 2.4 2.5 115.4 136.2 122.9 118.8 123.6 118.0 113.9 95.4 100.4 164.4 183.0 197.2 202.1 208.6 212.9 207.7 192.0 201.9
291.1 331.4 327.5 328.4 340.0 338.0 328.8 292.6 307.7
0.20 0.30 0.20 0.21 0.22 0.24 0.26 0.35 0.38 0.10 0.10 0.05 0.03 0.05 0.04 0.04 0.04 0.04 32.5 32.2 31.3 29.5 29.3 26.6 26.1 26.6 27.9 104.1 120.4 126.6 122.4 100.8 71.8 62.2 52.1 54.8
136.9 153.0 158.2 152.1 130.4 98.6 88.6 79.1 83.1
41 40 37 41 28 36 33 41 42 2,812 2,277 2,771 2,899 2,485 2,834 3,023 2,970 2,408
2,853 2,317 2,808 2,940 2,513 2,870 3,056 3,011 2,450
517 587 542 575 586 476 490 363 492 519 583 582 716 665 547 525 513 532 1,506 1,284 1,276 1,264 1,289 1,248 1,239 1,025 948
1,312 1,478 1,475 1,688 1,757 1,736 1,693 1,516 1,428
542 777 661 570 610 661 655 674 752 – – 754 492 692 615 575 573 649 919 884 939 908 936 831 831 864 879
1,437 1,582 1,555 1,459 1,245 914 823 800 933
4,501 4,284 3,979 4,111 3,242 3,420 3,126 5,158 5,501
6,995 6,544 – – 6,365 7,404 7,765 7,670 7,879
Sources:MinistryofPlantationIndustries MinistryofPublicEnterprise andKandyDevelopment
JEDB –JanathaEstateDevelopmentBoardSLSPC –SriLankaStatePlantationCorporation(a) Provisional(b) Datasourcechanged(c) ThefiguresofPlantationCompaniesincludesthedataofKurunegala,Chilaw&ElkaduwaPlantations. ThosePlantationsareprivatisedbutmanagedbytheGovernment.

AGRICULTURE56
(a)Revised(b)Provisional
LB–LeftBankRB–RightBank
Settlements (Families)
SystemB(LB)SystemCSystemDSystemGSystemHSystemLUdawalawe(LB+RB)Victoria/Kotmale/RambakenoyaHuruluWewa–Dambulla
Land Cultivated (Hectares)
System H
PaddyOtherCrops
System C
PaddyOtherCrops
System B
PaddyOtherCrops
System G
PaddyOtherCrops
System L
PaddyOtherCrops
Udawalawe
PaddyOtherCrops
System D & Rambaken Oya
PaddyOtherCrops
Total
PaddyOtherCrops
1,049 396 1,360 909 726 658 608 – 2,970 – 253 107 1,612 – 199 481 1,373 20 1,200 547 – – – – – 321 53 – 100 46 – – 101 – 96 191 98 3 1,371 352 54 – – 5 – – 5 290 2,015 356 – 569 485 1,426 630 2,429 64 – 1,755 1,802 2,931 354 340 – 143 10 221 40 5,975 92 – – 26 2 88 62 5 14 810 102 – – – – – – 295 360 817 –
67,529 49,964 67,838 70,993 59,509 67,367 38,789 51,311 36,816 24,069
51,263 36,729 50,508 53,119 44,100 47,172 26,355 42,040 29,508 13,186 16,266 13,235 17,330 17,874 15,409 20,195 12,434 9,271 7,308 10,883
46,685 35,813 46,617 46,163 46,171 47,122 39,639 47,403 47,406 36,600
43,184 31,949 44,702 45,645 44,554 44,244 33,990 44,900 44,704 34,086 3,501 3,864 1,915 518 1,617 2,878 5,649 2,503 2,702 2,514
35,920 33,024 41,222 41,331 40,591 37,407 32,086 40,519 39,695 29,595
33,875 30,370 38,512 38,039 37,898 34,044 30,139 41,332 38,020 28,879 2,045 2,654 2,710 3,292 2,693 3,363 1,947 1,187 1,675 716
11,223 8,496 11,522 10,444 6,305 10,020 7,931 12,535 9,782 8,105
9,727 7,641 10,132 9,356 5,362 8,889 7,326 11,168 8,675 7,000 1,496 855 1,390 1,088 943 1,131 605 1,367 1,107 1,105
953 1,436 2,167 1,767 3,050 3,437 1,320 2,758 2,612 2,021
777 1,121 1,557 999 2,054 2,437 715 2,045 2,149 1,319 176 315 610 768 996 1,000 605 713 463 702
39,059 40,394 43,338 45,229 43,333 45,839 26,489 28,836 27,620 10,052
20,147 21,583 27,081 27,956 24,799 24,444 22,092 24,804 22,806 7,319 18,912 18,811 16,257 17,273 18,534 21,395 4,397 4,032 4,814 2,733
– – – – – – 249 2,792 3,620 1,179
– – – – – – 116 1,144 1,542 762 – – – – – – 133 1,648 2,078 417
201,369 169,127 212,704 215,927 198,959 211,192 146,503 186,699 167,551 111,621
158,973 129,393 172,492 175,114 158,767 161,230 120,733 167,433 147,404 92,551 42,396 39,734 40,212 40,813 40,192 49,962 25,770 20,721 20,147 19,070
Settlements and Land Cultivated under Mahaweli Programme 2008 – 2017
Table 5.19
Source:MahaweliAuthorityofSriLanka
Item 2008 2009 2010 2011 2012 2013 2014(a) 2015 2016(b) 2017(b)

INDUSTRY57
Sugar 2008 – 2017
Milk and Milk Products 2008 – 2017
Table 6.1
Table 6.2
Item 2008 2009 2010 2011 2012 2013 2014 2015 2016 2017(a)
Item 2008 2009 2010 2011 2012 2013 2014 2015 2016 2017(a)
Sugar Cane
TotalArea(withratoons),Ha. AreaHarvested,Ha. CaneHarvested,’000MT AverageYieldperHectare,MT
Sugar Production, MT
Sevanagala Pelwatta Galoya
Cost of Sugar Production, Rs./kg.
Sevanagala Pelwatta Galoya
Sugar Imports
Volume,MT’000 Value,Rs.Mn. ImportPrice(C.I.F.),Rs./MT
Sugar Availability, MT ’000
Per Capita, kg.
7,294 7,320 7,360 6,992 9,208 11,801 12,608 12,135 11,784 10,915 6,271 6,200 5,988 6,024 7,034 9,329 11,045 9,005 11,676 9,945 348 287 272 290 348 534 576 572 653 591 56 47 50 45 54 67 75 89 58 61
39,378 32,168 31,336 34,875 35,659 53,061 52,318 55,972 61,265 55,552
10,978 8,718 8,602 6,015 9,631 14,190 14,417 14,377 17,234 15,198 28,400 23,450 22,734 28,860 22,712 28,358 17,964 27,612 34,188 27,643 – – – – 3,316 10,513 19,937 13,994 9,843 12,711
58.32 63.00 65.00 n.a. 68.00 98.00 104.76 99.09 125.00 133.00 83.66 96.36 93.80 82.00 112.00 104.00 161.62 132.39 133.00 153.00 – – – – 91.00 98.15 102.52 134.62 124.45 114.00
571 466 548 606 569 548 520 624 651 498 21,988 25,045 41,077 47,091 43,872 37,187 33,332 34,164 49,919 39,041 38,533 53,717 74,987 77,764 77,149 67,904 64,142 54,753 76,660 78,402
608.66 494.42 579.12 640.88 604.66 601.06 572.00 679.98 713.18 553.50
30.11 24.18 28.04 30.71 29.84 29.34 27.66 32.43 33.64 25.81
(a) Provisionaln.a. – Not available
Sources :Department of Census and Statistics Pelwatta Sugar Industries Ltd. Sevanagala Sugar Industries Ltd. Galoya Plantations Pvt. Ltd. Sri Lanka Customs Central Bank of Sri Lanka
Milk Collection, Litres ’000
MilkIndustriesofLankaCo.,Ltd.
NestleLankaLtd.
Finished Products
LiquidMilk,Litres’000(b)
PasteurisedMilk(b)
SterilisedMilk(b)
CondensedMilk,Kgs.’000(b)
MilkPowder,Kgs.’000(c)
Imports of Milk Products
InfantMilkFood,MT
OtherMilkFood,MT’000
87,845 91,844 99,410 95,710 68,386 66,234 61,478 64,583 70,094 96,202
53,590 54,870 55,530 52,813 68,386 66,234 61,478 64,583 70,094 96,202
34,255 36,974 43,880 42,897 n.a. n.a. n.a. n.a. n.a. n.a.
13,585 13,837 23,190 18,965 7,768(b) 6,859(b) 6,063 5,927 6,201 5,428 8,692 8,217 7,427 6,931 3,574(b) 3,263(b) 3,163 3,900 3,425 3,527 4,893 5,620 15,763 12,034 4,194(b) 3,596(b) 2,900 2,027 2,776 1,901
4,031 3,637 4,743 4,137 4,621(b) 4,188(b) 4,076 3,495 n.a. n.a.
7,886 8,421 9,593 8,720 14,242 13,185 11,878 11,113 11,140 n.a.
1,343 1,442 911 1,756 1,446 1,545 1,172 1,613 1,659 2,179
66 65 76 88 84 69 71 86 100 99
Sources:CeylonColdStoresLtd. MilkIndustriesofLankaCo.Ltd.(MILCO) NestleLankaLtd.(NLL) SriLankaCustoms
(a) Provisional(b) ExcludingNLL.(c) Thisfigureincludesimportedpowderedmilkandotherpowderedmaltproductsupto2007. From2008onwards,includesonlydomesticproductions.n.a.–Notavailable

INDUSTRY58
Textiles 2009 – 2017
Table 6.3
Item 2009 2010 2011 2012 2013 2014 2015 2016 2017(a)
Exports of Textiles and Garments
Yarn Mn.kgs. Rs.Mn.
Fabric Mn.kgs. Rs.Mn.
Fibre Mn.kgs. Rs.Mn.
OtherMadeUpTextile Mn.kgs. Articles Rs.Mn.
Garments Rs.Mn.
Total Exports Rs. Mn.
Export Markets (% of Value of Garment Exports)
USA Germany UK France Netherland Canada Italy
Imports of Textiles and Textile Articles
Yarn Mn.kgs. Rs.Mn.
Fabric Mn.kgs. Rs.Mn.
Fibre Mn.kgs. Rs.Mn.
ClothingAccessories Mn.kgs. Rs.Mn.
Silk,Wool,Cotton,etc., Mn.kgs. inrawform Rs.Mn.
TextileArticles Mn.kgs. Rs.Mn.
Total Value of Imports Rs. Mn.
17 15 17 18 19 22 21 21 22 4,808 5,621 6,272 7,461 7,543 8,844 8,555 10,121 10,516
19 18 17 13 15 16 17 19 19 6,365 7,958 9,363 11,807 15,917 11,791 13,813 15,607 18,185
6 9 12 7 6 12 11 10 7 239 368 504 392 564 3,231 3,609 3,437 2,612
11 15 19 40 11 12 15 14 15 4,858 6,124 6,579 6,735 7,363 8,472 10,013 11,807 13,317
358,374 359,113 440,791 482,212 551,659 611,350 618,803 669,796 722,624
374,645 379,185 463,509 508,607 583,046 643,688 654,794 710,768 767,254
41.2 40.8 39.5 39.9 42.9 42.5 46.3 45.7 45.2 5.7 5.5 5.2 5.0 4.4 3.9 4.3 4.2 4.3 27.1 25.2 23.1 23.4 21.1 19.3 17.9 18.0 16.9 1.8 1.7 2.0 2.4 2.7 3.5 2.5 1.6 1.4 1.9 2.8 1.8 1.1 1.4 1.9 2.1 1.9 2.1 1.3 1.7 1.8 2.0 1.8 1.6 1.8 2.1 2.2 11.2 11.0 12.1 10.9 9.6 10.7 7.8 7.6 9.1
61 71 62 66 61 71 82 82 80 25,002 35,800 38,358 40,631 37,782 44,484 48,064 53,560 55,655
181 197 224 217 205 216 232 265 263 137,148 155,780 203,883 234,192 210,863 240,882 242,395 317,396 338,519
8 7 7 7 11 22 37 27 17 2,131 2,282 2,650 2,486 3,452 6,702 10,912 8,665 6,079
3 3 4 6 3 3 3 4 4 7,384 6,606 7,036 7,502 6,424 5,968 5,304 8,031 8,106
4 5 6 7 7 8 9 8 11 1,832 1,893 2,159 2,317 2,420 2,825 2,785 2,977 3,666
1 1 2 5 2 2 2 2 2 2,183 2,181 2,507 2,418 3,360 3,047 2,505 3,267 3,361
175,681 204,542 256,592 289,546 264,302 303,907 311,965 393,896 415,386
Source:SriLankaCustoms(a)Provisional
Textiles Garment Exports
800
600
400
Rs.
Bn
.
20172009 2010 2011 2012 201620152013 20140
Exports of Textiles & Garments
Imports of Textiles & Textile Articles
200

INDUSTRY59
Petroleum 2008 – 2017
Minerals 2008 – 2017
Table 6.4
Table 6.5
Item 2008 2009 2010 2011 2012 2013 2014 2015 2016 2017(a)
Item 2008 2009 2010 2011 2012 2013 2014 2015 2016 2017(a)
1,853 2,066 1,819 2,070 1,486 1,743 1,824 1,763 1,685 1,591 143,159 111,715 120,180 183,056 157,758 182,064 187,760 100,578 86,969 107,397
2,396 2,162 2,882 3,501 3,961 2,907 3,385 3,321 3,885 4,895 222,235 138,190 222,273 335,225 467,058 352,984 391,651 244,148 246,233 375,374
164 179 158 206 152 144 152 154 166 165 111 83 93 93 75 57 65 75 104 60 732 781 686 779 648 724 641 552 479 431 451 485 442 501 411 390 496 510 583 506 – – – – – – – – – – 154 195 126 155 93 125 168 155 148 236 16 24 23 24 17 20 28 7 9 19 45 42 35 46 27 5 – – – – 100 105 84 80 71 87 117 135 144 142 3 17 2 3 4 n.a. 3 2 1 – – – – – – – – – – – 27,553 15,447 29,761 61,170 58,902 55,128 44,132 50,461 41,794 66,280
8,259.8 7,912.3 7,944.5 10,523.0 14,982.2 16,765.0 22,582.9 22,234.5 21,712.8 22,108.4
8,096.2 7,754.3 7,802.1 10,375.7 14,757.6 16,643.8 22,442.7 22,132.2 19,903.5 22,075.6
163.6 158.0 142.4 147.3 224.6 121.2 140.2 102.3 101.6 32.8
6,136 915 766 842 1,018 848 565 718 799(c) 811(c)
5,176 3,018 3,231 3,341 3,094 3,083 3,116 2,834 3,163 3,123 378 260 454 479 561 569 615 531 668 722 73,055 86,011 140,533 143,376 181,346 184,487 197,463 187,236 211,274 231,032
56,824 31,967 53,361 68,085 44,707 42,685 32,972 39,439 17,457 53,734
16,731 74,074 36,692 38,122 51,187 15,806 26,956 40,909 30,595 36,994 214 414 344 923 2,000 436 480 418 335 914
3,405 2,133 2,493 1,970 1,590 1,406 2,111 1,808 2,237 2,174
6,090 6,661 2,608 2,302 1,648 1,040 2,753 1,170 2,121 1,976 231 163 189 295 516 151 330 119 228 215
Crude Oil Imports
Quantity,MT’000 Value(C.I.F.),Rs.Mn. Refined Products Imports(b)
Quantity,MT’000 Value(C.I.F.),Rs.Mn. Processed in Sri Lanka, MT ’000
Petrol Kerosene FurnaceOil AutoDiesel MarineandHeavyDiesel AviationFuel(Avtur) LiquidPetroleumGas Asphalts(Bitumen) Naptha(Chemical) Solvents LocallyBlendedLubricationOil Exports, Rs. Mn.
(a)Provisional
(b)Excludingcoal.
n.a.–Notavailable
Sources : CeylonPetroleumCorporationandotherExportersofPetroleum
LankaIOCPLC
SriLankaCustoms
Precious & Semi Precious Stones
Exports,Rs.Mn.
GemExports
GeudaExports
Graphite–
Production,MT(b)
Exports –Quantity,MT –Value,Rs.Mn. –AveragePrice,Rs./MT
Ilmenite–
Production,MT(d)
Exports –Quantity,MT –Value,Rs.Mn.
Rutile–
Production,MT
Exports –Quantity,MT –Value,Rs.Mn.
(a)Provisional(b)DoesnotincludedatafromBogalaGraphiteLankaLtd.from2009.(c)OnlyKahatagalaGraphiteproduction.(d)IncludesproductionofHi-Ti-Ilmenitefrom2010.
Sources:LankaMineralSandsLtd. NationalGemandJewelleryAuthority BogalaGraphiteLankaLtd. KahatagahaGraphiteLankaLtd. SriLankaCustoms

INDUSTRY60
Electricity 2008 – 2017
Table 6.7
Item 2008 2009 2010 2011 2012 2013 2014 2015 2016 2017(a)
2,645 2,684 2,817 3,148 3,312 3,362 3,932 3,847 4,018 4,138
1,207 1,207 1,207 1,207 1,357 1,361 1,377 1,377 1,384 1,384 548 548 548 554 554 564 544 604 604 604 – – – 300 300 300 900 900 900 900 3 3 3 3 3 3 3 3 3 3
138 172 175 194 227 267 288 307 342 353 737 742 842 842 784 771 671 511 611 689 12 12 42 48 87 96 150 145 174 206
1,922 1,868 1,955 2,163 2,146 2,164 2,152 2,283 2,453 2,523
9,901 9,882 10,714 11,528 11,801 11,898 12,357 13,090 14,149 14,671
3,700 3,356 4,988 4,018 2,727 5,990 3,632 4,904 3,481 3,059 2,083 2,091 1,394 1,494 2,029 1,283 1,696 1,050 2,297 2,529 – – – 1,038 1,404 1,469 3,202 4,443 5,047 5,103 3 3 3 3 2 2 2 1 2 2
428 525 646 601 565 916 902 1,065 739 945 3,680 3,883 3,601 4,253 4,906 1,977 2,610 1,225 2,164 2,516 6 23 83 121 168 260 313 401 419 517
8,417 8,441 9,268 10,024 10,475 10,621 11,063 11,786 12,785 13,430
2,799 2,927 3,186 3,430 3,577 3,546 3,585 3,943 4,272 4,463
2,678 2,518 2,870 3,131 3,285 3,344 3,498 3,608 3,864 4,041 202 219 232 252 272 274 275 291 330 315 1,386 1,316 1,473 1,574 1,628 1,676 1,726 1,812 1,942 1,987 1,090 983 1,165 1,306 1,385 1,394 1,497 1,504 1,591 1,739
1,703 1,768 1,903 2,087 2,202 2,316 2,520 2,681 2,987 3,222
1,130 1,120 1,201 1,267 1,302 1,308 1,352 1,446 1,553 1,595
108 108 108 109 109 108 108 108 109 108
Installed Capacity, MW
CEB Hydro FuelOil(b)
Coal Other
Private Hydro–Small FuelOil(c)
Other
Maximum Demand, MW
Units Generated, GWh
CEB Hydro FuelOil(b)
Coal Other
Private Hydro–Small FuelOil(c)
Other
Sales, GWh
DomesticandReligious
Industrial SmallUnits MediumUnits LargeUnits
GeneralPurposeandHotel(d)
LECO
StreetLighting
(a) Provisional
(b) Datafrom2011hadbeensplitasfueloilandcoalpower,ascoalpowergenerationcommencedin2011.
(c) InclusiveofIndependentPowerProducers(IPP).
(d) Datafrom2013includesalestogovernmentcategory.
Source:CeylonElectricityBoard
Cement 2008 – 2017
Table 6.6
Item 2008 2009 2010 2011 2012 2013 2014 2015 2016 2017(a)
1,572 1,453 1,737 1,974 2,068 1,910 1,884 2,287 2,695 2,819
2,004 1,702 2,012 2,584 3,796 4,123 4,363 4,092 5,299 5,676 16,784 14,042 14,856 22,222 33,337 40,536 41,304 39,372 50,589 53,498 8,375 8,250 7,385 8,599 8,783 9,832 9,468 9,622 9,547 9,425
10,338 11,279 9,855 10,720 13,097 13,787 13,902 13,160 11,734 11.367
Local Production
ProductionVolume,MT’000
Imports
Volume,MT’000 Value,Rs.Mn. ImportsPrice(C.I.F.),Rs.perMT
Price, Rs. per MT (Annual Avg.)(b)
(a)Provisional Sources:Holcim(Lanka)Limited(b)Ex-factorypriceperMT TokyoCementCompanyLankaPLC SriLankaCustoms

INDUSTRY61
Gross Generation of Electricity by Power Stations – 2016 and 2017
Table 6.8
PowerStation CapacityMW Jan Feb Mar Apr May Jun Jul Aug Sep Oct Nov Dec Total
CEB Hydro Laxapana Complex Canyon OldLaxapana NewLaxapana Wimalasurendra Polpitiya Sub Total Mahaweli Complex Ukuwela Bowetanne Victoria UpperKotmale Kotmale Randenigala Rantambe Sub Total Samanalawewa Kukule Mini Hydro (CEB) Inginiyagala UdaWalawe Nilambe Sub Total Total Hydro Wind Power Thermal Kelanitissa:Steam Gas Gas(New) CombinedCycle Sapugaskanda SapugaskandaExt. BurgeMounted UthuruJanani Total Thermal Oil PuttalamCoal Total ThermalTotal CEBPrivate MiniHydro(Private) ORE(a) Thermal Total Private
Grand Total
60.00 10.82 14.62 17.67 11.36 4.68 12.07 12.54 6.02 6.10 9.70 7.05 10.10 122.73 53.80 18.46 27.07 17.72 16.62 26.72 37.30 22.26 13.01 15.66 18.18 15.27 8.97 237.24 116.00 34.09 44.25 54.22 36.57 33.37 46.91 42.63 25.06 23.98 33.33 25.79 32.42 432.62 50.00 7.38 11.85 7.38 6.82 8.07 13.64 7.74 2.98 4.84 6.44 4.57 2.98 84.69 75.00 25.37 33.27 32.12 22.65 31.51 46.13 31.02 18.22 19.14 25.14 21.27 19.92 325.74 354.80 96.12 131.06 129.10 94.02 104.35 156.05 116.18 65.29 69.72 92.79 73.94 74.39 1,203.02 40.00 12.92 13.65 9.18 4.68 9.97 20.53 21.93 15.30 10.07 11.09 17.27 11.55 158.13 40.00 4.79 2.38 2.29 0.75 6.50 4.50 4.74 4.09 3.88 1.20 4.16 3.14 42.41 210.00 100.65 62.48 49.47 34.10 37.93 70.64 44.19 42.98 33.54 48.83 38.41 26.25 589.47 150.00 24.62 10.84 8.76 10.07 45.54 32.03 26.25 22.06 18.96 10.89 17.77 7.01 234.81 201.00 21.18 28.45 15.61 1.58 29.13 41.54 39.09 30.20 13.47 18.19 19.00 22.76 280.20 122.60 66.32 32.48 18.66 23.13 30.82 39.32 33.23 23.40 7.57 11.15 18.41 19.21 323.71 50.00 30.49 15.25 8.00 9.13 14.77 16.06 14.33 10.44 3.29 4.60 8.31 8.02 142.68 813.60 260.97 165.54 111.97 83.44 174.66 224.62 183.76 148.48 90.77 105.94 123.33 97.93 1,771.41 120.00 38.18 29.92 49.35 35.20 22.22 33.37 13.54 13.44 2.94 2.49 1.10 18.78 260.53 75.00 13.77 6.64 5.33 13.33 37.48 31.97 12.73 11.13 9.15 10.38 36.19 14.05 202.14 11.25 4.20 2.00 0.86 5.95 5.68 6.09 5.70 1.67 1.08 3.37 2.55 2.63 41.78 6.00 2.86 1.91 0.52 2.19 2.86 2.71 2.03 0.47 0.00 0.00 0.00 0.00 15.55 3.20 0.97 0.21 0.16 0.30 0.30 0.91 0.27 0.12 0.04 0.13 0.76 0.14 4.31 20.45 8.04 4.13 1.54 8.43 8.83 9.71 8.00 2.26 1.11 3.50 3.31 2.77 61.64 1,383.85 417.06 337.29 297.29 234.42 347.53 455.71 334.21 240.60 173.70 215.11 237.87 207.93 3,498.72 3.00 0.08 0.08 0.09 0.06 0.18 0.29 0.28 0.31 0.42 0.27 0.02 0.06 2.14 80.00 0.10 1.78 6.38 1.71 1.18 0.15 0.00 0.00 0.18 10.92 9.27 13.06 44.73 115.00 2.07 21.39 56.62 34.56 9.98 0.23 0.00 0.00 17.57 43.76 56.66 20.92 263.75 165.00 0.00 0.00 73.82 97.23 65.18 74.01 87.27 20.07 99.59 82.69 87.79 109.90 797.55 80.00 18.41 25.70 36.44 33.33 17.63 11.30 13.49 28.88 15.66 34.29 40.83 33.21 309.17 80.00 33.12 39.43 49.56 44.97 32.35 33.68 32.37 42.89 41.63 43.58 42.90 39.17 475.67 60.00 20.37 40.56 42.91 15.92 29.87 25.60 31.70 40.11 36.77 36.67 9.94 37.35 367.76 24.00 4.93 7.76 11.60 12.60 7.38 3.75 5.90 10.70 7.14 12.57 9.18 8.10 101.58 604.00 78.99 136.61 277.33 240.32 163.57 148.71 170.72 142.65 218.54 264.49 256.56 261.71 2,360.21 900.00 395.13 342.78 404.87 399.50 376.31 389.83 512.54 566.58 539.24 380.78 359.92 399.40 5,066.89 1,504.00 474.12 479.39 682.21 639.82 539.88 538.53 683.26 709.24 757.78 645.27 616.48 661.11 7,427.09 2,890.85 891.27 816.76 979.59 874.30 887.59 994.54 1,017.75 950.14 931.90 860.65 854.37 869.10 10,927.96 342.16 65.96 35.93 23.20 39.55 118.50 111.27 67.04 60.65 45.82 45.00 88.38 37.39 738.68 173.91 24.84 18.29 15.69 16.44 41.09 61.17 52.46 54.09 56.96 37.06 14.14 26.75 418.97 611.00 167.87 221.64 206.26 224.72 128.55 18.18 81.97 184.26 169.59 284.66 203.29 273.13 2,164.12 1,127.07 258.67 275.86 245.15 280.70 288.14 190.62 201.46 298.99 272.38 366.71 305.81 337.27 3,321.78
4,017.92 1,149.94 1,092.62 1,224.74 1,155.01 1,175.73 1,185.16 1,219.21 1,249.13 1,204.27 1,227.36 1,160.18 1,206.37 14,249.74
Generation in 2016, GWh
Generation in 2017, GWh 60.00 6.73 2.62 3.98 6.52 4.40 0.98 8.97 12.76 17.61 18.77 15.36 17.97 116.67 53.80 10.37 13.27 11.91 11.54 14.71 21.74 13.87 23.12 31.57 30.20 33.70 36.05 252.05 116.00 21.30 8.88 13.83 21.39 24.68 15.03 31.92 51.13 62.97 68.35 51.03 59.08 429.60 50.00 4.17 5.59 4.50 4.55 3.44 5.60 3.84 5.60 10.80 8.76 14.04 15.99 86.87 75.00 14.82 10.21 11.96 15.58 18.84 21.13 24.63 37.55 50.96 51.99 43.49 48.35 349.49 354.80 57.39 40.57 46.17 59.59 66.07 64.49 83.23 130.17 173.91 178.07 157.61 177.42 1,234.69 40.00 6.34 4.63 5.81 11.92 8.68 18.04 19.88 16.93 12.84 4.39 21.70 23.62 154.78 40.00 4.62 2.43 5.40 2.22 1.24 2.96 3.08 2.76 8.10 0.01 17.05 16.22 66.09 210.00 5.98 0.49 9.80 23.47 29.45 25.17 49.54 7.16 13.65 26.91 68.88 27.46 287.95 150.00 7.17 3.95 18.41 8.85 19.01 26.08 12.29 31.41 35.45 46.00 42.31 51.48 302.41 201.00 11.56 9.51 4.36 20.19 4.61 19.81 48.27 20.35 28.55 37.83 45.46 49.98 300.48 122.60 13.95 12.95 6.04 15.79 20.09 19.35 18.75 6.04 2.31 3.35 12.51 10.57 141.71 50.00 7.42 6.51 5.97 7.39 9.27 9.30 9.39 3.24 1.53 3.81 9.52 10.89 84.23 813.60 57.05 40.47 55.79 89.83 92.35 120.72 161.19 87.89 102.43 122.30 217.43 190.21 1,337.65 120.00 9.08 10.33 3.48 19.56 12.26 1.87 25.83 7.62 6.95 11.09 17.95 32.54 158.55 75.00 8.33 5.35 12.66 11.24 28.50 35.50 18.84 34.26 45.32 47.19 35.92 39.58 322.67 11.25 1.13 1.00 0.26 1.99 2.54 2.03 0.95 0.23 0.06 0.05 0.38 0.98 11.58 6.00 0.00 0.20 0.04 0.18 0.98 0.59 0.00 0.00 0.00 0.00 0.09 1.16 3.24 3.20 0.20 0.14 0.80 0.51 0.33 0.52 0.12 0.16 0.45 0.92 1.31 1.39 6.85 20.45 1.33 1.34 1.09 2.69 3.84 3.15 1.07 0.38 0.50 0.97 1.79 3.53 21.67 1,383.85 133.18 98.05 119.19 182.91 203.02 225.72 290.15 260.32 329.11 359.61 430.69 443.28 3,075.24 3.00 0.11 0.15 0.08 0.17 0.35 0.36 0.33 0.29 0.17 0.12 0.04 0.05 2.21 80.00 7.25 5.13 5.61 11.08 8.41 0.16 10.18 1.46 0.32 1.07 2.42 0.00 53.08 115.00 26.45 33.59 30.52 49.53 41.27 10.75 63.66 34.11 8.71 21.00 20.10 8.19 347.88 165.00 84.44 53.75 65.70 90.55 74.42 75.69 70.48 108.83 99.63 82.10 92.23 71.68 969.50 80.00 25.80 22.85 24.96 34.86 34.22 19.55 30.21 22.53 31.74 26.77 23.68 25.44 322.62 80.00 42.72 34.16 30.79 33.99 34.66 31.60 34.37 27.68 23.24 20.00 26.81 30.05 370.07 60.00 39.41 32.57 42.25 41.29 41.60 34.01 32.83 36.32 32.97 32.03 35.42 37.56 438.25 24.00 9.95 4.46 4.53 9.38 10.30 4.44 13.65 9.14 9.13 6.29 7.82 6.46 95.56 604.00 236.01 186.52 204.35 270.69 244.89 176.19 255.38 240.07 205.74 189.26 208.47 179.38 2,596.95 900.00 485.78 534.34 583.44 396.42 465.76 496.07 369.25 445.20 335.00 475.19 241.40 292.79 5,120.63 1,504.00 721.79 720.86 787.79 667.11 710.65 672.26 624.63 685.27 540.74 664.46 449.87 472.18 7,717.59 2,890.85 855.08 819.06 907.06 850.19 914.02 898.34 915.10 945.89 870.01 1,024.19 880.60 915.51 10,795.03 352.58 29.27 20.86 54.94 47.44 65.81 100.44 64.55 102.81 112.91 121.70 105.66 119.07 945.45 205.91 29.40 27.05 21.52 34.39 54.23 75.61 60.07 63.05 55.84 46.30 22.05 27.20 516.71 689.00 260.12 213.51 286.15 274.63 234.95 169.94 260.33 203.38 186.71 80.75 184.27 161.14 2,515.88 1,247.49 318.79 261.42 362.60 356.46 354.99 345.99 384.95 369.24 355.46 248.76 311.98 307.40 3,978.03
4,138.34 1,173.86 1,080.48 1,269.67 1,206.64 1,269.01 1,244.33 1,300.05 1,315.12 1,225.48 1,272.94 1,192.58 1,222.91 14,773.07
(a)OtherRenewableEnergy(Solar,Dendro,Biomass&Wind). Source:CeylonElectricityBoard

INDUSTRY62
Electricity Sales by Province 2014 – 2017
Table 6.9
Province&
TypeofSale
UnitsinGWh Revenue,Rs.Mn. No.ofConsumerAccounts
2014 2015 2016 2017 2014 2015 2016 2017 2014 2015 2016 2017
243.06 251.71 268.26 270.46 7,712.54 6,457.80 7,045.00 7,087.00 134,589 136,943 138,838 140,797 7.74 7.89 8.73 9.01 67.49 70.23 76.62 79.52 870 878 889 899 159.71 161.64 180.52 178.00 2,685.54 2,445.63 2,695.97 2,645.02 396 392 384 374 869.14 897.81 948.94 992.79 23,401.28 21,046.89 22,534.18 23,338.79 33,741 34,430 35,017 35,523 9.71 9.71 9.74 9.71 – – – – – – – –
1,289.36 1,328.76 1,416.19 1,459.95 33,866.85 30,020.55 32,351.76 33,150.33 169,596 172,643 175,128 177,593
979.37 1,067.75 1,150.72 1,186.88 17,705.36 16,331.87 18,475.56 19,202.42 1,053,449 1,081,055 1,117,146 1,142,260 11.55 12.32 13.43 14.02 84.66 91.09 99.72 105.53 5,146 5,314 5,470 5,643 1,920.31 1,995.55 2,121.36 2,260.84 31,456.09 29,065.59 30,475.93 32,870.36 10,846 10,828 10,854 10,821 582.90 614.95 694.88 765.86 15,761.37 14,363.09 16,045.91 17,555.56 131,077 138,485 147,617 157,394 39.31 39.33 39.44 39.35 – – – – – – – –
3,533.43 3,729.89 4,019.82 4,266.96 65,007.47 59,851.64 65,097.12 69,733.87 1,200,518 1,235,682 1,281,087 1,316,118
506.03 554.06 582.93 605.56 6,209.57 5,832.10 6,322.49 6,669.62 783,624 806,642 847,188 866,266 8.91 9.53 10.19 10.72 57.86 62.78 67.56 72.29 5,934 6,113 6,343 6,555 268.13 285.05 301.51 307.36 4,589.92 4,313.85 4,542.13 4,682.22 3,828 3,904 3,976 4,031 252.37 276.66 309.61 334.70 6,708.43 6,287.63 7,015.66 7,549.22 90,209 94,758 99,693 105,282 7.61 7.61 7.63 7.61 – – – – – – – –
1,043.04 1,132.91 1,211.87 1,265.95 17,565.78 16,496.37 17,947.84 18,973.34 883,595 911,417 957,200 982,134
393.06 432.64 462.96 477.75 4,762.87 4,541.55 5,114.11 5,317.62 610,186 629,302 654,437 667,344 6.33 6.81 7.50 7.66 42.85 47.06 52.54 53.46 3,540 3,707 3,895 4,068 269.44 263.76 274.06 284.62 4,456.64 3,903.15 4,022.86 4,199.29 4,441 4,594 4,763 4,944 198.78 215.86 260.70 283.57 5,112.70 4,785.16 5,696.96 6,188.21 61,149 64,514 68,736 73,562 10.45 10.47 10.50 10.50 – – – – – – – –
878.05 929.54 1,015.73 1,064.10 14,375.05 13,276.92 14,886.46 15,758.59 679,316 702,117 731,831 749,918
138.10 162.00 185.01 213.64 1,906.07 1,879.48 2,242.17 2,601.71 207,844 234,393 267,250 295,985 5.54 6.02 7.05 7.89 37.54 43.09 48.52 54.50 3,675 4,003 4,404 4,726 20.67 26.12 29.81 31.85 380.72 421.72 481.80 521.28 3,518 3,764 4,101 4,640 93.69 105.03 118.68 128.97 2,506.53 2,426.91 2,734.29 2,956.46 26,682 28,103 30,802 34,069 1.63 1.63 1.63 1.63 – – – – – – – –
259.62 300.79 342.19 383.98 4,830.86 4,771.20 5,506.77 6,133.95 241,719 270,263 306,565 339,420
255.73 294.85 330.71 352.63 3,423.73 3,436.67 4,060.40 4,323.80 370,193 392,297 426,889 459,151 5.52 6.18 6.99 7.64 37.76 42.75 49.05 54.09 2,942 3,168 3,389 3,612 124.81 123.13 136.16 141.09 2,036.71 1,805.15 1,998.68 2,085.15 4,960 5,048 5,081 5,155 113.34 127.94 147.60 166.58 2,990.57 2,902.05 3,306.38 3,742.47 39,919 41,934 44,594 48,777 4.86 4.86 4.87 4.86 – – – – – – – –
504.25 556.95 626.32 672.80 8,488.76 8,186.62 9,414.52 10,205.51 418,014 442,447 479,953 516,695
430.31 476.62 523.35 552.91 5,704.96 5,428.12 6,269.78 6,688.49 621,905 649,175 687,209 710,384 7.27 7.84 8.69 9.28 46.97 51.65 58.46 63.08 4,604 4,734 4,874 5,013 461.47 468.97 503.04 509.87 7,576.76 6,880.41 7,370.92 7,502.63 16,517 17,696 18,149 19,159 167.63 184.23 207.32 230.27 4,582.48 4,278.82 4,785.80 5,314.87 77,445 81,520 86,962 94,362 27.37 27.37 27.44 27.37 – – – – – – – –
1,094.05 1,165.03 1,269.84 1,329.70 17,911.17 16,639.00 18,484.95 19,569.07 720,471 753,125 797,194 828,918
202.65 223.43 249.87 262.38 2,309.30 2,229.69 2,615.14 2,762.63 327,480 343,252 372,484 382,469 4.59 4.38 4.99 5.53 30.01 31.15 35.80 40.02 2,053 2,156 2,243 2,332 95.38 100.62 125.84 127.24 1,737.76 1,637.45 2,008.17 2,047.20 6,164 6,378 6,685 6,992 99.45 107.48 123.48 132.07 2,631.81 2,442.61 2,798.15 2,998.70 36,970 38,988 41,491 44,381 2.08 2.08 2.09 2.08 – – – – – – – –
404.15 437.99 506.27 529.29 6,708.88 6,340.89 7,457.26 7,848.56 372,667 390,774 422,903 436,174
154.48 174.12 188.89 197.10 1,527.02 1,494.43 1,675.68 1,756.52 293,387 308,030 328,683 342,593 2.62 2.83 3.06 3.09 16.15 17.67 19.24 19.86 2,157 2,290 2,427 2,597 52.85 55.03 56.81 61.10 935.98 865.18 887.96 975.38 2,314 2,428 2,673 2,796 67.22 68.48 83.01 88.07 1,825.58 1,592.87 1,905.58 2,038.14 27,929 29,265 30,839 33,447 0.97 0.97 0.97 0.97 – – – – – – – –
278.13 301.42 332.74 350.32 4,304.73 3,970.15 4,488.46 4,789.89 325,787 342,013 364,622 381,433
218.63 239.23 255.61 265.53 2,416.51 2,297.57 2,537.76 2,659.85 365,572 386,306 403,309 417,811 3.05 3.20 3.50 3.65 19.28 20.45 22.62 23.72 2,254 2,347 2,448 2,554 125.66 127.68 134.99 141.16 2,158.58 1,962.66 2,064.35 2,165.59 1,593 1,649 1,715 1,782 75.15 82.51 92.67 98.77 2,037.02 1,906.38 2,135.88 2,275.26 36,428 38,347 40,237 42,579 4.37 4.37 4.38 4.37 – – – – – – – –
426.85 457.00 491.15 513.47 6,631.40 6,187.06 6,760.61 7,124.41 405,847 428,649 447,709 464,726
1,352.19 1,446.00 1,553.18 1,594.95 24,980.67 22,295.38 24,496.28 23,776.33 1 1 1 1
11,063.11 11,786.28 12,785.29 13,431.46 204,671.63 188,035.77 206,892.04 217,063.85 5,417,532 5,649,132 5,964,194 6,193,130
Colombo City Domestic Religious Industrial Commercial StreetLighting
Total
Western Province(a)
Domestic Religious Industrial Commercial StreetLighting
Total
Central Province Domestic Religious Industrial Commercial StreetLighting
Total
Southern Province Domestic Religious Industrial Commercial StreetLighting
Total
Northern Province Domestic Religious Industrial Commercial StreetLighting
Total
Eastern Province Domestic Religious Industrial Commercial StreetLighting
Total
North Western Province Domestic Religious Industrial Commercial StreetLighting
Total
North Central Province Domestic Religious Industrial Commercial StreetLighting
Total
Uva Province Domestic Religious Industrial Commercial StreetLighting
Total
Sabaragamuwa Province Domestic Religious Industrial Commercial StreetLighting
Total
Transmission Bulk Supply to LECO
Grand Total
(a)ExcludingColombocity. Source:CeylonElectricityBoardNote1:TransmissionBulkSupplytoLECOisaccountedasoneaccount.Note2:StreetLightingConsumerAccountsareaccountedasoneaccount.

IND
USTRY
63
Water – Consumers, Consumption and Revenue by Province 2014 – 2017
Table 6.10
Contd.
764,500 804,082 857,647 902,050 157.1 166.9 186.5 190.6 6,747.8 7,038.4 8,541.4 8,609.2 6,819.8 7,276.4 8,278.1 8,850.0 3,396 3,411 3,549 3,592 22.2 20.3 19.9 19.2 1,547.9 1,406.2 1,384.8 1,367.1 1,672.3 1,484.8 1,415.1 1,352.3 444 504 509 510 1.8 2.2 2.5 2.6 97.4 113.8 133.8 129.3 117.9 171.4 174.6 141.0 65,308 70,382 75,541 80,776 49.2 52.7 60.0 61.7 3,766.0 4,083.4 4,672.7 4,955.4 3,714.8 4,112.5 4,682.9 4,999.7
833,648 878,379 937,246 986,928 230.3 242.1 268.9 274.1 12,159.2 12,641.7 14,732.7 15,061.0 12,324.8 13,045.1 14,550.8 15,343.0
209,155 220,016 231,633 243,079 32.7 34.9 39.1 40.6 1,102.6 1,128.1 1,347.8 1,414.7 1,094.4 1,153.9 1,378.9 1,481.2 1,007 1,007 1,031 1,048 1.0 1.1 1.2 1.1 73.9 79.3 84.1 85.0 73.9 82.0 79.2 85.7 63 58 50 46 … … … … 2.1 1.0 0.5 0.4 2.1 1.0 0.6 0.5 13,992 14,971 16,021 17,183 9.6 9.9 10.7 11.6 417.0 440.0 493.1 543.9 403.6 444.6 475.3 563.2
224,217 236,052 248,735 261,356 43.3 45.9 51.1 53.4 1,595.6 1,648.4 1,925.6 2,044.0 1,574.0 1,681.5 1,934.0 2,130.7
260,239 275,493 284,404 291,732 43.3 46.1 49.9 50.2 1,520.4 1,549.7 1,769.3 1,805.5 1,455.4 1,570.1 1,789.7 1,845.0 1,816 1,932 2,008 2,088 2.9 2.9 3.0 2.9 204.6 206.7 215.7 216.1 214.1 211.4 214.1 225.2 100 102 102 103 0.3 0.2 0.2 0.2 19.3 14.2 13.7 12.9 12.1 15.1 14.1 14.0 14,179 15,690 16,909 18,101 7.2 7.5 8.6 9.4 510.5 549.0 641.6 710.1 527.8 591.0 747.9 725.3
276,334 293,217 303,423 312,024 53.6 56.7 61.7 62.7 2,254.7 2,319.6 2,640.3 2,744.6 2,209.4 2,387.5 2,765.8 2,809.5
10,825 13,291 16,102 19,736 1.6 1.9 2.2 2.6 59.6 68.6 81.5 94.4 61.1 65.7 79.9 90.4 210 239 279 316 0.2 0.3 0.3 0.3 15.9 18.7 22.5 25.4 16.6 21.1 20.6 24.9 5 7 7 7 … … … … 0.6 0.7 0.7 0.8 0.6 0.6 0.7 0.9 1149 1,297 1,429 1,594 0.3 0.3 0.3 0.4 16.5 19.3 21.2 25.5 17.0 19.4 24.3 28.1
12,189 14,834 17,817 21,653 2.0 2.4 2.9 3.3 92.6 107.3 125.9 146.1 95.3 106.9 125.4 144.3
156,199 177,058 206,976 232,498 20.3 23.2 29.1 32.6 654.7 721.1 978.7 1,078.4 656.9 744.3 930.7 1,204.7 1,191 1,319 1,449 1,610 2.4 2.6 2.9 2.9 166.9 179.8 199.8 207.2 182.7 175.7 192.6 205.4 16 17 18 17 0.2 0.3 0.4 0.2 16.0 17.4 27.1 16.7 15.8 15.9 27.2 17.7 5,943 6,904 8,106 9,299 2.0 2.3 2.6 3.5 142.8 151.9 173.7 231.3 138.2 149.5 162.7 242.0
163,349 185,298 216,552 243,424 24.9 28.3 34.9 39.1 980.5 1,070.3 1,379.4 1,533.6 993.6 1,085.4 1,313.1 1,669.9
Western Domestic Government Industry Other
Total
Central Domestic Government Industry Other
Total
Southern Domestic Government Industry Other
Total
Northern Domestic Government Industry Other
Total
Eastern Domestic Government Industry Other
Total
District
No.ofConsumers QuantityofWater(m3Mn.) RevenueBilled(Rs.Mn.) RevenueCollected(Rs.Mn.)
2014 2015 2016 2017 2014 2015 2016 2017 2014 2015 2016 2017 2014 2015 2016 2017

IND
USTRY
64
Water – Consumers, Consumption and Revenue by Province 2014 – 2017
Table 6.10 (Contd.)
North Western Domestic Government Industry Other
Total
North Central Domestic Government Industry Other
Total
Uva Domestic Government Industry Other
Total
Sabaragamuwa Domestic Government Industry Other
Total
Total Domestic Government Industry Other
Total
58,075 62,719 66,767 70,600 8.3 8.9 10.3 10.3 274.0 279.3 349.7 343.3 277.2 296.2 354.2 351.9 468 506 536 564 0.6 0.6 0.6 0.5 42.4 39.3 40.0 37.4 45.3 37.1 40.2 37.8 73 76 76 80 0.1 0.1 … 0.1 6.3 4.3 3.7 4.5 6.3 4.4 3.7 4.6 5,414 5,881 6,403 6,792 4.0 4.2 4.5 4.5 172.1 180.0 197.0 208.1 169.0 182.5 197.7 206.2
64,030 69,182 73,782 78,036 13.0 13.6 15.4 15.4 494.8 502.9 590.3 593.3 497.8 520.1 595.7 600.5
82,976 91,030 97,558 103,473 13.6 14.8 17.4 18.1 471.9 489.1 630.6 648.8 491.0 517.2 645.7 701.0 895 934 904 955 2.7 2.8 2.9 2.9 186.9 197.4 204.2 207.7 216.3 204.2 183.2 203.9 11 11 6 10 … … … … … … 0.5 0.2 … … 0.1 0.1 8,018 8,693 9,218 9,913 2.9 3.2 3.5 3.5 191.9 209.9 244.4 263.1 186.7 208.6 238.7 271.9
91,900 100,668 107,686 114,351 19.2 20.8 23.8 24.5 850.8 896.4 1,079.8 1,119.9 894.1 930.1 1,067.7 1,177.3
70,213 75,225 79,638 87,375 9.9 10.5 12.2 12.6 319.1 325.0 403.8 423.4 306.2 337.8 396.7 428.1 694 697 732 731 2.1 2.0 2.1 2.1 143.9 139.6 148.3 148.7 154.3 145.4 149.3 149.1 2 2 2 2 … … … … 2.1 0.7 0.7 0.8 2.5 0.5 0.6 1.0 5,155 5,383 5,901 6,686 2.0 2.1 2.3 2.5 110.7 119.5 134.6 145.2 114.1 129.7 133.6 154.2
76,064 81,307 86,273 94,794 14.0 14.6 16.6 17.1 575.9 584.8 687.4 718.1 577.1 613.5 680.3 732.4
81,173 85,155 90,528 95,376 12.6 13.6 15.4 15.7 442.6 443.2 555.1 573.0 436.0 450.0 548.3 597.5 567 595 588 615 0.9 1.2 1.3 1.3 65.4 76.0 90.9 89.0 65.4 74.4 87.9 85.9 159 216 299 373 … … 0.1 0.1 2.5 3.0 5.2 5.7 2.5 3.0 4.9 5.7 8,368 8,818 9,542 10,242 2.2 2.4 2.7 2.9 180.7 191.2 223.7 244.3 178.1 191.6 218.0 249.7
90,267 94,784 100,957 106,606 15.8 17.2 19.5 19.9 691.2 713.4 875.0 912.0 682.0 719.0 859.0 938.8
1,693,355 1,804,069 1,931,256 2,045,919 299.4 320.7 362.0 373.3 11,592.7 12,042.3 14,657.8 14,990.9 11,598.2 12,411.8 14,402.3 15,549.9 10,244 10,640 11,076 11,519 35.0 33.8 34.1 33.2 2,448.0 2,343.2 2,390.4 2,383.6 2,640.9 2,436.1 2,382.1 2,370.1 873 993 1,069 1,148 2.4 2.7 3.3 3.1 146.2 155.0 186.0 171.4 159.7 211.8 226.3 185.6 127,526 138,019 149,070 160,586 79.4 84.5 95.3 100.1 5,508.3 5,944.2 6,802.1 7,326.9 5,449.3 6,029.4 6,881.1 7,440.5
1,831,998 1,953,721 2,092,471 2,219,172 416.2 441.7 494.7 509.7 19,695.2 20,484.8 24,036.3 24,872.8 19,848.1 21,089.1 23,891.8 25,546.1
…Negligible Source:NationalWaterSupply&DrainageBoard
District
No.ofConsumers QuantityofWater(m3Mn.) RevenueBilled(Rs.Mn.) RevenueCollected(Rs.Mn.)
2014 2015 2016 2017 2014 2015 2016 2017 2014 2015 2016 2017 2014 2015 2016 2017

INDUSTRY65
Board of Investment (BOI) Enterprises 2008 – 2017
Table 6.11
IndustrialCategory 2008 2009 2010 2011 2012(a) 2013(a) 2014(a) 2015 2016 2017(b)
13,227 13,195 13,984 13,436 15,612 15,647 14,135 n.a. n.a. n.a.
302,304 307,912 264,456 276,551 292,004 291,986 298,746 n.a. n.a. n.a.
1,338 1,771 3,621 3,861 3,553 3,366 3,310 n.a. n.a. n.a.
1,703 1,730 1,890 2,325 1,938 2,241 2,168 n.a. n.a. n.a.
26,494 23,382 20,659 26,017 26,929 27,734 25,410 n.a. n.a. n.a.
6,239 9,082 8,854 9,228 9,354 9,119 9,288 n.a. n.a. n.a.
6,441 6,866 6,853 7,113 8,744 6,619 6,635 n.a. n.a. n.a.
31,348 27,164 27,492 27,930 27,165 29,863 31,408 n.a. n.a. n.a.
69,071 86,428 78,275 84,452 91,191 96,895 93,575 n.a. n.a. n.a.
458,165 477,530 426,084 450,913 476,490 483,470 484,675 n.a. n.a. n.a.
38,136 35,277 30,790 34,234 40,442 43,291 44,871 41,342 47,999 55,643
260,179 278,120 298,207 373,463 393,442 460,123 542,877 557,370 608,632 657,314
3,678 2,268 4,926 6,031 6,979 7,065 6,904 6,160 6,228 7,648
3,875 3,586 4,160 5,805 6,506 5,165 7,684 6,968 6,819 9,602
80,953 52,383 74,065 110,426 118,088 124,374 140,818 124,712 138,043 156,679
16,195 9,679 13,123 19,379 22,832 26,897 30,638 24,277 22,199 20,493
18,493 13,385 17,482 17,871 17,548 17,561 16,692 14,487 17,296 22,518
39,625 35,089 43,132 45,386 48,988 49,071 56,949 58,179 62,727 76,712
36,537 22,085 30,681 40,953 42,008 40,400 56,205 64,476 73,406 82,941
497,671 451,872 516,566 653,548 696,833 773,947 903,638 897,971 983,349 1,089,550
Employment (End December)
Food,BeveragesandTobaccoProducts
Textile,WearingAppareland LeatherProducts
WoodandWoodProducts
Paper,PaperProducts,Printing andPublishing
Chemicals,Petroleum,Coal,Rubber andPlasticProducts
Non-MetallicMineralProducts
FabricatedMetal,Machineryand TransportEquipment
ManufacturedProducts (NotElsewhereSpecified)
Services(includesAgriculture)
Total
Gross Export Earnings (f.o.b.), Rs. Mn.
Food,BeveragesandTobaccoProducts
Textile,WearingAppareland LeatherProducts
WoodandWoodProducts
Paper,PaperProducts,Printing andPublishing
Chemicals,Petroleum,Coal,Rubber andPlasticProducts
Non-MetallicMineralProducts
FabricatedMetal,Machineryand TransportEquipment
ManufacturedProducts (NotElsewhereSpecified)
ServicesandInfrastructure
Total
(a)Revised(b)Provisionaln.a.–Notavailable
Source :BoardofInvestmentofSriLanka

PRICES AND WAGES66
Consumer Price Indices 2008 – 2017
Table 7.1
Item 2008 2009 2010 2011 2012 2013 2014 2015 2016 2017
Sources: DepartmentofCensusandStatistics
CentralBankofSriLanka
Colombo Consumers’ Price Index (2002=100)(a)
AllItemsPercentageChange
SubIndicesFoodandNon-AlcoholicBeveragesClothingandFootwearHousing,Water,Electricity,GasandOtherFuelsFurnishing,H/HEquipmentandRoutineHouseholdMaintenanceHealthTransportCommunicationRecreationandCultureEducationMiscellaneousGoodsandServices
Colombo Consumer Price Index (2006/07=100)(b)(c)
AllItemsPercentageChange
SubIndicesFoodandNon-AlcoholicBeveragesClothingandFootwearHousing,Water,Electricity,GasandOtherFuelsFurnishing,H/HEquipmentandRoutineHouseholdMaintenanceHealthTransportCommunicationRecreationandCultureEducationMiscellaneousGoodsandServices
Colombo Consumer Price Index (2013=100)(d)
AllItemsPercentageChange
SubIndicesFoodandNon-AlcoholicBeveragesAlcoholicBeveragesandTobaccoClothingandFootwearHousing,Water,Electricity,GasandOtherFuelsFurnishing,H/HEquipmentandRoutineHouseholdMaintenanceHealthTransportCommunicationRecreationandCultureEducationRestaurantsandHotelsMiscellaneousGoodsandServices
(a)DiscontinuedfromJune2011.
(b)TherebasedCCPI(2006/07=100)hasreplacedCCPI(2002=100)fromJune2011.
(c)DiscontinuedfromJanuary2017.
(d)TherebasedCCPI(2013=100)hasreplacedCCPI(2006/07=100)fromJanuary2017.
199.9 206.8 219.1 22.6 3.4 5.9
213.3 219.2 234.2 154.8 165.3 176.6 226.8 227.5 235.3 154.1 168.0 176.4 163.2 194.8 227.8 240.3 238.8 240.7 100.0 107.0 109.4 128.3 161.8 168.7 141.0 152.0 171.3 156.3 168.5 180.7
129.2 133.6 141.9 151.5 162.9 174.2 179.9 181.5 188.3 3.5 6.2 6.7 7.6 6.9 3.3 0.9 3.7
144.0 148.5 158.8 172.7 180.9 195.2 202.5 212.4 221.7 112.5 122.0 130.2 147.6 162.1 170.8 171.4 195.3 207.7 114.0 115.1 119.2 124.4 136.4 151.0 152.7 138.2 138.0 113.0 122.5 128.0 133.8 142.7 148.5 151.9 164.4 170.7 150.4 184.7 233.9 240.3 247.5 251.7 273.1 311.4 345.6 141.7 138.4 139.7 149.6 181.9 190.2 198.9 182.9 187.1 82.6 88.2 90.3 90.3 90.3 90.3 93.9 94.0 100.5 116.1 122.7 131.8 139.0 144.6 150.4 153.8 161.6 166.9 110.3 120.7 135.9 140.6 141.2 142.6 143.3 148.1 155.2 113.3 122.4 126.3 131.1 136.5 142.2 146.8 154.2 160.8
105.1 107.4 111.7 119.0 2.2 4.0 6.6
104.3 110.0 116.7 127.5 111.1 127.3 153.8 186.0 100.9 111.9 119.2 126.3
108.9 110.3 110.1 110.2 102.2 107.5 107.8 118.0 104.1 111.7 126.0 144.2 101.7 91.1 92.9 96.9 103.5 103.5 110.0 119.8 101.4 105.3 107.4 109.9 103.6 107.4 112.8 129.0 101.2 104.5 107.2 116.4 101.5 103.5 118.5 134.0
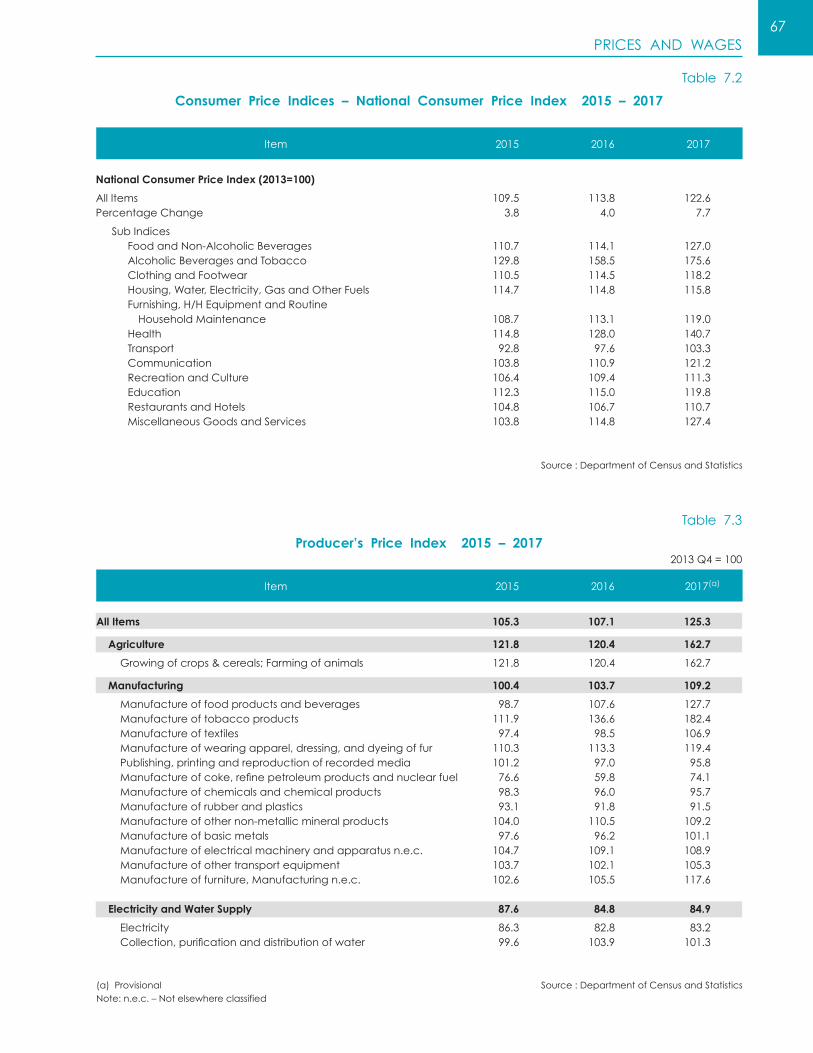
PRICES AND WAGES67
Consumer Price Indices – National Consumer Price Index 2015 – 2017
Producer’s Price Index 2015 – 2017
Table 7.2
Table 7.3
Item 2015 2016 2017
Item 2015 2016 2017(a)
National Consumer Price Index (2013=100)
AllItemsPercentageChange
SubIndices FoodandNon-AlcoholicBeverages AlcoholicBeveragesandTobacco ClothingandFootwear Housing,Water,Electricity,GasandOtherFuels Furnishing,H/HEquipmentandRoutine HouseholdMaintenance Health Transport Communication RecreationandCulture Education RestaurantsandHotels MiscellaneousGoodsandServices
109.5 113.8 122.6 3.8 4.0 7.7
110.7 114.1 127.0 129.8 158.5 175.6 110.5 114.5 118.2 114.7 114.8 115.8 108.7 113.1 119.0 114.8 128.0 140.7 92.8 97.6 103.3 103.8 110.9 121.2 106.4 109.4 111.3 112.3 115.0 119.8 104.8 106.7 110.7 103.8 114.8 127.4
105.3 107.1 125.3
121.8 120.4 162.7
121.8 120.4 162.7
100.4 103.7 109.2
98.7 107.6 127.7 111.9 136.6 182.4 97.4 98.5 106.9 110.3 113.3 119.4 101.2 97.0 95.8 76.6 59.8 74.1 98.3 96.0 95.7 93.1 91.8 91.5 104.0 110.5 109.2 97.6 96.2 101.1 104.7 109.1 108.9 103.7 102.1 105.3 102.6 105.5 117.6
87.6 84.8 84.9
86.3 82.8 83.2 99.6 103.9 101.3
Source:DepartmentofCensusandStatistics
Source:DepartmentofCensusandStatistics
2013Q4=100
All Items
Agriculture
Growingofcrops&cereals;Farmingofanimals
Manufacturing
Manufactureoffoodproductsandbeverages Manufactureoftobaccoproducts Manufactureoftextiles Manufactureofwearingapparel,dressing,anddyeingoffur Publishing,printingandreproductionofrecordedmedia Manufactureofcoke,refinepetroleumproductsandnuclearfuel Manufactureofchemicalsandchemicalproducts Manufactureofrubberandplastics Manufactureofothernon-metallicmineralproducts Manufactureofbasicmetals Manufactureofelectricalmachineryandapparatusn.e.c. Manufactureofothertransportequipment Manufactureoffurniture,Manufacturingn.e.c.
Electricity and Water Supply
Electricity Collection,purificationanddistributionofwater
(a)ProvisionalNote:n.e.c.–Notelsewhereclassified

PRICES AND WAGES68
Colombo Consumers’ Price Index 1958 – 2007
Table 7.4
Year AllItems Change,% Food Clothing Fuel&Light Rent Miscellaneous
1952=100
1958 105.0 2.1 105.8 87.5 101.0 101.5 113.1 1959 105.2 0.2 104.7 92.1 102.4 101.5 115.3 1960 103.5 -1.6 100.8 95.1 102.7 101.5 117.5 1961 104.8 1.3 99.8 103.9 104.4 101.5 122.8 1962 106.3 1.4 100.9 108.2 105.6 101.5 124.9 1963 108.8 2.4 103.0 118.2 103.0 101.5 126.6 1964 112.2 3.1 106.4 127.2 103.2 101.5 129.3 1965 112.5 0.3 107.3 126.7 100.7 101.5 128.3 1966 112.3 -0.2 109.1 117.3 95.9 101.5 127.3 1967 114.8 2.2 112.7 116.7 96.4 101.5 128.9 1968 121.5 5.8 121.2 120.1 103.2 101.5 133.6 1969 130.5 7.4 127.9 130.8 124.9 108.4 147.1 1970 138.2 5.9 136.6 137.3 136.1 109.8 153.2 1971 141.9 2.7 139.1 145.0 140.8 109.8 159.5 1972 150.9 6.3 147.5 163.5 145.9 109.8 169.5 1973 165.4 9.6 166.2 186.1 164.4 109.8 169.8 1974 185.8 12.3 189.7 204.6 220.9 109.8 178.3 1975 198.3 6.7 204.3 208.2 237.0 109.8 191.9 1976 200.7 1.2 202.1 211.7 265.2 109.8 203.8 1977 203.2 1.2 203.3 223.8 257.5 109.8 208.4 1978 227.8 12.1 237.5 226.2 262.1 109.8 224.8 1979 252.3 10.8 263.3 231.2 328.5 109.8 252.4 1980 318.2 26.1 339.7 239.9 563.9 109.8 293.8 1981 375.4 18.0 399.6 257.8 767.9 109.8 345.7 1982 416.1 10.8 450.4 273.8 816.4 109.8 377.1 1983 474.2 14.0 506.3 291.1 1,087.6 109.8 433.7 1984 553.1 16.6 598.0 307.5 1,282.7 109.8 496.9 1985 561.2 1.5 598.4 324.2 1,332.1 109.8 524.4 1986 606.0 8.0 641.4 374.5 1,347.6 109.8 599.7 1987 652.8 7.7 697.0 400.9 1,358.7 109.8 650.7 1988 744.1 14.0 802.0 419.8 1,535.1 109.8 742.6 1989 830.2 11.6 884.6 490.0 1,718.9 109.8 860.1 1990 1,008.6 21.5 1,090.9 610.2 1,934.2 109.8 1,021.0 1991 1,131.5 12.2 1,220.3 678.4 2,252.2 109.8 1,146.0 1992 1,260.4 11.4 1,366.0 723.6 2,334.3 109.8 1,318.7 1993 1,408.4 11.7 1,519.4 782.7 2,730.0 109.8 1,490.4 1994 1,527.4 8.4 1,654.1 795.7 3,131.6 109.8 1,578.7 1995 1,644.6 7.7 1,768.1 803.9 3,322.4 109.8 1,800.6 1996 1,906.7 15.9 2,107.6 821.8 3,591.6 109.8 1,994.7 1997 2,089.1 9.6 2,336.9 844.0 3,739.8 109.8 2,157.8 1998 2,284.9 9.4 2,592.1 852.3 3,872.8 109.8 2,319.9 1999 2,392.1 4.7 2,695.4 863.3 3,929.7 109.8 2,558.1 2000 2,539.8 6.2 2,815.8 872.9 4,660.9 109.8 2,802.4 2001 2,899.4 14.2 3,244.7 909.6 5,328.9 109.8 3,131.1 2002 3,176.4 9.6 3,589.9 950.5 5,795.8 109.8 3,327.9 2003 3,377.0 6.3 3,798.4 974.4 6,674.6 109.8 3,497.5 2004 3,632.8 7.6 4,096.2 984.0 7,315.3 109.8 3,726.4 2005 4,055.5 11.6 4,590.6 1,026.7 8,303.0 109.8 4,098.4 2006 4,610.8 13.7 5,198.7 1,067.2 10,641.8 109.8 4,482.6 2007 5,416.1 17.5 6,143.3 1,115.7 13,338.6 109.8 4,978.4
Source:DepartmentofCensusandStatisticsNote:ThisserieswasdiscontinuedfromMay2008,andwasreplacedbyCCPI(2002=100)

PRICES AND WAGES69
Average Retail Prices of Selected Consumer Items 2008 – 2017
Table 7.5
Item 2008 2009 2010 2011 2012 2013 2014 2015 2016 2017(a)
Rupees
76.19 74.97 75.56 71.82 70.33 71.90 83.83 90.25 95.58 101.58 64.64 63.24 61.37 60.51 60.09 62.04 75.75 76.73 76.69 90.59 64.21 61.65 59.41 55.33 56.63 58.33 71.92 74.85 69.60 86.03
102.53 90.45 114.91 144.69 125.45 130.31 134.03 195.82 183.39 176.78 91.55 90.61 108.24 124.06 121.12 131.03 133.37 182.54 168.30 176.58 87.79 81.79 94.92 103.25 101.88 99.31 104.50 131.40 129.69 125.89 65.52 61.57 76.12 85.24 80.99 87.31 88.57 113.86 115.48 118.60 78.71 79.65 101.09 96.23 110.93 115.73 114.69 166.35 143.24 138.26
45.14 48.03 52.45 59.84 64.30 63.00 66.70 78.18 84.79 95.77 62.99 54.42 65.32 82.20 76.17 76.83 84.75 101.12 100.96 117.35 127.49 115.61 142.38 164.17 145.18 151.87 161.71 223.61 213.51 229.71 102.60 102.10 131.70 172.20 198.53 232.59 176.66 237.85 372.38 248.27
45.11 46.17 48.52 52.80 55.05 59.47 63.16 75.99 81.41 79.64 13.81 15.16 16.00 18.14 19.35 20.71 21.52 24.11 26.35 27.58 12.92 14.10 14.67 16.79 17.94 19.73 20.60 23.09 25.16 26.30 13.43 14.60 15.43 17.87 18.39 19.34 20.17 22.38 25.04 26.39 13.87 14.89 15.10 17.00 18.08 19.83 20.50 22.52 24.87 26.23
80.15 89.81 96.12 108.12 110.60 117.42 121.26 125.96 134.74 145.90 35.81 35.71 37.25 47.21 49.85 50.44 52.92 56.99 61.62 72.59 44.24 46.63 51.08 58.34 59.68 64.33 66.75 80.59 82.27 85.23
330.67 365.14 395.96 415.97 441.15 472.24 497.29 539.55 650.60 747.09 623.07 694.21 737.39 780.93 897.75 1,056.37 1,139.17 1,245.27 1,432.51 1,655.50 302.99 332.38 398.70 383.09 389.88 411.82 420.27 458.79 496.94 498.80 10.05 10.08 14.45 13.00 11.81 14.56 13.55 14.94 16.19 14.19
678.75 722.10 728.45 834.87 926.20 1,007.71 1,030.13 1,070.95 1,173.76 1,221.96 484.64 520.41 541.10 590.58 642.99 675.48 697.23 725.97 770.46 815.75 367.34 407.04 426.47 459.32 492.82 509.80 528.05 559.38 601.10 596.02 473.67 519.24 548.30 595.06 650.00 680.70 711.20 753.22 802.07 850.57 371.95 408.60 434.21 479.71 519.06 556.55 579.23 603.51 645.76 675.38 144.34 150.34 156.62 161.25 170.06 182.54 177.25 181.92 195.82 201.18
666.60 738.95 772.39 839.36 982.49 1,092.87 1,117.16 1,140.73 1,213.61 1,256.88 487.41 543.70 594.39 656.48 753.77 834.35 861.14 889.07 941.71 978.26 407.84 451.81 486.28 543.61 623.65 662.20 693.03 717.22 747.16 740.10 611.22 688.23 704.76 767.34 862.98 919.32 944.45 971.34 1,040.80 1,078.03 309.84 330.62 316.24 325.07 388.08 578.03 495.14 493.22 573.50 613.53
160.51 199.14 193.94 220.42 233.49 240.87 242.87 236.58 224.58 205.78 160.51 199.14 196.50 232.88 229.66 232.61 233.99 217.97 190.12 186.56 154.12 198.16 172.62 198.71 197.51 201.04 193.77 153.25 148.49 146.76
134.00 132.86 205.81 198.10 224.37 271.56 299.73 252.11 228.94 234.31 189.99 133.85 164.28 149.25 142.57 153.58 161.37 181.88 183.29 167.56 130.43 124.86 112.54 141.23 143.08 151.57 156.10 171.01 184.51 202.54 124.22 130.38 171.47 203.80 220.78 238.17 217.98 236.06 239.38 272.66
214.57 214.79 202.22 275.01 231.48 228.00 230.85 275.76 349.26 259.07 492.40 482.40 498.00 781.70 1,237.63 1,076.80 1,320.54 1,489.80 1,594.28 1,510.30 119.40 113.80 136.20 242.80 219.35 215.00 228.13 274.19 305.56 349.61 313.50 297.70 294.10 282.80 268.42 285.40 369.17 329.38 309.91 290.63 285.70 342.20 763.10 824.00 672.52 689.93 687.19 671.18 677.69 692.04 100.60 109.60 286.30 226.00 216.59 227.85 201.42 234.92 368.89 396.10 32.89 34.49 33.22 32.72 32.57 33.07 34.58 34.80 55.28 61.13 32.14 33.41 35.18 40.49 40.06 40.21 40.61 43.93 49.87 48.80 265.60 293.90 311.00 290.20 288.32 394.17 526.35 429.88 396.84 702.76
99.37 101.85 99.81 142.25 108.13 171.87 102.46 125.91 123.39 236.50 478.20 473.90 521.00 562.30 593.62 638.91 642.11 638.42 661.80 684.64 292.30 291.90 310.60 361.70 383.33 388.76 386.79 411.29 434.90 466.84 197.90 213.40 230.80 232.20 255.90 273.97 288.28 306.02 321.43 321.93 863.20 906.60 972.70 1,151.10 1,551.40 1,817.27 1,810.70 1,890.27 2,021.74 2,394.81
28.68 22.03 30.48 36.41 29.61 40.17 40.05 45.30 39.70 61.46 185.70 139.50 173.44 211.75 174.18 197.67 210.77 203.17 209.20 265.28
Rice, kg. Samba(Highest) ParBoiled(Highest) Kekulu(Highest)
Up Country Vegetables, kg Beans Carrot BeetRoot Cabbage Leeks
Low Country Vegetables, kg Pumpkin Brinjals Capsicum Limes
Leafy Vegetables Spinach(Nivithi)(1kg) Mukunuwenna(1bundle) Kan-kun(1bundle) Gotukola(1bundle) KaturuMurunga(1bundle)
Yams, kg Potatoes Manioc SweetPotatoes
Meat and Eggs, kg Beef(withoutbones) Mutton(withbones) Chicken(Ordinary) Eggs(Farm)
Sea Fish, kg Seer–Thora Trevally–Paraw SkipJack–Balaya Tuna–Kelawalla Shark–Mora Sardine–Salaya
Dried Fish, kg Seer–Thora Shark–Mora SkipJack–Balaya QueenFish–Kattawa Sprats
Canned and Preserved Fish, (425g) TinnedFish(Delmege) TinnedFish(Captain/Classic) TinnedFish(Other)
Pulses, kg GreenGram Dhal–Mysore Dhal–Kadala(b) Cowpea(Best)
Condiments, kg DriedChillies Pepper Tamarind Coriander Turmeric(Dried) Garlic WashedSalt(1Pkt) ChilliePowder(100g) RawGinger
Spices, kg RedOnion CumminSeed FennelSeed MatheSeed CinnamonQuills
Coconut Coconut(Medium),each CoconutOil,750ml
Contd.

PRICES AND WAGES70
Average Retail Prices of Selected Consumer Items 2008 – 2017
Table 7.5 (Contd.)
Item 2008 2009 2010 2011 2012 2013 2014 2015 2016 2017(a)
Rupees
85.35 87.56 106.51 112.25 114.37 112.51 110.73 121.20 150.04 178.73 95.93 101.41 128.36 129.08 129.74 133.64 125.51 145.06 176.87 197.44 45.56 46.25 56.41 55.33 57.73 61.70 57.51 63.90 74.84 99.01 42.21 51.80 51.41 58.46 61.51 63.64 61.38 84.30 83.79 79.66
49.90 52.77 54.44 59.14 65.36 69.97 73.12 76.96 81.70 84.98 592.50 648.20 729.90 789.00 822.45 936.64 1,024.85 1,122.02 1,145.63 1,222.04 982.50 1,033.10 1,113.60 1,113.00 1,138.66 1,156.55 1,177.64 1,179.13 1,295.63 1,643.99 268.61 243.39 227.43 249.71 289.11 316.96 379.40 329.76 324.78 324.70 274.15 258.60 234.46 256.46 300.37 324.67 379.77 330.27 324.58 324.26 301.26 315.27 316.65 333.49 372.38 402.19 460.73 464.95 464.91 480.71 274.72 275.21 278.54 299.48 343.60 415.72 439.73 440.01 439.93 458.78 274.45 257.25 233.00 253.96 296.46 323.59 371.93 330.03 324.85 319.17 122.16 128.66 133.18 145.14 173.71 184.59 188.53 195.42 206.93 214.22 143.53 145.53 168.27 177.77 208.87 229.16 238.95 240.31 244.02 249.13
52.70 55.25 55.55 56.15 58.44 62.14 63.86 61.96 66.43 75.53 12.69 13.97 14.88 16.67 18.81 20.45 – 20.01 24.66 34.99
268.76 282.98 302.19 347.69 388.15 414.36 434.48 442.05 448.36 476.09 762.35 820.10 875.31 983.65 1,059.61 1,196.00 1,277.28 1,315.66 1,507.25 1,644.90
26.20 27.05 27.00 28.83 33.95 36.90 39.60 40.00 40.87 43.83 162.88 186.82 180.59 184.05 194.58 209.85 233.25 239.11 242.19 256.80 29.80 32.00 32.22 33.61 36.78 38.71 40.35 41.00 42.64 50.59 46.87 52.28 52.84 54.68 59.62 63.13 67.15 70.00 70.00 73.26
73.29 51.19 51.38 59.65 103.73 107.25 99.82 61.70 54.13 48.97 317.99 314.12 349.78 361.75 401.73 437.01 454.24 452.79 510.97 517.08 2.90 3.37 3.89 4.07 4.48 4.95 4.98 5.00 5.18 5.62 1,762.78 1,510.32 1,689.10 1,931.28 2,254.27 2,458.32 2,381.84 1,628.03 1,413.51 1,416.70
41.44 42.80 47.27 48.21 49.57 56.27 58.26 66.14 70.88 75.65 43.49 45.80 50.54 50.50 51.78 59.47 59.99 61.56 64.24 67.83 3.66 4.01 4.41 5.03 5.40 5.94 5.72 5.96 6.89 7.57
37.40 37.44 40.16 48.80 55.17 59.46 59.74 53.87 56.64 57.71
8.41 9.05 9.47 10.36 11.07 11.56 11.84 11.09 11.60 12.38 2.28 2.35 2.60 2.85 3.02 3.22 3.28 3.23 3.46 3.70
73.70 71.40 69.75 83.56 91.07 98.05 98.07 86.29 90.20 89.89 – – 60.00 62.04 88.53 126.63 131.49 132.70 136.24 143.85 39.39 39.39 45.96 45.47 47.61 49.28 49.96 52.20 105.70 120.12
443.57 491.82 515.21 524.95 569.75 679.17 674.42 681.33 642.34 611.80 103.01 118.54 121.35 134.41 149.70 168.84 182.96 189.12 193.33 206.66 217.55 248.57 259.61 300.83 313.20 342.10 459.57 494.99 494.80 501.15 144.55 152.09 162.30 195.10 242.51 251.04 250.36 272.17 332.68 368.14
63.19 78.61 93.79 97.37 100.63 102.37 101.95 86.92 100.14 106.73
21.45 22.75 26.73 32.02 35.83 39.99 39.24 41.15 42.44 46.57 149.26 164.74 187.60 197.69 220.68 252.06 274.54 296.53 317.37 331.84 152.45 175.98 178.20 187.77 213.80 233.48 253.37 276.70 296.62 322.72 179.45 200.44 203.77 212.92 237.51 228.24 233.15 256.13 266.93 291.20 160.65 192.47 206.04 215.12 223.98 271.84 315.44 340.60 388.82 437.59 40.18 44.15 45.67 46.39 48.35 54.85 57.85 61.47 62.68 64.82
27.47 29.36 29.88 31.21 35.11 39.46 44.05 45.01 46.77 49.54 27.52 30.15 30.01 31.31 35.55 40.41 44.05 45.01 46.29 49.30 9.61 10.23 10.73 11.13 11.85 13.63 14.37 12.56 13.63 14.95
Fruits, each Pineapple(1kg) Banana–Kolikuttu(1kg) Banana–Ambul(1kg) Papaw(1kg)
Milk Food and Beverages FreshMilk(Dairy),750ml Tea(BOP)(1kg) CoffeePowder(1kg) Lakspray(400g) Anchor(400g) Lactogen(half)(400g) Lactogen(full)(400g) Nespray(400g) MilkMaid(397g) Ice-Cream(Highland),1Litre
Tobacco and Tobacco Products, each ChewingTobacco–Jaffna Cigarettes–Bristol
Clothing Sarongs,each Sarees,each
Soap, tablet Sunlight(each) SovereignBar,BarSoap(each) Kohomba(each) SignalToothpaste–med.(65g)
Fuel and Light Kerosene,1litre FireWood,50kg SafetyMatches,Each LPGas(Cylinder–13kg)
Batteries (Each) Batteries(Laxapahana) Batteries(Eveready) Candles(each)
Bakery Products Bread(loaf)
Cereal Preparations (bought from outside) Hopper(each) StringHopper(each)
Other Cereal Preparation WheatFlour(1kg) KurakkanFlour(400g) RiceFlour(400g)(c)
Fats & Oil SoyaOil(Turkey)(1Ltr) Margarine(Astra)(250g) Butter(Anchor) Butter(Highland)
Sugar Sugar(White)(1kg)
Preserved Food Papadam(1Pkt) Jam(Woodapple)MD(485g) Jam(Woodapple)Kist(454g) Marmite(115g) Dates(1kg) SoyaMeat(LankaSoy)(90g)
Non-Alcoholic Beverages OrangeBarley(400ml) Fanta/CocaCola(300ml) PlainTea(1Cup)
(a)Provisional
(b)YellowImported
(c)Unitwaschangedfrom400gto1kg.in2016.
Source :CentralBankofSriLanka

PRICES AND WAGES71
Average Retail Prices of Selected Food Items by Provinces 2016 and 2017
Table 7.6
Item Western Central Southern Northern Eastern NorthWestern
NorthCentral Uva Sabara-
gamuwaAll
Island
AshPlantainsBeansCabbageCarrotPumpkinSnakegourdBrinjalsTomatoesRice(Samba)Rice(Kekulu)RedOnionsBigOnionsPotatoesDriedChilliesDhal(a)
Eggs(Farm)(Each)CoconutKelawallaBalayaSalaya
AshPlantainsBeansCabbageCarrotPumpkinSnakegourdBrinjalsTomatoesRice(Samba)Rice(Kekulu)RedOnionsBigOnionsPotatoesDriedChilliesDhal(a)
Eggs(Farm)(Each)CoconutKelawallaBalayaSalaya
2016
109.05 103.03 94.04 69.48 95.61 88.58 82.59 100.22 89.41 94.52 184.12 168.08 195.18 186.95 183.69 197.59 183.86 175.51 165.75 183.39 123.46 104.90 122.86 116.25 115.60 120.05 115.88 98.43 104.63 115.48 166.68 162.31 174.88 170.31 176.10 180.08 177.55 150.47 147.00 168.30 88.90 91.46 99.81 65.78 77.63 78.66 79.77 89.68 76.89 84.79 115.87 94.69 105.80 82.24 97.08 101.91 90.52 98.94 89.32 99.91 106.50 103.49 94.44 97.61 109.30 105.24 93.32 102.37 88.36 100.96 124.22 108.05 114.67 117.59 107.39 124.34 115.42 100.92 103.79 115.06 93.00 96.02 104.13 93.45 99.02 87.74 89.95 103.18 97.48 95.58 69.51 72.97 61.78 69.22 70.43 73.11 74.33 65.15 71.44 69.60 127.68 124.87 126.55 106.23 125.26 121.56 122.29 138.51 119.94 123.39 90.04 84.94 84.17 91.18 93.86 92.09 84.19 86.12 86.38 88.14 142.94 136.44 137.08 104.48 135.85 132.56 123.93 140.86 136.15 134.74 352.68 363.52 354.45 331.64 349.95 347.94 342.89 339.97 346.83 349.26 181.22 184.16 183.15 175.17 183.31 189.40 181.93 196.45 193.95 184.51 15.85 16.40 16.28 16.54 16.61 15.50 15.59 17.44 16.23 16.19 42.53 40.97 44.48 31.70 39.04 37.72 37.62 39.05 38.42 39.70 869.50 796.10 867.24 423.75 657.50 782.39 842.66 787.66 731.65 802.07 665.04 598.09 685.95 433.90 542.37 580.54 539.31 547.82 578.96 601.10 219.71 198.99 202.64 172.90 187.52 193.18 152.13 213.42 188.37 195.82
2017(b)
119.44 111.67 99.72 79.23 105.82 97.47 92.68 109.95 99.23 103.29 184.47 161.80 185.56 184.17 165.49 183.93 182.08 164.47 156.71 176.78 134.48 102.05 131.21 122.78 113.56 112.42 115.77 105.45 101.10 118.60 183.55 165.09 182.88 184.75 182.45 174.32 187.51 166.53 140.68 176.58 100.55 104.65 109.41 71.39 89.02 85.74 98.05 101.32 89.42 95.77 135.09 107.61 130.64 94.92 105.00 112.84 109.94 114.19 101.39 115.69 125.53 119.59 119.28 120.94 113.17 113.28 109.59 115.54 100.26 117.35 153.35 134.73 139.97 141.54 144.08 134.96 140.32 127.02 122.59 140.00 99.55 102.15 104.18 102.09 106.07 98.30 97.62 105.86 102.07 101.58 85.83 88.57 81.02 88.37 84.72 89.19 86.72 83.32 86.55 86.03 251.81 239.24 272.21 196.29 211.90 226.65 231.02 263.12 232.50 236.50 123.19 118.22 113.46 120.08 113.68 122.49 118.85 117.45 128.14 119.02 156.97 146.00 148.99 114.42 147.06 138.94 136.48 151.53 151.64 145.90 258.41 257.56 252.43 255.42 296.46 260.32 249.68 265.29 246.60 259.07 190.05 204.47 211.01 206.50 198.70 202.32 191.26 217.46 208.40 202.54 13.73 14.13 13.97 15.17 14.48 13.76 13.83 15.81 13.84 14.19 63.75 65.67 63.74 52.30 66.29 55.46 58.51 65.83 59.79 61.46 956.10 864.42 871.19 449.26 723.28 793.11 872.34 861.82 795.26 850.57 664.86 591.02 645.90 421.99 599.73 571.48 495.62 572.21 607.08 596.02 221.99 209.65 208.77 188.46 204.55 187.37 148.32 223.99 195.88 201.18
Rs.perkg.
(a)YellowImported(b)Provisional
Source :CentralBankofSriLanka

PRICES AND WAGES72
Average Producer Prices of Selected Items 2008 – 2017
Table 7.7
Commodity 2008 2009 2010 2011 2012 2013 2014 2015 2016 2017(a)
Rupees
32.99 34.37 31.55 31.09 31.37 33.22 41.12 41.12 38.58 49.07
59.41 58.79 69.67 98.28 72.98 77.40 83.01 125.74 117.10 112.18 52.70 55.63 65.42 67.60 68.95 80.39 81.57 119.69 108.78 112.28 50.03 50.49 58.43 60.07 58.09 59.79 61.02 79.52 82.20 75.26
21.72 24.92 27.30 31.28 33.26 31.85 34.83 39.32 43.76 52.25 38.65 36.58 37.61 47.14 43.72 43.39 48.72 56.75 57.90 66.28 77.01 78.21 95.01 105.10 90.23 96.36 103.58 151.32 138.73 151.16 47.83 63.86 59.24 79.48 95.20 116.87 82.46 112.50 207.48 129.57
50.60 67.48 67.56 79.02 76.52 84.29 88.88 93.80 99.78 113.34 20.45 22.27 21.53 27.64 28.11 28.91 30.76 33.29 35.75 43.67 24.57 26.16 29.19 34.02 35.07 36.06 37.74 46.30 47.95 49.65
8.68 9.53 12.25 11.09 10.03 12.46 11.77 12.88 14.19 12.47
420.19 439.74 449.98 545.93 576.01 644.24 653.12 723.43 793.22 811.22 317.87 323.31 351.59 397.06 434.63 461.19 460.25 504.49 550.80 590.65 234.67 258.54 268.19 280.32 307.59 309.61 324.29 357.21 391.65 378.12 283.23 302.32 325.60 349.66 412.90 432.85 453.41 478.90 498.73 535.85 246.83 258.88 269.75 316.23 368.11 380.00 392.24 425.64 477.22 509.09 69.53 73.90 78.84 86.18 95.06 105.59 106.39 104.61 108.22 114.88
553.47 551.67 518.86 620.08 656.36 649.58 728.71 713.94 829.77 852.67 317.74 355.98 367.29 484.82 546.90 574.06 605.48 587.08 675.51 667.78 308.58 342.88 358.86 434.15 521.88 530.56 532.47 537.25 567.16 553.04 488.86 493.33 514.05 610.16 676.04 657.36 649.95 673.45 724.25 780.91 249.15 261.90 244.17 264.78 310.92 509.71 454.87 397.16 446.72 502.07
96.53 106.06 154.68 157.88 169.99 199.71 225.81 197.38 182.81 183.23 85.41 99.15 121.26 145.81 156.31 165.68 145.94 161.71 162.21 177.87 50.61 64.08 66.90 73.67 85.76 120.00 130.19 137.86 138.13 139.77
178.81 183.97 171.48 216.89 180.49 183.47 188.51 217.68 264.25 210.62 322.56 305.33 329.44 607.81 848.93 749.72 987.07 1,072.10 1,177.48 931.54 120.30 136.70 299.72 344.56 249.10 274.58 308.75 227.89 262.40 304.06
58.62 60.74 64.11 87.97 64.14 108.94 66.55 75.66 74.29 136.14 465.79 457.26 504.23 1203.42 1,184.32 1,181.60 1,361.98 1,052.26 1,041.66 990.03 1,342.59 1,753.85 3,038.98 2,706.62 1,697.18 1,978.62 1,808.33 1,544.86 1,569.59 2,044.35 614.20 581.41 666.73 824.66 954.16 1,006.07 1,060.19 1,132.31 1,345.09 1,598.12
22.99 18.43 23.82 28.73 22.79 31.14 31.22 34.66 29.19 47.3323,201.22 19,835.54 26,472.00 31,555.86 26,215.38 33,064.98 34,682.00 33,912.33 32,511.68 42,567.42 1,090.41 1,222.62 1,386.10 1,887.85 1,915.84 2,133.45 2,369.95 2,254.63 2,250.67 2,356.41
2,118.27 2,164.39 2,681.14 2,989.39 3,031.14 2,735.75 2,723.10 2,868.93 3,354.61 4,382.65 2,745.85 3,152.49 3,627.08 3,751.90 3,750.80 4,014.56 3,747.69 4,196.37 5,139.15 5,766.30 1,202.64 1,408.59 1,550.12 1,485.01 1,535.76 1,700.80 1,567.22 1,696.99 1,975.24 2,636.28
717.16 723.89 810.30 951.81 838.08 857.22 923.41 1,214.12 1,792.10 1,192.29 1,134.53 1,016.98 1,320.27 1,606.06 1,301.06 1,373.92 1,715.34 2,399.38 2,435.48 1,913.21
145.71 150.51 144.46 188.04 203.40 229.51 211.61 208.62 238.46 219.35 142.73 177.12 201.09 201.06 254.58 271.16 278.15 289.51 307.06 318.00
225.33 212.03 218.22 237.16 248.55 223.33 224.52 241.14 332.69 410.10
133.87 185.22 258.23 317.33 283.59 193.72 236.22 248.36 301.06 300.76
95.72 80.90 55.23 54.40 55.47 61.42 69.12 63.69 64.93 88.94
4,921.60 5,319.82 5,693.01 6,504.33 10,317.25 11,423.24 11,436.49 12,229.93 14,054.92 15,010.47 3,632.82 3,681.88 3,630.87 4,271.69 4,714.20 4,999.73 4,946.45 5,111.19 5,967.74 7,788.08 4,932.82 5,248.48 5,195.31 5,541.74 6,243.18 6,577.43 6,501.87 6,387.03 6,643.85 6,903.74
Paddy, kg.
Up Country Vegetables, kg Beans Carrot BeetRoot
Low Country Vegetables, kg Pumpkin(Red) Brinjals CurryChillies Lime
Yams, kg Potatoes Manioc SweetPotatoes
Eggs (Farm), each
Sea Fish, kg Seer–Thora Trevally–Paraw SkipJack–Balaya Tuna–Kelawalla Shark–Mora Sardine–Salaya
Dried Fish, kg Seer–Thora Shark–Mora SkipJack–Balaya QueenFish–Kattawa Sprats
Pulses, kg GreenGram CowpeaMI35(White) Sorghum
Curry Stuff, kg DriedChillies Pepper Turmeric(Dried)
Spices, kg RedOnion Cloves Cardamom CinnamonQuills
Coconut Coconut,each Copra,250kg CoconutCharcoal,50kg
Fruits, 50 kg Pineapple Banana–Kolikuttu Banana–Ambul
Betel and Arecanut, 1,000 Betel Arecanut(Seasoned)
Jaggery and Treacle CoconutJaggery,kg CoconutTreacle,750ml
Coffee Seed, kg
Cocoa, kg
Tea Leaves, kg
Building Materials Bricks,1,000 Sand,cube Metal¾”,cube
(a)Provisional Source :CentralBankofSriLanka

PRICES AND WAGES73
Average Producer Prices of Selected Food Items by Provinces 2016 and 2017
Table 7.8
Item Western Central Southern Northern Eastern NorthWestern
NorthCentral Uva Sabara-
gamuwaAll
Island
AshPlantainsPumpkinsSnakegourdBrinjalsBeansCabbagesCarrotTomatoesDriedChilliesPotatoesRedOnionsBigOnionsEggs(Farm)(100Nos.)ParawBalayaKelawallaSalaya
AshPlantainsPumpkinsSnakegourdBrinjalsBeansCabbagesCarrotTomatoesDriedChilliesPotatoesRedOnionsBigOnionsEggs(Farm)(100Nos.)ParawBalayaKelawallaSalaya
2016
52.03 61.98 45.68 40.82 50.14 45.38 45.76 53.96 47.91 47.97 – 51.75 74.07 37.90 42.38 37.90 41.16 42.89 49.23 43.76 67.64 60.22 61.22 51.85 55.94 58.64 45.59 50.91 56.67 55.47 64.04 60.31 55.38 64.21 65.26 57.22 48.51 56.30 46.47 57.90 – 116.16 – 125.00 – – 115.00 110.37 132.92 117.10 – 57.63 – 70.10 – 43.40 40.00 62.42 – 59.81 – 106.61 – 155.28 – – – 102.87 98.96 108.78 – 60.55 – 74.63 60.14 66.17 49.15 59.36 83.75 63.70 – 284.25 – 278.16 248.13 265.50 233.52 – – 264.25 – 104.77 – 78.33 – – – 103.57 – 99.78 – 84.42 – 72.51 81.20 69.02 81.25 – – 74.29 – 72.80 – 71.63 – – 61.00 – – 70.60 1,438.64 1,433.93 1,434.08 1,421.13 1,447.85 1,376.40 1,228.03 1,501.24 1,452.72 1,418.73 658.58 – 551.07 463.27 616.80 436.81 – – – 550.80 443.47 – 378.85 278.42 433.10 304.17 – – – 391.65 626.21 – 472.68 254.44 483.22 455.27 – – – 498.73 92.67 – 134.78 101.04 119.93 105.59 – – – 108.22
2017(a)
61.81 71.04 47.96 47.64 55.83 49.33 53.06 58.10 54.92 53.98 85.00 63.97 77.97 41.01 46.64 44.60 53.67 54.44 63.83 52.25 79.07 71.42 84.74 57.19 58.61 68.05 56.37 61.67 80.71 66.11 67.11 76.22 65.65 77.55 65.82 60.21 56.37 64.81 61.50 66.28 – 107.20 – 117.00 – – 80.00 107.83 136.67 112.18 – 60.28 – 56.76 – 31.10 32.31 62.85 – 55.52 – 113.26 – 119.29 – – – 113.30 101.05 112.28 – 84.74 – 100.63 – 74.64 62.14 79.92 124.74 83.22 – – – 217.13 194.00 208.46 202.38 – – 210.62 – 115.93 – 85.17 – – – 116.47 – 113.34 – 109.20 – 134.34 147.31 152.15 158.75 – – 136.14 – 74.00 – 101.20 – – 55.71 – – 94.30 1,247.87 1,257.96 1,225.20 1,306.99 1,268.58 1,205.73 1,147.28 1,303.97 1,229.75 1,246.99 727.57 – 547.21 490.13 716.23 463.85 – – – 590.65 423.18 – 329.55 300.00 467.54 302.39 – – – 378.12 680.34 – 464.34 332.00 552.34 494.35 – – – 535.85 108.65 – 119.38 118.64 131.69 94.44 – – – 114.88
Rs.perkg.
(a)Provisional Source :CentralBankofSriLanka
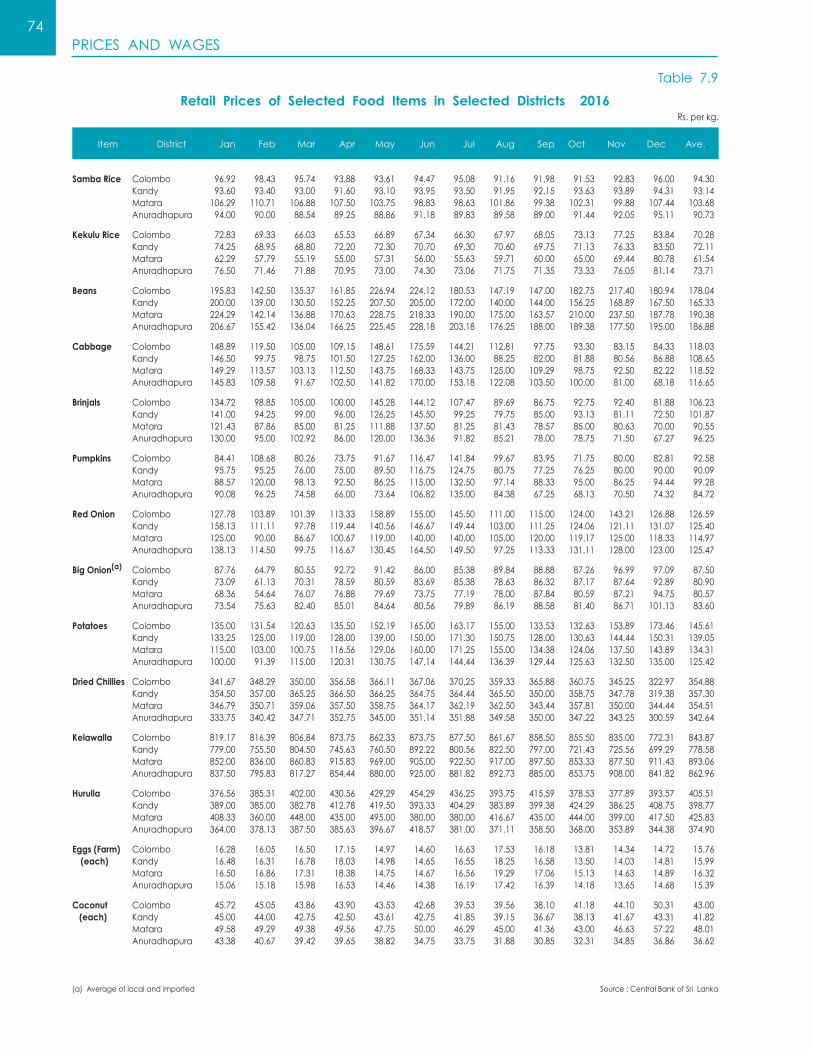
PRICES AND WAGES74
Retail Prices of Selected Food Items in Selected Districts 2016
Table 7.9
Item District Jan Feb Mar Apr May Jun Jul Aug Sep Oct Nov Dec Ave..
Rs.perkg.
96.92 98.43 95.74 93.88 93.61 94.47 95.08 91.16 91.98 91.53 92.83 96.00 94.30 93.60 93.40 93.00 91.60 93.10 93.95 93.50 91.95 92.15 93.63 93.89 94.31 93.14 106.29 110.71 106.88 107.50 103.75 98.83 98.63 101.86 99.38 102.31 99.88 107.44 103.68 94.00 90.00 88.54 89.25 88.86 91.18 89.83 89.58 89.00 91.44 92.05 95.11 90.73
72.83 69.33 66.03 65.53 66.89 67.34 66.30 67.97 68.05 73.13 77.25 83.84 70.28 74.25 68.95 68.80 72.20 72.30 70.70 69.30 70.60 69.75 71.13 76.33 83.50 72.11 62.29 57.79 55.19 55.00 57.31 56.00 55.63 59.71 60.00 65.00 69.44 80.78 61.54 76.50 71.46 71.88 70.95 73.00 74.30 73.06 71.75 71.35 73.33 76.05 81.14 73.71
195.83 142.50 135.37 161.85 226.94 224.12 180.53 147.19 147.00 182.75 217.40 180.94 178.04 200.00 139.00 130.50 152.25 207.50 205.00 172.00 140.00 144.00 156.25 168.89 167.50 165.33 224.29 142.14 136.88 170.63 228.75 218.33 190.00 175.00 163.57 210.00 237.50 187.78 190.38 206.67 155.42 136.04 166.25 225.45 228.18 203.18 176.25 188.00 189.38 177.50 195.00 186.88
148.89 119.50 105.00 109.15 148.61 175.59 144.21 112.81 97.75 93.30 83.15 84.33 118.03 146.50 99.75 98.75 101.50 127.25 162.00 136.00 88.25 82.00 81.88 80.56 86.88 108.65 149.29 113.57 103.13 112.50 143.75 168.33 143.75 125.00 109.29 98.75 92.50 82.22 118.52 145.83 109.58 91.67 102.50 141.82 170.00 153.18 122.08 103.50 100.00 81.00 68.18 116.65
134.72 98.85 105.00 100.00 145.28 144.12 107.47 89.69 86.75 92.75 92.40 81.88 106.23 141.00 94.25 99.00 96.00 126.25 145.50 99.25 79.75 85.00 93.13 81.11 72.50 101.87 121.43 87.86 85.00 81.25 111.88 137.50 81.25 81.43 78.57 85.00 80.63 70.00 90.55 130.00 95.00 102.92 86.00 120.00 136.36 91.82 85.21 78.00 78.75 71.50 67.27 96.25
84.41 108.68 80.26 73.75 91.67 116.47 141.84 99.67 83.95 71.75 80.00 82.81 92.58 95.75 95.25 76.00 75.00 89.50 116.75 124.75 80.75 77.25 76.25 80.00 90.00 90.09 88.57 120.00 98.13 92.50 86.25 115.00 132.50 97.14 88.33 95.00 86.25 94.44 99.28 90.08 96.25 74.58 66.00 73.64 106.82 135.00 84.38 67.25 68.13 70.50 74.32 84.72
127.78 103.89 101.39 113.33 158.89 155.00 145.50 111.00 115.00 124.00 143.21 126.88 126.59 158.13 111.11 97.78 119.44 140.56 146.67 149.44 103.00 111.25 124.06 121.11 131.07 125.40 125.00 90.00 86.67 100.67 119.00 140.00 140.00 105.00 120.00 119.17 125.00 118.33 114.97 138.13 114.50 99.75 116.67 130.45 164.50 149.50 97.25 113.33 131.11 128.00 123.00 125.47
87.76 64.79 80.55 92.72 91.42 86.00 85.38 89.84 88.88 87.26 96.99 97.09 87.50 73.09 61.13 70.31 78.59 80.59 83.69 85.38 78.63 86.32 87.17 87.64 92.89 80.90 68.36 54.64 76.07 76.88 79.69 73.75 77.19 78.00 87.84 80.59 87.21 94.75 80.57 73.54 75.63 82.40 85.01 84.64 80.56 79.89 86.19 88.58 81.40 86.71 101.13 83.60
135.00 131.54 120.63 135.50 152.19 165.00 163.17 155.00 133.53 132.63 153.89 173.46 145.61 133.25 125.00 119.00 128.00 139.00 150.00 171.30 150.75 128.00 130.63 144.44 150.31 139.05 115.00 103.00 100.75 116.56 129.06 160.00 171.25 155.00 134.38 124.06 137.50 143.89 134.31 100.00 91.39 115.00 120.31 130.75 147.14 144.44 136.39 129.44 125.63 132.50 135.00 125.42
341.67 348.29 350.00 356.58 366.11 367.06 370.25 359.33 365.88 360.75 345.25 322.97 354.88 354.50 357.00 365.25 366.50 366.25 364.75 364.44 365.50 350.00 358.75 347.78 319.38 357.30 346.79 350.71 359.06 357.50 358.75 364.17 362.19 362.50 343.44 357.81 350.00 344.44 354.51 333.75 340.42 347.71 352.75 345.00 351.14 351.88 349.58 350.00 347.22 343.25 300.59 342.64
819.17 816.39 806.84 873.75 862.33 873.75 877.50 861.67 858.50 855.50 835.00 772.31 843.87 779.00 755.50 804.50 745.63 760.50 892.22 800.56 822.50 797.00 721.43 725.56 699.29 778.58 852.00 836.00 860.83 915.83 969.00 905.00 922.50 917.00 897.50 853.33 877.50 911.43 893.06 837.50 795.83 817.27 854.44 880.00 925.00 881.82 892.73 885.00 853.75 908.00 841.82 862.96
376.56 385.31 402.00 430.56 429.29 454.29 436.25 393.75 415.59 378.53 377.89 393.57 405.51 389.00 385.00 382.78 412.78 419.50 393.33 404.29 383.89 399.38 424.29 386.25 408.75 398.77 408.33 360.00 448.00 435.00 495.00 380.00 380.00 416.67 435.00 444.00 399.00 417.50 425.83 364.00 378.13 387.50 385.63 396.67 418.57 381.00 371.11 358.50 368.00 353.89 344.38 374.90
16.28 16.05 16.50 17.15 14.97 14.60 16.63 17.53 16.18 13.81 14.34 14.72 15.76 16.48 16.31 16.78 18.03 14.98 14.65 16.55 18.25 16.58 13.50 14.03 14.81 15.99 16.50 16.86 17.31 18.38 14.75 14.67 16.56 19.29 17.06 15.13 14.63 14.89 16.32 15.06 15.18 15.98 16.53 14.46 14.38 16.19 17.42 16.39 14.18 13.65 14.68 15.39
45.72 45.05 43.86 43.90 43.53 42.68 39.53 39.56 38.10 41.18 44.10 50.31 43.00 45.00 44.00 42.75 42.50 43.61 42.75 41.85 39.15 36.67 38.13 41.67 43.31 41.82 49.58 49.29 49.38 49.56 47.75 50.00 46.29 45.00 41.36 43.00 46.63 57.22 48.01 43.38 40.67 39.42 39.65 38.82 34.75 33.75 31.88 30.85 32.31 34.85 36.86 36.62
Source :CentralBankofSriLanka
Samba Rice Colombo Kandy Matara Anuradhapura
Kekulu Rice Colombo Kandy Matara Anuradhapura
Beans Colombo Kandy Matara Anuradhapura
Cabbage Colombo Kandy Matara Anuradhapura
Brinjals Colombo Kandy Matara Anuradhapura
Pumpkins Colombo Kandy Matara Anuradhapura
Red Onion Colombo Kandy Matara Anuradhapura
Big Onion(a) Colombo Kandy Matara Anuradhapura
Potatoes Colombo Kandy Matara Anuradhapura
Dried Chillies Colombo Kandy Matara Anuradhapura
Kelawalla Colombo Kandy Matara Anuradhapura
Hurulla Colombo Kandy Matara Anuradhapura
Eggs (Farm) Colombo (each) Kandy Matara Anuradhapura
Coconut Colombo (each) Kandy Matara Anuradhapura
(a)Averageoflocalandimported

PRICES AND WAGES75
Retail Prices of Selected Food Items in Selected Districts 2017(a)
Table 7.10
Item District Jan Feb Mar Apr May Jun Jul Aug Sep Oct Nov Dec Ave..
Rs.perkg.
97.06 96.21 93.74 95.87 96.50 97.97 97.39 98.44 102.14 105.13 106.46 108.53 99.49 99.05 90.78 88.94 91.25 94.00 98.00 98.61 99.20 102.69 104.17 103.67 108.19 98.24 108.75 106.43 105.00 98.57 102.71 104.13 101.94 105.50 104.44 105.88 103.50 105.44 104.41 97.44 90.17 91.80 90.88 93.32 96.75 98.50 98.04 101.59 104.45 106.88 107.55 98.25
89.31 87.35 81.22 82.77 84.40 85.62 85.32 85.18 87.39 87.60 86.43 88.70 85.96 91.30 89.75 79.38 81.75 85.44 89.60 89.78 90.20 91.19 92.11 92.44 94.25 89.05 89.19 79.79 77.88 76.69 77.43 82.63 78.69 79.88 81.25 82.63 82.38 82.31 80.94 87.22 79.75 79.00 78.54 80.55 84.38 86.96 87.79 89.73 91.45 93.13 92.59 86.12
111.88 175.86 167.35 228.07 220.27 193.89 161.33 165.28 175.83 180.75 190.00 283.75 187.09 92.75 147.50 158.89 162.50 156.11 173.50 155.56 145.25 158.44 150.83 163.06 246.11 158.58 113.75 170.71 169.38 211.88 179.17 183.13 171.25 185.00 197.50 168.75 183.75 315.63 187.85 130.00 180.00 165.25 192.50 198.18 222.08 180.00 197.50 195.45 189.00 172.08 244.09 189.68
77.81 73.33 75.82 138.00 179.00 158.06 157.00 114.44 123.61 151.25 158.33 169.38 129.94 53.75 52.78 62.78 92.19 127.78 150.50 124.44 89.00 96.25 110.83 129.44 143.33 102.78 74.38 76.25 75.00 120.00 128.33 168.75 141.25 124.38 117.50 140.00 163.13 146.88 122.87 50.00 49.50 72.25 124.58 150.91 172.50 140.83 97.92 94.55 146.00 157.08 151.82 119.27
85.63 95.00 75.29 104.00 136.73 136.94 140.00 138.89 147.65 162.19 167.67 187.50 130.90 74.00 77.22 73.33 90.94 125.56 161.50 135.00 122.00 125.63 129.44 151.67 173.89 120.21 62.50 71.88 62.50 88.75 111.43 131.25 109.38 107.50 123.75 154.38 153.75 187.86 112.98 64.00 74.50 55.25 81.04 105.23 135.00 121.88 110.42 124.55 138.00 175.00 167.27 113.86
91.06 95.11 100.00 108.00 102.67 128.24 135.67 92.22 81.76 88.75 95.67 94.06 100.79 83.50 90.31 87.50 92.19 93.89 133.75 129.72 90.00 100.31 89.17 100.00 106.39 99.95 85.00 95.00 101.25 107.50 97.14 120.00 141.25 106.25 105.00 101.25 110.63 108.75 106.68 76.25 86.67 95.00 101.67 105.00 117.08 131.25 88.33 67.50 103.25 112.08 106.36 99.98
165.00 148.50 147.27 199.67 285.00 293.89 252.86 220.00 280.83 293.75 364.38 463.75 254.22 122.81 133.75 130.56 197.81 255.63 348.06 290.83 195.25 288.13 334.44 347.38 388.75 252.56 120.00 117.50 140.00 163.75 260.00 310.00 202.50 185.83 215.00 330.00 388.33 432.50 236.44 128.33 125.00 131.94 159.17 201.50 281.50 260.00 198.33 284.55 347.00 362.00 352.14 236.76
97.31 98.13 99.81 101.73 99.43 101.02 108.81 129.40 135.19 141.82 160.98 161.74 119.12 93.43 94.81 87.22 89.93 84.92 88.86 96.00 124.28 129.42 128.22 140.75 153.65 112.82 84.38 88.13 84.06 87.81 85.71 89.38 86.25 126.25 119.69 126.43 151.19 154.53 114.23 93.76 93.25 101.43 98.23 98.64 96.65 107.00 122.13 132.31 130.03 154.59 150.95 117.75
155.83 151.67 138.00 171.67 173.18 166.43 171.54 169.69 160.00 148.93 143.08 156.43 158.49 149.35 149.67 129.67 151.44 154.50 157.75 156.94 163.25 152.94 140.56 126.11 131.67 147.16 140.71 143.57 134.06 157.50 162.14 154.38 158.57 164.17 152.50 140.00 134.38 134.29 147.67 121.43 122.50 126.88 132.05 144.00 147.22 147.50 144.69 147.75 139.17 136.00 135.71 137.52
301.72 282.06 287.17 267.00 259.33 261.11 263.14 249.41 263.24 270.36 257.67 260.33 268.51 288.50 271.11 258.33 221.88 225.00 216.00 216.94 222.25 234.38 236.67 236.67 251.25 240.09 340.63 282.50 275.63 226.88 230.00 225.63 215.63 220.00 226.88 233.13 231.25 235.63 245.47 316.11 278.25 270.00 251.67 235.00 231.46 228.75 233.13 233.18 240.65 247.92 245.45 249.08
856.33 865.33 853.24 918.67 989.33 990.28 985.67 1,039.12 1,009.71 940.63 904.67 993.57 946.67 803.00 784.44 815.00 873.13 810.56 841.88 920.71 930.56 842.14 863.75 768.33 883.13 842.03 933.33 905.00 885.83 903.33 927.50 970.00 860.83 920.00 875.00 880.00 830.00 942.50 903.53 868.75 820.00 923.33 865.83 870.56 1,015.50 940.83 908.33 873.64 898.33 827.50 929.09 895.60
437.00 430.00 434.71 459.33 453.33 482.65 415.71 427.35 427.78 393.33 385.77 415.00 430.98 425.56 428.21 435.00 441.88 428.13 497.50 462.22 433.00 400.63 435.63 418.06 421.25 435.60 460.00 490.00 360.00 485.00 546.67 496.67 463.33 456.00 417.00 415.00 416.00 408.00 449.78 365.56 406.67 347.00 394.17 416.25 398.50 380.45 358.18 365.00 336.11 340.91 368.00 372.22
13.94 14.66 14.59 14.39 12.37 13.17 14.31 13.25 13.25 12.47 14.22 14.06 13.71 14.35 14.44 14.64 14.25 13.03 13.78 14.39 13.58 13.88 12.92 14.39 14.17 13.98 14.63 14.71 14.31 15.44 13.79 13.00 14.38 14.00 13.75 12.25 13.50 14.00 13.97 14.65 14.14 14.41 14.33 13.62 13.03 13.38 13.07 13.19 12.35 13.42 14.27 13.63
55.13 59.50 61.00 64.50 64.00 61.03 56.93 59.68 66.92 77.50 81.83 79.64 65.40 49.75 56.94 62.44 66.88 66.50 62.00 61.39 58.75 64.06 72.50 81.39 80.56 65.03 56.88 64.06 70.63 66.81 67.00 62.50 60.36 59.69 66.06 75.94 80.71 87.50 67.72 42.00 49.75 49.65 58.13 53.18 53.54 50.63 52.42 63.18 70.83 76.88 74.90 57.86
Source :CentralBankofSriLanka
Samba Rice Colombo Kandy Matara Anuradhapura
Kekulu Rice Colombo Kandy Matara Anuradhapura
Beans Colombo Kandy Matara Anuradhapura
Cabbage Colombo Kandy Matara Anuradhapura
Brinjals Colombo Kandy Matara Anuradhapura
Pumpkins Colombo Kandy Matara Anuradhapura
Red Onion Colombo Kandy Matara Anuradhapura
Big Onion(b) Colombo Kandy Matara Anuradhapura
Potatoes Colombo Kandy Matara Anuradhapura
Dried Chillies Colombo Kandy Matara Anuradhapura
Kelawalla Colombo Kandy Matara Anuradhapura
Hurulla Colombo Kandy Matara Anuradhapura
Eggs (Farm) Colombo (each) Kandy Matara Anuradhapura
Coconut Colombo (each) Kandy Matara Anuradhapura
(a)Provisional
(b)Averageoflocalandimported

PRICES AND WAGES76
Nominal Wage Rate Indices 1965 – 2017
Table 7.11
Year
WorkersinWagesBoards GovernmentEmployees
Workers
in
Agriculture
Workersin
Industryand
Commerce
Workers
in
Services
All
Workers
Non-Executive
Officers
Minor
Employees
Central
Government
Employees
Government
School
Teachers
1978December=100
1965 24.2 34.7 – 25.3 52.2 42.2 46.0 57.6 1966 24.2 34.5 – 25.3 52.2 42.2 46.0 57.6 1967 25.1 36.3 – 26.2 53.5 44.1 47.7 58.6 1968 29.0 42.3 – 30.2 59.7 52.8 55.4 63.6 1969 29.0 42.3 – 30.2 61.6 54.4 57.2 65.0 1970 29.3 43.4 – 30.6 67.0 59.2 62.2 69.2 1971 29.6 46.1 – 31.1 67.0 59.2 62.2 69.2 1972 31.0 47.5 – 33.6 67.1 59.4 62.4 69.2 1973 35.1 52.2 – 36.4 69.5 62.9 65.4 70.6 1974 43.9 62.0 – 45.5 77.4 71.4 73.7 78.0 1975 50.4 72.0 – 52.4 84.2 79.8 81.5 84.3 1976 51.5 73.9 – 53.6 88.2 84.9 86.2 89.1 1977 64.8 79.5 – 66.2 89.2 86.2 87.3 90.6 1978 94.2 98.8 – 94.7 100.0 100.0 100.0 100.0 1979 123.1 111.3 113.9 119.6 115.6 118.7 117.2 112.3 1980 153.6 138.8 130.5 147.3 126.0 132.0 129.1 120.1 1981 153.9 151.0 146.4 152.2 140.9 151.1 146.1 133.1 1982 181.2 161.0 169.7 175.8 180.6 194.7 187.8 166.4 1983 198.7 163.1 177.8 188.8 204.6 226.2 215.7 188.1 1984 250.3 183.3 190.7 228.8 231.4 260.9 246.6 211.4 1985 273.5 203.9 190.7 247.9 264.4 303.2 284.3 247.3 1986 288.1 224.3 190.7 261.3 276.6 317.2 297.4 247.3 1987 302.3 256.3 196.6 277.7 276.6 317.2 297.4 247.3 1988 378.4 271.7 229.5 335.8 364.0 414.1 390.0 331.5 1989 435.9 334.9 245.9 388.1 396.0 444.6 421.8 367.8 1990 517.2 379.5 267.8 453.5 439.6 513.5 476.8 404.5 1991 577.7 459.6 336.5 518.8 488.2 582.3 534.6 444.8 1992 664.1 510.8 365.9 590.0 507.2 609.9 557.6 461.8 1993 803.7 528.7 365.9 685.8 622.1 728.3 675.5 567.1 1994 821.5 555.8 431.4 712.4 692.7 772.3 735.5 595.6 1995 830.9 651.6 456.7 740.3 749.4 828.1 792.5 760.5 1996 907.9 682.8 559.7 801.7 757.1 878.7 818.2 760.5 1997 971.8 710.8 487.2 849.1 842.9 966.7 906.5 778.5 1998 1,097.7 807.7 506.4 953.3 959.6 1,029.1 1,001.4 805.5 1999 1,116.0 829.2 559.7 977.6 959.6 1,029.1 1,001.4 805.5 2000 1,142.7 857.2 559.7 1,000.4 1,031.3 1,125.8 1,084.7 865.1 2001 1,176.4 919.7 657.6 1,049.3 1,225.9 1,388.2 1,310.8 1,026.8 2002 1,269.6 986.5 678.0 1,126.5 1,410.3 1,636.7 1,525.0 1,180.1 2003 1,382.2 1,009.4 678.0 1,205.2 1,410.3 1,636.7 1,525.0 1,180.1 2004 1,397.7 1,044.1 751.0 1,233.0 1,709.0 2,039.5 1,872.1 1,428.4 2005 1,527.4 1,078.4 779.7 1,329.7 2,178.4 2,672.4 2,417.5 1,818.6 2006 1,567.1 1,090.7 779.7 1,358.2 2,853.8 3,463.0 3,150.8 2,304.2 2007 1,821.4 1,522.4 1,057.1 1,648.8 3,493.4 4,172.7 3,828.4 2,740.0 2008 2,286.6 1,877.5 1,370.8 2,070.4 3,749.5 4,494.7 4,116.1 2,938.6 2009 2,349.4 2,054.0 1,545.8 2,171.4 4,082.4 4,943.5 4,502.8 3,215.3 2010 3,327.6 2,199.0 1,673.3 2,865.3 4,210.4 5,116.1 4,651.6 3,321.7 2011 3,427.2 2,402.1 1,851.8 2,996.1 4,490.1 5,465.1 4,964.5 3,576.1 2012 4,433.0 2,402.1 1,851.8 3,662.0 4,803.6 5,831.8 5,304.7 3,821.8 2013 4,435.9 3,191.6 2,241.5 3,869.2 5,035.6 6,130.5 5,568.3 4,011.0 2014 4,560.9 3,459.1 2,313.2 4,012.2 5,462.2 6,691.7 6,058.0 4,361.9 2015 4,734.4 3,459.1 2,313.2 4,127.0 7,152.1 8,970.2 8,021.6 5,766.6 2016 4,735.7 3,459.1 2,313.2 4,127.9 7,413.0 9,341.6 8,333.2 6,067.7
2017(a) 4,736.7 3,459.1 2,313.2 4,128.6 7,413.0 9,341.6 8,333.2 6,067.7
Sources :DepartmentofLabour CentralBankofSriLanka
(a)Provisional
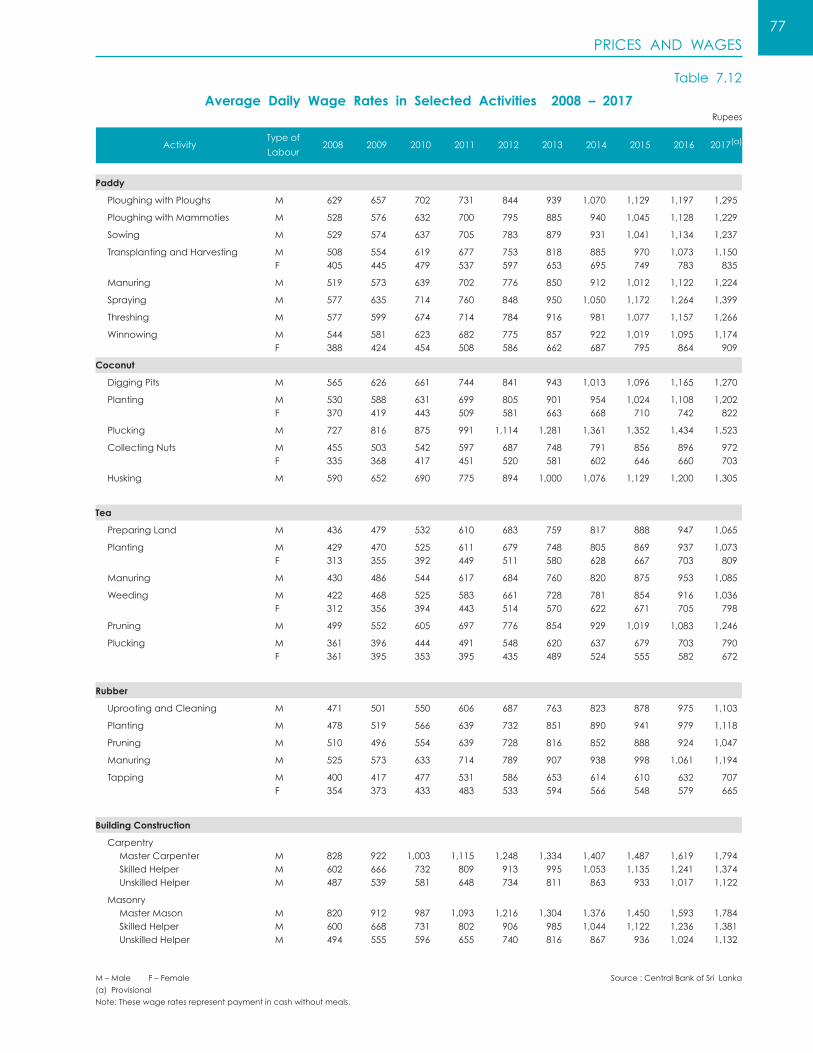
PRICES AND WAGES77
Average Daily Wage Rates in Selected Activities 2008 – 2017
Table 7.12
ActivityTypeof
Labour2008 2009 2010 2011 2012 2013 2014 2015 2016 2017(a)
Rupees
Paddy
PloughingwithPloughs M
PloughingwithMammoties M
Sowing M
TransplantingandHarvesting M F
Manuring M
Spraying M
Threshing M
Winnowing M F
Coconut
DiggingPits M
Planting M F
Plucking M
CollectingNuts M F
Husking M
Tea
PreparingLand M
Planting M F
Manuring M
Weeding M F
Pruning M
Plucking M F
Rubber
UprootingandCleaning M
Planting M
Pruning M
Manuring M
Tapping M F
Building Construction
Carpentry MasterCarpenter M SkilledHelper M UnskilledHelper M
Masonry MasterMason M SkilledHelper M UnskilledHelper M
629 657 702 731 844 939 1,070 1,129 1,197 1,295
528 576 632 700 795 885 940 1,045 1,128 1,229
529 574 637 705 783 879 931 1,041 1,134 1,237
508 554 619 677 753 818 885 970 1,073 1,150 405 445 479 537 597 653 695 749 783 835
519 573 639 702 776 850 912 1,012 1,122 1,224
577 635 714 760 848 950 1,050 1,172 1,264 1,399
577 599 674 714 784 916 981 1,077 1,157 1,266
544 581 623 682 775 857 922 1,019 1,095 1,174 388 424 454 508 586 662 687 795 864 909
565 626 661 744 841 943 1,013 1,096 1,165 1,270
530 588 631 699 805 901 954 1,024 1,108 1,202 370 419 443 509 581 663 668 710 742 822
727 816 875 991 1,114 1,281 1,361 1,352 1,434 1,523
455 503 542 597 687 748 791 856 896 972 335 368 417 451 520 581 602 646 660 703
590 652 690 775 894 1,000 1,076 1,129 1,200 1,305
436 479 532 610 683 759 817 888 947 1,065
429 470 525 611 679 748 805 869 937 1,073 313 355 392 449 511 580 628 667 703 809
430 486 544 617 684 760 820 875 953 1,085
422 468 525 583 661 728 781 854 916 1,036 312 356 394 443 514 570 622 671 705 798
499 552 605 697 776 854 929 1,019 1,083 1,246
361 396 444 491 548 620 637 679 703 790 361 395 353 395 435 489 524 555 582 672
471 501 550 606 687 763 823 878 975 1,103
478 519 566 639 732 851 890 941 979 1,118
510 496 554 639 728 816 852 888 924 1,047
525 573 633 714 789 907 938 998 1,061 1,194
400 417 477 531 586 653 614 610 632 707 354 373 433 483 533 594 566 548 579 665
828 922 1,003 1,115 1,248 1,334 1,407 1,487 1,619 1,794 602 666 732 809 913 995 1,053 1,135 1,241 1,374 487 539 581 648 734 811 863 933 1,017 1,122
820 912 987 1,093 1,216 1,304 1,376 1,450 1,593 1,784 600 668 731 802 906 985 1,044 1,122 1,236 1,381 494 555 596 655 740 816 867 936 1,024 1,132
Source :CentralBankofSriLankaM–MaleF–Female
(a)Provisional
Note:Thesewageratesrepresentpaymentincashwithoutmeals.

PRICES AND WAGES78
Minimum Wage Rate Indices of Workers in Wages Board Trades(a)
Table 7.13
PeriodWorkersin
Agriculture(b)Workersin
IndustryandCommerce(c)Workersin
Services(d)Workersin
WagesBoardsTrades(e)
Nominal Real(f) Nominal Real(f) Nominal Real(f) Nominal Real(f)
1978December=100
2016 January February March April May June July August September October November December
2017(g) January February March April May June July August September October November December
4,735.8 120.9 3,459.1 88.3 2,313.2 59.1 4,128.0 105.4 4,735.6 121.6 3,459.1 88.8 2,313.2 59.4 4,127.9 106.0 4,735.4 123.0 3,459.1 89.9 2,313.2 60.1 4,127.7 107.2 4,735.3 121.4 3,459.1 88.7 2,313.2 59.3 4,127.6 105.8 4,735.5 118.6 3,459.1 86.6 2,313.2 57.9 4,127.8 103.4 4,735.7 116.1 3,459.1 84.8 2,313.2 56.7 4,127.9 101.2 4,736.1 115.9 3,459.1 84.6 2,313.2 56.6 4,128.2 101.0 4,735.9 118.2 3,459.1 86.3 2,313.2 57.7 4,128.1 103.0 4,735.6 118.6 3,459.1 86.6 2,313.2 57.9 4,127.9 103.4 4,735.6 117.8 3,459.1 86.1 2,313.2 57.6 4,127.9 102.7 4,735.8 117.1 3,459.1 85.5 2,313.2 57.2 4,128.0 102.1 4,736.0 116.0 3,459.1 84.7 2,313.2 56.6 4,128.1 101.1
4,736.2 114.6 3,459.1 83.7 2,313.2 56.0 4,128.3 99.9 4,736.4 114.0 3,459.1 83.2 2,313.2 55.7 4,128.4 99.3 4,736.4 114.2 3,459.1 83.4 2,313.2 55.8 4,128.4 99.5 4,736.4 113.6 3,459.1 83.0 2,313.2 55.5 4,128.4 99.0 4,736.6 112.5 3,459.1 82.2 2,313.2 55.0 4,128.5 98.1 4,736.7 110.8 3,459.1 80.9 2,313.2 54.1 4,128.6 96.5 4,736.9 111.4 3,459.1 81.4 2,313.2 54.4 4,128.7 97.1 4,736.8 112.0 3,459.1 81.8 2,313.2 54.7 4,128.6 97.6 4,736.7 111.1 3,459.1 81.2 2,313.2 54.3 4,128.6 96.9 4,736.9 110.1 3,459.1 80.4 2,313.2 53.8 4,128.7 96.0 4,737.1 108.9 3,459.1 79.5 2,313.2 53.2 4,128.9 94.9 4,737.4 108.2 3,459.1 79.0 2,313.2 52.9 4,129.0 94.3
(a) TheIndexnumbersarecalculatedbytheLabourDepartmentonfixedweightsbasedonthenumbersemployed
asat31December1978.ThewagerateusedinthecalculationofIndexnumbersareNominalwagesfordifferent
tradesfixedbytheWagesBoard.
(b) TheIndexreferstowageratesofteagrowingandmanufacturing,rubbergrowingandmanufacturing,coconut,
cocoa,cardamomsandpeppergrowingtradesonly.
(c) Including baking, brick and tile manufacturing, coconut manufacturing, printing, textile, tyre and tube
manufacturing, coir mattresses and bristle fibre export, hosiery manufacturing, engineering, garment
manufacturing,matchmanufacturing,biscuitandconfectionery,teaexportandrubberexporttradesonly.
(d) Thisincludescinema,motortransportandnursinghometradesonly.
(e) Combinedindexforworkersinagriculture,inindustry&commerceandinservices.
(f) BasedonColomboConsumers’PriceIndex(CCPI)-(2006/07=100).
(g) Provisional
Sources :DepartmentofLabour
CentralBankofSriLanka

PRICES AND WAGES79
2016 January February March April May June July August September October November December
2017(c) January February March April May June July August September October November December
Wage Rate Indices of Government Employees(a)
Table 7.14
2012=100
Period
SeniorLevelOfficers
TertiaryLevelOfficers
SecondaryLevelOfficers
PrimaryLevelOfficers
AllGovernmentOfficers
Nominal Real(b) Nominal Real(b) Nominal Real(b) Nominal Real(b) Nominal Real(b)
138.2 123.1 154.0 137.1 161.6 143.8 169.6 150.9 160.4 142.8 138.2 124.4 154.0 138.5 161.6 145.4 169.6 152.6 160.4 144.4 147.6 133.8 158.6 143.7 161.8 146.6 172.1 155.9 161.5 146.4 141.4 126.3 155.5 138.9 161.6 144.4 170.4 152.2 160.8 143.6 141.4 124.0 155.5 136.4 161.6 141.7 170.4 149.4 160.8 141.0 141.4 121.4 155.5 133.5 161.6 138.8 170.4 146.3 160.8 138.1 141.4 122.4 155.5 134.6 161.6 139.9 170.4 147.5 160.8 139.2 141.4 124.4 155.5 136.8 161.6 142.2 170.4 149.9 160.8 141.5 141.4 124.2 155.5 136.6 161.6 142.0 170.4 149.7 160.8 141.2 141.4 122.9 155.5 135.2 161.6 140.5 170.4 148.1 160.8 139.8 141.4 120.9 155.5 133.0 161.6 138.2 170.4 145.7 160.8 137.5 141.4 119.4 155.5 131.4 161.6 136.6 170.4 144.0 160.8 135.9
141.4 118.1 155.5 130.0 161.6 135.1 170.4 142.4 160.8 134.4 141.4 117.6 155.5 129.3 161.6 134.4 170.4 141.7 160.8 133.7 141.4 117.9 155.5 129.7 161.6 134.9 170.4 142.2 160.8 134.1 141.4 116.5 155.5 128.1 161.6 133.2 170.4 140.4 160.8 132.5 141.4 115.7 155.5 127.3 161.6 132.3 170.4 139.5 160.8 131.6 141.4 114.2 155.5 125.6 161.6 130.6 170.4 137.7 160.8 129.9 141.4 115.2 155.5 126.7 161.6 131.7 170.4 138.8 160.8 131.0 141.4 115.2 155.5 126.8 161.6 131.8 170.4 138.9 160.8 131.1 141.4 114.3 155.5 125.7 161.6 130.7 170.4 137.8 160.8 130.0 141.4 112.9 155.5 124.2 161.6 129.1 170.4 136.1 160.8 128.5 141.4 111.5 155.5 122.7 161.6 127.5 170.4 134.4 160.8 126.8 141.4 111.3 155.5 122.5 161.6 127.3 170.4 134.2 160.8 126.6
(a) This index covers all levels of public sector employees, under the disaggregation of Senior,
Tertiary,SecondaryandPrimarylevels.Thebaseperiodemploymentstructurewasbasedona
specialAnnualPublicSectorEmploymentSurvey(APSES)conductedin2012.Initialsalaryscales
of specificoccupationsanddueallowancesas specified in thePublicAdministrationCircular
No.06/2006 issuedbytheMinistryofPublicAdministrationandHomeAffairson25thApril2006
wereusedtoconstructtheIndex.
(b) BasedonNationalConsumerPriceIndex(NCPI)–(2013=100).
(c) Provisional
Source :CentralBankofSriLanka
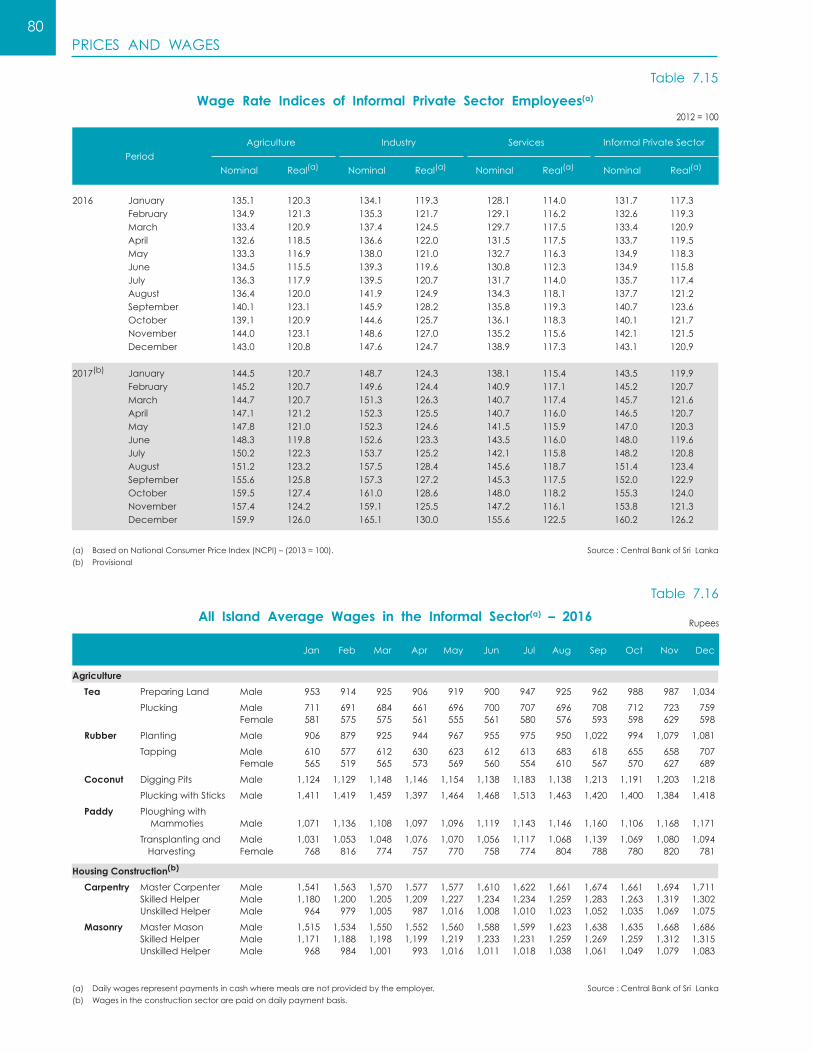
PRICES AND WAGES80
Wage Rate Indices of Informal Private Sector Employees(a)
Table 7.15
Period
Agriculture Industry Services InformalPrivateSector
Nominal Real(a) Nominal Real(a) Nominal Real(a) Nominal Real(a)
2012=100
2016 January February March April May June July August September October November December
2017(b) January February March April May June July August September October November December
135.1 120.3 134.1 119.3 128.1 114.0 131.7 117.3 134.9 121.3 135.3 121.7 129.1 116.2 132.6 119.3 133.4 120.9 137.4 124.5 129.7 117.5 133.4 120.9 132.6 118.5 136.6 122.0 131.5 117.5 133.7 119.5 133.3 116.9 138.0 121.0 132.7 116.3 134.9 118.3 134.5 115.5 139.3 119.6 130.8 112.3 134.9 115.8 136.3 117.9 139.5 120.7 131.7 114.0 135.7 117.4 136.4 120.0 141.9 124.9 134.3 118.1 137.7 121.2 140.1 123.1 145.9 128.2 135.8 119.3 140.7 123.6 139.1 120.9 144.6 125.7 136.1 118.3 140.1 121.7 144.0 123.1 148.6 127.0 135.2 115.6 142.1 121.5 143.0 120.8 147.6 124.7 138.9 117.3 143.1 120.9
144.5 120.7 148.7 124.3 138.1 115.4 143.5 119.9 145.2 120.7 149.6 124.4 140.9 117.1 145.2 120.7 144.7 120.7 151.3 126.3 140.7 117.4 145.7 121.6 147.1 121.2 152.3 125.5 140.7 116.0 146.5 120.7 147.8 121.0 152.3 124.6 141.5 115.9 147.0 120.3 148.3 119.8 152.6 123.3 143.5 116.0 148.0 119.6 150.2 122.3 153.7 125.2 142.1 115.8 148.2 120.8 151.2 123.2 157.5 128.4 145.6 118.7 151.4 123.4 155.6 125.8 157.3 127.2 145.3 117.5 152.0 122.9 159.5 127.4 161.0 128.6 148.0 118.2 155.3 124.0 157.4 124.2 159.1 125.5 147.2 116.1 153.8 121.3 159.9 126.0 165.1 130.0 155.6 122.5 160.2 126.2
(a) BasedonNationalConsumerPriceIndex(NCPI)–(2013=100).
(b) Provisional
Source :CentralBankofSriLanka
All Island Average Wages in the Informal Sector(a) – 2016
Table 7.16
Jan Feb Mar Apr May Jun Jul Aug Sep Oct Nov Dec
Rupees
Agriculture
Tea PreparingLand Male
Plucking Male Female
Rubber Planting Male
Tapping Male Female
Coconut DiggingPits Male
PluckingwithSticks Male
Paddy Ploughingwith Mammoties Male
Transplantingand Male Harvesting Female
Housing Construction(b)
Carpentry MasterCarpenter Male SkilledHelper Male UnskilledHelper Male
Masonry MasterMason Male SkilledHelper Male UnskilledHelper Male
953 914 925 906 919 900 947 925 962 988 987 1,034
711 691 684 661 696 700 707 696 708 712 723 759 581 575 575 561 555 561 580 576 593 598 629 598
906 879 925 944 967 955 975 950 1,022 994 1,079 1,081
610 577 612 630 623 612 613 683 618 655 658 707 565 519 565 573 569 560 554 610 567 570 627 689
1,124 1,129 1,148 1,146 1,154 1,138 1,183 1,138 1,213 1,191 1,203 1,218
1,411 1,419 1,459 1,397 1,464 1,468 1,513 1,463 1,420 1,400 1,384 1,418
1,071 1,136 1,108 1,097 1,096 1,119 1,143 1,146 1,160 1,106 1,168 1,171
1,031 1,053 1,048 1,076 1,070 1,056 1,117 1,068 1,139 1,069 1,080 1,094 768 816 774 757 770 758 774 804 788 780 820 781
1,541 1,563 1,570 1,577 1,577 1,610 1,622 1,661 1,674 1,661 1,694 1,711 1,180 1,200 1,205 1,209 1,227 1,234 1,234 1,259 1,283 1,263 1,319 1,302 964 979 1,005 987 1,016 1,008 1,010 1,023 1,052 1,035 1,069 1,075
1,515 1,534 1,550 1,552 1,560 1,588 1,599 1,623 1,638 1,635 1,668 1,686 1,171 1,188 1,198 1,199 1,219 1,233 1,231 1,259 1,269 1,259 1,312 1,315 968 984 1,001 993 1,016 1,011 1,018 1,038 1,061 1,049 1,079 1,083
(a) Dailywagesrepresentpaymentsincashwheremealsarenotprovidedbytheemployer.
(b) Wagesintheconstructionsectorarepaidondailypaymentbasis.
Source :CentralBankofSriLanka

PRICES AND WAGES81
All Island Average Wages in the Informal Sector(a) – 2017(b)
Table 7.17
Jan Feb Mar Apr May Jun Jul Aug Sep Oct Nov Dec
Rupees
Agriculture
Tea PreparingLand Male
Plucking Male Female
Rubber Planting Male
Tapping Male Female
Coconut DiggingPits Male
PluckingwithSticks Male
Paddy Ploughingwith Mammoties Male
Transplantingand Male Harvesting Female
Housing Construction(c)
Carpentry MasterCarpenter Male SkilledHelper Male UnskilledHelper Male
Masonry MasterMason Male SkilledHelper Male UnskilledHelper Male
997 1,003 1,013 1,025 1,035 1,024 1,039 1,068 1,103 1,135 1,150 1,229
788 789 769 769 779 783 811 796 813 825 777 793 639 634 652 648 670 688 674 686 686 690 710 693
1,050 1,050 1,063 1,067 1,045 1,094 1,070 1,095 1,189 1,220 1,191 1,271
702 687 688 687 694 704 725 729 654 730 728 783 661 652 620 648 670 679 664 707 623 683 684 683
1,229 1,219 1,245 1,215 1,221 1,235 1,238 1,286 1,294 1,335 1,335 1,359
1,445 1,376 1,550 1,458 1,510 1,538 1,527 1,502 1,612 1,589 1,586 1,603
1,173 1,150 1,188 1,219 1,213 1,224 1,200 1,204 1,234 1,276 1,270 1,316
1,144 1,064 1,118 1,171 1,155 1,143 1,117 1,109 1,229 1,198 1,178 1,189 785 818 805 835 816 837 812 861 858 871 845 862
1,725 1,724 1,713 1,781 1,770 1,794 1,781 1,849 1,818 1,856 1,869 1,852 1,318 1,309 1,319 1,353 1,347 1,370 1,368 1,405 1,399 1,424 1,430 1,458 1,098 1,079 1,082 1,103 1,105 1,110 1,127 1,138 1,154 1,157 1,144 1,181
1,704 1,698 1,716 1,769 1,766 1,783 1,772 1,835 1,814 1,848 1,859 1,856 1,319 1,322 1,328 1,355 1,357 1,379 1,378 1,415 1,400 1,432 1,440 1,459 1,106 1,096 1,084 1,121 1,118 1,119 1,127 1,147 1,147 1,170 1,164 1,194
(a) Dailywagesrepresentpaymentsincashwheremealsarenotprovidedbytheemployer.
(b) Provisional
(c) Wagesintheconstructionsectorarepaidondailypaymentbasis.
Source :CentralBankofSriLanka
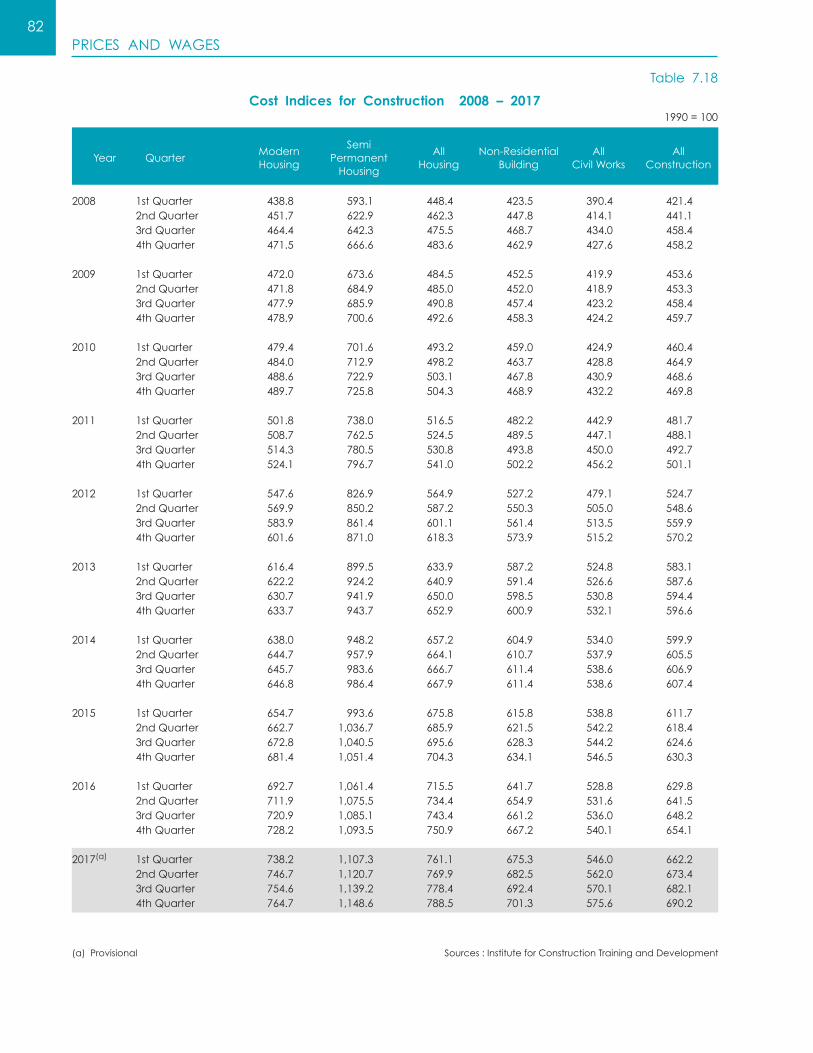
PRICES AND WAGES82
Cost Indices for Construction 2008 – 2017
Table 7.18
1990=100
Year QuarterModernHousing
SemiPermanentHousing
AllHousing
Non-ResidentialBuilding
AllCivilWorks
AllConstruction
2008 1stQuarter 2ndQuarter 3rdQuarter 4thQuarter
2009 1stQuarter 2ndQuarter 3rdQuarter 4thQuarter
2010 1stQuarter 2ndQuarter 3rdQuarter 4thQuarter
2011 1stQuarter 2ndQuarter 3rdQuarter 4thQuarter
2012 1stQuarter 2ndQuarter 3rdQuarter 4thQuarter
2013 1stQuarter 2ndQuarter 3rdQuarter 4thQuarter
2014 1stQuarter 2ndQuarter 3rdQuarter 4thQuarter
2015 1stQuarter 2ndQuarter 3rdQuarter 4thQuarter
2016 1stQuarter 2ndQuarter 3rdQuarter 4thQuarter
2017(a) 1stQuarter 2ndQuarter 3rdQuarter 4thQuarter
438.8 593.1 448.4 423.5 390.4 421.4 451.7 622.9 462.3 447.8 414.1 441.1 464.4 642.3 475.5 468.7 434.0 458.4 471.5 666.6 483.6 462.9 427.6 458.2
472.0 673.6 484.5 452.5 419.9 453.6 471.8 684.9 485.0 452.0 418.9 453.3 477.9 685.9 490.8 457.4 423.2 458.4 478.9 700.6 492.6 458.3 424.2 459.7
479.4 701.6 493.2 459.0 424.9 460.4 484.0 712.9 498.2 463.7 428.8 464.9 488.6 722.9 503.1 467.8 430.9 468.6 489.7 725.8 504.3 468.9 432.2 469.8
501.8 738.0 516.5 482.2 442.9 481.7 508.7 762.5 524.5 489.5 447.1 488.1 514.3 780.5 530.8 493.8 450.0 492.7 524.1 796.7 541.0 502.2 456.2 501.1
547.6 826.9 564.9 527.2 479.1 524.7 569.9 850.2 587.2 550.3 505.0 548.6 583.9 861.4 601.1 561.4 513.5 559.9 601.6 871.0 618.3 573.9 515.2 570.2
616.4 899.5 633.9 587.2 524.8 583.1 622.2 924.2 640.9 591.4 526.6 587.6 630.7 941.9 650.0 598.5 530.8 594.4 633.7 943.7 652.9 600.9 532.1 596.6
638.0 948.2 657.2 604.9 534.0 599.9 644.7 957.9 664.1 610.7 537.9 605.5 645.7 983.6 666.7 611.4 538.6 606.9 646.8 986.4 667.9 611.4 538.6 607.4
654.7 993.6 675.8 615.8 538.8 611.7 662.7 1,036.7 685.9 621.5 542.2 618.4 672.8 1,040.5 695.6 628.3 544.2 624.6 681.4 1,051.4 704.3 634.1 546.5 630.3
692.7 1,061.4 715.5 641.7 528.8 629.8 711.9 1,075.5 734.4 654.9 531.6 641.5 720.9 1,085.1 743.4 661.2 536.0 648.2 728.2 1,093.5 750.9 667.2 540.1 654.1
738.2 1,107.3 761.1 675.3 546.0 662.2 746.7 1,120.7 769.9 682.5 562.0 673.4 754.6 1,139.2 778.4 692.4 570.1 682.1 764.7 1,148.6 788.5 701.3 575.6 690.2
Sources:InstituteforConstructionTrainingandDevelopment(a)Provisional

EXTERNAL TRADE AND FINANCE83
Summary of External Trade 2008 – 2017
Table 8.1
Item 2008 2009 2010 2011 2012 2013 2014 2015 2016 2017(a)
878,499 813,911 974,387 1,167,588 1,245,531 1,344,054 1,453,176 1,431,431 1,500,766 1,732,440
213,132 210,092 260,632 279,466 297,715 333,942 364,762 337,007 338,727 422,031
137,606 136,194 162,793 164,869 180,429 199,446 212,588 182,054 184,778 233,338 13,535 11,327 19,580 22,811 15,726 9,194 5,916 3,548 4,758 5,920 15,728 18,635 18,728 29,394 26,594 26,488 46,517 47,745 53,283 53,037 46,264 43,937 59,531 62,392 74,966 98,814 99,741 103,660 95,907 129,736 662,220 600,621 688,759 883,771 938,762 1,001,808 1,078,725 1,087,938 1,155,706 1,302,575
376,990 374,645 379,185 463,509 508,607 583,046 643,688 654,794 710,768 767,254 27,553 15,447 29,761 61,170 58,902 55,128 44,132 50,461 41,794 66,280 257,678 210,529 279,813 359,091 371,254 363,634 390,905 382,684 403,144 469,041
2,311 2,280 2,739 3,631 7,833 6,727 7,764 3,826 4,219 5,263
835 918 22,258 720 1,221 1,577 1,924 2,660 2,114 2,570
1,525,705 1,172,618 1,519,737 2,241,488 2,441,879 2,323,128 2,535,163 2,572,467 2,794,393(b) 3,198,572
217,295 179,722 279,762 404,037 380,968 410,996 503,021 640,352 628,862 686,424 976,190 707,655 910,010 1,357,505 1,474,534 1,361,740 1,488,091 1,309,234 1,438,156 1,743,719 309,092 240,284 311,496 473,974 582,921 548,604 542,169 620,730 725,473(b) 746,175 23,128 44,957 18,470 5,972 3,455 1,788 1,882 2,151 1,902 22,254 -647,207 -358,707 -545,350 -1,073,900 -1,196,348 -979,074 -1,081,987 -1,141,035 -1,293,627(b) -1,466,133
0.58 0.69 0.64 0.52 0.51 0.58 0.57 0.56 0.54(b) 0.54
66.6 72.4 100.0 108.7 116.2 117.5 121.9 114.7 121.2 130.0 135.2 115.3 100.0 110.2 110.0 117.3 122.3 128.0 127.0 136.7 90.1 83.5 100.0 119.8 127.8 137.9 149.1 146.8 153.9 177.7
82.8 92.5 100.0 119.7 129.7 125.3 124.8 114.5 116.3(b) 123.2 121.5 83.6 100.0 123.6 124.2 122.3 134.0 148.2 158.5(b) 171.3 100.6 77.3 100.0 147.9 161.1 153.2 167.2 169.7 184.3(b) 211.0
80.4 78.3 100.0 90.9 89.6 93.8 97.6 100.2 104.2(b) 105.6
Exports, Rs. Mn.
AgriculturalExports
Tea Rubber CoconutProducts Other
IndustrialExports
TextilesandGarments PetroleumProducts Other
Mineral Other
Imports, Rs. Mn.
ConsumerGoods IntermediateGoods InvestmentGoods Unclassified
Balance of Trade, Rs. Mn.
Export / Import Ratio
ExportIndices(c)
UnitValueIndex VolumeIndex ValueIndex
ImportIndices(c)
UnitValueIndex VolumeIndex ValueIndex
TermsofTrade (2010=100)(d)
(a) Provisional
(b) Revised
(c) Intermsofrupee.Tradeindiceswerecalculated2010asthebaseyear.
(d) TermsofTrade=(ExportUnitValueIndex/ImportUnitValueIndex)×100
Sources: CeylonPetroleumCorporationand
otherExportersofPetroleum
LankaIOCPLC
NationalGemandJewelleryAuthority
SriLankaCustoms
CentralBankofSriLanka

EXTERNAL TRADE AND FINANCE84
Selected Exports 2008 – 2017
Selected Imports 2008 – 2017
Table 8.2
Table 8.3
Agricultural Exports
Tea,MT’000Rubber,MT’000Coconut,Mn.NutsVegetables,MTCoffee,MTCinnamon,MTPepper,MTBetelLeaves,MTArecanuts,MTSesameSeeds&OtherOilSeeds,MTUnmanufacturedTobacco,MT
Selected Other Exports
PetroleumProducts,MT’000MineralExports(b),MTGems,carats’000
Item 2008 2009 2010 2011 2012 2013 2014 2015 2016 2017(a)
Item 2008 2009 2010 2011 2012 2013 2014 2015 2016 2017(a)
320 290 328 323 320 320 327 307 289 289 49 56 52 43 37 24 16 10 16 17 380 367 251 386 351 379 716 552 765 466 12,279 15,670 20,994 13,446 10,814 22,737 40,460 25,846 21,140 21,697 86 60 26 10 10 19 57 24 14 14 12,459 12,234 13,682 13,747 14,762 14,148 13,949 13,828 14,946 16,967 6,253 6,580 12,971 5,065 10,532 21,703 8,353 17,027 8,383 13,778 3,002 2,591 2,604 2,845 1,934 3,024 2,998 2,404 1,956 5,145 3,050 1,426 2,106 2,177 2,435 9,783 29,384 29,513 13,468 10,645 315 1,449 9,201 546 3298 7,036 4,942 3,926 3,969 1,765 1,278 686 695 708 861 1,142 1,162 880 897 918
310 269 436 589 504 511 398 908 807 972 5,176 3,018 3,231 3,341 3,094 3,083 3,116 2,834 3,163 3,123 7,532 7,445 7,345 9,154 9,194 14,393 12,685 12,116 12,136 9,400
84 52 126 28 36 23 600 286 30 748
571 466 548 606 569 548 520 624 651 498
66 65 76 88 84 69 71 86 100 99 1,343 1,442 911 1,756 1,446 1,545 1,172 1,613 1,659 2,179
48 49 49 50 41 39 36 35 37 35 29 27 34 33 31 40 43 85 78 71
919 1,026 1,051 1,242 1,084 895 1,179 1,208 948 1,250
110 61 558 82 189 122 108 74 111 168
773 462 649 801 640 600 765 873 527 399
1,853 2,066 1,819 2,070 1,486 1,743 1,824 1,763 1,685 2,179
2,004 1,702 2,012 2,584 3,796 4,123 4,363 4,092 5,299 5,676
19,460 3,767 37,522 68,763 103,182 32,321 46,647 134,715 47,957 40,519 153,657 112,307 226,426 252,036 186,372 160,524 314,060 349,385 329,978 364,346 28,175 12,860 18,617 26,870 18,967 13,701 5,842 12,601 13,185 10,295
(a) Provisional
(b) Graphiteonly
Sources: CeylonPetroleumCorporationand
otherExportersofPetroleum
NationalGemandJewelleryAuthority
SriLankaCustoms
CentralBankofSriLanka
Sources: SriLankaCustoms
CentralBankofSriLanka
Food and Drink, MT ’000
Rice
Sugar
MilkandMilkProducts
MilkandMilkFood(b)
InfantMilkFood,MT
FishandFishProducts
FishDried(c)
FishOther
WheatGrain
Medical and Pharmaceuticals MT ’000
Fertilizer, MT ’000
Crude Oil, MT ’000
Cement, MT ’000
Transport Equipment (No.)
MotorVehicles(d)
MotorCyclesTractors
(c)Includingmaldive-fish,spratsandsmokedfish.
(d)Includingmotorcars,vans,lorriesandbuses.
(a)Provisional.
(b)Excludinginfantmilkfood.

EXTERNAL TRADE AND FINANCE85
Imports by Major Categories 2008 – 2017
Table 8.4
Item 2008 2009 2010 2011 2012 2013 2014 2015 2016 2017(a)
Rs.Million
217,295 179,722 279,762 404,037 380,968 410,996 503,021 640,352 628,862 686,424
117,903 107,155 149,568 173,277 166,003 176,423 213,308 220,828 237,036 280,646
4,730 2,592 6,741 2,035 3,083 2,297 36,795 17,956 1,872 45,881 112 60 90 1,538 628 237 270 277 255 300 21,988 25,045 41,077 47,091 43,872 37,187 33,332 34,164 49,919 39,041 31,221 18,948 29,214 38,182 39,023 37,572 44,308 34,088 36,338 48,145 6,275 7,869 7,607 8,404 8,935 11,251 8,918 11,103 14,356 14,465 6,348 6,101 7,070 8,066 8,548 9,939 9,895 19,095 20,184 18,697 47,229 46,540 57,768 67,961 61,914 77,940 79,791 104,144 114,112 114,117
99,391 72,567 130,194 230,760 214,965 234,573 289,713 419,524 391,826 405,778
21,759 10,195 48,720 94,473 61,189 74,691 116,165 168,869 113,655 109,527
6,947 2,760 5,080 13,015 14,923 13,324 11,237 16,358 19,760 21,462
4,320 4,150 6,712 7,621 8,064 8,526 9,573 12,822 12,708 11,900
23,010 23,199 24,549 38,487 47,537 48,845 49,685 62,498 76,547 79,299 43,356 32,263 45,133 77,165 83,252 89,187 103,053 158,978 169,155 183,590
976,190 707,655 910,010 1,357,505 1,474,534 1,361,740 1,488,091 1,309,234 1,438,156 1,743,719
62,420 20,851 27,157 44,992 39,859 30,972 35,591 39,573 19,904 15,703
366,839 251,006 343,809 530,389 640,197 555,930 600,150 366,339 361,895 522,470
45,187 40,476 47,203 63,720 70,445 78,074 87,016 98,142 100,613 102,591
9,809 9,095 11,586 13,943 15,095 16,707 18,517 20,056 24,093 24,641
22,165 17,587 24,763 29,230 25,615 29,082 39,169 41,834 45,827 47,798
43,441 30,921 30,009 47,382 46,352 41,551 52,844 48,658 36,221 54,394
193,764 175,681 204,542 256,592 289,546 264,302 303,907 311,965 393,896 415,386
232,565 162,038 220,941 371,257 347,424 345,123 350,898 382,668 455,707 560,737
309,092 240,284 311,496 473,974 582,921 548,604 542,169 620,730 725,473(b) 746,175
97,405 75,290 92,905 118,935 157,437 175,054 170,901 184,176 228,538 242,621
52,315 40,926 66,991 117,737 124,773 86,170 92,367 125,927 96,605(b) 102,914
158,907 123,731 151,223 236,857 300,138 286,631 278,257 309,811 399,090 399,453
465 336 377 445 573 748 644 816 1,239 1,187
23,128 44,957 18,470 5,972 3,455 1,788 1,882 2,151 1,902 22,254
1,525,705 1,172,618 1,519,737 2,241,488 2,441,879 2,323,128 2,535,163 2,572,467 2,794,393 3,198,572
Consumer Goods
Food and Drink
Rice Flour Sugar MilkandMilkProducts FishDried FishOther FoodOther
Other Consumer Goods
MotorCarsandCycles
RadioReceiversandTVSets
TyresandTubes
MedicalandPharmaceutical Products
Other
Intermediate Goods
Fertiliser
Fuel
ChemicalElementsandCompounds
Dyeing,Tanning&ColouringMaterials
PaperandPaperBoards
WheatandMaize
TextilesandTextileArticles
Other
Investment Goods
BuildingMaterials
TransportEquipment
MachineryandEquipment
Other
Unclassified Imports
Total Imports(c)
(a) Provisional
(b) Revised
(c) Adjusted
Sources: SriLankaCustoms
PrimaCeylonLtd.
SerendibFlourMills(Pvt)Ltd.
CeylonPetroleumCorporation
LankaIOCPLC
CentralBankofSriLanka

EXTERNAL TRADE AND FINANCE86
Direction of Trade – Exports(a) 2013 – 2017
Table 8.5
ValueinRs.Million
GroupofCountries2013 2014 2015 2016 2017(b)
Value Share(%) Value Share
(%) Value Share(%) Value Share
(%) Value Share(%)
Largest Export Destinations
UnitedStatesofAmerica UnitedKingdom India Germany Italy Belgium–Luxembourg UnitedArabEmirates China,People'sRepublicof Turkey Netherlands
Other Export Destinations
Australia Azerbaijan Bangladesh Brazil Canada Chile Denmark France HongKong Hungary Indonesia Iran Iraq Ireland,Republicof Israel Japan Jordan Kuwait Lebanon Libya Malaysia Maldives Mexico Pakistan Philippines Poland Russia SaudiArabia Singapore SouthAfrica SouthKorea Spain Sweden Switzerland Syria Taiwan Thailand Vietnam Other
European Union (EU)(c)
Asian Clearing Union (ACU)(d)
SAARC Region(e)
Middle East(f)
APTA Region(g)
BIMSTEC(h)
C.I.S. Countries(i)
322,044 24.0 356,524 24.5 381,976 26.6 409,131 27.3 443,512 25.6 139,173 10.4 145,716 10.0 139,907 9.8 152,010 10.1 157,992 9.1 70,174 5.2 81,575 5.6 87,449 6.1 80,665 5.4 105,397 6.1 60,487 4.5 65,015 4.5 64,711 4.5 72,827 4.9 82,396 4.8 65,914 4.9 80,203 5.5 59,011 4.1 62,557 4.2 79,866 4.6 57,986 4.3 41,261 2.8 38,447 2.7 49,241 3.3 52,864 3.1 30,574 2.3 36,204 2.5 37,543 2.6 34,041 2.3 41,986 2.4 16,885 1.3 24,565 1.7 41,849 2.9 30,733 2.0 37,732 2.2 24,734 1.8 33,906 2.3 24,507 1.7 21,955 1.5 35,515 2.1 24,650 1.8 31,691 2.2 29,914 2.1 30,263 2.0 33,632 1.9
20,109 1.5 21,377 1.5 21,771 1.5 24,137 1.6 28,811 1.7 6,699 0.5 7,253 0.5 6,361 0.4 6,773 0.5 9,897 0.6 10,606 0.8 11,771 0.8 12,618 0.9 16,374 1.1 18,660 1.1 8,128 0.6 7,154 0.5 6,017 0.4 6,477 0.4 8,161 0.5 19,599 1.5 22,469 1.5 24,591 1.7 26,199 1.7 31,989 1.8 4,556 0.3 5,735 0.4 5,225 0.4 5,715 0.4 7,555 0.4 3,625 0.3 3,908 0.3 3,881 0.3 3,804 0.3 5,561 0.3 25,211 1.9 34,513 2.4 26,176 1.8 22,860 1.5 26,265 1.5 16,945 1.3 18,395 1.3 18,439 1.3 20,218 1.3 25,943 1.5 708 0.1 1,123 0.1 1,610 0.1 3,367 0.2 4,958 0.3 4,791 0.4 5,884 0.4 4,798 0.3 6,093 0.4 7,159 0.4 26,465 2.0 23,635 1.6 21,173 1.5 25,155 1.7 27,002 1.6 11,594 0.9 12,013 0.8 14,291 1.0 16,253 1.1 22,392 1.3 5,534 0.4 6,487 0.4 4,771 0.3 5,408 0.4 6,632 0.4 12,928 1.0 16,918 1.2 15,981 1.1 13,051 0.9 12,497 0.7 28,977 2.2 31,003 2.1 29,312 2.0 29,384 2.0 31,882 1.8 5,686 0.4 5,880 0.4 5,228 0.4 4,752 0.3 6,151 0.4 7,611 0.6 6,929 0.5 5,422 0.4 4,205 0.3 5,067 0.3 2,593 0.2 3,537 0.2 3,414 0.2 4,550 0.3 5,611 0.3 2,868 0.2 5,990 0.4 4,485 0.3 6,752 0.4 8,005 0.5 6,047 0.5 5,830 0.4 4,967 0.3 5,243 0.3 8,245 0.5 7,652 0.6 11,535 0.8 10,511 0.7 13,878 0.9 16,459 1.0 13,174 1.0 14,585 1.0 14,427 1.0 19,253 1.3 25,081 1.4 10,726 0.8 9,700 0.7 9,948 0.7 9,296 0.6 11,287 0.7 1,077 0.1 4,504 0.3 2,354 0.2 2,153 0.1 5,672 0.3 6,125 0.5 6,861 0.5 5,906 0.4 6,738 0.4 7,249 0.4 36,144 2.7 35,749 2.5 26,320 1.8 26,501 1.8 31,991 1.8 8,225 0.6 9,577 0.7 11,061 0.8 9,467 0.6 11,617 0.7 13,566 1.0 18,413 1.3 11,274 0.8 16,543 1.1 28,878 1.7 4,003 0.3 4,330 0.3 4,318 0.3 4,750 0.3 6,429 0.4 10,116 0.8 9,551 0.7 8,734 0.6 10,020 0.7 9,613 0.6 8,680 0.6 8,534 0.6 10,295 0.7 11,966 0.8 11,303 0.7 7,929 0.6 9,278 0.6 8,739 0.6 10,009 0.7 11,951 0.7 13,835 1.0 16,958 1.2 13,131 0.9 14,283 1.0 14,810 0.9 12,483 0.9 8,078 0.6 6,538 0.5 7,979 0.5 6,361 0.4 3,985 0.3 5,152 0.4 6,036 0.4 5,670 0.4 7,560 0.4 8,584 0.6 8,918 0.6 7,251 0.5 6,977 0.5 8,469 0.5 5,461 0.4 9,696 0.7 9,896 0.7 13,793 0.9 15,229 0.9 126,334 9.4 107,268 7.4 121,083 8.4 111,644 7.4 122,688 7.1
422,591 31.5 455,926 31.4 411,044 28.7 451,507 30.1 503,227 29.1 126,429 9.4 138,980 9.6 142,413 9.9 145,689 9.7 179,414 10.4 99,825 7.4 115,097 7.9 121,085 8.4 120,453 8.0 152,213 8.8 144,228 10.7 158,028 10.9 145,195 10.1 140,437 9.4 176,351 10.2 107,793 8.0 127,634 8.8 150,784 10.5 138,263 9.2 171,641 9.9 90,169 6.7 103,029 7.1 108,032 7.5 104,337 7.0 133,136 7.7 54,048 4.0 52,627 3.6 38,563 2.7 39,913 2.7 49,365 2.9
Sources:NationalGemandJewelleryAuthority SriLankaCustoms CentralBankofSriLanka
(a) Thecountrieswhicharenotmentionedhaverelativelysmallervalueofexports.(b) Provisional(c) Members of the European Union are Austria, Belgium-Luxembourg, Bulgaria, Croatia, Cyprus, Czech Republic,
Denmark,Estonia,Finland,France,Germany,Greece,Hungary, Ireland, Italy,Latvia,Lithuania,Malta,Netherlands,Poland,Portugal,Romania,SlovakRepublic,Slovenia,Spain,SwedenandUK.
(d) MembersoftheAsianClearingUnionareBangladesh,Bhutan,India,Iran,Maldives,Myanmar,Nepal,PakistanandSriLanka.(e) SouthAsianAssociationforRegionalCo-operation.ItsmembersareAfghanistan,Bangladesh,Bhutan,India,Maldives,Nepal,PakistanandSriLanka.(f) MiddleEasterncountriesareBahrain,Iran,Iraq,Israel,Jordan,Kuwait,Oman,Palestine,Qatar,SaudiArabia,Syria,Turkey,UAEandYemen.(g) Asia-PacificTradeAgreement.ItsmembersareBangladesh,China,India,Laos,Mongolia,SouthKoreaandSriLanka.(h) BayofBengalInitiativeforMulti-SectoralTechnicalandEconomicCooperation.ItsmembersareBangladesh,Bhutan,India,Myanmar,Nepal,ThailandandSriLanka(i) MembersoftheCommonwealthofIndependentStatesareArmenia,Azerbaijan,Belarus,Kazakhstan,Kyrgyzstan,Moldova,Russia,Tajikistan,Turkmenistan,UkraineandUzbekistan.

EXTERNAL TRADE AND FINANCE87
Direction of Trade – Imports(a) 2013 – 2017
Table 8.6
ValueinRs.Million
GroupofCountries2013 2014 2015 2016 2017(b)
Value Share(%) Value Share
(%) Value Share(%) Value Share
(%) Value Share(%)
Largest Import Origins
India China,People'sRepublicof UnitedArabEmirates Singapore Japan Malaysia Thailand UnitedStatesofAmerica Taiwan HongKong
Other Import Origins
Australia Austria Belgium–Luxembourg Brazil Canada Denmark France Germany Indonesia Israel Italy Maldives Myanmar Netherland NewZealand Oman Pakistan Qatar Russia SaudiArabia SouthAfrica SouthKorea Spain Sweden Switzerland Turkey Ukraine UnitedKingdom Vietnam Other
European Union (EU)(d)
Asian Clearing Union (ACU)(e)
SAARC Region(f)
Middle East(g)
APTA Region(h)
BIMSTEC(i)
C.I.S. Countries(j)
409,375 17.6 525,264 20.7 580,237 22.5 555,505 19.9 690,229 21.6 381,275 16.4 456,130 18.0 504,619 19.6 581,824(c) 20.8 603,042 18.9 152,253 6.6 239,945 9.5 145,016 5.6 162,935 5.8 258,751 8.1 217,180 9.3 164,485 6.5 144,538 5.6 171,065 6.1 206,117 6.4 86,243 3.7 122,886 4.8 188,853 7.3 138,379 5.0 158,318 4.9 73,608 3.2 97,205 3.8 69,116 2.7 92,875 3.3 97,232 3.0 56,366 2.4 57,741 2.3 67,507 2.6 74,968 2.7 78,988 2.5 53,765 2.3 64,275 2.5 63,991 2.5 78,550 2.8 74,937 2.3 56,213 2.4 57,882 2.3 62,485 2.4 72,232 2.6 73,490 2.3 55,493 2.4 45,867 1.8 49,668 1.9 67,895 2.4 64,340 2.0
27,531 1.2 30,996 1.2 36,500 1.4 28,598 1.0 37,562 1.2 5,903 0.3 8,109 0.3 11,056 0.4 14,567 0.5 10,216 0.3 28,361 1.2 15,742 0.6 20,137 0.8 10,424 0.4 12,006 0.4 16,484 0.7 16,829 0.7 17,316 0.7 28,143 1.6 19,096 0.6 29,537 1.3 40,442 1.6 39,837 1.5 36,744 1.3 34,621 1.1 7,391 0.3 8,142 0.3 5,882 0.2 8,841 0.3 6,839 0.2 16,906 0.7 21,249 0.8 15,841 0.6 21,496 0.8 24,364 0.8 49,630 2.1 42,690 1.7 47,155 1.8 63,368 2.3 61,052 1.9 56,663 2.4 58,906 2.3 62,435 2.4 56,516 2.0 56,899 1.8 9,867 0.4 9,196 0.4 7,022 0.3 11,788 0.4 10,143 0.3 32,569 1.4 34,590 1.4 28,477 1.1 40,235 1.4 46,506 1.5 1,692 0.1 1,311 0.1 3,128 0.1 13,049 0.5 24,934 0.8 1,155 … 3,881 0.2 2,918 0.1 4,644 0.2 12,198 0.4 11,090 0.5 10,971 0.4 15,614 0.6 16,498 0.6 11,852 0.4 28,213 1.2 33,062 1.3 25,211 1.0 28,563 1.0 43,736 1.4 99,624 4.3 73,095 2.9 25,680 1.0 4,669 0.2 11,837 0.4 48,846 2.1 36,505 1.4 40,411 1.6 44,310 1.6 53,216 1.7 6,840 0.3 7,462 0.3 4,836 0.2 4,386 0.2 8,053 0.3 19,288 0.8 34,009 1.3 32,775 1.3 29,076 1.0 26,655 0.8 11,301 0.5 14,312 0.6 15,763 0.6 19,709 0.7 22,816 0.7 4,697 0.2 2,820 0.1 11,666 0.5 28,874 1.0 43,678 1.4 37,195 1.6 51,187 2.0 40,267 1.6 47,113 1.7 50,773 1.6 5,926 0.3 6,587 0.3 5,642 0.2 11,303 0.4 13,323 0.4 9,011 0.4 7,070 0.3 11,659 0.5 9,389 0.3 9,980 0.3 31,195 1.3 16,915 0.7 17,295 0.7 39,968 1.4 46,362 1.4 5,192 0.2 6,713 0.3 6,744 0.3 10,074 0.4 12,963 0.4 3,714 0.2 629 … 593 … 9,181 0.3 17,377 0.5 36,292 1.6 37,888 1.5 49,506 1.9 47,663 1.7 40,859 1.3 23,429 1.0 25,090 1.0 33,247 1.3 39,276 1.4 42,828 1.3 117,021 5.0 46,983 1.9 63,284 2.5 68,287(c) 2.4 80,339 2.5
214,973 9.2 207,323 8.2 228,907 8.9 264,765 9.5 261,080 8.2 465,797 20.0 571,396 22.5 632,781 24.6 622,834 22.3 788,878 24.7 463,164 19.9 566,491 22.3 628,912 24.4 617,179 22.1 775,058 24.2 293,321 12.6 355,935 14.0 212,383 8.3 220,230 7.9 332,390 10.4 831,093 35.8 1,036,350 40.9 1,131,106 43.9 1,190,172 42.6 1,351,849 42.3 470,139 20.2 590,294 23.3 655,795 25.5 639,424 22.9 788,077 24.6 29,921 1.3 37,229 1.5 39,151 1.5 42,130 1.5 48,530 1.5
Sources:CeylonPetroleumCorporation LankaIOCPLC PrimaCeylonLtd SerendibFlourMills(Pvt)Ltd. SriLankaCustoms CentralBankofSriLanka
(a) Thecountrieswhicharenotmentionedhaverelativelysmallervalueofimports.(b) Provisional
(c) Revised
(d) Membersof theEuropeanUnionareAustria,Belgium–Luxembourg,Bulgaria,Croatia,Cyprus,CzechRepublic,Denmark,Estonia, Finland, France,Germany,Greece,Hungary, Ireland, Italy,Latvia, Lithuania, Malta, Netherlands, Poland, Portugal, Romania, Slovak Republic, Slovenia,Spain,SwedenandUK.
(e) MembersoftheAsianClearingUnionareBangladesh,Bhutan,India,Iran,Maldives,Myanmar,Nepal,PakistanandSriLanka.
(f) SouthAsianAssociationforRegionalCo-operation.ItsmembersareAfghanistan,Bangladesh,Bhutan,India,Maldives,Nepal,PakistanandSriLanka.
(g) MiddleEasterncountriesareBahrain,Iran,Iraq,Israel,Jordan,Kuwait,Oman,Palestine,Qatar,SaudiArabia,Syria,Turkey,UAEandYemen.
(h) Asia-PacificTradeAgreement.ItsmembersareBangladesh,China,India,Laos,Mongolia,SouthKoreaandSriLanka.
(i) BayofBengalInitiativeforMulti-SectoralTechnicalandEconomicCooperation.ItsmembersareBangladesh,Bhutan,India,Myanmar,Nepal,ThailandandSriLanka
(j) MembersoftheCommonwealthofIndependentStatesareArmenia,Azerbaijan,Belarus,Kazakhstan,Kyrgyzstan,Moldova,Russia,Tajikistan,Turkmenistan,UkraineandUzbekistan.
…–Negligible

EXTERNAL TRADE AND FINANCE88
(2010=100)
(2010=100)
Central Bank Trade Indices – Value(a) 2013 – 2017
Central Bank Trade Indices – Volume(a) 2013 – 2017
Table 8.7
Table 8.8
Category 2013 2014 2015 2016 2017(b)
Category 2013 2014 2015 2016 2017(b)
137.9 149.1 146.8 153.9 177.7
128.1 140.0 129.3 130.0 161.9 122.5 130.6 111.8 113.5 143.3 47.0 30.2 18.1 24.3 30.2 141.4 248.4 254.9 284.5 283.2 162.5 267.2 270.0 205.5 261.9 145.5 156.6 158.0 167.8 189.1 153.8 169.8 172.7 187.4 202.3 185.2 148.3 169.6 140.4 222.7 182.4 184.6 164.1 177.6 202.5 245.6 283.5 139.7 154.0 192.2
153.2 167.2 169.7 184.3(c) 211.0
146.9 179.8 228.9 224.8 245.4 118.0 142.6 147.6 158.5 187.6 180.2 222.5 322.2 301.0 311.7 149.7 163.5 143.9 158.0 191.6 161.7 174.6 106.6 105.3 152.0 129.2 148.6 152.5 192.6 203.1 114.0 131.1 145.7 73.3 57.8 161.2 179.5 201.1 212.1 216.4 138.5 176.1 162.1 120.7 181.3 176.1 174.1 199.3 232.9(c) 239.5 189.5 184.0 204.9 263.9 264.1 128.6 137.9 188.0 144.2(c) 153.6 188.4 184.0 198.2 246.0 261.2
117.3 122.3 128.0 127.0 136.7
97.4 103.2 95.6 90.8 96.5 95.0 98.5 91.3 86.2 87.4 45.5 32.3 21.0 27.2 31.4 112.7 170.7 159.4 174.1 154.5 162.6 232.2 205.3 149.6 169.8 128.7 133.2 144.4 144.9 156.3 121.1 128.2 126.4 127.1 129.8 116.9 92.6 208.6 185.8 228.5 109.0 108.1 96.9 104.2 109.4 81.0 158.6 82.4 88.9 105.6
122.3 134.0 148.2 158.5(c) 171.3
119.2 143.3 177.9 156.5 167.4 105.4 125.8 128.1 124.1 146.7 135.1 163.5 235.0 193.8 191.0 111.1 122.9 128.7 142.5 158.6 103.4 117.7 116.6 129.5 150.7 104.7 115.8 120.4 138.2 137.6 88.4 112.6 129.5 68.6 53.7 128.1 138.3 155.6 163.4 161.6 84.8 123.5 121.3 92.7 134.0 157.6 158.2 179.7 208.9(c) 208.7 183.9 180.7 197.3 253.9 244.2 103.5 114.4 156.5 110.9(c) 112.8 153.9 153.0 167.8 206.2 220.1
Total Exports
Agricultural Tea Rubber CoconutProducts MinorAgriculturalProducts Industrial Products TextilesandGarments PetroleumProducts RubberProducts Mineral Products
Total Imports
Consumer Goods FoodandBeverages OtherConsumerGoods Intermediate Goods Fuel TextilesandTextileArticles Fertiliser ChemicalProducts WheatandMaize Investment Goods MachineryandEquipment TransportEquipment BuildingMaterials
(a)Thevalueindexiscomputedasasimpleindexoftheratioof
rupeevaluesbetweenthecurrentperiodandthebaseperiod.
(b)Provisional
(c)Revised
Source:CentralBankofSriLanka
Source:CentralBankofSriLanka(a)VolumeindexiscomputedasaLaspeyre’sindex.
(b)Provisional
(c)Revised

EXTERNAL TRADE AND FINANCE89
(2010=100)
SriLankaRupeesperUnitofForeignCurrency
Central Bank Trade Indices – Unit Value(a) 2013 – 2017
Exchange Rates – Year End 2008 – 2017
Table 8.9
Table 8.10
Category 2013 2014 2015 2016 2017(b)
Country Currency 2008 2009 2010 2011 2012 2013 2014 2015 2016 2017
117.5 121.9 114.7 121.2 130.0
131.6 135.6 135.3 143.2 167.7 129.0 132.6 122.5 131.6 164.0 103.2 93.5 86.2 89.4 96.3 125.5 145.5 160.0 163.4 183.3 99.9 115.1 131.5 137.3 154.2 113.0 117.5 109.4 115.8 121.0 126.9 132.4 136.6 147.5 155.9 158.5 160.2 81.3 75.6 97.4 167.3 170.7 169.3 170.5 185.0 303.1 178.7 169.5 173.2 182.0
125.3 124.8 114.5 116.3(c) 123.2
123.2 125.4 128.7 143.6 146.6 111.9 113.4 115.2 127.7 127.9 133.4 136.1 137.1 155.3 163.2 134.7 133.0 111.8 110.9 120.8 156.4 148.3 91.4 81.3 100.8 123.4 128.3 126.6 139.4 147.6 129.0 116.4 112.5 106.9 107.7 125.9 129.8 129.2 129.8 133.9 163.3 142.6 133.6 130.2 135.3 111.7 110.0 110.9 111.5(c) 114.8 103.0 101.8 103.8 103.9 108.2 124.3 120.5 120.1 130.1(c) 136.2 122.5 120.2 118.1 119.3 118.6
93.8 97.6 100.2 104.2(c) 105.6
78.05 101.99 112.88 115.58 132.24 116.67 107.64 105.10 108.43 119.10 92.76 109.29 110.90 111.58 127.83 122.73 113.12 103.89 111.17 121.61 21.40 22.00 19.79 19.83 22.54 24.19 21.40 21.09 21.24 24.51 159.45 163.72 147.56 147.42 168.13 180.45 159.42 157.37 157.87 182.49 14.60 14.75 14.26 14.66 16.40 16.86 16.89 18.59 19.32 19.55 2.36 2.46 2.48 2.15 2.33 2.11 2.07 2.17 2.21 2.39 1.25 1.24 1.36 1.47 1.48 1.25 1.10 1.20 1.29 1.36 409.56 398.27 394.12 408.73 452.16 463.01 447.86 474.48 489.30 505.92 32.58 33.33 35.98 35.83 41.57 39.77 37.52 33.52 33.40 37.63 65.39 81.85 85.63 88.01 104.81 107.50 102.83 98.63 104.35 108.49 16.13 19.64 18.86 18.97 22.79 21.51 17.66 16.38 17.38 18.53 1.44 1.36 1.29 1.27 1.31 1.24 1.30 1.37 1.43 1.38 30.15 30.49 29.59 30.37 33.91 34.86 34.92 38.39 39.93 40.76 78.60 81.32 86.14 87.58 104.01 103.26 99.25 101.84 103.67 114.32 12.07 15.39 16.74 13.93 15.01 12.54 11.34 9.27 11.04 12.32 14.59 15.83 16.45 16.50 19.56 20.36 16.93 17.12 16.49 18.53 106.94 110.08 118.51 121.02 139.28 147.29 132.59 145.71 146.91 156.17 30.80 31.14 30.21 31.01 34.62 35.60 35.68 39.23 40.79 41.61 163.28 181.75 171.41 175.45 205.47 215.58 204.04 213.57 184.04 205.54 113.14 114.38 110.95 113.90 127.16 130.75 131.05 144.06 149.80 152.85
Total Exports
Agricultural Tea Rubber CoconutProducts MinorAgriculturalProducts Industrial Products TextilesandGarments PetroleumProducts RubberProducts Mineral Products
Total Imports
Consumer Goods FoodandBeverages OtherConsumerGoods Intermediate Goods Fuel TextilesandTextileArticles Fertiliser ChemicalProducts WheatandMaize Investment Goods MachineryandEquipment TransportEquipment BuildingMaterials
Terms of Trade
Australia DollarCanada DollarDenmark KronerEuropeanUnion EuroHongkong DollarIndia RupeeJapan YenKuwait DinarMalaysia RinggitNewZealand DollarNorway KronerPakistan RupeeSaudiArabia RiyalSingapore DollarSouthAfrica RandSweden KronerSwitzerland FrancUnitedArabEmirates DirhamUnitedKingdom PoundUnitedStatesofAmerica Dollar
Source:CentralBankofSriLanka
Source:CentralBankofSriLanka
(a)Paascheunitvalueindexisderivedbyusingtherupeevalueindexandthevolumeindex.(b)Provisional(c)Revised

EXTERNAL TRADE AND FINANCE90
Balance of Payments(a) 2003 – 2011
Table 8.11(A)
Item 2003 2004 2005 2006 2007 2008 2009 2010 2011
Rs.Million
Trade Balance Exports Imports
Services (net) Receipts Payments
Income (net) Receipts Payments
Goods, Services and Income (net)
Current Transfers (net)
PrivateTransfers(net) Receipts Payments
OfficialTransfers(net)
Current Account Balance
Capital and Financial Account (net)
Capital Account (net)
Capital Transfers (net) Receipts Payments
Financial Account
Long-term(net) DirectInvestment ForeignDirectInvestment(net) PrivatisationProceeds PrivateLong-term(net) Inflows Outflows GovernmentLong-term(net) Inflows Outflows Short-term(net) PortfolioInvestment(net) PrivateShort-term(net) GovernmentShort-term(net) CommercialBank(net) CommercialBankAssets(net) CommercialBankLiabilities(net)(b)
Allocations of SDRs(c)
Errors and Omissions
Overall Balance
Monetary Movements
Average Exchange Rate Rs./US $
Ratio to GDP in percentages(d)
TradeAccount CurrentAccount CurrentAccountwithoutGrants
-148,324 -227,171 -253,082 -350,037 -404,703 -647,207 -358,707 -545,350 -1,073,900 495,426 583,967 638,276 716,579 845,683 878,499 813,911 974,387 1,167,588 643,750 811,138 891,359 1,066,615 1,250,386 1,525,705 1,172,618 1,519,737 2,241,488
38,443 42,735 34,043 26,660 33,357 43,557 44,780 79,766 121,635 136,123 154,746 154,877 168,802 196,249 217,180 217,378 279,634 340,977 97,680 112,011 120,833 142,142 162,892 173,623 172,598 199,868 219,342
-16,535 -20,688 -30,049 -40,424 -39,054 -105,032 -55,814 -69,776 -72,041 16,385 15,813 3,629 32,457 50,213 -3,133 13,551 36,508 51,102 32,920 36,501 33,678 72,881 89,267 101,899 69,365 106,284 123,143
-126,416 -205,124 -249,088 -363,801 -410,400 -708,682 -369,740 -535,360 -1,024,306
119,791 139,710 183,842 208,385 255,684 288,639 345,498 413,885 513,216
116,350 136,672 174,542 197,861 245,006 277,711 336,578 407,967 506,630 136,475 158,291 197,968 224,678 276,814 316,091 382,818 465,166 569,103 20,125 21,619 23,426 26,817 31,808 38,380 46,240 57,199 62,473
3,441 3,038 9,300 10,524 10,677 10,928 8,920 5,918 6,587
-6,625 -65,414 -65,246 -155,416 -154,717 -420,042 -24,242 -121,475 -511,090
69,723 60,539 123,865 190,769 230,978 193,714 299,381 322,035 458,639
7,146 4,974 25,108 30,292 29,669 31,456 26,832 18,521 18,126
7,146 4,974 25,108 30,292 29,669 31,456 26,832 18,521 18,126 7,768 5,643 25,863 31,171 30,735 32,774 28,465 20,599 20,382 622 669 755 879 1,066 1,319 1,633 2,078 2,256
62,577 55,565 98,757 160,477 201,309 162,258 272,550 303,515 440,513
69,721 69,805 80,391 95,089 140,054 109,174 149,772 268,228 364,307 19,450 22,826 23,505 46,985 60,768 74,837 44,112 49,008 99,265 16,557 21,948 23,505 46,985 60,768 74,837 44,112 49,008 99,265 2,893 878 – – – – – – – -3,201 2,270 1,054 -3,590 3,314 7,768 9,105 17,569 19,489 9,738 17,503 19,739 14,469 22,033 28,693 44,795 65,934 34,376 12,939 15,233 18,685 18,058 18,719 20,925 35,691 48,365 14,887 53,472 44,709 55,832 51,694 75,971 26,568 96,555 201,650 245,553 88,106 78,299 75,309 97,690 144,146 114,658 204,435 276,582 333,307 34,634 33,590 19,477 45,996 68,175 88,090 107,880 74,932 87,754 2,086 3,623 7,743 2,311 53,861 47,052 182,911 -82,412 -20,073 209 1,109 6,103 5,377 11,249 6,460 -785 -26,010 -18,979 1,877 2,514 1,640 -3,066 1,868 63,987 26,108 -116,655 -26,887 – – – – 40,744 -23,395 157,588 60,252 25,794 -9,231 -17,863 10,623 63,076 7,394 6,031 -60,134 117,699 96,279 -9,090 -45,367 -19,669 23,789 -31,352 17,889 -51,298 33,343 14,724 -141 27,504 30,292 39,287 38,746 -11,858 -8,836 84,356 81,555
– – – – – – 58,353 – –
-14,487 -2,599 -10,494 -1,830 -16,259 80,534 40,082 -112,586 -53,399
48,610 -7,474 48,125 33,523 60,002 -145,795 315,221 87,974 -105,850
-48,610 7,474 -48,125 -33,523 -60,002 145,795 -315,221 -87,974 105,850
96.52 101.19 100.50 103.96 110.62 108.33 114.94 113.06 110.57
-8.4 -10.9 -10.3 -11.9 -11.3 -14.7 -7.4 -9.7 -16.4 -0.4 -3.1 -2.7 -5.3 -4.3 -9.5 -0.5 -2.2 -7.8 -0.6 -3.3 -3.0 -5.7 -4.6 9.8 -0.7 -2.3 -7.9
(a) ThispresentationconformsasfaraspossibletotheBalanceofPaymentsManual,5thEdition(1993) oftheInternationalMonetaryFund(IMF).Inaddition,beginning1994,OffshoreBankingUnitshavebeentreatedasapartofthedomesticbankingsystem.
(b) Commercial Bank liabilities include US dollars 973 million inflows in the form of long-term foreignborrowingsin2012.
(c) GeneralandspecialallocationsofSpecialDrawingsRights(SDRs)bytheIMF.
(d) BasedonGDPatcurrentmarketpricespublishedbytheDepartmentofCensusandStatistics.
Sources:BoardofInvestmentofSriLanka ColomboStockExchange DepartmentofCensusandStatistics ExternalResourcesDepartment SriLankaCustoms CentralBankofSriLanka

EXTERNAL TRADE AND FINANCE91
Balance of Payments(a) 2003 – 2011
Table 8.11(B)
Item 2003 2004 2005 2006 2007 2008 2009 2010 2011
USdollarsMillion
Trade Balance Exports Imports
Services (net) Receipts Payments
Income (net) Receipts Payments
Goods, Services and Income (net)
Current Transfers (net)
PrivateTransfers(net) Receipts Payments
OfficialTransfers(net)
Current Account Balance
Capital and Financial Account (net)
Capital Account (net)
Capital Transfers (net) Receipts Payments
Financial Account
Long-term(net) DirectInvestment ForeignDirectInvestment(net) PrivatisationProceeds PrivateLong-term(net) Inflows Outflows GovernmentLong-term(net) Inflows Outflows Short-term(net) PortfolioInvestment(net) PrivateShort-term(net) GovernmentShort-term(net) CommercialBank(net) CommercialBankAssets(net) CommercialBankLiabilities(net)(b)
Allocations of SDRs(c)
Errors and Omissions
Overall Balance
Monetary Movements
Average Exchange Rate Rs./US $
Ratio to GDP in percentages(d)
TradeAccount CurrentAccount CurrentAccountwithoutGrants
-1,539 -2,243 -2,516 -3,370 -3,656 -5,981 -3,122 -4,825 -9,710 5,133 5,757 6,347 6,883 7,640 8,111 7,085 8,626 10,559 6,672 8,000 8,863 10,253 11,296 14,091 10,207 13,451 20,269
399 419 338 257 302 401 391 707 1,099 1,411 1,527 1,540 1,625 1,775 2,004 1,892 2,474 3,084 1,012 1,108 1,202 1,368 1,472 1,603 1,501 1,768 1,985
-172 -204 -299 -389 -358 -972 -488 -617 -647 170 157 35 311 449 -32 116 323 467 341 360 335 700 807 940 603 940 1,114
-1,312 -2,028 -2,478 -3,502 -3,712 -6,552 -3,219 -4,735 -9,258
1,241 1,380 1,828 2,004 2,311 2,666 3,005 3,660 4,643
1,205 1,350 1,736 1,904 2,214 2,565 2,927 3,608 4,583 1,414 1,564 1,968 2,161 2,502 2,918 3,330 4,116 5,145 209 214 233 257 288 353 403 508 562
36 30 93 101 97 101 77 52 60
-71 -648 -650 -1,499 -1,402 -3,886 -214 -1,075 -4,615
722 631 1,224 1,808 2,097 1,774 2,594 2,877 4,262
74 64 250 291 269 291 233 164 164
74 64 250 291 269 291 233 164 164 81 71 257 299 278 303 247 182 185 6 7 7 8 10 12 14 19 20
648 567 974 1,517 1,828 1,483 2,361 2,713 4,098
722 680 798 907 1,251 1,016 1,304 2,379 3,308 201 227 234 451 548 691 384 435 896 171 217 234 451 548 691 384 435 896 30 10 – – – – – – – -33 14 11 -35 31 74 79 149 175 101 169 197 139 199 265 390 580 310 134 155 186 174 168 191 311 431 135 554 439 553 491 672 252 840 1,796 2,237 913 771 747 932 1,290 1,059 1,780 2,460 3,026 359 331 194 441 618 807 940 665 789 21 39 77 21 493 441 1,590 -730 -181 2 11 60 51 101 60 -6 -230 -171 19 28 16 -30 20 594 228 -1,032 -243 – – – – 372 -213 1,369 531 233 96 -152 100 590 83 26 -533 1,064 971 -94 -354 -223 297 -281 210 -435 249 183 -2 202 323 293 364 -185 -98 815 788
– – – – – – 508 – –
-148 -189 -72 -105 -165 728 346 -881 -708
502 -205 501 204 531 -1,385 2,725 921 -1,061
-502 205 -501 -204 -531 1,385 -2,725 -921 1,061
96.52 101.19 100.50 103.96 110.62 108.33 114.94 113.06 110.57
-8.4 -10.9 -10.3 -11.9 -11.3 -14.7 -7.4 -9.7 -16.4 -0.4 -3.1 -2.7 -5.3 -4.3 -9.5 -0.5 -2.2 -7.8 -0.6 -3.3 -3.0 -5.7 -4.6 -9.8 -0.7 -2.3 -7.9
(a) ThispresentationconformsasfaraspossibletotheBalanceofPaymentsManual,5thEdition(1993)oftheInternationalMonetaryFund(IMF).Inaddition,beginning1994,OffshoreBankingUnitshavebeentreatedasapartofthedomesticbankingsystem.
(b) Commercial Bank liabilities include US dollars 973 million inflows in the form of long-term foreignborrowingsin2012.
(c) GeneralandspecialallocationsofSpecialDrawingsRights(SDRs)bytheIMF.
(d) BasedonGDPatcurrentmarketpricespublishedbytheDepartmentofCensusandStatistics.
Sources:BoardofInvestmentofSriLanka ColomboStockExchange DepartmentofCensusandStatistics ExternalResourcesDepartment SriLankaCustoms CentralBankofSriLanka

EXTERNAL TRADE AND FINANCE92
Balance of Payments(a)
Table 8.11(C)
ItemRs.Million USdollarsMillion
2014 2015 2016(b) 2017(c) 2014 2015 2016(b) 2017(c)
Current Account
Trade Balance
Exports Imports
Services (net)
Receipts Payments
Primary Income (net)
Receipts Payments
Secondary Income (net)
PrivateTransfers(net) Receipts Payments
OfficialTransfers(net)
Capital Account (net)
Current Account + Capital Account
Financial Account
Net Acquisition of Assets
DirectInvestment
PortfolioInvestment DebtSecurities
OtherInvestment CurrencyandDeposits TradeCreditandAdvances OtherAccountsReceivable
ReserveAssets
Net Incurrence of Liabilities
DirectInvestment
PortfolioInvestment EquityandInvestmentFundShares DebtSecurities
OtherInvestment CurrencyandDeposits Loans TradeCreditandAdvances OtherAccountsPayable
ErrorsandOmissions
Overall balance
-259,436 -257,524 -254,159 -350,695 -1,988 -1,883 -1,742 -2,309
-1,081,987 -1,141,035 -1,293,627 -1,466,133 -8,287 -8,388 -8,873 -9,619
1,453,176 1,431,431 1,500,766 1,732,440 11,130 10,546 10,310 11,360 2,535,163 2,572,467 2,794,393 3,198,572 19,417 18,935 19,183 20,980
245,496 316,170 419,338 508,790 1,880 2,325 2,879 3,338
731,863 869,634 1,039,283 1,182,738 5,605 6,397 7,138 7,760 486,367 553,464 619,945 673,949 3,725 4,072 4,259 4,421
-235,000 -274,740 -319,652 -357,668 -1,808 -2,013 -2,202 -2,355
20,263 17,253 18,499 24,414 155 127 127 160 255,263 291,994 338,151 382,082 1,963 2,140 2,329 2,515
813,128 842,082 939,782 964,316 6,227 6,193 6,453 6,327
809,437 838,471 936,990 962,682 6,199 6,167 6,434 6,316 916,344 948,957 1,054,489 1,091,972 7,018 6,980 7,242 7,164 106,906 110,486 117,498 129,291 819 814 807 848
3,691 3,610 2,792 1,634 28 27 19 11
7,684 6,256 3,745 1,667 58 46 25 11
-250,679 -251,268 -250,414 -349,028 -1,929 -1,836 -1,717 -2,298
-200,261 -346,198 -317,181 -336,145 -1,536 -2,312 -2,182 -2,184
338,335 121,053 7,128 448,927 2,588 911 31 2,944
8,725 7,199 34,476 8,162 67 53 237 72
-29 3 -1 -12 … … ... … -29 3 -1 -12 … … ... …
127,197 70,962 38,245 16,297 973 503 266 102 36,115 21,127 538 12,094 276 143 5 78 50,000 15,807 -17,114 8,322 383 116 -118 54 41,082 34,028 54,821 -4,119 314 244 379 -31
202,442 42,890 -65,593 424,480 1,548 354 -472 2,771
538,595 467,252 324,309 785,072 4,124 3,223 2,213 5,128
116,721 93,528 131,839 210,361 894 680 897 1,375
269,768 101,935 144,665 271,168 2,065 686 993 1,772 23,275 -8,185 3,684 54,606 178 -60 24 359 246,492 110,121 140,981 216,562 1,887 747 969 1,413
152,107 271,788 47,806 303,543 1,165 1,857 323 1,981 -38,152 209,324 -87,671 -33,698 -292 1,457 -609 -228 223,475 105,244 114,419 280,407 1,713 759 793 1,839 -53,145 -54,437 12,466 47,019 -407 -401 84 309 19,929 11,657 8,592 9,815 151 41 55 61 51,492 -94,930 -66,767 12,883 393 -476 -465 114
180,904 -129,654 -46,013 330,004 1,369 -1,489 -500 2,068
(a)TheclassificationusedinthistablefollowstheBalanceofPaymentsManual6thedition(2009)oftheIMF.
(b)Revised
(c)Provisional
…–Negligible
Source:CentralBankofSriLanka

EXTERNAL TRADE AND FINANCE93
Source:CentralBankofSriLanka
Workers’ Remittances 2008 – 2017
Table 8.12
MiddleEastEuropeanUnionFarEastAsiaEuropeOtherNorthAmericaSouthEastAsiaAustraliaandNewZealandSouthAsiaSouthandCentralAmericaOther
Total
MiddleEastEuropeanUnionFarEastAsiaEuropeOtherNorthAmericaSouthEastAsiaAustraliaandNewZealandSouthAsiaSouthandCentralAmericaOther
Total
MiddleEastEuropeanUnionFarEastAsiaEuropeOtherNorthAmericaSouthEastAsiaAustraliaandNewZealandSouthAsiaSouthandCentralAmericaOther
Total
Region 2008 2009 2010 2011 2012 2013 2014 2015 2016 2017(a)
Rs. Million
189,039 229,298 279,688 335,201 428,593 460,195 509,487 512,437 566,260 565,642 56,901 69,287 81,905 97,886 136,752 149,812 165,858 166,068 186,645 199,831 18,967 23,351 27,922 44,390 64,938 72,009 79,722 94,896 107,558 125,577 13,909 17,035 20,011 25,610 35,143 39,729 43,984 41,754 48,506 50,231 12,329 14,546 15,823 17,073 22,155 24,003 26,574 28,469 30,580 31,667 9,800 11,484 16,288 22,764 33,615 37,246 41,235 53,142 57,997 60,058 6,006 6,508 9,307 11,382 16,808 19,037 21,076 21,826 25,308 26,207 3,477 4,594 6,515 5,691 11,460 10,760 11,912 13,285 15,817 16,380 2,529 3,254 3,956 4,553 6,112 7,449 8,247 8,541 7,381 7,644 3,161 3,445 3,956 4,553 8,404 7,449 8,247 8,541 8,436 8,736
316,118 382,801 465,372 569,103 763,980 827,689 916,344 948,957 1,054,489 1,091,972
US Dollars Million
1,745 1,995 2,474 3,030 3,358 3,562 3,902 3,769 3,889 3,711 525 603 724 885 1,071 1,160 1,270 1,222 1,282 1,311 175 203 247 401 509 557 611 698 739 824 128 148 177 232 275 308 337 307 333 330 114 127 140 154 174 186 204 209 210 208 90 100 144 206 263 288 316 391 398 394 55 57 82 103 132 147 161 161 174 172 32 40 58 51 90 83 91 98 109 107 23 28 35 41 48 58 63 63 51 50 29 30 35 41 66 58 63 63 58 57
2,918 3,330 4,116 5,145 5,985 6,407 7,018 6,980 7,242 7,164
Share (%)
59.8 59.9 60.1 58.9 56.1 55.6 55.6 54.0 53.7 51.8 18.0 18.1 17.6 17.2 17.9 18.1 18.1 17.5 17.7 18.3 6.0 6.1 6.0 7.8 8.5 8.7 8.7 10.0 10.2 11.5 4.4 4.4 4.3 4.5 4.6 4.8 4.8 4.4 4.6 4.6 3.9 3.8 3.4 3.0 2.9 2.9 2.9 3.0 2.9 2.9 3.1 3.0 3.5 4.0 4.4 4.5 4.5 5.6 5.5 5.5 1.9 1.7 2.0 2.0 2.2 2.3 2.3 2.3 2.4 2.4 1.1 1.2 1.4 1.0 1.5 1.3 1.3 1.4 1.5 1.5 0.8 0.9 0.9 0.8 0.8 0.9 0.9 0.9 0.7 0.7 1.0 0.9 0.9 0.8 1.1 0.9 0.9 0.9 0.8 0.8
100.0 100.0 100.0 100.0 100.0 100.0 100.0 100.0 100.0 100.0
(a)Provisional

EXTERNAL TRADE AND FINANCE94
Tourism 2008 – 2017
Table 8.13
Item 2008 2009 2010 2011 2012 2013 2014 2015 2016 2017(a)
438,475 447,890 654,476 855,975 1,005,605 1,274,593 1,527,153 1,798,380 2,050,832 2,116,407
196,627 196,433 292,378 364,459 445,464 546,732 633,160 700,900 804,504 842,868 173,042 174,534 244,124 333,841 380,289 509,653 650,810 822,272 938,697 962,395 24,311 24,948 40,216 49,057 59,236 65,616 72,653 84,943 98,376 104,375 21,839 26,068 37,290 46,467 57,776 60,836 65,252 71,672 83,851 92,003 16,776 23,741 37,540 57,501 56,169 80,509 88,991 101,066 107,635 95,581 2,141 1,549 2,308 3,614 5,045 8,081 12,163 12,899 12,144 12,703 3,739 617 620 1,036 1,626 3,166 4,124 4,628 5,625 6,482
321,079 358,188 516,538 687,830 748,436 915,208 1,037,644 1,198,240 1,710,027 1,776,503 37,261 38,473 83,270 68,436 90,040 67,946 20,270 23,323 37,121 60,940 80,135 51,229 54,668 99,709 167,129 291,439 469,239 576,817 303,684 278,964
87,695 89,526 112,497 119,875 126,523 140,009 138,097 195,134 116,544 131,409
13,429 5,469 14,675 15,122 18,681 17,387 5,965 4,068 13,144 n.a. 834 871 783 906 1,199 967 1,599 1,763 1,940 2,094
256 242 253 252 269 279 334(b) 354 382 401 14,793 14,461 14,714 14,653 15,510 16,223 18,510(b) 19,376(b) 22,126(b) 23,477 28,698 28,344 28,978 28,844 30,880 32,284 36,883(b) 38,370(b) 46,114(b) 48,008
578 629 530 654 930 688 1,265(b) 1,409 1,558 1,693 5,319 5,946 5,895 6,141 8,207 7,373 9,916(b) 10,702 11,535 12,509 9,712 11,654 11,210 11,601 13,347 14,450 18,340(b) 20,211 21,570 23,469
43.9 48.4 70.1 77.1 71.2 71.7 74.3 74.5 74.8 73.3
123,134 124,970 132,055 138,685 162,869 270,150 299,890 319,436 335,659 359,215
51,306 52,071 55,023 57,786 67,862 112,550 129,790 135,930 146,115 156,369 71,828 72,899 77,032 80,899 95,007 157,600 170,100 183,506 189,544 202,846
37,094 40,133 65,018 91,926 132,427 221,720 317,479 405,492 512,373(b) 598,143 342 350 576 830 1,039 1,715 2,431 2,981 3,518(b) 3,925
Total Tourist Arrivals
Tourist Arrivals by Region
Europe Asia NorthAmerica Australasia MiddleEast Africa LatinAmerica&Caribbeans
Tourist Arrivals by Purpose of Visits
Pleasure Business Other
Excursionist Arrivals
Total Charter Carrier Arrivals
Establishments Providing Accommodation
GradedEstablishments Rooms Beds
SupplementaryEstablishments Rooms Beds
Annual Room Occupancy Rate, % Employment in Tourist Industry
DirectEmployment EstimatedIndirectEmployment Gross Tourist Receipts
Rs.Mn. US$Mn.
(a)Provisional
(b)Revised
n.a.–Notavailable
Note: Theterm“tourist”isusedtodescribevisitorswhospendonenightormoreinthecountry.
Theterm“excursionist”identifiesthosewhodonotmakeanovernightstaybutspendseveralhoursinthecountry.
Sources:SriLankaTourismDevelopmentAuthority
CentralBankofSriLanka

EXTERNAL TRADE AND FINANCE95
External Debt and Debt Service Payments 2008 – 2017
Table 8.14
Category 2008 2009 2010 2011 2012 2013 2014 2015 2016(a) 2017(b)
Rs.Million
External Debt
Short-term GeneralGovernment CentralBank Deposit-TakingCorporations,
excepttheCentralBank OtherSectors
Long-term
GeneralGovernment CentralBank Deposit-TakingCorporations,
excepttheCentralBank OtherSectors DirectInvestment:
Inter-companyLending
Total Debt Outstanding %ofGDP(c)
Debt Service Payments(d)
Amortization InterestPayments
Earnings from Exports of Merchandise and Services
Receipts from Exports of Merchandise, Services Income and Current Transfers
Debt Service Ratio
DebtServiceasa%of ExportsandServices
DebtServiceasa%of MerchandiseandServices, IncomeandCurrentTransfers
Government Debt Service Payments (as a % of Total Debt Service Payments)
467,157 611,916 666,567 825,562 816,246 885,234 964,424 1,105,732 1,176,715 1,267,565 – – – 66,306 73,240 66,331 52,260 4,813 11,943 25,485 – – – 93,299 29,545 38,029 58,073 69,536 80,315 91,074 – – – 383,427 470,619 507,795 622,035 830,153 862,694 877,443 – – – 282,530 242,841 273,080 232,056 201,230 221,763 273,563
1,543,952 1,780,313 2,088,449 2,904,462 3,901,083 4,332,500 4,672,034 5,357,141 5,722,601 6,653,952
– – – 2,243,132 2,740,138 2,848,167 3,110,214 3,550,762 4,010,319 4,780,900 – – – 287,627 421,676 348,424 238,604 337,135 221,335 203,083 – – – – 154,471 375,872 443,737 488,860 453,102 454,081 – – – 239,808 359,007 485,429 535,382 576,305 614,732 655,809 – – – 133,894 225,790 274,608 323,398 379,908 423,113 560,079
2,011,109 2,392,229 2,755,017 3,730,024 4,717,329 5,217,735 5,615,759 6,438,703 6,899,316 7,921,517 45.6 49.5 37.8 50.2 54.2 53.7 54.1 55.7 56.8 59.5
277,297 230,616 208,984 199,233 334,592 522,155 474,527 648,541 648,315 694,127
228,488 189,621 138,941 121,246 222,916 385,362 323,626 487,275 472,270 481,028 48,809 40,995 70,043 77,987 111,676 136,793 150,901 161,266 176,045 213,099 1,095,679 1,031,289 1,254,021 1,508,565 1,730,467 1,949,158 2,185,039 2,301,065 2,540,049 2,915,178 1,419,565 1,436,578 1,761,613 2,135,356 2,519,483 2,796,568 3,125,336 3,270,886 3,615,829 4,033,198
25.3 22.4 16.7 13.2 19.7 26.8 21.7 28.2 25.6 23.9
19.5 16.1 11.9 9.3 13.5 18.7 15.2 19.8 18.0 17.2
81.6 74.5 65.3 82.1 81.9 59.0 59.7 59.6 42.6 53.0
(a) Revised
(b) Provisional
(c) BasedonGDPatcurrentmarketpricesinrupees,aspublishedbytheDepartmentofCensusandStatistics.
(d) Externaldebtservicepaymentswerereclassifiedfrom2008onwardstocapturedebtservicingofgovernmentsecurities
(i.e.,foreignholdingofTreasurybonds)inaccordancewiththeExternalDebtStatisticsManual(2003)oftheInternational
MonetaryFund.
Sources:ExternalResourcesDepartment
CentralBankofSriLanka

MONEY AND CAPITAL MARKETS96
Reserve Money 2008 – 2017
Table 9.1
Item 2008 2009 2010 2011 2012 2013 2014 2015 2016 2017(a)
Rs.Million
186,099 217,430 255,652 293,233 318,060 339,771 416,895 491,700 552,778 598,054
155,023 181,840 216,549 242,871 251,539 264,607 329,426 388,057 429,502 439,396
31,076 35,590 39,104 50,362 66,522 75,164 87,469 103,643 123,276 158,658 82,311 86,086 104,853 146,269 166,288 148,810 161,009 181,727 303,251 341,712
15 22 6 2 14 5 7 5 118 27
268,425 303,537 360,511 439,504 484,362 488,586 577,912 673,432 856,147 939,793
148,157 412,202 505,463 340,090 396,468 529,128 688,007 576,187 558,589 846,139
325,439 685,659 862,534 838,607 965,910 1,058,355 1,129,975 1,126,674 1,049,800 1,328,413
177,295 273,481 357,069 498,543 569,454 529,238 441,987 550,504 491,221 482,312
217,352 109,005 76,894 262,742 278,843 114,007 149,672 229,926 413,016 225,080
218,582 111,331 79,977 264,540 279,529 114,419 149,976 230,349 413,350 225,377
142,274 37,451 2,098 169,797 168,237 5,252 6,078 79,217 330,043 25,576
76,308 73,881 77,879 94,743 111,292 109,167 143,898 151,132 83,307 199,801
0 0 0 0 0 0 0 0 0 0
1,231 2,326 3,083 1,797 686 411 305 423 333 297
21,150 1,137 2,460 2,132 1,022 14,993 16,749 -2,811 -2,067 3,005
-118,234 -218,807 -224,306 -165,461 -191,970 -169,538 -276,516 -129,869 -113,392 -134,430
19,443 17,722 22,037 22,323 30,960 47,632 49,210 48,380 46,734 41,496
137,677 236,528 246,343 187,784 222,931 217,170 325,726 178,250 160,125 175,927 268,425 303,537 360,511 439,504 484,362 488,586 577,912 673,432 856,147 939,793
Reserve Money
CurrencyHoldings
Public CommercialBanks
CommercialBanks’Deposits withtheCentralBank
DepositsofGovt.Agencies withtheCentralBank
Total(ReserveMoney)
Factors Determining Reserve Money
NetForeignAssetsoftheCentralBank
ForeignAssets
Less:ForeignLiabilities
NetCredittoGovt.bytheCentralBank
GrossCredit
Government& Govt.GuaranteedSecurities
Advances
CashItemsinCollection
Less:Govt.Depositswith theCentralBank
CentralBankCredittoFinancialInstitutions
NetOtherAssetsoftheCentralBank
OtherAssets
Less:OtherLiabilities Total (Reserve Money)
(a)Provisional Source:CentralBankofSriLanka

MONEY AND CAPITAL MARKETS97
Money Supply 2008 – 2017
Table 9.2
Item 2008 2009 2010 2011 2012 2013 2014 2015(a) 2016 2017(b)
Rs.Million
186,099 217,430 255,652 293,233 318,060 339,771 416,895 491,700 552,778 598,054
– – – – – – – – – – 31,076 35,590 39,104 50,362 66,522 75,164 87,469 103,643 123,276 158,658 155,023 181,840 216,549 242,871 251,539 264,607 329,426 388,057 429,502 439,396
386,520 428,429 593,437 771,688 867,583 818,293 832,129 999,640 1,015,251 1,091,379
24,527 22,722 37,690 35,488 26,084 25,165 34,745 44,605 41,995 47,140 239,693 250,837 365,104 540,364 642,989 573,157 514,655 628,103 626,134 690,336 122,300 154,870 190,643 195,836 198,510 219,971 282,729 326,931 347,123 353,903 277,323 336,710 407,192 438,707 450,049 484,578 612,155 714,988 776,624 793,299
1,004,871 1,200,045 1,405,808 1,753,896 2,143,136 2,574,215 2,848,402 3,342,224 4,046,935 4,872,014 1,245,453 1,469,459 1,684,216 2,053,032 2,479,021 2,933,275 3,263,698 3,850,929 4,628,972 5,514,762
1,282,194 1,536,755 1,813,000 2,192,603 2,593,185 3,058,793 3,460,558 4,057,212 4,823,559 5,665,313
1,522,776 1,806,169 2,091,408 2,491,740 2,929,070 3,417,853 3,875,853 4,565,917 5,405,596 6,308,062
88,760 358,554 390,284 150,916 112,395 133,808 318,203 206,923 167,111 534,863
1,582,340 1,630,858 1,920,515 2,628,418 3,176,184 3,601,713 3,923,201 4,827,980 5,849,104 6,616,026
471,839 513,843 494,804 735,562 912,850 1,109,663 1,227,794 1,387,792 1,667,525 1,801,707 217,352 109,005 76,894 262,742 278,843 114,007 149,672 229,926 413,016 225,080 254,488 404,838 417,911 472,819 634,007 995,656 1,078,123 1,157,867 1,254,509 1,576,627 15,085 73,233 91,927 71,385 91,258 164,674 197,013 261,815 308,382 342,354 1,948 1,830 1,829 2,131 2,453 1,976 1,936 1,828 1,892 2,635 1,093,468 1,041,952 1,331,955 1,819,341 2,169,624 2,325,400 2,496,458 3,176,544 3,871,305 4,469,330
1,095,416 1,043,782 1,333,784 1,821,472 2,172,076 2,327,376 2,498,394 3,178,372 3,873,197 4,471,965
-388,906 -452,658 -497,799 -586,730 -695,395 -676,729 -780,846 -977,690 -1,192,656 -1,485,576 1,282,194 1,536,755 1,813,000 2,192,603 2,593,185 3,058,793 3,460,558 4,057,212 4,823,559 5,665,313 268,425 303,537 360,511 439,504 484,362 488,586 577,912 673,432 856,147 939,793
270,541 284,673 362,717 426,005 437,590 455,925 528,688 643,308 719,173 758,358 1,212,736 1,400,494 1,662,475 2,008,806 2,398,836 2,854,327 3,247,201 3,720,369 4,397,202 5,299,757 1,465,236 1,665,465 1,920,181 2,291,879 2,752,434 3,206,259 3,630,606 4,186,260 4,942,840 5,909,735 1.03 1.11 1.13 1.00 0.93 0.99 1.06 1.06 0.91 0.84 4.78 5.06 5.03 4.99 5.35 6.26 5.99 6.02 5.63 6.03 5.67 5.95 5.80 5.67 6.05 7.00 6.71 6.78 6.31 6.71
16.30 16.99 17.68 16.95 19.96 21.04 19.60 17.02 16.56(f) 17.52 3.64 3.45 3.86 3.59 3.64 3.36 3.19 2.94 2.71(f) 2.51 3.01 2.90 3.34 3.15 3.17 2.99 2.85 2.62 2.41(f) 2.25
Monetary Aggregates
Currency
HeldbytheGovernment HeldbyCommercialBanks HeldbythePublic
DemandDeposits
HeldbytheGovernment HeldbyCommercialBanks HeldbythePublic
NarrowMoneySupply(M1)
TimeandSavingsDepositsheldbythepublic HeldinRupeeDeposits HeldinRupeeand ForeignCurrencyDeposits
BroadMoneySupply(M2)(c)
ConsolidatedBroadMoneySupply(M2b)(d)
Underlying Factors M2
NetExternalBankingAssets
DomesticCredit
NetCredittoGovernment ByCentralBank ByCommercialBanks(e)
PublicCorporations(f)
Co-operatives OtherPrivate(f)
CredittoPrivateSector(f)
Otheritems(Net)(e)
Total:BroadMoneySupply(M2)
ReserveMoney
MoneySupply(12MonthAverage) M
1 M
2 M
2b
MoneyMultiplier(g): ofM1
ofM2
ofM2b
VelocityofMoney(h)
ofM1
ofM2
ofM2b
Source:CentralBankofSriLankaNote:Monetarydatafrom1990havebeenreclassifiedtobeconsistentwiththestandardinternationalpractice.
(a) DFCCBankwhichoperatedasaLicensedSpecialisedBankwasamalgamatedwiththeDFCCVardhanaBankandoperatesasaLicensed
CommercialBanknamely,DFCCBankPLCwitheffectfrom01October2015.
(b) Provisional.
(c) TotalNarrowMoney(Currency+Demanddepositsheldbythepublic)+TimeandSavingdeposits(Rupees)heldbythepublic.
(d) TotalNarrowMoney+TimeandSavingsDeposits(Rupeeandforeigncurrencydeposits)heldbythepublicwithcommercialBanks.
(e) RestructuringbondsworthRs.19,392.6million,whichwere issuedby thegovernment to the two statebanks,havebeenconverted to
Treasurybondsupontheirmaturity inOctober2006.Thisamount,whichpreviouslyappearedunderOtherAssetshasbeen included in
TreasuryBondssinceOctober2006.
(f) Revised.
(g) RatioofMoneySupplytoReserveMoney.
(h) RatioofGDPtoMoneySupply(Average).

MONEY AND CAPITAL MARKETS98
Broad Money Supply (M2b) 2008 – 2017
Table 9.3
Item 2008 2009 2010 2011 2012 2013 2014 2015(a) 2016 2017(b)
Rs.Million
277,323 336,710 407,192 438,707 450,049 484,578 612,155 714,988 776,624 793,299
155,023 181,840 216,549 242,871 251,539 264,607 329,426 388,057 429,502 439,396 122,300 154,870 190,643 195,836 198,510 219,971 282,729 326,931(c) 347,123 353,903
1,245,453 1,469,459 1,684,216 2,053,032 2,479,021 2,933,275 3,263,698 3,850,929 4,628,972 5,514,762
1,175,802 1,395,205 1,599,421 1,971,706 2,366,037 2,809,888 3,121,032 3,674,360 4,439,938 5,298,564 69,651 74,254 84,796 81,326 112,984 123,387 142,666 176,569 189,034 216,198
1,522,776 1,806,169 2,091,408 2,491,740 2,929,070 3,417,853 3,875,853 4,565,917 5,405,596 6,308,062
77,700 401,880 377,442 98,057 -25,831 -76,325 15,126 -298,163 -231,238 121,538
148,157 412,202 505,463 340,090 396,468 529,128 688,007 576,187 558,589 846,139
-70,457 -10,323 -128,021 -242,033 -422,299 -605,453 -672,881 -874,350 -789,827 -724,601
-14,534 -6,768 -66,558 -63,757 -121,878 -231,155 -220,947 -295,864 -325,659 -290,761 -55,923 -3,555 -61,464 -178,276 -300,421 -374,299 -451,934 -578,486 -464,168 -433,840
1,445,076 1,404,288 1,713,966 2,393,683 2,954,901 3,494,178 3,860,727 4,864,081 5,636,834 6,186,524
1,897,499 1,907,748 2,262,861 3,037,970 3,696,131 4,200,783 4,640,146 5,732,034 6,671,677 7,504,715
582,907 640,326 627,185 833,610 1,045,232 1,301,342 1,435,900 1,759,492 1,972,133 2,168,517 217,352 109,005 76,894 262,742 278,843 114,007 149,672 229,926 413,016 225,080 365,556 531,321 550,291 570,868 766,389 1,187,335 1,286,228 1,529,566 1,559,116 1,943,438 254,488 404,838 417,911 472,819 634,007 995,656 1,078,123 1,157,867 1,254,509 1,576,627 111,068 126,483 132,380 98,048 132,382 191,678 208,105 371,699 304,608 366,811
46,991 73,233 144,578 198,500 292,477 365,098 450,924 530,669 513,768 536,982 15,085 73,233 91,927 71,385 91,258 164,674 197,013 261,815 308,382 342,354 31,905 0 52,651 127,115 201,219 200,424 253,911 268,853 205,386 194,628
1,267,601 1,194,189 1,491,099 2,005,860 2,358,421 2,534,343 2,753,322 3,441,874 4,185,777 4,799,215 1,095,416 1,043,782 1,333,784 1,821,472 2,172,076 2,327,376 2,498,394 3,178,372 3,873,197 4,471,965 172,185 150,406 157,315 184,388 186,345 206,967 254,928 263,502 312,579 327,250
-452,423 -503,460 -548,895 -644,287 -741,230 -706,605 -779,418 -867,954 -1,034,843 -1,318,191
-262,838 -304,379 -352,808 -494,337 -634,688 -605,221 -657,074 -718,954 -865,472 -1,079,540 -189,585 -199,080 -196,087 -149,950 -106,541 -101,384 -122,344 -149,000 -169,371 -238,651
1,522,776 1,806,169 2,091,408 2,491,740 2,929,070 3,417,853 3,875,853 4,565,917 5,405,596 6,308,062
NarrowMoneySupply(M1)
CurrencyinCirculation DemandDeposits
TimeandSavingsDeposits(TSD)
DomesticBankingUnits ForeignCurrencyBankingUnits
Broad Money Supply M2b (M1+ TSD)
NetForeignAssets
MonetaryAuthorities(d)
CommercialBanks
DomesticBankingUnits ForeignCurrencyBankingUnits
NetDomesticAssets
DomesticCredit
NetCredittotheGovernment CentralBank CommercialBanks(e)
DomesticBankingUnits ForeignCurrencyBankingUnits
CredittoPublicCorporations(c)
DomesticBankingUnits(c)
ForeignCurrencyBankingUnits
CredittoPrivateSector(c)
DomesticBankingUnits(c)
ForeignCurrencyBankingUnits
OtherItems(Net)(e)
MonetaryAuthoritiesand DomesticBankingUnits ForeignCurrencyBankingUnits
Broad Money Supply M2b
Source:CentralBankofSriLanka(a) DFCCBankwhichoperatedasaLicensedSpecialisedBankwasamalgamatedwiththeDFCCVardhanaBank
andoperatesasaLicensedCommercialBanknamely,DFCCBankPLCwitheffectfrom01October2015.
(b) Provisional.
(c) Revised.
(d) This includes NFA of the Central Bank as well as the government Crown Agent's balance reported by the
DepartmentofStateAccounts.
(e) RestructuringbondsworthRs.19,392.6million,whichwereissuedbythegovernmenttothetwostatebankshave
beenconvertedtoTreasurybondsupontheirmaturityinOctober2006.Thisamount,whichpreviouslyappeared
underOtherAssetshasbeenincludedinNetCredittoGovernmentsinceOctober2006.

MONEY AND CAPITAL MARKETS99
Interest Rates 2008 – 2017
Table 9.4
Item 2008 2009 2010 2011 2012 2013 2014 2015 2016 2017
Percentumperannum
Policy Interest Rates
StandingDepositFacilityRate(SDFR)(a)
StandingLendingFacilityRate(SLFR)(a)
CentralBankAdvanceRate(BankRate)
Inter-bankCallRates
Treasury Bill Yield Rates (Year end)
PrimaryMarket 3Months 6Months 12Months
TreasuryBonds,YieldtoMaturity 2YearBonds 3YearBonds 4YearBonds 5YearBonds 6YearBonds
SecondaryMarket 3Months 6Months 12Months
Rupee Securities Rate
Commercial Bank Deposit Rates
Savings
AWDR
FixedDeposits 3Months 6Months 12Months
AWFDR
NSB Deposit Rates
Savings
FixedDeposits 6Months 12Months
Commercial Bank Advance Rates
PrimeLendingRate LoansSecuredbyGovernmentSecurities UnsecuredLoans BillsPurchasedandDiscounted
International Interest Rates (Period Average)
LIBORonUSdollarDeposits Overnight 7-Days 1-Month 3-Months 6-Months 1-Year
LIBORon3-MonthsDeposits Euro JapaneseYen SwissFranc PoundSterling(ParisMarket)
10.50 7.50 7.25 7.00 7.50 6.50 6.50 6.00 7.00 7.25 12.00 9.75 9.00 8.50 9.50 8.50 8.00 7.50 8.50 8.75 15.00 15.00 15.00 15.00 15.00 15.00 15.00 15.00 15.00 15.00
12.50–14.50 8.63–9.40 7.75–8.15 8.75–9.10 9.50–9.85 7.50–7.75 6.00–6.50 6.40 8.40–8.44 8.10–8.25
17.33 7.73 7.24 8.68 10.00 7.54 5.74 6.45 8.72 7.69 18.57 8.73 7.35 8.71 11.32 7.85 5.84 6.83 9.63 8.30 19.12 9.33 7.55 9.31 11.69 8.29 6.01 7.30 10.17 8.90
20.53(Dec) 9.55 (Dec) 8.27(Aug) 7.77 (Feb) 13.62 (Jul) – – 6.70 (Jun) 11.04 (Jul) 9.83 (Aug)20.54(Dec) 12.83 (Jul) 8.15(Dec) 7.99 (Jan) 13.50(May) 10.87(Aug) – 8.18 (Jul) 11.62 (Jul) 9.55 (Dec)20.34(Dec) 9.78 (Dec) 8.60(Dec) 8.20 (Jul) 14.10 (Jul) – – 8.91 (Nov) 11.94(Dec) 11.14 (Jul)17.00(Sep) 10.32 (Oct) 8.76 (Sep) 8.60 (Jun) 14.15(Jun) 10.64 (Oct) 8.93 (May) 9.79 (Dec) 11.76(Aug) 10.20(Nov) – 9.92 (Oct) 8.93 (Sep) 8.85 (Oct) 14.25 (Jul) 10.97 (Feb) – 9.90 (Sep) 12.03 (Jul) –
– 7.78 7.26 8.60 10.10 7.63 5.60 6.58 8.65 7.65 18.36 8.78 7.36 8.78 11.30 8.05 5.85 6.80 9.57 8.27 19.03 9.58 7.55 9.25 11.65 8.23 5.95 7.25 10.17 8.87
– 14 – – – – – – – –
3.00–16.50 1.50–10.50 1.50–9.50 1.00–8.50 0.75–10.50 0.75–9.14 0.50–8.00 0.50–8.00 0.50–9.00 0.50–9.50
11.63 8.01 6.23 7.24 10.10 9.37 6.20 6.20 8.17 9.07
9.50–20.00 3.00–19.00 4.75– 8.50 4.75–11.25 5.00–16.25 5.70–15.00 3.50– 7.00 3.10–11.10 4.00–13.50 4.00–12.7513.00–19.00 6.00–18.00 5.00– 9.75 5.50–11.00 5.00–16.25 6.20–12.25 3.90– 8.75 3.90– 9.50 4.50–13.50 4.00–13.50 8.50–20.25 7.25–19.00(b) 5.05–17.00 5.55–11.00 5.00–17.00 6.00–16.00 3.95–12.00 3.95–15.00 4.50–15.00 4.89–15.00
16.89 10.91 8.20 8.95 13.21 11.78 7.33 7.57 10.46 11.48
5.00 5.00 5.00 5.00 5.00 5.00 5.00 5.00 4.25 4.00
15.50 8.50 7.50 7.50 13.00 9.25 6.00 7.00 10.75 10.75 15.00 9.50 8.50 8.50 12.50 9.50 6.50 7.25 11.00 11.00
19.17 11.12 9.27 10.49 14.29 9.96 6.35 7.40 11.73 11.3313.00–30.00 9.00–24.00 9.00–22.00 6.85–22.00 9.00–21.00 9.00–18.00 6.60–24.00 6.00–14.25 5.00–20.00 8.00–16.00 6.00–39.00 6.00–40.80 6.00–35.00 6.00–35.00 7.00–32.00 7.00–24.00 5.44–24.00 2.50–24.00 3.50–24.00 4.07–36.87 6.00–26.50 4.58–24.00 5.25–20.00 4.55–20.00 4.70–22.00 4.50–22.00 3.25–22.00 3.00–22.58 2.00–24.00 6.00–27.00
2.31 0.23 0.23 0.16 0.15 0.13 0.09 0.14 0.41 1.03 2.56 0.28 0.26 0.20 0.19 0.16 0.12 0.16 0.44 1.06 2.67 0.33 0.27 0.23 0.24 0.19 0.16 0.20 0.50 1.11 2.91 0.69 0.34 0.34 0.43 0.27 0.23 0.32 0.74 1.26 3.05 1.12 0.52 0.51 0.69 0.41 0.33 0.49 1.06 1.48 3.08 1.57 0.92 0.83 1.01 0.68 0.56 0.80 1.38 1.79
4.63 1.23 0.81 1.39 0.57 0.15 0.18 -0.03 -0.28 -0.37 0.92 0.48 0.23 0.19 0.19 0.16 0.13 0.09 -0.02 -0.02 2.58 0.38 0.19 0.12 0.07 0.02 0.01 -0.75 -0.75 -0.73 5.51 1.21 0.70 0.87 0.83 0.51 0.54 0.57 0.50 0.36
Sources:InternationalFinancialStatistics
FederalReserveEconomicData
CentralBankofSriLanka
Note:Domesticinterestratesrepresenttheyearendposition.
(a) The Repurchase rate and the Reverse Repurchase rate of theCentralBankwererenamedastheStandingDepositFacilityRate(SDFR) and Standing Lending Facility Rate (SLFR), respectively,w.e.f.2January2014.
(b) Revised
LIBOR:LondonInterBankOfferedRateAWDR:AverageWeightedDepositRateAWFDR:AverageWeightedFixedDepositRate

MONEY AND CAPITAL MARKETS100
Government Debt Securities Market 2008 – 2017
Table 9.5
Item 2008 2009 2010 2011 2012 2013 2014 2015 2016 2017(a)
Sources:MinistryofFinanceandMassMedia CentralBankofSriLanka
Treasury Bills
PrimaryMarket AmountIssued/Sold,Rs.Mn. PurchasedbyCentralBank Others WeightedAveragePrice,Rs.–YearEnd (PerRs.100worthTreasurybill) 3Months 6Months 12Months WeightedAverageYield,%–YearEnd 3Months 6Months 12Months WeightedAverageYield,%-Average 3Months 6Months 12Months OverallAverageCentralBankSecondaryTreasuryBillMarket Sales(Discounts),Rs.Mn. Purchases(Re-discounts),Rs.Mn.
OutstandingTreasuryBillsby Ownership,Rs.Mn.(b)
CentralBank CommercialBanks Employees’ProvidentFund OtherProvidentFunds SavingsInstitutions Insurance&FinanceCompanies Departments&OtherOfficialFunds Other ForeignInvestors(c)
Total
Treasury Bonds
PrimaryMarketIssues,Rs.Mn.YieldtoMaturity,% 2YearBonds 3YearBonds 4YearBonds 5YearBonds 6YearBonds 7YearBonds 8YearBonds 9YearBonds 10YearBonds 12YearBonds 15YearBonds 20YearBonds 30YearBondsRupeeSecurities PrimaryMarketIssues,Rs.Mn. RateofInterest,%OutstandingSecuritiesby Ownership,Rs.Mn.(b)(d)
CommercialBanks Employees’ProvidentFund OtherProvidentFunds SavingsInstitutions Insurance&FinanceCompanies Departments&OtherOfficialFunds Private&Other ForeignInvestors(c)
Total
779,576 821,211 1,000,069 1,164,570 1,649,984 1,235,304 1,121,705 1,589,527 1,635,349 1,624,266 183,727 190,326 133,823 217,584 485,332 334,764 337,659 564,159 790,738 513,092 595,849 630,885 866,246 946,986 1,164,652 900,540 784,046 1,025,368 844,611 1,111,174 95.85 98.12 98.22 97.88 97.56 98.15 98.59 98.43 97.87 97.91 91.54 95.86 96.45 95.83 94.64 96.22 97.16 96.77 95.41 95.59 83.98 91.47 92.98 91.48 89.54 92.35 94.34 93.36 90.77 91.00 17.33 7.67 7.24 8.68 10.00 7.54 5.74 6.38 8.72 7.69 18.49 8.65 7.35 8.71 11.32 7.85 5.84 6.69 9.63 8.30 19.08 9.32 7.55 9.31 11.69 8.29 6.00 7.11 10.17 8.90 18.54 11.43 7.84 7.28 10.72 8.95 6.58 6.32 8.26 9.10 18.45 12.18 8.41 7.21 12.29 9.91 6.57 6.50 9.23 9.81 18.89 12.76 8.42 7.41 12.14 10.65 6.73 6.60 10.20 10.07 18.59 12.25 8.31 7.31 11.81 10.45 6.68 6.46 9.24 9.77 26,608 70,185 13,250 – 18,448 128,750 – 127,855 39,600 110,325 8,038 – – – – – – – 15,770 –
163,584 37,451 2,993 169,797 154,005 3,053 123,496 104,754 331,389 9,908 87,869 160,081 220,358 185,756 219,748 443,951 278,296 340,664 244,139 463,198 1 420 5,969 – 33,410 13,969 1,000 – 41,057 74,475 55 – 15 1,279 122 45 – 162 77 49 20,791 42,677 52,541 58,733 61,972 68,328 47,945 67,766 18,049 38,378 10,988 7,192 12,072 11,010 19,097 28,629 47,461 47,388 57,918 58,093 16,431 21,452 20,636 5,968 2,566 8,114 10,986 7,570 7,616 760 102,882 171,757 199,858 158,344 138,149 134,048 185,582 89,937 79,336 52,293 6,358 40,410 57,317 70,123 80,184 73,916 55,500 5,045 12,816 27,552
408,958 481,441 571,759 661,008 709,254 774,053 750,267 663,285 792,396 724,706
488,737 701,438 508,576 602,951 847,899 1,017,134 860,695 869,923 663,616 548,815 18.95 16.32 9.46 7.77 11.30 – – 6.7 11.04 9.92 18.44 17.01 9.01 7.99 11.11 10.95 – 8.18 11.62 – 17.87 14.29 9.65 8.23 11.58 – – 8.91 10.61 11.13 17.00 11.20 9.31 8.55 13.32 10.95 8.93 9.79 11.76 10.20 – – 9.19 8.84 12.50 – – 9.9 12.03 11.21 – – 9.19 8.84 12.50 – – 9.65 12.18 12.92 – – 9.15 8.91 14.40 11.51 7.15 10.82 10.96 10.33 – – – 9.00 – 11.77 – – 12.08 12.91 – 13.39 9.59 9.15 14.00 11.8 9.23 10.94 11.06 10.13 – – – 9.10 – 12.09 – – 13.72 – – – – 9.30 – 12.17 8.63 11.00 14.23 – – – – – 11.00 12.19 11.32 11.45 – – – – – – – 12.18 11.75 11.73 12.09 – – 1,904 – – – – – – – – – 14.00 – – – – – – – – 90,082 188,576 162,215 206,547 244,770 386,398 595,067 517,613 731,942 803,455 607,770 718,717 814,451 927,374 1,117,360 1,356,389 1,450,144 1,612,461 1,737,219 1,855,665 9,507 13,766 19,872 7,550 30,639 35,031 315 42,713 48,060 – 164,457 195,588 221,805 246,418 261,309 285,915 327,932 358,470 406,722 407,415 26,410 33,194 33,624 34,410 31,711 26,636 42,742 58,808 68,124 68,305 90,778 21,949 36,963 37,006 37,596 187,904 210,598 245,045 264,014 285,278 292,975 341,722 354,957 359,946 371,669 174,087 217,255 470,138 458,707 402,501 17,647 145,124 183,538 199,531 317,604 403,486 401,710 298,734 247,222 295,059
1,299,625 1,658,636 1,827,425 2,018,782 2,412,657 2,855,846 3,245,764 3,603,982 3,962,009 4,117,679
(a) Provisional(b) Adjustedforsecondarymarkettransactions.(c) IncludesrupeedenominatedTreasurybillsandTreasurybondsheldbyforeigninvestors.(d) ExcludesTreasurybondsofRs.4,397millionissuedtoCWEinNovember2003(maturedin14November2016)and
Rs.78,441millionissuedtoCPCinJanuary2012(ofwhichRs.21,779millionmaturedin01January2017andthecurrentoutstandingisRs.56,662million)andRs.13,125millionissuedtocapitalizeSriLankanAirlinesinMarch2013.
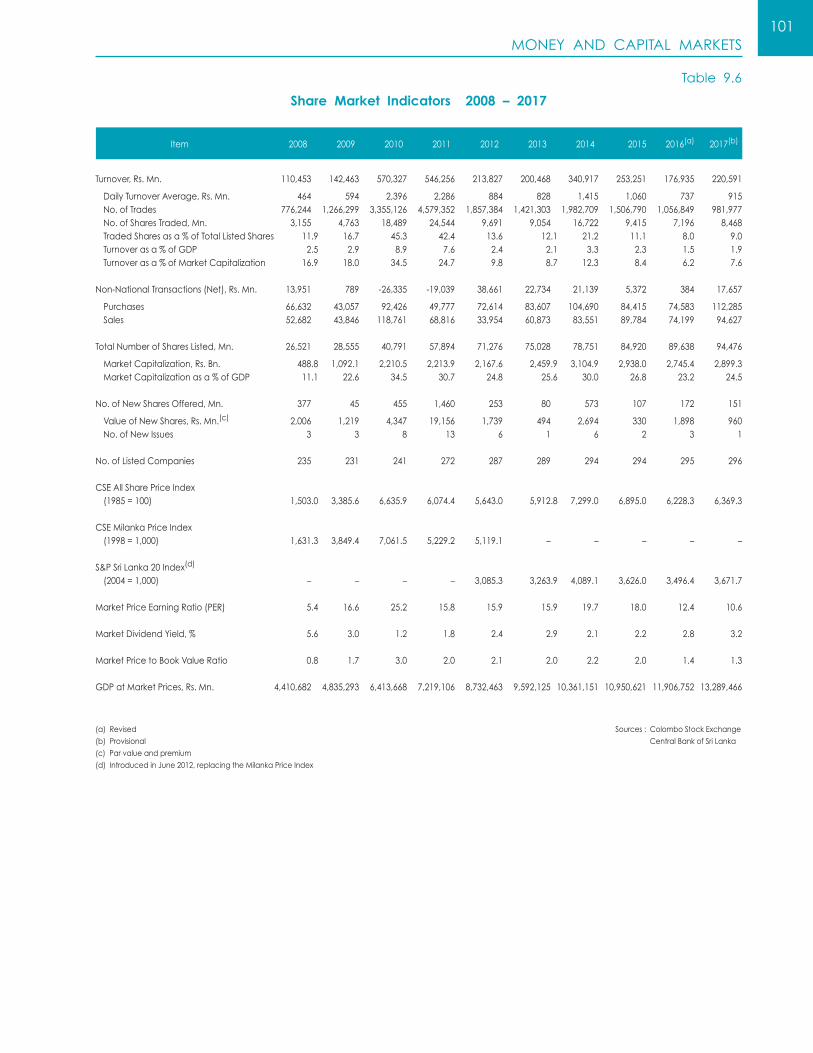
MONEY AND CAPITAL MARKETS101
Share Market Indicators 2008 – 2017
Table 9.6
Item 2008 2009 2010 2011 2012 2013 2014 2015 2016(a) 2017(b)
110,453 142,463 570,327 546,256 213,827 200,468 340,917 253,251 176,935 220,591
464 594 2,396 2,286 884 828 1,415 1,060 737 915 776,244 1,266,299 3,355,126 4,579,352 1,857,384 1,421,303 1,982,709 1,506,790 1,056,849 981,977 3,155 4,763 18,489 24,544 9,691 9,054 16,722 9,415 7,196 8,468 11.9 16.7 45.3 42.4 13.6 12.1 21.2 11.1 8.0 9.0 2.5 2.9 8.9 7.6 2.4 2.1 3.3 2.3 1.5 1.9 16.9 18.0 34.5 24.7 9.8 8.7 12.3 8.4 6.2 7.6 13,951 789 -26,335 -19,039 38,661 22,734 21,139 5,372 384 17,657
66,632 43,057 92,426 49,777 72,614 83,607 104,690 84,415 74,583 112,285 52,682 43,846 118,761 68,816 33,954 60,873 83,551 89,784 74,199 94,627 26,521 28,555 40,791 57,894 71,276 75,028 78,751 84,920 89,638 94,476
488.8 1,092.1 2,210.5 2,213.9 2,167.6 2,459.9 3,104.9 2,938.0 2,745.4 2,899.3 11.1 22.6 34.5 30.7 24.8 25.6 30.0 26.8 23.2 24.5 377 45 455 1,460 253 80 573 107 172 151
2,006 1,219 4,347 19,156 1,739 494 2,694 330 1,898 960 3 3 8 13 6 1 6 2 3 1
235 231 241 272 287 289 294 294 295 296 1,503.0 3,385.6 6,635.9 6,074.4 5,643.0 5,912.8 7,299.0 6,895.0 6,228.3 6,369.3 1,631.3 3,849.4 7,061.5 5,229.2 5,119.1 – – – – – – – – – 3,085.3 3,263.9 4,089.1 3,626.0 3,496.4 3,671.7 5.4 16.6 25.2 15.8 15.9 15.9 19.7 18.0 12.4 10.6 5.6 3.0 1.2 1.8 2.4 2.9 2.1 2.2 2.8 3.2 0.8 1.7 3.0 2.0 2.1 2.0 2.2 2.0 1.4 1.3 4,410,682 4,835,293 6,413,668 7,219,106 8,732,463 9,592,125 10,361,151 10,950,621 11,906,752 13,289,466
Turnover,Rs.Mn.
DailyTurnoverAverage,Rs.Mn. No.ofTrades No.ofSharesTraded,Mn. TradedSharesasa%ofTotalListedShares Turnoverasa%ofGDP Turnoverasa%ofMarketCapitalization
Non-NationalTransactions(Net),Rs.Mn.
Purchases Sales
TotalNumberofSharesListed,Mn.
MarketCapitalization,Rs.Bn. MarketCapitalizationasa%ofGDP
No.ofNewSharesOffered,Mn.
ValueofNewShares,Rs.Mn.(c)
No.ofNewIssues
No.ofListedCompanies
CSEAllSharePriceIndex (1985=100)
CSEMilankaPriceIndex (1998=1,000)
S&PSriLanka20Index(d)
(2004=1,000)
MarketPriceEarningRatio(PER)
MarketDividendYield,%
MarketPricetoBookValueRatio
GDPatMarketPrices,Rs.Mn.
(a)Revised
(b)Provisional
(c)Parvalueandpremium
(d)IntroducedinJune2012,replacingtheMilankaPriceIndex
Sources: ColomboStockExchange
CentralBankofSriLanka

MONEY AND CAPITAL MARKETS102
Share Trading Indicators by Business Sector 2016 – 2017
Table 9.7
Note:Theabovesharevolumeandturnoverfiguresrepresentonlyordinaryvotingshares.
Shares Traded, ’000
2016 1stQuarter 419,986.5 70,577.4 27,521.0 41,606.3 520,815.3 8,229.3 363,129.5 120,082.6 16,589.4 44,850.1 35,056.7 228,198.8 611.1 177.2 6,358.6 73,170.7 9,369.3 209.1 101,104.6 30,442.4 2ndQuarter 487,520.7 57,087.5 4,880.6 47,165.6 265,450.5 20,642.9 98,319.4 104,441.3 10,206.4 3,297.0 16,593.6 235,261.1 934.8 200.3 4,388.9 42,290.7 11,508.1 16.9 73,135.3 133,135.5 3rdQuarter 654,195.6 67,282.7 8,390.9 54,493.5 479,171.5 8,688.6 24,401.2 165,869.6 11,087.6 8,512.6 43,677.8 430,663.9 1,078.8 37.8 20,291.6 140,597.6 9,608.0 64.6 122,423.0 35,155.8 4thQuarter 398,732.7 36,746.3 3,851.2 36,978.4 227,864.8 5,458.1 11,680.5 61,050.2 6,260.5 1,150.2 15,422.5 117,156.6 673.4 16.5 9,788.3 107,398.5 2,838.8 23.5 120,297.9 12,160.6 2017 1stQuarter 271,207.8 53,219.3 8,870.0 35,253.2 548,478.9 7,069.8 38,042.3 80,667.0 8,718.8 5,023.6 325,826.5 131,840.4 403.5 29.5 31,077.1 79,104.2 2,491.6 34.6 109,756.4 31,971.4 2ndQuarter 633,589.5 33,026.2 16,441.2 35,372.6 1,030,778.4 13,196.3 17,776.0 113,469.2 15,251.5 17,462.1 24,861.6 238,233.1 1,836.4 73.0 30,313.8 224,480.9 11,765.5 28.2 123,953.7 51,799.6 3rdQuarter 646,269.5 48,770.7 14,580.1 84,777.3 700,055.9 9,944.4 9,644.5 61,913.0 17,454.3 23,484.1 26,099.9 158,286.9 809.3 50.4 103,331.3 34,565.6 43,795.0 48.9 69,872.3 341,120.5 4thQuarter 544,134.2 41,886.1 14,523.5 75,429.3 220,453.1 4,660.6 35,494.1 77,461.2 13,739.1 4,304.2 112,258.4 137,204.3 33,219.9 347.7 74,032.7 37,969.5 31,249.8 22.1 180,026.8 32,188.3 Turnover, Rs. ’000
2016 1stQuarter 11,987,346.9 3,765,976.7 364,707.0 912,540.5 12,670,583.6 160,368.9 1,723,621.9 1,897,262.3 316,230.8 11,698.8 792,860.5 6,559,006.4 245,237.3 63,054.5 110,356.5 1,036,564.8 32,605.1 40,284.6 1,096,302.3 1,068,713.3 2ndQuarter 14,673,228.8 4,432,632.9 149,161.4 1,171,592.2 8,240,928.5 427,891.6 2,194,819.8 843,194.3 333,099.4 33,147.8 378,354.8 7,012,573.3 260,903.1 64,023.9 63,166.4 589,435.3 42,148.7 9,993.5 833,151.2 769,046.1 3rdQuarter 13,509,406.6 5,885,479.2 205,421.6 1,437,527.7 8,313,439.9 174,332.8 330,862.0 1,291,269.1 250,544.9 74,060.0 831,587.2 11,382,936.9 108,605.4 12,935.1 375,859.0 1,817,207.9 83,702.0 43,104.2 1,367,044.3 511,497.0 4thQuarter 21,029,583.9 2,673,186.8 133,054.3 784,981.6 9,015,488.2 95,324.3 159,084.4 427,663.1 146,382.4 9,005.6 333,759.2 4,441,496.9 69,171.8 7,026.3 152,893.3 600,360.4 10,717.1 13,031.7 1,307,228.4 141,369.1 2017 1stQuarter 7,774,543.1 4,394,274.2 81,482.4 915,251.5 19,725,992.9 119,021.3 968,803.7 1,059,296.2 210,316.5 4,978.6 223,200.8 6,098,163.3 41,367.5 9,496.6 504,969.0 507,010.7 10,659.5 9,492.1 1,240,042.1 1,662,538.8 2ndQuarter 19,876,728.1 5,473,135.4 100,054.8 932,502.5 23,861,142.2 227,733.2 324,233.6 739,652.1 389,473.1 10,225.1 362,884.0 8,886,474.3 154,906.2 20,363.3 534,854.7 1,083,300.9 92,785.4 20,476.0 1,488,681.1 390,724.7 3rdQuarter 11,923,642.1 3,191,948.5 196,729.1 1,497,475.3 15,329,227.8 171,399.6 159,162.2 268,875.3 419,544.6 34,558.0 466,463.5 6,295,778.2 74,540.2 12,230.5 1,622,534.5 477,159.2 199,343.7 38,614.1 835,140.811,828,161.4 4thQuarter 22,686,174.2 5,153,352.0 84,594.8 1,096,860.5 11,637,466.9 73,935.0 387,490.3 501,878.8 469,565.1 18,536.1 1,379,738.6 4,259,045.2 2,615,284.8 88,223.9 1,479,306.4 403,783.8 141,690.9 14,500.4 2,381,138.6 144,911.1 No. of Trades
2016 1stQuarter 65,771 14,770 2,857 10,232 28,898 3,480 3,810 10,995 5,449 895 5,491 54,942 2,322 671 4,286 11,129 2,050 629 2,539 4,526 2ndQuarter 77,256 20,107 1,744 14,593 31,811 4,660 7,329 24,513 7,926 1,473 7,291 66,551 2,114 769 4,728 11,610 1,722 537 2,618 8,563 3rdQuarter 86,197 19,249 2,206 13,885 59,158 2,903 3,852 19,983 5,971 3,198 9,323 87,332 1,958 624 4,730 15,673 2,350 955 2,489 6,508 4thQuarter 55,947 9,623 1,503 7,904 18,514 2,738 2,252 15,285 3,566 815 5,051 32,937 1,136 591 3,542 7,136 994 464 2,013 2,637 2017 1stQuarter 48,699 8,367 1,356 5,372 23,089 3,490 2,385 11,259 3,133 576 5,677 30,743 1,464 446 4,546 6,260 803 520 1,968 3,152 2ndQuarter 75,613 15,634 2,884 7,627 40,260 5,925 2,473 23,575 6,720 1,393 10,173 53,684 2,079 436 16,920 9,347 9,538 711 2,610 7,209 3rdQuarter 60,529 11,494 2,531 15,714 36,670 2,687 2,234 14,678 7,031 2,415 8,246 42,306 1,779 615 34,730 7,998 9,438 730 1,977 5,146 4thQuarter 69,298 13,783 2,243 16,892 22,047 1,674 2,196 12,448 4,798 1,402 8,286 39,651 1,484 649 35,167 7,562 7,289 370 2,311 5,363 Market Capitalization, Rs. Bn.
2016 1stQuarter 618.3 521.0 18.6 34.4 429.4 11.8 52.5 319.4 24.6 1.0 47.0 148.6 23.0 80.8 22.2 43.7 6.0 6.6 153.1 24.3 2ndQuarter 632.6 562.1 19.1 35.1 435.3 11.9 61.5 328.1 27.3 1.1 48.0 159.8 23.6 75.5 22.8 44.7 5.8 6.6 152.9 23.8 3rdQuarter 680.8 536.5 19.0 41.8 470.4 12.2 66.6 331.4 27.2 1.1 47.7 183.4 23.5 71.8 21.9 45.7 5.7 7.2 164.1 27.7 4thQuarter 653.9 533.9 17.2 37.6 514.1 12.0 59.6 321.2 24.0 0.9 51.3 170.4 21.6 75.1 22.0 42.5 5.2 6.7 150.5 25.7 2017 1stQuarter 613.3 552.9 15.9 35.3 505.5 11.5 57.5 307.7 20.5 0.7 49.2 164.3 20.5 57.0 23.7 37.4 4.8 6.9 152.1 26.1 2ndQuarter 757.1 586.4 18.7 38.9 628.1 12.5 57.7 319.2 24.9 0.8 54.5 198.1 21.4 54.6 29.1 39.7 7.9 6.7 155.5 29.5 3rdQuarter 761.6 561.3 18.6 38.8 572.4 11.8 62.0 306.1 24.6 1.0 50.6 176.6 20.2 48.3 35.3 39.1 6.1 6.8 150.9 27.5 4thQuarter 770.0 581.6 17.5 34.6 555.5 11.8 57.0 305.6 22.5 0.8 50.0 161.8 20.3 45.6 33.0 36.8 5.8 6.8 157.3 25.0
Indicator Banks, Beverages, Chemicals Construction Diversified Footwear Health Hotels Investment Infor- Land Manu- Motors Oil Planta- Power Services Stores Tele- Trading & Insurance Food& &Pharma– & Holdings & Care & Trusts mation & facturing Palms tions & & communi- Quarter &Finance Tobacco ceuticals Engineering Textiles Travels Technology Property Energy Supplies cation

MONEY AND CAPITAL MARKETS103
Share Trading Indicators by Business Sector 2016 – 2017
Table 9.7
Shares Traded, ’000
2016 1stQuarter 419,986.5 70,577.4 27,521.0 41,606.3 520,815.3 8,229.3 363,129.5 120,082.6 16,589.4 44,850.1 35,056.7 228,198.8 611.1 177.2 6,358.6 73,170.7 9,369.3 209.1 101,104.6 30,442.4 2ndQuarter 487,520.7 57,087.5 4,880.6 47,165.6 265,450.5 20,642.9 98,319.4 104,441.3 10,206.4 3,297.0 16,593.6 235,261.1 934.8 200.3 4,388.9 42,290.7 11,508.1 16.9 73,135.3 133,135.5 3rdQuarter 654,195.6 67,282.7 8,390.9 54,493.5 479,171.5 8,688.6 24,401.2 165,869.6 11,087.6 8,512.6 43,677.8 430,663.9 1,078.8 37.8 20,291.6 140,597.6 9,608.0 64.6 122,423.0 35,155.8 4thQuarter 398,732.7 36,746.3 3,851.2 36,978.4 227,864.8 5,458.1 11,680.5 61,050.2 6,260.5 1,150.2 15,422.5 117,156.6 673.4 16.5 9,788.3 107,398.5 2,838.8 23.5 120,297.9 12,160.6 2017 1stQuarter 271,207.8 53,219.3 8,870.0 35,253.2 548,478.9 7,069.8 38,042.3 80,667.0 8,718.8 5,023.6 325,826.5 131,840.4 403.5 29.5 31,077.1 79,104.2 2,491.6 34.6 109,756.4 31,971.4 2ndQuarter 633,589.5 33,026.2 16,441.2 35,372.6 1,030,778.4 13,196.3 17,776.0 113,469.2 15,251.5 17,462.1 24,861.6 238,233.1 1,836.4 73.0 30,313.8 224,480.9 11,765.5 28.2 123,953.7 51,799.6 3rdQuarter 646,269.5 48,770.7 14,580.1 84,777.3 700,055.9 9,944.4 9,644.5 61,913.0 17,454.3 23,484.1 26,099.9 158,286.9 809.3 50.4 103,331.3 34,565.6 43,795.0 48.9 69,872.3 341,120.5 4thQuarter 544,134.2 41,886.1 14,523.5 75,429.3 220,453.1 4,660.6 35,494.1 77,461.2 13,739.1 4,304.2 112,258.4 137,204.3 33,219.9 347.7 74,032.7 37,969.5 31,249.8 22.1 180,026.8 32,188.3 Turnover, Rs. ’000
2016 1stQuarter 11,987,346.9 3,765,976.7 364,707.0 912,540.5 12,670,583.6 160,368.9 1,723,621.9 1,897,262.3 316,230.8 11,698.8 792,860.5 6,559,006.4 245,237.3 63,054.5 110,356.5 1,036,564.8 32,605.1 40,284.6 1,096,302.3 1,068,713.3 2ndQuarter 14,673,228.8 4,432,632.9 149,161.4 1,171,592.2 8,240,928.5 427,891.6 2,194,819.8 843,194.3 333,099.4 33,147.8 378,354.8 7,012,573.3 260,903.1 64,023.9 63,166.4 589,435.3 42,148.7 9,993.5 833,151.2 769,046.1 3rdQuarter 13,509,406.6 5,885,479.2 205,421.6 1,437,527.7 8,313,439.9 174,332.8 330,862.0 1,291,269.1 250,544.9 74,060.0 831,587.2 11,382,936.9 108,605.4 12,935.1 375,859.0 1,817,207.9 83,702.0 43,104.2 1,367,044.3 511,497.0 4thQuarter 21,029,583.9 2,673,186.8 133,054.3 784,981.6 9,015,488.2 95,324.3 159,084.4 427,663.1 146,382.4 9,005.6 333,759.2 4,441,496.9 69,171.8 7,026.3 152,893.3 600,360.4 10,717.1 13,031.7 1,307,228.4 141,369.1 2017 1stQuarter 7,774,543.1 4,394,274.2 81,482.4 915,251.5 19,725,992.9 119,021.3 968,803.7 1,059,296.2 210,316.5 4,978.6 223,200.8 6,098,163.3 41,367.5 9,496.6 504,969.0 507,010.7 10,659.5 9,492.1 1,240,042.1 1,662,538.8 2ndQuarter 19,876,728.1 5,473,135.4 100,054.8 932,502.5 23,861,142.2 227,733.2 324,233.6 739,652.1 389,473.1 10,225.1 362,884.0 8,886,474.3 154,906.2 20,363.3 534,854.7 1,083,300.9 92,785.4 20,476.0 1,488,681.1 390,724.7 3rdQuarter 11,923,642.1 3,191,948.5 196,729.1 1,497,475.3 15,329,227.8 171,399.6 159,162.2 268,875.3 419,544.6 34,558.0 466,463.5 6,295,778.2 74,540.2 12,230.5 1,622,534.5 477,159.2 199,343.7 38,614.1 835,140.811,828,161.4 4thQuarter 22,686,174.2 5,153,352.0 84,594.8 1,096,860.5 11,637,466.9 73,935.0 387,490.3 501,878.8 469,565.1 18,536.1 1,379,738.6 4,259,045.2 2,615,284.8 88,223.9 1,479,306.4 403,783.8 141,690.9 14,500.4 2,381,138.6 144,911.1 No. of Trades
2016 1stQuarter 65,771 14,770 2,857 10,232 28,898 3,480 3,810 10,995 5,449 895 5,491 54,942 2,322 671 4,286 11,129 2,050 629 2,539 4,526 2ndQuarter 77,256 20,107 1,744 14,593 31,811 4,660 7,329 24,513 7,926 1,473 7,291 66,551 2,114 769 4,728 11,610 1,722 537 2,618 8,563 3rdQuarter 86,197 19,249 2,206 13,885 59,158 2,903 3,852 19,983 5,971 3,198 9,323 87,332 1,958 624 4,730 15,673 2,350 955 2,489 6,508 4thQuarter 55,947 9,623 1,503 7,904 18,514 2,738 2,252 15,285 3,566 815 5,051 32,937 1,136 591 3,542 7,136 994 464 2,013 2,637 2017 1stQuarter 48,699 8,367 1,356 5,372 23,089 3,490 2,385 11,259 3,133 576 5,677 30,743 1,464 446 4,546 6,260 803 520 1,968 3,152 2ndQuarter 75,613 15,634 2,884 7,627 40,260 5,925 2,473 23,575 6,720 1,393 10,173 53,684 2,079 436 16,920 9,347 9,538 711 2,610 7,209 3rdQuarter 60,529 11,494 2,531 15,714 36,670 2,687 2,234 14,678 7,031 2,415 8,246 42,306 1,779 615 34,730 7,998 9,438 730 1,977 5,146 4thQuarter 69,298 13,783 2,243 16,892 22,047 1,674 2,196 12,448 4,798 1,402 8,286 39,651 1,484 649 35,167 7,562 7,289 370 2,311 5,363 Market Capitalization, Rs. Bn.
2016 1stQuarter 618.3 521.0 18.6 34.4 429.4 11.8 52.5 319.4 24.6 1.0 47.0 148.6 23.0 80.8 22.2 43.7 6.0 6.6 153.1 24.3 2ndQuarter 632.6 562.1 19.1 35.1 435.3 11.9 61.5 328.1 27.3 1.1 48.0 159.8 23.6 75.5 22.8 44.7 5.8 6.6 152.9 23.8 3rdQuarter 680.8 536.5 19.0 41.8 470.4 12.2 66.6 331.4 27.2 1.1 47.7 183.4 23.5 71.8 21.9 45.7 5.7 7.2 164.1 27.7 4thQuarter 653.9 533.9 17.2 37.6 514.1 12.0 59.6 321.2 24.0 0.9 51.3 170.4 21.6 75.1 22.0 42.5 5.2 6.7 150.5 25.7 2017 1stQuarter 613.3 552.9 15.9 35.3 505.5 11.5 57.5 307.7 20.5 0.7 49.2 164.3 20.5 57.0 23.7 37.4 4.8 6.9 152.1 26.1 2ndQuarter 757.1 586.4 18.7 38.9 628.1 12.5 57.7 319.2 24.9 0.8 54.5 198.1 21.4 54.6 29.1 39.7 7.9 6.7 155.5 29.5 3rdQuarter 761.6 561.3 18.6 38.8 572.4 11.8 62.0 306.1 24.6 1.0 50.6 176.6 20.2 48.3 35.3 39.1 6.1 6.8 150.9 27.5 4thQuarter 770.0 581.6 17.5 34.6 555.5 11.8 57.0 305.6 22.5 0.8 50.0 161.8 20.3 45.6 33.0 36.8 5.8 6.8 157.3 25.0
Indicator Banks, Beverages, Chemicals Construction Diversified Footwear Health Hotels Investment Infor- Land Manu- Motors Oil Planta- Power Services Stores Tele- Trading & Insurance Food& &Pharma– & Holdings & Care & Trusts mation & facturing Palms tions & & communi- Quarter &Finance Tobacco ceuticals Engineering Textiles Travels Technology Property Energy Supplies cation
(Contd.)

MONEY AND CAPITAL MARKETS104
Share Trading Indicators by Business Sector 2016 – 2017
Table 9.7 (Contd.)
Note:Theabovesharevolumeandturnoverfiguresrepresentonlyordinaryvotingshares.n.a.–Notavailable
Price Index – High
2016 1stQuarter 17,008.2 22,401.1 2,942.2 7,648.5 1,837.8 1,040.3 930.7 3,270.1 17,704.8 62.2 691.6 4,394.5 17,708.2 94,336.1 723.1 170.2 26,732.3 24,190.3 191.4 18,082.7 2ndQuarter 16,569.5 22,837.7 2,625.9 7,620.8 1,716.8 1,028.0 1,117.3 3,226.4 16,809.0 66.2 728.6 4,318.2 18,199.4 80,294.3 716.4 174.9 27,983.9 23,409.0 190.6 16,403.8 3rdQuarter 16,486.6 22,546.5 2,833.8 7,252.8 1,715.1 980.3 1,161.8 3,156.5 15,256.5 53.4 705.1 4,640.9 16,866.6 74,563.3 678.8 172.4 28,986.0 20,174.5 183.6 17,157.7 4thQuarter 16,733.5 21,990.3 2,855.5 7,208.8 1,714.9 984.5 1,131.4 3,160.4 14,574.9 48.4 660.3 4,684.2 16,638.1 72,544.6 657.7 158.2 29,014.3 19,292.0 185.0 17,103.8 2017 1stQuarter 15,737.2 21,955.9 2,592.2 6,763.4 1,582.9 949.0 3,022.2 1,016.2 12,662.0 42.2 635.3 4,386.7 15,246.8 72,123.3 690.9 146.0 28,701.6 17,643.0 175.2 17,041.7 2ndQuarter 17,058.7 24,238.9 2,707.5 6,675.4 1,888.3 1,018.8 3,043.2 1,000.5 13,151.2 37.7 654.4 4,685.7 15,172.0 67,662.2 920.9 144.5 29,541.5 22,755.6 183.0 18,435.8 3rdQuarter 16,950.5 23,221.4 2,787.7 6,543.1 1,915.9 1,045.8 3,000.9 1,030.3 14,490.9 46.1 615.9 4,702.6 15,041.1 65,490.2 1,042.3 140.2 28,145.8 21,050.3 173.9 18,432.2 4thQuarter 17,828.6 23,207.5 2,639.6 6,429.5 1,754.2 976.7 2,909.7 1,028.4 13,229.2 46.7 580.4 4,168.7 14,512.5 59,093.0 1,090.1 132.5 27,561.8 19,151.8 185.3 16,969.7 Price Index – Low
2016 1stQuarter 14,155.1 20,608.8 2,139.3 6,827.9 1,498.9 808.2 839.5 2,956.6 12,384.0 45.6 626.5 3,541.5 15,180.6 77,171.1 603.0 142.0 23,921.0 19,758.1 158.1 14,634.1 2ndQuarter 14,994.7 20,471.5 2,355.6 6,944.4 1,543.9 914.9 880.7 3,019.3 12,979.6 46.1 648.8 3,807.0 16,346.3 72,041.1 655.8 151.1 25,573.6 19,481.9 168.2 14,742.4 3rdQuarter 15,216.4 21,179.5 2,365.6 6,790.8 1,554.2 925.8 1,016.3 3,077.7 13,711.5 41.1 654.1 4,010.7 16,095.4 68,558.4 638.6 155.5 26,407.5 18,596.0 170.2 14,534.3 4thQuarter 15,418.5 20,771.4 2,446.3 6,424.9 1,545.7 890.7 980.1 3,013.5 12,132.7 38.3 597.5 4,283.7 15,140.2 67,584.6 613.1 142.3 26,871.6 17,307.5 162.7 15,522.6 2017 1stQuarter 14,504.0 20,933.8 2,333.2 6,068.4 1,497.6 787.0 2,896.1 932.3 10,653.1 32.8 580.2 4,078.4 14,196.2 64,294.2 624.6 126.9 23,864.9 15,814.0 163.3 15,508.0 2ndQuarter 14,749.7 21,952.1 2,393.0 6,062.4 1,537.4 893.6 2,903.8 947.6 10,898.1 32.2 605.3 4,183.9 14,203.0 63,371.8 691.8 128.3 25,264.4 16,287.7 169.4 16,177.7 3rdQuarter 16,338.4 21,787.6 2,574.8 5,849.2 1,699.8 902.1 2,860.4 924.6 12,477.5 31.7 571.4 4,147.6 14,084.2 56,379.5 848.7 127.4 27,115.0 18,061.9 160.4 16,145.4 4thQuarter 16,493.7 22,347.1 2,308.6 5,761.6 1,651.0 840.7 2,804.7 924.3 11,287.3 32.8 537.7 3,863.2 14,066.1 53,173.1 907.9 116.0 26,541.9 16,955.9 167.4 14,931.7 Price Index – Average
2016 1stQuarter 15,354.8 21,135.3 2,530.2 7,085.2 1,642.0 917.0 3,104.9 869.3 14,690.7 49.7 655.4 3,894.6 16,566.9 83,034.4 662.3 153.4 25,236.8 22,032.7 171.1 15,970.7 2ndQuarter 15,963.1 22,139.2 2,512.3 7,323.2 1,633.6 975.2 3,143.1 1,020.1 15,227.6 54.4 694.3 4,178.2 17,244.6 78,438.0 691.2 163.9 27,095.7 21,578.0 178.9 15,688.3 3rdQuarter 16,063.0 21,969.9 2,605.8 7,071.4 1,655.8 956.2 3,125.0 1,091.1 14,529.9 46.3 682.5 4,376.5 16,578.6 71,633.0 657.2 162.2 27,173.9 19,299.8 176.9 16,174.5 4thQuarter 16,049.7 21,372.6 2,618.9 6,845.7 1,628.0 936.3 3,079.6 1,057.7 13,326.5 43.2 632.9 4,453.4 16,094.4 70,461.8 634.8 150.7 27,551.7 18,225.0 172.9 16,339.2 2017 1stQuarter 15,171.8 21,254.8 2,481.0 6,402.1 1,536.9 867.0 2,958.7 970.4 11,674.8 38.7 606.1 4,247.7 14,778.6 68,716.6 665.0 137.0 26,933.4 16,889.0 168.8 15,974.9 2ndQuarter 16,414.7 23,515.3 2,610.7 6,504.7 1,746.2 962.8 3,002.3 970.5 12,691.7 34.8 625.2 4,508.4 14,788.5 65,502.7 836.7 136.8 27,549.8 19,537.8 175.2 17,829.6 3rdQuarter 16,574.1 22,404.0 2,653.0 6,234.6 1,791.9 971.8 2,923.9 969.3 13,211.6 36.2 591.0 4,403.8 14,546.5 61,643.7 937.8 133.8 27,710.9 18,969.5 167.3 17,079.4 4thQuarter 17,068.3 22,798.6 2,471.3 6,091.5 1,710.6 915.2 2,860.3 973.8 12,415.9 37.9 562.7 4,024.7 14,262.0 56,805.8 994.8 124.6 27,184.5 18,183.5 177.0 16,343.6
Market Dividend Yield, %
2016 1stQuarter 3.1 3.0 3.0 3.0 2.0 0.3 0.6 2.0 3.5 0.0 1.3 4.2 4.6 0.5 3.1 5.2 1.5 5.6 1.7 3.4 2ndQuarter 3.9 2.7 1.4 3.7 3.3 0.7 1.4 2.2 1.3 0.0 4.1 4.5 6.6 0.1 5.9 5.7 1.2 4.5 3.4 1.9 3rdQuarter 3.7 3.0 2.4 4.0 2.8 0.7 1.4 1.2 1.3 0.0 4.0 4.7 7.6 0.1 6.3 5.5 1.1 5.6 3.2 0.5 4thQuarter 3.3 3.0 2.7 3.8 2.6 0.0 1.1 1.1 1.7 0.0 3.2 4.6 5.6 0.1 6.6 8.2 1.5 2.1 1.7 0.6 2017 1stQuarter 3.3 3.3 2.8 3.6 3.1 0.3 1.4 2.4 2.6 n.a. 1.3 5.0 8.3 0.0 6.2 7.0 3.2 2.9 1.7 0.7 2ndQuarter 2.6 3.4 3.9 2.6 2.2 0.2 1.4 2.5 1.3 n.a. 3.0 3.9 6.0 1.7 2.6 4.1 4.1 1.4 1.7 0.6 3rdQuarter 2.7 3.2 2.6 3.4 2.7 0.9 1.4 2.3 2.0 n.a. 6.5 5.7 6.5 3.4 2.4 4.6 4.0 3.2 2.1 4.6 4thQuarter 2.5 3.8 3.5 3.1 3.2 0.9 1.4 2.6 2.5 n.a. 6.4 6.6 5.1 3.4 2.5 2.8 2.2 2.9 3.0 4.9
Marker Price Earning Ratio
2016 1stQuarter 9.3 18.1 17.4 16.3 15.7 n.a. 124.8 29.0 8.0 n.a. 9.4 16.9 9.3 115.8 28.7 9.0 15.1 48.9 14.9 7.1 2ndQuarter 7.5 17.2 34.5 10.7 14.2 24.0 47.3 16.9 n.a. n.a. 9.2 8.1 7.7 54.4 n.a. 9.3 15.0 n.a. 15.7 13.0 3rdQuarter 8.0 16.0 46.0 11.0 16.1 25.7 56.2 14.6 n.a. n.a. 8.3 9.3 7.9 42.1 n.a. 9.0 10.2 22.4 16.8 13.5 4thQuarter 7.0 14.4 36.6 10.4 17.4 22.8 62.4 12.8 339.8 n.a. 9.9 8.0 6.8 44.0 n.a. 8.7 14.6 30.3 13.3 12.6 2017 1stQuarter 6.2 15.5 41.8 10.5 20.2 17.0 63.6 17.8 29.2 n.a. 9.6 7.6 6.1 33.9 n.a. 5.6 15.6 n.a. 11.9 13.5 2ndQuarter 6.8 17.0 18.3 19.2 20.6 20.7 43.8 16.1 79.9 n.a. 9.8 8.9 7.0 7.8 4.7 8.9 15.7 n.a. 7.2 7.0 3rdQuarter 6.7 18.7 14.4 15.6 13.0 26.8 41.7 19.3 7.7 n.a. 8.6 7.8 8.9 5.4 4.8 13.3 41.2 n.a. 12.0 6.7 4thQuarter 6.6 18.1 36.3 12.0 11.8 47.8 51.8 15.6 7.5 n.a. 9.3 7.8 10.9 4.4 3.2 n.a. 147.8 n.a. 12.9 7.1 Market Price to Book Value
2016 1stQuarter 1.2 4.6 1.1 1.4 1.4 1.2 4.3 2.7 0.7 1.0 0.9 2.5 1.0 2.6 0.6 1.3 1.4 1.6 1.3 0.9 2ndQuarter 1.2 3.8 1.0 0.9 1.1 0.6 2.1 2.9 0.5 n.a. 0.9 1.5 0.8 1.4 0.6 1.4 0.7 1.3 1.3 0.9 3rdQuarter 1.3 3.6 1.2 0.9 1.2 1.1 2.1 3.1 0.5 n.a. 0.8 1.7 0.8 1.3 0.6 1.4 0.7 1.3 1.4 1.0 4thQuarter 1.2 3.5 1.0 0.7 1.2 1.0 2.0 2.8 0.5 n.a. 0.9 1.4 0.7 1.4 0.6 1.2 0.7 1.6 1.2 0.9 2017 1stQuarter 1.0 3.4 1.0 0.7 1.2 0.9 1.9 2.5 0.5 n.a. 0.9 1.4 0.7 1.0 0.6 1.0 0.7 1.4 1.3 0.9 2ndQuarter 1.1 6.1 1.1 0.7 1.5 1.0 1.8 2.4 0.6 n.a. 1.0 1.5 0.7 1.0 0.9 1.1 0.7 2.4 1.3 0.9 3rdQuarter 1.2 5.8 1.0 0.8 1.1 0.9 1.7 2.3 0.6 n.a. 0.8 1.3 0.7 1.1 0.9 1.1 0.7 1.9 1.2 0.9 4thQuarter 1.1 5.9 0.9 0.7 1.0 0.9 1.7 2.1 0.5 n.a. 0.7 1.2 0.7 1.0 0.8 1.0 0.7 1.3 1.2 0.8
Indicator Banks, Beverages, Chemicals Construction Diversified Footwear Health Hotels Investment Infor- Land Manu- Motors Oil Planta- Power Services Stores Tele- Trading & Insurance Food& &Pharma– & Holdings & Care & Trusts mation & facturing Palms tions & & communi- Quarter &Finance Tobacco ceuticals Engineering Textiles Travels Technology Property Energy Supplies cation

MONEY AND CAPITAL MARKETS105
Share Trading Indicators by Business Sector 2016 – 2017
Table 9.7 (Contd.)
Price Index – High
2016 1stQuarter 17,008.2 22,401.1 2,942.2 7,648.5 1,837.8 1,040.3 930.7 3,270.1 17,704.8 62.2 691.6 4,394.5 17,708.2 94,336.1 723.1 170.2 26,732.3 24,190.3 191.4 18,082.7 2ndQuarter 16,569.5 22,837.7 2,625.9 7,620.8 1,716.8 1,028.0 1,117.3 3,226.4 16,809.0 66.2 728.6 4,318.2 18,199.4 80,294.3 716.4 174.9 27,983.9 23,409.0 190.6 16,403.8 3rdQuarter 16,486.6 22,546.5 2,833.8 7,252.8 1,715.1 980.3 1,161.8 3,156.5 15,256.5 53.4 705.1 4,640.9 16,866.6 74,563.3 678.8 172.4 28,986.0 20,174.5 183.6 17,157.7 4thQuarter 16,733.5 21,990.3 2,855.5 7,208.8 1,714.9 984.5 1,131.4 3,160.4 14,574.9 48.4 660.3 4,684.2 16,638.1 72,544.6 657.7 158.2 29,014.3 19,292.0 185.0 17,103.8 2017 1stQuarter 15,737.2 21,955.9 2,592.2 6,763.4 1,582.9 949.0 3,022.2 1,016.2 12,662.0 42.2 635.3 4,386.7 15,246.8 72,123.3 690.9 146.0 28,701.6 17,643.0 175.2 17,041.7 2ndQuarter 17,058.7 24,238.9 2,707.5 6,675.4 1,888.3 1,018.8 3,043.2 1,000.5 13,151.2 37.7 654.4 4,685.7 15,172.0 67,662.2 920.9 144.5 29,541.5 22,755.6 183.0 18,435.8 3rdQuarter 16,950.5 23,221.4 2,787.7 6,543.1 1,915.9 1,045.8 3,000.9 1,030.3 14,490.9 46.1 615.9 4,702.6 15,041.1 65,490.2 1,042.3 140.2 28,145.8 21,050.3 173.9 18,432.2 4thQuarter 17,828.6 23,207.5 2,639.6 6,429.5 1,754.2 976.7 2,909.7 1,028.4 13,229.2 46.7 580.4 4,168.7 14,512.5 59,093.0 1,090.1 132.5 27,561.8 19,151.8 185.3 16,969.7 Price Index – Low
2016 1stQuarter 14,155.1 20,608.8 2,139.3 6,827.9 1,498.9 808.2 839.5 2,956.6 12,384.0 45.6 626.5 3,541.5 15,180.6 77,171.1 603.0 142.0 23,921.0 19,758.1 158.1 14,634.1 2ndQuarter 14,994.7 20,471.5 2,355.6 6,944.4 1,543.9 914.9 880.7 3,019.3 12,979.6 46.1 648.8 3,807.0 16,346.3 72,041.1 655.8 151.1 25,573.6 19,481.9 168.2 14,742.4 3rdQuarter 15,216.4 21,179.5 2,365.6 6,790.8 1,554.2 925.8 1,016.3 3,077.7 13,711.5 41.1 654.1 4,010.7 16,095.4 68,558.4 638.6 155.5 26,407.5 18,596.0 170.2 14,534.3 4thQuarter 15,418.5 20,771.4 2,446.3 6,424.9 1,545.7 890.7 980.1 3,013.5 12,132.7 38.3 597.5 4,283.7 15,140.2 67,584.6 613.1 142.3 26,871.6 17,307.5 162.7 15,522.6 2017 1stQuarter 14,504.0 20,933.8 2,333.2 6,068.4 1,497.6 787.0 2,896.1 932.3 10,653.1 32.8 580.2 4,078.4 14,196.2 64,294.2 624.6 126.9 23,864.9 15,814.0 163.3 15,508.0 2ndQuarter 14,749.7 21,952.1 2,393.0 6,062.4 1,537.4 893.6 2,903.8 947.6 10,898.1 32.2 605.3 4,183.9 14,203.0 63,371.8 691.8 128.3 25,264.4 16,287.7 169.4 16,177.7 3rdQuarter 16,338.4 21,787.6 2,574.8 5,849.2 1,699.8 902.1 2,860.4 924.6 12,477.5 31.7 571.4 4,147.6 14,084.2 56,379.5 848.7 127.4 27,115.0 18,061.9 160.4 16,145.4 4thQuarter 16,493.7 22,347.1 2,308.6 5,761.6 1,651.0 840.7 2,804.7 924.3 11,287.3 32.8 537.7 3,863.2 14,066.1 53,173.1 907.9 116.0 26,541.9 16,955.9 167.4 14,931.7 Price Index – Average
2016 1stQuarter 15,354.8 21,135.3 2,530.2 7,085.2 1,642.0 917.0 3,104.9 869.3 14,690.7 49.7 655.4 3,894.6 16,566.9 83,034.4 662.3 153.4 25,236.8 22,032.7 171.1 15,970.7 2ndQuarter 15,963.1 22,139.2 2,512.3 7,323.2 1,633.6 975.2 3,143.1 1,020.1 15,227.6 54.4 694.3 4,178.2 17,244.6 78,438.0 691.2 163.9 27,095.7 21,578.0 178.9 15,688.3 3rdQuarter 16,063.0 21,969.9 2,605.8 7,071.4 1,655.8 956.2 3,125.0 1,091.1 14,529.9 46.3 682.5 4,376.5 16,578.6 71,633.0 657.2 162.2 27,173.9 19,299.8 176.9 16,174.5 4thQuarter 16,049.7 21,372.6 2,618.9 6,845.7 1,628.0 936.3 3,079.6 1,057.7 13,326.5 43.2 632.9 4,453.4 16,094.4 70,461.8 634.8 150.7 27,551.7 18,225.0 172.9 16,339.2 2017 1stQuarter 15,171.8 21,254.8 2,481.0 6,402.1 1,536.9 867.0 2,958.7 970.4 11,674.8 38.7 606.1 4,247.7 14,778.6 68,716.6 665.0 137.0 26,933.4 16,889.0 168.8 15,974.9 2ndQuarter 16,414.7 23,515.3 2,610.7 6,504.7 1,746.2 962.8 3,002.3 970.5 12,691.7 34.8 625.2 4,508.4 14,788.5 65,502.7 836.7 136.8 27,549.8 19,537.8 175.2 17,829.6 3rdQuarter 16,574.1 22,404.0 2,653.0 6,234.6 1,791.9 971.8 2,923.9 969.3 13,211.6 36.2 591.0 4,403.8 14,546.5 61,643.7 937.8 133.8 27,710.9 18,969.5 167.3 17,079.4 4thQuarter 17,068.3 22,798.6 2,471.3 6,091.5 1,710.6 915.2 2,860.3 973.8 12,415.9 37.9 562.7 4,024.7 14,262.0 56,805.8 994.8 124.6 27,184.5 18,183.5 177.0 16,343.6
Market Dividend Yield, %
2016 1stQuarter 3.1 3.0 3.0 3.0 2.0 0.3 0.6 2.0 3.5 0.0 1.3 4.2 4.6 0.5 3.1 5.2 1.5 5.6 1.7 3.4 2ndQuarter 3.9 2.7 1.4 3.7 3.3 0.7 1.4 2.2 1.3 0.0 4.1 4.5 6.6 0.1 5.9 5.7 1.2 4.5 3.4 1.9 3rdQuarter 3.7 3.0 2.4 4.0 2.8 0.7 1.4 1.2 1.3 0.0 4.0 4.7 7.6 0.1 6.3 5.5 1.1 5.6 3.2 0.5 4thQuarter 3.3 3.0 2.7 3.8 2.6 0.0 1.1 1.1 1.7 0.0 3.2 4.6 5.6 0.1 6.6 8.2 1.5 2.1 1.7 0.6 2017 1stQuarter 3.3 3.3 2.8 3.6 3.1 0.3 1.4 2.4 2.6 n.a. 1.3 5.0 8.3 0.0 6.2 7.0 3.2 2.9 1.7 0.7 2ndQuarter 2.6 3.4 3.9 2.6 2.2 0.2 1.4 2.5 1.3 n.a. 3.0 3.9 6.0 1.7 2.6 4.1 4.1 1.4 1.7 0.6 3rdQuarter 2.7 3.2 2.6 3.4 2.7 0.9 1.4 2.3 2.0 n.a. 6.5 5.7 6.5 3.4 2.4 4.6 4.0 3.2 2.1 4.6 4thQuarter 2.5 3.8 3.5 3.1 3.2 0.9 1.4 2.6 2.5 n.a. 6.4 6.6 5.1 3.4 2.5 2.8 2.2 2.9 3.0 4.9
Marker Price Earning Ratio
2016 1stQuarter 9.3 18.1 17.4 16.3 15.7 n.a. 124.8 29.0 8.0 n.a. 9.4 16.9 9.3 115.8 28.7 9.0 15.1 48.9 14.9 7.1 2ndQuarter 7.5 17.2 34.5 10.7 14.2 24.0 47.3 16.9 n.a. n.a. 9.2 8.1 7.7 54.4 n.a. 9.3 15.0 n.a. 15.7 13.0 3rdQuarter 8.0 16.0 46.0 11.0 16.1 25.7 56.2 14.6 n.a. n.a. 8.3 9.3 7.9 42.1 n.a. 9.0 10.2 22.4 16.8 13.5 4thQuarter 7.0 14.4 36.6 10.4 17.4 22.8 62.4 12.8 339.8 n.a. 9.9 8.0 6.8 44.0 n.a. 8.7 14.6 30.3 13.3 12.6 2017 1stQuarter 6.2 15.5 41.8 10.5 20.2 17.0 63.6 17.8 29.2 n.a. 9.6 7.6 6.1 33.9 n.a. 5.6 15.6 n.a. 11.9 13.5 2ndQuarter 6.8 17.0 18.3 19.2 20.6 20.7 43.8 16.1 79.9 n.a. 9.8 8.9 7.0 7.8 4.7 8.9 15.7 n.a. 7.2 7.0 3rdQuarter 6.7 18.7 14.4 15.6 13.0 26.8 41.7 19.3 7.7 n.a. 8.6 7.8 8.9 5.4 4.8 13.3 41.2 n.a. 12.0 6.7 4thQuarter 6.6 18.1 36.3 12.0 11.8 47.8 51.8 15.6 7.5 n.a. 9.3 7.8 10.9 4.4 3.2 n.a. 147.8 n.a. 12.9 7.1 Market Price to Book Value
2016 1stQuarter 1.2 4.6 1.1 1.4 1.4 1.2 4.3 2.7 0.7 1.0 0.9 2.5 1.0 2.6 0.6 1.3 1.4 1.6 1.3 0.9 2ndQuarter 1.2 3.8 1.0 0.9 1.1 0.6 2.1 2.9 0.5 n.a. 0.9 1.5 0.8 1.4 0.6 1.4 0.7 1.3 1.3 0.9 3rdQuarter 1.3 3.6 1.2 0.9 1.2 1.1 2.1 3.1 0.5 n.a. 0.8 1.7 0.8 1.3 0.6 1.4 0.7 1.3 1.4 1.0 4thQuarter 1.2 3.5 1.0 0.7 1.2 1.0 2.0 2.8 0.5 n.a. 0.9 1.4 0.7 1.4 0.6 1.2 0.7 1.6 1.2 0.9 2017 1stQuarter 1.0 3.4 1.0 0.7 1.2 0.9 1.9 2.5 0.5 n.a. 0.9 1.4 0.7 1.0 0.6 1.0 0.7 1.4 1.3 0.9 2ndQuarter 1.1 6.1 1.1 0.7 1.5 1.0 1.8 2.4 0.6 n.a. 1.0 1.5 0.7 1.0 0.9 1.1 0.7 2.4 1.3 0.9 3rdQuarter 1.2 5.8 1.0 0.8 1.1 0.9 1.7 2.3 0.6 n.a. 0.8 1.3 0.7 1.1 0.9 1.1 0.7 1.9 1.2 0.9 4thQuarter 1.1 5.9 0.9 0.7 1.0 0.9 1.7 2.1 0.5 n.a. 0.7 1.2 0.7 1.0 0.8 1.0 0.7 1.3 1.2 0.8
Indicator Banks, Beverages, Chemicals Construction Diversified Footwear Health Hotels Investment Infor- Land Manu- Motors Oil Planta- Power Services Stores Tele- Trading & Insurance Food& &Pharma– & Holdings & Care & Trusts mation & facturing Palms tions & & communi- Quarter &Finance Tobacco ceuticals Engineering Textiles Travels Technology Property Energy Supplies cation
Source:ColomboStockExchange

MONEY AND CAPITAL MARKETS106
Share Trading Indicators by Major Companies(a) 2015 – 2017 Table 9.8
Indicator&
Quarter
JohnKeells
HoldingsPLC
CeylonTobaccoCompany
PLC
CommercialBankofCeylon
PLC
DialogAxiata
PLC
Hatton NationalBankPLC
CeylonCold
StoresPLC
NestleLanka PLC
HemasHoldings
PLC
DistilleriesCompanyofSriLanka
PLC
MelstacorpPLC
SampathBankPLC
LankaOrixLeasing
CompanyPLC
Sri Lanka Telecom
PLC
Cargills(Ceylon)
PLC
Lion BreweryCeylon
PLC
CarsonCumber-batchPLC
CTHoldings
DFCCBankPLC
CeylincoInsurance
(a)Givencompaniesareintermsofmarketcapitalisationasatend2012.
No. of Trades 2015 1stQuarter 16,021 687 4,384 4,215 3,083 460 627 1,708 1,433 – 4,747 562 703 194 112 277 205 1,873 327 2ndQuarter 7,791 733 3,003 2,295 1,685 652 635 1,558 1,063 – 4,012 1,628 882 484 111 232 138 1,759 169 3rdQuarter 12,116 934 3,070 4,807 2,256 502 655 1,953 1,222 – 3,704 1,415 1,109 773 128 282 381 1,654 122 4thQuarter 8,432 453 5,118 2,139 1,263 476 719 1,123 720 – 1,997 615 479 479 98 185 133 1,217 2052016 1stQuarter 8,948 538 4,896 1,709 1,193 566 590 1,118 639 – 3,485 897 830 278 181 229 129 1,160 125 2ndQuarter 6,302 473 4,132 1,637 1,357 613 533 905 1,111 – 2,459 650 981 344 319 266 106 1,211 91 3rdQuarter 8,618 1,206 3,600 1,587 1,151 923 290 1,107 3,035 – 2,728 1,006 902 361 381 401 223 1,206 59 4thQuarter 6,896 737 2,561 1,398 872 1,078 470 570 – 383 2,026 610 615 361 577 236 158 1,773 1152017 1stQuarter 8,290 499 2,110 1,329 618 699 577 642 – 2,703 2,523 650 639 432 196 268 324 1,320 429 2ndQuarter 10,252 597 3,622 1,642 1,330 1,358 608 1,228 – 1,456 2,803 3,371 968 508 262 223 210 1,634 199 3rdQuarter 4,754 415 2,526 1,112 1,418 720 797 859 – 761 3,883 2,240 865 369 178 274 137 900 158 4thQuarter 5,464 357 3,553 1,634 1,343 653 687 601 – 510 8,338 1,352 677 353 407 317 246 1,496 168
Turnover,Rs.'000 2015 1stQuarter 13,137,536 179,517 4,556,916 1,088,339 2,529,918 115,474 136,040 576,059 2,377,344 – 1,780,690 44,090 25,514 33,081 41,075 40,427 68,166 745,142 47,915 2ndQuarter 6,349,311 379,013 4,770,698 720,739 1,663,743 169,756 524,049 369,212 2,056,482 – 2,320,214 343,532 26,360 158,650 38,908 18,959 10,510 834,677 3,535,993 3rdQuarter 9,524,382 956,112 5,116,424 1,996,017 1,848,917 113,683 545,159 1,323,445 1,410,030 – 2,026,911 247,457 37,707 177,077 68,869 53,684 48,460 392,628 1,960,268 4thQuarter 7,749,801 797,085 4,941,382 1,503,091 1,658,124 236,147 366,733 356,634 1,580,284 – 854,570 41,567 10,064 241,582 681,260 8,551 534,744 486,308 206,4642016 1stQuarter 7,767,744 979,593 3,574,777 1,030,087 672,691 439,550 304,726 758,477 552,077 – 1,806,909 55,385 66,215 178,443 284,133 82,522 12,214 204,479 56,289 2ndQuarter 5,653,271 527,131 4,187,088 810,654 1,770,650 133,454 408,350 733,141 1,782,868 – 961,168 28,772 22,498 232,409 396,806 25,605 41,934 205,862 54,421 3rdQuarter 4,803,946 1,109,051 1,764,418 1,351,923 721,055 356,079 43,668 861,393 2,735,528 – 986,513 708,091 15,121 74,629 568,898 5,384 33,540 172,141 48,036 4thQuarter 5,341,351 901,320 3,332,083 1,298,337 1,065,409 238,709 507,475 1,482,170 – 43,045 730,362 102,875 8,891 272,337 404,958 7,531 44,619 726,424 33,7802017 1stQuarter 12,156,702 236,299 1,560,221 1,232,505 1,102,117 624,884 640,899 2,116,625 – 2,393,537 974,758 27,613 7,537 359,449 401,138 10,643 63,009 154,267 102,896 2ndQuarter 17,080,377 533,317 9,354,540 1,475,739 1,566,515 2,726,227 792,562 2,472,184 – 1,463,164 1,954,514 330,120 12,943 186,134 487,988 16,993 67,889 480,947 60,860 3rdQuarter 9,527,330 257,287 2,457,970 818,943 1,826,918 955,699 432,530 1,156,492 – 893,809 1,978,098 709,735 16,198 53,970 356,655 14,840 68,166 58,688 19,978 4thQuarter 7,663,000 312,583 6,873,568 2,371,678 2,112,867 988,892 1,341,282 1,631,623 – 382,125 6,886,015 391,693 9,461 441,730 1,632,914 22,862 158,484 732,545 38,169
No. of Shares Traded,000 2015 1stQuarter 61,680 170 25,541 85,742 11,374 411 60 7,114 10,093 – 6,894 497 505 227 66 97 484 3,403 30 2ndQuarter 31,881 382 28,655 65,131 7,335 478 235 4,614 7,930 – 8,953 3,759 559 1,136 61 47 81 4,050 2,207 3rdQuarter 52,120 1,033 30,250 182,993 8,490 292 268 14,893 4,838 – 7,658 2,306 789 1,054 108 134 342 2,000 1,225 4thQuarter 43,715 804 32,927 137,309 7,721 573 176 4,153 5,767 – 3,393 440 209 1,333 1,088 24 3,821 2,909 1452016 1stQuarter 49,466 986 28,072 99,228 3,423 1,029 151 9,451 2,518 – 7,906 707 1,876 1,068 567 322 94 1,370 39 2ndQuarter 36,378 475 32,232 72,584 8,573 276 180 8,325 8,329 – 4,214 334 551 1,614 947 95 331 1,460 37 3rdQuarter 32,560 1,235 12,885 122,016 3,225 561 19 9,073 10,797 – 3,927 8,455 407 445 1,498 24 265 1,305 37 4thQuarter 35,606 1,050 22,956 120,050 4,723 329 247 14,141 – 716 2,783 1,296 248 1,517 952 41 370 6,130 252017 1stQuarter 86,828 283 11,301 109,537 4,820 799 326 19,994 – 36,778 3,648 435 220 1,827 906 64 455 1,310 77 2ndQuarter 105,774 542 66,452 123,565 6,698 3,185 360 17,588 – 22,197 6,815 3,456 389 898 1,118 100 424 3,968 40 3rdQuarter 56,939 264 17,798 69,335 7,872 1,143 238 8,160 – 13,677 6,782 5,836 537 267 789 96 415 477 14 4thQuarter 49,200 323 48,655 179,709 8,067 1,011 824 12,718 – 6,520 20,481 2,998 318 2,179 3,061 138 897 6,114 28
Price – High (Rs.) 2015 1stQuarter 250.30 1,124.00 194.00 14.30 242.00 300.00 2,390.00 89.90 246.00 – 275.00 97.00 54.90 157.50 654.60 489.00 150.00 232.00 1,949.90 2ndQuarter 214.00 1,050.00 175.00 11.90 239.50 400.00 2,355.00 85.50 296.00 – 272.00 113.00 49.90 145.00 700.00 440.00 140.00 230.00 1,700.00 3rdQuarter 199.00 990.00 175.50 12.10 230.50 425.00 2,160.00 99.80 320.00 – 279.90 116.20 50.90 188.00 680.00 430.00 164.00 206.50 1,580.00 4thQuarter 191.00 1,000.00 162.50 11.60 222.00 440.00 2,240.00 93.00 285.00 – 261.90 102.50 49.50 193.50 660.00 400.00 148.50 183.00 1,500.002016 1stQuarter 179.00 1,042.00 142.00 10.90 211.00 479.00 2,100.00 92.90 245.90 – 253.00 94.50 46.40 189.50 630.00 355.00 142.00 168.00 1,560.00 2ndQuarter 165.00 1,140.00 136.00 11.50 216.60 564.90 2,445.00 95.00 225.00 – 240.00 93.00 45.00 168.90 549.50 300.00 135.00 170.00 1,650.00 3rdQuarter 159.00 1,050.10 144.50 11.60 228.00 690.00 2,410.00 105.50 294.00 – 266.90 92.00 39.80 179.00 435.00 240.00 132.00 140.00 1,440.00 4thQuarter 158.00 900.00 151.90 11.80 235.00 865.00 2,200.20 108.50 – 65.00 268.70 83.90 39.90 195.00 509.90 196.90 140.00 132.40 1,499.902017 1stQuarter 150.00 880.00 148.50 11.60 236.50 835.00 2,100.00 110.00 – 69.50 285.00 79.00 36.70 201.00 495.00 190.00 150.00 124.00 1,599.90 2ndQuarter 180.00 1,030.00 149.00 12.30 250.00 1,000.00 2,310.00 154.90 – 69.50 300.00 114.00 36.00 220.50 475.00 189.00 170.00 133.90 1,720.00 3rdQuarter 179.00 1,005.00 141.00 12.20 244.50 889.90 2,049.90 154.90 – 69.50 311.00 130.00 32.80 210.00 475.00 170.00 170.00 130.00 1,624.70 4thQuarter 166.10 1,005.00 150.00 13.60 271.00 1,029.00 1,740.00 134.90 – 61.00 352.20 145.00 31.90 211.00 598.00 180.00 188.00 138.20 1,597.00
Price – Low (Rs.) 2015 1stQuarter 195.00 999.00 158.10 10.30 192.00 257.00 2,105.00 70.00 210.50 – 235.20 75.00 44.00 136.00 590.00 365.00 127.10 200.00 1,304.00 2ndQuarter 189.90 896.50 160.00 10.30 213.50 275.00 2,000.00 71.00 235.00 – 240.00 76.00 44.00 134.10 601.00 370.00 126.20 199.50 1,460.00 3rdQuarter 167.50 881.00 158.00 10.10 203.00 340.00 1,960.40 78.00 265.00 – 248.10 95.00 43.00 135.20 618.00 372.00 128.10 182.10 1,345.00 4thQuarter 166.00 950.00 139.90 10.50 207.50 380.00 2,000.00 79.50 240.00 – 246.00 90.10 45.00 162.20 590.00 345.00 130.20 155.00 1,342.002016 1stQuarter 140.00 950.00 115.00 9.70 185.00 380.00 1,903.30 72.00 205.00 – 210.00 64.10 31.20 150.00 452.00 212.00 117.00 135.00 1,300.00 2ndQuarter 135.00 1,000.00 121.00 10.10 197.00 400.10 2,030.00 81.00 205.00 – 217.50 71.10 36.70 140.00 372.00 238.00 118.00 126.20 1,340.00 3rdQuarter 135.00 850.00 120.10 10.40 206.00 540.00 2,030.00 85.00 208.00 – 227.60 78.00 35.80 150.00 370.00 183.00 120.00 125.50 1,300.00 4thQuarter 143.00 797.00 138.50 10.10 218.00 613.00 1,975.00 94.60 – 59.00 253.00 70.20 33.30 165.10 380.00 172.00 114.00 116.10 1,200.002017 1stQuarter 133.90 800.00 128.50 10.40 221.00 710.00 1,930.10 95.00 – 54.90 256.00 59.00 32.10 180.00 406.10 150.10 120.00 110.00 1,200.00 2ndQuarter 138.00 865.00 130.50 11.10 220.00 810.00 2,001.00 108.00 – 60.00 253.50 60.50 30.80 183.00 400.00 153.20 142.50 112.00 1,430.00 3rdQuarter 157.90 949.00 134.60 11.10 220.00 740.00 1,699.90 118.00 – 58.00 266.20 107.10 28.00 190.20 410.10 145.10 140.00 118.00 1,350.00 4thQuarter 145.00 934.10 133.00 12.00 236.00 823.00 1,600.00 118.00 – 56.50 305.00 112.00 27.00 192.00 470.00 147.00 170.00 118.30 1,276.00
Maket Capitalisation, Rs. Mn. 2015 1stQuarter 198,899 187,230 134,135 84,695 71,674 28,341 123,300 37,977 72,150 – 42,330 36,400 82,121 30,688 48,008 71,956 23,436 53,762 33,834 2ndQuarter 203,388 168,666 131,580 85,510 69,898 33,264 112,705 46,949 81,000 – 44,681 47,377 79,775 31,562 49,616 78,967 – 52,967 31,518 3rdQuarter 193,476 180,824 130,397 88,767 69,372 36,685 112,754 48,666 82,470 – 44,491 45,904 87,897 38,080 49,600 77,573 24,901 48,486 28,000 4thQuarter 211,829 185,919 115,033 87,138 68,320 40,069 110,110 53,189 73,800 – 42,734 44,669 84,828 42,336 50,400 67,970 25,634 44,563 29,7122016 1stQuarter 176,032 189,553 102,998 83,067 65,741 40,867 108,977 46,147 61,860 – 38,943 34,214 70,029 33,600 36,720 53,024 23,784 36,318 29,960 2ndQuarter 183,508 196,690 101,345 84,695 69,974 52,994 128,941 49,239 62,130 – 40,352 37,066 68,224 34,272 30,400 47,074 21,642 33,667 28,788 3rdQuarter 209,367 161,098 119,935 94,468 74,267 61,177 118,201 59,602 71,130 – 47,130 39,061 69,668 39,200 30,400 36,076 22,521 34,277 27,976 4thQuarter 201,183 151,077 120,852 85,510 74,420 71,318 107,553 56,126 71,130 69,108 46,086 34,452 64,975 43,546 37,200 34,132 22,924 32,474 29,8002017 1stQuarter 191,332 163,140 110,297 92,025 75,694 77,077 112,249 62,256 71,130 68,992 48,223 28,987 60,102 42,045 36,800 32,050 27,263 30,221 31,724 2ndQuarter 248,079 185,451 129,615 97,725 81,087 83,882 109,063 87,763 71,130 79,597 53,325 53,603 57,756 45,024 34,400 31,167 29,296 34,198 31,934 3rdQuarter 321,024 181,891 128,970 98,540 92,178 92,178 91,328 68,312 71,130 68,292 57,440 60,350 52,341 43,008 37,768 29,851 31,127 31,547 28,000 4thQuarter 206,044 188,167 126,554 105,869 97,684 90,278 87,358 72,436 71,130 69,341 68,577 54,696 51,439 44,778 43,200 34,564 32,958 32,554 31,940

MONEY AND CAPITAL MARKETS107
Share Trading Indicators by Major Companies(a) 2015 – 2017 Table 9.8
Indicator&
Quarter
JohnKeells
HoldingsPLC
CeylonTobaccoCompany
PLC
CommercialBankofCeylon
PLC
DialogAxiata
PLC
Hatton NationalBankPLC
CeylonCold
StoresPLC
NestleLanka PLC
HemasHoldings
PLC
DistilleriesCompanyofSriLanka
PLC
MelstacorpPLC
SampathBankPLC
LankaOrixLeasing
CompanyPLC
Sri Lanka Telecom
PLC
Cargills(Ceylon)
PLC
Lion BreweryCeylon
PLC
CarsonCumber-batchPLC
CTHoldings
DFCCBankPLC
CeylincoInsurance
Source:ColomboStockExchange
No. of Trades 2015 1stQuarter 16,021 687 4,384 4,215 3,083 460 627 1,708 1,433 – 4,747 562 703 194 112 277 205 1,873 327 2ndQuarter 7,791 733 3,003 2,295 1,685 652 635 1,558 1,063 – 4,012 1,628 882 484 111 232 138 1,759 169 3rdQuarter 12,116 934 3,070 4,807 2,256 502 655 1,953 1,222 – 3,704 1,415 1,109 773 128 282 381 1,654 122 4thQuarter 8,432 453 5,118 2,139 1,263 476 719 1,123 720 – 1,997 615 479 479 98 185 133 1,217 2052016 1stQuarter 8,948 538 4,896 1,709 1,193 566 590 1,118 639 – 3,485 897 830 278 181 229 129 1,160 125 2ndQuarter 6,302 473 4,132 1,637 1,357 613 533 905 1,111 – 2,459 650 981 344 319 266 106 1,211 91 3rdQuarter 8,618 1,206 3,600 1,587 1,151 923 290 1,107 3,035 – 2,728 1,006 902 361 381 401 223 1,206 59 4thQuarter 6,896 737 2,561 1,398 872 1,078 470 570 – 383 2,026 610 615 361 577 236 158 1,773 1152017 1stQuarter 8,290 499 2,110 1,329 618 699 577 642 – 2,703 2,523 650 639 432 196 268 324 1,320 429 2ndQuarter 10,252 597 3,622 1,642 1,330 1,358 608 1,228 – 1,456 2,803 3,371 968 508 262 223 210 1,634 199 3rdQuarter 4,754 415 2,526 1,112 1,418 720 797 859 – 761 3,883 2,240 865 369 178 274 137 900 158 4thQuarter 5,464 357 3,553 1,634 1,343 653 687 601 – 510 8,338 1,352 677 353 407 317 246 1,496 168
Turnover,Rs.'000 2015 1stQuarter 13,137,536 179,517 4,556,916 1,088,339 2,529,918 115,474 136,040 576,059 2,377,344 – 1,780,690 44,090 25,514 33,081 41,075 40,427 68,166 745,142 47,915 2ndQuarter 6,349,311 379,013 4,770,698 720,739 1,663,743 169,756 524,049 369,212 2,056,482 – 2,320,214 343,532 26,360 158,650 38,908 18,959 10,510 834,677 3,535,993 3rdQuarter 9,524,382 956,112 5,116,424 1,996,017 1,848,917 113,683 545,159 1,323,445 1,410,030 – 2,026,911 247,457 37,707 177,077 68,869 53,684 48,460 392,628 1,960,268 4thQuarter 7,749,801 797,085 4,941,382 1,503,091 1,658,124 236,147 366,733 356,634 1,580,284 – 854,570 41,567 10,064 241,582 681,260 8,551 534,744 486,308 206,4642016 1stQuarter 7,767,744 979,593 3,574,777 1,030,087 672,691 439,550 304,726 758,477 552,077 – 1,806,909 55,385 66,215 178,443 284,133 82,522 12,214 204,479 56,289 2ndQuarter 5,653,271 527,131 4,187,088 810,654 1,770,650 133,454 408,350 733,141 1,782,868 – 961,168 28,772 22,498 232,409 396,806 25,605 41,934 205,862 54,421 3rdQuarter 4,803,946 1,109,051 1,764,418 1,351,923 721,055 356,079 43,668 861,393 2,735,528 – 986,513 708,091 15,121 74,629 568,898 5,384 33,540 172,141 48,036 4thQuarter 5,341,351 901,320 3,332,083 1,298,337 1,065,409 238,709 507,475 1,482,170 – 43,045 730,362 102,875 8,891 272,337 404,958 7,531 44,619 726,424 33,7802017 1stQuarter 12,156,702 236,299 1,560,221 1,232,505 1,102,117 624,884 640,899 2,116,625 – 2,393,537 974,758 27,613 7,537 359,449 401,138 10,643 63,009 154,267 102,896 2ndQuarter 17,080,377 533,317 9,354,540 1,475,739 1,566,515 2,726,227 792,562 2,472,184 – 1,463,164 1,954,514 330,120 12,943 186,134 487,988 16,993 67,889 480,947 60,860 3rdQuarter 9,527,330 257,287 2,457,970 818,943 1,826,918 955,699 432,530 1,156,492 – 893,809 1,978,098 709,735 16,198 53,970 356,655 14,840 68,166 58,688 19,978 4thQuarter 7,663,000 312,583 6,873,568 2,371,678 2,112,867 988,892 1,341,282 1,631,623 – 382,125 6,886,015 391,693 9,461 441,730 1,632,914 22,862 158,484 732,545 38,169
No. of Shares Traded,000 2015 1stQuarter 61,680 170 25,541 85,742 11,374 411 60 7,114 10,093 – 6,894 497 505 227 66 97 484 3,403 30 2ndQuarter 31,881 382 28,655 65,131 7,335 478 235 4,614 7,930 – 8,953 3,759 559 1,136 61 47 81 4,050 2,207 3rdQuarter 52,120 1,033 30,250 182,993 8,490 292 268 14,893 4,838 – 7,658 2,306 789 1,054 108 134 342 2,000 1,225 4thQuarter 43,715 804 32,927 137,309 7,721 573 176 4,153 5,767 – 3,393 440 209 1,333 1,088 24 3,821 2,909 1452016 1stQuarter 49,466 986 28,072 99,228 3,423 1,029 151 9,451 2,518 – 7,906 707 1,876 1,068 567 322 94 1,370 39 2ndQuarter 36,378 475 32,232 72,584 8,573 276 180 8,325 8,329 – 4,214 334 551 1,614 947 95 331 1,460 37 3rdQuarter 32,560 1,235 12,885 122,016 3,225 561 19 9,073 10,797 – 3,927 8,455 407 445 1,498 24 265 1,305 37 4thQuarter 35,606 1,050 22,956 120,050 4,723 329 247 14,141 – 716 2,783 1,296 248 1,517 952 41 370 6,130 252017 1stQuarter 86,828 283 11,301 109,537 4,820 799 326 19,994 – 36,778 3,648 435 220 1,827 906 64 455 1,310 77 2ndQuarter 105,774 542 66,452 123,565 6,698 3,185 360 17,588 – 22,197 6,815 3,456 389 898 1,118 100 424 3,968 40 3rdQuarter 56,939 264 17,798 69,335 7,872 1,143 238 8,160 – 13,677 6,782 5,836 537 267 789 96 415 477 14 4thQuarter 49,200 323 48,655 179,709 8,067 1,011 824 12,718 – 6,520 20,481 2,998 318 2,179 3,061 138 897 6,114 28
Price – High (Rs.) 2015 1stQuarter 250.30 1,124.00 194.00 14.30 242.00 300.00 2,390.00 89.90 246.00 – 275.00 97.00 54.90 157.50 654.60 489.00 150.00 232.00 1,949.90 2ndQuarter 214.00 1,050.00 175.00 11.90 239.50 400.00 2,355.00 85.50 296.00 – 272.00 113.00 49.90 145.00 700.00 440.00 140.00 230.00 1,700.00 3rdQuarter 199.00 990.00 175.50 12.10 230.50 425.00 2,160.00 99.80 320.00 – 279.90 116.20 50.90 188.00 680.00 430.00 164.00 206.50 1,580.00 4thQuarter 191.00 1,000.00 162.50 11.60 222.00 440.00 2,240.00 93.00 285.00 – 261.90 102.50 49.50 193.50 660.00 400.00 148.50 183.00 1,500.002016 1stQuarter 179.00 1,042.00 142.00 10.90 211.00 479.00 2,100.00 92.90 245.90 – 253.00 94.50 46.40 189.50 630.00 355.00 142.00 168.00 1,560.00 2ndQuarter 165.00 1,140.00 136.00 11.50 216.60 564.90 2,445.00 95.00 225.00 – 240.00 93.00 45.00 168.90 549.50 300.00 135.00 170.00 1,650.00 3rdQuarter 159.00 1,050.10 144.50 11.60 228.00 690.00 2,410.00 105.50 294.00 – 266.90 92.00 39.80 179.00 435.00 240.00 132.00 140.00 1,440.00 4thQuarter 158.00 900.00 151.90 11.80 235.00 865.00 2,200.20 108.50 – 65.00 268.70 83.90 39.90 195.00 509.90 196.90 140.00 132.40 1,499.902017 1stQuarter 150.00 880.00 148.50 11.60 236.50 835.00 2,100.00 110.00 – 69.50 285.00 79.00 36.70 201.00 495.00 190.00 150.00 124.00 1,599.90 2ndQuarter 180.00 1,030.00 149.00 12.30 250.00 1,000.00 2,310.00 154.90 – 69.50 300.00 114.00 36.00 220.50 475.00 189.00 170.00 133.90 1,720.00 3rdQuarter 179.00 1,005.00 141.00 12.20 244.50 889.90 2,049.90 154.90 – 69.50 311.00 130.00 32.80 210.00 475.00 170.00 170.00 130.00 1,624.70 4thQuarter 166.10 1,005.00 150.00 13.60 271.00 1,029.00 1,740.00 134.90 – 61.00 352.20 145.00 31.90 211.00 598.00 180.00 188.00 138.20 1,597.00
Price – Low (Rs.) 2015 1stQuarter 195.00 999.00 158.10 10.30 192.00 257.00 2,105.00 70.00 210.50 – 235.20 75.00 44.00 136.00 590.00 365.00 127.10 200.00 1,304.00 2ndQuarter 189.90 896.50 160.00 10.30 213.50 275.00 2,000.00 71.00 235.00 – 240.00 76.00 44.00 134.10 601.00 370.00 126.20 199.50 1,460.00 3rdQuarter 167.50 881.00 158.00 10.10 203.00 340.00 1,960.40 78.00 265.00 – 248.10 95.00 43.00 135.20 618.00 372.00 128.10 182.10 1,345.00 4thQuarter 166.00 950.00 139.90 10.50 207.50 380.00 2,000.00 79.50 240.00 – 246.00 90.10 45.00 162.20 590.00 345.00 130.20 155.00 1,342.002016 1stQuarter 140.00 950.00 115.00 9.70 185.00 380.00 1,903.30 72.00 205.00 – 210.00 64.10 31.20 150.00 452.00 212.00 117.00 135.00 1,300.00 2ndQuarter 135.00 1,000.00 121.00 10.10 197.00 400.10 2,030.00 81.00 205.00 – 217.50 71.10 36.70 140.00 372.00 238.00 118.00 126.20 1,340.00 3rdQuarter 135.00 850.00 120.10 10.40 206.00 540.00 2,030.00 85.00 208.00 – 227.60 78.00 35.80 150.00 370.00 183.00 120.00 125.50 1,300.00 4thQuarter 143.00 797.00 138.50 10.10 218.00 613.00 1,975.00 94.60 – 59.00 253.00 70.20 33.30 165.10 380.00 172.00 114.00 116.10 1,200.002017 1stQuarter 133.90 800.00 128.50 10.40 221.00 710.00 1,930.10 95.00 – 54.90 256.00 59.00 32.10 180.00 406.10 150.10 120.00 110.00 1,200.00 2ndQuarter 138.00 865.00 130.50 11.10 220.00 810.00 2,001.00 108.00 – 60.00 253.50 60.50 30.80 183.00 400.00 153.20 142.50 112.00 1,430.00 3rdQuarter 157.90 949.00 134.60 11.10 220.00 740.00 1,699.90 118.00 – 58.00 266.20 107.10 28.00 190.20 410.10 145.10 140.00 118.00 1,350.00 4thQuarter 145.00 934.10 133.00 12.00 236.00 823.00 1,600.00 118.00 – 56.50 305.00 112.00 27.00 192.00 470.00 147.00 170.00 118.30 1,276.00
Maket Capitalisation, Rs. Mn. 2015 1stQuarter 198,899 187,230 134,135 84,695 71,674 28,341 123,300 37,977 72,150 – 42,330 36,400 82,121 30,688 48,008 71,956 23,436 53,762 33,834 2ndQuarter 203,388 168,666 131,580 85,510 69,898 33,264 112,705 46,949 81,000 – 44,681 47,377 79,775 31,562 49,616 78,967 – 52,967 31,518 3rdQuarter 193,476 180,824 130,397 88,767 69,372 36,685 112,754 48,666 82,470 – 44,491 45,904 87,897 38,080 49,600 77,573 24,901 48,486 28,000 4thQuarter 211,829 185,919 115,033 87,138 68,320 40,069 110,110 53,189 73,800 – 42,734 44,669 84,828 42,336 50,400 67,970 25,634 44,563 29,7122016 1stQuarter 176,032 189,553 102,998 83,067 65,741 40,867 108,977 46,147 61,860 – 38,943 34,214 70,029 33,600 36,720 53,024 23,784 36,318 29,960 2ndQuarter 183,508 196,690 101,345 84,695 69,974 52,994 128,941 49,239 62,130 – 40,352 37,066 68,224 34,272 30,400 47,074 21,642 33,667 28,788 3rdQuarter 209,367 161,098 119,935 94,468 74,267 61,177 118,201 59,602 71,130 – 47,130 39,061 69,668 39,200 30,400 36,076 22,521 34,277 27,976 4thQuarter 201,183 151,077 120,852 85,510 74,420 71,318 107,553 56,126 71,130 69,108 46,086 34,452 64,975 43,546 37,200 34,132 22,924 32,474 29,8002017 1stQuarter 191,332 163,140 110,297 92,025 75,694 77,077 112,249 62,256 71,130 68,992 48,223 28,987 60,102 42,045 36,800 32,050 27,263 30,221 31,724 2ndQuarter 248,079 185,451 129,615 97,725 81,087 83,882 109,063 87,763 71,130 79,597 53,325 53,603 57,756 45,024 34,400 31,167 29,296 34,198 31,934 3rdQuarter 321,024 181,891 128,970 98,540 92,178 92,178 91,328 68,312 71,130 68,292 57,440 60,350 52,341 43,008 37,768 29,851 31,127 31,547 28,000 4thQuarter 206,044 188,167 126,554 105,869 97,684 90,278 87,358 72,436 71,130 69,341 68,577 54,696 51,439 44,778 43,200 34,564 32,958 32,554 31,940

MONEY AND CAPITAL MARKETS108
Share Issues 2014 – 2017
Table 9.9
IssueandSector
2014 2015 2016(a) 2017(b)
No. No. No. No.of Shares Value of Shares Value of Shares Value of Shares Value
Issues ’000 Rs.’000 Issues ’000 Rs.’000 Issues ’000 Rs.’000 Issues ’000 Rs.’000
New Listing(c)
Banks,Finance&InsuranceBeverages,Food&TobaccoDiversifiedHoldingsManufacturingLand&PropertyPower&EnergyConstruction&EngineeringHealthcareHotels&Travels
Total
Right Issues
Banks,Finance&InsuranceBeverages,Food&TobaccoChemicals&PharmaceuticalsConstruction&EngineeringDiversifiedHoldingsFootwear&TextilesHotels&TravelsInformationTechnologyInvestmentTrustsLand&PropertyManufacturingMotorsPlantationsPower&EnergyTradingStores&SuppliesServices
Total
Bonus Issues(d)
Banks,Finance&InsuranceBeverages,Food&TobaccoConstruction&EngineeringHotels&TravelsLand&PropertyManufacturingPower&Energy
Total
1 235,712 1,649,987 1 6,630 79,565 3 171,500 1,897,500 – – – 1 62,000 300,000 – – – – – – – – – 1 132,616 397,848 – – – – – – – – – 1 59,861 838,048 – – – – – – 1* 30,685* – 1 16,000 96,000 – – – – – – 1 121,000 960,000 – – – – – – – – – – – – – – – – – – – – – – – – 1 100,000 250,000 – – – – – – – – – – – – – – – – – –
5 506,189 3,281,882 2 106,630 329,565 3 171,500 1,897,500 1 121,000 960,000*
5 711,192 3,262,471 4 702,630 4,275,342 4 817,480 1,013,625 11 1,789,484 42,194,731 – – – – – – – – – – – – – – – – – – – – – – – – – – – 1 53,290 2,398,069 – – – – – – 1 1,860,000 2,325,000 1 57,255 4,122,325 – – – – – – 1 55,398 526,277 – – – – – – – – – 2 160,570 1,798,659 2 137,950 2,101,264 2 98,947 1,517,469 – – – – – – – – – – – – – – – – – – 1 3,993 49,909 – – – – – – – – – 1 44,394 976,666 – – – 1 355,151 7,280,602 1 15,549 186,584 2 234,872 887,696 – – – 1 19 149,328 – – – – – – – – – – – – – – – 1 140,501 1,334,760 – – – 1 10,150 101,500 – – – – – – – – – – – – – – – – – – – – – – – – – – – 1 380 45,562 – – – – – – – – – 1 25 30,008 – – – 1 1,688 877,752
10 2,802,708 8,098,990 15 1,375,290 16,221,603 6 916,427 2,531,094 15 2,156,492 50,603,914
1 6,522 260,910 – – – 2 15,092 – – – – 1 960 – – – – – – – – – – – – 1 182 – – – – – – – – – – – – 1 384 3,847 – – – 1 47,316 – 1 66,825 – 1 238,635 – – – – 1 74,715 –
2 6,906 264,757 1 238,635 – 3 62,409 – 4 142,682 –
(a)Revised
(b)Provisional
(c)Excludingnewlistingswhichwereintroducedbywayofintroductions.
(d)IncludingCapitalisationofReserves.
*OfferforSalenottakentototal
Source:ColomboStockExchange

GOVERNMENT FINANCE109
Summary of Fiscal Operations 2008 – 2017
Table 10.1
Item 2008 2009 2010 2011 2012 2013 2014 2015 2016 2017(a)
Rs.Million
Revenue and Grants
Revenue
Tax Revenue(b)
IncomeTax TaxesonGoodsandServices TaxesonInternationalTrade Other
Non-Tax Revenue
PropertyIncome FeesandCharges Other
Grants
Expenditure and Net Lending
RecurrentExpenditure
ExpenditureonGoodsandServices
o/w;SalariesandWages
InterestPayments
Domestic Foreign
TransferPayments
CapitalExpenditure
AcquisitionofRealAssets CapitalTransfers
LendingminusRepayments
Current Account Surplus (+) / Deficit (-)
Overall Budget Surplus (+) / Deficit (-)
Total Financing
ForeignFinancing(c)
DomesticFinancing
MarketBorrowings Bank Non-Bank
OtherBorrowings
Outstanding Central Government Debt
Domestic
Foreign
RevenueandGrantsTotalExpenditureandNetLendingRecurrentExpenditureCurrentAccountSurplus(+)/Deficit(-)OverallBudgetSurplus(+)/Deficit(-)
686,482 725,566 834,188 983,003 1,067,532 1,153,306 1,204,621 1,460,892 1,693,558 1,839,562
655,259 699,644 817,279 967,862 1,051,460 1,137,447 1,195,206 1,454,878 1,686,062 1,831,531
585,621 618,933 724,747 845,697 908,913 1,005,895 1,050,362 1,355,779 1,463,689 1,670,178
126,541 139,558 135,623 157,310 172,563 205,666 198,115 262,583 258,857 274,562 306,409 272,383 355,366 436,758 457,818 506,906 539,023 724,282 747,147 921,244 112,336 137,260 130,749 162,071 184,634 191,815 198,483 244,231 302,538 311,782 40,335 69,732 103,009 89,558 93,898 101,508 114,741 124,683 155,147 162,591
69,639 80,711 92,532 122,165 142,547 131,552 144,844 99,099 222,374 161,353
27,323 43,991 58,147 71,730 103,669 75,686 73,828 39,055 131,198 67,922 16,592 23,321 19,746 30,891 20,739 37,768 35,499 42,398 68,365 66,635 25,724 13,399 14,621 19,544 18,139 18,098 35,517 17,646 22,811 26,795
31,222 25,922 16,909 15,141 16,071 15,859 9,415 6,014 7,496 8,031
996,126 1,201,927 1,280,205 1,433,182 1,556,499 1,669,396 1,795,865 2,290,394 2,333,883 2,573,056
743,710 879,575 937,094 1,024,906 1,131,023 1,205,180 1,322,898 1,701,658 1,757,782 1,927,693
360,328 379,731 388,286 451,605 487,833 512,624 568,829 772,563 746,250 756,591
239,078 271,229 300,558 319,601 347,747 393,228 440,982 561,730 576,471 588,518
212,475 309,675 352,592 356,699 408,498 444,007 436,395 509,674 610,895 735,566
182,198 273,978 297,127 288,134 317,659 343,022 327,934 394,289 484,182 570,623 30,277 35,698 55,464 68,565 90,839 100,985 108,461 115,386 126,713 164,942
170,908 190,168 196,216 216,602 234,692 248,549 317,674 419,420 400,637 435,536
232,607 277,416 302,087 377,812 400,082 454,303 459,855 588,175 577,036 638,343
128,605 143,590 158,488 217,438 197,350 252,535 252,303 313,260 328,202 360,333 104,002 133,826 143,599 160,374 202,732 201,768 207,551 274,916 248,834 278,010
19,809 44,936 41,025 30,464 25,394 9,913 13,112 561 -934 7,021
-88,450 -179,931 -119,815 -57,044 -79,563 -67,733 -127,692 -246,779 -71,719 -96,162
-309,644 -476,361 -446,017 -450,180 -488,967 -516,090 -591,244 -829,502 -640,325 -733,494
309,644 476,361 446,017 450,180 488,967 516,090 591,244 829,502 640,325 733,494
4,645 230,807 243,788 218,956 286,455 123,700 212,523 236,803 391,914 439,243
314,287 245,554 202,229 231,224 202,511 392,390 378,721 592,699 248,411 294,251
309,669 234,274 191,999 236,021 202,511 379,390 392,084 592,699 248,411 249,574 195,233 49,027 -1,892 191,850 131,527 296,977 126,929 291,841 139,955 187,733 114,437 185,247 193,891 44,171 70,984 82,414 265,155 300,858 108,456 61,841
4,619 11,280 10,230 -4,798 – 13,000 -13,363 – – 44,677
3,588,962 4,161,422 4,590,245 5,133,365 6,000,112 6,793,249 7,390,899 8,503,227 9,387,303 10,313,045
2,140,228 2,400,955 2,565,662 2,804,085 3,232,813 3,832,825 4,277,783 4,959,196 5,341,507 5,594,427
1,448,734 1,760,467 2,024,583 2,329,280 2,767,299 2,960,424 3,113,116 3,544,031 4,045,796 4,718,618
As Per cent of GDP(d)(e)(f)
15.6 15.0 13.0 13.6 12.2 12.0 11.6 13.3 14.2 13.8 22.6 24.9 20.0 19.9 17.8 17.4 17.3 20.9 19.6 19.3 16.9 18.2 14.6 14.2 13.0 12.6 12.8 15.5 14.8 14.5 -2.0 -3.7 -1.9 -0.8 -0.9 -0.7 -1.2 -2.3 -0.6 -0.7 -7.0 -9.9 -7.0 -6.2 -5.6 -5.4 -5.7 -7.6 -5.4 -5.5
Sources: MinistryofFinanceand
MassMedia
CentralBankofSriLanka
(a) Provisional
(b) Includes theamountof taxexemptionsgranted for specifiedprojectsand theamountof taxconcessionsgrantedon importof
vehiclesbypublicservants.
(c) IncludesrupeedenominatedTreasurybondsandTreasurybillsissuedtoforeigninvestors.
(d) From 2003, based on GDP estimates compiled by the Department of Census and Statistics and rebased GDP estimates
(baseyear2010)oftheDepartmentofCensusandStatisticshavebeenusedfrom2010onwards
(e) BasedonrevisedGDPestimatesfor2015and2016madeavailableon20March2018bytheDepartmentofCensusandStatistics.
(f) BasedonrevisedGDPestimatesfor2017madeavailableon18June2018bytheDepartmentofCensusandStatistics.
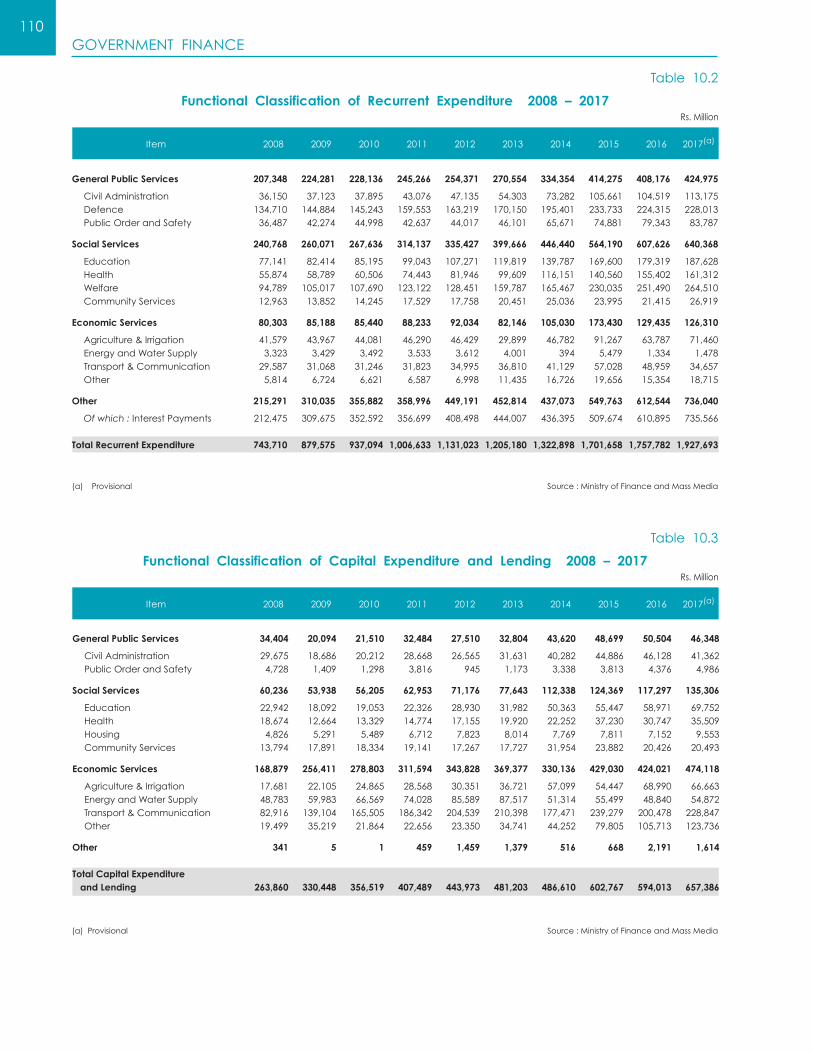
GOVERNMENT FINANCE110
Functional Classification of Recurrent Expenditure 2008 – 2017
Functional Classification of Capital Expenditure and Lending 2008 – 2017
Table 10.2
Table 10.3
Item 2008 2009 2010 2011 2012 2013 2014 2015 2016 2017(a)
Item 2008 2009 2010 2011 2012 2013 2014 2015 2016 2017(a)
Rs.Million
Rs.Million
General Public Services
CivilAdministration Defence PublicOrderandSafety
Social Services
Education Health Welfare CommunityServices
Economic Services
Agriculture&Irrigation EnergyandWaterSupply Transport&Communication Other
Other
Of which :InterestPayments
Total Recurrent Expenditure
207,348 224,281 228,136 245,266 254,371 270,554 334,354 414,275 408,176 424,975
36,150 37,123 37,895 43,076 47,135 54,303 73,282 105,661 104,519 113,175 134,710 144,884 145,243 159,553 163,219 170,150 195,401 233,733 224,315 228,013 36,487 42,274 44,998 42,637 44,017 46,101 65,671 74,881 79,343 83,787
240,768 260,071 267,636 314,137 335,427 399,666 446,440 564,190 607,626 640,368
77,141 82,414 85,195 99,043 107,271 119,819 139,787 169,600 179,319 187,628 55,874 58,789 60,506 74,443 81,946 99,609 116,151 140,560 155,402 161,312 94,789 105,017 107,690 123,122 128,451 159,787 165,467 230,035 251,490 264,510 12,963 13,852 14,245 17,529 17,758 20,451 25,036 23,995 21,415 26,919
80,303 85,188 85,440 88,233 92,034 82,146 105,030 173,430 129,435 126,310
41,579 43,967 44,081 46,290 46,429 29,899 46,782 91,267 63,787 71,460 3,323 3,429 3,492 3,533 3,612 4,001 394 5,479 1,334 1,478 29,587 31,068 31,246 31,823 34,995 36,810 41,129 57,028 48,959 34,657 5,814 6,724 6,621 6,587 6,998 11,435 16,726 19,656 15,354 18,715
215,291 310,035 355,882 358,996 449,191 452,814 437,073 549,763 612,544 736,040
212,475 309,675 352,592 356,699 408,498 444,007 436,395 509,674 610,895 735,566
743,710 879,575 937,094 1,006,633 1,131,023 1,205,180 1,322,898 1,701,658 1,757,782 1,927,693
Source:MinistryofFinanceandMassMedia
Source:MinistryofFinanceandMassMedia
(a) Provisional
(a)Provisional
General Public Services
CivilAdministration PublicOrderandSafety
Social Services
Education Health Housing CommunityServices
Economic Services
Agriculture&Irrigation EnergyandWaterSupply Transport&Communication Other
Other
Total Capital Expenditure and Lending
34,404 20,094 21,510 32,484 27,510 32,804 43,620 48,699 50,504 46,348
29,675 18,686 20,212 28,668 26,565 31,631 40,282 44,886 46,128 41,362 4,728 1,409 1,298 3,816 945 1,173 3,338 3,813 4,376 4,986
60,236 53,938 56,205 62,953 71,176 77,643 112,338 124,369 117,297 135,306
22,942 18,092 19,053 22,326 28,930 31,982 50,363 55,447 58,971 69,752 18,674 12,664 13,329 14,774 17,155 19,920 22,252 37,230 30,747 35,509 4,826 5,291 5,489 6,712 7,823 8,014 7,769 7,811 7,152 9,553 13,794 17,891 18,334 19,141 17,267 17,727 31,954 23,882 20,426 20,493
168,879 256,411 278,803 311,594 343,828 369,377 330,136 429,030 424,021 474,118
17,681 22,105 24,865 28,568 30,351 36,721 57,099 54,447 68,990 66,663 48,783 59,983 66,569 74,028 85,589 87,517 51,314 55,499 48,840 54,872 82,916 139,104 165,505 186,342 204,539 210,398 177,471 239,279 200,478 228,847 19,499 35,219 21,864 22,656 23,350 34,741 44,252 79,805 105,713 123,736
341 5 1 459 1,459 1,379 516 668 2,191 1,614 263,860 330,448 356,519 407,489 443,973 481,203 486,610 602,767 594,013 657,386

GOVERNMENT FINANCE111
Government Revenue 2008 – 2017
Table 10.4
Item 2008 2009 2010 2011 2012 2013 2014 2015 2016 2017(a)
Rs.Million
Tax Revenue
TaxesonForeignTrade Imports PAL/RIDL/SCL/Other(b)
TaxesonDomesticGoods andServices GST/VAT Domestic Imports ExciseTax Liquor Tobacco/Cigarettes Petroleum Other LicenceFees TaxesonNetIncomeandProfits Corporate Non-Corporate TaxesonInterest StampDuty/CessLevy/ SRL/NBT/Other(c)
DebitsTax
Non-Tax Revenue
CurrentRevenue PropertyIncome Rent Interest ProfitsandDividends NationalLottery CentralBankProfitTransfers SocialSecurityContributions FeesandAdministration Charges Other CapitalRevenue(d)
Total
585,621 618,933 724,747 845,697 908,913 1,005,895 1,050,362 1,355,779 1,463,689 1,670,178
112,336 137,260 130,749 162,071 184,634 191,815 198,483 244,231 302,538 311,782 63,844 79,560 64,163 79,811 80,155 83,123 81,108 132,189 156,487 136,501 48,492 57,700 66,685 82,260 104,479 108,692 117,375 112,042 146,051 175,280 306,409 272,383 355,366 436,758 457,818 506,906 539,023 724,282 747,147 921,244 203,646 171,510 219,990 225,858 229,604 250,757 275,350 219,700 283,470 443,760 102,805 103,891 120,412 104,897 109,370 124,440 140,084 130,527 168,134 275,367 100,841 67,620 99,578 120,961 120,234 126,317 135,266 89,173 115,336 168,393 100,970 97,604 129,864 204,822 223,960 250,700 256,691 497,652 454,952 469,500 27,434 28,525 36,654 55,286 60,086 66,008 69,100 105,264 120,238 113,684 37,288 37,601 40,675 49,623 53,563 58,567 57,240 80,015 88,792 86,002 18,977 23,018 28,038 22,470 28,466 27,131 28,732 45,092 55,719 73,983 17,271 8,460 24,497 77,444 81,845 98,994 101,618 267,282 190,203 195,831 1,793 3,269 5,512 6,078 4,254 5,449 6,983 6,929 8,726 7,984 126,541 139,558 135,623 157,310 172,563 205,666 198,115 262,583 258,857 274,562 63,693 66,751 75,208 98,748 91,888 100,649 98,183 162,019 164,592 177,591 23,326 28,229 30,993 24,785 21,413 27,337 30,529 38,152 46,426 45,619 39,522 44,578 29,422 33,776 59,262 77,679 69,402 62,412 47,839 51,351 31,925 61,696 92,165 85,326 93,898 101,508 114,742 124,683 155,147 162,591 8,410 8,036 10,843 4,232 – – – – – –
69,639 80,711 92,532 122,165 142,547 131,552 144,844 99,099 222,374 161,353
69,521 80,633 92,292 121,651 141,716 131,272 127,239 99,001 221,966 161,353 27,323 43,991 58,147 71,730 103,669 75,686 73,828 39,055 131,198 67,922 2,050 1,425 2,048 3,580 2,197 2,331 5,669 2,823 10,980 4,450 9,305 9,043 8,017 9,846 9,488 9,664 7,978 4,498 4,826 7,395 7,365 11,982 31,301 34,351 46,761 35,169 46,814 29,798 108,160 53,998 603 1,542 1,781 1,953 2,223 2,173 1,868 1,936 2,231 2,079 8,000 20,000 15,000 22,000 43,000 26,350 11,500 – 5,000 – 6,791 11,165 11,120 12,628 11,738 15,145 14,919 15,213 18,046 22,940 16,592 23,321 19,746 30,891 20,739 37,768 35,499 42,398 68,365 66,635 18,815 2,156 3,279 6,402 5,570 2,673 2,993 2,334 4,357 3,855 118 78 240 514 831 280 17,604 98 407 –
655,259 699,644 817,279 967,862 1,051,460 1,137,447 1,195,206 1,454,878 1,686,062 1,831,531
(a) Provisional
(b) PortandAirportDevelopmentLevy(PAL),RegionalInfrastructureDevelopmentLevy(RIDL)andSpecialCommodityLevy(SCL)
(c) SocialResponsibilityLevy(SRL)andNationBuildingTax(NBT)
(d) Saleofcapitalgoods
Source:MinistryofFinanceandMassMedia

GOVERNMENT FINANCE112
Central Government Domestic Debt 2008 – 2017
Table 10.5
Item 2008 2009 2010 2011 2012 2013 2014 2015 2016 2017(a)
Rs.Million
By Instruments
RupeeLoans(b)
TreasuryBills(c)
SriLankaDevelopmentBonds CentralBankAdvances TreasuryBonds(d)
Other(e)
Total
By Ownership
BankingSector CentralBank CommercialBanks
Non-BankSector SavingsInstitutions InsuranceFunds ProvidentandPensionFunds(f)
OfficialFunds(g)
PrivateBusinessand Individuals(h)
Other
Total
130,009 112,292 87,709 61,961 58,386 55,518 55,518 24,088 24,088 24,088 402,600 441,032 514,442 590,885 629,070 700,137 694,767 658,240 779,581 697,154 158,805 168,079 173,877 183,845 222,994 369,215 391,083 668,458 572,199 637,886 76,308 73,881 77,879 94,743 111,292 109,167 143,898 151,132 83,307 199,801 1,281,978 1,513,512 1,643,887 1,819,251 2,095,054 2,452,360 2,844,054 3,305,248 3,714,787 3,822,620 90,528 92,160 67,869 53,400 116,017 146,429 148,463 152,031 167,545 212,879
2,140,228 2,400,955 2,565,662 2,804,085 3,232,813 3,832,825 4,277,783 4,959,196 5,341,507 5,594,427
657,425 705,766 691,716 886,221 1,060,317 1,433,773 1,669,882 1,924,036 2,114,901 2,328,544 239,248 109,593 78,376 263,329 265,198 112,396 267,677 256,050 414,950 209,412 418,177 596,172 613,340 622,892 795,119 1,321,377 1,402,205 1,667,986 1,699,951 2,119,133
1,482,804 1,695,189 1,873,945 1,917,864 2,172,495 2,399,053 2,607,901 3,035,160 3,226,606 3,265,883 204,067 257,084 286,514 314,319 330,150 358,243 379,877 428,236 426,771 447,792 25,976 34,490 32,839 34,356 33,768 30,849 30,536 50,597 57,944 72,305 698,192 835,402 884,279 959,303 1,204,729 1,428,534 1,474,560 1,655,336 1,826,633 1,942,739 107,234 132,485 167,374 161,568 178,900 202,118 221,584 252,615 271,630 289,154 443,084 426,177 495,261 447,385 424,015 365,376 500,773 647,807 643,628 513,894 4,251 9,551 7,678 933 933 13,933 570 570 – –
2,140,228 2,400,955 2,565,662 2,804,085 3,232,813 3,832,825 4,277,783 4,959,196 5,341,507 5,594,427
(a) Provisional
(b) Includesthemarketvalueofinvestmentsheldbyjointinvestmentfundonbehalfofthesinkingfunds.
(c) ExcludesoutstandingTreasurybillsheldbyforeigninvestors.
(d) Excludes,(i)rupeedenominatedTreasurybondsheldbyforeigninvestors;(ii)Treasurybondsamounting
toRs.78,447million issuedtosettleduestoCPCinJanuary2012.Duetomaturingofsomeofthose
bonds in January 2017, theoutstandingamount from January 2017was Rs. 56,662million; and (iii)
TreasurybondsamountingtoRs.13,125millionissuedtocapitalizeSriLankanAirlines.
(e) Includes administrative borrowings arising from foreign loans channelled through government or
semi-governmentagenciesandoutstandingborrowingsfromOffshoreBankingUnits(OBUs).
(f) Trusts,Benevolent,PensionandProvidentFundsandtheEmployees’ProvidentFund.
(g) TheCentralGovernment,LocalAuthorities,StateCorporations,Departmentalandotherofficialfunds.
(h) IncludesthevalueofTreasuryCertificatesofDeposits,PublicDebtSinkingFunds(theInvestmentFund
w.e.f.September,1971)andtheNationalHousingSinkingFund.
Sources: MinistryofFinanceandMassMedia
MinistryofNationalPoliciesandEconomicAffairs
CentralBankofSriLanka
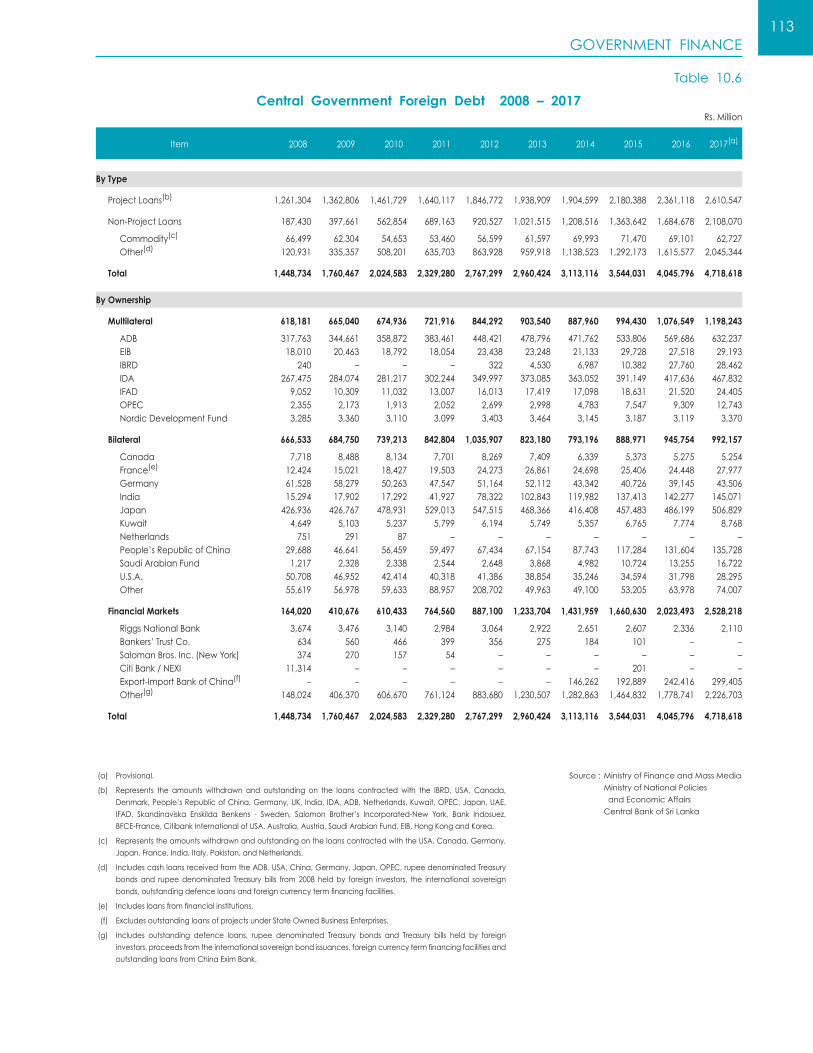
GOVERNMENT FINANCE113
Central Government Foreign Debt 2008 – 2017
Table 10.6
Item 2008 2009 2010 2011 2012 2013 2014 2015 2016 2017(a)
Rs.Million
1,261,304 1,362,806 1,461,729 1,640,117 1,846,772 1,938,909 1,904,599 2,180,388 2,361,118 2,610,547
187,430 397,661 562,854 689,163 920,527 1,021,515 1,208,516 1,363,642 1,684,678 2,108,070
66,499 62,304 54,653 53,460 56,599 61,597 69,993 71,470 69,101 62,727 120,931 335,357 508,201 635,703 863,928 959,918 1,138,523 1,292,173 1,615,577 2,045,344
1,448,734 1,760,467 2,024,583 2,329,280 2,767,299 2,960,424 3,113,116 3,544,031 4,045,796 4,718,618
618,181 665,040 674,936 721,916 844,292 903,540 887,960 994,430 1,076,549 1,198,243
317,763 344,661 358,872 383,461 448,421 478,796 471,762 533,806 569,686 632,237 18,010 20,463 18,792 18,054 23,438 23,248 21,133 29,728 27,518 29,193 240 – – – 322 4,530 6,987 10,382 27,760 28,462 267,475 284,074 281,217 302,244 349,997 373,085 363,052 391,149 417,636 467,832 9,052 10,309 11,032 13,007 16,013 17,419 17,098 18,631 21,520 24,405 2,355 2,173 1,913 2,052 2,699 2,998 4,783 7,547 9,309 12,743 3,285 3,360 3,110 3,099 3,403 3,464 3,145 3,187 3,119 3,370
666,533 684,750 739,213 842,804 1,035,907 823,180 793,196 888,971 945,754 992,157
7,718 8,488 8,134 7,701 8,269 7,409 6,339 5,373 5,275 5,254 12,424 15,021 18,427 19,503 24,273 26,861 24,698 25,406 24,448 27,977 61,528 58,279 50,263 47,547 51,164 52,112 43,342 40,726 39,145 43,506 15,294 17,902 17,292 41,927 78,322 102,843 119,982 137,413 142,277 145,071 426,936 426,767 478,931 529,013 547,515 468,366 416,408 457,483 486,199 506,829 4,649 5,103 5,237 5,799 6,194 5,749 5,357 6,765 7,774 8,768 751 291 87 – – – – – – – 29,688 46,641 56,459 59,497 67,434 67,154 87,743 117,284 131,604 135,728 1,217 2,328 2,338 2,544 2,648 3,868 4,982 10,724 13,255 16,722 50,708 46,952 42,414 40,318 41,386 38,854 35,246 34,594 31,798 28,295 55,619 56,978 59,633 88,957 208,702 49,963 49,100 53,205 63,978 74,007
164,020 410,676 610,433 764,560 887,100 1,233,704 1,431,959 1,660,630 2,023,493 2,528,218
3,674 3,476 3,140 2,984 3,064 2,922 2,651 2,607 2,336 2,110 634 560 466 399 356 275 184 101 – – 374 270 157 54 – – – – – – 11,314 – – – – – – 201 – – – – – – – – 146,262 192,889 242,416 299,405 148,024 406,370 606,670 761,124 883,680 1,230,507 1,282,863 1,464,832 1,778,741 2,226,703
1,448,734 1,760,467 2,024,583 2,329,280 2,767,299 2,960,424 3,113,116 3,544,031 4,045,796 4,718,618
Source:MinistryofFinanceandMassMedia
MinistryofNationalPolicies
andEconomicAffairs
CentralBankofSriLanka
By Type
ProjectLoans(b)
Non-ProjectLoans
Commodity(c)
Other(d)
Total
By Ownership
Multilateral
ADB EIB IBRD IDA IFAD OPEC NordicDevelopmentFund
Bilateral
Canada France(e)
Germany India Japan Kuwait Netherlands People’sRepublicofChina SaudiArabianFund U.S.A. Other
Financial Markets
RiggsNationalBank Bankers’TrustCo. SalomanBros.Inc.(NewYork) CitiBank/NEXI Export-ImportBankofChina(f)
Other(g)
Total
(a) Provisional.
(b) Represents the amounts withdrawn and outstanding on the loans contracted with the IBRD, USA, Canada,
Denmark,People’sRepublicofChina,Germany,UK, India, IDA,ADB,Netherlands,Kuwait,OPEC,Japan,UAE,
IFAD, Skandinaviska Enskilda Benkens - Sweden, Salomon Brother’s Incorporated-New York, Bank Indosuez,
BFCE-France,CitibankInternationalofUSA,Australia,Austria,SaudiArabianFund,EIB,HongKongandKorea.
(c) RepresentstheamountswithdrawnandoutstandingontheloanscontractedwiththeUSA,Canada,Germany,
Japan,France,India,Italy,Pakistan,andNetherlands.
(d) IncludescashloansreceivedfromtheADB,USA,China,Germany,Japan,OPEC,rupeedenominatedTreasury
bonds and rupeedenominated Treasury bills from 2008 held by foreign investors, the international sovereign
bonds,outstandingdefenceloansandforeigncurrencytermfinancingfacilities.
(e) Includesloansfromfinancialinstitutions.
(f) ExcludesoutstandingloansofprojectsunderStateOwnedBusinessEnterprises.
(g) Includes outstanding defence loans, rupee denominated Treasury bonds and Treasury bills held by foreign
investors,proceedsfromtheinternationalsovereignbondissuances,foreigncurrencytermfinancingfacilitiesand
outstandingloansfromChinaEximBank.

GOVERNMENT FINANCE114
Revenue and Expenditure of Provincial Councils(a)
Table 10.7
Item Western Central Southern Northern EasternNorth
WesternNorthCentral
UvaSabara-gamuwa
Total
Revenue and Expenditure
Receipts GrantfromtheCentralGovt. Revenue
Total
Expenditure Recurrent(IncludingLocalGovt.) CapitalExpenditure(b)
Total
Receipts GrantfromtheCentralGovt. Revenue
Total
Expenditure Recurrent(IncludingLocalGovt.) CapitalExpenditure(b)
Total
Receipts GrantfromtheCentralGovt. Revenue
Total
Expenditure Recurrent(IncludingLocalGovt.) CapitalExpenditure(b)
Total
Analysis of Revenue Collection
TurnoverTax(c)
ExciseDutyonLiquor(d)
LicenceFee–VehiclesLicenceFee–OthersProfitandDividendsOther
Sub Total
StampDuty
Total
TurnoverTax(c)
ExciseDutyonLiquor(d)
LicenceFee–VehiclesLicenceFee–OthersProfitandDividendsOther
Sub Total
StampDuty
Total
TurnoverTax(c)
ExciseDutyonLiquor(d)
LicenceFee–VehiclesLicenceFee–OthersProfitandDividendsOther
Sub Total
StampDuty
Total
2015 21,128 25,432 23,449 18,108 18,937 23,384 15,833 17,962 20,848 185,082 35,607 6,027 6,104 2,219 2,705 6,384 2,818 2,727 3,381 67,972
56,736 31,459 29,553 20,327 21,642 29,768 18,651 20,689 24,229 253,053
49,434 27,998 25,637 18,373 19,886 26,598 14,848 18,590 20,858 222,223 4,654 1,513 2,025 1,798 1,393 1,649 1,980 1,824 3,351 20,187
54,088 29,511 27,662 20,171 21,279 28,247 16,829 20,414 24,209 242,410
2016 23,344 24,866 22,118 19,068 18,971 22,688 16,124 17,937 19,555 184,691 41,203 6,874 6,630 3,115 3,316 7,383 3,592 3,297 4,186 79,585
64,547 31,760 28,748 22,183 22,287 30,070 19,716 21,234 23,741 264,276
54,325 29,300 28,199 19,313 20,276 28,017 16,732 19,386 22,116 237,664 6,218 2,665 3,556 2,772 1,954 1,951 3,121 2,284 3,497 28,016
60,544 31,964 31,755 22,084 22,230 29,968 19,853 21,670 25,613 265,680
2017 16,091 25,420 23,977 21,304 21,420 24,631 16,688 18,840 21,747 190,117 44,498 7,382 8,171 3,583 3,699 8,092 3,822 3,487 4,242 86,976
60,589 32,802 32,149 24,887 25,119 32,723 20,510 22,327 25,989 277,094
52,651 30,355 27,548 20,438 22,052 28,527 17,030 20,069 22,668 241,338 7,158 1,477 5,430 3,659 2,749 2,806 3,012 2,911 4,539 33,742
59,810 31,832 32,978 24,097 24,800 31,333 20,042 22,980 27,207 275,080
2015
42 8 3 – – 1 9 2 384 448 723 416 171 – 50 164 58 126 113 1,820 3,751 806 945 283 335 1,131 488 347 626 8,711 – 4 3 – – – … … … 6 – – – – – – – – – – 14,204 2,582 2,824 1,456 1,527 2,833 1,675 1,552 1,332 29,986
18,720 3,816 3,946 1,738 1,912 4,129 2,229 2,027 2,455 40,972
16,887 2,212 2,158 481 793 2,255 589 699 926 27,000
35,607 6,027 6,104 2,219 2,705 6,384 2,818 2,727 3,381 67,972
2016
29 5 2 – – 3 1 2 2 44 812 431 197 42 82 155 67 119 124 2,028 3,869 851 612 305 455 1,234 535 387 672 8,921 – 5 2 – – – ... ... ... 7 – – – – – – – – – – 16,240 2,992 3,052 2,237 1,820 3,266 2,253 1,938 2,239 36,038
20,951 4,284 3,864 2,585 2,357 4,659 2,856 2,456 3,037 47,038
20,252 2,590 2,766 530 959 2,723 736 841 1,149 32,547
41,203 6,874 6,630 3,115 3,316 7,383 3,592 3,287 4,186 79,585
2017
16 3 1 – – 4 1 3 1 29 659 367 142 47 101 141 75 102 96 1,731 3,988 901 1,176 324 464 1,295 570 420 712 9,849 – 13 2 – – – … … – 15 – – – – – – – – – – 19,966 3,688 4,191 2,808 2,184 4,066 2,454 2,201 2,350 43,909
24,629 4,972 5,512 3,180 2,749 5,506 3,101 2,726 3,159 55,533
19,869 2,410 2,659 404 950 2,586 721 761 1,083 31,443
44,498 7,382 8,171 3,583 3,699 8,092 3,822 3,487 4,242 86,976
(a) AsatendDecember. (b) IncludesCriteriaBasedGrants(CBG)andProjectSpecificDevelopmentGrants(PSDG). (c) Turnovertaxcalculationisbeenterminatedasperthe2011budgetproposals. Thisaccountstothearrearsescollectedfor2010. (d) IncludingLicenceFee–Liquor…Negligible
Source : MinistryofLocalGovernmentand ProvincialCouncils
Rs.Million

BANKING AND FINANCIAL INSTITUTIONS115
Assets and Liabilities of the Central Bank 2008 – 2017
Table 11.1
Item 2008 2009 2010 2011 2012 2013 2014 2015 2016 2017(a)
(a)Provisional
(b)Revised
Source :CentralBankofSriLanka
Rs.Million
ASSETS
InternationalReserves
CashandBankBalancesAbroad (includingTreasurybills)
ForeignGovernmentand Non-GovernmentSecurities
SpecialDrawingRights
IMFRelatedAssets
Receivable
LoansandAdvances
ToGovernment ToOthers
GovernmentandGovernment GuaranteedSecurities
OtherAssetsandAccounts
LIABILITIES
Capital
CurrencyIssued
NotesinCirculation CoinsinCirculation
Deposits
Government CommercialBanks Govt.AgenciesandInstitutions InternationalOrganisations, ForeignGovernments& ForeignBankingInstitutions Other
SecuritiesOutstanding
BorrowingsAbroad
OtherLiabilitiesandAccounts
598,370 821,873 985,407 1,141,717 1,284,448 1,246,012(b) 1,464,295 1,426,259 1,529,210 1,604,834
325,439 685,659 862,534 838,607 965,910 1,058,355 1,129,975 1,126,674 1,049,800 1,328,413
158,193(b) 232,705 243,672 360,508 327,749 541,148 603,773 666,961 548,126 601,551
94,721 376,411 547,591 404,983 554,219 431,703 446,262 376,041 378,427 596,218
221 2,286 273 502 491 2,032 1,200 970 303 677
72,179 74,223 70,926 72,588 80,861 83,369 78,616 82,666 116,705 126,161
125 33 72 26 2,590 104 124 36 6,238 3,807
77,885 75,017 80,339 97,057 113,136 110,542 145,387 152,018 83,791 200,025
76,308 73,881 77,879 94,743 111,292 109,167 143,898 151,132 83,307 199,801 1,577 1,137 2,460 2,314 1,844 1,375 1,489 886 484 224
142,274 37,451 2,098 169,797 168,237 5,252 6,078 79,217 330,043 25,576
52,772(b) 23,746 40,436 36,257 37,165 71,863(b) 182,855 68,349 65,577 50,819
598,370 821,873 985,407 1,141,717 1,284,448 1,246,012(b) 1,464,295 1,426,259 1,529,210 1,604,834
25,000 25,000 25,000 25,000 35,000 35,000 50,000 50,000 50,000 50,000 186,099 217,430 255,652 293,233 318,060 339,771 416,895 491,700 552,778 598,054
181,307 212,173 249,977 287,080 311,152 332,382 408,773 481,969 541,460 585,328 4,792 5,257 5,675 6,153 6,908 7,389 8,122 9,731 11,318 12,726 260,859 361,918 465,017 646,615 736,446 678,469 603,314 732,662 794,927 824,353
1,231 2,326 3,083 1,797 686 411 305 423 333 297 82,311 86,086 104,853 146,269 166,288 148,810 161,009 181,727 303,251 341,712 15 22 6 2 14 5 7 5 118 27 177,295 273,481 357,069 498,543 569,454 529,238 441,987 550,504 491,221 482,312 7 3 6 4 4 5 5 3 4 4
– 78,023 95,055 – – – – – – –
– – – – – – – – – –
126,413 139,502 144,682 176,869 194,941 192,772 394,086 151,897 131,505 132,426

BANKING AND FINANCIAL INSTITUTIONS116
Selected Financial Highlights of Licensed Commercial Banks 2013 – 2017(a)
Table 11.2
Item 2013 2014 2015 2016(a) 2017(b)
Rs.Million
Profit and Loss Account
Total income InterestIncome Non-interestIncome Total expenses Interestexpenses Non-interestexpenses Net Interest Income Profits Before Taxations and Provisions TotalProvisions Operating Profits/Losses on Ordinary Activities Before Taxes Profits After Tax
Balance Sheet Items
Total Assets Cash and Due from Banks CashandShort-termFunds BalanceswithCentralBank PlacementwithBanks,FinancialInstitutes andOwnHeadOffice Investments TreasuryBills TreasuryBonds OtherGovernmentSecurities InvestmentinAssociatesandSubsidiaries OtherInvestments Loans and Advances (Net of IIS and Provisions) GrossLoansandAdvances InterestinSuspense(IIS) GrossLoansandAdvances(NetofIIS) LoanLossProvisions–Total Specific Provisions General Provisions NetLoans(NetofIISandProvisions) Fixed Assets Other Assets
Total Liabilities (Including Equity) Deposits RupeeDeposits ForeignCurrencyDeposits Borrowings LKRBorrowings ForeignCurrencyBorrowings Other Liabilities Equity Capital and Reserves ShareCapital/AssignedCapital/Paid-upCapital StatutoryReserveFund TotalOtherReserves Off Balance Sheet Exposures Contingencies Commitments ContraAccounts
Liquidity TotalLiquidAssets(DBUOperationsOnly) StatutoryLiquidityRatio%(DBUOperationsOnly)
Capital Adequacy CommonEquityTierI(CETI)Capital TotalTier1Capital TotalCapitalBase
CommonEquityTier1(CET1)CapitalRatio,% TotalTier1CapitalRatio,% TotalCapitalRatio,%
Assets Quality GrossNPLRatio(NetofIIS),% NetNPLRatio(NetofIISandProvisions),%
SpecificProvisionCoverageRatio,% TotalProvisionsCoverageRatio,%
Earnings ReturnonAssets(BeforeTax),% ReturnonAssets(AfterTax),% ReturnonEquity(AfterTax),% InterestMargin,%
(a)Revised(b)Provisionaln.a.–Notavailable
676,936 659,850 688,809 860,358 1,094,182 591,156 561,809 591,331 757,486 971,871 85,780 98,041 97,478 102,872 122,311 536,716 500,645 503,727 650,415 835,063 394,747 340,461 325,235 453,185 630,247 141,969 160,184 178,492 197,230 204,816 196,409 221,348 266,096 304,301 341,624 140,220 159,205 185,082 209,943 259,119 18,433 10,690 19,058 10,726 19,623 121,787 148,515 166,023 199,217 239,496 74,595 88,005 97,124 116,495 138,918
5,941,473 6,971,832 8,077,474 9,046,583 10,292,397 590,606 936,801 807,917 988,082 1,022,595 290,408 557,270 330,197 364,823 354,507 150,765 164,327 190,765 296,282 339,248
149,433 215,205 286,954 326,978 328,840 1,719,197 1,953,237 2,367,810 2,291,323 2,576,672 529,780 447,597 443,834 293,329 506,270 721,080 994,636 1,144,029 1,285,286 1,291,860 364,344 394,158 633,767 572,977 639,671 24,246 25,689 20,213 20,790 22,288 800,826 1,085,793 1,269,995 1,404,226 1,408,443 3,349,325 3,810,652 4,620,046 5,438,604 6,318,684 3,566,188 4,022,838 4,839,334 5,686,828 6,592,546 139,630 128,293 124,044 146,076 161,626 3,426,558 3,894,545 4,715,290 5,540,751 6,430,920 77,233 83,893 95,245 102,148 112,236 62,080 65,683 71,619 74,150 79,726 15,152 18,210 23,626 27,998 32,510 3,349,325 3,810,652 4,620,046 5,438,604 6,318,684 67,530 78,306 90,050 98,052 110,694 214,814 192,835 191,652 230,522 263,753
5,941,473 6,971,832 8,077,474 9,046,583 10,292,397 4,169,520 4,686,306 5,403,131 6,295,559 7,399,006 3,489,550 3,914,396 4,471,076 5,254,085 6,230,629 679,970 771,910 932,055 1,041,474 1,168,377 1,015,391 1,448,209 1,758,389 1,696,414 1,607,062 359,562 582,730 679,969 665,760 599,826 655,829 865,479 1,078,421 1,030,654 1,007,236 266,951 268,807 279,227 347,326 419,625 489,611 568,511 636,727 707,285 866,704 138,692 163,657 165,692 185,402 246,915 22,963 26,153 29,628 34,502 42,255 327,956 378,701 441,407 487,381 577,535 3,064,778 3,228,916 3,455,573 7,258,154 3,997,673 2,244,189 2,171,108 2,271,576 5,973,241 2,633,406 730,206 937,514 1,092,437 1,185,251 1,240,530 90,383 120,293 91,560 99,661 123,736
1,704 1,913 1,946 2,139 2,578 37.7 39.5 33.9 29.9 31.3
n.a. n.a. n.a. n.a. 706,234 438,271 513,527 559,966 636,755 706,228 517,844 600,993 661,315 790,189 870,557
n.a. n.a. n.a. n.a. 12.4 14.9 14.7 13.0 12.6 12.4 17.6 17.2 15.4 15.6 15.2
5.6 4.2 3.2 2.6 2.5 3.4 2.1 1.2 0.7 0.8
32.5 39.7 46.9 52.1 49.6 40.4 50.7 62.3 71.8 69.9
1.9 2.0 1.9 1.9 2.0 1.3 1.4 1.3 1.4 1.4 16.0 16.6 16.2 17.3 17.6 3.5 3.5 3.6 3.6 3.5
Source :CentralBankofSriLanka

BANKING AND FINANCIAL INSTITUTIONS117
(a)Provisional
Note:Datarefertooperationsofdomesticbankingunitsonly.
Assets and Liabilities of Commercial Banks 2008 – 2017
Table 11.3
Item 2008 2009 2010 2011 2012 2013 2014 2015 2016 2017(a)
Source :CentralBankofSriLanka
Rs.Million
31,076 35,590 39,104 50,362 66,522 75,164 87,469 103,643 123,276 158,658
84,432 88,047 107,705 149,711 169,466 151,200 164,428 199,646 308,671 341,828
21,649 18,800 11,474 51,390 49,840 25,568 43,810 80,582 74,813 78,804
12,799 27,893 6,066 21,866 35,890 25,762 14,831 17,591 20,289 24,048
197,624 236,081 191,240 159,567 155,013 108,503 196,950 359,740 432,933 525,901
249,665 476,507 538,474 517,045 648,725 980,866 1,063,638 1,189,962 1,282,031 1,567,654
75,642 144,393 205,405 175,644 200,718 398,394 262,049 325,001 227,517 428,452 144,093 221,798 198,195 283,750 389,824 514,241 718,972 741,493 937,305 1,022,461 29,930 110,316 134,874 57,651 58,183 68,231 82,616 123,468 117,209 116,741
1,146,442 1,137,416 1,454,619 1,905,732 2,305,613 2,547,661 2,776,488 3,477,653 4,205,719 4,890,777
36,081 30,376 29,574 31,021 34,655 45,008 42,580 19,029 20,063 24,711 286,702 246,205 338,357 373,762 495,973 489,383 531,878 605,893 707,018 864,011 823,659 860,834 1,086,687 1,500,949 1,774,985 2,013,271 2,202,030 2,852,731 3,478,638 4,002,056
204,254 210,022 218,055 302,005 326,301 413,542 508,326 269,706 234,850 237,169
1,947,940 2,230,356 2,566,737 3,157,677 3,757,370 4,328,266 4,855,940 5,698,522 6,682,581 7,824,839
183,183 191,017 237,814 313,334 375,920 444,945 528,661 608,898 716,963 850,931
153,687 184,283 235,981 243,451 243,735 272,753 339,458 389,293 405,152 425,822
3,068 5,124 6,920 9,856 14,865 22,321 11,629 9,540 8,923 16,193 23,297 20,396 34,607 33,691 25,398 24,754 34,441 44,182 41,661 46,843 122,285 154,849 190,637 195,835 198,496 219,966 282,722 326,926 347,005 353,876 5,037 3,914 3,817 4,069 4,976 5,713 10,667 8,645 7,563 8,910
1,256,881 1,488,603 1,718,996 2,117,734 2,554,485 2,980,394 3,301,517 3,901,124 4,672,937 5,566,871
4,087 7,063 14,851 30,840 54,401 26,422 30,513 29,150 16,419 27,973 1,004,871 1,200,045 1,405,808 1,753,896 2,143,136 2,574,215 2,848,402 3,342,224 4,046,935 4,872,014 247,923 281,495 298,337 332,998 356,948 379,757 422,601 529,750 609,584 666,884
124,942 103,329 112,825 167,017 217,952 239,441 283,758 377,930 418,504 417,328
107,054 88,998 99,473 147,275 142,492 127,460 145,315 182,212 206,131 254,942 17,889 14,331 13,351 19,742 75,460 111,981 138,443 195,717 212,374 162,385
229,247 263,124 261,121 316,141 365,278 390,732 402,545 421,277 469,025 563,888
1,947,940 2,230,356 2,566,737 3,157,677 3,757,370 4,328,266 4,855,940 5,698,522 6,682,581 7,824,839
ASSETS
CashinHand
DuefromCentralBank
DuefromDomesticBanks
CashItemsinProcessofCollection
ForeignCurrencyonHandand BalancesduefromBanksAbroad
Investments
Treasurybills GovernmentSecurities Other
LoansandAdvances
BillsPurchasedandDiscounted Overdrafts Loans
FixedandOtherAssets
Total
LIABILITIES
Paid-upCapital,ReserveFundsandUndistributedProfits
DemandDeposits
InterBanks Govt.ofSriLanka Residents NonResidents
TimeandSavingsDeposits
Govt.ofSriLanka Residents NonResidents
Borrowings
DomesticInterBanks Foreign
OtherLiabilities
Total

BANKING AND FINANCIAL INSTITUTIONS118
Deposits of Commercial Banks by Ownership 2013 – 2017
Table 11.5
Item
2013 2014 2015 2016 2017
DemandDeposits
Time&SavingsDeposits
DemandDeposits
Time&SavingsDeposits
DemandDeposits
Time&SavingsDeposits
DemandDeposits
Time&SavingsDeposits
DemandDeposits
Time&SavingsDeposits
(a)IncludesInterbankDeposits.(b)From2011onwardsCertificatesofDepositsarereportedunderothercategoriesbasedontheirownership.
Source :CentralBankofSriLanka
Rs.Million
Government
FinancialInstitutions(a)
Plantation
Trading
Manufacturing
OtherBusinessInstitutions
Non-BusinessInstitutions
Individuals
LocalGovernmentand ProvincialCouncils
CertificatesofDeposits(b)
ForeignCurrencyDeposits
Total
24,754 26,422 34,441 30,513 44,182 29,150 41,661 16,419 46,843 27,973
14,112 81,296 18,189 78,243 21,197 72,337 21,381 70,830 22,563 166,064
2,846 5,987 3,396 6,156 3,670 7,839 3,553 7,370 8,440 11,706
20,640 42,563 25,012 48,169 29,205 46,823 28,228 55,198 32,501 67,124
15,125 28,504 19,299 35,739 15,779 45,846 18,368 61,211 16,297 69,224
79,327 304,077 95,115 289,477 98,808 318,190 102,345 435,570 115,186 541,053
26,205 128,343 29,229 120,708 31,094 124,977 31,348 161,684 29,847 149,023
76,818 1,968,451 92,725 2,240,810 110,696 2,618,366 115,793 3,111,058 122,145 3,642,324
12,413 17,373 14,633 17,404 16,344 15,207 20,553 16,247 18,035 11,174
– – – – – – – – – –
19,394 480,572 29,871 521,453 33,778 652,247 40,726 735,307 40,369 816,303
291,634 3,083,588 361,910 3,388,672 404,753 3,930,982 423,956 4,670,895 452,224 5,501,968
Mobilization of Deposits by Type of Deposit 2013 – 2017
Table 11.4
ItemRupeesMillion PercentageShare
2013 2014 2015 2016(a) 2017(a) 2013 2014 2015 2016(a) 2017(a)
Demand Deposits
LicensedCommercialBanks Savings Deposits
LicensedCommercialBanks LicensedSpecialisedBanks LicensedFinanceCompanies Thrift&Credit Co-operativeSocieties Co-operativeRuralBanks
Time Deposits
LicensedCommercialBanks LicensedSpecialisedBanks LicensedFinanceCompanies Thrift&Credit Co-operativeSocieties Co-operativeRuralBanks
Total(b)
296,548 380,970 446,448 479,202 496,010 6.63 7.55 7.67 7.07 6.18
1,162,817 1,519,193 1,794,032 1,926,016 2,114,111 25.99 30.09 30.80 28.43 26.34
974,164 1,282,186 1,518,521 1,627,851 1,779,045 21.78 25.40 26.07 24.02 22.16 143,608 179,425 211,073 230,256 253,293 3.21 3.55 3.62 3.40 3.16 8,563 16,984 22,568 22,184 30,014 0.19 0.34 0.39 0.33 0.37 2,665 2,839 1,203 3,225 5,820 0.06 0.06 0.02 0.05 0.07 33,816 37,759 40,666 42,500 45,939 0.76 0.75 0.70 0.63 0.57
3,014,316 3,148,426 3,583,894 4,370,522 5,416,291 67.38 62.36 61.53 64.50 67.48
2,170,548 2,180,149 2,531,020 3,200,730 3,985,888 48.52 43.18 43.46 47.24 49.66 467,244 523,884 548,497 611,719 718,422 10.44 10.38 9.42 9.03 8.95 328,062 396,468 457,486 507,688 655,670 7.33 7.85 7.85 7.49 8.17 2,923 1,044 401 1,075 n.a. 0.07 0.02 0.01 0.02 – 45,539 46,881 46,490 49,310 56,311 1.02 0.93 0.80 0.73 0.70
4,473,681 5,048,589 5,824,374 6,775,740 8,026,412 100.00 100.00 100.00 100.00 100.00
(a)Provisional(b)Demand,Savings&TimeDepositsofallinstitutions.n.a.–Notavailable
Sources:Co-operativeDevelopmentDepartment SanasaFederation CentralBankofSriLanka

BANKING AND FINANCIAL INSTITUTIONS119
Commercial Banks’ Loans and Advances to the Private Sector(a)(b)
Table 11.6
Item Dec.2013 Dec.2014 Dec.2015(c) Dec.2016(c) Dec.2017(d)
Rs.Million
1. Agriculture and Fishing
of which,
Tea Rubber Coconut Paddy VegetableandFruitCultivation,andMinorFoodCrops LivestockandDairyFarming Fisheries 2. Industry
of which,
Construction
of which, PersonalHousingincluding Purchasing/Construction/Repairs StaffHousing
FoodandBeverages TextilesandApparel WoodandWoodProductsincludingFurniture PaperandPaperProducts Chemical,Petroleum,Pharmaceuticaland HealthcareandRubberandPlasticProducts Non-MetallicMineralProducts BasicMetalProducts FabricatedMetalProducts,Machineryand TransportEquipment ManufacturedProducts(notspecifiedelsewhere) 3. Services
of which,
WholesaleandRetailTrade Tourism FinancialandBusinessServices Transport CommunicationandInformationTechnology PrintingandPublishing Education Health Shipping,AviationandFreightForwarding 4. Personal Loans and Advances(e)
of which,
ConsumerDurables Pawning CreditCards PersonalEducation PersonalHealthcare Other 5. Total
304,922 287,292 308,950 361,463 412,371
54,303 68,543 72,707 82,435 91,048 18,906 20,754 18,459 23,803 24,432 7,010 7,821 12,234 16,261 20,444 14,783 16,852 19,004 28,947 32,594 14,720 16,441 20,022 25,093 29,336 8,246 11,221 14,432 15,387 21,502 10,374 11,707 11,022 14,045 17,504 899,620 1,118,034 1,397,487 1,707,466 2,041,423
384,160 469,764 639,240 811,249 993,450
174,633 224,829 306,252 389,440 472,969 50,253 55,983 64,563 69,077 72,981
60,572 71,072 85,372 95,334 105,135 105,960 148,528 129,884 159,358 174,671 7,156 8,153 14,474 14,911 17,980 8,377 7,573 11,260 13,336 17,418 37,038 51,094 76,174 76,706 90,476 8,299 10,786 14,994 16,645 24,092 12,140 12,704 19,040 23,610 30,991 85,988 101,003 124,892 148,762 170,257 8,363 10,898 14,513 19,366 21,660 616,628 709,311 950,916 1,287,626 1,393,900
233,835 230,826 273,033 387,271 435,796 62,986 76,757 102,908 138,726 171,975 117,705 147,513 217,593 308,134 306,533 28,373 31,376 53,983 64,603 71,755 24,243 40,567 50,049 61,881 60,455 11,162 12,982 15,742 18,512 22,545 5,355 5,380 7,134 9,378 10,752 10,229 15,386 25,194 30,454 34,731 14,238 13,926 13,248 28,097 19,190 713,816 651,608 771,128 888,561 1,053,177
74,920 92,015 143,517 198,146 210,206 292,873 172,699 133,418 132,408 148,411 52,789 57,520 64,641 75,947 91,451 1,033 1,760 2,223 2,322 2,920 1,236 2,062 3,300 3,516 3,979 259,573 293,542 378,535 443,063 556,633 2,534,986 2,766,246 3,428,481 4,245,116 4,900,870
Source :CentralBankofSriLanka.(a) BasedontheQuarterlySurveyofCommercialBank’sLoansandAdvancestothePrivateSector,whichincludesloansandadvancesofbothDBUsandOBUsofcommercialbanks.
(b) Includesloans,overdrafts,billsdiscountedandpurchased,andexcludescashitemsintheprocessofcollection.
(c) Revised(d) Provisional(e) Excludespersonalhousingloans,whichhavebeenincludedunder‘Construction’classified
under‘industry‘andincludesSafetyNetSchemerelatedloans.
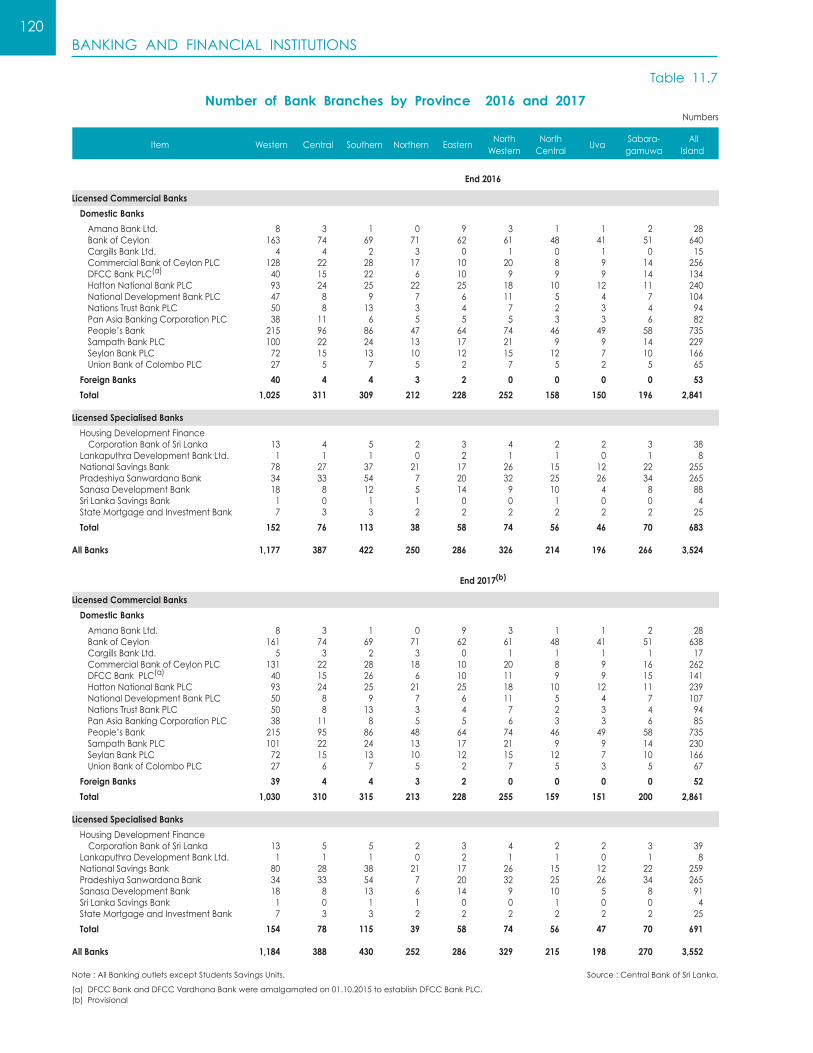
BANKING AND FINANCIAL INSTITUTIONS120
Number of Bank Branches by Province 2016 and 2017
Table 11.7
Item Western Central Southern Northern EasternNorth
WesternNorthCentral
UvaSabara-gamuwa
AllIsland
Numbers
Licensed Commercial Banks
Domestic Banks
AmanaBankLtd. BankofCeylon CargillsBankLtd. CommercialBankofCeylonPLC DFCCBankPLC(a)
HattonNationalBankPLC NationalDevelopmentBankPLC NationsTrustBankPLC PanAsiaBankingCorporationPLC People’sBank SampathBankPLC SeylanBankPLC UnionBankofColomboPLC
Foreign Banks
Total
Licensed Specialised Banks
HousingDevelopmentFinance CorporationBankofSriLanka LankaputhraDevelopmentBankLtd. NationalSavingsBank PradeshiyaSanwardanaBank SanasaDevelopmentBank SriLankaSavingsBank StateMortgageandInvestmentBank
Total
All Banks
Note:AllBankingoutletsexceptStudentsSavingsUnits.
(a)DFCCBankandDFCCVardhanaBankwereamalgamatedon01.10.2015toestablishDFCCBankPLC.(b)Provisional
Source :CentralBankofSriLanka.
End 2016
8 3 1 0 9 3 1 1 2 28 163 74 69 71 62 61 48 41 51 640 4 4 2 3 0 1 0 1 0 15 128 22 28 17 10 20 8 9 14 256 40 15 22 6 10 9 9 9 14 134 93 24 25 22 25 18 10 12 11 240 47 8 9 7 6 11 5 4 7 104 50 8 13 3 4 7 2 3 4 94 38 11 6 5 5 5 3 3 6 82 215 96 86 47 64 74 46 49 58 735 100 22 24 13 17 21 9 9 14 229 72 15 13 10 12 15 12 7 10 166 27 5 7 5 2 7 5 2 5 65
40 4 4 3 2 0 0 0 0 53
1,025 311 309 212 228 252 158 150 196 2,841
13 4 5 2 3 4 2 2 3 38 1 1 1 0 2 1 1 0 1 8 78 27 37 21 17 26 15 12 22 255 34 33 54 7 20 32 25 26 34 265 18 8 12 5 14 9 10 4 8 88 1 0 1 1 0 0 1 0 0 4 7 3 3 2 2 2 2 2 2 25
152 76 113 38 58 74 56 46 70 683
1,177 387 422 250 286 326 214 196 266 3,524
End 2017(b)
8 3 1 0 9 3 1 1 2 28 161 74 69 71 62 61 48 41 51 638 5 3 2 3 0 1 1 1 1 17 131 22 28 18 10 20 8 9 16 262 40 15 26 6 10 11 9 9 15 141 93 24 25 21 25 18 10 12 11 239 50 8 9 7 6 11 5 4 7 107 50 8 13 3 4 7 2 3 4 94 38 11 8 5 5 6 3 3 6 85 215 95 86 48 64 74 46 49 58 735 101 22 24 13 17 21 9 9 14 230 72 15 13 10 12 15 12 7 10 166 27 6 7 5 2 7 5 3 5 67
39 4 4 3 2 0 0 0 0 52
1,030 310 315 213 228 255 159 151 200 2,861
13 5 5 2 3 4 2 2 3 39 1 1 1 0 2 1 1 0 1 8 80 28 38 21 17 26 15 12 22 259 34 33 54 7 20 32 25 26 34 265 18 8 13 6 14 9 10 5 8 91 1 0 1 1 0 0 1 0 0 4 7 3 3 2 2 2 2 2 2 25
154 78 115 39 58 74 56 47 70 691 1,184 388 430 252 286 329 215 198 270 3,552

BANKING AND FINANCIAL INSTITUTIONS121
Bank Branches and Banking Density by District – 2017(a)
Table 11.8
District
DomesticCommercialBanks LicensedSpecialisedBanks
AmanaBankLtd.
BankofC
eylon
CargillsBa
nkLtd.
CommercialBankofC
eylonPLC
DFC
CBankPLC(b)
HattonNationalBankPLC
NationsTrustBankPLC
NationalD
evelopmentBankPLC
PanAsia
BankingCorporationPLC
People’sBank
SampathBankLtd.
SeylanBankPLC
UnionBankofC
olomboLtd.
ForeignBanks(c)
HousingDevelopmentFinance
CorporationBankofSriLanka
LankaputhraDevelopmentBa
nkLtd
NationalSavingsBa
nk
PradeshiyaSanwardanaBankLtd.
SanasaDevelopmentBa
nkLtd.
SriLankaSavingBank
StateMortgageandInvestmentBa
nk
TotalN
o.ofBranches
Population,’000
Populationp
erBranch
BankingDensityIndex(d)
Ampara
Anuradhapura
Badulla
Batticoloa
Colombo
Galle
Gampaha
Hambantota
Jaffna
Kalutara
Kandy
Kegalle
Kilinochchi
Kurunegala
Mannar
Matale
Matara
Moneragala
Mullaitivu
NuwaraEliya
Polonnaruwa
Puttalam
Ratnapura
Trincomalee
Vavuniya
Total
5 25 0 4 6 11 2 3 2 28 7 6 0 1 1 0 8 10 8 0 1 128 705 5,508 18
0 34 0 6 4 7 1 3 2 31 6 7 5 0 1 0 12 14 8 1 1 143 918 6,420 16
1 24 0 6 5 6 2 3 2 35 5 4 2 0 1 0 6 16 2 0 1 121 864 7,140 14
3 21 0 5 3 6 1 2 2 19 6 4 1 1 1 1 7 7 3 0 1 94 560 5,957 17
7 93 4 77 23 54 36 31 28 121 63 41 17 37 6 1 43 4 9 1 3 699 2,419 3,461 29
1 27 1 12 9 9 5 4 3 36 10 5 3 4 2 0 14 19 6 0 1 171 1,113 6,509 15
1 46 1 41 9 30 9 14 7 59 28 21 7 2 5 0 25 12 5 0 2 324 2,391 7,380 14
0 19 0 6 6 8 4 3 2 21 6 4 2 0 2 1 11 15 4 0 1 115 647 5,626 18
0 38 2 12 4 12 2 6 3 29 8 6 3 3 1 0 15 2 2 0 1 149 608 4,081 25
0 22 0 13 8 9 5 5 3 35 10 10 3 0 2 0 12 18 4 0 2 161 1,271 7,894 13
3 42 2 15 8 14 6 5 7 51 15 9 5 4 2 1 17 18 4 0 1 229 1,452 6,341 16
1 24 0 6 5 4 1 2 3 28 6 6 2 0 1 1 10 16 6 0 1 123 877 7,130 14
0 7 0 2 1 2 0 0 1 4 1 1 0 0 0 0 1 1 1 0 0 22 124 5,636 18
2 37 1 12 6 9 5 6 2 51 13 8 4 0 3 0 18 21 6 0 1 205 1,694 8,263 12
0 8 0 1 0 2 0 0 0 5 1 1 1 0 0 0 2 1 2 1 0 25 107 4,280 23
0 14 0 3 5 3 1 2 3 19 3 2 1 0 2 0 4 7 2 0 1 72 514 7,139 14
0 23 1 10 11 8 4 2 3 29 8 4 2 0 1 0 13 20 3 1 1 144 851 5,910 17
0 17 1 3 4 6 1 1 1 14 4 3 1 0 1 0 6 10 3 0 1 77 485 6,299 16
0 9 0 1 0 3 0 0 0 7 1 1 0 0 0 0 2 0 0 0 0 24 96 4,000 25
0 18 1 4 2 7 1 1 1 25 4 4 0 0 1 0 7 8 2 0 1 87 756 8,690 12
1 14 1 2 5 3 1 2 1 15 3 5 0 0 1 1 3 11 2 0 1 72 431 5,986 17
1 24 0 8 5 9 2 5 4 23 8 7 3 0 1 1 8 11 3 0 1 124 814 6,565 15
1 27 1 10 10 7 3 5 3 30 8 4 3 0 2 0 12 18 2 0 1 147 1,151 7,830 13
1 16 0 1 1 8 1 1 1 17 4 2 1 0 1 1 2 3 3 0 0 64 412 6,438 16
0 9 1 2 1 2 1 1 1 3 2 1 1 0 1 0 1 3 1 0 1 32 184 5,750 17
28 638 17 262 141 239 94 107 85 735 230 166 67 52 39 8 259 265 91 4 25 3,552 21,444 6,037 17
Note:AllBankingoutletsexceptStudentsSavingsUnits.
(a) Provisional
(b) DFCCBankandDFCCVardhanaBankwereamulgamatedon01.10.2015toestablishDFCCBankPLC.
(c) ForeignBanks–AxisBankLtd.,CitiBankN.A.,DeutscheBankAG,HabibBankLtd,ICICIBankLtd.,IndianBank,IndianOverseasBank,MCBLtd.,PublicBankBerhard,StandardCharteredBankLtd.,StateBankofIndiaandHongkong&ShanghaiBankingCorporationLtd.
(d) No.ofBankBranchesper100,000persons.
Source :CentralBankofSriLanka

BANKING AND FINANCIAL INSTITUTIONS122
Source :CentralBankofSriLanka
Bank Branch Network 2008 – 2017
Table 11.9
NameofBank 2008 2009 2010 2011 2012 2013 2014 2015(a) 2016 2017(b)
Licensed Commercial Banks*
Domestic Banks
AmanaBankLtd BankofCeylon(c)
CargillsBankLtd CommercialBankofCeylonPLC(c)
DFCCBankPLC HattonNationalBankPLC NationalDevelopmentBankPLC NationsTrustBankPLC PanAsiaBankingCorporationPLC People’sBank SampathBankPLC SeylanBankPLC UnionBankofColomboLtd
Foreign Banks
Licensed Specialised Banks*
HousingDevelopmentFinance CorporationBankofSriLanka LankaputhraDevelopmentBank NationalSavingsBank PradeshiyaSanwardhanaBank SanasaDevelopmentBankLtd SriLankaSavingsBank StateMortgageandInvestmentBank Others(d)
Total Bank Branches
District Co-operative Rural Banks
Total Branches (including Rural Banks)
Population(’000)
PopulationperBankBranch
No. of Branches per 100,000 persons (Density)
TotalBankBranches CommercialBankBranches AllBranches(includingRuralBanks)
1,816 1,948 2,114 2,381 2,530 2,651 2,724 2,781 2,841 2,861
1,779 1,911 2,075 2,338 2,485 2,604 2,673 2,728 2,788 2,809
0 0 0 14 14 24 24 24 28 28 450 495 523 565 608 628 632 637 640 638 0 0 0 0 0 0 3 11 15 17 166 168 182 210 226 234 238 246 256 262 36 55 90 93 101 115 120 123 134 141 160 169 188 217 225 231 231 239 240 239 40 44 47 60 69 78 83 93 104 107 38 40 42 52 62 77 94 97 94 94 32 35 41 64 73 77 78 79 82 85 623 647 656 702 723 730 736 735 735 735 112 130 168 203 206 209 217 222 229 230 108 111 117 128 142 150 156 158 166 166 14 17 21 30 36 51 61 64 65 67
37 37 39 43 45 47 51 53 53 52
461 505 568 608 630 656 654 671 683 691
21 26 28 31 32 33 36 38 38 39 6 7 7 7 7 8 8 8 8 8 137 157 186 210 219 229 235 245 255 259 225 235 245 252 261 265 265 265 265 265 45 53 73 79 81 82 82 87 88 91 1 1 1 1 1 4 4 4 4 4 13 13 15 15 16 22 24 24 25 25 13 13 13 13 13 13 0 0 0 0
2,277 2,453 2,682 2,989 3,160 3,307 3,378 3,452 3,524 3,552
1,763 1,805 1,935 2,019 1,949 2,080 2,185 2,210 2,227 2,258
4,040 4,258 4,617 5,008 5,109 5,387 5,563 5,662 5,751 5,810
20,246 20,476 20,675 20,869 20,424 20,579 20,771 20,966 21,203 21,444
8,892 8,347 7,709 6,982 6,463 6,223 6,149 6,074 6,017 6,037
11.2 12.0 13.0 14.3 15.5 16.1 16.3 16.5 16.6 16.6 9.0 9.5 10.2 11.4 12.4 12.9 13.1 13.3 13.4 13.3 20.0 20.8 22.3 24.0 25.0 26.2 26.8 27.0 27.1 27.1
*AllBankingoutletsexceptStudentsSavingsUnits.
(a) Revised
(b) Provisional
(c) Overseasbankbranchesarealsoincludes.
(d) Bankswhicharenotinoperationnow.
Banking Density (LCBs and LSBs) by Province as at end 2017

BANKING AND FINANCIAL INSTITUTIONS123
Non-Bank Financial Institutions 2010 – 2017(a)
Table 11.10
Item 2010 2011 2012 2013 2014 2015 2016(b) 2017(c)
Rs.Million
ASSETS
Cash and Bank Balances CashinHand DemandDepositswithCom.Banks Time&SavingsDepositswithCom.Banks Time&SavingsDepositswith LicensedFinanceCompanies DepositswithOtherInstitutions
Investments InvestmentsinGovt.ofSriLankaSecurities TreasuryBills TreasuryBonds SharesHeldforTradingInvestments Debentures SharesinOtherCompanies SharesinSubsidiary&AssociateCompanies InvestmentProperties OtherInvestments Provisionfordeclineinvalueof investmentsecurities
Loans & Advances (Net) Leasing HirePurchase Loans RealEstate PawningAdvances DuesfromRelatedParty LoanLossProvisionsand SuspendedInterest
Trading Stocks RealEstate RepossessedItems Other
Fixed Assets
Other Assets
LIABILITIES
Capital Account Paid-upCapital RetainedEarningsandReserves
Deposits FixedDeposits SavingsDeposits CertificateofDeposits
Borrowings from FinancialInstitutions Others
Other Liabilities
No. of Institutions
370,806 474,229 573,435 684,585 814,553 996,127 1,211,891 1,354,991
12,414 20,351 25,887 40,907 44,091 43,844 76,129 107,746 1,493 1,517 2,100 2,540 3,097 3,391 4,463 6,702 5,938 8,042 9,850 12,168 12,637 12,977 18,869 29,671 4,685 10,563 12,898 24,304 26,149 24,726 51,175 67,187 0 6 500 340 439 403 695 1,054 298 222 539 1,555 1,769 2,347 928 3,131
51,592 30,724 40,000 51,776 109,717 99,634 111,708 118,068 20,237 12,525 18,949 30,623 62,325 58,122 73,205 65,552 13,976 12,230 17,465 26,327 48,690 49,040 62,679 58,603 6,261 295 1,483 4,296 13,636 9,082 10,526 6,949 4,072 4,181 4,344 4,607 6,990 6,269 6,221 4,566 1,024 1,055 597 1,684 909 2,418 1,238 2,544 2,080 2,339 2,136 1,472 1,699 2,616 1,561 1,821 16,668 5,494 6,243 5,584 26,821 27,408 26,676 26,955 4,899 5,262 6,659 7,541 8,668 9,990 11,218 14,654 2,929 255 1,526 1,522 3,382 5,302 1,543 12,461 -316 -386 -455 -1,258 -1,079 -12,492 -9,954 -10,487
248,726 373,104 448,941 521,320 603,748 795,844 962,672 1,057,097 87,503 166,052 214,866 249,117 275,593 419,296 490,412 554,274 96,036 118,400 122,985 122,176 120,613 73,364 42,241 27,183 53,545 72,664 91,267 144,443 210,704 307,816 431,332 475,989 7,435 6,000 5,909 5,211 4,308 3,619 2,194 2,479 15,231 20,568 31,374 26,279 22,577 23,934 27,225 35,099 5,707 4,733 5,296 5,860 7,554 9,643 12,901 13,666 -16,730 -15,312 -22,757 -31,765 -37,601 -41,828 -43,634 -51,594
19,104 15,716 14,292 15,065 14,572 12,936 7,662 7,756 15,630 11,330 9,926 8,065 7,006 5,737 2,955 2,985 1,560 1,453 2,239 4,768 6,173 4,821 4,126 4,473 1,914 2,933 2,128 2,232 1,392 2,378 582 298
19,989 16,479 19,921 21,888 25,840 28,305 33,326 38,446
18,982 17,855 24,394 33,628 16,585 15,565 20,394 25,878
370,806 474,229 573,435 684,585 814,553 996,127 1,211,891 1,354,991
48,048 76,853 93,614 96,584 116,870 123,139 146,107 169,674 22,280 51,592 58,829 58,894 65,899 63,026 64,297 66,554 25,768 25,262 34,785 37,690 50,971 60,113 81,810 103,120
146,120 186,016 254,117 337,297 414,116 480,636 530,740 686,720 140,196 179,268 248,516 328,062 396,468 457,486 507,688 655,670 5,074 5,938 4,855 8,563 16,984 22,568 22,184 30,014 850 810 747 672 664 581 869 1036
138,992 171,682 177,284 193,111 217,385 314,295 438,662 396,030 91,412 103,100 96,383 94,938 110,835 176,595 276,588 235,890 47,580 68,582 80,900 98,173 106,550 137,700 162,074 160,140
37,647 39,678 48,420 57,593 66,181 78,058 96,382 102,567
58 55 60 58 56 53 53 51
(a) Non-BankFinancialInstitutionssectorrepresentLicensedFinanceCompaniesandSpecialisedLeasingCompanies.
(b) Revised.
(c) Provisional.
Source:CentralBankofSriLanka

BANKING AND FINANCIAL INSTITUTIONS124
Unit Trusts 2014 – 2017
Summary of Co-operative Rural Banks and Credit Societies 2008 – 2017
Table 11.11
Table 11.12
Item 2014 2015 2016(a) 2017(b)
Item 2008 2009 2010 2011 2012 2013 2014 2015 2016 2017(a)
Co-operative Rural Banks
No.ofBanks
Deposits,Rs.Mn.
SavingsDeposits TimeDeposits
LoansOutstanding,Rs.Mn.
Agriculture&AnimalHusbandry SmallIndustries Housing,Electrification&Water Commerce&OtherProjects Other
Thrift & Credit Co-operative Societies
No.ofSocieties
Deposits,Rs.Mn.
LoansGranted,Rs.Mn.
Agriculture&AnimalHusbandry SmallIndustries Housing,Electrification&Water Commerce&OtherProjects Other
1,763 1,805 1,935 2,019 1,949 2,080 2,185 2,210 2,227 2,258
33,042 103,877 61,984 71,081 63,627 79,355 84,640 87,157 91,810 102,249
24,451 63,989 35,262 41,642 33,524 33,816 37,759 40,666 42,500 45,939 8,591 39,886 26,723 29,440 30,103 45,539 46,881 46,490 49,310 56,311
9,775 67,424 44,398 30,781 51,371 39,520 37,757 45,130 49,770 55,488
3,277 4,315 2,952 1,162 4,759 2,083 2,344 4,475 2,796 2,690 618 2,089 858 1,262 2,858 1,906 2,668 3,098 3,563 3,509 43,150 15,703 14,462 24,160 14,013 12,983 21,094 24,810 29,370 399 6,059 2,774 17,607 8,298 7,737 5,854 5,440 6,504 1,973 19,959 17,595 11,525 3,582 12,269 12,786 11,038 13,626 13,362
8,440 8,440 8,440 8,424 8,424 8,424 8,424 8,424 8,423 8,423
3,565 4,483 4,764 5,311 5,287 5,588 3,883 1,603 4,300 5,820
3,105 3,093 3,205 3,987 4,175 4,766 4,808 7,060 18,200 15,664
755 955 1,037 1,243 1,461 1,561 1,734 1,959 5,049 3,163 208 265 273 483 434 476 357 1,047 2,699 2,450 1,001 732 695 915 1,360 1,603 1,460 2,554 6,583 7,073 503 796 865 673 564 664 734 904 2,331 2,173 638 345 335 672 357 462 523 597 1,538 805
(a)Provisional Sources:Co-operativeDevelopmentDepartment
SanasaFederation
⎫⎬⎭⎫⎬⎭
Sources : UnitTrustAssociationofSriLanka SecuritiesandExchangeCommissionofSriLanka
Total Assets (Rs. bn)
NetAssetValue-NAV(Rs.bn)
Investments in Equities (Rs. bn)
ShareofTotalNetAssets(%)
Investments in Government Securities (Rs. bn)
ShareofTotalAssets(%)
No. of Unit Trusts
Types of Funds:
NumberofBalancedFunds NumberofGrowthFunds NumberofIndex/SectorFunds NumberofIncomeFunds NumberofGiltEdgedFunds NumberofMoneyMarketFunds NumberofIPOFunds NumberofShariahFunds NumberofDollarBondFunds
No. of Units in Issue (mn)
NAVperunit
Total No. of Unit Holders
(a) Revised(b) Provisional
126.5 130.3 104.0 128.8
126.0 129.4 103.1 127.6
13.6 14.4 13.9 13.0
10.8 11.1 13.5 10.2
56.1 29.4 49.6 22.5
44.4 22.6 48.1 17.7
67 74 78 79
8 11 11 11 8 8 8 8 4 4 4 4 15 16 17 17 13 15 16 16 12 13 15 16 2 2 2 2 4 4 4 4 1 1 1 1
9,772 8,812 7,141 7,638
13 15 14 17
32,619 38,140 41,154 41,037

TRANSPORTATION125
Road Network 2000 – 2017
Road Kilometerage by Province and District 2017
Table 12.1
Table 12.2
Year ClassA ClassB ClassC ClassD Expressways Total
Kilometres
2000 4,222 7,265 7,315 5,425 – 24,2272001 4,337 7,571 7,536 5,720 – 25,1642002 4,339 7,670 7,682 5,763 – 25,4542003 4,339 7,670 8,136 5,765 – 25,9102004 4,339 7,679 8,136 5,771 – 25,9252005 4,314 7,706 8,257 6,074 – 26,3512006 4,219 7,553 9,565(a) 5,412(a) – 26,7502007 4,219 7,655 9,575(a) 5,418(a) – 26,8672008 4,219 7,670 9,552(a) 5,546(a) – 26,9882009 4,216 7,704 11,231 5,855 – 29,0062010 4,219 7,800 11,316 5,783 – 29,1192011 4,219 7,800 11,424 6,356 95 29,8952012 4,219 7,945 11,304 6,287 95 29,8502013 4,219 7,949 11,669 6,726 121 30,6842014 4,215 7,993 11,837 7,193 161 31,3982015 4,215 7,995 12,497 6,385 170 31,2622016 4,215 7,995 12,497 6,385 170 31,262
2017 4,215 7,995 12,529 6,394 170 31,303
(a)ExcludingNorthernProvince. Sources: RoadDevelopmentAuthority ProvincialRoadDevelopmentAuthorities
Western 374 1,224 1,078 874 98 3,649 Colombo 166 261 242 162 34 864 Gampaha 128 622 385 499 35 1,670 Kalutara 80 341 451 213 29 1,115 Central 409 1,338 1,665 578 – 3,990 Kandy 184 563 929 352 – 2,027 Matale 105 283 300 177 – 865 NuwaraEliya 120 492 436 49 – 1,097 Southern 347 1,154 915 715 71 3,204 Galle 97 393 387 272 60 1,209 Matara 135 257 288 243 11 935 Hambantota 115 504 240 200 – 1,060 Northern 734 525 1,959 161 – 3,379 Jaffna 381
(a) 277
(a) 544 45 – 1,608(a)
Kilinochchi
322 39 – Mannar 113 92 309 26 – 540 Mullaitivu 113 103 390 17 – 622 Vavuniya 128 54 394 34 – 609
Eastern 620 551 848 273 – 2,292 Batticaloa 206 61 313 45 – 624 Ampara 273 282 319 128 – 1,002 Trincomalee 141 209 216 100 – 666 North Western 352 1,003 1,914 831 – 4,101 Kurunegala 196 638 1,254 488 – 2,576 Puttalam 156 365 661 344 – 1,525 North Central 492 702 1,211 736 – 3,141 Anuradhapura 350 471 741 698 – 2,259 Polonnaruwa 143 230 471 39 – 882 Uva 471 693 1,689 682 – 3,535 Badulla 267 432 1,109 406 – 2,214 Moneragala 204 261 580 276 – 1,321 Sabaragamuwa 416 804 1,247 1,544 – 4,011 Kegalle 144 365 559 714 – 1,781 Ratnapura 272 440 688 830 – 2,230
Province/District
ClassA
ClassB
ClassC
ClassD
Express-ways Total Province/
DistrictClassA
ClassB
ClassC
ClassD
Express-ways Total
“A”Class – AllroadswithinthenetworkofTrunkRoadsconnectingthenationalcapitalwiththeprovincialcapitalsandalsoconnectingthesecapitalswithoneanother.Alsoincludedareothermajorroads(allroadspavedandbitumensurfacedwithcarriagewaybetween24ft.to36ft.andplatformwidth36ft.to56ft.).
“B”Class – Mainroadsconnectingotherimportanttownsandalsoprovidingimportantlinkswithinthetrunkroutesystem (Metalledandbitumenwithasmallpercentagegravelled).“C”Class – Otherroadssuchasagriculturalroadsandlocalroads(Singlecarriagewayof12ft.widthandaplatformwidthof22ft. mostlymetalledbutwithasmallpercentagegravelled).“D”Class – Gravelledroadwith8ft.–10ft.widthsurfacegenerallymotorableduringdryweatheronly.
(a)TotalofJaffnaandKilinochchidistricts Sources:RoadDevelopmentAuthority ProvincialRoadDevelopmentAuthorities
⎫⎬⎭
⎫⎬⎭

TRANSPORTATION126
Road Kilometerage by Province
Table 12.3
RoadClass Western Central Southern Northern Eastern NorthWestern
NorthCentral Uva Sabara-
gamuwaAll
Island
Year 2013
ClassA 374 409 347 734 620 353 495 471 416 4,219ClassB 1,219 1,338 1,149 524 551 971 699 693 804 7,949ClassC 998 1,665 915 1,959 722 1,429 1,211 1,522 1,247 11,669ClassD 954 578 715 161 376 1,446 736 215 1,544 6,726Expressways 79 – 42 – – – – – – 121
Total 3,625 3,990 3,169 3,379 2,269 4,199 3,141 2,901 4,011 30,684
Year 2014
ClassA 374 409 347 734 620 352 492 471 416 4,215ClassB 1,222 1,338 1,154 525 551 1,003 702 693 804 7,995ClassC 998 1,666 915 1,959 817 1,914 1,211 1,689 1,247 12,497ClassD 954 578 715 161 263 831 736 682 1,544 6,385Expressways 89 – 71 – – – – – – 170
Total 3,638 3,991 3,204 3,379 2,251 4,101 3,141 3,535 4,011 31,262
Year 2015
ClassA 374 409 347 734 620 352 492 471 416 4,215ClassB 1,224 1,338 1,154 525 551 1,003 702 693 804 7,995ClassC 1,078 1,666 915 1,959 817 1,914 1,211 1,689 1,247 12,497ClassD 874 578 715 161 263 831 736 682 1,544 6,385Expressways 98 – 71 – – – – – – 170
Total 3,649 3,991 3,204 3,379 2,251 4,101 3,141 3,535 4,011 31,262
Year 2016
ClassA 374 409 347 734 620 352 492 471 416 4,215ClassB 1,224 1,338 1,154 525 551 1,003 702 693 804 7,995ClassC 1,078 1,666 915 1,959 817 1,914 1,211 1,689 1,247 12,497ClassD 874 578 715 161 263 831 736 682 1,544 6,385Expressways 98 – 71 – – – – – – 170
Total 3,649 3,991 3,204 3,379 2,251 4,101 3,141 3,535 4,011 31,262
Year 2017
ClassA 374 409 347 734 620 352 492 471 416 4,215ClassB 1,224 1,338 1,154 525 551 1,003 702 693 804 7,995ClassC 1,078 1,666 915 1,959 848 1,914 1,211 1,689 1,247 12,529ClassD 874 578 715 161 273 831 736 682 1,544 6,394Expressways 98 – 71 – – – – – – 170
Total 3,649 3,991 3,132 3,379 2,292 4,101 3,141 3,535 4,011 31,303
“A”Class – AllroadswithinthenetworkofTrunkRoadsconnectingthenationalcapitalwiththeprovincialcapitalsandalsoconnectingthesecapitalswithoneanother.Alsoincludedareothermajorroads(allroadspavedandbitumensurfacedwithcarriagewaybetween24ft.to36ft.andplatformwidth36ft.to56ft.).
“B”Class – Mainroadsconnectingotherimportanttownsandalsoprovidingimportantlinkswithinthetrunkroutesystem (Metalledandbitumenwithasmallpercentagegravelled).
“C”Class – Otherroadssuchasagriculturalroadsandlocalroads(Singlecarriagewayof12ft.widthandaplatformwidthof22ft.mostly metalledbutwithasmallpercentagegravelled).
“D”Class – Gravelledroadwith8ft.–10ft.widthsurfacegenerallymotorableduringdryweatheronly.
Sources:RoadDevelopmentAuthority ProvincialRoadDevelopmentAuthorities

TRANSPORTATION127
Motor Vehicles by Province(a)
Table 12.4
VehicleCategory Western Central Southern Northern EasternNorth
WesternNorthCentral
UvaSabara-gamuwa
AllIsland
Omnibuses*PrivateCoaches**DualPurposeVehiclesPrivateCarsLandVehiclesGoodsTransportVehiclesMotorCyclesThreewheelersOthers
Total
Omnibuses*PrivateCoaches**DualPurposeVehiclesPrivateCarsLandVehiclesGoodsTransportVehiclesMotorCyclesThreewheelersOthers
Total
Omnibuses*PrivateCoaches**DualPurposeVehiclesPrivateCarsLandVehiclesGoodsTransportVehiclesMotorCyclesThreewheelersOthers
Total
Number
Year 2015
8,710 2,164 2,005 1,239 659 2,161 926 939 2,000 20,803 16,033 2,522 3,505 560 534 3,385 841 924 2,529 30,833 147,961 31,114 36,716 7,106 11,929 43,369 21,372 14,992 21,983 336,542 333,614 45,735 46,223 4,488 9,265 43,717 16,290 13,567 27,907 540,806 14,937 2,807 14,276 12,757 19,275 15,020 9,682 8,201 3,478 100,433 94,811 21,005 21,844 3,766 6,231 32,867 12,055 10,144 16,896 219,619 671,641 117,646 325,046 150,623 194,193 356,233 194,061 91,369 126,308 2,227,120 307,204 112,924 126,055 16,854 43,984 96,065 56,428 62,912 109,590 932,016 808 8,094 199 1,935 164 519 45 750 605 13,119
1,595,719 344,011 575,869 199,328 286,234 593,336 311,700 203,798 311,296 4,421,291
Year 2016
8,562 2,257 1,933 1,010 669 1,883 881 958 1,730 19,883 16,454 2,752 3,493 643 604 3,960 951 968 2,495 32,320 149,444 34,821 38,375 8,074 13,493 50,627 23,828 17,077 21,386 357,125 346,534 52,036 49,259 5,212 10,833 48,371 18,552 15,327 27,796 573,920 15,936 3,535 14,810 14,367 20,820 16,031 11,228 9,099 3,023 108,849 96,106 22,816 21,079 3,837 6,672 32,033 12,002 10,390 16,325 221,260 732,567 134,928 351,563 168,056 221,113 383,543 211,523 106,352 127,460 2,437,105 321,866 123,410 132,425 18,283 48,655 102,670 58,977 69,127 103,564 978,977 872 4,179 196 503 57 111 94 784 1,079 7,875
1,688,341 380,734 613,133 219,985 322,916 639,229 338,036 230,082 304,858 4,737,314
Year 2017(b)
8,947 1,743 1,980 1,014 654 2,082 828 1,329 1,911 20,488 17,727 3,835 3,980 744 686 4,117 1,131 1,175 3,186 36,581 154,890 37,719 40,599 8,469 14,225 53,882 24,888 17,485 25,523 377,680 367,165 56,549 53,659 5,632 12,125 53,043 20,762 16,646 34,552 620,133 16,241 3,936 14,812 14,175 21,551 15,810 11,337 9,504 3,360 110,726 98,482 24,501 24,016 5,771 7,096 34,994 12,315 10,526 18,485 236,186 772,660 152,818 367,631 183,024 241,997 409,446 226,577 114,808 155,956 2,624,917 326,087 130,731 133,894 18,715 50,232 101,710 59,854 69,066 119,632 1,009,921 1,068 91 174 145 66 97 47 2,478 95 4,261
1,763,267 411,923 640,745 237,689 348,632 675,181 357,739 243,017 362,700 5,040,893
(a)MotorVehicleswithvalidrevenuelicenses.
(b)Provisional.
* BusesownedbySLTBandprivatebuseswithroutepermits.
** Otherprivatebusesandcoacheswithoutroutepermits.
Sources:DivisionalSecretariats
CentralBankofSriLanka

TRANSPORTATION128
New Registration of Motor Vehicles 2008 – 2017
SLTB / Regional Bus Companies 2008 – 2017
Table 12.5
Table 12.6
Item 2008 2009 2010 2011 2012 2013 2014 2015 2016 2017(a)
Item 2008 2009 2010 2011 2012 2013 2014 2015 2016(a) 2017(b)
(a)Provisional Source :DepartmentofMotorTraffic
Number
Passenger Transport
BusesandCoaches PrivateCars MotorCycles ThreeWheelers Goods Transport
Lorries DuelPurposeVehicles Others Land Vehicles
Tractors HandTractors Others Total
222,173 179,286 316,022 453,891 325,740 283,138 394,554 610,204 444,931 410,430
1,180 739 2491 4,248 3,095 1,805 3,851 4,140 2,685 3,331 20,237 5,762 23,072 57,886 31,546 28,380 38,780 105,628 45,172 39,182 155,952 135,421 204,811 253,331 192,284 169,280 272,885 370,889 340,129 344,380 44,804 37,364 85,648 138,426 98,815 83,673 79,038 129,547 56,945 23,537
16,894 9,697 23,557 48,336 49,663 30,475 25,920 46,598 34,450 28,174
13,588 8,016 10,803 12,446 10,445 4,525 3,851 5,356 5,271 8,689 2,856 1,280 11,712 33,518 37,397 24,603 20,799 39,456 26,887 16,742 450 401 1,042 2,372 1,821 1,347 1,270 1,786 2,292 2,743
26,132 15,092 19,664 23,194 21,892 13,038 9,082 12,105 13,947 13,049
3,339 2,286 4,389 6,649 6,221 3,437 2,003 4,299 5,261 5,309 20,724 11,473 12,974 13,424 12,229 7,335 5,067 5,678 5,024 3,512 2,069 1,333 2,301 3,121 3,442 2,266 2,012 2,128 3,662 4,228
265,199 204,075 359,243 525,421 397,295 326,651 429,556 668,907 493,328 451,653
Source:SriLankaTransportBoard (a) Revised
(b) Provisional
(c) TotalRevenue/AverageFareperKilometre.
(d) Datafrom2009hasbeenrevisedduetoachangeinthe
data source from National Transport Commission to Sri
LankaTransportBoard.
Operational
PassengerJourneys,Mn.
TimeTableRequirement(T.T.R.) (Average),No.
BusesOperated (AverageDaily),No.
OperatedKilometres,Mn.
PassengerKilometres(c)(d),Mn.
SeatKilometres(e),Mn.
AveragePassengerJourney,km.
LoadFactor(f),%
AverageCapacityofVehiclesOperated,No.
AverageVehicleUtilization(g),km.Operated
Revenue,Rs.Mn.
of which :
WayBillCollection SalesofSeasonTickets
× 100
(e) OperatedKilometres×AverageCapacity.
(f) PassengerKilometres
SeatKilometres
(g) PerBusperDay.
910 918 669 671 915 892 924 1,019 1,064 1,005
7,112 7,134 7,129 7,131 7,176 7,176 7,226 7,235 7,257 7,257
4,246 4,482 4,441 4,365 4,314 4,373 4,596 5,284 5,342 5,274
313 332 341 341 338 344 371 440 452 448
15,080 11,233 11,815 11,907 11,909 12,201 12,717 15,210 16,101 15,697
15,569 15,780 16,576 17,012 17,007 17,317 18,258 21,911 22,642 22,485
16.6 17.1 17.1 17.7 18.7 18.7 18.7 19.8 20.0 20.0
96.0 96.0 71.3 70.0 70.0 70.5 69.7 69.4 71.1 69.8
52 52 49 48 52 52 52 52 52 53
201 199 204 214 214 215 217 228 232 233
18,083 21,528 21,560 21,018 26,117 30,189 33,665 35,825 40,928 42,163
12,973 13,442 14,658 15,176 18,209 19,430 21,956 24,249 26,017 27,172 528 536 542 553 654 684 741 741 833 904

TRANSPORTATION129
Sri Lanka Railways 2008 – 2017
Table 12.7
Item 2008 2009 2010 2011 2012 2013 2014 2015 2016 2017(a)
Rolling Stock, No.
Locomotives(b)
BroadGauge DualGauge(KV-Line)
PassengerCoaches BroadGauge DualGauge(KV-Line)
GoodsWagons BroadGauge DualGauge(KV-Line)
Route, km.
BroadGauge DualGauge(KV-Line)
Main Stations, No.
BroadGauge DualGauge(KV-Line)
Sub Stations, No.
BroadGauge DualGauge(KV-Line)
Passenger Journeys, Mn.
OrdinaryTicketPassengers(f)
SeasonTicketPassengers
Passenger Kilometres(g), Mn.
OrdinaryTicketPassengers SeasonTicketPassengers(h)
Revenue from Passenger Traffic, Rs. Mn.
OrdinaryTicketPassengers SeasonTicketPassengers
CoachingTrainKilometre,Mn.km.
GoodsHauled,Mn.Tons
TonKilometreageofGoods Hauled(i),Mn.
ReceiptsfromGoodsTraffic,Rs.Mn.
GoodsTrainKilometres,Mn.km.
GrossReceipts,Rs.Mn.
WorkingExpenditure,Rs.Mn.
PersonnelStrength,No.
187(c) 187 191 68(d) 125(e) 137(e) 247(e) 72(d) 74(d) 74(d)
– – – – – – 5 – – –
800 800 800 560 560 740 950 565(d) 565(d) 665(d)
– – – – – – 18 – – –
1,200 1,200 1,200 1,090 1,090 800 755 862 850 860 – – – – – – 12 – – –
1,143 1,150 1,153 1,448 1,448 1,448 1,449 1,449 1,461 1,461 – – – – – – – – – –
172 172 172 183 183 174 168 174 174 179 – – – – – – – – – –
161 162 162 160 160 164 194 162 162 161 – – – – – – – – – –
53 54 52 49 62 57 67 73 69 67 52 48 49 47 44 61 62 68 67 69
2,932 2,964 2,814 2,912 3,340 4,235 4,693 5,077 5,143 5,141 1,749 1,604 1,539 1,663 1,699 2,023 2,149 2,281 2,271 2,354
2,024 2,490 2,363 2,445 2,806 3,557 3,942 4,164 4,308 4,261 699 777 749 794 793 930 1,009 1,011 1,058 1,075 9.2 9.5 9.8 10.0 10.6 10.9 11.1 – 11.1 10.7
1.7 1.6 2.7 1.9 2.1 1.9 1.9 1.8 2.0 2.0
121 113 163 154 143 133 130 130 140 145
364 337 420 430 447 413 387 384 409 429
0.3 0.3 0.3 0.5 0.5 0.5 0.6 – 0.4 0.5
3,671 4,020 4,018 4,235 4,852 5,423 5,909 6,335 6,463 6,477
8,225 8,788 7,191 8,295 8,648 10,586 16,943 14,049 13,396 14,081
15,168 15,273 15,488 15,480 13,499 12,883 12,443 14,452 14,460 16,617
(a) Provisional.
(b) Locomotivesincludeallengines,steamanddieselandpowersetsandrailcars.
(c) MaintainableStock(includingDMUs,ShuntingLocos).
(d) AvailableLocomotives.
(e) MaintainableStock.
(f) Numberofjourneystakenbypassengersholdingordinarytickets(ornumberofordinaryticketholders).
(g) Numberofpassengerstravelled×distancetravelled.
(h) Numberofseasonticketholdersmultipliedby40(assumingthataseasonticketholderusuallytakes
40numbersofjourneyforamonth).
(i) Numberoftonshauled×distancehauled.
Source:SriLankaRailways

TRANSPORTATION130
Aviation : SriLankan Airlines 2009 – 2017
Port Services 2008 – 2017
Table 12.8
Table 12.9
Item 2009 2010 2011 2012 2013 2014 2015 2016 2017(a)
Item 2008 2009 2010 2011 2012 2013 2014 2015 2016 2017(a)
Scheduled Services
KilometresFlown,’000HoursFlownPassengersCarried,No.FreightTonsCarried,No.PassengerKilometresFlown,’000AvailableSeatKilometresFlown,’000PassengerLoadFactor,%TotalTonneKilometresPerformed,’000Passengers(IncludingExcessBaggage)Freight&MailAvailableTonneKilometres,’000WeightLoadFactor,%Employment,No.
38,012 40,451 52,757 66,559 67,174 70,450 77,125 67,393 74,979 54,228 62,003 74,886 93,922 95,238 97,319 96,494 96,221 107,673 2,435,479 2,807,889 3,261,341 4,164,234 4,232,343 4,240,195 4,332,411 4,491,709 5,342,456 69,106 83,147 87,919 97,829 99,190 97,563 101,429 102,734 127,235 7,851,363 9,399,619 10,676,945 12,790,217 12,987,511 12,719,412 12,747,024 12,854,710 13,983,80110,382,321 12,076,114 13,733,446 15,871,522 15,854,641 15,965,221 15,843,430 15,952,239 17,096,075 75.6 77.8 77.7 80.6 81.9 79.7 80.5 80.6 81.8 976,052 1,472,746 1,287,385 1,493,190 1,511,496 1,473,534 1,478,424 1,522,284 1,617,816 699,448 1,154,213 943,146 1,118,415 1,143,095 1,108,076 1,129,192 1,137,299 1,232,998 276,604 318,533 344,239 374,775 368,400 365,458 349,232 384,985 384,818 1,477,005 1,716,252 1,917,296 2,175,677 2,191,103 2,200,320 2,176,147 2,206,539 2,363,781 58 55 55 53 52 51 68 69 68 4,664 4,969 5,487 6,159 6,548 6,903 7,020 6,959 7,021
4,814 4,456 4,067 4,332 4,134 3,976 4,264 4,728 4,998 4,879 4,424 4,114 3,910 4,124 3,870 3,667 3,742 4,197 4,405 4,329 68 32 48 73 69 36 60 72 96 87 322 310 109 126 161 134 127 164 216 233 – – – 9 34 139 335 295 281 230
30,451 29,284 36,585 39,448 39,806 40,019 44,870 46,654 51,799 55,942 28,086 27,214 34,307 36,642 36,721 37,453 41,540 43,271 47,982 51,955 458 166 318 464 422 200 394 540 771 711 1,907 1,904 1,960 2,337 2,646 2,276 2,621 2,649 2,825 3,120 – – – 5 17 90 316 195 220 156
20,132 19,494 24,655 25,620 25,165 26,224 29,540 30,925 34,720 37,915 19,874 19,159 24,461 25,373 24,949 26,029 29,254 30,447 33,896 37,079 1.5 0.8 0.4 0.3 0.0 6.7 0.4 1.8 0.1 0.1 256 334 194 237 213 159 127 379 689 778 – – – 10 3 29 158 98 135 58
47,960 46,373 58,768 62,016 61,670 63,482 70,794 73,718 81,879 89,035 40,490 39,601 51,426 54,109 53,504 56,195 63,329 65,682 73,682 79,825 838 649 627 722 618 364 601 1113 879 843 2,565 2,097 2,556 2,620 2,709 2,657 2,444 2,344 2,572 2,501 4,068 4,026 4,159 4,565 4,839 4,265 4,420 4,579 4,746 5,865
3,687,338 3,464,297 4,137,441 4,262,887 4,187,120 4,306,206 4,907,915 5,185,467 5,734,923 6,209,068 813,271 751,992 932,244 1,046,886 1,020,255 1,031,977 1,126,985 1,217,971 1,299,850 1,383,551 2,785,422 2,633,055 3,095,589 3,123,828 3,064,767 3,208,117 3,699,710 3,888,321 4,355,261 4,741,582 88,645 79,250 109,608 92,173 102,098 66,112 81,220 79,175 79,812 83,935
25,143 23,331 28,280 31,086 38,098 37,232 37,492 40,805 44,080 45,609 24,561 22,816 27,724 30,347 36,943 35,804 35,159 37,214 39,913 41,325 314 178 277 441 597 478 696 915 1239 1388 268 337 279 285 423 366 400 530 886 1120 – – – 13 135 585 1237 2,145 2,042 1,776
13,715 13,367 12,828 11,008 10,200 9,886 9,598 9,550 9,651 9,377 12,548 12,263 11,681 10,059 9,325 9,014 8,747 8,725 8,856 8,588 553 513 500 433 391 378 373 355 348 351 614 591 598 466 436 426 419 417 402 401 – – 49 50 48 68 59 53 45 37
(a)Provisional Source :SriLankanAirlines
Vessels Arrived Colombo Galle Trincomalee Hambantota
Cargo Discharged, MT ’000 Colombo Galle Trincomalee Hambantota
Cargo Loaded, MT ’000 Colombo Galle Trincomalee Hambantota
Total Cargo Handled (Port of Colombo), MT ’000 Containerised BreakBulk DryBulk LiquidBulk
Container Throughput (Port of Colombo), TEU Domestic Transhipment Re-Stowing
Revenue, Rs. Mn. Colombo Galle Trincomalee Hambantota
Employees Colombo Galle Trincomalee Hambantota
(a)Provisional Source:SriLankaPortsAuthority

TRANSPORTATION131
Selected Public Transport Indicators by Province
Table 12.10
RoadClass Western Central Southern Northern Eastern NorthWestern
NorthCentral Uva Sabara-
gamuwaAll
Island
Sri Lanka Railways OperatedKilometers,Mn. 2014 2015(a)
2016(a)
2017(b)
PassengerKilometers,Mn. 2014 2015(a)
2016(a)
2017(b)
FreightTonneKilometers,Mn. 2014 2015(a)
2016(a)
2017(b)
Private Bus Services
TotalFleet 2014 2015(a)
2016(a)
2017(b)
BusesOperated 2014 2015(a)
2016(a)
2017(b)
SeatingCapacity 2014 2015(a)
2016(a)
2017(b)
OperatedKilometers,Mn. 2014 2015(a)
2016(a)
2017(b)
PassengerKilometers,Mn. 2014 2015(a)
2016(a)
2017(b)
SLCTB / Regional Bus Companies(c)
BusesOperated 2014 2015(a)
2016(a)
2017(b)
PassengerKilometers.Mn. 2014 2015(a)
2016(a)
2017(b)
OperatedKilometers,Mn. 2014 2015(a)
2016(a)
2017(b)
(a)Revised(b)Provisional(c)BusesunderSLTTS(SriLankaTouristTransportService),areincludedinWesternProvincefrom2014onwards.
*ThesefiguresincludethedatarelatedtothepermitsissuedbytheNationalTransportCommissionaswell.
Sources : NationalTransportCommission SriLankaTransportBoard SriLankaRailways
5.4 0.9 1.1 0.4 0.7 1.3 0.8 0.2 0.3 11.1 7.1 0.6 0.5 1.0 0.4 0.6 0.4 0.2 0.3 11.3 6.9 0.7 0.6 1.1 0.5 0.7 0.5 0.2 0.3 11.5 6.9 0.7 0.6 0.8 0.5 0.7 0.5 0.2 0.3 11.2
4,166.6 411.2 342.8 686.9 274.4 342.8 274.4 136.8 205.9 6,841.9 4,732.2 411.2 342.8 686.9 274.4 342.8 274.4 136.8 205.9 7,407.4 4,502.7 459.3 371.1 743.7 297.0 371.1 297.0 148.2 223.0 7,413.1 4,668.4 464.4 394.2 521.2 341.9 408.4 309.7 157.0 229.9 7,495.1
33.8 5.7 6.7 0.1 17.8 52.6 10.2 2.4 1.2 130.4 33.0 6.0 6.8 0.1 17.7 52.7 10.1 2.4 1.2 130.0 35.5 6.4 7.3 0.1 19.1 56.7 10.9 2.6 1.3 139.9 36.8 6.7 7.5 0.1 19.7 58.7 11.3 2.7 1.3 144.8
7,526 2,888 1,932 1,122 678 2,075 902 1,193 2,105 23,569* 6,019 2,113 1,338 1,153 560 1,470 672 1,074 2,104 19,617* 5,851 2,377 1,324 1,079 634 1,505 693 1,032 1,827 19,614* 6,159 2,421 1,323 1,112 637 1,520 759 1,166 1,715 19,998*
6,746 2,806 1,816 968 460 1,820 764 1,152 2,001 21,353* 4,802 2,012 1,240 997 416 1,258 609 810 1,700 16,950* 4,302 2,367 1,191 901 501 1,470 625 785 1,772 17,131* 4,154 2,410 1,280 965 493 1,478 626 825 1,715 16,972*
283,349 117,837 76,280 40,652 19,324 76,446 32,107 48,386 84,044 930,705* 201,684 84,504 52,080 41,874 17,472 52,836 25,578 34,020 71,400 749,172* 180,684 99,414 50,022 37,842 21,042 61,740 26,250 32,970 74,424 758,106* 174,468 101,220 53,760 40,530 20,706 62,076 26,292 34,650 72,030 749,136*
361.8 152.4 112.7 50.4 27.3 115.2 45.9 64.0 112.1 1,336.2* 238.4 99.9 61.6 49.5 20.7 62.4 30.2 40.2 84.4 1,012.6* 214.1 117.8 59.2 44.8 24.9 73.1 31.1 39.1 88.2 1,030.2* 206.2 119.6 63.5 47.9 24.4 73.3 31.0 40.9 85.1 1,008.8*
16,715.2 7,040.3 5,205.9 2,328.0 1,261.2 5,321.5 2,121.6 2,954.6 5,181.1 65,676.7*11,012.8 4,614.3 2,843.8 2,286.5 954.0 2,885.1 1,396.7 1,857.6 3,898.8 47,552.4* 9,893.1 5,443.3 2,738.9 2,072.0 1,152.1 3,380.5 1,437.3 1,805.2 4,074.9 49,544.5* 9,256.7 5,527.0 2,935.5 2,213.1 1,130.6 3,389.6 1,435.6 1,892.0 3,933.1 50,542.4*
1,349 739 446 200 263 541 403 496 566 5,003 1,416 789 493 241 308 587 421 573 612 5,440 1,335 793 486 245 301 581 424 568 603 5,336 1,276 789 480 236 295 588 420 578 604 5,266
3,146.9 1,709.3 1,337.7 570.9 932.9 1,451.7 1,305.9 1,139.8 1,122.4 12,717.4 3,677.0 2,143.4 1,598.5 824.1 1,166.1 1,663.0 1,330.4 1,470.7 1,337.3 15,210.3 3,624.1 2,232.9 1,639.9 944.4 1,283.1 1,772.1 1,451.2 1,560.0 1,593.6 16,101.4 3,465.6 2,241.3 1,624.8 919.8 1,272.8 1,826.5 1,455.9 1,679.9 1,215.3 15,701.8
95.0 42.4 38.5 17.1 23.7 43.5 38.4 35.1 35.1 368.8 109.7 54.6 45.4 23.3 30.3 50.4 38.5 45.4 40.3 437.8 107.0 56.3 46.1 25.8 32.1 51.6 40.6 48.4 41.2 449.1 103.8 56.2 45.4 25.3 32.0 52.5 40.8 48.3 40.9 445.3

SOCIO-ECONOMIC SERVICES132
National Level Findings of the Household Income and Expenditure Survey (HIES)by Survey Period – Sri Lanka
Table 13.1
Variable Unit
HIESSurveyPeriod
1985/86 1990/91 1995/96 2002 2005 2006/07 2009/10 2012/13 2016
Meanhouseholdincomepermonth Rs.
Medianhouseholdincomepermonth Rs.
Meanpercapitaincomepermonth Rs.
Incomereceiversmeanincomepermonth Rs.
No.ofincomereceiversperhousehold No.
Householdsize No.
Monetaryincomepermonthperhousehold Rs.
Non-Monetaryincomepermonth perhousehold Rs.
Ginicoefficientofhouseholdincome
Ginicoefficientofhouseholdexpenditure
Ginicoefficientofincomereceiversincome
Meanhouseholdexpenditurepermonth Rs.
Expenditureonfoodanddrink Rs.
Expenditureonnonfooditems(excluding liquor,narcoticdrugsandtobacco) Rs.
Expenditureonliquor, narcoticdrugsandtobacco Rs.
FoodRatio (asapercentage) %
PovertyHeadCountRatio %
2,012 3,549 6,476 12,803 20,048 26,286 36,451 45,878 62,237
1,322 2,547 3,793 8,482 13,617 16,735 23,746 30,814 43,511
395 724 1,439 3,056 4,896 6,463 9,104 11,819 16,377
941 1,819 3,367 6,959 10,563 14,457 20,427 25,963 33,894
2.0 2.0 1.8 1.8 1.9 1.8 1.8 1.8 1.8
5.1 4.9 4.5 4.2 4.1 4.1 4.0 3.9 3.8
1,334 2,963 5,264 10,386 17,089 22,616 31,209 39,300 52,979
678 586 1,212 2,419 2,959 3,670 5,242 6,578 9,257
0.46 0.43 0.46 0.47 0.47 0.49 0.49 0.48 0.45
– – 0.36 0.41 0.40 0.41 0.37 0.40 0.41
– 0.52 0.52 0.53 0.55 0.55 0.55 0.53 0.51
2,079 3,905 6,525 13,147 19,151 22,952 31,331 41,444 54,999
1,198 2,377 3,552 5,848 7,593 8,641 13,267 15,651 19,114
802 1,384 2,753 6,993 11,079 13,819 17,399 25,088 34,829
79 144 219 306 479 492 665 705 1,056
57.6 60.9 54.4 44.5 39.6 37.6 42.3 37.8 34.8
– 26.1 28.8 22.7 – 15.2 8.9 6.7 4.1
Source : HouseholdIncomeandExpenditureSurveySeries, DepartmentofCensusandStatistics
Total Income & Food Ratio (Food and Drink/Household Expenditure)
20161985/86 1990/91 1995/96 2002 2005 2006/07 2009/10 2012/13
70,000
60,000
50,000
40,000
Tota
l In
co
me
(R
s.)
Foo
d R
atio
(%
)
30,000
20,000
10,000
0 0
10
20
30
40
50
60
70
Total Income per Month per Houseold Food Ratio

SOCIO-ECONOMIC SERVICES133
Average Monthly Household Expenditure on Selected Food/Non-Food Itemsby HIES Survey Period – Sri Lanka
Table 13.2
ExpenditureGroup
HIESSurveyPeriod
1985/86 1990/91 1995/96 2002 2005 2006/07 2009/10 2012/13 2016
Food Expenditure
Rice WheatFlour Bread Condiments Pulses Vegetables Coconuts Meat Fish DriedFish Milk&MilkProducts Eggs Fruit Sugar OtherFood&Drinks
Total
Non-Food Expenditure
Housing FuelandLight ClothingandTextileandFoot-Wear PersonalCareandHealth TransportandCommunication Education CulturalandEntertainment Non-DurableHouseholdGoods ConsumerDurables OtherNon-ConsumerExpenditure LiquorandTobacco
Total
Source : HouseholdIncomeandExpenditureSurveySeries, DepartmentofCensusandStatistics
Average Monthly Expenditure (Rs.)
306 610 752 1,052 1,051 1,197 2,298 2,134 2,452 31 35 39 72 94 97 189 210 185 64 107 158 254 273 303 426 462 464 119 252 353 532 687 803 1,209 1,416 1,881 44 115 130 185 259 304 547 552 693 120 235 296 464 617 727 1,006 1,279 1,530 71 130 244 426 429 473 738 962 1,096 31 80 156 188 337 366 517 669 918 71 137 233 371 647 744 1,163 1,430 1,820 48 101 162 219 290 348 492 656 773 52 122 254 489 748 754 1,038 1,389 1,562 11 27 39 47 78 85 134 160 205 15 32 62 212 296 294 386 461 612 76 155 184 193 248 315 452 459 418 151 239 490 1,144 1,539 1,831 2,672 3,412 4,505
1,198 2,383 3,552 5,848 7,593 8,641 13,267 15,651 19,114
148 340 825 1,661 2,054 2,639 3,446 4,667 6,873 104 180 294 552 811 1,042 1,278 1,755 1,757 95 159 282 388 588 694 903 1,194 1,581 80 148 309 581 1,106 980 1,429 2,181 2,529 105 192 382 929 1,733 2,401 3,072 4,315 5,548 29 66 128 315 473 632 1,018 1,448 2,066 – 33 69 149 255 260 402 515 908 – 59 87 142 315 301 264 318 362 39 53 121 318 713 786 780 1,018 2,261 202 153 256 1,957 3,033 4,083 4,807 7,678 10,945 79 144 219 306 479 492 665 705 1,056
881 1,528 2,972 7,299 11,558 14,311 18,064 25,793 35,8865
Average Monthly Expenditure (% share)
25.3(a) 25.7(a) 21.2 18.0 13.8 13.9 17.3 13.6 12.8 2.6(a) 1.5(a) 1.1 1.2 1.2 1.1 1.4 1.3 1.0 5.3(a) 4.5(a) 4.4 4.3 3.6 3.5 3.2 3.0 2.4 9.8(a) 10.6(a) 9.9 9.1 9.0 9.3 9.1 9.0 9.8 3.6(a) 4.8(a) 3.7 3.2 3.4 3.5 4.1 3.5 3.6 9.9(a) 9.9(a) 8.3 7.9 8.1 8.4 7.6 8.2 8.0 5.9(a) 5.5(a) 6.9 7.3 5.6 5.5 5.6 6.1 5.7 2.6(a) 3.4(a) 4.4 3.2 4.4 4.2 3.9 4.3 4.8 5.9(a) 5.8(a) 6.6 6.3 8.5 8.6 8.8 9.1 9.5 4.0(a) 4.2(a) 4.6 3.7 3.8 4.0 3.7 4.2 4.0 4.3(a) 5.1(a) 7.1 8.4 9.9 8.7 7.8 8.9 8.2 0.9(a) 1.1(a) 1.1 0.8 1.0 1.0 1.0 1.0 1.1 1.2(a) 1.3(a) 1.7 3.6 3.9 3.4 2.9 2.9 3.2 6.3(a) 6.5(a) 5.2 3.3 3.3 3.6 3.4 2.9 2.2 12.5(a) 10.1(a) 13.8 19.6 20.3 21.2 20.1 21.8 23.6
100.0 100.0 100.0 100.0 100.0 100.0 100.0 100.0 100.0
16.8(a) 22.3 27.8 22.8 17.8 18.4 19.1 18.1 19.2 11.8(a) 11.8 9.9 7.6 7.0 7.3 7.1 6.8 4.9 10.8(a) 10.4 9.5 5.3 5.1 4.9 5.0 4.6 4.4 9.1(a) 9.7 10.4 8.0 9.6 6.9 7.9 8.5 7.0 11.9(a) 12.6 12.9 12.7 15.0 16.8 17.0 16.7 15.5 3.3(a) 4.3 4.3 4.3 4.1 4.4 5.6 5.6 5.8 – 2.2 2.3 2.0 2.2 1.8 2.2 2.0 2.5 – 3.9 2.9 1.9 2.7 2.1 1.5 1.2 1.0 4.4(a) 3.5 4.1 4.4 6.2 5.5 4.3 3.9 6.3 22.9(a) 10.0 8.6 26.8 26.2 28.5 26.6 29.8 30.5 9.0(a) 9.4 7.4 4.2 4.1 3.4 3.7 2.7 2.9
100.0 100.0 100.0 100.0 100.0 100.0 100.0 100.0 100.0
(a)Revised
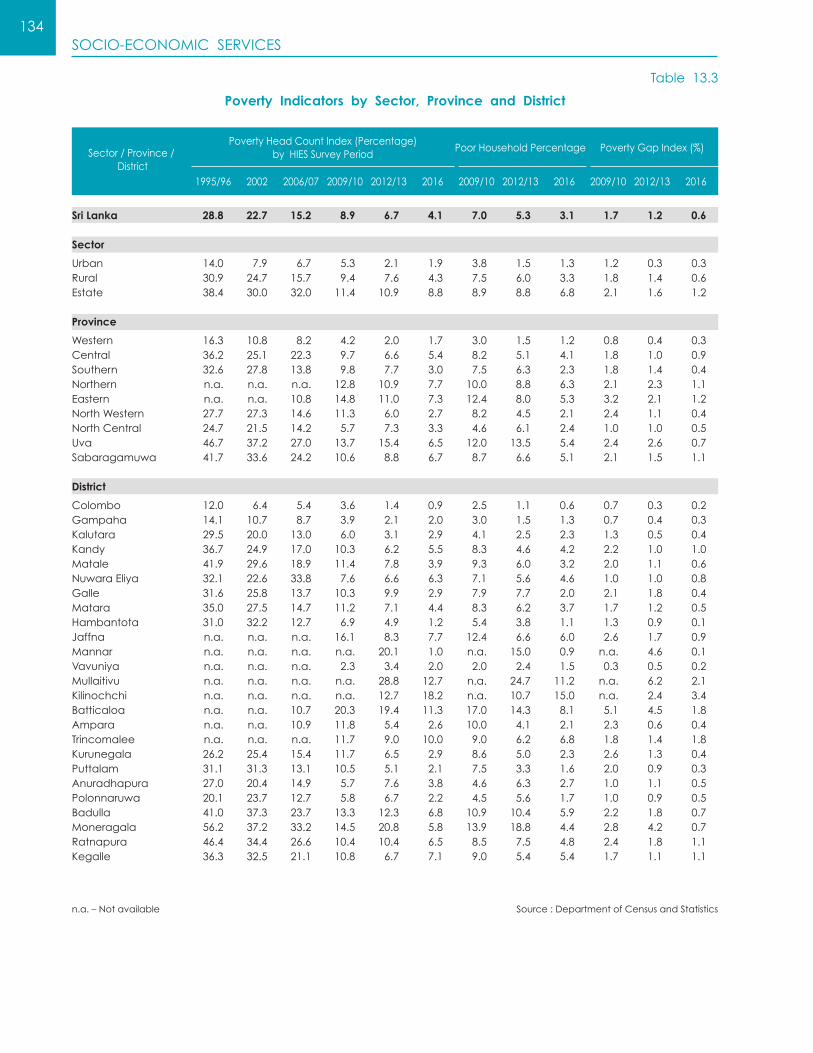
SOCIO-ECONOMIC SERVICES134
Poverty Indicators by Sector, Province and District
Table 13.3
Sector/Province/District
PovertyHeadCountIndex(Percentage)byHIESSurveyPeriod
PoorHouseholdPercentage PovertyGapIndex(%)
1995/96 2002 2006/07 2009/10 2012/13 2016 2009/10 2012/13 2016 2009/10 2012/13 2016
Sri Lanka
Sector
UrbanRuralEstate
Province
WesternCentralSouthernNorthernEasternNorthWesternNorthCentralUvaSabaragamuwa
District
ColomboGampahaKalutaraKandyMataleNuwaraEliyaGalleMataraHambantotaJaffnaMannarVavuniyaMullaitivuKilinochchiBatticaloaAmparaTrincomaleeKurunegalaPuttalamAnuradhapuraPolonnaruwaBadullaMoneragalaRatnapuraKegalle
28.8 22.7 15.2 8.9 6.7 4.1 7.0 5.3 3.1 1.7 1.2 0.6
14.0 7.9 6.7 5.3 2.1 1.9 3.8 1.5 1.3 1.2 0.3 0.3 30.9 24.7 15.7 9.4 7.6 4.3 7.5 6.0 3.3 1.8 1.4 0.6 38.4 30.0 32.0 11.4 10.9 8.8 8.9 8.8 6.8 2.1 1.6 1.2
16.3 10.8 8.2 4.2 2.0 1.7 3.0 1.5 1.2 0.8 0.4 0.3 36.2 25.1 22.3 9.7 6.6 5.4 8.2 5.1 4.1 1.8 1.0 0.9 32.6 27.8 13.8 9.8 7.7 3.0 7.5 6.3 2.3 1.8 1.4 0.4 n.a. n.a. n.a. 12.8 10.9 7.7 10.0 8.8 6.3 2.1 2.3 1.1 n.a. n.a. 10.8 14.8 11.0 7.3 12.4 8.0 5.3 3.2 2.1 1.2 27.7 27.3 14.6 11.3 6.0 2.7 8.2 4.5 2.1 2.4 1.1 0.4 24.7 21.5 14.2 5.7 7.3 3.3 4.6 6.1 2.4 1.0 1.0 0.5 46.7 37.2 27.0 13.7 15.4 6.5 12.0 13.5 5.4 2.4 2.6 0.7 41.7 33.6 24.2 10.6 8.8 6.7 8.7 6.6 5.1 2.1 1.5 1.1
12.0 6.4 5.4 3.6 1.4 0.9 2.5 1.1 0.6 0.7 0.3 0.2 14.1 10.7 8.7 3.9 2.1 2.0 3.0 1.5 1.3 0.7 0.4 0.3 29.5 20.0 13.0 6.0 3.1 2.9 4.1 2.5 2.3 1.3 0.5 0.4 36.7 24.9 17.0 10.3 6.2 5.5 8.3 4.6 4.2 2.2 1.0 1.0 41.9 29.6 18.9 11.4 7.8 3.9 9.3 6.0 3.2 2.0 1.1 0.6 32.1 22.6 33.8 7.6 6.6 6.3 7.1 5.6 4.6 1.0 1.0 0.8 31.6 25.8 13.7 10.3 9.9 2.9 7.9 7.7 2.0 2.1 1.8 0.4 35.0 27.5 14.7 11.2 7.1 4.4 8.3 6.2 3.7 1.7 1.2 0.5 31.0 32.2 12.7 6.9 4.9 1.2 5.4 3.8 1.1 1.3 0.9 0.1 n.a. n.a. n.a. 16.1 8.3 7.7 12.4 6.6 6.0 2.6 1.7 0.9 n.a. n.a. n.a. n.a. 20.1 1.0 n.a. 15.0 0.9 n.a. 4.6 0.1 n.a. n.a. n.a. 2.3 3.4 2.0 2.0 2.4 1.5 0.3 0.5 0.2 n.a. n.a. n.a. n.a. 28.8 12.7 n.a. 24.7 11.2 n.a. 6.2 2.1 n.a. n.a. n.a. n.a. 12.7 18.2 n.a. 10.7 15.0 n.a. 2.4 3.4 n.a. n.a. 10.7 20.3 19.4 11.3 17.0 14.3 8.1 5.1 4.5 1.8 n.a. n.a. 10.9 11.8 5.4 2.6 10.0 4.1 2.1 2.3 0.6 0.4 n.a. n.a. n.a. 11.7 9.0 10.0 9.0 6.2 6.8 1.8 1.4 1.8 26.2 25.4 15.4 11.7 6.5 2.9 8.6 5.0 2.3 2.6 1.3 0.4 31.1 31.3 13.1 10.5 5.1 2.1 7.5 3.3 1.6 2.0 0.9 0.3 27.0 20.4 14.9 5.7 7.6 3.8 4.6 6.3 2.7 1.0 1.1 0.5 20.1 23.7 12.7 5.8 6.7 2.2 4.5 5.6 1.7 1.0 0.9 0.5 41.0 37.3 23.7 13.3 12.3 6.8 10.9 10.4 5.9 2.2 1.8 0.7 56.2 37.2 33.2 14.5 20.8 5.8 13.9 18.8 4.4 2.8 4.2 0.7 46.4 34.4 26.6 10.4 10.4 6.5 8.5 7.5 4.8 2.4 1.8 1.1 36.3 32.5 21.1 10.8 6.7 7.1 9.0 5.4 5.4 1.7 1.1 1.1
Source : DepartmentofCensusandStatisticsn.a.–Notavailable

SOCIO-ECONOMIC SERVICES135
Daily Average Dietary Energy Consumption per Personby Poverty Status, Sector, Province and District 2012/13 and 2016
Table 13.4
Sector/Province/District
2012/13 2016
PoorHouseholds
Non-PoorHouseholds
AllHouseholds
PoorHouseholds
Non-PoorHouseholds
AllHouseholds
KiloCalories
Sri Lanka
Sector
UrbanRuralEstate
Province
WesternCentralSouthernNorthernEasternNorthWesternNorthCentralUvaSabaragamuwa
District
ColomboGampahaKalutaraKandyMataleNuwaraEliyaGalleMataraHambantotaJaffnaMannarVavuniyaMullaitivuKilinochchiBatticaloaAmparaTrincomaleeKurunegalaPuttalamAnuradhapuraPolonnaruwaBadullaMoneragalaRatnapuraKegalle
1,530 2,153 2,111 1,445 2,123 2,095
1,243 1,915 1,901 1,222 1,947 1,933 1,539 2,197 2,147 1,454 2,152 2,122 1,646 2,388 2,307 1,550 2,322 2,254
1,176 1,975 1,958 1,195 1,967 1,954 1,523 2,246 2,198 1,471 2,167 2,129 1,443 2,214 2,155 1,379 2,141 2,118 1,545 2,219 2,146 1,624 2,225 2,179 1,453 2,152 2,075 1,423 2,099 2,050 1,501 2,197 2,155 1,386 2,164 2,143 1,553 2,254 2,203 1,429 2,275 2,247 1,783 2,404 2,308 1,703 2,360 2,318 1,675 2,209 2,162 1,420 2,178 2,127
1,077 1,875 1,863 1,170 1,955 1,948 1,240 2,034 2,018 1,138 1,977 1,961 1,178 2,050 2,023 1,283 1,971 1,951 1,431 2,131 2,088 1,430 2,068 2,033 1,553 2,331 2,270 1,379 2,141 2,111 1,664 2,407 2,358 1,578 2,373 2,323 1,383 2,108 2,036 1,281 2,028 2,007 1,568 2,229 2,182 1,444 2,125 2,094 1,406 2,373 2,326 1,463 2,353 2,343 1,592 2,257 2,202 1,743 2,199 2,164 1281 1,961 1,825 1,670 2,235 2,230 1,486 2,201 2,177 1,666 2,328 2,315 1,584 2,115 1,962 1,514 2,262 2,167 1,699 2,314 2,236 1,419 2,151 2,018 1,386 2,091 1,954 1,504 2,066 2,002 1,546 2,193 2,158 1,378 2,161 2,141 1,558 2,155 2,101 1,319 2,030 1,959 1,530 2,184 2,142 1,374 2,203 2,179 1,425 2,224 2,183 1,418 2,083 2,069 1,539 2,225 2,172 1,400 2,279 2,245 1,587 2,315 2,266 1,536 2,266 2,250 1,894 2,425 2,359 1,688 2,373 2,326 1,664 2,361 2,216 1,735 2,337 2,302 1,761 2,289 2,234 1,449 2,243 2,192 1,500 2,109 2,069 1,386 2,091 2,041
Source : HouseholdIncomeandExpenditureSurvey2012/13and2016 DepartmentofCensusandStatistics

SOCIO-ECONOMIC SERVICES136
Housing Conditions and Ownership of Durable Goods by Sector2009/10, 2012/13 and 2016
Table 13.5(A)
Item
2009/10(a) 2012/13 2016
Urban Rural EstateAll
IslandUrban Rural Estate
AllIsland
Urban Rural EstateAll
Island
Percent
Wall Type(b)
Permanent SemiPermanent
Floor Type(c)
Permanent SemiPermanent
Roof Type(d)
Permanent SemiPermanent
Main Source of Drinking Water Safe NotSafe
Toilet Facilities ExclusivefortheHousehold SharingwithanotherHousehold PublicToiletFacilities NoToiletFacilities
Lighting Electricity Kerosene SolarEnergy Other
Cooking Fuel Firewood Gas Kerosene Other
Garbage Disposal CollectedbyLocalAuthorities Buried/Burned ProcessforFertilizer Dumpedwithinpremises Thrownawayoutsidepremises Other
Telecommunication Facilities FixedTelephoneLinesonly Mobileonly FixedandMobileConnections NoTelephoneFacilities
Household Equipments Radio/CassettePlayers Televisions VCD/DVDPlayers PersonalComputers Notusinganyofthese
Domestic Electrical Items SewingMachines WashingMachines Refrigerators Cookers(Gas/Electric/Kerosene) ElectricFans Notusinganyofthese
Vehicle Ownership Bicycle MotorCycles/Scooters ThreeWheelers MotorCars/Vans Buses/Lorries NoVehicle
94.1 91.5 89.1 91.7 96.0 92.8 95.0 93.5 97.30 95.1 96.2 95.5 5.9 8.5 10.9 8.3 4.0 7.2 5.0 6.5 2.7 4.9 3.8 4.5
97.1 87.6 83.1 88.7 98.4 91.6 84.9 92.4 98.9 95.2 89.1 95.6 2.9 12.4 16.9 11.3 1.6 8.4 15.1 7.6 1.1 4.8 10.9 4.4
91.1 88.9 23.0 86.0 95.5 91.5 32.3 89.6 96.1 94.2 33.0 91.9 8.9 11.1 77.0 14.0 4.5 8.5 67.7 10.4 3.9 5.8 67.0 8.1
97.4 87.6 60.3 87.7 98.8 90.0 46.3 89.7 97.8 89.3 44.7 88.8 2.6 12.4 39.7 12.3 1.2 10.0 53.7 10.3 2.2 10.7 55.3 11.2
86.4 90.9 74.0 89.5 90.0 90.7 76.2 89.9 91.9 92.4 77.3 91.7 7.1 6.2 13.1 6.6 7.3 7.8 21.1 8.4 6.6 7.0 19.8 7.5 5.1 0.4 7.2 1.4 2.7 0.2 2.1 0.7 1.6 0.1 2.6 0.4 1.3 2.5 5.6 2.5 0.0 1.2 0.7 0.9 – 0.5 0.4 0.4
95.6 84.1 76.9 85.3 98.0 88.8 83.0 90.2 98.9 96.7 92.7 96.9 4.4 13.7 22.5 12.8 1.8 10.2 16.5 9.0 0.8 3.0 7.1 2.8 0.0 2.2 0.7 1.8 0.2 0.9 0.3 0.7 0.3 0.3 0.2 0.3 – – – – 0.0 0.2 0.2 0.2 0.1 … – …
39.2 86.7 97.3 80.5 36.7 86.7 95.7 78.5 25.1 76.8 85.8 68.6 48.0 11.3 1.5 16.0 54.7 11.4 2.4 18.5 68.6 21.7 12.9 29.1 11.4 1.1 0.6 2.5 6.5 1.0 1.1 1.9 4.5 0.6 0.9 1.2 1.3 0.9 0.6 0.9 2.2 1.0 0.6 1.1 1.8 1.0 0.4 1.1
67.1 7.2 1.3 15.3 74.8 9.4 4.4 20.4 79.9 10.1 2.1 21.4 21.1 62.5 31.3 55.2 16.1 47.7 29.9 41.5 13.8 50.7 36.4 43.9 1.9 7.5 4.7 6.6 2.0 6.5 3.2 5.6 1.2 4.4 2.6 3.8 2.5 18.3 15.2 16.0 5.9 35.1 43.6 30.5 4.4 33.9 37.3 29.1 6.4 4.0 46.2 6.3 0.4 0.5 7.5 0.8 0.3 0.4 7.5 0.7 1.1 0.5 1.2 0.7 0.8 0.8 11.3 1.2 0.4 0.6 14.1 1.1
10.6 17.7 25.1 17.0 4.5 6.3 15.4 6.4 3.0 3.1 7.7 3.3 32.5 29.7 22.2 29.8 46.0 52.7 37.4 50.9 56.8 63.4 53.3 61.9 41.7 29.3 13.8 30.3 42.6 28.0 22.6 30.3 35.5 24.6 22.4 26.3 15.2 23.3 38.9 22.9 6.8 13.0 24.7 12.5 4.8 8.9 16.6 8.5
76.5 75.6 69.4 75.4 73.7 71.2 65.7 71.4 61.7 64.0 54.9 63.2 86.9 79.3 70.5 80.0 90.4 81.6 73.3 82.7 88.9 86.1 81.2 86.3 48.7 33.5 39.8 35.9 53.4 40.7 46.4 43.1 40.7 35.5 45.1 36.8 23.6 11.2 2.2 12.5 34.5 15.9 3.8 18.5 34.0 18.2 5.4 20.3 7.4 10.1 17.4 10.1 4.9 9.5 16.7 9.0 5.9 7.3 11.6 7.3
50.7 42.7 20.2 42.7 52.0 41.1 17.5 41.9 44.1 39.1 16.1 39.0 28.0 11.3 1.7 13.1 37.4 13.5 2.3 17.2 40.2 17.1 2.5 20.3 60.2 37.9 7.9 39.6 67.7 43.2 14.3 46.2 68.8 51.4 17.3 52.9 73.1 33.6 11.6 38.1 75.2 37.1 21.1 42.9 81.1 48.9 40.1 53.9 78.1 48.4 11.5 50.8 84.0 52.5 19.3 56.5 83.3 59.2 17.9 61.5 11.5 34.7 68.6 33.1 7.7 30.6 57.9 27.8 5.6 22.2 44.3 20.4
35.6 42.5 6.7 39.8 31.1 39.0 4.9 36.2 25.2 32.6 3.3 30.1 21.2 27.9 4.1 25.8 27.6 32.2 6.5 30.3 30.1 39.9 5.7 36.8 6.1 6.9 2.3 6.5 9.9 11.1 4.4 10.6 13.3 14.5 9.1 14.1 10.4 5.1 1.1 5.6 15.4 5.5 1.0 7.0 16.2 8.3 0.9 9.3 1.4 1.9 0.4 1.8 1.9 2.3 0.4 2.2 1.1 3.3 0.6 2.8 43.0 38.8 87.3 41.8 38.2 37.0 85.4 39.2 36.9 33.5 82.6 36.1
(a) ExcludingMannar,KilinochchiandMullaitivudistricts.
(b) Permanent–Brick,Cabok,CementBlock,PressedSoilBlock SemiPermanent–Mud,Plank/Takaran,Cadjan/Palmyrah,Other
(c) Permanent–Cement,Terrazzo/Tile,Concrete SemiPermanent–Mud,Wood,Sand,Other
Source : HouseholdIncomeandExpenditureSurvey 2009/10,2012/13and2016, DepartmentofCensusandStatistics
(d) Permanent–Tile,Asbestos,Concrete SemiPermanent–Takaran,Cadjan/MetalSheet,Palmyrah,
Straw,Other
…Neglegible

SOCIO-ECONOMIC SERVICES137
Housing Conditions and Ownership of Durable Goods by Province – 2012/13
Table 13.5(B)
Percent
Wall Type(a)
Permanent SemiPermanent
Floor Type(b)
Permanent SemiPermanent
Roof Type(c)
Permanent SemiPermanent
Main Source of Drinking Water Safe NotSafe
Toilet Facilities ExclusivefortheHousehold SharingwithanotherHousehold PublicToiletFacilities NoToiletFacilities
Lighting Electricity Kerosene SolarEnergy
Cooking Fuel Firewood Gas Kerosene Other
Garbage Disposal CollectedbyLocalAuthorities Buried/Burned ProcessforFertilizer Dumpedwithinpremises Thrownawayoutsidepremises Other
Telecommunication Facilities FixedTelephoneLinesonly Mobileonly FixedandMobileConnections NoTelephoneFacilities
Household Equipments Radio/CassettePlayers Televisions VCD/DVDPlayers PersonalComputers Notusinganyofthese
Domestic Electrical Items SewingMachines WashingMachines Refrigerators Cookers(Gas/Electric/Kerosene) ElectricFans Notusinganyofthese
Vehicle Ownership Bicycle MotorCycles/Scooters ThreeWheelers MotorCars/Vans Buses/Lorries NoVehicle
(a) Permanent–Brick,Cabok,CementBlock,PressedSoilBlock SemiPermanent–Plank/MetalSheet,Cadjan/Palmyrah,Other
(b) Permanent–Cement,Terrazzo/Tile,Concrete SemiPermanent–Mud,Wood,Sand,Other
(c) Permanent–Tile,Asbestos,Concrete SemiPermanent–Takaran,Cadjan/Palmyrah,Other
Source : HouseholdIncomeandExpenditureSurvey 2012/13,DepartmentofCensusandStatistics
Item Western Central Southern Northern EasternNorth
WesternNorthCentral
UvaSabara-gamuwa
AllIsland
95.2 95.3 93.7 82.1 91.2 94.0 94.6 91.8 93.3 93.5 4.8 4.7 6.3 17.9 8.8 6.0 5.4 8.2 6.7 6.5
98.3 89.0 93.9 88.4 92.5 93.5 86.2 78.8 91.7 92.4 1.7 11.0 6.1 11.6 7.5 6.5 13.8 21.2 8.3 7.6
96.1 75.7 95.7 80.4 90.0 90.8 92.4 81.5 87.5 89.6 3.9 24.3 4.3 19.6 10.0 9.2 7.6 18.5 12.5 10.4
97.1 77.6 88.2 95.1 97.2 92.9 93.4 74.8 80.3 89.7 2.9 22.4 11.8 4.9 2.8 7.1 6.6 25.2 19.7 10.3
91.0 89.3 93.1 83.9 82.5 91.4 90.4 89.3 91.2 89.9 7.4 10.0 6.7 9.8 11.5 7.4 8.2 9.7 8.8 8.4 1.6 0.6 0.1 0.3 1.1 0.1 0.3 0.6 0.0 0.7 0.1 0.1 0.1 5.9 4.9 1.1 1.1 0.5 0.0 0.9
97.6 92.5 94.4 66.0 79.9 89.1 87.4 83.7 88.2 90.2 2.2 7.1 5.2 31.9 19.6 9.4 11.1 14.1 11.1 9.0 0.2 0.4 0.3 2.0 0.5 1.5 1.0 2.0 0.8 0.7 0.0 0.0 0.1 0.1 0.2 0.0 1.0 0.2 0.0 0.2
53.0 84.3 85.3 87.3 77.5 92.5 94.8 95.2 91.6 78.5 41.0 13.8 13.0 8.9 16.3 6.2 4.6 4.2 7.7 18.5 4.4 1.0 0.3 3.3 4.2 0.2 0.0 0.1 0.2 1.9 1.6 0.7 1.4 0.5 1.9 1.2 0.6 0.5 0.5 1.1
40.2 12.2 11.6 12.4 43.0 6.7 4.9 6.9 8.8 20.4 35.6 35.5 38.1 54.2 35.0 55.5 74.3 37.6 32.4 41.5 4.2 6.8 8.0 9.3 0.7 5.8 3.1 8.4 6.1 5.6 18.7 37.9 41.1 23.1 20.3 31.4 17.6 44.5 50.8 30.5 0.5 2.3 0.6 0.8 1.1 0.3 0.0 0.7 0.7 0.8 0.8 5.3 0.5 0.1 0.0 0.3 0.1 1.7 1.3 1.2
4.4 8.6 6.7 2.5 3.4 6.2 8.9 12.9 7.5 6.4 47.4 45.9 53.8 68.6 61.2 56.6 52.7 38.9 45.7 50.9 41.3 34.4 27.5 16.9 11.1 25.3 23.6 30.5 29.2 30.3 6.9 11.1 12.0 12.0 24.3 11.9 14.8 17.8 17.6 12.5
74.8 74.7 74.7 50.4 51.5 73.0 70.4 74.4 75.6 71.4 91.6 85.2 85.0 54.8 66.1 83.4 80.9 77.6 82.0 82.7 52.3 47.3 39.8 30.2 31.3 40.0 35.6 37.8 43.9 43.1 31.3 19.0 14.2 14.8 9.2 15.4 10.1 8.0 12.3 18.5 4.3 7.2 6.4 25.1 22.2 8.4 9.3 11.0 9.0 9.0
53.7 42.9 45.1 18.4 25.7 43.0 36.1 30.0 38.0 41.9 32.3 15.3 11.7 4.5 10.5 15.7 7.4 6.2 10.1 17.2 67.2 40.3 45.6 20.8 29.3 47.5 38.9 23.8 38.1 46.2 69.0 43.1 37.3 22.2 33.5 36.1 26.9 17.8 29.0 42.9 79.4 33.8 58.1 39.8 61.4 55.5 56.4 27.3 43.3 56.5 10.3 35.4 25.6 51.6 30.7 27.8 31.5 51.7 38.8 27.8
27.7 11.4 41.1 81.6 60.4 52.7 66.7 19.1 14.4 36.2 31.8 12.5 32.4 34.4 29.8 48.3 49.7 15.6 18.3 30.3 12.6 10.1 12.0 5.1 5.3 11.5 11.7 7.8 10.6 10.6 13.8 4.9 5.1 1.8 1.6 6.6 3.8 3.0 4.9 7.0 2.2 2.1 2.1 0.3 1.0 4.1 2.7 1.7 1.6 2.2 36.3 67.5 34.8 13.1 28.0 21.6 13.5 63.6 62.2 39.2
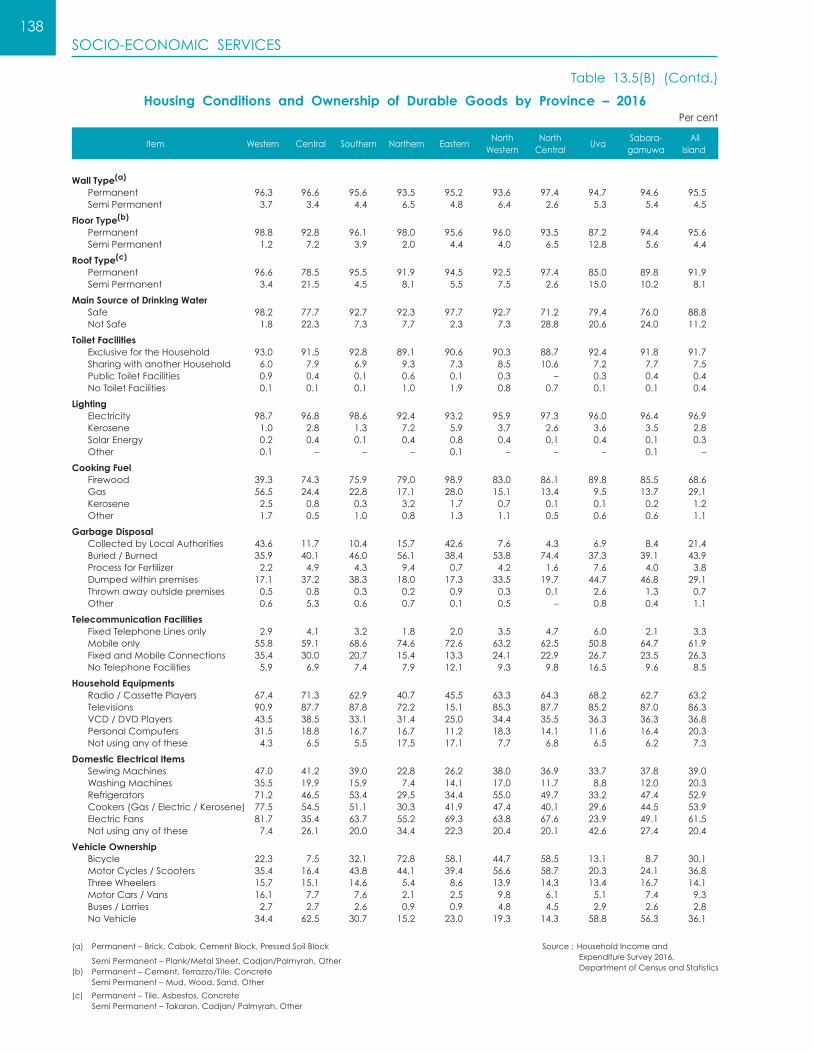
SOCIO-ECONOMIC SERVICES138
Housing Conditions and Ownership of Durable Goods by Province – 2016
Table 13.5(B) (Contd.)
Percent
Wall Type(a)
Permanent SemiPermanent
Floor Type(b)
Permanent SemiPermanent
Roof Type(c)
Permanent SemiPermanent
Main Source of Drinking Water Safe NotSafe
Toilet Facilities ExclusivefortheHousehold SharingwithanotherHousehold PublicToiletFacilities NoToiletFacilities
Lighting Electricity Kerosene SolarEnergy Other
Cooking Fuel Firewood Gas Kerosene Other
Garbage Disposal CollectedbyLocalAuthorities Buried/Burned ProcessforFertilizer Dumpedwithinpremises Thrownawayoutsidepremises Other
Telecommunication Facilities FixedTelephoneLinesonly Mobileonly FixedandMobileConnections NoTelephoneFacilities
Household Equipments Radio/CassettePlayers Televisions VCD/DVDPlayers PersonalComputers Notusinganyofthese
Domestic Electrical Items SewingMachines WashingMachines Refrigerators Cookers(Gas/Electric/Kerosene) ElectricFans Notusinganyofthese
Vehicle Ownership Bicycle MotorCycles/Scooters ThreeWheelers MotorCars/Vans Buses/Lorries NoVehicle
Item Western Central Southern Northern EasternNorth
WesternNorthCentral
UvaSabara-gamuwa
AllIsland
96.3 96.6 95.6 93.5 95.2 93.6 97.4 94.7 94.6 95.5 3.7 3.4 4.4 6.5 4.8 6.4 2.6 5.3 5.4 4.5
98.8 92.8 96.1 98.0 95.6 96.0 93.5 87.2 94.4 95.6 1.2 7.2 3.9 2.0 4.4 4.0 6.5 12.8 5.6 4.4
96.6 78.5 95.5 91.9 94.5 92.5 97.4 85.0 89.8 91.9 3.4 21.5 4.5 8.1 5.5 7.5 2.6 15.0 10.2 8.1
98.2 77.7 92.7 92.3 97.7 92.7 71.2 79.4 76.0 88.8 1.8 22.3 7.3 7.7 2.3 7.3 28.8 20.6 24.0 11.2
93.0 91.5 92.8 89.1 90.6 90.3 88.7 92.4 91.8 91.7 6.0 7.9 6.9 9.3 7.3 8.5 10.6 7.2 7.7 7.5 0.9 0.4 0.1 0.6 0.1 0.3 – 0.3 0.4 0.4 0.1 0.1 0.1 1.0 1.9 0.8 0.7 0.1 0.1 0.4
98.7 96.8 98.6 92.4 93.2 95.9 97.3 96.0 96.4 96.9 1.0 2.8 1.3 7.2 5.9 3.7 2.6 3.6 3.5 2.8 0.2 0.4 0.1 0.4 0.8 0.4 0.1 0.4 0.1 0.3 0.1 – – – 0.1 – – – 0.1 –
39.3 74.3 75.9 79.0 98.9 83.0 86.1 89.8 85.5 68.6 56.5 24.4 22.8 17.1 28.0 15.1 13.4 9.5 13.7 29.1 2.5 0.8 0.3 3.2 1.7 0.7 0.1 0.1 0.2 1.2 1.7 0.5 1.0 0.8 1.3 1.1 0.5 0.6 0.6 1.1
43.6 11.7 10.4 15.7 42.6 7.6 4.3 6.9 8.4 21.4 35.9 40.1 46.0 56.1 38.4 53.8 74.4 37.3 39.1 43.9 2.2 4.9 4.3 9.4 0.7 4.2 1.6 7.6 4.0 3.8 17.1 37.2 38.3 18.0 17.3 33.5 19.7 44.7 46.8 29.1 0.5 0.8 0.3 0.2 0.9 0.3 0.1 2.6 1.3 0.7 0.6 5.3 0.6 0.7 0.1 0.5 – 0.8 0.4 1.1
2.9 4.1 3.2 1.8 2.0 3.5 4.7 6.0 2.1 3.3 55.8 59.1 68.6 74.6 72.6 63.2 62.5 50.8 64.7 61.9 35.4 30.0 20.7 15.4 13.3 24.1 22.9 26.7 23.5 26.3 5.9 6.9 7.4 7.9 12.1 9.3 9.8 16.5 9.6 8.5
67.4 71.3 62.9 40.7 45.5 63.3 64.3 68.2 62.7 63.2 90.9 87.7 87.8 72.2 15.1 85.3 87.7 85.2 87.0 86.3 43.5 38.5 33.1 31.4 25.0 34.4 35.5 36.3 36.3 36.8 31.5 18.8 16.7 16.7 11.2 18.3 14.1 11.6 16.4 20.3 4.3 6.5 5.5 17.5 17.1 7.7 6.8 6.5 6.2 7.3
47.0 41.2 39.0 22.8 26.2 38.0 36.9 33.7 37.8 39.0 35.5 19.9 15.9 7.4 14.1 17.0 11.7 8.8 12.0 20.3 71.2 46.5 53.4 29.5 34.4 55.0 49.7 33.2 47.4 52.9 77.5 54.5 51.1 30.3 41.9 47.4 40.1 29.6 44.5 53.9 81.7 35.4 63.7 55.2 69.3 63.8 67.6 23.9 49.1 61.5 7.4 26.1 20.0 34.4 22.3 20.4 20.1 42.6 27.4 20.4
22.3 7.5 32.1 72.8 58.1 44.7 58.5 13.1 8.7 30.1 35.4 16.4 43.8 44.1 39.4 56.6 58.7 20.3 24.1 36.8 15.7 15.1 14.6 5.4 8.6 13.9 14.3 13.4 16.7 14.1 16.1 7.7 7.6 2.1 2.5 9.8 6.1 5.1 7.4 9.3 2.7 2.7 2.6 0.9 0.9 4.8 4.5 2.9 2.6 2.8 34.4 62.5 30.7 15.2 23.0 19.3 14.3 58.8 56.3 36.1
(a) Permanent–Brick,Cabok,CementBlock,PressedSoilBlock
SemiPermanent–Plank/MetalSheet,Cadjan/Palmyrah,Other(b) Permanent–Cement,Terrazzo/Tile,Concrete SemiPermanent–Mud,Wood,Sand,Other
(c) Permanent–Tile,Asbestos,Concrete SemiPermanent–Takaran,Cadjan/Palmyrah,Other
Source : HouseholdIncomeand ExpenditureSurvey2016, DepartmentofCensusandStatistics

SOCIO-ECONOMIC SERVICES139
Key Socio-Economic Indicators by Sector2009/10, 2012/13 and 2016
Table 13.6(A)
Item
2009/10(a) 2012/13 2016
Urban Rural EstateAll
IslandUrban Rural Estate
AllIsland
Urban Rural EstateAll
Island
Household Characteristics
NumberofIndividualsperHousehold NumberofIncomeReceiversper Household
Population Distribution
By Gender, % Male Female
By Age Group, % 0–14Years 15–59Years Over59Years
By Educational Attainment, % NoSchooling UptoGrade5 Grade6–10 PassedG.C.E.(O/L) PassedG.C.E.(A/L)andAbove
Income
Mean Income, Rs. per Month PerHousehold PerPerson
Median Income, Rs. per Month PerHousehold PerPerson
Income Shares by Deciles of Households, % 1stDecile 2ndDecile 3rdDecile 4thDecile 5thDecile 6thDecile 7thDecile 8thDecile 9thDecile 10thDecile
Income Share by Households, % Richest20% Poorest20% Middle60%
Gini Coefficient, One Month Income GiniCoefficient(Households) GiniCoefficient(PerPerson) GiniCoefficient(IncomeReceivers)
Expenditure, Rs. per Month Per Household
Household Expenditure Share, % Food Housing FuelandLight PersonalCareandHealthExpenses Transport Communication Education CulturalActivitiesandEntertainments Non-DurableHouseholdGoods andServices ClothingTextileandFootwear DurableHouseholdGoods OtherMiscellaneousExpenses OtherRareExpenses Liquor,NarcoticDrugsandTobacco
4.3 4.0 4.2 4.0 4.0 3.8 4.3 3.9 4.0 3.8 4.1 3.8 1.9 1.7 2.1 1.8 1.8 1.7 2.1 1.8 1.9 1.8 2.0 1.8
47.7 47.4 47.6 47.4 47.4 47.0 48.0 47.1 46.9 46.8 47.1 46.8 52.3 52.6 52.4 52.6 52.6 53.0 52.0 52.9 53.1 53.2 52.9 53.2
25.3 25.9 29.7 26.0 24.2 26.0 31.1 25.9 23.8 25.3 30.3 25.3 61.9 61.8 59.9 61.8 61.5 60.6 57.0 60.6 60.1 59.1 57.0 59.2 12.8 12.3 10.5 12.3 14.3 13.5 11.9 13.6 16.1 15.6 12.7 15.5
2.5 4.0 13.1 4.2 2.2 3.5 12.2 3.7 2.4 3.1 10.1 3.3 21.6 24.6 43.0 25.1 19.2 25.0 42.0 24.7 19.3 23.5 39.6 23.5 42.1 45.5 37.7 44.6 39.8 44.8 38.7 43.6 40.4 45.0 41.8 44.1 17.5 14.9 3.8 14.7 18.2 15.5 4.9 15.5 18.4 15.1 5.4 15.3 16.2 10.8 2.3 11.2 20.5 11.1 2.2 12.4 19.4 13.2 3.0 13.8
47,783 35,228 24,162 36,451 69,880 41,478 30,220 45,878 88,692 58,137 34,804 62,237 11,245 8,916 5,782 9,104 17,262 10,843 7,100 11,819 22,297 15,508 8,566 16,377
31,000 23,126 17,366 23,746 42,267 29,376 24,087 30,814 57,833 42,133 29,134 43,511 6,925 5,758 4,161 5,803 10,420 7,657 5,503 7,881 14,090 11,140 7,107 11,307
1.7 1.6 2.1 1.6 1.5 1.5 1.9 1.5 1.7 1.6 2.1 1.6 2.9 2.9 3.8 2.9 2.8 3.2 3.7 3.0 3.1 3.3 3.8 3.2 4.0 4.0 4.8 3.9 3.7 4.4 5.1 4.1 4.1 4.5 5.3 4.3 5.0 4.9 5.7 4.9 4.6 5.4 6.4 5.1 5.0 5.5 6.6 5.3 6.0 6.0 6.7 6.0 5.6 6.5 7.4 6.2 5.8 6.7 7.8 6.4 7.2 7.2 7.8 7.1 6.7 7.7 8.7 7.3 7.2 7.9 9.0 7.6 8.8 8.7 9.1 8.7 8.3 9.2 9.9 8.9 8.9 9.5 10.6 9.2 11.1 10.9 10.6 10.8 10.3 11.4 11.8 10.9 10.7 11.7 12.5 11.5 15.1 14.5 13.4 14.6 14.5 15.1 14.8 14.9 14.8 15.6 15.8 15.4 38.2 39.3 36.0 39.5 42.0 35.6 30.3 38.0 38.6 33.7 26.7 35.4
53.3 53.8 49.4 54.1 56.5 50.7 45.1 52.9 53.4 49.3 42.5 50.8 4.7 4.5 5.9 4.5 4.4 4.7 5.7 4.5 4.9 4.9 5.9 4.8 42.1 41.7 44.7 41.4 39.2 44.6 49.3 42.6 41.7 45.8 51.6 44.4
0.48 0.49 0.43 0.49 0.51 0.45 0.39 0.48 0.48 0.44 0.36 0.45 0.49 0.48 0.42 0.49 0.51 0.44 0.37 0.46 0.48 0.42 0.34 0.44 0.54 0.54 0.50 0.55 0.56 0.51 0.44 0.53 0.53 0.50 0.42 0.51
44,928 29,423 23,988 31,331 58,930 38,274 29,379 41,444 77,337 51,377 34,851 54,999
35.6 43.7 50.8 42.3 32.1 39.2 49.8 37.8 31.2 35.4 48.5 34.8 16.9 9.8 4.3 11.0 17.5 9.4 5.0 11.3 18.9 10.7 6.0 12.5 5.0 3.8 4.0 4.1 5.5 3.8 4.1 4.2 3.9 3.0 3.5 3.2 5.4 4.4 3.7 4.6 5.3 5.3 3.5 5.3 4.5 4.7 3.1 4.6 6.7 7.7 4.6 7.4 8.9 8.1 5.6 8.3 9.3 7.8 5.4 8.1 2.8 2.3 1.7 2.4 2.7 2.0 1.7 2.2 2.2 1.9 1.7 2.0 4.0 3.1 1.6 3.2 4.7 3.2 1.8 3.5 4.6 3.5 2.5 3.8 1.1 1.3 2.1 1.3 1.4 1.2 1.0 1.2 1.9 1.6 0.9 1.7 1.4 1.1 1.2 1.2 1.6 1.1 1.1 1.2 1.5 1.0 0.9 1.2 2.3 3.0 3.7 2.9 2.4 3.0 3.0 2.9 2.5 3.0 3.7 2.9 2.0 2.6 2.1 2.5 1.5 2.8 2.3 2.5 3.1 4.5 2.5 4.1 10.8 9.3 8.4 9.5 9.2 11.5 10.1 10.9 7.8 11.9 9.7 10.8 4.2 5.7 6.7 5.5 6.4 7.5 5.7 7.2 7.1 9.1 6.1 8.6 1.5 2.1 5.1 2.1 1.0 1.8 5.4 1.7 1.4 2.0 5.5 1.9
(a) ExcludingMannar,KilinochchiandMullaitivudistricts. Source : HouseholdIncomeandExpenditureSurvey
2009/10,2012/13and2016,
DepartmentofCensusandStatistics

SOCIO-ECONOMIC SERVICES140
Key Socio-Economic Indicators by Provinces – 2012/13
Table 13.6(B)
Item Western Central Southern Northern EasternNorth
WesternNorthCentral
UvaSabara-gamuwa
AllIsland
4.0 4.0 3.8 4.1 4.0 3.7 3.7 3.8 3.8 3.9
1.9 1.8 1.8 1.8 1.6 1.7 1.7 1.6 1.8 1.8
47.5 46.6 47.0 47.0 46.4 47.0 47.1 47.1 47.4 47.1 52.5 53.4 53.0 53.0 53.6 53.0 52.9 52.9 52.6 52.9
23.8 26.7 25.7 26.9 31.2 25.8 27.2 28.2 24.1 25.9 61.4 59.6 59.1 60.6 60.0 61.3 61.5 59.8 60.7 60.6 14.7 13.8 15.2 12.5 8.9 12.9 11.2 11.9 15.2 13.6
2.2 5.2 4.0 2.1 4.4 3.5 3.6 6.3 4.5 3.7 18.3 27.0 25.4 27.1 33.8 25.1 28.3 29.7 25.7 24.7 41.5 42.7 43.1 47.7 40.7 46.3 47.3 45.5 45.0 43.6 19.5 13.6 15.6 13.9 13.1 14.3 13.4 10.8 14.6 15.5 18.4 11.5 11.8 9.3 8.0 10.7 7.4 7.7 10.1 12.4
64,152 40,146 41,834 34,286 30,676 42,756 36,632 35,638 40,375 45,878 16,124 10,104 10,973 8,339 7,622 11,596 9,877 9,382 10,718 11,819 33,564 22,292 23,606 18,916 19,836 25,854 21,848 21,909 23,134 25,963
42,100 28,900 28,921 23,571 22,710 29,343 29,707 24,228 27,775 30,814 10,567 7,150 7,624 5,540 5,385 7,927 7,824 6,110 7,229 7,881 20,500 15,083 16,000 12,692 15,000 16,612 15,930 13,867 15,000 16,667
53.1 49.6 50.9 53.0 49.8 52.0 44.5 53.8 51.9 52.9 5.0 5.0 5.2 3.8 4.2 4.4 5.5 4.1 5.1 4.5 41.9 45.4 43.9 43.2 46.0 43.6 50.1 42.1 43.0 42.6
0.47 0.44 0.45 0.48 0.45 0.47 0.39 0.48 0.46 0.48 0.46 0.43 0.44 0.47 0.44 0.47 0.38 0.47 0.44 0.46 0.54 0.50 0.51 0.57 0.50 0.53 0.47 0.54 0.52 0.53
58,298 38,989 36,430 34,562 30,886 37,665 33,935 28,867 32,376 41,444
100.0 100.0 100.0 100.0 100.0 100.0 100.0 100.0 100.0 100.0 13.2 20.3 15.9 20.5 15.8 16.4 19.8 22.5 19.0 16.7 16.2 8.2 9.2 8.8 9.6 10.2 6.2 7.5 10.1 11.3 3.2 4.3 3.8 3.3 1.9 3.2 3.9 4.6 4.2 3.5 7.4 8.6 8.5 6.2 7.4 8.5 9.6 10.7 8.8 8.2 4.6 4.4 2.0 4.9 7.3 4.9 4.0 2.9 3.0 4.3 10.2 4.9 10.5 13.1 13.3 9.4 8.8 5.4 5.3 9.1 4.5 4.1 4.5 0.5 2.1 5.5 4.6 3.7 5.2 4.2 5.5 5.9 7.1 6.4 5.8 6.4 7.3 5.1 7.7 6.2 8.1 9.0 10.5 8.7 11.2 9.1 9.7 8.3 9.1 9.0 10.0 9.7 9.5 7.8 6.9 7.5 7.1 8.4 8.4 8.9 1.7 3.2 2.0 3.3 3.0 2.3 3.2 3.6 2.7 2.4 2.5 3.2 3.3 4.0 3.5 3.1 3.6 2.9 3.1 3.0 3.2 2.8 3.3 2.7 2.7 3.0 2.5 2.9 2.5 2.9 9.7 11.5 9.7 9.9 9.3 10.6 9.7 11.4 10.8 10.2
100.0 100.0 100.0 100.0 100.0 100.0 100.0 100.0 100.0 100.0 20.8 18.0 17.3 9.3 15.0 14.6 14.0 16.8 17.9 18.1 6.8 6.2 5.7 10.6 12.3 5.7 6.1 6.3 6.6 6.8 8.7 7.4 7.8 9.5 12.0 8.2 8.2 5.5 9.0 8.5 13.0 13.1 11.7 11.0 11.6 15.5 14.7 14.6 14.4 13.3 3.5 3.4 3.1 4.1 3.8 3.3 3.4 3.5 3.4 3.5 6.4 5.3 5.4 4.9 4.9 4.9 4.2 4.5 5.4 5.6 2.2 2.3 2.2 1.8 1.2 1.3 2.2 1.6 1.6 2.0
2.0 1.8 1.7 2.5 2.3 2.0 2.1 2.4 1.7 2.0 3.4 5.4 4.9 6.2 8.4 5.0 5.9 6.0 5.3 4.6 3.1 3.9 4.6 4.5 4.5 4.5 5.6 6.0 4.6 3.9 17.3 17.0 18.2 15.8 11.7 19.5 21.5 14.2 18.4 17.5 11.0 12.7 14.0 17.0 8.9 12.3 9.1 12.6 7.6 11.5 1.7 3.5 3.3 2.7 3.4 3.2 3.0 6.0 4.0 2.7
Household Characteristics
NumberofIndividualsperHousehold NumberofIncomeReceiversper Household
Population Distribution
By Gender, % Male Female
By Age Group, % 0–14Years 15–59Years Over59Years
By Educational Attainment, % NoSchooling UptoGrade5 Grade6–10 PassedG.C.E.(O/L) PassedG.C.E.(A/L)andAbove
Income
Mean Income, Rs. per Month PerHousehold PerPerson PerIncomeReceiver
Median Income, Rs. per Month PerHousehold PerPerson PerIncomeReceiver
Income Share by Households, % Richest20% Poorest20% Middle60%
Gini Coefficient, One Month Income GiniCoefficient(Households) GiniCoefficient(PerPerson) GiniCoefficient(IncomeReceivers)
Expenditure, Rs. per Month Per Household
Household Expenditure Share, %
All Food Cereal PreparedFoods Pulses Vegetables Meat Fish DriedFish Coconut Condiments Milk&MilkProducts FatandOil Sugar,Juggery&Treacle Fruits Other
All Non-Food Housing FuelandLight PersonalCareandHealthExpenses Transport Communication Education CulturalActivitiesandEntertainment Non-DurableHouseholdGoods &Services Clothing,TextileandFootwear DurableHouseholdGoods OtherMiscellaneousExpenses OtherRareExpenses Liquor,NarcoticDrugsandTobacco
Source : HouseholdIncomeandExpenditureSurvey 2012/13,DepartmentofCensusandStatistics

SOCIO-ECONOMIC SERVICES141
Key Socio-Economic Indicators by Province – 2016
Table 13.6(B) (Contd.)
Item Western Central Southern Northern EasternNorth
WesternNorthCentral
UvaSabara-gamuwa
AllIsland
Household Characteristics
NumberofIndividualsperHousehold NumberofIncomeReceiversper Household
Population Distribution
By Gender, % Male Female
By Age Group, % 0–14Years 15–59Years Over59Years
By Educational Attainment, % NoSchooling UptoGrade5 Grade6–10 PassedG.C.E.(O/L) PassedG.C.E.(A/L)andAbove
Income
Mean Income, Rs. per Month PerHousehold PerPerson PerIncomeReceiver
Median Income, Rs. per Month PerHousehold PerPerson PerIncomeReceiver
Income Share by Households, % Richest20% Poorest20% Middle60%
Gini Coefficient, One Month Income GiniCoefficient(Households) GiniCoefficient(PerPerson) GiniCoefficient(IncomeReceivers)
Expenditure, Rs. per Month Per Household
Household Expenditure Share, %
All Food Cereal PreparedFoods Pulses Vegetables Meat Fish DriedFish Eggs Coconut Condiments Milk&MilkProducts FatandOil Sugar,Juggery&Treacle Fruits Other
All Non-Food Housing FuelandLight PersonalCareandHealthExpenses Transport Communication Education CulturalActivitiesandEntertainment Non-DurableHouseholdGoods &Services Clothing,TextileandFootwear DurableHouseholdGoods OtherMiscellaneousExpenses OtherRareExpenses Liquor,NarcoticDrugsandTobacco
3.9 3.9 3.8 4.1 3.8 3.6 3.6 3.7 3.7 3.8 1.9 1.9 1.8 2.0 1.6 1.8 1.7 1.7 1.9 1.8
47.8 45.9 47.3 47.3 46.4 46.2 45.4 46.8 46.3 46.8 52.2 54.1 52.7 52.7 53.6 53.8 54.6 53.2 53.7 53.2
23.4 26.7 25.4 25.3 28.9 24.8 29.4 25.9 23.6 25.3 60.1 56.9 57.6 59.9 61.1 59.6 58.1 59.9 59.3 59.2 16.5 16.5 17.0 14.8 10.0 15.6 12.5 14.2 17.1 15.5
2.0 5.0 3.6 1.9 3.9 3.1 3.1 5.1 4.4 3.3 18.0 26.2 23.9 25.6 32.0 23.9 25.6 25.6 24.4 23.5 42.8 41.8 43.4 51.0 40.6 45.6 49.1 45.4 44.6 44.1 18.6 13.8 15.8 10.8 14.9 13.5 11.8 13.9 14.7 15.3 18.6 13.0 13.2 10.7 8.5 13.8 10.2 9.9 11.8 13.8
84,231 53,053 59,375 46,081 43,168 60,398 60,298 51,635 49,057 62,237 21,665 13,729 15,730 11,384 11,259 16,671 16,567 13,867 13,157 16,377 43,959 28,328 32,354 23,286 27,511 33,274 35,186 29,623 26,153 33,894
57,514 40,010 43,605 34,500 32,621 41,977 42,092 36,597 37,043 43,511 14,400 9,890 11,253 8,434 8,261 11,420 11,248 10,139 9,711 11,307 30,000 20,000 23,143 17,200 21,500 22,127 23,417 20,377 19,436 23,260
51.2 47.5 48.2 48.4 47.6 51.5 51.6 49.8 47.0 50.8 5.3 5.2 5.6 4.3 5.2 4.5 4.7 4.3 5.5 4.8 43.4 47.2 46.2 47.3 47.2 44.0 43.7 45.9 47.5 44.4
0.45 0.42 0.42 0.44 0.42 0.46 0.46 0.45 0.41 0.45 0.45 0.41 0.40 0.41 0.40 0.44 0.45 0.42 0.39 0.44 0.51 0.49 0.49 0.52 0.46 0.53 0.53 0.50 0.47 0.51
74,505 50,334 52,271 42,537 38,407 55,514 48,176 39,140 42,810 54,999
100.0 100.0 100.0 100.0 100.0 100.0 100.0 100.0 100.0 100.0 12.5 19.0 14.3 20.1 13.9 15.1 18.1 20.6 18.7 15.5 15.7 9.3 11.0 9.2 11.4 12.1 8.6 7.1 8.8 11.8 3.3 4.3 4.0 3.9 2.2 3.2 3.6 4.5 4.7 3.6 8.7 10.8 10.3 7.8 9.0 9.8 10.7 13.1 11.8 9.9 5.1 5.2 2.7 5.4 8.4 4.9 4.7 3.4 3.1 4.8 9.9 6.1 11.0 13.2 14.9 9.3 9.6 6.5 5.9 9.5 4.1 4.1 4.1 0.6 2.1 5.4 4.4 3.8 5.4 4.0 0.9 1.3 1.1 1.0 1.2 1.0 1.1 1.3 1.1 1.1 5.2 5.7 6.8 5.4 4.7 5.9 6.4 4.8 7.7 5.8 9.2 9.6 11.2 9.8 10.5 10.2 9.4 10.0 9.8 9.8 9.2 8.6 8.5 7.6 6.7 7.0 6.7 7.9 7.6 8.2 2.2 2.9 1.9 3.2 2.6 2.1 3.1 4.0 2.6 2.5 1.8 2.2 2.6 3.2 2.7 2.3 2.5 2.5 2.4 2.3 3.8 2.8 3.2 2.6 2.4 3.1 2.9 3.5 2.9 3.2 8.3 8.2 7.3 7.0 7.3 8.8 8.2 7.2 7.4 8.0
100.0 100.0 100.0 100.0 100.0 100.0 100.0 100.0 100.0 100.0 24.9 18.5 15.8 8.8 16.2 12.8 13.2 17.2 16.7 19.2 5.0 4.9 4.0 7.2 9.2 4.0 4.1 4.7 4.6 4.9 6.8 7.2 7.4 10.9 7.3 7.2 6.0 5.6 6.8 7.0 12.9 12.1 10.9 11.4 11.9 12.5 12.6 13.1 13.1 12.4 3.2 3.2 2.4 3.8 3.8 2.7 2.5 3.0 3.0 3.0 6.2 6.3 5.0 6.9 6.0 4.9 4.5 5.7 5.6 5.8 2.8 2.1 2.6 1.7 1.1 2.0 1.7 2.3 4.5 2.5 1.9 1.8 1.4 1.8 2.0 1.5 1.9 1.9 1.8 1.8 3.4 5.0 4.4 5.9 7.9 4.2 5.4 6.0 5.2 4.4 4.9 4.9 9.2 5.4 6.2 10.3 5.7 4.5 6.5 6.3 14.4 18.4 17.6 17.7 12.8 19.6 22.1 16.3 17.0 16.6 11.7 12.5 16.0 15.1 12.3 14.9 16.7 11.8 11.8 13.1 1.9 3.1 3.4 3.4 3.2 3.4 3.6 7.6 3.4 2.9
Source : HouseholdIncomeandExpenditureSurvey2016, DepartmentofCensusandStatistics

SOCIO-ECONOMIC SERVICES142
General Education 2008 – 2017
Table 13.7
Item 2008 2009 2010 2011 2012 2013 2014 2015 2016 2017(a)
Total No. of Schools
GovernmentSchools
OtherSchools
PirivenaSchools PrivateandSpecialSchools
Classification of Govt. Schools(b)
1A&BSchools 1CSchools Type2Schools Type3Schools
Total No. of Pupils
GovernmentSchools
OtherSchools
PirivenaSchools PrivateandSpecialSchools
New Admissions(c)
Total No. of Teachers
GovernmentSchools(d)
OtherSchools
PirivenaSchools PrivateandSpecialSchools
Pupil / Teacher Ratio (All Schools)
10,445 10,205 10,502 10,548 10,737 10,849 10,971 10,997 11,021 11,053
9,662 9,410 9,685 9,731 9,905 10,012 10,121 10,144 10,162 10,194
783 795 817 817 832 837 850 853 859 859
691 697 719 720 734 734 747 749 754 753 92 98 98 97 98 103 103 104 105 106 9,662 9,410 9,685 9,731 9,905 10,012 10,121 10,144 10,162 10,194
698 702 716 716 748 868 974 1,004 1,016 1,029 1,937 1,944 2,005 2,027 2,038 1,910 1,814 1,801 1,805 1,818 4,166 4,043 4,094 4,131 3,910 3,730 3,584 3,462 3,408 3,287 2,861 2,721 2,870 2,857 3,209 3,504 3,749 3,877 3,933 4,060
4,101,586 4,037,896 4,119,525 4,155,255 4,194,336 4,233,555 4,273,065 4,330,368 4,345,740 4,367,493
3,930,451 3,864,824 3,940,072 3,972,983 4,004,059 4,037,095 4,078,798 4,129,534 4,143,330 4,165,964
171,135 173,072 179,453 182,272 190,277 196,460 194,267 200,834 202,410 201,529
56,065 58,098 62,091 62,645 64,608 66,116 62,870 64,606 66,003 62,872 115,070 114,974 117,362 119,627 125,669 130,344 131,397 136,228 136,407 138,657
326,466 329,832 332,562 331,491 339,143 342,451 349,182 334,877 317,895 322,135
224,410 225,951 224,541 228,672 235,924 236,131 245,628 247,453 245,930 255,037
213,212 214,307 212,457 216,397 223,724 223,752 232,990 233,883 232,555 241,591
11,198 11,644 12,084 12,275 12,200 12,379 12,638 13,570 13,375 13,446
5,744 5,943 6,090 6,487 6,086 6,062 6,162 6,495 6,503 6,414 5,454 5,701 5,994 5,788 6,114 6,317 6,476 7,075 6,872 7,032 18.3 17.9 18.3 18.6 17.8 17.9 17.4 17.5 17.6 17.2
Note:Schools in KilinochchiandMullaitivudistrictswere temporarilyclosedat thecensusdate(2009.06.01)in2009.
(a)Provisional(b)ClassificationofSchools: 1A&B –SchoolshavingGCE(A/L)Scienceclasses 1C –SchoolshavingGCE(A/L)Arts/Commerceclasses/NoScienceclasses Type2 –SchoolshavingclassesuptoGrade11. Type3 –SchoolshavingclassesonlyuptoGrade5.(c)Governmentschoolsonly.(d)Teachersinfunctioningandtemporaryclosedschools.
Source:MinistryofEducation
Total No. of Pupils & Pupils per Teacher Ratio (All Schools)
2016 20172008 2009 2010 2011 2012 2013 2014 2015
4,400,000
4,200,000
Tota
l No
. of P
up
ils
Pup
il /
Tea
ch
er R
atio
4,000,000
3,800,000 16.5
17.0
17.5
18.0
18.5
19.0
Total No. of Pupils Pupil / Teacher Ratio

SOCIO-ECONOMIC SERVICES143
Government School Teachers and Pupils by Province and District 2010 – 2017
Table 13.8
Province/District2010 2011 2012 2013 2014 2015 2016 2017(a)
T P T P T P T P T P T P T P T P
Western
Colombo Gampaha Kalutara Central
Kandy Matale NuwaraEliya Southern
Galle Matara Hambantota Northern
Jaffna Kilinochchi Mannar Mullaitivu Vavuniya Eastern
Batticaloa Ampara Trincomalee North Western
Kurunegala Puttalam North Central
Anuradhapura Polonnaruwa Uva
Badulla Moneragala Sabaragamuwa
Ratnapura Kegalle Total
39 916 41 929 43 938 43 946 46 956 45 969 44 969 46 965
15 362 16 366 17 369 17 372 18 376 18 380 17 380 18 375 15 344 15 348 16 351 16 353 17 357 16 362 16 361 17 362 10 210 10 215 10 218 11 220 11 223 11 227 11 228 12 228
30 522 30 523 32 526 32 530 32 535 34 543 33 544 34 548
16 271 16 269 16 270 16 272 17 274 17 278 17 279 18 282 6 95 6 96 6 97 6 98 6 99 7 101 7 101 7 104 9 156 9 157 9 159 9 160 9 162 10 164 10 164 10 162
29 504 29 506 29 511 29 513 30 519 29 524 29 526 30 532
11 218 11 217 11 219 11 220 12 223 11 224 11 223 12 225 10 160 10 162 10 163 10 164 10 164 10 167 10 167 10 168 8 126 8 126 8 130 8 130 8 132 8 134 8 136 8 138
14 240 14 248 15 249 15 250 16 249 16 247 17 243 18 241
8 130 7 131 7 128 7 125 8 123 8 121 8 118 9 116 1 26 2 28 2 29 2 31 2 32 2 32 2 33 2 32 1 28 2 29 2 28 2 29 2 29 2 27 2 27 2 27 3 12 1 20 1 23 2 26 2 28 2 28 2 28 2 28 1 43 2 41 2 39 2 39 3 38 3 38 3 37 3 37
20 386 20 385 21 386 21 388 21 389 21 392 21 394 22 395
6 131 6 130 7 130 7 130 7 130 7 131 7 132 7 131 9 155 9 156 9 158 9 159 9 161 9 161 9 162 9 165 5 100 5 98 5 98 5 99 5 98 5 100 5 100 5 99
27 473 27 476 28 479 27 486 28 492 28 502 28 505 28 509
20 313 20 317 20 319 20 323 20 329 20 334 20 337 20 341 7 160 7 159 8 160 7 163 8 164 8 168 8 168 8 168
14 254 15 259 15 266 16 270 17 273 17 279 17 287 17 292
11 176 11 179 11 184 11 187 12 189 12 193 12 199 12 202 4 79 4 80 4 82 4 84 5 83 5 86 5 88 5 90
18 277 18 279 19 278 19 280 20 283 20 287 20 288 21 291
12 182 12 184 13 183 13 183 13 185 13 186 13 186 14 185 6 95 6 95 6 95 6 97 6 98 6 101 6 103 7 105
21 368 22 367 22 371 23 374 23 383 24 387 24 387 25 393
11 209 11 207 12 209 12 210 12 215 13 218 13 219 13 223 10 159 10 160 10 162 11 165 11 168 11 168 11 168 12 170
212 3,940 216 3,973 224 4,004 224 4,037 233 4,079 234 4,130 233 4,143 242 4,166
Source:MinistryofEducationNote:SchoolsinKilinochchiandMullaitivudistrictsweretemporarilyclosed atthecensusdate(2009.06.01)in2009.
T:TeachersP:Pupils
(a)Provisional
’000

SOCIO-ECONOMIC SERVICES144
Government Schools by Size of Student Population – 2016
Table 13.9(A)
Province/District
0–100
101–500
501–1,000
1,001–1,500
1,501–2,000
2,001–2,500
2,501–3,000
3,001–3,500
Above3,500
Total
Western
Colombo Gampaha Kalutara Central
Kandy Matale NuwaraEliya Southern
Galle Matara Hambantota Northern
Jaffna Kilinochchi Mannar Mullaitivu Vavuniya Eastern
Batticaloa Ampara Trincomalee North Western
Kurunegala Puttalam North Central
Anuradhapura Polonnaruwa Uva
Badulla Moneragala Sabaragamuwa
Ratnapura Kegalle Total
201 603 265 112 61 45 20 19 34 1,360
41 164 85 37 23 16 9 10 20 405 59 249 116 48 23 21 7 6 7 536 101 190 64 27 15 8 4 3 7 419 494 713 199 58 21 17 8 4 7 1,521
183 306 98 30 10 7 7 2 7 650 117 153 29 11 4 8 0 1 0 323 194 254 72 17 7 2 1 1 0 548 302 527 152 56 29 13 14 6 15 1,114
115 200 56 22 14 6 7 2 9 431 102 167 55 14 10 7 3 3 2 363 85 160 41 20 5 0 4 1 4 320 411 433 89 21 8 7 1 1 0 971
172 204 39 16 3 4 1 0 0 439 31 51 19 2 0 1 0 0 0 104 65 56 9 0 3 0 0 0 0 133 52 57 11 2 1 0 0 0 0 123 91 65 11 1 1 2 0 1 0 172 309 556 168 37 16 14 3 3 0 1,106
103 167 63 10 6 7 1 0 0 357 113 230 60 19 8 2 2 3 0 437 93 159 45 8 2 5 0 0 0 312 327 658 163 44 32 12 11 3 9 1,259
268 450 100 24 20 9 10 3 6 890 59 208 63 20 12 3 1 0 3 369 256 392 106 21 15 6 2 3 4 805
176 272 74 14 9 5 1 2 4 557 80 120 32 7 6 1 1 1 0 248 285 436 125 23 11 8 5 0 2 895
204 291 74 14 6 6 4 0 2 601 81 145 51 9 5 2 1 0 0 294 413 516 113 44 18 9 7 6 5 1,131
207 274 66 28 13 6 2 2 3 601 206 242 47 16 5 3 5 4 2 530 2,998 4,834 1,380 416 211 131 71 45 76 10,162
Source:MinistryofEducation
Numbers

SOCIO-ECONOMIC SERVICES145
Government Schools by Size of Student Population – 2017(a)
Table 13.9(B)
Province/District
0–100
101–500
501–1,000
1,001–1,500
1,501–2,000
2,001–2,500
2,501–3,000
3,001–3,500
Above3,500
Total
Western
Colombo Gampaha Kalutara Central
Kandy Matale NuwaraEliya Southern
Galle Matara Hambantota Northern
Jaffna Kilinochchi Mannar Mullaitivu Vavuniya Eastern
Batticaloa Ampara Trincomalee North Western
Kurunegala Puttalam North Central
Anuradhapura Polonnaruwa Uva
Badulla Moneragala Sabaragamuwa
Ratnapura Kegalle Total
201 607 262 112 58 40 21 24 34 1,359
38 167 87 37 19 13 9 16 18 404 61 250 115 48 21 20 8 6 8 537 102 190 60 27 18 7 4 2 8 418 503 704 193 61 22 17 9 2 8 1,519
186 305 90 32 12 8 7 1 8 649 115 153 29 10 6 7 0 1 0 321 202 246 74 19 4 2 2 0 0 549 291 537 145 58 33 13 12 7 16 1,112
110 204 56 21 16 6 6 1 10 430 97 171 49 17 11 7 3 4 2 361 84 162 40 20 6 0 3 2 4 321 443 423 93 20 9 8 0 1 0 997
194 196 38 15 5 5 0 0 0 453 32 48 21 2 0 1 0 0 0 104 68 57 9 1 2 0 0 0 0 137 50 58 13 1 1 0 0 0 0 123 99 64 12 1 1 2 0 1 0 180 324 545 168 33 19 14 3 4 0 1,110
107 167 63 6 9 6 1 0 359 119 223 59 20 8 3 2 4 0 438 98 155 46 7 2 5 0 0 0 313 323 654 166 50 27 10 11 6 9 1,256
261 452 97 30 16 7 10 6 6 885 62 202 69 20 11 3 1 0 3 371 254 393 114 19 17 5 3 2 5 812
179 270 79 11 11 4 2 1 5 562 75 123 35 8 6 1 1 1 0 250 301 428 117 27 10 11 4 0 2 900
219 286 66 16 6 8 3 0 2 606 82 142 51 11 4 3 1 0 0 294 406 514 117 45 20 4 9 9 5 1,129
200 270 72 28 15 2 6 3 2 598 206 244 45 17 5 2 3 6 3 531 3,046 4,805 1,375 425 215 122 72 55 79 10,194
Source:MinistryofEducation(a)Provisional
Numbers
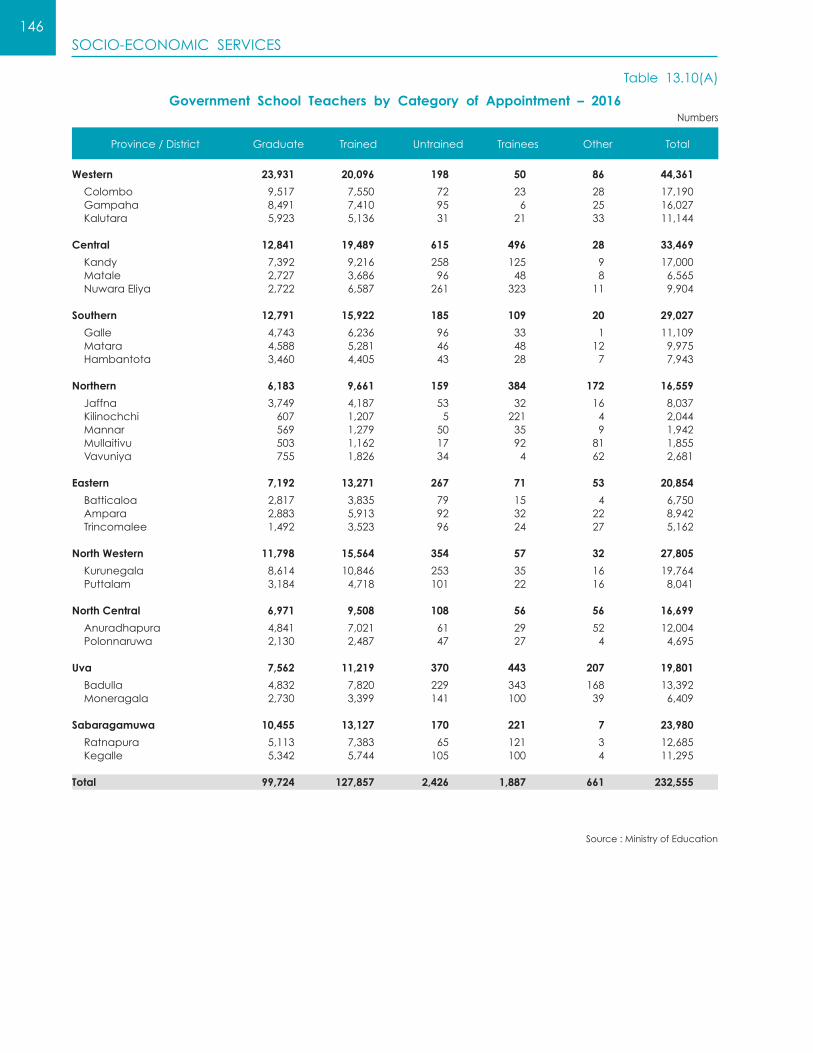
SOCIO-ECONOMIC SERVICES146
Government School Teachers by Category of Appointment – 2016
Table 13.10(A)
Western
Colombo Gampaha Kalutara Central
Kandy Matale NuwaraEliya Southern
Galle Matara Hambantota Northern
Jaffna Kilinochchi Mannar Mullaitivu Vavuniya Eastern
Batticaloa Ampara Trincomalee North Western
Kurunegala Puttalam North Central
Anuradhapura Polonnaruwa Uva
Badulla Moneragala Sabaragamuwa
Ratnapura Kegalle Total
23,931 20,096 198 50 86 44,361
9,517 7,550 72 23 28 17,190 8,491 7,410 95 6 25 16,027 5,923 5,136 31 21 33 11,144 12,841 19,489 615 496 28 33,469
7,392 9,216 258 125 9 17,000 2,727 3,686 96 48 8 6,565 2,722 6,587 261 323 11 9,904 12,791 15,922 185 109 20 29,027
4,743 6,236 96 33 1 11,109 4,588 5,281 46 48 12 9,975 3,460 4,405 43 28 7 7,943 6,183 9,661 159 384 172 16,559
3,749 4,187 53 32 16 8,037 607 1,207 5 221 4 2,044 569 1,279 50 35 9 1,942 503 1,162 17 92 81 1,855 755 1,826 34 4 62 2,681 7,192 13,271 267 71 53 20,854
2,817 3,835 79 15 4 6,750 2,883 5,913 92 32 22 8,942 1,492 3,523 96 24 27 5,162 11,798 15,564 354 57 32 27,805
8,614 10,846 253 35 16 19,764 3,184 4,718 101 22 16 8,041 6,971 9,508 108 56 56 16,699
4,841 7,021 61 29 52 12,004 2,130 2,487 47 27 4 4,695 7,562 11,219 370 443 207 19,801
4,832 7,820 229 343 168 13,392 2,730 3,399 141 100 39 6,409 10,455 13,127 170 221 7 23,980
5,113 7,383 65 121 3 12,685 5,342 5,744 105 100 4 11,295 99,724 127,857 2,426 1,887 661 232,555
Source:MinistryofEducation
Numbers
Province/District Graduate Trained Untrained Trainees Other Total

SOCIO-ECONOMIC SERVICES147
Province/District Graduate Trained Untrained Trainees Other Total
Government School Teachers by Category of Appointment – 2017(a)
Table 13.10(B)
Western
Colombo Gampaha Kalutara Central
Kandy Matale NuwaraEliya Southern
Galle Matara Hambantota Northern
Jaffna Kilinochchi Mannar Mullaitivu Vavuniya Eastern
Batticaloa Ampara Trincomalee North Western
Kurunegala Puttalam North Central
Anuradhapura Polonnaruwa Uva
Badulla Moneragala Sabaragamuwa
Ratnapura Kegalle Total
25,263 20,103 261 50 148 45,825
9,917 7,646 94 13 70 17,740 9,143 7,278 102 26 30 16,579 6,203 5,179 65 11 48 11,506
13,548 19,424 690 352 44 34,058
7,976 9,153 309 94 22 17,554 2,695 3,699 131 40 6 6,571 2,877 6,572 250 218 16 9,933
13,614 16,252 285 113 32 30,296
5,067 6,242 147 40 14 11,510 4,743 5,469 68 46 13 10,339 3,804 4,541 70 27 5 8,447
7,258 10,482 91 6 104 17,941
4,371 4,486 44 1 17 8,919 694 1,417 11 1 – 2,123 676 1,351 18 2 11 2,058 632 1,305 9 2 75 2,023 885 1,923 9 – 1 2,818
7,631 13,843 242 50 44 21,810
2,978 3,994 54 12 4 7,042 3,080 6,138 117 24 20 9,379 1,573 3,711 71 14 20 5,389
12,251 15,345 515 73 55 28,239
8,908 10,607 372 44 30 19,961 3,343 4,738 143 29 25 8,278
7,597 9,542 186 46 69 17,440
5,230 6,980 125 22 63 12,420 2,367 2,562 61 24 6 5,020
7,949 11,658 664 478 94 20,843
5,053 8,065 410 409 72 14,009 2,896 3,593 254 69 22 6,834
11,645 12,989 377 125 3 25,139
5,631 7,286 136 73 1 13,127 6,014 5,703 241 52 2 12,012
106,756 129,638 3,311 1,293 593 241,591
Source:MinistryofEducation
Numbers
(a)Provisional
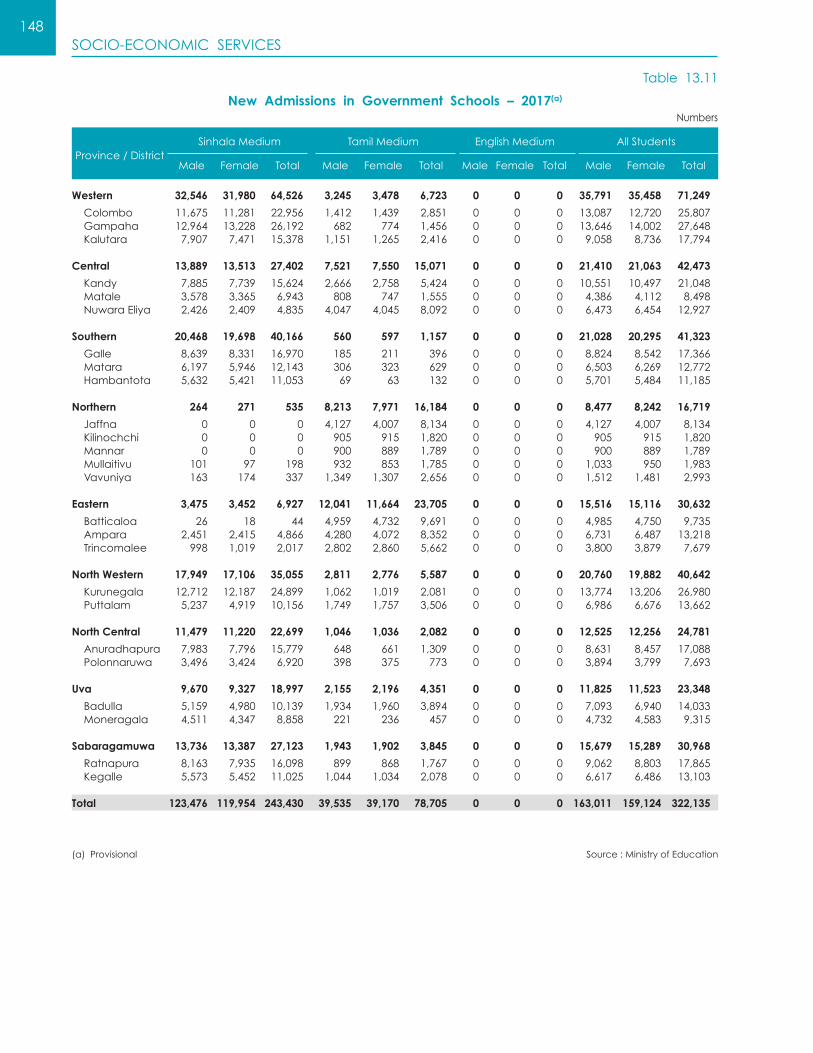
SOCIO-ECONOMIC SERVICES148
New Admissions in Government Schools – 2017(a)
Table 13.11
Province/DistrictSinhalaMedium TamilMedium EnglishMedium AllStudents
Male Female Total Male Female Total Male Female Total Male Female Total
Western
Colombo Gampaha Kalutara Central
Kandy Matale NuwaraEliya Southern
Galle Matara Hambantota Northern
Jaffna Kilinochchi Mannar Mullaitivu Vavuniya Eastern
Batticaloa Ampara Trincomalee North Western
Kurunegala Puttalam North Central
Anuradhapura Polonnaruwa Uva
Badulla Moneragala Sabaragamuwa
Ratnapura Kegalle Total
Source:MinistryofEducation(a)Provisional
Numbers
32,546 31,980 64,526 3,245 3,478 6,723 0 0 0 35,791 35,458 71,249
11,675 11,281 22,956 1,412 1,439 2,851 0 0 0 13,087 12,720 25,807 12,964 13,228 26,192 682 774 1,456 0 0 0 13,646 14,002 27,648 7,907 7,471 15,378 1,151 1,265 2,416 0 0 0 9,058 8,736 17,794 13,889 13,513 27,402 7,521 7,550 15,071 0 0 0 21,410 21,063 42,473
7,885 7,739 15,624 2,666 2,758 5,424 0 0 0 10,551 10,497 21,048 3,578 3,365 6,943 808 747 1,555 0 0 0 4,386 4,112 8,498 2,426 2,409 4,835 4,047 4,045 8,092 0 0 0 6,473 6,454 12,927 20,468 19,698 40,166 560 597 1,157 0 0 0 21,028 20,295 41,323
8,639 8,331 16,970 185 211 396 0 0 0 8,824 8,542 17,366 6,197 5,946 12,143 306 323 629 0 0 0 6,503 6,269 12,772 5,632 5,421 11,053 69 63 132 0 0 0 5,701 5,484 11,185 264 271 535 8,213 7,971 16,184 0 0 0 8,477 8,242 16,719
0 0 0 4,127 4,007 8,134 0 0 0 4,127 4,007 8,134 0 0 0 905 915 1,820 0 0 0 905 915 1,820 0 0 0 900 889 1,789 0 0 0 900 889 1,789 101 97 198 932 853 1,785 0 0 0 1,033 950 1,983 163 174 337 1,349 1,307 2,656 0 0 0 1,512 1,481 2,993 3,475 3,452 6,927 12,041 11,664 23,705 0 0 0 15,516 15,116 30,632
26 18 44 4,959 4,732 9,691 0 0 0 4,985 4,750 9,735 2,451 2,415 4,866 4,280 4,072 8,352 0 0 0 6,731 6,487 13,218 998 1,019 2,017 2,802 2,860 5,662 0 0 0 3,800 3,879 7,679 17,949 17,106 35,055 2,811 2,776 5,587 0 0 0 20,760 19,882 40,642
12,712 12,187 24,899 1,062 1,019 2,081 0 0 0 13,774 13,206 26,980 5,237 4,919 10,156 1,749 1,757 3,506 0 0 0 6,986 6,676 13,662 11,479 11,220 22,699 1,046 1,036 2,082 0 0 0 12,525 12,256 24,781
7,983 7,796 15,779 648 661 1,309 0 0 0 8,631 8,457 17,088 3,496 3,424 6,920 398 375 773 0 0 0 3,894 3,799 7,693 9,670 9,327 18,997 2,155 2,196 4,351 0 0 0 11,825 11,523 23,348
5,159 4,980 10,139 1,934 1,960 3,894 0 0 0 7,093 6,940 14,033 4,511 4,347 8,858 221 236 457 0 0 0 4,732 4,583 9,315 13,736 13,387 27,123 1,943 1,902 3,845 0 0 0 15,679 15,289 30,968
8,163 7,935 16,098 899 868 1,767 0 0 0 9,062 8,803 17,865 5,573 5,452 11,025 1,044 1,034 2,078 0 0 0 6,617 6,486 13,103 123,476 119,954 243,430 39,535 39,170 78,705 0 0 0 163,011 159,124 322,135

SOCIO-ECONOMIC SERVICES149
Government Schools by Type, Pupils and Teachers – 2016 & 2017
Table 13.12
TypesofSchoolshavingclasses
Schools Pupils TeachersPupilsperTeacherNo. Percentage No. Percentage No. Percentage
GCE(A/L)Science(1AB)
GCE(A/L)Arts/Commerce (OtherthanScience)(1C)
Uptoyear11(Type2)
Fromyears1to5oryears 1to8(Type3)
All Government Schools
GCE(A/L)Science(1AB)
GCE(A/L)Arts/Commerce (OtherthanScience)(1C)
Uptoyear11(Type2)
Fromyears1to5oryears 1to8(Type3)
All Government Schools
Year 2016
1,016 10.0 1,626,565 39.3 76,012 32.7 21.4
1,805 17.8 1,034,743 25.0 60,001 25.8 17.2
3,408 33.5 826,255 19.9 61,586 26.5 13.4
3,933 38.7 655,767 15.8 34,956 15.0 18.8
10,162 100.0 4,143,330 100.0 232,555 100.0 17.8
Year 2017(a)
1,029 10.1 1,657,886 39.8 80,520 33.3 20.6
1,818 17.8 1,033,277 24.8 62,052 25.7 16.7
3,287 32.2 793,746 19.1 61,593 25.5 12.9
4,060 39.8 681,055 16.3 37,426 15.5 18.2
10,194 100.0 4,165,964 100.0 241,591 100.0 68.4
Source:MinistryofEducation(a)Provisional
Item 2012 2013 2014 2015 2016 2017
Performance of Candidates – GCE (O/L)(a) and GCE (A/L) – 2012 - 2017
Table 13.13
Numbers
SchoolcandidatessatforGCE(O/L)
PercentageofqualifyingforGCE(A/L)
AllcandidatessatforGCE(O/L)
PercentageofqualifyingforGCE(A/L)
SchoolcandidatessatforGCE(A/L)
Schoolcandidatesqualifying toenterUniversity
Percentageofqualifying toenterUniversity
AllcandidatessatforGCE(A/L)
AllcandidatesqualifyingtoenterUniversity
PercentageofqualifyingtoenterUniversity
Source:DepartmentofExaminations(a)5ormoresubjects.
294,338 287,040 277,414 290,929 286,251 312,464
62.39 64.21 66.55 67.15 69.94 71.03
312,832 308,054 298,549 314,635 293,218 326,424
60.87 62.42 64.51 64.81 69.68 70.11
196,954 209,906 207,304 210,340 211,865 206,630
124,434 122,913 126,971 131,137 134,238 136,421
63.18 58.56 61.25 62.35 63.36 66.02
233,632 246,680 247,376 255,191 258,193 253,330
144,819 143,695 149,489 155,447 160,520 163,104
61.99 58.25 60.43 60.91 62.17 64.38

SOCIO-ECONOMIC SERVICES150
GCE (O/L) Examination – 2014 - 2017Performance of School Candidates
GCE (A/L) Examination – 2014 - 2017Performance of School Candidates
Table 13.14
Table 13.15
Province
2014 2015 2016 2017
No.Sat(5ormoresubjects)
QualifiedforGCE(A/L)
No.Sat(5ormoresubjects)
QualifiedforGCE(A/L)
No.Sat(5ormoresubjects)
QualifiedforGCE(A/L)
No.Sat(5ormoresubjects)
QualifiedforGCE(A/L)
No. % No. % No. % No. %
Province
2014 2015 2016 2017
No.Sat
QualifiedforUniversityEntrance No.Sat
QualifiedforUniversityEntrance No.Sat
QualifiedforUniversityEntrance No.Sat
QualifiedforUniversityEntrance
No. % No. % No. % No. %
WesternCentralSouthernNorthernEasternNorthWesternNorthCentralUvaSabaragamuwa
Sri Lanka
WesternCentralSouthernNorthernEasternNorthWesternNorthCentralUvaSabaragamuwa
Sri Lanka
71,981 50,112 69.62 76,264 54,023 70.84 75,414 54,994 72.92 81,560 59,484 72.93 37,148 23,488 63.23 37,557 24,134 64.26 37,665 25,932 68.85 41,114 28,501 69.32 35,658 25,234 70.77 36,586 26,735 73.07 34,994 26,828 76.66 37,539 29,162 77.68 16,919 10,268 60.69 19,400 11,113 57.28 17,413 10,562 60.66 19,877 12,490 62.84 21,331 13,898 65.15 22,807 14,169 62.13 23,744 14,617 61.56 25,599 16,927 66.12 31,609 21,598 68.33 33,473 22,687 67.78 33,833 23,896 70.63 36,330 26,441 72.78 17,883 11,227 62.78 17,980 11,584 64.43 19,041 12,632 66.34 20,908 14,177 67.81 19,066 11,814 61.96 20,042 12,708 63.41 18,558 12,630 68.06 20,947 14,089 67.26 25,819 16,982 65.77 26,820 18,205 67.88 25,589 18,117 70.80 28,590 20,685 72.35
277,414 184,621 66.55 290,929 195,358 67.15 286,251 200,208 69.94 312,464 221,956 71.03
55,376 33,330 60.19 56,521 35,516 62.84 57,254 36,860 64.38 55,573 36,898 66.40 25,975 15,547 59.85 26,046 15,967 61.30 26,654 16,524 61.99 26,633 17,509 65.74 30,083 18,707 62.18 29,945 18,668 62.34 29,620 18,894 63.79 29,581 19,367 65.47 12,330 7,910 64.15 12,684 8,274 65.23 12,327 7,955 64.53 11,591 7,925 68.37 14,267 8,817 61.80 14,658 9,043 61.69 14,979 9,292 62.03 14,551 9,089 62.46 23,404 13,977 59.72 24,032 14,455 60.15 23,833 14,661 61.52 22,929 15,257 66.54 11,775 6,961 59.12 11,910 7,094 59.56 12,307 7,294 59.27 12,130 7,643 63.01 13,764 8,523 61.92 14,093 8,852 62.81 14,393 9,110 63.29 13,613 9,157 67.27 20,330 13,199 64.92 20,451 13,268 64.88 20,498 13,648 66.58 20,029 13,576 67.78
207,304 126,971 61.25 210,340 131,137 62.35 211,865 134,238 63.36 206,630 136,421 66.02
Source:DepartmentofExaminations
Source:DepartmentofExaminations

SOCIO-ECONOMIC SERVICES151
Item 2008 2009 2010 2011 2012 2013 2014 2015 2016 2017(b)
University Education(a) 2008 – 2017
Table 13.16
No.ofUniversities
No.ofotherHigherEducationalInstitutions(c)
No.ofStudents(Undergraduates)
University Institutes OpenUniversity
No.ofLecturers
University Institutes OpenUniversity
NewAdmissionsforbasicDegrees(e)
No.Graduated(i)
Arts&OrientalStudies –B.A./B.A.Special Commerce&Mgt.Studies –B.Sc./B.Com./B.B.A. LawL.L.B. ScienceB.Sc.(k)
EngineeringB.Sc.(Eng.) MedicineM.B.B.S. DentalSurgeryB.D.S. AgricultureB.Sc. VeterinaryScienceB.V.Sc. ArchitectureandQuantity SurveyingB.Sc. ComputerScience/ IT/ICT/MIT IndigenousMedicine ParamedicalStudies
ExpenditureonHigherEducation,Rs.Mn.(l)
CapitalExpenditure RecurrentExpenditure
15 15 15 15 15 15 15 15 15 15
17 17 17 17 17 18 18 18 18 19
79,644 82,375 86,216 92,572 88,713(d) 97,119 104,455 109,182 110,287 116,388
66,891 68,768 70,477 74,440 70,222 77,126 80,222 83,778 84,451 88,855 2,600 2,703 2,921 3,217 3,073 3,254 3,317 3,307 3,290 3,389 10,153 10,904 12,818 14,915 15,418 16,739 20,916 22,097 22,546 24,144
4,281 4,419 4,341 4,513 4,718 4,921 5,024 5,199 5,440 5,498
3,836 3,938 3,865 4,021 4,223 4,411 4,502 4,661 4,863 4,962 192 204 211 217 219 221 234 242 268 280 253 277 265 275 276 289 288 296 309 256
20,069 20,846 21,547 22,016 28,908(f)(g) 24,198(h) 25,200 25,676 29,083 30,668
12,958 13,952 13,042 16,686 11,614(j) 20,839 29,243 29,545 28,808 30,001 4,012 4,830 4,432 6,940 5,330 9,156 14,651 16,387 14,082 14,672 2,547 2,705 2,704 2,791 1,992 4,159 5,982 5,152 5,630 5,860 345 425 392 348 445 454 496 337 414 431 2,342 2,573 2,028 2,651 1,443 3,180 2,740 2,711 3,027 3,020 1,114 1,157 1,307 1,346 167 1,507 1,438 1,344 1,617 1,677 1,294 943 797 1,061 800 547 1,209 1145 1,135 1,157 125 71 64 65 20 73 68 79 91 97 510 513 540 595 515 727 867 710 799 952 80 39 60 58 54 59 57 69 73 87 116 200 118 211 150 201 214 77 224 232
303 382 392 439 561 644 947 1,043 946 992 170 114 208 181 137 132 175 227 169 181 – – – – – – 399 264 601 643
13,825 13,692 15,018 19,700 21,806 27,838 36,937 40,583 48,914 40,327
3,233 2,648 2,666 3,788 4,941 6,183 11,200 9,735 14,719 10,478 10,592 11,044 12,352 14,307 16,865 21,655 25,737 30,848 34,195 29,849
(a) InformationgivenhereinareonlywithregardtoUniversitiesandhighereducationalinstitutesestablishedundertheUniversitiesAct.Inaddition,thereareuniversitiesestablishedundervariousotheractsofParliament,suchasBuddhasravakaBhikshuUniversity,BuddhistandPaliUniversityofSriLanka,GeneralSirJohnKothalawalaDefenceUniversityandUniversityofVocationalTechnology.
(b) Provisional(c) IncludespostgraduateinstitutesandhighereducationalinstitutionswhichareunderUGC.Outoftheseinstitutionsonly4institutionsnamelyInstituteofIndigenousMedicine,
University of Colombo School of Computing, Gampaha Wickramarachchi Ayurveda Institute and Swamy Vipulananda Institute of Aesthetic Studies admit students forundergraduateprogrammesundertheUGCintake.
(d) Inyear2012,studentenrolmenthasbeendecreasedcomparedtotheyear2011duetonewintake(2011A/L)ofstudentswasnotadmitted.However,thedecreaseisnotsignificantasthefinalexamsandacademictermsofsomeuniversitieswerenotcompletedduetoAcademicandNon-Academicstrikesin2012.
(e) ExcludingtheOpenUniversityofSriLankaandexternaldegreecourses. (f) Including5,182studentsadmittedinadditiontothenormal intakeduetocourtcasesfiledbeforetheSupremeCourtchallengingthemethodologyusedtocalculatethe
Z-score.(g) Admissionin2012includestheintakefromthe2011GCE(A/L)buthasbeenadmittedonlyin2013,whiletheadmissionsin2013showstheundergraduatesadmittedintheFirst
Quarterof2014.(h) Showsthenumberofundergraduatesadmittedin1stQuarterof2014whichisrelevanttotheyear2013[intakeofGCE(A/L)–2012]. (i) IncludesExternal&OpenUniversityalso. (j) Numbergraduatedhasbeendecreasedin2012asfinalexamswerenotbeenheldinseveralfacultiesduetoAcademicandNon-Academicstrikesin2012.(k) From2007onwards,FoodSciencegraduatesareincludedunderB.Sc.Science. (l) TotalexpenditureonUniversityEducationprovidesactualexpenditureincludinggeneratedincomeandotherprojectsfortheyear2016while2017figuresareprovisionaland
arebasedononlythegovernmentgrantreleasedtoHEIs.
Source:UniversityGrantsCommission

SOCIO-ECONOMIC SERVICES152
2011/2012 2012/2013 2013/2014
Eligible(b) Admitted % Eligible(b) Admitted % Eligible(b) Admitted %
2014/2015 2015/2016 2016/2017
Eligible(b) Admitted(d) % Eligible(b) Admitted(e) % Eligible(b) Admitted(f) %
Eligibility, Admission and Enrollment of Students for University Education(a) Academic Year 2011/12 – 2016/17
Table 13.17
Arts Male Female
Total
Commerce Male Female
Total
Science Male Female
Total
Other(c) Male Female
Total
Total Male Female
Total
Arts Male Female
Total
Commerce Male Female
Total
Science Male Female
Total
Engineering MaleTechnology(g) Female
Total
Biosystem MaleTechnology(g) Female
Total
Other(c) Male Female
Total
Total Male Female
Total
19,818 2,075 10.5 17,408 1,539 8.8 16,943 1,589 9.4 56,020 8,222 14.7 51,695 6,456 12.5 51,352 6,638 12.9
75,838 10,297 13.6 69,103 7,995 11.6 68,295 8,227 12.1
13,199 2,418 18.3 18,179 2,063 11.3 16,332 2,085 12.8 17,714 3,324 18.8 22,353 2,903 13.0 21,412 3,140 14.7
30,913 5,742 18.6 40,532 4,966 12.3 37,744 5,225 13.8
15,818 6,429 40.6 15,292 5,178 33.9 16,599 5,796 34.9 18,411 6,396 34.7 19,166 5,994 31.3 20,118 5,860 29.1
34,229 12,825 37.5 34,458 11,172 32.4 36,717 11,656 31.8
106 12 11.3 192 25 13.0 309 36 11.7 325 32 9.8 531 40 7.5 675 56 8.3
431 44 10.2 723 65 9.0 984 92 9.4
48,941 10,934 22.3 51,071 8,805 17.2 50,183 9,506 18.9 92,470 17,974 19.4 93,745 15,393 16.4 93,557 15,694 16.8
141,411 28,908 20.4 144,816 24,198 16.7 143,740 25,200 17.5
17,078 1,577 9.2 15,709 1,756 11.2 14,798 1,676 11.3 51,487 7,040 13.7 49,802 8,135 16.3 49,420 7,742 15.7
68,565 8,617 12.6 65,511 9,891 15.1 64,218 9,418 14.7
17,505 2,043 11.7 16,868 2,010 11.9 15,480 2,053 13.3 23,097 3,256 14.1 24,050 3,431 14.3 23,288 3,740 16.1
40,602 5,299 13.1 40,918 5,441 13.3 38,768 5,793 14.9
17,561 6,036 34.4 17,774 5,797 32.6 19,197 6,441 33.6 21,492 5,567 25.9 22,912 5,865 25.6 24,890 6,614 26.6
39,053 11,603 29.7 40,686 11,662 28.7 44,087 13,055 29.6
– – – 3,214 870 27.1 5,775 1,032 17.9 – – – 733 260 35.5 936 183 19.6
– – – 3,947 1,130 28.6 6,711 1,215 18.1
– – – 661 138 20.9 1,242 172 13.9 – – – 2,245 583 26.0 3,471 685 19.7
– – – 2,906 721 24.8 4,713 857 18.2
435 51 11.7 565 130 23.0 851 182 21.4 917 73 8.0 1,017 80 7.9 1,169 142 12.2
1,352 124 9.2 1,582 210 13.3 2,020 324 16.0
52,579 9,707 18.5 54,791 10,701 19.5 57,343 11,556 20.2 96,993 15,936 16.4 100,759 18,354 18.2 103,174 19,106 18.5
149,572 25,643 17.1 155,550 29,055 18.7 160,517 30,662 19.1
Note:UndergraduateenrollmentisbasedonthecalenderyearandadmissionisbasedonacademicyearsrelevanttotheirGCE(A/L)Examinations.
(a) InformationgivenhereinareonlywithregardtoUniversitiesandHigherEducationalInstitutesestablishedundertheUniversitiesAct.(b) ‘Eligible’referstoallthecandidateswhoattainedtheminimumrequirementslaiddownbytheUGCforadmissiontotheUniversitiesatthe
GCE(A/L)examination.(c) ‘Other’referstotheoddsubjectcombinationsintroducedfromGCE(A/L)2011.(d) Excludes33studentswhoadmittedunderforeignintakeandteachersintake.(e) Excludes28studentswhoadmittedunderforeignintakeandteachersintake.(f) Excludes6studentswhoadmittedunderforeignintakeandteachersintake.(g) TheTechnologyStreamareofferedfromacademicyear2015/2016.
Source:UniversityGrantsCommission

SOCIO-ECONOMIC SERVICES153
Source:UniversityGrantsCommission
Province/District 2009/10 2010/11 2011/12 2012/13 2013/14 2014/15 2015/16 2016/17
University Admissions by Province and DistrictAcademic Year 2009/10 – 2016/17
Table 13.18
Western
Colombo Gampaha Kalutara Central
Kandy Matale NuwaraEliya Southern
Galle Matara Hambantota Northern
Jaffna Kilinochchi Mannar Mullaitivu Vavuniya Eastern
Batticaloa Ampara Trincomalee North Western
Kurunegala Puttalam North Central
Anuradhapura Polonnaruwa Uva
Badulla Moneragala Sabaragamuwa
Ratnapura Kegalle Special Additional Intake(a)
Total
5,512 5,517 7,147 6,466 6,863 6,869 7,571 8,248
2,861 2,874 3,410 3,139 3,322 3,252 3,605 3,994 1,627 1,618 2,187 1,969 2,172 2,206 2,475 2,662 1,024 1,025 1,550 1,358 1,369 1,411 1,491 1,592
2,111 2,123 2,794 2,494 2,512 2,548 2,770 3,224
1,290 1,311 1,671 1,517 1,532 1,579 1,656 1,892 357 322 504 446 421 421 457 555 464 490 619 531 559 548 657 777
3,553 3,497 4,503 3,754 4,047 4,042 3,898 4,525
1,585 1,543 2,055 1,512 1,776 1,865 1,606 1,924 1,243 1,228 1,464 1,390 1,402 1,310 1,359 1,575 725 726 984 852 869 867 933 1,026
1,532 1,526 2,139 1,576 1,567 1,589 1,851 2,039
967 885 1,265 881 902 950 1,121 1,190 98 168 203 153 165 146 164 209 141 138 207 163 151 143 171 198 230 195 196 158 151 139 157 179 96 140 268 221 198 211 238 263
1,308 1,364 1,883 1,597 1,676 1,667 2,086 2,307
467 456 642 515 542 572 717 785 565 609 819 705 709 699 859 939 276 299 422 377 425 396 510 583
2,226 2,189 2,958 2,447 2,457 2,520 2,761 3,142
1,640 1,600 2,154 1,755 1,767 1,804 1,934 2,198 586 589 804 692 690 716 827 944
879 992 1,374 1,186 1,294 1,327 1,472 1,554
619 714 972 830 935 966 1,054 1,097 260 278 402 356 359 361 418 457
1,005 1,034 1,526 1,271 1,388 1,380 1,558 1,770
647 674 985 812 898 898 1,063 1,170 358 360 541 459 490 482 495 600
1,985 2,032 2,620 2,152 2,376 2,401 2,574 2,887
1,169 1,178 1,488 1,242 1,375 1,368 1,465 1,168 816 854 1,132 910 1,001 1,033 1,109 1,719
1,436 1,742(b) 1,964 1,255 1,020 1,333 2,542 972
21,547 22,016 28,908 24,198 25,200 25,676 29,083 30,668
Note:Information given herein are only with regard to universities and HigherEducationalInstitutesestablishedundertheUniversitiesAct.
(a) ‘SpecialandAdditionalIntake’referstothestudentsadmittedonthebasisofSpecialCategoriessuchasblindanddifferentlyabled,excelledin fieldsother thanstudies,armedforces, foreign, teachers,etc.,onthe recommendationof theAppealsCommitteeandtheAditionalIntake,forspecialsubjectssuchasJapanies,English,History,etc.,wheredistricthasnotbeentakenintoaccountforselection.
(b) StudentsadmittedunderSupplementaryIntakeareaddedtothis.

SOCIO-ECONOMIC SERVICES154
DistrictArts(a) Managementand
Commerce Law Science(b) Medicine VeterinaryScience Dentistry
A B A B A B A B A B A B A B
DistrictAgriculture Engineering Architecture/
Quan.Surveying(d)ComputerScience(e)
OtherCourses(f) Total TotalAdmissions
A B A B A B A B A B A B
University Admissions by Academic Stream and District – Academic Year 2015/16
Table 13.19(A)
ColomboGampahaKalutaraKandyMataleNuwaraEliyaGalleMataraHambantotaJaffnaKilinochchiMannarMullaitivuVavuniyaBatticaloaAmparaTrincomaleeKurunegalaPuttalamAnuradhapuraPolonnaruwaBadullaMoneragalaRatnapuraKegalle
SpecialandAdditionalIntake(c)
Total
ColomboGampahaKalutaraKandyMataleNuwaraEliyaGalleMataraHambantotaJaffnaKilinochchiMannarMullaitivuVavuniyaBatticaloaAmparaTrincomaleeKurunegalaPuttalamAnuradhapuraPolonnaruwaBadullaMoneragalaRatnapuraKegalle
SpecialandAdditionalIntake(c)
Total
320 53 616 322 33 22 525 304 137 77 14 5 21 5 508 49 256 317 17 21 181 297 38 76 0 4 0 4 383 25 145 167 8 11 126 159 23 41 0 2 0 3 340 42 106 191 9 13 200 187 35 46 2 3 0 3 101 16 16 69 1 5 12 66 4 16 0 1 0 1 133 27 24 120 1 8 3 111 1 29 0 2 0 2 394 24 111 151 9 10 182 139 45 35 8 2 5 2 299 29 99 114 5 8 150 105 35 27 3 2 2 2 263 13 36 103 6 7 73 100 20 25 1 2 0 2 306 39 30 104 4 7 64 113 27 29 0 3 0 2 38 12 0 25 0 1 0 28 0 5 0 1 0 1 28 11 6 23 1 1 0 34 1 5 0 1 0 1 46 10 0 20 0 1 0 27 0 4 0 1 0 1 54 13 8 34 0 2 0 37 8 7 0 1 0 1 259 38 10 87 2 6 7 86 15 21 0 1 0 1 278 47 25 111 1 8 15 103 9 27 0 2 0 2 177 27 9 67 1 4 4 63 8 16 0 1 0 1 566 37 97 224 5 15 135 210 31 54 0 4 0 3 232 18 28 128 3 9 20 118 9 31 0 2 0 2 331 23 56 147 10 10 6 139 8 35 0 2 0 2 88 10 15 71 0 5 4 67 2 17 0 1 0 1 275 33 52 139 5 9 49 143 8 33 0 2 0 2 144 12 26 79 1 5 3 74 1 19 0 1 0 1 346 32 137 182 10 12 89 173 17 45 0 3 0 3 347 24 71 116 6 8 81 110 12 28 0 2 0 2
0 2,221 0 85 0 2 0 89 0 24 0 2 0 3
6,256 2,885 1,979 3,196 138 210 1,929 3,082 494 772 28 53 28 53
82 83 193 109 43 24 137 90 204 186 2,325 1,280 3,605 36 84 52 107 11 21 36 87 90 183 1,225 1,250 2,475 40 43 23 57 3 13 11 46 63 99 825 666 1,491 58 51 44 65 12 23 18 55 40 113 864 792 1,656 5 21 3 24 1 5 2 20 27 41 172 285 457 1 31 5 41 0 7 4 30 8 69 180 477 657 41 40 73 50 17 11 62 41 70 84 1,017 589 1,606 54 29 71 38 15 7 47 29 123 66 903 456 1,359 27 27 28 35 6 5 25 28 44 57 529 404 933 35 35 60 35 7 9 58 29 73 52 664 457 1,121 0 13 0 8 0 3 0 10 3 16 41 123 164 0 14 0 7 0 3 4 11 5 15 45 126 171 0 13 0 7 0 3 0 10 0 14 46 111 157 2 14 3 11 0 3 1 13 6 20 82 156 238 4 25 10 30 0 7 13 26 22 47 342 375 717 9 29 4 37 1 6 21 27 35 62 398 461 859 4 21 5 23 0 4 8 18 11 38 227 283 510 51 57 50 76 5 15 35 61 73 130 1,048 886 1,934 4 32 7 43 3 6 1 30 26 75 333 494 827 9 40 9 50 1 7 4 40 41 84 475 579 1,054 3 22 1 24 0 4 1 19 23 40 137 281 418 9 38 19 46 2 16 14 38 50 81 483 580 1,063 0 22 3 27 0 4 3 20 7 43 188 307 495 25 46 17 62 2 11 18 46 83 106 744 721 1,465 40 29 11 39 2 12 22 30 48 69 640 469 1,109
0 33 0 24 0 6 0 22 0 31 0 2,542 2,542
539 892 691 1,075 131 235 545 876 1,175 1,821 13,933 15,150 29,083
A–MeritB–Other(studentsadmittedunderdistrictquotaandunderprivilegeddistrictquota)
(a) 1. Arts–Arts/SocialScienceandHumanities,MassMedia/VisualandperformingArts.
2. Admission toArtsdegreeprogramme ispurelyonmerithowever,policyensures thenumber selectedfromeachdistricttobenotlessthanthenumberadmittedin1993/94or2002/03,whicheverisgreater.
ThisadjustmentisshownundertheOtherCoursescategory.
(b) Includes Biological Sciences, Physical Sciences, Food Sciences, Fisheries&Marine Sciences and PhysicalEducationcourses.
(c) “Special&Additional Intake” refers to the studentsadmittedon thebasis of SpecialCategories suchasBlindandDifferentlyabled,excelledinfieldsotherthanStudies,ArmedForces,Foreign,Teachers,etc.,ontherecommendationoftheAppealsCommitteeandAdditionalIntakesforspecialsubjectsinArtssuchasJapanies,English,History,etc.
Note: Informationgiven herein are onlywith regard to Universities andHigher Educational Institutes established under theUniversitiesAct.
(d) Includes all other courses conducted in theArchitecture Faculty such as Design,Town&CountryPlanning,LandscapeArchitectureandFacilitiesManagement.
(e) Includes the Management & Information Technology, Information Technology,Information & Communicat ion Technology, Information Technology &Management,Computation&Management,BusinessInformationSystems,etc.
(f) Other Courses – Fashion Design/Transport & Logistic Management, IndigenousMedicine, Paramedical Studies. Paramedical Studies includesNursing, Pharmacy,MedicalLaboratoriesSciences,Radiography,PhysiotherapyandSpeech&HearingSciences.
Source:UniversityGrantsCommission
(Contd.)
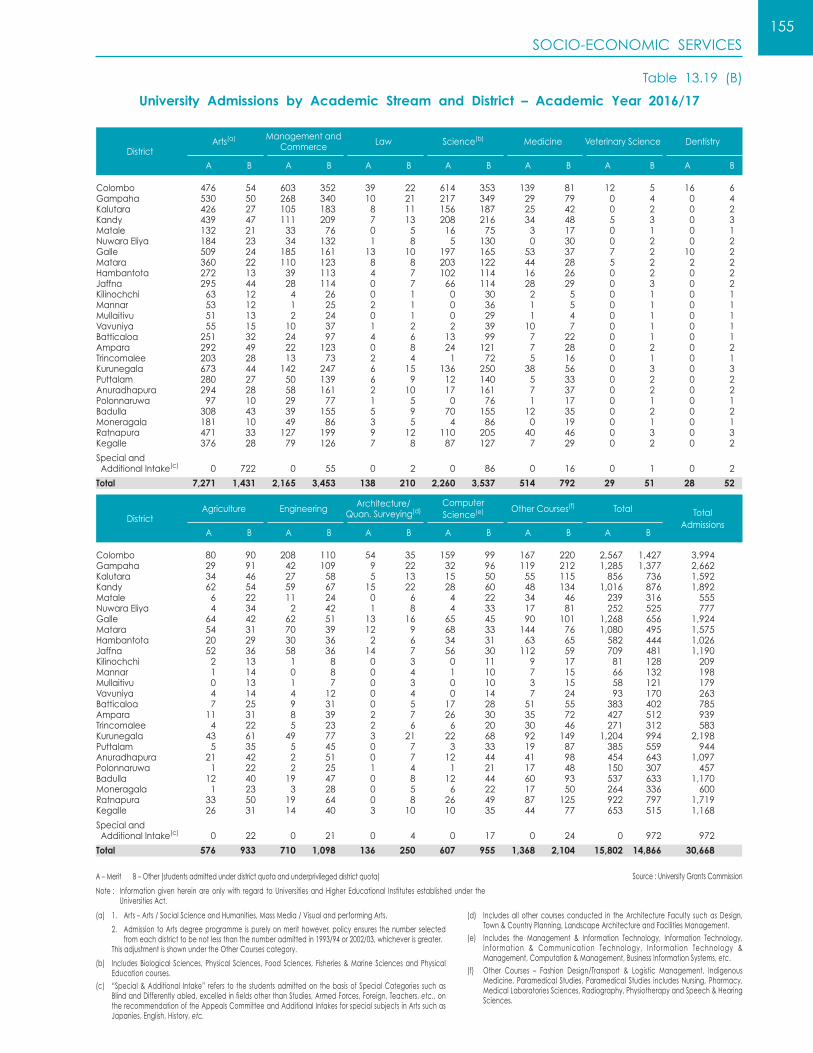
SOCIO-ECONOMIC SERVICES155
DistrictArts(a) Managementand
Commerce Law Science(b) Medicine VeterinaryScience Dentistry
A B A B A B A B A B A B A B
DistrictAgriculture Engineering Architecture/
Quan.Surveying(d)ComputerScience(e)
OtherCourses(f) Total TotalAdmissions
A B A B A B A B A B A B
University Admissions by Academic Stream and District – Academic Year 2016/17
Table 13.19 (B)
ColomboGampahaKalutaraKandyMataleNuwaraEliyaGalleMataraHambantotaJaffnaKilinochchiMannarMullaitivuVavuniyaBatticaloaAmparaTrincomaleeKurunegalaPuttalamAnuradhapuraPolonnaruwaBadullaMoneragalaRatnapuraKegalle
SpecialandAdditionalIntake(c)
Total
ColomboGampahaKalutaraKandyMataleNuwaraEliyaGalleMataraHambantotaJaffnaKilinochchiMannarMullaitivuVavuniyaBatticaloaAmparaTrincomaleeKurunegalaPuttalamAnuradhapuraPolonnaruwaBadullaMoneragalaRatnapuraKegalle
SpecialandAdditionalIntake(c)
Total
476 54 603 352 39 22 614 353 139 81 12 5 16 6 530 50 268 340 10 21 217 349 29 79 0 4 0 4 426 27 105 183 8 11 156 187 25 42 0 2 0 2 439 47 111 209 7 13 208 216 34 48 5 3 0 3 132 21 33 76 0 5 16 75 3 17 0 1 0 1 184 23 34 132 1 8 5 130 0 30 0 2 0 2 509 24 185 161 13 10 197 165 53 37 7 2 10 2 360 22 110 123 8 8 203 122 44 28 5 2 2 2 272 13 39 113 4 7 102 114 16 26 0 2 0 2 295 44 28 114 0 7 66 114 28 29 0 3 0 2 63 12 4 26 0 1 0 30 2 5 0 1 0 1 53 12 1 25 2 1 0 36 1 5 0 1 0 1 51 13 2 24 0 1 0 29 1 4 0 1 0 1 55 15 10 37 1 2 2 39 10 7 0 1 0 1 251 32 24 97 4 6 13 99 7 22 0 1 0 1 292 49 22 123 0 8 24 121 7 28 0 2 0 2 203 28 13 73 2 4 1 72 5 16 0 1 0 1 673 44 142 247 6 15 136 250 38 56 0 3 0 3 280 27 50 139 6 9 12 140 5 33 0 2 0 2 294 28 58 161 2 10 17 161 7 37 0 2 0 2 97 10 29 77 1 5 0 76 1 17 0 1 0 1 308 43 39 155 5 9 70 155 12 35 0 2 0 2 181 10 49 86 3 5 4 86 0 19 0 1 0 1 471 33 127 199 9 12 110 205 40 46 0 3 0 3 376 28 79 126 7 8 87 127 7 29 0 2 0 2
0 722 0 55 0 2 0 86 0 16 0 1 0 2
7,271 1,431 2,165 3,453 138 210 2,260 3,537 514 792 29 51 28 52
80 90 208 110 54 35 159 99 167 220 2,567 1,427 3,994 29 91 42 109 9 22 32 96 119 212 1,285 1,377 2,662 34 46 27 58 5 13 15 50 55 115 856 736 1,592 62 54 59 67 15 22 28 60 48 134 1,016 876 1,892 6 22 11 24 0 6 4 22 34 46 239 316 555 4 34 2 42 1 8 4 33 17 81 252 525 777 64 42 62 51 13 16 65 45 90 101 1,268 656 1,924 54 31 70 39 12 9 68 33 144 76 1,080 495 1,575 20 29 30 36 2 6 34 31 63 65 582 444 1,026 52 36 58 36 14 7 56 30 112 59 709 481 1,190 2 13 1 8 0 3 0 11 9 17 81 128 209 1 14 0 8 0 4 1 10 7 15 66 132 198 0 13 1 7 0 3 0 10 3 15 58 121 179 4 14 4 12 0 4 0 14 7 24 93 170 263 7 25 9 31 0 5 17 28 51 55 383 402 785 11 31 8 39 2 7 26 30 35 72 427 512 939 4 22 5 23 2 6 6 20 30 46 271 312 583 43 61 49 77 3 21 22 68 92 149 1,204 994 2,198 5 35 5 45 0 7 3 33 19 87 385 559 944 21 42 2 51 0 7 12 44 41 98 454 643 1,097 1 22 2 25 1 4 1 21 17 48 150 307 457 12 40 19 47 0 8 12 44 60 93 537 633 1,170 1 23 3 28 0 5 6 22 17 50 264 336 600 33 50 19 64 0 8 26 49 87 125 922 797 1,719 26 31 14 40 3 10 10 35 44 77 653 515 1,168
0 22 0 21 0 4 0 17 0 24 0 972 972
576 933 710 1,098 136 250 607 955 1,368 2,104 15,802 14,866 30,668
Source:UniversityGrantsCommissionA–MeritB–Other(studentsadmittedunderdistrictquotaandunderprivilegeddistrictquota)
(a) 1. Arts–Arts/SocialScienceandHumanities,MassMedia/VisualandperformingArts.
2. Admission toArtsdegreeprogramme ispurelyonmerithowever,policyensures thenumber selectedfromeachdistricttobenotlessthanthenumberadmittedin1993/94or2002/03,whicheverisgreater.
ThisadjustmentisshownundertheOtherCoursescategory.
(b) Includes Biological Sciences, Physical Sciences, Food Sciences, Fisheries&Marine Sciences and PhysicalEducationcourses.
(c) “Special&Additional Intake” refers to the studentsadmittedon thebasis of SpecialCategories suchasBlindandDifferentlyabled,excelledinfieldsotherthanStudies,ArmedForces,Foreign,Teachers,etc.,ontherecommendationoftheAppealsCommitteeandAdditionalIntakesforspecialsubjectsinArtssuchasJapanies,English,History,etc.
Note: Informationgiven herein are onlywith regard to Universities andHigher Educational Institutes established under theUniversitiesAct.
(d) Includes all other courses conducted in theArchitecture Faculty such as Design,Town&CountryPlanning,LandscapeArchitectureandFacilitiesManagement.
(e) Includes the Management & Information Technology, Information Technology,Information & Communicat ion Technology, Information Technology &Management,Computation&Management,BusinessInformationSystems,etc.
(f) Other Courses – Fashion Design/Transport & Logistic Management, IndigenousMedicine, Paramedical Studies. Paramedical Studies includesNursing, Pharmacy,MedicalLaboratoriesSciences,Radiography,PhysiotherapyandSpeech&HearingSciences.

SOCIO-ECONOMIC SERVICES156
Ethnicity ArtsManagementandCommerce
Law Science(a) Medicine Dentistry
Ethnicity VeterinaryScience Agriculture Engineering Architecture/
Quan.Surv.(b)ComputerScience(c)
Other(d) Total
University Admissions by Academic Stream and EthnicityAcademic Year 2013/2014 – 2016/2017
Table 13.20
Sinhalese 2013/14 2014/15 2015/16 2016/17
Tamil 2013/14 2014/15 2015/16 2016/17
Moor 2013/14 2014/15 2015/16 2016/17
Other 2013/14 2014/15 2015/16 2016/17
Total 2013/14 2014/15 2015/16 2016/17
Sinhalese 2013/14 2014/15 2015/16 2016/17
Tamil 2013/14 2014/15 2015/16 2016/17
Moor 2013/14 2014/15 2015/16 2016/17
Other 2013/14 2014/15 2015/16 2016/17
Total 2013/14 2014/15 2015/16 2016/17
5,353 4,169 297 4,129 1,052 86 5,736 4,298 289 4,130 997 67 5,605 4,455 279 4,221 1,009 66 5,907 4,763 286 4,891 1,042 63
1,172 472 40 431 127 11 1,238 526 33 449 145 9 1,869 495 38 458 164 7 1,532 566 34 529 155 11
852 233 32 286 83 7 965 190 26 312 92 4 1,601 210 28 310 83 5 1,224 268 27 355 100 6
19 8 1 3 15 0 27 16 2 3 21 0 54 15 3 19 1 2 37 21 1 21 7 0
7,396 4,882 370 4,849 1,277 104 7,966 5,030 350 4,894 1,255 80 9,129 5,175 348 5,008 1,257 80 8,700 5,618 348 5,796 1,304 80
99 1,338 1,351 331 1,085 883 20,173 85 1,213 1,331 287 1,055 827 20,315 66 1,163 1,464 312 1,075 903 22,618 65 1,206 1,485 314 1,186 1,104 22,312
15 166 200 48 185 150 3,017 11 175 194 58 192 173 3,203 13 191 223 39 207 133 3,837 11 206 232 54 229 185 3,744
3 92 72 18 125 152 1,955 3 107 74 17 117 166 2,073 1 76 75 13 133 132 2,667 4 94 87 18 139 159 2,481
1 1 5 0 1 1 55 0 2 4 2 4 4 85 1 1 2 1 6 3 111 0 3 3 0 8 8 109
118 1,597 1,628 397 1,396 1,186 25,200 99 1,497 1,603 364 1,368 1,170 25,676 81 1,431 1,764 365 1,421 1,171 27,230 80 1,509 1,807 386 1,562 1,456 28,646
Source:UniversityGrantsCommissionNote: InformationgivenhereinareonlywithregardtoUniversitiesandHigherEducationalInstitutesestablishedundertheUniversitiesAct.
(a) IncludesBiologicalSciences,PhysicalSciences,SurveyingScience,FoodSciences,Fisheries&MarineSciencesandPhysicalEducationcourses.
(b) IncludesallothercoursesconductedintheArchitectureFacultysuchasDesign,Town&CountryPlanning,LandscapeArchitectureandFacilitiesManagement.
(c) Includes theManagement & Information Technology, Information Technology, Information & Communication Technology, InformationTechnologyandManagement,Computation&Management,BusinessInformationSystems,InformationSystems,ComputerScienceandTechnology,etc.
(d) IncludesIndigenousMedicine,ParamedicalStudiesandFashionDesign/TransportandLogisticManagement.
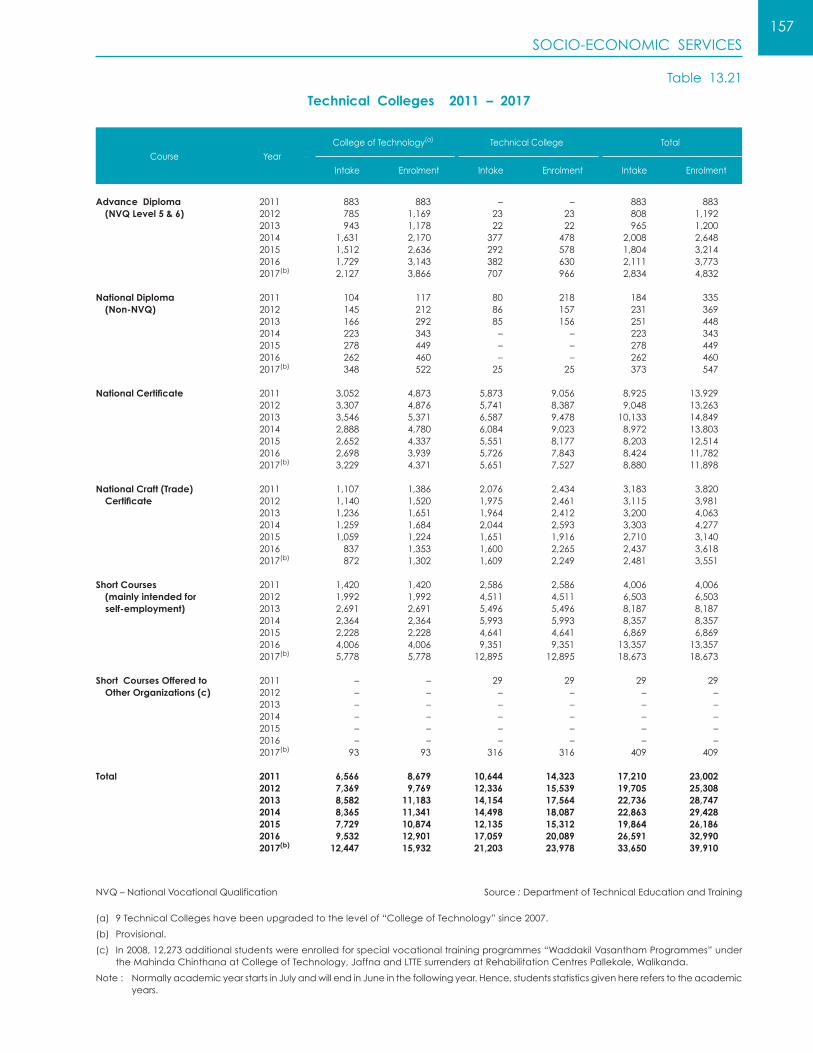
SOCIO-ECONOMIC SERVICES157
Course Year
CollegeofTechnology(a) TechnicalCollege Total
Intake Enrolment Intake Enrolment Intake Enrolment
Technical Colleges 2011 – 2017
Table 13.21
Advance Diploma (NVQ Level 5 & 6)
National Diploma (Non-NVQ)
National Certificate
National Craft (Trade) Certificate
Short Courses (mainly intended for self-employment)
Short Courses Offered to Other Organizations (c)
Total
2011 883 883 – – 883 883 2012 785 1,169 23 23 808 1,192 2013 943 1,178 22 22 965 1,200 2014 1,631 2,170 377 478 2,008 2,648 2015 1,512 2,636 292 578 1,804 3,214 2016 1,729 3,143 382 630 2,111 3,773 2017(b) 2,127 3,866 707 966 2,834 4,832 2011 104 117 80 218 184 335 2012 145 212 86 157 231 369 2013 166 292 85 156 251 448 2014 223 343 – – 223 343 2015 278 449 – – 278 449 2016 262 460 – – 262 460 2017(b) 348 522 25 25 373 547 2011 3,052 4,873 5,873 9,056 8,925 13,929 2012 3,307 4,876 5,741 8,387 9,048 13,263 2013 3,546 5,371 6,587 9,478 10,133 14,849 2014 2,888 4,780 6,084 9,023 8,972 13,803 2015 2,652 4,337 5,551 8,177 8,203 12,514 2016 2,698 3,939 5,726 7,843 8,424 11,782 2017(b) 3,229 4,371 5,651 7,527 8,880 11,898 2011 1,107 1,386 2,076 2,434 3,183 3,820 2012 1,140 1,520 1,975 2,461 3,115 3,981 2013 1,236 1,651 1,964 2,412 3,200 4,063 2014 1,259 1,684 2,044 2,593 3,303 4,277 2015 1,059 1,224 1,651 1,916 2,710 3,140 2016 837 1,353 1,600 2,265 2,437 3,618 2017(b) 872 1,302 1,609 2,249 2,481 3,551 2011 1,420 1,420 2,586 2,586 4,006 4,006 2012 1,992 1,992 4,511 4,511 6,503 6,503 2013 2,691 2,691 5,496 5,496 8,187 8,187 2014 2,364 2,364 5,993 5,993 8,357 8,357 2015 2,228 2,228 4,641 4,641 6,869 6,869 2016 4,006 4,006 9,351 9,351 13,357 13,357 2017(b) 5,778 5,778 12,895 12,895 18,673 18,673 2011 – – 29 29 29 29 2012 – – – – – – 2013 – – – – – – 2014 – – – – – – 2015 – – – – – – 2016 – – – – – – 2017(b) 93 93 316 316 409 409 2011 6,566 8,679 10,644 14,323 17,210 23,002 2012 7,369 9,769 12,336 15,539 19,705 25,308 2013 8,582 11,183 14,154 17,564 22,736 28,747 2014 8,365 11,341 14,498 18,087 22,863 29,428 2015 7,729 10,874 12,135 15,312 19,864 26,186 2016 9,532 12,901 17,059 20,089 26,591 32,990 2017(b) 12,447 15,932 21,203 23,978 33,650 39,910
NVQ–NationalVocationalQualification Source :DepartmentofTechnicalEducationandTraining
(a) 9TechnicalCollegeshavebeenupgradedtothelevelof“CollegeofTechnology”since2007.
(b) Provisional.
(c) In2008,12,273additionalstudentswereenrolledforspecialvocationaltrainingprogrammes“WaddakilVasanthamProgrammes”undertheMahindaChinthanaatCollegeofTechnology,JaffnaandLTTEsurrendersatRehabilitationCentresPallekale,Walikanda.
Note: NormallyacademicyearstartsinJulyandwillendinJuneinthefollowingyear.Hence,studentsstatisticsgivenherereferstotheacademicyears.

SOCIO-ECONOMIC SERVICES158
Item 2008 2009 2010 2011 2012 2013 2014 2015 2016(a) 2017(b)
Health Services 2008 – 2017
Table 13.22
Western Medicine(c)
Hospitals PrimaryMedicalCareUnits Doctors(d) HospitalBeds Nurses Attendants InPatientsTreated,’000 OutPatients’Visits,’000 Midwives
Family Planning
NewAcceptors(No.)
Loops OralPills Sterilizations Injectables Implant
TotalExpenditureonHealth,Rs.Mn.
CurrentExpenditure CapitalExpenditure
ImportsofMedicalandPharmaceuticalProducts(Govt.&Private),Rs.Mn.
Sources:MinistryofHealth FamilyHealthBureau SriLankaCustoms
(a) Revised(b) Provisional(c) PublicSector.(d) IncludesAssistantMedicalPractitioners.(e) IncludingInternMedicalOfficers.n.a.–Notavailable
619 555 568 592 593 603 601 610 610 612 411 475 476 475 480 481 484 475 475 506 14,255 14,831 15,283(e) 17,481(e) 18,190 18,610 18,958 20,446(e) 21,469 21,259 65,835 68,897 69,501 69,731 73,437 74,636 76,918 76,781 76,829 76,774 22,996 25,549 27,494 29,101 30,136 30,928 31,964 32,272 32,499 34,221 7,184 8,301 8,189 7,477 8,403 8,091 8,215 8,689 8,268 9,218 4,898 5,474 5,591 n.a. 5840 5,926 6,120 6,322 6,493 n.a. 45,382 48,782 49,871 n.a. 50631 53,861 55,105 54,652 53,044 n.a. 8,937 8,943 8,726 8,748 8,745 8,874 9,022 9,021 8,864 8,532
267,133 245,013 223,595 208,100 238,016 181,645 127,130 153,901 157,191 168,120
58,770 52,141 48,350 47,315 73,932 52,917 40,813 44,916 37,517 32,986 53,594 50,454 45,398 38,433 79,957 43,556 26,644 33,279 27,609 26,080 23,480 22,091 21,587 19,787 21,109 15,771 11,657 14,419 14,806 16,106120,004 110,966 98,540 87,865 37,886 34,713 8,195 14,491 36,322 49,262 11,285 9,361 9,720 14,700 25,132 34,688 39,821 46,796 40,937 43,686
74,548 71,452 73,835 89,237 99,101 119,530 138,403 177,789 186,149 196,820
55,874 58,789 60,506 74,443 81,946 99,609 116,151 140,560 155,402 161,312 18,674 12,664 13,329 14,794 17,155 19,920 22,252 37,230 30,747 35,509
23,010 23,199 24,549 38,487 47,537 48,845 49,685 62,498 76,547 79,299
Total Expenditure on Health
20172008 2009 2010 2011 2012 2013 2014 2015 2016
120,000
160,000
200,000
Rs.
Mill
ion
80,000
40,000
0

SOCIO-ECONOMIC SERVICES159
YearMedicalOfficers(a)
DentalSurgeons(b)
Reg./Asst.MedicalOfficers
Nurses(c)PublicHealth
HospitalMidwivesNursing
Sisters(d)Inspectors Midwives
Selected Public Health Personnel 1992 – 2016
Table 13.23
1992 3,345 381 1,253 11,214 113 846 4,108 2,0251993 3,713 390 1,305 11,818 109 876 4,361 2,1721994 4,047 387 1,357 13,060 117 928 4,400 2,2141995 4,577 421 1,376 13,403 174 932 4,383 2,2881996 5,117 462 1,397 13,933 189 915 4,352 2,3931997 5,628 481 1,384 13,815 145 901 4,497 2,2841998 6,427 521 1,340 14,448 183 888 4,578 2,4101999 6,994 529 1,340 14,052 237 1,142 4,625 2,5032000 7,963 637 1,349 14,716 270 1,486 4,798 2,5962001 8,384 751 1,343 15,797 259 1,401 4,654 2,7232002 9,290 867 1,326 16,517 310 1,470 4,819 2,7942003 9,063 889 1,260 16,621 310 1,420 4,319 3,1542004 8,874 915 1,218 18,654 315 1,397 4,524 2,6682005 10,198 954 1,274 19,934 313 1,512 4,896 2,3712006 10,279 1,181 1,183 18,950 299 1,535 5,080 2,5552007 11,023 1,314 1,194 22,370 290 1,740 6,167 2,8282008 12,479 858 1,134 23,800 270 1,475 5,331 3,0162009 13,874 1,051 1,099 31,198 169 1,371 5,167 2,7732010 14,388 1,122 1,096 32,680 310 1,383 5,634 2,8232011 n.a. n.a. n.a. n.a. n.a. n.a. n.a. n.a.2012 15,910 1,223 1,130 31,218 332 1,510 5,821 2,6052013 16,690 1,279 1,064 31,235 322 1,544 5,950 2,8482014 17,615 1,360 999 32,893 277 1,526 5,954 2,8882015 18,243 1,340 936 34,051 290 1,604 6,041 2,7652016(e) 18,968 1,433 883 34,069 277 1,692 6,247 2,365
Source:MedicalStatisticsUnit,MinistryofHealth(a) IncludesMedicalOfficersincurative,administrativeandpreventiveservices.(b) IncludesRegionalandConsultantDentalSurgeons.(c) ExcludesPupilNurses.(d) SupervisingPublicHealthNursingSisters/PublicHealthNursingSisters.(e) Provisional.
n.a.–Notavailable
No. of Medical Officers (Public Sector)
20162006 2007 2008 2009 2010 2012 2014 20152013
20,000
12,000
16,000
8,000
4,000
0
Nu
mb
er

SOCIO-ECONOMIC SERVICES160
Public Health Personnel by District 2016(a)
Table 13.24
ColomboGampahaKalutaraKandyMataleNuwaraEliyaGalleMataraHambantotaJaffnaMannarVavuniyaMullaitivuKilinochchiBatticaloaAmparaTrincomaleeKalmunaiKurunegalaPuttalamAnuradhapuraPolonnaruwaBadullaMoneragalaRatnapuraKegalle
Total
ColomboGampahaKalutaraKandyMataleNuwaraEliyaGalleMataraHambantotaJaffnaMannarVavuniyaMullaitivuKilinochchiBatticaloaAmparaTrincomaleeKalmunaiKurunegalaPuttalamAnuradhapuraPolonnaruwaBadullaMoneragalaRatnapuraKegalle
Total
4,515 296 133 9,724 29 255 430 215 2,043 86 78 3,041 30 115 457 151 826 69 45 2,131 40 105 469 139 1,812 190 135 4,319 16 86 440 202 381 21 34 607 10 44 163 66 300 34 14 424 4 42 322 57 898 58 57 2,814 17 93 310 145 590 37 40 1,400 9 65 271 110 424 32 10 1,442 15 55 208 101 589 41 15 830 3 60 175 38 104 7 4 123 1 20 59 28 229 18 1 340 2 15 88 3 69 7 – 94 1 17 43 18 108 13 1 93 – 12 57 12 432 30 13 891 11 56 189 96 350 26 4 1,461 1 29 138 30 300 27 11 441 1 37 154 55 374 27 14 661 7 49 151 126 1,063 94 92 2,902 22 113 454 178 479 47 21 644 3 50 189 58 565 43 29 1,970 9 83 232 118 395 33 11 618 5 36 123 48 613 62 35 1,916 12 58 295 118 317 23 9 527 10 36 193 61 672 68 35 1,993 11 89 369 94 520 44 42 1,150 8 72 268 98
18,968 1,433 883 42,556 277 1,692 6,247 2,365
393 129 498 212 157 102 27 32 116 92 108 34 54 23 7 35 54 51 79 14 13 16 2 30 137 97 130 76 49 29 10 20 30 48 23 7 5 6 – 8 21 49 19 8 6 4 2 10 80 79 74 34 27 9 6 26 53 63 45 14 12 8 2 21 39 54 33 13 7 7 2 15 48 52 34 15 16 4 2 8 6 13 6 2 2 – – 2 3 13 15 5 4 1 4 4 3 12 4 2 3 – – 1 5 13 4 2 2 1 1 – 33 34 31 11 11 9 2 4 29 24 30 9 8 9 1 3 29 27 22 7 8 4 2 2 35 29 36 12 8 8 1 5 90 129 83 27 22 16 5 39 41 76 36 9 7 7 2 12 53 87 52 20 19 13 3 15 42 27 26 11 11 8 2 11 62 79 57 19 19 11 3 16 27 42 26 8 6 6 – 11 64 75 50 22 13 10 3 19 53 70 45 14 11 4 – 15
1,546 1,464 1,566 607 500 315 89 364
DistrictMedicalOfficers(b)
DentalSurgeons(c)
Reg./Asst.MedicalOfficers
Nurses(d)PublicHealth
HospitalMidwivesNursing
Sisters(e)Inspectors(f) Midwives
DistrictPharma-cists
DispensersMedicalLab
Technologists
Radio-Graphers
Physio-therapists
ECGRecordists
EEGRecordists
SchoolDental
Therapists
(a) Provisional(b) IncludesMedicalOfficersinAdministrativeGradeandSpecialists.(c) IncludesRegionalDentalSurgeonsandConsultantDentalSurgeons.(d) IncludesSupervisingPublicHealthNursingSisters,PublicHealthNursingSistersandPupilNurses.(e) SupervisingPublicHealthNursingSisters/PublicHealthNursingSisters.(f) IncludesSupervisingPublicHealthInspectors.
Source:MedicalStatisticsUnit, MinistryofHealthcare&Nutrition

SOCIO-ECONOMIC SERVICES161
Item 2008 2009 2010 2011 2012 2013 2014 2015 2016 2017(a)
Activities of Health Campaigns 2008 – 2017
Table 13.25
Sexually Transmitted Diseases
PatientsExamined,’000PositiveCases,’000PersonnelStrength(b)– Doctors Others
Expenditure(c),Rs.Mn.
Malaria
PatientsExamined,’000PositiveCases,’000PersonnelStrength–Doctors Others
Expenditure,Rs.Mn.
Leprosy
PatientsExamined,’000PositiveCases,’000PersonnelStrength–Doctors(f)
Others(f)
Expenditure,Rs.Mn.
Respiratory Diseases
PatientsExamined,’000SputumPositiveTBPatients,’000PersonnelStrength–Doctors Others
Expenditure,Rs.Mn.
Filariasis
PatientsExamined,’000PositiveCases,’000PersonnelStrength–Doctors(j)
Others(j)
Expenditure,Rs.Mn.
Sources:STD/AIDSControlProgramme Anti-MalariaCampaign Anti-LeprosyCampaign RespiratoryDiseaseControlProgramme Anti-FilariasisCampaign.
(a) Provisional.
(b) NationalSTD/AIDScontrolprogramme.
(c) ExpenditureforCentralSTDcliniconly.
(d) Noindigenousmalariacasesreported.
(e) FiguresstatedrepresentexpenditurebornebyAntiMalariaCampaignDirectorateandprovinces.ThisexcludesexpenditureforHambantota,AnuradhapuraandRatnapuradistricts,becausetheauthoritiesareunabletogivethespecificamountsspentonmalariacontrol.
(f) OnlyCentralCampaign.
(g) Includesnewandre-treatmentpatientsdiagnosedbysputumsmear,cultureorWRD.In2013and2014onlythesputumsmearpositivenewcaseswereconsidered
(h) IncludesstaffofCentralUnit,NHRDWelisara,NationalTuberculosisReferenceLaboratory,CentralDrugStores,ChestClinicsColomboandGampaha.
(i) Includes staff ofCentral Unit, National Tuberculosis Reference Laboratory,Central Drug Stores,ChestClinicsColomboandGampaha.
(j) Includesonlycampaignstaff.
(k) IncludesexpenditureofCentralgovernmentonly.
n.a.–Notavailable
…–Negligible
16.8 17.2 13.7 19.3 15.5 19.6 22.1 22.9 22.0 19.5 10.0 10.5 8.3 11.7 9.0 10.5 10.9 11.0 11.0 10.9 26 30 37 75 25 80 67 93 103 110 128 98 99 339 98 350 328 378 380 336
51.8 58.7 69.4 75.2 75.1 158.0 196.2 263.2 323.9 388.3
1,047.1 909.6 1,001.1 994.5 948.2 988.7 1,069.8 1,142.4 1,031.0 1,074.7 0.7 0.6 0.7 0.1 ... 0.0(d) 0.0(d) 0.0(d) 0.0(d) 0.0(d)
27 29 23 24 19 25 23 24 20 28 2,227 2,084 1,861 1,858 1,734 1,712 1,627 1,611 1,448 1,430
207.0 204.0 335.0 556.0(e) 414.0(e) 429.0(e) 465.0(e) 532.0(e) 456.0(e) 694.0(e)
n.a. n.a. n.a. n.a. n.a. n.a. n.a. n.a. n.a. n.a. 2.0 2.0 2.1 1.9 2.2 2.1 2.3 2.1 1.8 1.8 10 8 7 6 11 9 12 13 13 13 71 60 63 75 67 65 67 87 92 74
35.8 32.9 42.1 38.5 50.3 64.8 66.2 87.1 91.2 107.8
56.2 91.4 106.3 139.8 150.5 157.5 162.9 216.5 140.9 131.5 4.7 4.8 4.6 4.5 4.3 4.4 4.3 4.7(g) 4.5(g) 4.3(g)
115 81 150 569 109(h) 37(i) 39(i) 47(i) 51(i) 44(i)
505 487 677 516 545(h) 133(i) 153(i) 136(i) 137(i) 147(i)
332.3 454.0 555.0 514.0 561.3 213.9 289.0 267.3 430.2 458.0
513.4 494.7 482.9 411.6 373.1 420.0 344.9 337.9 372.4 330.8 0.2 0.2 0.2 0.1 0.1 0.2 0.2 0.1 0.2 0.1 5 6 6 5 10 9 10 4 4 4 20 25 25 27 24 27 25 25 28 28
n.a. 13.7(k) 21.9(k) 23.1(k) 28.4 35.7 38.8 34.8 50.7 35.6

SOCIO-ECONOMIC SERVICES162
Item 2008 2009 2010 2011 2012 2013 2014 2015 2016 2017(a)
Postal Services 2008 – 2017
Table 13.26
MainPostOffices(No.)
SubPostOffices(No.)
AgencyPostOffices(No.)
DeliveryAreas(No.)
AreaServedbya PostOffice(Sq.km.)
PopulationServedbya PostOffice
LettersPerInhabitant
DomesticMail,’000
Letters PostCards Newspapers& PrintedMaterials Express Insured Registered
Parcels
Parcels(Ordinary)Paid Parcels(Ordinary)Other
ForeignMail(Outward),’000
Sea
Letters PostCards Newspapers& PrintedMaterials SmallPackets/Parcels
Air
Aerogrames Letters PostCards Newspapers& PrintedMaterials SmallPackets/Parcels
ForeignMail(Inward),’000
Sea
Letters PostCards Newspapers& PrintedMaterials SmallPackets/Parcels
Air
Letters PostCards Newspapers& PrintedMaterials SmallPackets/Parcels
643 643 648 648 651 651 653 653 652 653
3,410 3,410 3,410 3,410 3,411 3,375 3,410 3,410 3,410 3,409
684 684 684 684 676 602 629 629 629 628
6,729 6,729 6,729 6,729 6,729 6,729 6,729 6,729 6,729 6,729
14 14 14 14 13 14 14 14 14 15
4,311 4,311 4,312 4,330 4,641 4,378 4,332 4,332 4,428 4,572
21 21 21 14 13 13 16 16 17 17
238,400 236,852 291,294 201,647 203,135 272,729 341,225 365,249 369,445 373,096 11,531 12,250 14,742 12,654 13,025 10,992 9,538 10,024 10,005 9,504 82,711 79,525 14,773 15,512 14,003 15,356 13,101 13,769 14,457 15,179 198 212 95 86 91 86 82 86 87 110 162 281 28 36 33 31 83 87 96 94 32,413 59,426 19,149 28,698 30,954 21,418 35,183 36,987 29,596 25,603
1,210 1,194 438 320 323 202 294 261 162 113 62 58 125 134 75 61 75
72 69 76 74 71 72 80 64 65 65 29 34 19 21 23 25 20 11 11 11 27 31 56 53 52 43 55 41 41 42 33 38 33 4 3 6 16 9 9 9
– – 2,131 2,023 2,213 2,122 63 42 42 42 24,997 27,356 4,526 5,382 4,748 4,885 2,020 1,587 1,603 1,618 3,025 3,451 6,631 7,329 7,163 7,041 829 862 871 878 917 840 134 143 156 144 219 196 198 199 406 387 94 6 3 5 8 6 6 6
65 67 62 59 57 62 210 187 190 192 43 40 31 28 29 34 3 1 1 1 59 57 43 39 37 47 91 74 75 76 48 48 98 7 7 5 8 6 5 5
20,745 22,498 19,315 20,167 20,489 20,642 1,805 1,346 1,359 1,372 2,420 2,765 2,165 3,154 2,932 2,687 25 27 27 27 1,492 1,623 1,456 1,569 1,635 1,559 225 187 189 190 408 422 410 27 32 25 840 2,011 2,031 2,051
(a)Provisional. Source:DepartmentofPosts
⎫⎬⎭

SOCIO-ECONOMIC SERVICES163
Mass Media 2008 – 2017
Item 2008 2009 2010 2011 2012 2013 2014 2015 2016 2017(a)
Item 2008 2009 2010 2011 2012 2013 2014 2015 2016 2017(a)
Telecommunication Services 2008 – 2017
Table 13.27
Table 13.28
(a) Provisional
(b) WirelessLocalLooptelephonesdeclinedin2012duetherectificationofstatisticalreportingssubsequenttothemergeroftwocompanies.
(c) WirelessLocalLooptelephonesandCellularphonesdeclined in2013due toa revision in theclassificationofactive subscribers in January2013.
(d) IncludeFixedWirelineServicesandFixedWirelessServicesonly.
(e) Includesmobileinternetconnectionsfrom2010onwards.
Sources: TelecommunicationsRegulatoryCommissionofSriLanka CentralBankofSriLanka
Fixed Access Services
Subscriber Base (’000) WirelineTelephonesinService(’000) WirelessLocalLoopTelephones(’000) GrowthRateoftheSubscribers TelephonePenetraction(d)
(Telephonesper100persons)
Other Services
CellularPhones(’000) CellularPhonesper100Persons PublicPayPhoneBooths InternetConnections(e)
3,446 3,436 3,535 3,608 3,449 2,707 2,710 2,601 2,550 2,603 934 872 897 942 999 1,062 1,123 1,128 1,166 1,198 2,513 2,564 2,638 2,667 2,450(b) 1,645(c) 1,587 1,473 1,384 1,405 25.7 -0.3 2.9 2.1 -4.4 -21.5 0.1 -4.0 -2.0 2.1
17.0 16.8 17.1 17.3 16.9 13.2 13.0 12.4 12.0 12.1
11,083 14,264 17,267 18,319 20,324 20,315(c) 22,123 24,385 26,228 28,199 55 70 84 88 100 99 107 116 124 132 7,417 7,378 6,958 6,458 6,983 6,773 6,642 5,809 5,301 5,137 234,000 240,000 502,000 844,749 1,365,655 2,009,456 3,396,295 4,090,920 4,920,554 5,904,260
161,578 164,547 170,240 173,255 228,269 334,348 345,029 383,129 411,760 398,759
117,136 123,245 126,730 128,163 156,375 210,805 206,979 226,490 258,995 245,103 12,927 9,347 8,884 10,194 28,748 47,302 62,625 75,906 60,969 60,249 31,516 31,955 34,627 34,897 43,146 76,241 75,424 80,734 91,796 93,407 25 26 26 27 36 52 53 58 62 59 88,696 82,801 80,295 88,281 90,403 106,574 117,544 124,949 127,064 136,307
66,178 62,096 62,948 70,453 66,710 68,699 74,960 80,811 83,288 91,461 8,007 7,071 3,233 3,964 9,698 15,432 20,335 21,653 19,324 19,479 14,511 13,635 14,115 13,864 13,995 22,443 22,250 22,485 24,452 25,367 84 78 75 81 85 100 109 115 115 122
18 20 21 22 25 25 25 25 24 22
56 48 51 51 54 54 54 54 54 55
Circulation of Newspapers(b)
DailyNewspapers,’000
Sinhala Tamil English Copiesper’000persons perday,No.
WeeklyNewspapers,’000
Sinhala Tamil English Copiesper’000persons perweek,No.
Televisions
No.ofTVChannels
Radios
No.ofRadioServices
Sources:AssociatedNewspapersofCeylonLtd. ExpressNewspapers(Ceylon)Ltd. SumathiPublications UpaliNewspapersLtd. WijeyaPublicationsLtd. MinistryofFinanceandMassMedia
(a)Provisional.(b)Nationalnewspapersonly.

SOCIO-ECONOMIC SERVICES164
Item 2008 2009 2010 2011 2012 2013 2014 2015 2016 2017
Prisoners 2008 – 2017
Table 13.29
Training Schools for Youthful Offenders
Admission Averagedailypopulation Admission to Prisons by Offence
Murder AttemptedMurder CulpableHomicideandAttempted CulpableHomicide Kidnapping Rape Simple&GrievousHurt CriminalForce&Intimidation UnlawfulIntercourse&Attempt AttemptSuicide&AbetmentofSuicide Burglary&Robbery Trespass,HouseBreaking& PossessionofHouseBreakingTools Extortion&Looting Cheating&CriminalBreachofTrust Theft OtherOffences
Total Admissions to Prisons by Length of Sentence
UnderoneMonth OneMonthtoSixMonths SixMonthstoOneYear OneYeartoTwoYears TwoYearstoFiveYears FiveYearstoTenYears OverTenYearsandDeathSentences
Total Death Sentences
Sentenced to Death DeathSentencesCommutedto Imprisonment AwaitingExecutionorFinalDecision forCommutationorExecution Admission Rate (Per 100,000 Population)
36 26 32 28 16 29 16 21 14 22 75 69 67 70 63 57 37 40 41 39
124 108 96 103 125 118 136 175 174 211 166 121 149 113 144 115 95 74 94 110 64 88 529 335 470 210 273 228 200 136 125 110 2 11 87 6 11 14 43 6 7 10 319 227 250 166 273 244 281 211 199 148 290 317 347 217 284 307 301 374 348 233 46 31 85 18 17 21 29 50 50 18 65 163 208 142 195 33 14 35 18 28 2 0 0 0 3 3 15 9 13 13 894 1130 1,438 819 1097 1,536 1,422 910 937 944 550 868 502 488 636 656 606 485 536 479 583 519 683 537 603 1065 603 504 671 312 344 321 493 405 501 885 513 369 379 485 1,216 1,268 1,356 1,282 1,893 1,780 1,689 1,218 1,220 1,278 28,436 32,453 25,964 22,512 22,336 23,755 21,641 19,530 19,225 18,366
33,566 37,872 32,128 27,018 28,391 30,760 27,588 24,086 24,060 22,833
2,440 3,034 2,972 2,098 3,826 2,961 3,518 2,243 4,774 4,316 13,647 12,973 11,150 11,147 13,192 15,013 12,559 12,317 11,780 11,479 6,895 8,566 6,424 5,706 4,984 6,003 5,421 5,509 3,214 3,195 7,103 9,375 8,367 5,757 3,772 4,104 3,651 2,322 2,502 2,251 2,377 3,105 2,433 1,698 2,003 2,024 1,783 1,043 1,203 989 576 453 415 357 296 352 311 205 226 213 528 366 367 255 318 303 345 447 361 390
33,566 37,872 32,128 27,018 28,391 30,760 27,588 24,086 24,060 22,833
128 108 96 107 131 124 153 186 180 217 0 0 0 0 0 0 0 0 0 0 128 108 96 107 131 124 153 186 180 217 166 185 156 130 140 151 133 115 114 107
Source:DepartmentofPrisons

SOCIO-ECONOMIC SERVICES165
Source:DepartmentofPrisons
District
2013 2014 2015 2016 2017
Male Female Total Male Female Total Male Female Total Male Female Total Male Female Total
Prisoners by District 2013 – 2017
Table 13.30
ColomboGampahaKalutaraKandyMataleNuwaraEliyaGalleMataraHambantotaJaffnaMannarVavuniyaMullaitivuKilinochchiBatticaloaAmparaTrincomaleeKurunegalaPuttalamAnuradhapuraPolonnaruwaBadullaMoneragalaRatnapuraKegalle
Total
10,614 301 10,915 9,574 279 9,853 10,982 241 11,223 8,189 276 8,465 8,832 205 9,037 4,647 97 4,744 4,160 90 4,250 1,577 89 1,666 2,432 173 2,605 2,001 78 2,079 1,288 45 1,333 1,275 46 1,321 839 43 882 1,824 68 1,892 1,549 44 1,593 1295 27 1322 638 29 667 556 34 590 516 36 552 725 13 738 401 11 412 540 9 549 401 17 418 243 14 257 468 8 476 390 13 403 453 12 465 270 18 288 366 12 378 207 19 226 1,553 66 1,619 1,513 76 1,589 962 49 1,011 1,156 36 1,192 1,090 6 1,096 472 25 497 382 18 400 486 21 507 617 16 633 368 9 377 348 4 352 307 8 315 81 1 82 240 6 246 279 6 285 253 18 271 200 16 216 266 11 277 409 13 422 463 11 474 95 5 100 107 8 115 223 9 232 187 5 192 181 3 184 435 12 447 460 14 474 279 13 292 273 15 288 312 10 322 108 3 111 205 8 213 256 8 264 224 9 233 231 7 238 127 4 131 123 6 129 330 7 337 328 27 355 94 4 98 488 24 512 534 32 566 426 20 446 456 13 469 430 12 442 499 26 525 508 21 529 358 17 375 414 11 425 293 7 300 330 8 338 254 9 263 318 14 332 235 8 243 202 6 208 1,838 59 1,897 1,541 30 1,571 1,436 60 1,496 1,282 72 1,354 880 27 907 961 34 995 685 32 717 573 21 594 895 37 932 280 16 296 935 37 972 1,136 35 1,171 878 18 896 895 19 914 1,101 19 1,120 436 19 455 292 12 304 257 8 265 231 3 234 211 5 216 459 7 466 401 10 411 350 10 360 324 4 328 359 10 369 414 13 427 279 1 280 203 7 210 255 1 256 253 10 263 836 19 855 729 28 757 477 13 490 578 10 588 873 21 894 644 17 661 458 5 463 543 10 553 596 11 607 586 9 595
29,866 894 30,760 26,754 834 27,588 23,327 759 24,086 23,165 895 24,060 22,268 565 22,833
Total Prisoners by Province – 2016/17
Western Central Southern Northern Eastern NorthWestern
NorthCentral
Uva Sabara-gamuwa
16,000
12,0002016
2017
8,000
4,000
0

SOCIO-ECONOMIC SERVICES166
Source:DepartmentofPrisons
Item
2014 2015 2016 2017
Male Female Total Male Female Total Male Female Total Male Female Total
Selected Demography of Prisoners 2014 – 2017
Table 13.31
Prisoners by Age Groups
Under16years 16to40years 41to60years Above60years
Prisoners by Educational Status
NoSchooling Grade1–5 PassedGrade8 PassedGCE(O/L) PassedGCE(A/L) Graduates Other
Prisoners by Marital Status
NeverMarried Married Widowed Divorced LegallySeparated
Prisoners by Ethnicity
Sinhalese Tamil Moor Malay Burgher Other
Prisoners by Religion
Buddhist Hindu Islam RomanCatholic OtherChristians Others
Total Convicted Prisoners
– – – – – – – – – – – –16,491 504 16,995 14,263 347 14,610 14,428 406 14,834 11,546 276 11,822 9,852 300 10,152 8,618 390 9,008 8,104 475 8,579 9,471 253 9,724 411 30 441 446 22 468 633 14 647 1251 36 1,287
1,445 95 1,540 981 118 1,099 1,361 162 1,523 1,294 82 1,376 5,818 219 6,037 4,304 142 4,446 12,239 534 12,773 9,480 163 9,64312,721 414 13,135 13,663 327 13,990 6,028 101 6,129 7,294 103 7,397 3,359 78 3,437 2,957 122 3,079 2,559 84 2,643 2,878 188 3,066 1,052 24 1,076 1,315 39 1,354 896 13 909 1,149 25 1,174 38 3 41 66 9 75 54 1 55 112 1 113 2,321 1 2,322 41 2 43 28 – 28 61 3 64
7,884 59 7,943 10,025 116 10,141 6,115 138 6,253 6,916 96 7,01217,398 555 17,953 12,179 473 12,652 15,131 629 15,760 13,756 408 14,164 519 97 616 221 69 290 563 55 618 551 29 580 659 76 735 508 52 560 779 48 827 741 17 758 294 47 341 394 49 443 577 25 602 304 15 319
18,572 521 19,093 17,174 436 17,610 13,109 496 13,605 15,269 356 15,625 4,283 176 4,459 3,261 212 3,473 4,876 296 5,172 3,891 117 4,008 3,633 126 3,759 2,860 90 2,950 4,995 100 5,095 3,043 85 3,128 55 2 57 8 9 17 90 – 90 12 – 12 90 4 94 19 7 26 85 2 87 16 3 19 121 5 126 5 5 10 10 1 11 37 4 41
17,089 441 17,530 16,158 362 16,520 11,833 467 12,300 14,240 327 14,567 3,363 163 3,526 2,579 171 2,750 4,153 240 4,393 3,302 97 3,399 3,708 127 3,835 2,870 116 2,986 4,969 91 5,060 3,050 85 3,135 1,595 70 1,665 1,398 70 1,468 1,899 77 1,976 1,381 43 1,424 976 32 1,008 302 40 342 296 20 316 277 9 286 23 1 24 20 – 20 15 – 15 18 4 22
26,754 834 27,588 23,327 759 24,086 23,165 895 24,060 22,268 565 22,833

SRI LANKA AND ASIA167
Demographic Indicators : SAARC Countries
Demographic Indicators : Selected East Asian Countries
Table 14.1
Table 14.2
IndicatorRef.Year
Sri Lanka
Afghanis-tan
Bangla-desh
Bhutan India Maldives Nepal Pakistan
IndicatorRef.Year
Indonesia Malaysia PhilippinesRep.ofKorea
Singapore Thailand
Mid-yearPopulation,Mn.
PopulationGrowth,%
LandArea(b),’000Sq.km.
DensityofPopulation[PersonsperSq.km.]
PopulationbyAgeGroups,% 0–14Years15–64Years65Years&Above
UrbanPopulation,%
CrudeBirthRate,per1,000
CrudeDeathRate,per1,000
TotalFertilityRate[BirthsperWoman]
InfantMortalityRate[per1,000LiveBirths]
MaternalMortalityRate[per100,000LiveBirths]
ExpectationofLifeatBirth,Years
Mid-yearPopulation,Mn.
PopulationGrowth,%
LandArea(a),’000Sq.km.
DensityofPopulation[PersonsperSq.km.]
PopulationbyAgeGroups,% 0–14Years15–64Years65Years&Above
UrbanPopulation,%
CrudeBirthRate,per1,000
CrudeDeathRate,per1,000
TotalFertilityRate[BirthsperWoman]
InfantMortalityRate[per1,000LiveBirths]
MaternalMortalityRate[per100,000LiveBirths]
ExpectationofLifeatBirth,Years
2000 19.1 21.0 129.3 0.6 1,019.0 0.3 21.0 140.0 2005 19.6 23.6 138.6 0.6 1,106.0 0.3 25.3 156.0 2010 20.7 26.0 148.6 0.7 1,186.0 0.4 26.3 173.5 2016 21.4(a) 29.2 160.8 0.8 1,299.0 0.5 28.3 195.4
2005 1.1 1.5 1.5 1.3 1.5 3.3 2.3 2.2 2010 1.0 2.0 1.4 1.8 1.4 2.3 1.4 2.1 2016 1.1 2.1 1.2 1.5 1.2 3.7 1.4 1.9
2016 62.7 652.9 147.6 38.4 3,287.3 0.3 147.2 796.1
2016 342(a) 53 1,252 21 445 1,392 202 251
2016 25.2(a) 43.9 28.9 26.9 28.2 23.4 31.7 34.9 2016 66.9(a) 53.6 66.0 68.3 66.0 72.5 62.7 60.6 2016 7.9(a) 2.5 5.1 4.8 5.8 4.1 5.6 4.5
2016 19.3 23.7 34.9 39.5 31.0(c) n.a. 19.6 39.9
2015 15.2(a) 33.3 19.5 17.4 19.7 20.8 20.2 28.8
2015 6.5(a) 8.0 5.4 6.2 7.3 3.8 6.3 7.3
2015 2.1 4.7 2.1 2.0 2.4 2.1 2.2 3.6
2015 9 66 31 27 38 7 29 66
2015 27 396 176 148 174 68 258 178
2015 75.0 60.7 72.0 69.8 68.3 77.0 70.0 66.4
(a) 2017
(b) Excludingareaunderinlandwaterbodies.
(c) 2015
n.a.–Notavailable
(a) Excludingareaunderinlandwaterbodies.
(b) 2015
(c) 2013
Sources: KeyIndicatorsforAsiaandthePacific2017,ADB HumanDevelopmentReport2016,UNDP WorldDevelopmentIndicators2018 (WorldBank-updated05/21/2018) DepartmentofCensusandStatistics RegistrarGeneral’sDepartment
Sources: KeyIndicatorsforAsiaandthePacific2016,ADB HumanDevelopmentReport2016,UNDP WorldDevelopmentIndicators2018 (WorldBank–updated05/21/2018)
2000 206.3 23.5 76.8 47.0 4.0 62.2 2005 219.9 26.0 84.7 48.2 4.3 64.1 2010 238.5 28.6 93.1 49.6 5.1 65.9 2016 258.7 31.7 103.2 51.2 5.6 67.5
2005 1.3 2.1 1.9 0.2 2.4 0.6 2010 2.7 1.8 2.3 0.5 1.8 0.6 2016 1.3 1.5 1.7 0.5 1.3 0.4
2016 1,910.9 330.8 300.0 100.3 0.7 513.1
2016 144 95 347 526 7,909 135
2016 27.7 24.6 32.0 13.7 15.2 17.7 2016 67.1 69.3 63.3 72.9 72.5 71.4 2016 5.2 6.1 4.7 13.4 12.3 11.0
2016 53.7(b) 74.8 44.3 82.6 100.0 44.5(c)
2015 19.6 16.8 23.3 8.6 9.7 10.5
2015 7.2 5.0 6.8 5.4 4.8 8.0
2015 2.4 1.9 2.9 1.2 1.2 1.5
2015 23 6 22 3 2 11
2015 126 40 114 11 10 20
2015 69.1 74.9 68.4 82.2 82.6 74.6

SRI LANKA AND ASIA168
National Accounts Indicators : SAARC Countries
Table 14.3
IndicatorRef.Year
Sri Lanka(a)
Afghanis-tan
Bangla-desh
Bhutan India Maldives Nepal Pakistan
Gross Domestic Product (GDP)(b), Mn US $
GDP Per Capita(b), US$
GDP Per Capita at PPP, US$
Growth Rate of Real GDP, %
Sectoral Composition of GDP(b)(e), %
Agriculture
Industry
Services
Consumption, Investment and Savings, % of GDP(b)
PrivateConsumption
GovernmentConsumption
GrossDomesticCapital Formation
GrossDomesticSavings
GrossNationalSavings
Sources:KeyIndicatorsforAsiaandthePacific2017,ADB WorldDevelopmentIndicators2018 (WorldBank–updated05/21/2018) DepartmentofCensusandStatistics
(a) Thedata is basedon thebase year 2010GDP estimates of the Department ofCensusandStatistics.
(b) Estimatesatcurrentmarketprices.(c) Revised(d) Provisional
(e) ForSriLanka,excludingtaxeslesssubsidieson products (GDP = the sumof the grossvalueaddedatbasicprices,plusalltaxesonproducts,lessallsubsidiesonproducts).
(f) Estimatesatcurrentfactorcostprices.(g) Estimatesatcurrentproducers’prices.n.a.–Notavailable
2013 74,294 20,264 149,990 1,798 1,856,722 3,295 19,271 231,219 2014 79,359 20,616 172,885 1,945 2,035,393 3,697 20,003 244,361 2015 80,556(c) 19,216 195,079 2,059 2,089,865 4,007 21,411 270,556 2016 81,776(c)(d) 19,469 221,415 2,213 2,263,792 4,224 21,132 278,913 2013 3,609 639 952 2,351 1,452 8,291 689 1,272 2014 3,821 629 1,085 2,505 1,573 9,057 706 1,317 2015 3,842(c) 570 1,210 2,615 1,596 9,576 747 1,429 2016 3,857(c)(d) 562 1,359 2,774 1,710 9,875 729 1,444 2013 10,599 2,295 2,989 7,636 5,368 10,722 2,315 4,554 2014 11,219 2,357 3,184 8,086 5,798 11,171 2,472 4,757 2015 11,778 2,298 3,384 8,566 6,251 11,201 2,544 4,939 2016 12,316 2,363 3,629 9,190 6,700 12,429 2,556 5,178 2013 3.4 6.4 6.0 2.1 6.1 4.7 4.1 4.4 2014 5.0 3.1 6.1 5.7 7.2 6.0 6.0 4.7 2015 5.0(c) -1.8 6.6 6.5 7.9 2.8 3.3 4.7 2016 4.5(c)(d) 3.6 7.1 n.a. 6.6 3.9 0.4 5.5
2013 7.7 25.6(f) 16.3(g) 17.1 18.0(f) 3.9 33.8 24.8(f)
2014 8.0 25.2(f) 16.1(g) 17.7 17.0(f) 3.4 32.5 25.0(f)
2015 8.2(c) 22.9 15.5 17.4 17.0 3.1 31.8 25.5 2016 7.5(c)(d) 24.1 14.8 n.a. 17.4 n.a. 31.6 24.6 2013 29.2 20.5(f) 27.6(g) 44.6 30.7(f) 16.7 15.2 21.0(f)
2014 28.3 21.7(f) 27.6(g) 42.9 30.0(f) 18.5 15.1 20.9(f)
2015 27.2(c) 22.9 28.2 43.2 29.7 22.0 14.9 19.0 2016 27.3(c)(d) 22.0 28.8 n.a. 28.8 n.a. 14.2 19.4 2013 56.4 53.9(f) 56.1(g) 38.3 51.3(f) 79.5 51.0 54.2(f)
2014 56.9 53.1(f) 56.3(g) 39.4 53.0(f) 78.1 52.4 54.1(f)
2015 57.4(c) 54.2 56.4 39.4 53.2 74.9 53.3 55.5 2016 56.9(c)(d) 53.9 56.5 n.a. 53.8 n.a. 54.2 56.0
2013 67.6 80.6 72.8 51.1 59.7 n.a. n.a. 80.8 2014 67.4 80.5 72.6 n.a. 60.1 n.a. n.a. 80.7 2015 67.4(c) 84.1 72.4 55.3 59.5 n.a. 80.2 79.2 2016 63.8(c)(d) 81.6 69.1 n.a. 58.8 n.a. 84.6 80.0 2013 7.8 11.7 5.1 17.5 11.3 n.a. n.a. 11.0 2014 8.4 12.4 5.3 n.a. 11.4 n.a. n.a. 10.8 2015 9.0(c) 12.3 5.4 17.8 10.6 n.a. 11.0 11.8 2016 8.5(c)(d) 12.0 5.9 n.a. 11.7 n.a. 11.6 11.3 2013 33.2 17.0 28.4 47.3 32.0 n.a. n.a. 15.0 2014 32.3 17.7 28.6 n.a. 30.8 n.a. n.a. 15.0 2015 31.2(c) 19.4 28.9 54.0 33.3 n.a. 38.8 15.1 2016 35.0(c)(d) 17.2 29.7 n.a. n.a. n.a. 33.7 15.6 2013 24.6 7.8 22.0 24.1 n.a. n.a. 10.6 8.2 2014 24.2 8.0 22.1 30.7 n.a. n.a. 11.9 8.2 2015 23.6(c) 5.1 22.2 26.9 n.a. n.a. 8.8 9.3 2016 27.6(c)(d) 6.4 25.0 n.a. n.a. n.a. 5.3 8.7 2013 29.9 23.4 29.8 23.2 32.3 15.7 40.6 13.9 2014 29.8 23.2 29.1 35.0 33.3 16.8 45.7 13.4 2015 28.8(c) 21.4 30.3 32.0 31.8 12.7 44.0 14.7 2016 32.8(c)(d) 25.5 30.9 33.4 29.7 0.4 40.0 13.8

SRI LANKA AND ASIA169
National Accounts Indicators : Selected East Asian Countries
Table 14.4
IndicatorRef.Year
Indonesia Malaysia PhilippinesRep.ofKorea
Singapore Thailand
Gross Domestic Product (GDP)(a), Mn US $
GDP Per Capita(a), US$
GDP Per Capita at PPP, US$
Growth Rate of Real GDP, %
Sectoral Composition of GDP(a), %
Agriculture
Industry
Services
Consumption, Investment and Savings, % of GDP(a)
PrivateConsumption
GovernmentConsumption
GrossDomesticCapitalFormation
GrossDomesticSavings
GrossNationalSavings
2013 912,524 323,277 271,836 1,305,605 302,511 420,529 2014 890,815 338,062 284,585 1,411,334 308,143 406,522 2015 861,256 296,434 292,774 1,382,764 296,841 399,235 2016 932,259 296,536 304,905 1,411,246 296,976 407,026
2013 3,621 10,882 2,760 25,890 56,029 6,171 2014 3,492 11,184 2,843 27,811 56,336 5,942 2015 3,336 9,649 2,878 27,105 53,630 5,815 2016 3,570 9,508 2,951 27,539 52,962 5,911
2013 10,108 23,867 6,546 32,616 81,287 15,611 2014 10,661 25,178 6,953 33,632 84,594 15,977 2015 11,155 26,200 7,331 34,422 86,128 16,566 2016 11,720 27,267 7,812 35,751 87,855 17,270
2013 5.6 4.7 7.1 2.9 5.0 2.7 2014 5.0 6.0 6.1 3.3 3.6 0.9 2015 4.9 5.0 6.1 2.8 1.9 2.9 2016 5.0 4.2 6.9 2.8 2.0 3.2
2013 13.7 9.2(b) 11.2 2.3 0.0 11.3 2014 13.7 9.0(b) 11.3 2.3 0.0 10.5 2015 14.0 8.6 10.3 2.3 0.0 9.1 2016 14.0 8.8 9.7 2.2 0.0 8.3
2013 43.6 40.3(b) 31.2 38.4 24.8 37.0 2014 42.9 40.4(b) 31.4 38.2 24.9 36.8 2015 41.3 39.6 30.8 38.0 26.4 35.7 2016 40.8 38.9 30.9 38.6 26.1 35.8
2013 42.6 50.5(b) 57.9 59.3 75.1 51.7 2014 43.3 50.6(b) 57.3 59.4 75.0 52.7 2015 44.7 51.8 58.9 59.7 73.6 55.1 2016 45.3 52.4 59.5 59.2 73.8 55.8
2013 56.2 51.8 73.3 50.9 36.7 52.0 2014 56.1 52.4 72.4 50.4 36.8 52.3 2015 55.9 54.1 73.8 47.1 36.7 51.6 2016 56.5 54.9 73.6 46.4 36.5 49.7
2013 9.5 13.7 10.8 15.0 10.1 16.9 2014 9.5 13.3 10.4 15.1 10.0 17.1 2015 9.8 13.1 11.0 15.2 10.4 17.2 2016 9.4 12.6 11.1 15.2 11.3 17.1
2013 34.0 25.9 20.0 29.1 29.0 27.5 2014 34.7 25.0 20.9 29.2 27.6 24.1 2015 34.6 25.1 20.6 28.5 26.3 24.1 2016 34.3 26.1 24.3 29.2 25.3 22.0
2013 33.7 34.5 15.8 34.1 52.8 31.3 2014 33.4 34.3 17.0 34.5 53.2 31.8 2015 32.9 32.7 15.2 35.7 52.7 34.9 2016 32.9 32.5 15.3 36.0 51.2 37.7
2013 30.7 29.4 24.2 35.3 47.4 26.3 2014 31.5 29.4 24.3 35.3 48.4 27.7 2015 32.1 28.2 23.7 36.6 44.9 30.3 2016 32.5 28.2 24.5 36.2 44.4 33.5
(a) Estimatesatcurrentmarketprices.
(b) Estimatesatcurrentproducers’prices.
Sources:KeyIndicatorsforAsiaandthePacific2017,ADB WorldDevelopmentIndicators2018 (WorldBank–updated05/21/2018)

SRI LANKA AND ASIA170
Inflation(a) : Sri Lanka and Selected Countries
Table 14.5
Country 2010 2011 2012 2013 2014 2015 2016 2017
Percent
SAARC Countries
Sri Lanka(b)
Afghanistan Bangladesh Bhutan India Maldives Nepal Pakistan
East Asian Countries (Selected)
Indonesia Malaysia Philippines RepublicofKorea Singapore Thailand
Industrial Countries (Selected)
Japan UnitedKingdom UnitedStates
6.2 6.7 7.6 6.9 3.3 2.2 4.0 6.6
2.2 11.8 6.4 7.4 4.7 -0.7 4.4 5.0 9.4 11.5 6.2 7.5 7.0 6.2 5.7 5.7 5.7 7.3 9.3 11.3 9.9 6.3 3.9 3.4 9.5 9.5 10.0 9.4 5.8 4.9 4.5 3.6 6.2 11.3 10.9 3.8 2.1 1.0 0.5 2.8 9.6 9.6 8.3 9.9 9.0 7.2 9.9 4.5 10.1 13.7 11.0 7.4 8.6 4.5 2.9 4.1
5.1 5.3 4.0 6.4 6.4 6.4 3.5 3.8 1.7 3.2 1.7 2.1 3.1 2.1 2.1 3.8 3.8 4.7 3.2 2.9 4.2 1.4 1.8 3.2 2.9 4.0 2.2 1.3 1.3 0.7 1.0 1.9 2.8 5.2 4.6 2.4 1.0 -0.5 -0.5 0.6 3.3 3.8 3.0 2.2 1.9 -0.9 0.2 0.7
-0.7 -0.3 -0.1 0.3 2.8 0.8 -0.1 0.5 3.3 4.5 2.8 2.6 1.5 0.0 0.7 2.7 1.6 3.1 2.1 1.5 1.6 0.1 1.3 2.1
(a)PercentagechangeofannualaverageConsumerPriceIndex.(b)2010to2014–ColomboConsumerPriceIndex(2006/07=100) 2015onwards–ColomboConsumerPriceIndex(2013=100)
Sources:WorldEconomicOutlookApril2018–IMF DepartmentofCensusandStatistics
Inflation – SAARC Countries : 2013–17
14.0
10.0
6.0
2.0
-2.0
Per c
en
t
2013
Sri Lanka Afghanistan Bangladesh Bhutan India Maldives Nepal Pakistan
2014 2015 2016 2017

SRI LANKA AND ASIA171
External Trade and Finance Indicators : SAARC Countries
Table 14.6
IndicatorRef.Year
Sri Lanka
Afghanis-tan
Bangla-desh
Bhutan India Maldives Nepal Pakistan
2014 11,130 571 30,098 519 299,596 145 925 25,869 (10.9) (8.8) (9.8) (-0.4) (-12.9) (19.6) (9.4)
2015 10,546 571 30,375 543 258,881 144 797 23,048 (–) (1.6) (9.4) (-9.5) (-0.6) (-7.3) (-7.0)
2016 10,310(a) 596 33,255 481 270,782 n.a. 651 20,853 (4.5) (9.8) (-9.1) (7.3) (n.a.) (-17.8) (-9.6)
2014 535 20 192 697 236 322 34 138 2015 502 20 191 717 202 308 28 120 2016 486 20 207 626 208 n.a. 23 107 2014 19,417 7,729 40,869 901 432,399 1,990 7,187 46,093 (-11.4) (5.3) (12.7) (0.8) (15.1) (28.3) (6.5)
2015 18,935 7,723 40,276 945 375,611 1,893 7,240 44,472 (-0.1) (-0.8) (9.8) (-9.0) (-4.9) (8.4) (0.7)
2016 19,183(a) 6,534 42,684 1,008 375,136 n.a. 7,183 44,652 (-15.4) (6.2) (9.4) (2.4) (n.a.) (-0.1) (0.3) 2014 934 275 261 1,209 341 4,423 260 245 2015 902 270 253 1,248 293 4,057 259 232 2016 905 224 265 1,311 289 n.a. 254 229 2014 0.57 0.07 0.74 0.58 0.69 0.07 0.13 0.56 2015 0.56 0.07 0.75 0.57 0.69 0.08 0.11 0.52 2016 0.54 0.09 0.78 0.48 0.72 n.a. 0.09 0.47 2014 -8,287.0 -6,115 -7,481.9 -394.1 -144,047.4 -1,660.0 -6,558.2 -17,877.0 2015 -8,388.0 -6,435 -6,120.2 -427.0 -136,884.2 -1,655.0 -5,697.6 -16,677.0 2016 -8,873.0(a) n.a. -6,229.7 -538.0 n.a. -1,839.5 -7,995.6 -19,910.0 2014 -1,987.7 -3,919.9 755.8 -483.5 -27,314.3 -117.8 496.2 -3,616.0 2015 -1,882.8 -5,056.7 2,579.6 -572.3 -22,456.8 -294.1 2,446.6 -2,122.0 2016 -1,742.4(a) n.a. 1,279.0 -617.6 n.a. -840.0 -168.1 -5,036.0 2014 7,316 6,681 21,785 1,245 303,455 627 6,027 11,807 2015 6,543 6,232 27,023 1,103 344,311 576 7,937 17,830 2016 5,189(a) 6,476 31,776 1,127 341,145 478 8,498 19,650 2015 44,839 2,489 38,640 1,956 479,559 943 4,155 65,482 2015 28.2 2.9 4.1 17.8 10.9 3.5 8.3 12.9 2014 130.56 57.25 77.64 61.03 61.03 15.38 97.55 101.10 2015 135.94 61.14 77.95 64.15 64.15 15.37 102.41 102.77 2016 145.60 67.87 78.47 67.20 67.20 15.37 107.38 104.77
Exports, Mn. US $
Exports Per Capita, US $
Imports, Mn. US $
Imports Per Capita, US $
Export / Import Ratio
Balance of Trade(b), Mn, US $
Current A/c Balance, Mn, US $
Total Reserves Minus Gold, Mn, US $
External Debt, Mn, US $
External Debt Service / Exports Ratio(c), %
Exchange Rate for US $(d)
(a) Revised
(b) Exportslessimports.
(c) Totaldebtserviceincludesprincipalandinterestpaymentson long termdebt, interestpaymentson short termdebt,andIMFrepurchasesandcharges.
(d) Unitsofdomesticcurrency(annualaverage)perUSdollar.
n.a.–Notavailable
Note:Annualchange(%)isgivenwithinparenthesis.
Sources: InternationalFinancialStatistics,2018April,IMF InternationalFinancialStatistics,Yearbook2017,IMF KeyIndicatorsforAsiaandthePacific2017,ADB CentralBankofSriLanka

SRI LANKA AND ASIA172
External Trade and Finance Indicators : Selected East Asian Countries
Table 14.7
IndicatorRef.Year
Indonesia Malaysia PhilippinesRep.ofKorea
Singapore Thailand
2014 175,981 218,691 62,102 572,665 398,536 223,360 (-3.6) (6.3) (9.5) (2.3) (0.1) (5.3)
2015 150,366 181,202 58,827 526,757 348,806 203,189 (-14.6) (1.6) (-5.3) (-8.0) (-6.5) (-0.4)
2016 144,490 175,041 56,313 495,426 322,008 210,866 (-3.9) (1.1) (-4.3) (-5.9) (-5.1) (3.0)
2014 698 7,147 622 11,295 72,461 3,334 2015 589 5,808 579 10,329 63,419 3,022 2016 559 5,529 546 9,676 57,501 3,126 2014 178,179 195,125 65,398 525,515 362,563 206,341 (-4.5) (5.3) (4.8) (1.9) (-1.4) (-2.5)
2015 142,695 159,855 71,067 436,499 300,286 177,529 (-19.9) (0.4) (8.7) (-16.9) (-11.5) (-5.8)
2016 135,653 155,604 80,834 406,193 278,141 175,651 (-4.9) (1.9) (13.7) (-6.9) (-4.7) (-1.8) 2014 706 6,377 655 10,365 65,921 3,080 2015 558 5,124 699 8,559 54,597 2,640 2016 524 4,915 783 7,933 49,668 2,604 2014 0.99 1.12 0.95 1.09 1.10 1.08 2015 1.05 1.13 0.83 1.21 1.16 1.14 2016 1.07 1.12 0.70 1.22 1.16 1.20 2014 6,982.6 34,605.1 -17,330.4 88,885.4 81,712.2 17,263.1 2015 14,048.6 27,943.9 -23,309.2 122,269.2 82,848.0 26,841.1 2016 15,436.5 24,376.6 -34,079.5 120,445.7 82,786.2 n.a. 2014 -27,509.9 14,846.5 10,755.9 84,373.0 60,818.9 15,285.7 2015 -17,518.7 9,067.6 7,265.7 105,939.6 53,756.9 32,149.0 2016 -16,909.1 6,920.9 600.7 98,677.4 56,501.1 n.a. 2014 108,836 114,572 72,057 358,785 256,643 151,253 2015 103,268 93,979 73,964 363,149 247,534 151,266 2016 113,493 93,072 73,433 366,308 246,365 166,157 2015 308,540 190,951 77,725 395,400 – 129,654 2015 32.1 6.1 9.9 27.1 – 6.9 2014 11,865.20 3.27 44.40 1,053.00 1.27 32.48 2015 13,389.40 3.91 45.50 1,131.20 1.37 34.25 2016 13,308.30 4.15 47.50 1,160.40 1.38 35.30
Exports, Mn. US $
Exports Per Capita, US $
Imports, Mn. US $
Imports Per Capita, US $
Export / Import Ratio
Balance of Trade(a), Mn, US $
Current A/c Balance, Mn, US $
Total Reserves Minus Gold, Mn, US $
External Debt, Mn, US $
External Debt Service / Exports Ratio(b), %
Exchange Rate for US $(c)
(a) Exportslessimports.
(b) Totaldebtservice includesprincipaland interestpaymentsonlongtermdebt,interestpaymentsonshorttermdebt,andIMFrepurchasesandcharges.
(c) Unitsofdomesticcurrency(annualaverage)perUSdollar.
Note:Annualchange(%)isgivenwithinparenthesis.
Sources: InternationalFinancialStatistics,2018April,IMF InternationalFinancialStatistics,Yearbook2017,IMF KeyIndicatorsforAsiaandthePacific2017,ADB

SRI LANKA AND ASIA173
Monetary and Fiscal Operations : SAARC Countries
Table 14.8
IndicatorRef.Year
Sri Lanka
Afghanis-tan
Bangla-desh
Bhutan India Maldives Nepal Pakistan
2014 4,410 4,694 17,749 549 278,986 812 4,050 27,498 2015 4,675 4,082 20,308 389 304,409 667 4,920 32,942 2016 5,715 4,647 24,137 504 208,932 583 5,222 40,196
2014 4,671 6,655 18,991 684 345,746 727 3,566 78,971 2015 4,963 5,725 21,442 670 370,768 866 4,762 88,778 2016 5,184 6,333 25,978 768 294,185 875 4,872 103,477
2014 29,575 6,961 95,094 1,184 1,613,071 1,764 16,926 129,794 2015 31,695 6,098 106,766 1,175 1,705,056 1,980 19,566 139,497 2016 36,085 6,811 121,227 1,378 1,772,154 1,976 22,814 158,643
2014 37.3 33.8 55.0 60.9 79.3 47.7 84.6 53.1 2015 39.3 31.7 54.7 57.0 81.6 49.4 91.4 51.6 2016 44.1 35.0 54.8 62.3 78.3 46.8 108.0 56.9 2016 7.9 47.5 12.8 8.9 10.5 8.9 13.3 20.0 2016 6.4 45.5 9.5 46.7 11.9 35.4 7.2 42.0 2016 85.6 7.0 73.8 44.4 84.2 55.8 70.9 14.0 2015 16.8 1.2 13.7 2.6 12.3 19.1 43.7 17.3 2016 8.6 8.7 21.5 17.6 -18.6 1.0 3.0 16.4
2015 17.8 3.1 13.1 3.9 10.7 12.3 24.4 12.2 2016 18.4 9.7 13.8 20.3 6.6 -0.2 17.4 13.6
2016 -1,544 8,720 29,624 1,077 366,472 506 8,877 13,942 2016 44,537 -241 101,814 1,046 1,811,943 2,338 16,766 128,252 2016 -6,908 -1,669 -14,999 -745 -289,434 -867 -4,801 -21,670 2014 1.1 1.4 1.1 1.2 1.2 0.9 0.9 2.9 2015 1.1 1.4 1.1 1.7 1.2 1.3 1.0 2.7 2016 0.9 1.4 1.1 1.5 1.4 1.5 0.9 2.6
2014 6.7 1.5 5.4 2.2 5.8 2.2 4.2 4.7 2015 6.8 1.5 5.3 3.0 5.6 3.0 4.0 4.2 2016 6.3 1.5 5.0 2.7 8.5 3.4 4.4 3.9 2014 17.0 3.1 9.1 2.8 5.9 5.1 5.6 3.1 2015 16.2 3.4 9.1 3.1 5.6 4.6 4.5 3.0 2016 15.8 3.1 8.5 2.9 7.7 4.8 4.3 2.7 2014 2.7 3.0 1.8 1.6 1.3 2.1 1.2 1.9 2015 2.5 3.2 1.8 1.8 1.2 2.0 1.1 1.9 2016 2.3 2.9 1.8 1.6 1.3 2.1 0.9 1.8
2016 14.2(d) 10.3 10.0 17.8 9.8 37.1 20.5 15.3 2016 19.6(d) 25.7 13.7 29.4 13.4 45.0 26.4 20.6 2016 -5.4(d) -0.1 -3.7 -1.0 -3.5 -5.8 -4.5 -4.5
Reserve Money, Mn. US $
Narrow Money, Mn. US $
Broad Money, Mn. US $
% of GDP
Composition of Broad Money (%) Currency DemandDeposits Quasi-Money
% Change of Money(a) NarrowMoney
BroadMoney
Causal Factors in Broad Money, Mn. US $ NetForeignAssets DomesticCredit NetOtherItems Money Multiplier(b) forNarrowMoney
forBroadMoney
Income Velocity of Money(c)
ofNarrowMoney
ofBroadMoney
Fiscal Operation Indicators, % of GDP Revenue TotalExpenditure BudgetSurplus(+)/Deficit(-)
(a)Percentagechangeofamountsindomesticcurrency.(b)RatioofMoneytoReserveMoney.(c)RatioofGDPtoMoney.(d)BasedonrevisedGDPestimatesfor2015and2016madeavailableon20March2018bytheDepartmentofCensusandStatistics
Sources: InternationalFinancialStatistics,Yearbook2017,IMF KeyIndicatorsforAsiaandthePacific2017,ADB CentralBankofSriLanka

SRI LANKA AND ASIA174
Monetary and Fiscal Operations : Selected East Asian Countries
Table 14.9
IndicatorRef.Year
Indonesia Malaysia PhilippinesRep.ofKorea
Singapore Thailand
2014 79,849 35,646 52,082 106,244 41,823 48,893 2015 74,658 32,010 52,301 112,101 43,075 45,755 2016 79,640 31,469 55,366 118,767 44,579 48,939 2014 75,741 98,976 51,977 532,905 121,377 51,010 2015 76,509 84,023 56,553 604,224 113,791 49,268 2016 92,114 84,820 61,626 658,716 119,141 52,029
2014 335,476 433,417 202,957 1,889,597 388,205 509,951 2015 329,743 364,366 209,640 1,916,738 368,965 486,331 2016 372,505 357,476 224,985 1,993,425 387,646 510,449 2014 37.7 128.2 71.3 133.9 126.0 125.4 2015 38.3 122.9 71.6 138.6 124.3 121.8 2016 40.0 120.6 73.8 141.3 130.5 125.4 2015 10.1 5.3 8.2 3.6 6.9 7.3 2015 14.6 18.4 19.2 29.4 23.9 2.9 2015 75.3 78.2 54.2 67.0 69.3 89.8 2015 12.0 4.1 15.0 20.9 0.1 5.8 2016 17.3 5.7 15.1 12.3 7.7 4.8
2015 9.0 3.0 9.2 8.2 1.5 4.4 2016 10.0 2.7 13.3 7.1 8.0 4.2
2016 96,676 115,967 86,509 442,309 217,323 171,122 2016 389,275 392,374 184,700 2,192,030 382,342 507,622 2016 -113,446 -142,539 46,061 -640,915 -212,020 -168,295 2014 0.9 2.8 1.0 5.0 2.9 1.0 2015 1.0 2.6 1.1 5.4 2.6 1.1 2016 1.2 2.7 1.1 5.5 2.7 1.1
2014 4.2 12.2 3.9 17.8 9.3 10.4 2015 4.4 11.4 4.0 17.1 8.6 10.6 2016 4.7 11.4 4.1 16.8 8.7 10.4
2014 11.8 3.4 5.5 2.6 2.5 8.0 2015 11.3 3.5 5.2 2.3 2.6 8.1 2016 10.1 3.5 4.9 2.1 2.5 7.8 2014 2.7 0.8 1.4 0.7 0.8 0.8 2015 2.6 0.8 1.4 0.7 0.8 0.8 2016 2.5 0.8 1.4 0.7 0.8 0.8
2016 12.5 17.3 15.2 22.7 22.5(d) 18.8 2016 15.0 20.4 17.5 20.9 18.1(d) 19.5 2016 -2.5 -3.1 -2.4 1.0 4.4(d) -0.7
Reserve Money, Mn. US $
Narrow Money, Mn. US $
Broad Money, Mn. US $
% of GDP
Composition of Broad Money (%) Currency DemandDeposits Quasi-Money
% Change of Money(a) NarrowMoney
BroadMoney
Causal Factors in Broad Money, Mn. US $ NetForeignAssets DomesticCredit NetOtherItems Money Multiplier(b) forNarrowMoney
forBroadMoney
Income Velocity of Money(c)
ofNarrowMoney
ofBroadMoney
Fiscal Operation Indicators, % of GDP Revenue TotalExpenditure BudgetSurplus(+)/Deficit(-)
(a)Percentagechangeofamountsindomesticcurrency.(b)RatioofMoneytoReserveMoney.(c)RatioofGDPtoMoney.(d)2015data.
Sources:InternationalFinancialStatistics,Yearbook2017,IMF KeyIndicatorsforAsiaandthePacific2017,ADB
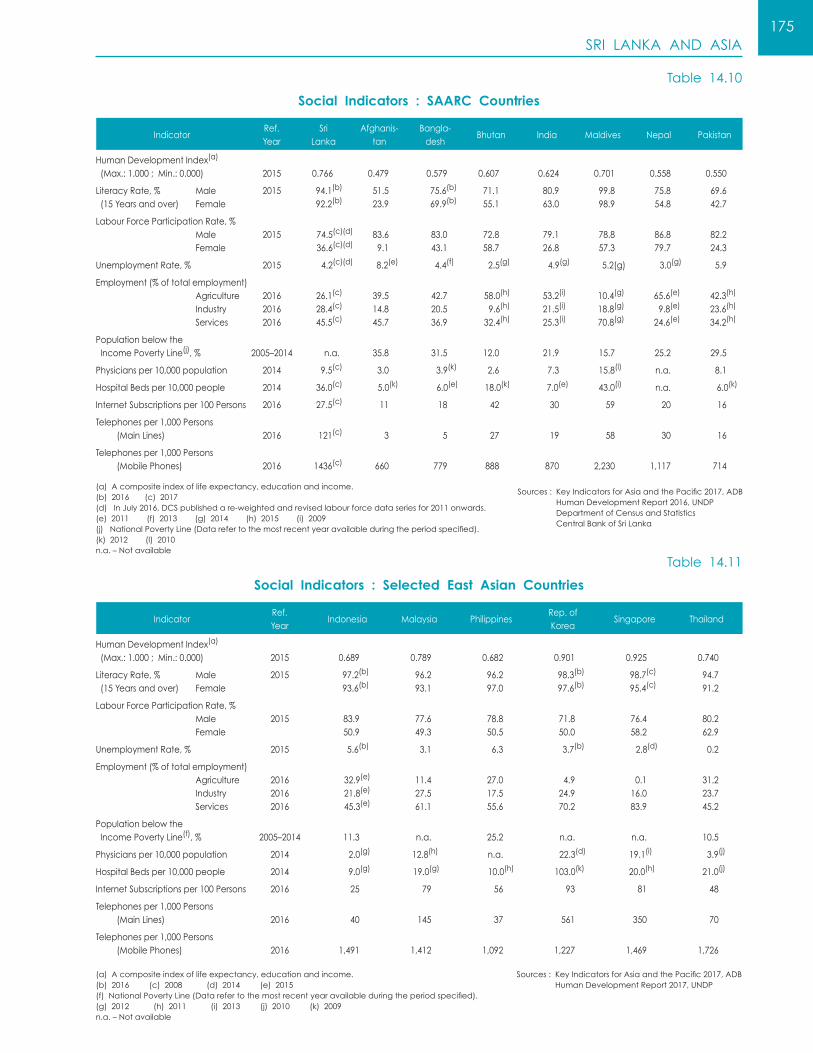
SRI LANKA AND ASIA175
Social Indicators : SAARC Countries
Table 14.10
IndicatorRef.Year
Sri Lanka
Afghanis-tan
Bangla-desh
Bhutan India Maldives Nepal Pakistan
2015 0.766 0.479 0.579 0.607 0.624 0.701 0.558 0.550
2015 94.1(b) 51.5 75.6(b) 71.1 80.9 99.8 75.8 69.6 92.2(b) 23.9 69.9(b) 55.1 63.0 98.9 54.8 42.7
2015 74.5(c)(d) 83.6 83.0 72.8 79.1 78.8 86.8 82.2 36.6(c)(d) 9.1 43.1 58.7 26.8 57.3 79.7 24.3
2015 4.2(c)(d) 8.2(e) 4.4(f) 2.5(g) 4.9(g) 5.2(g) 3.0(g) 5.9
2016 26.1(c) 39.5 42.7 58.0(h) 53.2(i) 10.4(g) 65.6(e) 42.3(h)
2016 28.4(c) 14.8 20.5 9.6(h) 21.5(i) 18.8(g) 9.8(e) 23.6(h)
2016 45.5(c) 45.7 36.9 32.4(h) 25.3(i) 70.8(g) 24.6(e) 34.2(h)
2005–2014 n.a. 35.8 31.5 12.0 21.9 15.7 25.2 29.5
2014 9.5(c) 3.0 3.9(k) 2.6 7.3 15.8(l) n.a. 8.1
2014 36.0(c) 5.0(k) 6.0(e) 18.0(k) 7.0(e) 43.0(i) n.a. 6.0(k)
2016 27.5(c) 11 18 42 30 59 20 16
2016 121(c) 3 5 27 19 58 30 16
2016 1436(c) 660 779 888 870 2,230 1,117 714
Sources: KeyIndicatorsforAsiaandthePacific2017,ADB HumanDevelopmentReport2016,UNDP DepartmentofCensusandStatistics CentralBankofSriLanka
Sources: KeyIndicatorsforAsiaandthePacific2017,ADB HumanDevelopmentReport2017,UNDP
Social Indicators : Selected East Asian Countries
Table 14.11
IndicatorRef.Year
Indonesia Malaysia PhilippinesRep.ofKorea
Singapore Thailand
2015 0.689 0.789 0.682 0.901 0.925 0.740
2015 97.2(b) 96.2 96.2 98.3(b) 98.7(c) 94.7 93.6(b) 93.1 97.0 97.6(b) 95.4(c) 91.2
2015 83.9 77.6 78.8 71.8 76.4 80.2 50.9 49.3 50.5 50.0 58.2 62.9
2015 5.6(b) 3.1 6.3 3.7(b) 2.8(d) 0.2
2016 32.9(e) 11.4 27.0 4.9 0.1 31.2 2016 21.8(e) 27.5 17.5 24.9 16.0 23.7 2016 45.3(e) 61.1 55.6 70.2 83.9 45.2
2005–2014 11.3 n.a. 25.2 n.a. n.a. 10.5
2014 2.0(g) 12.8(h) n.a. 22.3(d) 19.1(i) 3.9(j)
2014 9.0(g) 19.0(g) 10.0(h) 103.0(k) 20.0(h) 21.0(j)
2016 25 79 56 93 81 48
2016 40 145 37 561 350 70
2016 1,491 1,412 1,092 1,227 1,469 1,726
HumanDevelopmentIndex(a)
(Max.:1.000;Min.:0.000)
LiteracyRate,% Male(15Yearsandover) Female
LabourForceParticipationRate,% Male Female
UnemploymentRate,%
Employment(%oftotalemployment) Agriculture Industry Services
PopulationbelowtheIncomePovertyLine(j),%
Physiciansper10,000population
HospitalBedsper10,000people
InternetSubscriptionsper100Persons
Telephonesper1,000Persons(MainLines)
Telephonesper1,000Persons(MobilePhones)
(a)Acompositeindexoflifeexpectancy,educationandincome.(b)2016(c)2017(d)InJuly2016,DCSpublishedare-weightedandrevisedlabourforcedataseriesfor2011onwards.(e)2011(f)2013(g)2014(h)2015(i)2009(j)NationalPovertyLine(Datarefertothemostrecentyearavailableduringtheperiodspecified).(k)2012(l)2010n.a.–Notavailable
HumanDevelopmentIndex(a)
(Max.:1.000;Min.:0.000)
LiteracyRate,% Male(15Yearsandover) Female
LabourForceParticipationRate,% Male Female
UnemploymentRate,%
Employment(%oftotalemployment) Agriculture Industry Services
PopulationbelowtheIncomePovertyLine(f),%
Physiciansper10,000population
HospitalBedsper10,000people
InternetSubscriptionsper100Persons
Telephonesper1,000Persons(MainLines)
Telephonesper1,000Persons(MobilePhones)
(a)Acompositeindexoflifeexpectancy,educationandincome.(b)2016(c)2008(d)2014(e)2015(f)NationalPovertyLine(Datarefertothemostrecentyearavailableduringtheperiodspecified).(g)2012(h)2011(i)2013(j)2010(k)2009n.a.–Notavailable

SRI LANKA AND ASIA176
Doing Business Ranking(a) – 2018 : SAARC Countries
Doing Business Ranking(a) – 2018 : Selected East Asian Countries
Table 14.12
Table 14.13
IndicatorSri
LankaAfghanis-
tanBangla-desh
Bhutan India Maldives Nepal Pakistan
Overall Rank
Startingabusiness
Dealingwithconstructionpermits
Gettingelectricity
Registeringproperty
Gettingcredit
Protectingminorityinvestors
Payingtaxes
Tradingacrossborders
Enforcingcontracts
Resolvinginsolvency
Overall Rank
Startingabusiness
Dealingwithconstructionpermits
Gettingelectricity
Registeringproperty
Gettingcredit
Protectingminorityinvestors
Payingtaxes
Tradingacrossborders
Enforcingcontracts
Resolvinginsolvency
72 24 113 4 2 26
144 111 173 9 6 36
108 11 101 28 16 43
38 8 31 2 12 13
106 42 114 39 19 68
55 20 142 55 29 42
43 4 146 20 4 16
114 73 105 24 7 67
112 61 99 33 42 57
145 44 149 1 2 34
38 46 59 5 27 26
111 183 177 75 100 136 105 147
77 107 131 88 156 68 109 142
76 185 130 82 181 54 157 141
93 163 185 56 29 143 133 167
157 186 185 56 154 174 84 170
122 105 159 77 29 133 90 105
43 189 76 124 4 132 62 20
158 176 152 17 119 118 146 172
86 175 173 26 146 152 76 171
165 181 189 25 164 106 153 156
88 161 152 168 103 139 76 82
Source: DoingBusinessRanking–2018 WorldBank
Source: DoingBusinessRanking–2018 WorldBank
(a)Asperthenewmethodology.
(a)Asperthenewmethodology.
Indicator Indonesia Malaysia PhilippinesRep.ofKorea
Singapore Thailand

WORLD TABLES177
World Tea Production – Land, Area, Exports and Imports 2008 – 2016
Table 15.1
Country 2008 2009 2010 2011 2012 2013 2014 2015 2016
Production (Mn.kgs.)
Sri Lanka
Bangladesh China India Indonesia
Total Asia
Kenya Malawi
Total Africa
TotalCIS
TotalSouthAmerica
TotalOceania
Total World Land Area (’000 ha.)
Sri Lanka
Bangladesh China India Indonesia
Total Asia
Kenya Malawi
Total Africa
TotalCIS
TotalSouthAmerica
TotalOceania
Total World Percentage Share of World Tea Exports
Sri Lanka
China(mainland) India Indonesia Taiwan Turkey Vietnam OtherAsia
Total Asia
Kenya Malawi Ruwanda Tanzaniya Uganda Zimbabwe OtherAfrica
Total Africa
Argentina
OtherSouthAmerica
Total Others
Total Total World Exports (Mt ’000)
318.7 289.8 331.4 328.6 328.4 340.0 338.0 329.0 292.6
58.7 60.0 61.6 65.9 62.2 66.3 64.5 66.3 82.7 1,257.6 1,358.6 1,475.1 1,623.2 1,789.8 1,924.5 2,095.7 2,249.0 2,350.0 980.8 979.0 966.4 1,115.7 1,126.3 1,200.4 1,207.3 1,208.7 1,267.4 153.3 152.6 151.0 142.3 137.8 136.9 135.7 129.3 125.5
3,335.1 3,403.7 3,552.1 3,859.8 4,011.4 4,242.9 4,423.2 4,564.5 4,712.7
345.8 314.2 399.0 377.9 369.6 432.5 445.1 399.2 473.0 41.6 52.6 51.6 47.1 42.5 46.5 45.9 39.5 43.1
519.9 513.5 610.0 583.1 571.9 643.2 668.5 607.9 679.3
7.8 7.8 7.9 8.0 8.2 8.3 8.4 8.5 8.8
93.7 85.1 102.8 103.5 93.7 90.6 92.1 91.3 93.8
8.4 8.4 8.5 8.1 7.9 8.0 8.1 8.3 8.6
3,964.9 4,018.5 4,281.2 4,562.4 4,693.0 4,993.0 5,200.3 5,280.5 5,503.2
188.3 188.2 188.0 187.9 187.0 187.0 187.9 188.0 202.8
54.1 54.7 54.9 54.4 54.5 55.0 56.0 56.8 59.0 1,719.4 1,848.5 1,970.2 2,112.5 2,279.9 2,468.8 2,649.8 2,791.4 2,920.0 560.5 560.6 560.6 579.4 564.0 564.0 566.7 566.7 577.5 139.4 124.1 122.8 122.8 122.2 122.5 121.0 119.4 118.1
3,054.4 3,165.8 3,285.1 3,443.8 3,592.3 3,783.7 3,980.3 4,120.6 4,281.0
157.7 158.4 171.9 187.9 190.7 198.7 203.0 209.4 218.5 18.6 18.6 18.6 18.6 18.6 18.6 18.6 18.6 18.6
271.1 270.6 287.5 307.6 311.8 323.2 330.3 339.3 350.7
38.5 38.3 38.3 38.4 38.4 37.4 36.4 36.4 36.5
48.6 49.0 49.5 49.9 49.6 48.6 48.6 48.3 48.6
4.7 4.7 4.7 4.7 4.8 4.8 4.8 4.8 4.9
3,417.3 3,528.4 3,665.1 3,844.4 3,996.9 4,197.7 4,400.4 4,549.4 4,721.5
18.1 17.3 16.6 17.1 17.2 16.6 17.4 16.8 15.6
18.0 18.8 16.9 18.3 18.2 17.9 16.5 18.1 18.3 12.1 12.1 12.2 12.1 11.6 11.6 11.2 12.5 12.1 5.8 5.7 4.9 4.3 4.0 3.8 3.6 3.4 2.9 0.1 0.1 0.1 0.2 0.2 0.2 0.2 0.3 0.3 0.3 0.2 0.2 0.2 0.2 0.3 0.2 0.3 0.3 6.3 8.0 7.7 7.4 8.1 7.6 7.2 7.4 7.9 1.5 1.3 1.2 1.1 1.2 1.2 1.6 1.3 1.5
62.2 63.5 59.8 60.7 60.7 59.2 57.9 60.1 58.9
23.2 21.2 24.7 23.9 24.3 26.6 27.4 24.7 26.7 2.4 2.9 2.7 2.5 2.4 2.0 2.2 1.7 1.6 1.2 1.3 1.2 1.3 1.3 1.2 1.2 1.3 1.3 1.5 1.3 1.5 1.5 1.6 1.4 1.4 1.9 1.5 2.6 3.0 3.0 2.6 2.9 3.1 3.1 3.1 2.8 0.3 0.5 0.5 0.6 0.6 0.6 0.7 0.8 0.8 1.0 1.2 1.1 1.3 1.2 1.3 1.3 1.4 1.4
32.2 31.4 34.7 33.7 34.3 36.2 37.3 34.9 36.1
4.7 4.3 4.8 4.9 4.3 4.0 4.2 4.3 4.4
0.3 0.2 0.2 0.2 0.2 0.1 0.1 0.1 0.1
0.6 0.6 0.5 0.5 0.5 0.5 0.5 0.6 0.5
100.0 100.0 100.0 100.0 100.0 100.0 100.0 100.0 100.0
1,652.4 1,615.1 1,785.9 1,762.0 1,772.9 1,858.0 1,823.5 1,793.9 1,797.9
Contd.

WORLD TABLES178
World Tea Production – Land, Area, Exports and Imports 2008 – 2016
Table 15.1 (Contd.)
Country 2008 2009 2010 2011 2012 2013 2014 2015 2016
15.1 13.9 15.3 14.9 14.7 15.1 13.0 14.8 12.2 23.8 19.0 24.9 25.9 29.8 28.7 31.3 32.8 32.2 9.9 10.7 10.2 8.6 6.7 7.0 7.8 7.3 7.9 31.0 28.7 29.4 34.0 29.5 32.4 35.6 34.8 35.5 175.0 175.2 174.6 180.3 165.8 156.3 168.0 169.0 160.0 82.3 87.6 91.8 94.2 105.2 102.0 94.0 92.5 86.7 129.8 120.1 119.2 128.1 123.3 115.3 106.3 114.9 107.2 46.7 45.2 45.3 44.5 45.0 45.5 46.6 46.0 45.2
513.6 500.4 510.7 530.5 520.0 502.3 502.7 512.1 486.9 15.2 15.7 15.9 17.5 16.4 16.5 17.3 16.3 17.6 116.7 110.9 126.8 127.5 125.7 130.2 129.2 129.7 131.1 1.8 1.7 1.9 1.9 2.0 2.0 2.2 2.8 2.4
133.7 128.3 144.6 146.9 144.1 148.7 148.6 148.8 151.1 22.4 18.0 21.4 21.9 21.1 20.4 21.2 21.3 20.9 4.7 4.9 5.0 5.4 5.6 6.3 6.4 6.7 7.1
27.1 22.9 26.4 27.3 26.7 26.7 27.6 28.0 28.0 40.3 48.0 57.7 46.6 49.3 71.8 68.0 54.5 55.7 60.0 54.0 63.0 53.0 46.4 57.4 67.0 68.0 62.0 13.7 11.8 15.8 9.0 10.2 9.9 6.7 7.1 6.8 61.6 50.5 55.0 66.5 70.5 80.0 61.1 59.5 65.4 39.5 43.8 41.4 40.8 38.9 33.4 31.3 37.0 39.3 99.1 85.7 120.3 126.2 131.3 126.6 137.9 151.9 173.8 15.6 13.5 14.8 16.4 14.6 15.2 16.0 16.7 16.2 32.2 30.3 27.3 28.0 24.2 20.2 14.0 12.0 13.3 14.3 14.4 16.0 14.8 13.9 17.7 16.7 13.4 12.5 52.4 58.6 61.4 60.7 59.5 72.4 78.6 71.8 71.2
428.7 410.6 472.7 462.0 458.8 504.6 497.3 491.9 516.2 107.0 77.6 93.5 84.0 98.4 100.7 103.3 87.9 88.5 9.0 9.5 12.4 8.9 20.0 10.8 15.0 14.3 15.0 48.2 53.7 56.3 58.5 53.7 57.3 59.0 64.4 67.3 19.3 19.5 19.8 19.5 17.0 17.7 19.9 19.9 19.0 21.4 23.2 29.1 25.0 23.5 28.2 27.0 29.0 26.0 11.7 8.8 10.5 12.8 8.0 6.8 7.0 6.4 5.6 89.6 88.4 100.6 104.6 104.5 123.5 122.9 126.3 122.4
306.2 280.7 322.2 313.3 325.1 345.0 354.1 348.2 343.8 12.7 12.3 12.5 11.8 11.4 11.8 11.6 10.5 10.7 5.6 5.8 5.9 5.8 5.7 5.8 5.9 6.0 5.9
18.3 18.1 18.4 17.6 17.1 17.6 17.5 16.5 16.6 142.7 141.6 160.9 174.2 173.1 189.8 192.2 174.5 175.0
1,570.3 1,502.6 1,656.0 1,671.9 1,664.9 1,734.7 1,739.9 1,720.0 1,717.6
World Tea Imports for Consumption (Mn. kgs.)
Europe France Germany Ireland(Republic) Poland RussianFederation OtherCIS UnitedKingdom OtherEurope
Sub Total North America and West Indies Canada USA OtherCountries
Sub Total Latin America Chile OtherCountries
Sub Total Asia Afghanistan Dubai Jordan Iran Iraq Pakistan SaudiArabia Syria Yeman OtherAsian Countries
Sub Total Africa Egypt Libya Morocco SouthAfrica Sudan Tunisia OtherAfrican Countries
Sub Total Oceania Australia OtherOceanian Countries
Sub Total Major Producing Countries in Asia Total Imports
Source :AnnualStatisticsBulletin–2017,InternationalTeaCommittee
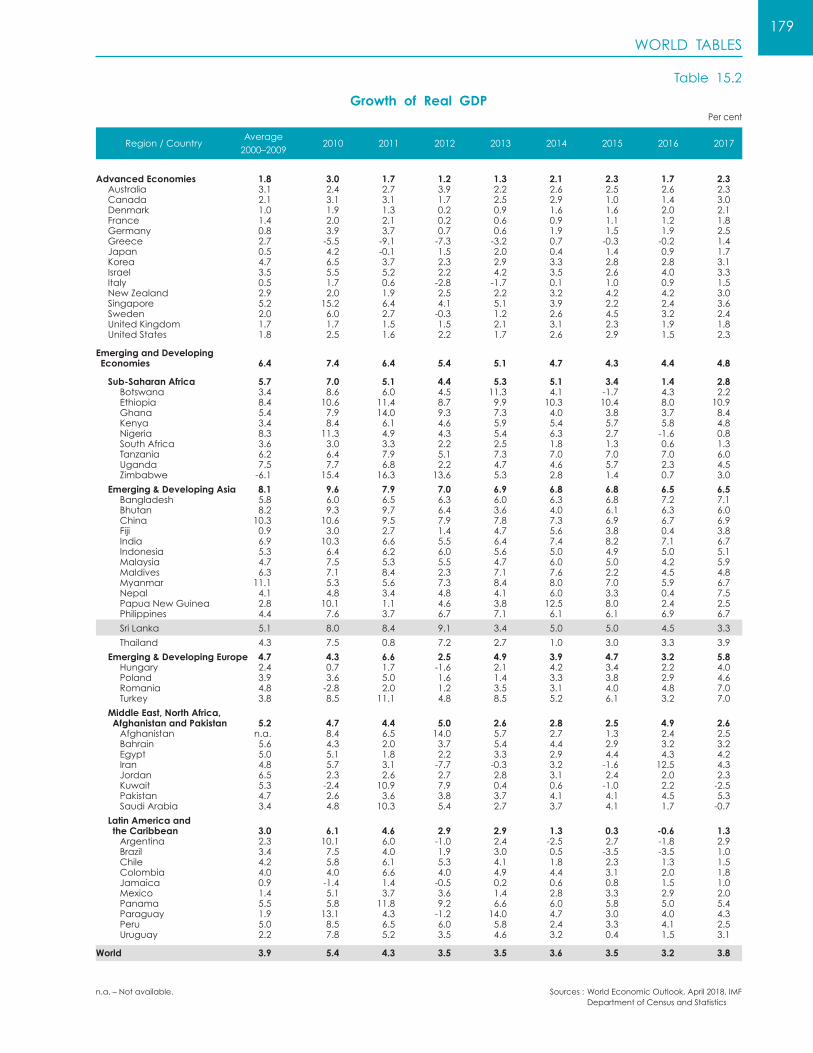
WORLD TABLES179
Growth of Real GDP
Table 15.2
Region/CountryAverage2000–2009
2010 2011 2012 2013 2014 2015 2016 2017
Percent
Advanced Economies Australia Canada Denmark France Germany Greece Japan Korea Israel Italy NewZealand Singapore Sweden UnitedKingdom UnitedStates
Emerging and Developing Economies
Sub-Saharan Africa Botswana Ethiopia Ghana Kenya Nigeria SouthAfrica Tanzania Uganda Zimbabwe
Emerging & Developing Asia Bangladesh Bhutan China Fiji India Indonesia Malaysia Maldives Myanmar Nepal PapuaNewGuinea Philippines
Sri Lanka
Thailand
Emerging & Developing Europe Hungary Poland Romania Turkey
Middle East, North Africa, Afghanistan and Pakistan Afghanistan Bahrain Egypt Iran Jordan Kuwait Pakistan SaudiArabia
Latin America and the Caribbean Argentina Brazil Chile Colombia Jamaica Mexico Panama Paraguay Peru Uruguay
World
1.8 3.0 1.7 1.2 1.3 2.1 2.3 1.7 2.3 3.1 2.4 2.7 3.9 2.2 2.6 2.5 2.6 2.3 2.1 3.1 3.1 1.7 2.5 2.9 1.0 1.4 3.0 1.0 1.9 1.3 0.2 0.9 1.6 1.6 2.0 2.1 1.4 2.0 2.1 0.2 0.6 0.9 1.1 1.2 1.8 0.8 3.9 3.7 0.7 0.6 1.9 1.5 1.9 2.5 2.7 -5.5 -9.1 -7.3 -3.2 0.7 -0.3 -0.2 1.4 0.5 4.2 -0.1 1.5 2.0 0.4 1.4 0.9 1.7 4.7 6.5 3.7 2.3 2.9 3.3 2.8 2.8 3.1 3.5 5.5 5.2 2.2 4.2 3.5 2.6 4.0 3.3 0.5 1.7 0.6 -2.8 -1.7 0.1 1.0 0.9 1.5 2.9 2.0 1.9 2.5 2.2 3.2 4.2 4.2 3.0 5.2 15.2 6.4 4.1 5.1 3.9 2.2 2.4 3.6 2.0 6.0 2.7 -0.3 1.2 2.6 4.5 3.2 2.4 1.7 1.7 1.5 1.5 2.1 3.1 2.3 1.9 1.8 1.8 2.5 1.6 2.2 1.7 2.6 2.9 1.5 2.3
6.4 7.4 6.4 5.4 5.1 4.7 4.3 4.4 4.8
5.7 7.0 5.1 4.4 5.3 5.1 3.4 1.4 2.8 3.4 8.6 6.0 4.5 11.3 4.1 -1.7 4.3 2.2 8.4 10.6 11.4 8.7 9.9 10.3 10.4 8.0 10.9 5.4 7.9 14.0 9.3 7.3 4.0 3.8 3.7 8.4 3.4 8.4 6.1 4.6 5.9 5.4 5.7 5.8 4.8 8.3 11.3 4.9 4.3 5.4 6.3 2.7 -1.6 0.8 3.6 3.0 3.3 2.2 2.5 1.8 1.3 0.6 1.3 6.2 6.4 7.9 5.1 7.3 7.0 7.0 7.0 6.0 7.5 7.7 6.8 2.2 4.7 4.6 5.7 2.3 4.5 -6.1 15.4 16.3 13.6 5.3 2.8 1.4 0.7 3.0
8.1 9.6 7.9 7.0 6.9 6.8 6.8 6.5 6.5 5.8 6.0 6.5 6.3 6.0 6.3 6.8 7.2 7.1 8.2 9.3 9.7 6.4 3.6 4.0 6.1 6.3 6.0 10.3 10.6 9.5 7.9 7.8 7.3 6.9 6.7 6.9 0.9 3.0 2.7 1.4 4.7 5.6 3.8 0.4 3.8 6.9 10.3 6.6 5.5 6.4 7.4 8.2 7.1 6.7 5.3 6.4 6.2 6.0 5.6 5.0 4.9 5.0 5.1 4.7 7.5 5.3 5.5 4.7 6.0 5.0 4.2 5.9 6.3 7.1 8.4 2.3 7.1 7.6 2.2 4.5 4.8 11.1 5.3 5.6 7.3 8.4 8.0 7.0 5.9 6.7 4.1 4.8 3.4 4.8 4.1 6.0 3.3 0.4 7.5 2.8 10.1 1.1 4.6 3.8 12.5 8.0 2.4 2.5 4.4 7.6 3.7 6.7 7.1 6.1 6.1 6.9 6.7
5.1 8.0 8.4 9.1 3.4 5.0 5.0 4.5 3.3
4.3 7.5 0.8 7.2 2.7 1.0 3.0 3.3 3.9
4.7 4.3 6.6 2.5 4.9 3.9 4.7 3.2 5.8 2.4 0.7 1.7 -1.6 2.1 4.2 3.4 2.2 4.0 3.9 3.6 5.0 1.6 1.4 3.3 3.8 2.9 4.6 4.8 -2.8 2.0 1.2 3.5 3.1 4.0 4.8 7.0 3.8 8.5 11.1 4.8 8.5 5.2 6.1 3.2 7.0
5.2 4.7 4.4 5.0 2.6 2.8 2.5 4.9 2.6 n.a. 8.4 6.5 14.0 5.7 2.7 1.3 2.4 2.5 5.6 4.3 2.0 3.7 5.4 4.4 2.9 3.2 3.2 5.0 5.1 1.8 2.2 3.3 2.9 4.4 4.3 4.2 4.8 5.7 3.1 -7.7 -0.3 3.2 -1.6 12.5 4.3 6.5 2.3 2.6 2.7 2.8 3.1 2.4 2.0 2.3 5.3 -2.4 10.9 7.9 0.4 0.6 -1.0 2.2 -2.5 4.7 2.6 3.6 3.8 3.7 4.1 4.1 4.5 5.3 3.4 4.8 10.3 5.4 2.7 3.7 4.1 1.7 -0.7
3.0 6.1 4.6 2.9 2.9 1.3 0.3 -0.6 1.3 2.3 10.1 6.0 -1.0 2.4 -2.5 2.7 -1.8 2.9 3.4 7.5 4.0 1.9 3.0 0.5 -3.5 -3.5 1.0 4.2 5.8 6.1 5.3 4.1 1.8 2.3 1.3 1.5 4.0 4.0 6.6 4.0 4.9 4.4 3.1 2.0 1.8 0.9 -1.4 1.4 -0.5 0.2 0.6 0.8 1.5 1.0 1.4 5.1 3.7 3.6 1.4 2.8 3.3 2.9 2.0 5.5 5.8 11.8 9.2 6.6 6.0 5.8 5.0 5.4 1.9 13.1 4.3 -1.2 14.0 4.7 3.0 4.0 4.3 5.0 8.5 6.5 6.0 5.8 2.4 3.3 4.1 2.5 2.2 7.8 5.2 3.5 4.6 3.2 0.4 1.5 3.1
3.9 5.4 4.3 3.5 3.5 3.6 3.5 3.2 3.8
Sources:WorldEconomicOutlook,April2018,IMF DepartmentofCensusandStatistics
n.a.–Notavailable.
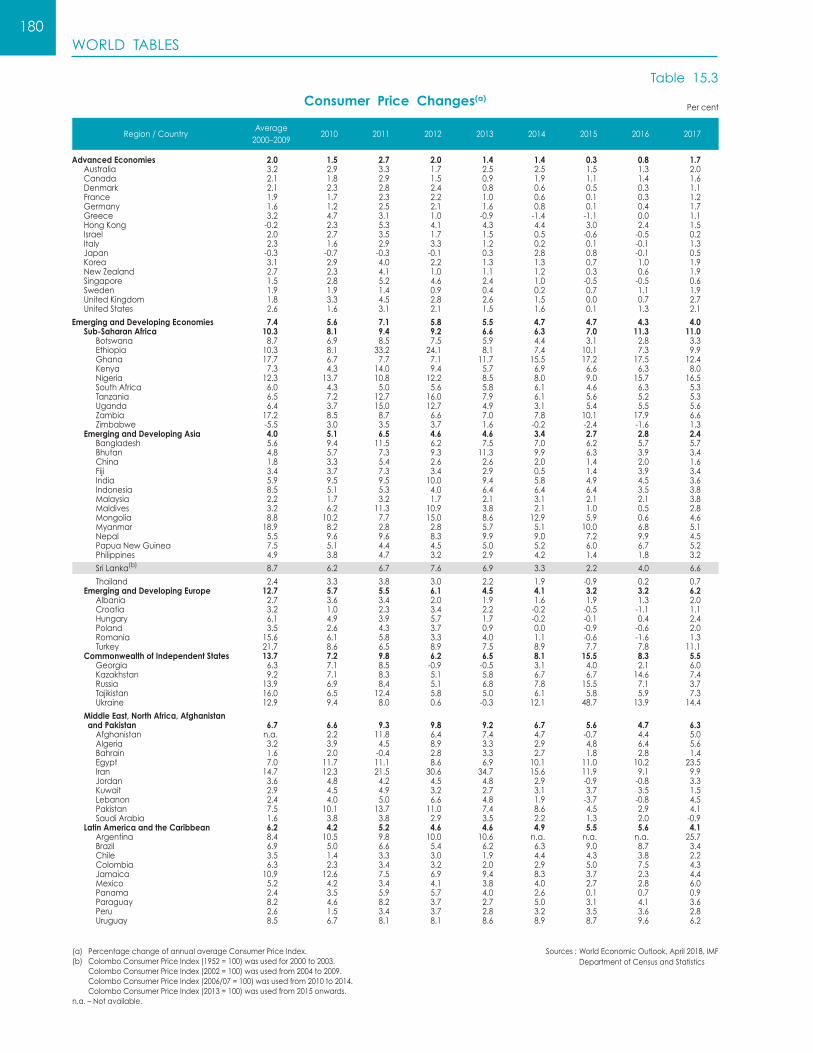
WORLD TABLES180
Consumer Price Changes(a)
Table 15.3
Region/CountryAverage2000–2009
2010 2011 2012 2013 2014 2015 2016 2017
Percent
Advanced Economies Australia Canada Denmark France Germany Greece HongKong Israel Italy Japan Korea NewZealand Singapore Sweden UnitedKingdom UnitedStates
Emerging and Developing Economies Sub-Saharan Africa Botswana Ethiopia Ghana Kenya Nigeria SouthAfrica Tanzania Uganda Zambia Zimbabwe Emerging and Developing Asia Bangladesh Bhutan China Fiji India Indonesia Malaysia Maldives Mongolia Myanmar Nepal PapuaNewGuinea Philippines
Sri Lanka(b)
Thailand Emerging and Developing Europe Albania Croatia Hungary Poland Romania Turkey Commonwealth of Independent States Georgia Kazakhstan Russia Tajikistan Ukraine
Middle East, North Africa, Afghanistan and Pakistan Afghanistan Algeria Bahrain Egypt Iran Jordan Kuwait Lebanon Pakistan SaudiArabia Latin America and the Caribbean Argentina Brazil Chile Colombia Jamaica Mexico Panama Paraguay Peru Uruguay
2.0 1.5 2.7 2.0 1.4 1.4 0.3 0.8 1.7 3.2 2.9 3.3 1.7 2.5 2.5 1.5 1.3 2.0 2.1 1.8 2.9 1.5 0.9 1.9 1.1 1.4 1.6 2.1 2.3 2.8 2.4 0.8 0.6 0.5 0.3 1.1 1.9 1.7 2.3 2.2 1.0 0.6 0.1 0.3 1.2 1.6 1.2 2.5 2.1 1.6 0.8 0.1 0.4 1.7 3.2 4.7 3.1 1.0 -0.9 -1.4 -1.1 0.0 1.1 -0.2 2.3 5.3 4.1 4.3 4.4 3.0 2.4 1.5 2.0 2.7 3.5 1.7 1.5 0.5 -0.6 -0.5 0.2 2.3 1.6 2.9 3.3 1.2 0.2 0.1 -0.1 1.3 -0.3 -0.7 -0.3 -0.1 0.3 2.8 0.8 -0.1 0.5 3.1 2.9 4.0 2.2 1.3 1.3 0.7 1.0 1.9 2.7 2.3 4.1 1.0 1.1 1.2 0.3 0.6 1.9 1.5 2.8 5.2 4.6 2.4 1.0 -0.5 -0.5 0.6 1.9 1.9 1.4 0.9 0.4 0.2 0.7 1.1 1.9 1.8 3.3 4.5 2.8 2.6 1.5 0.0 0.7 2.7 2.6 1.6 3.1 2.1 1.5 1.6 0.1 1.3 2.1
7.4 5.6 7.1 5.8 5.5 4.7 4.7 4.3 4.0 10.3 8.1 9.4 9.2 6.6 6.3 7.0 11.3 11.0 8.7 6.9 8.5 7.5 5.9 4.4 3.1 2.8 3.3 10.3 8.1 33.2 24.1 8.1 7.4 10.1 7.3 9.9 17.7 6.7 7.7 7.1 11.7 15.5 17.2 17.5 12.4 7.3 4.3 14.0 9.4 5.7 6.9 6.6 6.3 8.0 12.3 13.7 10.8 12.2 8.5 8.0 9.0 15.7 16.5 6.0 4.3 5.0 5.6 5.8 6.1 4.6 6.3 5.3 6.5 7.2 12.7 16.0 7.9 6.1 5.6 5.2 5.3 6.4 3.7 15.0 12.7 4.9 3.1 5.4 5.5 5.6 17.2 8.5 8.7 6.6 7.0 7.8 10.1 17.9 6.6 -5.5 3.0 3.5 3.7 1.6 -0.2 -2.4 -1.6 1.3 4.0 5.1 6.5 4.6 4.6 3.4 2.7 2.8 2.4 5.6 9.4 11.5 6.2 7.5 7.0 6.2 5.7 5.7 4.8 5.7 7.3 9.3 11.3 9.9 6.3 3.9 3.4 1.8 3.3 5.4 2.6 2.6 2.0 1.4 2.0 1.6 3.4 3.7 7.3 3.4 2.9 0.5 1.4 3.9 3.4 5.9 9.5 9.5 10.0 9.4 5.8 4.9 4.5 3.6 8.5 5.1 5.3 4.0 6.4 6.4 6.4 3.5 3.8 2.2 1.7 3.2 1.7 2.1 3.1 2.1 2.1 3.8 3.2 6.2 11.3 10.9 3.8 2.1 1.0 0.5 2.8 8.8 10.2 7.7 15.0 8.6 12.9 5.9 0.6 4.6 18.9 8.2 2.8 2.8 5.7 5.1 10.0 6.8 5.1 5.5 9.6 9.6 8.3 9.9 9.0 7.2 9.9 4.5 7.5 5.1 4.4 4.5 5.0 5.2 6.0 6.7 5.2 4.9 3.8 4.7 3.2 2.9 4.2 1.4 1.8 3.2
8.7 6.2 6.7 7.6 6.9 3.3 2.2 4.0 6.6
2.4 3.3 3.8 3.0 2.2 1.9 -0.9 0.2 0.7 12.7 5.7 5.5 6.1 4.5 4.1 3.2 3.2 6.2 2.7 3.6 3.4 2.0 1.9 1.6 1.9 1.3 2.0 3.2 1.0 2.3 3.4 2.2 -0.2 -0.5 -1.1 1.1 6.1 4.9 3.9 5.7 1.7 -0.2 -0.1 0.4 2.4 3.5 2.6 4.3 3.7 0.9 0.0 -0.9 -0.6 2.0 15.6 6.1 5.8 3.3 4.0 1.1 -0.6 -1.6 1.3 21.7 8.6 6.5 8.9 7.5 8.9 7.7 7.8 11.1 13.7 7.2 9.8 6.2 6.5 8.1 15.5 8.3 5.5 6.3 7.1 8.5 -0.9 -0.5 3.1 4.0 2.1 6.0 9.2 7.1 8.3 5.1 5.8 6.7 6.7 14.6 7.4 13.9 6.9 8.4 5.1 6.8 7.8 15.5 7.1 3.7 16.0 6.5 12.4 5.8 5.0 6.1 5.8 5.9 7.3 12.9 9.4 8.0 0.6 -0.3 12.1 48.7 13.9 14.4
6.7 6.6 9.3 9.8 9.2 6.7 5.6 4.7 6.3 n.a. 2.2 11.8 6.4 7.4 4.7 -0.7 4.4 5.0 3.2 3.9 4.5 8.9 3.3 2.9 4.8 6.4 5.6 1.6 2.0 -0.4 2.8 3.3 2.7 1.8 2.8 1.4 7.0 11.7 11.1 8.6 6.9 10.1 11.0 10.2 23.5 14.7 12.3 21.5 30.6 34.7 15.6 11.9 9.1 9.9 3.6 4.8 4.2 4.5 4.8 2.9 -0.9 -0.8 3.3 2.9 4.5 4.9 3.2 2.7 3.1 3.7 3.5 1.5 2.4 4.0 5.0 6.6 4.8 1.9 -3.7 -0.8 4.5 7.5 10.1 13.7 11.0 7.4 8.6 4.5 2.9 4.1 1.6 3.8 3.8 2.9 3.5 2.2 1.3 2.0 -0.9 6.2 4.2 5.2 4.6 4.6 4.9 5.5 5.6 4.1 8.4 10.5 9.8 10.0 10.6 n.a. n.a. n.a. 25.7 6.9 5.0 6.6 5.4 6.2 6.3 9.0 8.7 3.4 3.5 1.4 3.3 3.0 1.9 4.4 4.3 3.8 2.2 6.3 2.3 3.4 3.2 2.0 2.9 5.0 7.5 4.3 10.9 12.6 7.5 6.9 9.4 8.3 3.7 2.3 4.4 5.2 4.2 3.4 4.1 3.8 4.0 2.7 2.8 6.0 2.4 3.5 5.9 5.7 4.0 2.6 0.1 0.7 0.9 8.2 4.6 8.2 3.7 2.7 5.0 3.1 4.1 3.6 2.6 1.5 3.4 3.7 2.8 3.2 3.5 3.6 2.8 8.5 6.7 8.1 8.1 8.6 8.9 8.7 9.6 6.2
(a) PercentagechangeofannualaverageConsumerPriceIndex.(b) ColomboConsumerPriceIndex(1952=100)wasusedfor2000to2003. ColomboConsumerPriceIndex(2002=100)wasusedfrom2004to2009. ColomboConsumerPriceIndex(2006/07=100)wasusedfrom2010to2014. ColomboConsumerPriceIndex(2013=100)wasusedfrom2015onwards.n.a.–Notavailable.
Sources:WorldEconomicOutlook,April2018,IMF DepartmentofCensusandStatistics

WORLD TABLES181
Exports
Table 15.4
Region/Country 2009 2010 2011 2012 2013 2014 2015 2016
USdollarsBillion
Advanced Economies Australia Canada Denmark France Germany Greece HongKong Israel Italy Japan Korea NewZealand Singapore Sweden UnitedKingdom UnitedStates
Emerging and Developing Economies
Sub-Saharan Africa Botswana CentralAfricanRepublic Congo,Republicof Ethiopia Kenya SouthAfrica Tanzania Uganda Zimbabwe
Emerging and Developing Asia Bangladesh Bhutan China Fiji India Indonesia Malaysia Maldives Mongolia Myanmar Nepal PapuaNewGuinea Philippines
Sri Lanka
Thailand Vietnam
Europe Poland Romania Russia Turkey Ukraine
Middle East, North Africa and Pakistan Bahrain Egypt Jordan Kuwait Pakistan SaudiArabia UnitedArabEmirates
Western Hemisphere Argentina Brazil Chile Guyana Jamaica Mexico Panama Paraguay Peru Uruguay
World
7,852.9 9,282.8 10,771.6 10,539.5 10,689.4 10,836.2 9,613.9 9,537.2 154.0 212.3 271.7 256.7 253.0 241.2 187.7 191.2 314.0 387.5 452.1 454.8 458.4 469.9 409.0 389.4 91.8 95.8 111.9 106.1 111.4 110.5 94.2 94.2 476.1 517.0 585.3 558.6 568.6 568.8 494.8 489.4 1,120.7 1,261.6 1,476.9 1,408.4 1,451.6 1,492.5 1,323.7 1,335.9 25.1 28.2 33.9 35.5 36.2 36.0 28.7 28.1 318.5 390.1 428.7 442.8 459.0 473.7 465.1 462.3 47.9 58.4 67.6 63.2 66.6 68.6 63.6 60.2 406.7 446.9 523.3 501.5 517.6 528.1 458.5 455.8 580.7 769.8 822.6 798.6 714.6 690.2 624.8 644.9 363.5 466.4 555.2 547.9 559.6 572.7 526.8 535.7 24.8 32.3 37.5 37.4 41.1 40.7 34.3 33.9 269.8 351.9 409.5 408.4 410.2 405.3 346.6 338.1 131.0 158.1 187.2 172.7 167.6 162.5 140.0 139.5 356.5 417.8 493.8 476.5 474.1 481.9 439.3 407.2 1,056.0 1,278.5 1,480.3 1,545.7 1,579.0 1,623.4 1,504.6 1,453.8
4,615.1 5,922.6 7,411.0 7,698.4 7,931.9 7,983.8 6,766.9 6,421.0
238.4 314.7 403.7 398.5 399.9 390.9 306.2 n.a. 3.5 4.7 5.9 n.a. n.a. n.a. n.a. n.a. 0.1 0.1 0.1 0.1 0.1 n.a. n.a. n.a. 6.1 8.2 11.5 11.0 9.8 8.6 4.6 n.a. 1.3 1.8 2.6 3.1 3.0 4.5 3.8 n.a. 4.5 5.1 5.8 6.1 5.9 6.0 5.9 5.7 62.6 81.8 96.9 87.4 83.5 91.2 81.7 76.5 2.4 3.5 4.4 5.1 5.1 5.0 4.9 n.a. 3.0 3.1 2.4 2.9 2.8 2.7 2.7 n.a. 1.6 3.2 4.4 3.8 3.7 3.6 3.6 2.8
1,943.9 2,562.4 3,109.2 3,297.6 3,492.3 3,671.0 3,491.0 3,334.6 12.4 14.2 19.8 27.7 29.1 24.3 31.7 34.8 0.5 0.6 0.7 0.5 0.5 0.6 0.5 0.5 1,201.8 1,578.3 1,899.2 2,048.9 2,210.2 2,343.2 2,284.5 2,134.5 0.7 0.8 1.1 1.2 1.1 1.2 1.0 0.9 164.9 226.4 303.0 296.8 314.7 322.5 267.8 264.4 119.6 158.1 200.6 188.5 182.7 176.3 150.4 144.3 157.2 198.6 228.1 227.5 228.3 233.9 199.2 189.4 0.1 0.1 0.1 0.2 0.2 0.1 0.1 0.1 1.9 2.9 4.8 4.4 4.3 5.8 4.7 4.9 6.7 8.7 9.2 8.9 11.2 11.3 11.4 n.a. 0.9 0.8 0.9 0.9 0.8 0.9 0.7 n.a. 4.4 5.7 6.9 6.3 6.0 8.8 8.5 n.a. 38.4 51.5 48.3 52.1 56.6 62.1 58.6 56.3
7.1 8.6 10.6 9.8 10.4 11.1 10.5 10.3
151.9 193.4 220.2 227.8 224.9 225.2 211.0 213.9 57.1 71.7 94.5 115.5 132.5 149.6 162.1 176.4
938.5 1,147.5 1,461.4 1,475.1 1,488.2 1,485.0 1,161.8 1,094.6 136.6 159.8 188.7 181.8 202.6 218.9 199.4 203.7 40.6 49.4 62.7 57.9 65.9 69.9 60.6 63.6 301.2 392.7 515.4 527.4 521.8 497.8 341.5 282.2 102.1 113.9 134.9 152.5 151.8 157.6 143.8 142.8 39.7 51.4 68.4 68.8 63.3 53.9 38.1 36.4
830.3 1,049.9 1382.4 1,456.9 1,473.5 1,390.0 905.4 n.a. 11.9 15.4 19.7 20.5 17.5 20.5 11.2 n.a. 23.1 26.4 30.5 29.4 28.5 24.7 19.1 n.a. 6.5 7.0 8.0 7.9 7.9 8.4 7.8 7.5 54.0 62.7 102.7 114.5 114.1 100.8 54.1 46.2 17.5 21.4 25.4 24.6 25.1 24.7 22.1 20.6 192.3 251.1 364.7 388.4 375.9 342.3 203.5 182.3 185.0 220.0 285.0 300.0 365.0 359.0 265.0 n.a.
678.3 860.9 1,072.8 1,085.3 1,088.9 1,055.3 896.7 875.9 56.1 64.7 84.3 75.2 83.0 71.9 59.7 57.7 153.0 201.9 256.0 242.6 242.0 225.1 191.1 185.3 52.0 69.0 80.0 79.7 77.9 74.5 64.1 59.9 0.8 0.9 1.1 1.4 1.4 1.2 1.1 n.a. 1.3 1.3 1.6 1.7 1.6 1.4 1.3 n.a. 229.7 298.1 349.6 370.9 380.1 397.7 380.8 373.9 0.9 0.8 n.a. n.a. n.a. n.a. n.a. n.a. 5.1 6.5 7.8 7.3 9.5 9.6 8.4 8.5 27.1 35.8 46.4 47.4 42.9 39.5 34.4 37.0 5.4 6.7 8.0 8.6 8.8 9.5 7.7 7.2
12,430.3 15,154.5 18,116.0 18,166.6 18,545.5 18,744.7 16,323.7 15,931.0
n.a.–Notavailable. Sources: InternationalFinancialStatistics,Yearbook2017,IMF CentralBankofSriLanka

WORLD TABLES182
Imports
Table 15.5
Region/Country 2009 2010 2011 2012 2013 2014 2015 2016
USdollarsBillion
8,321.5 9,864.8 11,543.4 11,338.6 11,361.5 11,527.6 10,109.6 9,994.1 165.5 201.6 243.7 260.9 242.1 236.9 208.7 196.1 330.9 403.9 464.8 476.3 475.8 480.0 436.3 416.6 80.4 83.2 96.4 92.3 98.4 99.1 84.5 85.0 560.5 608.7 712.9 667.3 673.5 670.2 564.8 561.7 926.2 1,056.2 1256.2 1,164.6 1,192.8 1,209.3 1,052.9 1,056.5 74.1 69.2 68.1 63.7 62.4 64.2 48.3 48.2 347.3 433.1 483.6 504.4 523.6 544.1 522.0 516.4 550.5 692.4 854.1 885.6 832.4 811.9 648.3 607.0 323.1 425.2 524.4 519.6 515.6 525.5 436.5 443.7 49.3 61.2 75.8 75.4 74.9 75.5 65.0 68.9 414.7 487.0 558.8 489.1 477.3 470.5 407.9 401.7 25.2 31.8 37.3 37.8 40.4 42.5 36.6 36.6 245.8 310.8 365.8 379.7 373.0 366.2 296.7 291.9 120.3 148.5 174.7 164.1 159.7 159.5 137.7 139.8 486.0 568.5 646.0 651.8 662.7 683.7 622.3 588.4 1,605.3 1,969.2 2,265.9 2,336.5 2,329.1 2,412.5 2,248.2 2,250.2
4,301.1 5,471.8 6,765.9 7,036.4 7,309.0 7,319.9 6,358.3 6,069.7
211.9 258.7 331.1 319.8 324.0 333.6 291.0 263.7 4.7 5.7 7.3 9.1 8.4 8.1 7.2 n.a. 0.3 0.2 0.3 0.3 0.3 n.a. n.a. n.a. 3.0 3.0 5.2 5.2 5.5 6.2 7.7 n.a. 6.8 7.6 7.9 10.8 12.0 19.0 19.1 n.a. 10.2 12.1 14.8 16.3 16.4 18.4 16.1 14.1 33.8 44.2 64.4 35.7 44.6 46.5 34.9 35.2 74.1 94.2 121.5 124.3 106.9 104.8 90.4 79.0 6.3 7.7 10.7 11.3 12.3 12.0 10.3 n.a. 4.3 4.7 4.6 5.2 4.9 5.1 4.8 n.a. 3.2 5.2 7.6 6.7 6.8 6.3 6.1 5.2
1,818.7 2,470.2 3,098.3 3,272.4 3,396.6 3,416.6 2,992.9 2,871.6 20.6 26.1 34.0 38.4 36.2 37.7 48.1 52.6 0.5 0.9 1.0 1.0 0.9 0.9 1.1 1.0 1004.2 1,396.2 1,742.9 1,818.2 1,949.3 1,963.1 1,680.8 1,589.5 1.6 1.8 2.2 2.3 2.8 2.7 2.3 2.3 257.2 350.1 464.4 489.7 465.5 462.9 393.8 362.0 93.8 135.3 176.9 191.0 186.4 178.2 142.7 135.5 123.8 164.6 187.5 196.4 205.9 208.9 176.0 168.4 1.0 1.1 1.5 1.6 1.7 2.0 1.9 2.1 2.1 3.3 6.5 6.7 6.4 5.2 3.8 3.4 4.3 4.8 9.0 9.2 12.0 16.2 16.8 n.a. 3.7 5.1 5.4 5.4 6.0 7.3 6.4 n.a. 3.2 4.0 4.9 5.5 4.5 n.a. n.a. n.a. 45.9 58.5 64.1 65.8 65.6 68.7 74.6 85.9
10.2 13.5 20.3 19.2 18.0 19.4 18.9 19.2
134.7 185.1 229.1 250.6 249.7 228.0 201.9 195.7 69.9 83.8 104.0 115.1 131.3 148.8 162.8 174.2
934.0 1,127.6 1,414.3 1,410.7 1,454.7 1,407.1 1,108.2 1,110.0 78.0 87.6 101.0 94.3 99.1 103.9 90.7 92.0 149.6 178.1 208.3 195.4 204.3 222.2 195.2 198.4 54.3 61.9 76.3 70.3 73.5 77.9 69.9 74.6 205.4 270.2 350.4 369.3 375.4 338.8 212.2 210.7 140.9 185.5 240.8 236.5 251.7 242.2 207.2 198.5 45.4 60.7 82.6 84.7 77.0 54.4 37.5 39.2
651.9 733.5 841.8 916.0 967.4 992.9 908.1 n.a. 7.3 9.8 12.7 14.9 13.0 13.9 9.7 n.a. 44.9 52.9 58.9 65.8 59.7 61.0 65.0 n.a. 14.5 15.1 18.5 20.7 21.7 23.0 20.0 19.5 19.9 22.7 25.1 27.3 29.3 31.0 31.0 30.8 17.9 19.8 23.6 29.4 34.3 29.4 29.0 n.a. 31.6 37.8 44.0 44.1 44.6 47.4 43.8 46.6 95.5 106.9 131.6 155.6 168.2 173.8 174.7 135.9 150.0 165.0 205.0 220.0 245.0 262.0 230.0 n.a.
688.2 880.8 1,081.1 1,111.9 1,159.4 1,158.2 1,039.6 962.7 39.1 48.0 74.3 68.5 74.0 65.3 59.8 55.6 133.7 191.5 236.9 228.4 250.6 239.2 178.8 143.6 41.4 57.9 73.5 79.1 80.4 72.4 62.8 58.9 32.9 40.7 54.7 58.6 59.4 64.1 54.1 44.9 1.2 1.4 1.8 2.0 1.8 1.8 1.6 n.a. 4.9 5.2 6.5 6.5 6.2 5.8 5.0 n.a. 246.1 316.6 368.4 389.3 400.3 420.0 415.0 406.4 6.9 10.0 12.3 11.5 12.1 12.2 10.2 9.8 20.9 30.1 37.6 41.1 41.5 42.7 n.a. n.a. 6.2 8.6 10.6 10.6 11.0 10.9 9.1 7.9
12,579.1 15,277.5 18,232.7 18,291.9 18,581.2 18,759.4 16,392.7 16,014.6
Sources: InternationalFinancialStatistics,Yearbook2017,IMF CentralBankofSriLanka
n.a.–Notavailable.
Advanced Economies Australia Canada Denmark France Germany Greece HongKong Japan Korea Israel Italy NewZealand Singapore Sweden UnitedKingdom UnitedStates
Emerging and Developing Economies
Sub-Saharan Africa Botswana CentralAfricanRepublic Congo,Republicof Ethiopia Kenya Nigeria SouthAfrica Tanzania Uganda Zimbabwe
Emerging and Developing Asia Bangladesh Bhutan China Fiji India Indonesia Malaysia Maldives Mongolia Myanmar Nepal PapuaNewGuinea Philippines
Sri Lanka
Thailand Vietnam
Europe Hungary Poland Romania Russia Turkey Ukraine
Middle East, North Africa and Pakistan Bahrain Egypt Jordan Kuwait Oman Pakistan SaudiArabia UnitedArabEmirates
Western Hemisphere Argentina Brazil Chile Colombia Guyana Jamaica Mexico Paraguay Peru Uruguay
World
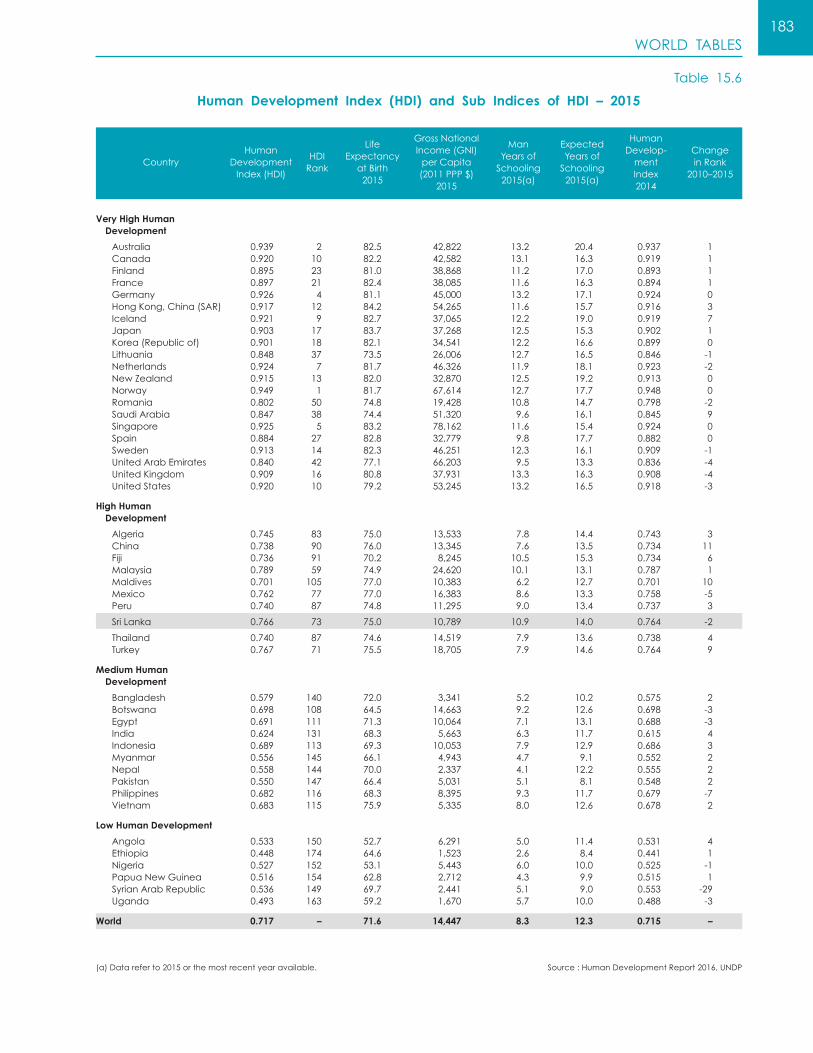
WORLD TABLES183
Human Development Index (HDI) and Sub Indices of HDI – 2015
Table 15.6
Very High Human Development
Australia Canada Finland France Germany HongKong,China(SAR) Iceland Japan Korea(Republicof) Lithuania Netherlands NewZealand Norway Romania SaudiArabia Singapore Spain Sweden UnitedArabEmirates UnitedKingdom UnitedStates
High Human Development
Algeria China Fiji Malaysia Maldives Mexico Peru
Sri Lanka
Thailand Turkey
Medium Human Development
Bangladesh Botswana Egypt India Indonesia Myanmar Nepal Pakistan Philippines Vietnam
Low Human Development
Angola Ethiopia Nigeria PapuaNewGuinea SyrianArabRepublic Uganda
World
CountryHuman
DevelopmentIndex(HDI)
HDIRank
LifeExpectancy
atBirth2015
GrossNationalIncome(GNI)perCapita(2011PPP$)
2015
ManYearsofSchooling2015(a)
ExpectedYearsofSchooling2015(a)
HumanDevelop-mentIndex2014
ChangeinRank
2010–2015
0.939 2 82.5 42,822 13.2 20.4 0.937 1 0.920 10 82.2 42,582 13.1 16.3 0.919 1 0.895 23 81.0 38,868 11.2 17.0 0.893 1 0.897 21 82.4 38,085 11.6 16.3 0.894 1 0.926 4 81.1 45,000 13.2 17.1 0.924 0 0.917 12 84.2 54,265 11.6 15.7 0.916 3 0.921 9 82.7 37,065 12.2 19.0 0.919 7 0.903 17 83.7 37,268 12.5 15.3 0.902 1 0.901 18 82.1 34,541 12.2 16.6 0.899 0 0.848 37 73.5 26,006 12.7 16.5 0.846 -1 0.924 7 81.7 46,326 11.9 18.1 0.923 -2 0.915 13 82.0 32,870 12.5 19.2 0.913 0 0.949 1 81.7 67,614 12.7 17.7 0.948 0 0.802 50 74.8 19,428 10.8 14.7 0.798 -2 0.847 38 74.4 51,320 9.6 16.1 0.845 9 0.925 5 83.2 78,162 11.6 15.4 0.924 0 0.884 27 82.8 32,779 9.8 17.7 0.882 0 0.913 14 82.3 46,251 12.3 16.1 0.909 -1 0.840 42 77.1 66,203 9.5 13.3 0.836 -4 0.909 16 80.8 37,931 13.3 16.3 0.908 -4 0.920 10 79.2 53,245 13.2 16.5 0.918 -3
0.745 83 75.0 13,533 7.8 14.4 0.743 3 0.738 90 76.0 13,345 7.6 13.5 0.734 11 0.736 91 70.2 8,245 10.5 15.3 0.734 6 0.789 59 74.9 24,620 10.1 13.1 0.787 1 0.701 105 77.0 10,383 6.2 12.7 0.701 10 0.762 77 77.0 16,383 8.6 13.3 0.758 -5 0.740 87 74.8 11,295 9.0 13.4 0.737 3
0.766 73 75.0 10,789 10.9 14.0 0.764 -2
0.740 87 74.6 14,519 7.9 13.6 0.738 4 0.767 71 75.5 18,705 7.9 14.6 0.764 9
0.579 140 72.0 3,341 5.2 10.2 0.575 2 0.698 108 64.5 14,663 9.2 12.6 0.698 -3 0.691 111 71.3 10,064 7.1 13.1 0.688 -3 0.624 131 68.3 5,663 6.3 11.7 0.615 4 0.689 113 69.3 10,053 7.9 12.9 0.686 3 0.556 145 66.1 4,943 4.7 9.1 0.552 2 0.558 144 70.0 2,337 4.1 12.2 0.555 2 0.550 147 66.4 5,031 5.1 8.1 0.548 2 0.682 116 68.3 8,395 9.3 11.7 0.679 -7 0.683 115 75.9 5,335 8.0 12.6 0.678 2
0.533 150 52.7 6,291 5.0 11.4 0.531 4 0.448 174 64.6 1,523 2.6 8.4 0.441 1 0.527 152 53.1 5,443 6.0 10.0 0.525 -1 0.516 154 62.8 2,712 4.3 9.9 0.515 1 0.536 149 69.7 2,441 5.1 9.0 0.553 -29 0.493 163 59.2 1,670 5.7 10.0 0.488 -3
0.717 – 71.6 14,447 8.3 12.3 0.715 –
(a)Datareferto2015orthemostrecentyearavailable. Source:HumanDevelopmentReport2016,UNDP

WORLD TABLES184
Human Development Index 1990 – 2015
Table 15.7
Country 1990 2000 2010 2012 2013 2014 2015HDIRank
2015
Very High Human Development
Australia Canada Finland France Germany HongKong,China(SAR) Iceland Italy Japan Korea(Republicof) Lithuania Netherlands NewZealand Norway Romania RussianFederation Singapore Spain Sweden Switzerland UnitedArabEmirates UnitedKingdom UnitedStates
High Human Development
Algeria China Malaysia Mexico Maldives Peru
Sri Lanka
Thailand Turkey Venezuela(BolivarianRep.of)
Medium Human Development
Bangladesh Botswana Cambodia Egypt India Indonesia Myanmar Nepal Philippines SouthAfrica Vietnam
Low Human Development
Angola Ethiopia Nigeria PapuaNewGuinea Uganda
World
0.791 0.836 0.876 0.884 0.887 0.890 0.892
0.866 0.899 0.927 0.933 0.936 0.937 0.939 2 0.849 0.867 0.903 0.909 0.912 0.919 0.920 10 0.783 0.856 0.878 0.887 0.890 0.893 0.895 23 0.779 0.849 0.882 0.887 0.890 0.894 0.897 21 0.801 0.860 0.912 0.919 0.920 0.924 0.926 4 0.781 0.825 0.898 0.907 0.913 0.916 0.917 12 0.797 0.854 0.894 0.907 0.915 0.919 0.921 9 0.768 0.828 0.872 0.876 0.877 0.881 0.887 26 0.814 0.856 0.884 0.894 0.899 0.902 0.903 17 0.731 0.820 0.884 0.891 0.896 0.899 0.901 18 0.731 0.757 0.826 0.834 0.841 0.846 0.848 37 0.830 0.878 0.911 0.922 0.923 0.923 0.924 7 0.818 0.868 0.901 0.908 0.910 0.913 0.915 13 0.849 0.917 0.939 0.942 0.945 0.948 0.949 1 0.700 0.708 0.798 0.794 0.797 0.798 0.802 50 0.733 0.720 0.785 0.799 0.803 0.805 0.804 49 0.718 0.820 0.911 0.920 0.922 0.924 0.925 5 0.755 0.825 0.867 0.874 0.877 0.882 0.884 27 0.815 0.877 0.901 0.904 0.906 0.909 0.913 14 0.831 0.888 0.932 0.934 0.936 0.938 0.939 2 0.726 0.798 0.824 0.829 0.832 0.836 0.840 42 0.775 0.866 0.902 0.899 0.904 0.908 0.909 16 0.860 0.884 0.910 0.915 0.916 0.916 0.918 10
0.574 0.637 0.716 0.728 0.736 0.744 0.746
0.577 0.644 0.724 0.737 0.741 0.743 0.745 83 0.499 0.592 0.700 0.713 0.723 0.734 0.738 90 0.643 0.725 0.774 0.779 0.783 0.787 0.789 59 0.648 0.700 0.745 0.753 0.754 0.758 0.762 77 – 0.587 0.663 0.683 0.693 0.701 0.701 105 0.613 0.677 0.721 0.731 0.735 0.737 0.740 87
0.626 0.686 0.746 0.757 0.760 0.764 0.766 73
0.574 0.649 0.720 0.733 0.737 0.738 0.740 87 0.576 0.653 0.737 0.754 0.759 0.764 0.767 71 0.634 0.672 0.756 0.770 0.771 0.769 0.767 71
0.465 0.525 0.598 0.613 0.620 0.626 0.631
0.386 0.468 0.545 0.565 0.570 0.575 0.579 139 0.585 0.560 0.678 0.693 0.697 0.698 0.698 108 0.357 0.412 0.533 0.546 0.553 0.558 0.563 143 0.547 0.612 0.671 0.681 0.686 0.688 0.691 111 0.428 0.494 0.580 0.599 0.607 0.615 0.624 131 0.528 0.604 0.662 0.677 0.682 0.686 0.689 113 0.353 0.427 0.526 0.540 0.547 0.552 0.556 145 0.378 0.446 0.529 0.545 0.551 0.555 0.558 144 0.586 0.622 0.669 0.671 0.676 0.679 0.682 116 0.621 0.629 0.638 0.652 0.660 0.665 0.666 119 0.477 0.576 0.655 0.668 0.675 0.678 0.683 115
0.356 0.388 0.475 0.486 0.490 0.494 0.497
– 0.391 0.495 0.523 0.527 0.531 0.533 150 – 0.283 0.411 0.427 0.435 0.441 0.448 174 – – 0.500 0.514 0.521 0.525 0.527 152 0.360 0.422 0.494 0.506 0.511 0.515 0.516 154 0.309 0.396 0.477 0.478 0.483 0.488 0.493 165
0.597 0.641 0.697 0.706 0.710 0.715 0.717
Source:HumanDevelopmentReport2016,UNDP

185NOTES

186NOTES

2018
ECO
NO
MIC
AN
D SO
CIA
L STATISTIC
S OF SR
I LAN
KA
2018 VO
L. XL
Rs.
300
ISBN 978-955-575-368-5