economic analyses of the port of melbourne · total economic value of the port of melbourne...
TRANSCRIPT
Economic Analyses of the Port of Melbourne A report by PricewaterhouseCoopers for the Department of Treasury and Finance and the
Department of Infrastructure


i
Foreword The Departments of Treasury and Finance and Infrastructure commissioned PricewaterhouseCoopers to undertake a study to investigate and assess the economic contribution to the Victorian and Australian economies of the Port of Melbourne, and industries directly related to the Port. The study presents the findings of PricewaterhouseCoopers’ analysis and details the effects of a number of scenarios, particularly the economic benefits accruing from the proposed Port Phillip Bay Channel Deepening Project. The study conforms to the methodological framework adopted by the Commonwealth Bureau of Transport and Regional Economics to value the activities of Australian maritime ports. Part 1 of the study publishes the “base case” analysis and modelling, undertaken using conservative data and economic assumptions. The study draws upon economic modelling undertaken by Monash University’s Centre of Policy Studies. In particular, the modelling reports the differences in the long term economic impacts of either proceeding or not proceeding with key port infrastructure, specifically the Channel Deepening Project. Part 2 is a supplementary study that reports the outcome of sensitivity analysis which considers a broader range of data and economic assumptions, and captures the benefits accruing from port infrastructure developments in addition to the Channel Deepening Project. The study also reports on the aggregate findings of a series of case studies of eleven key business customers of the Port of Melbourne. The study describes in general terms the relationship between the businesses and the Port, and identifies the separate contribution of these businesses to the Victorian and Australian economies. The findings of the study, and the independently prepared modelling, have been released to the Port of Melbourne Corporation for inclusion into the Corporation’s modelling of the benefits and costs of the Channel Deepening Project in the project’s Supplementary Environmental Effects Statement. Overall, the study reports the economic benefits that arise from proposed public and private infrastructure projects that together seek to improve the operational efficiency of the Port of Melbourne in the medium to long term. March 2007


ii
Contents
Part 1 Executive Summary 3 Contents 11 1 Introduction 15 2 Background 19 3 Trade and Shipping Projections 33 4 Current economic impact of the port: input-output analysis 41 5 Economic impact of infrastructure projects 51 6 Other economic studies of ports 59 7 Socio-economic analysis 67 8 Conclusions 81 Appendix A CoPS Modelling 87 Appendix B Glossary 105 Appendix C Stakeholders consulted 107 Appendix D Geographic distribution of indicative economic benefits of
the Port of Melbourne 109 Appendix E Port Phillip Bay shipping channels 117 Appendix F Port of Melbourne: port precinct 119 Appendix G Minister’s Statement on SEES 121
Part 2 Contents 133 1 Introduction 135 2 Sensitivity Analysis 137 3 Importance of the Port of Melbourne to business 143 Appendix A Terms of Reference 149 Appendix B Shipping scenarios (from the base case Port of Melbourne
economic impact report) 153 Appendix C Value of the Port of Melbourne 157 Appendix D References for case studies 159


Liability limited by a scheme approved under Professional Standards Legislation
The Economic Impact of the Port of Melbourne PART 1 A report for the Department of Treasury and Finance

THIS PAGE HAS BEEN LEFT BLANK INTENTIONALLY

Port of Melbourne Economic Contribution Study 3 Executive Summary
Executive Summary
This Study has been undertaken to assess the economic contribution of the Port of Melbourne to the Victorian and Australian economies. In addition, the Study has considered the economic impacts of the port on different regions of Victoria and the likely economic effects of the Channel Deepening Project. It is important to note upfront that PwC has deliberately taken a very conservative approach to valuing all of these factors. We have taken quite a restricted view of the assets, projects and expenditures that will contribute to economic outcomes. While this approach is likely to understate outcomes, we believe that it is important to err on the side of caution. The modelling by PwC and Monash University has found substantial economic benefits arising from the Port of Melbourne and the proposed Channel Deepening Project The Port of Melbourne is the most important port in Victoria and one of the largest in Australia. Different figures for the value of trade through the Port exist: According to the ABS it handled around $53 billion of trade in 2004-05 ($35 billion of imports and around $18 billion of exports)1; while the Port of Melbourne Corporation (PoMC) provides a higher figure of $75 billion of trade2. It is the nation’s largest container port, accounting for 38% of Australia’s container trade.3 In addition, the Port of Melbourne is the key international port for imports to, and exports from, Tasmania. This includes international exports and imports, as well as goods moving from and to mainland Australia. A range of different analytical tools have been used to meet the aims of the Study. These have included: • modelling the current economic impacts of the Port of Melbourne on Victoria
and Australia, using an input-output model based on the Bureau of Transport and Regional Economics framework for valuing the activities of ports;
• modelling the differences in the long term impacts on the Victorian and Australia economies of proceeding and not proceeding with key port infrastructure investments. This was undertaken by the Centre of Policy Studies (CoPS) at Monash University using TERM (The Enormous Regional Model);
• using the results of our input-output model, extrapolating some indicative economic impacts for different regions of Victoria; and
• based on research and an extensive consultation process, developing a qualitative assessment of the impacts of the port on key sectors of the economy. This assessment has considered both the current impacts on industry and the economy of the port’s activities, as well as the implications of proceeding or not proceeding with proposed infrastructure investments.
1 Australian Bureau of Statistics, March 2006 2 http://www.portofmelbourne.com.au/business/economiccont.asp 3 Port of Melbourne Corporation, Annual Report 2004/05, p. 25

Port of Melbourne Economic Contribution Study Executive Summary
4
The Channel Deepening Project (CDP) involves dredging defined sections of the shipping channels in the Yarra River and Port Phillip Bay. Dredging involves the physical removal of channel materials and is focused on sections close to the entrance of Port Phillip Bay and the entrance to the Port of Melbourne. The rationale for the CDP is that, because of insufficient depth of parts of the shipping channels, some container ships enter and leave Melbourne under capacity. This means that ships are operating at sub-optimal capacity, which results in higher costs per unit of goods shipped and, consequently, higher prices for those goods. The PoMC estimates that around 25% of ships visiting the port are affected by draught restrictions. In addition, draught restrictions mean that some larger ships are currently unable to visit the port.
Total economic value of the Port of Melbourne Activity at the Port of Melbourne generated a total economic impact of $2.501 billion in output in 2004-05. Value added to Australia equalled $1.1 billion and port activities supported 13,748 FTEs. The results of this analysis are summarised in table ES.1. Please note that, while the TERM model has not differentiated between the economic impacts for Victoria and for Australia, most of the impacts would accrue to Victoria.
Table ES.1: Total economic value of the Port of Melbourne, 2004-05
Direct Effects
Indirect Effects
Total Effects
Output ($ million) 1,338 1,163 2,501
Value Added ($ million) 596 545 1,140
Employment (FTEs) 7,563 6,185 13,748
There were 3,411 ship visits to the port in 2004-05 by commercial vessels. The results of this analysis indicate that, on average, each ship call at the Port of Melbourne resulted in the following impact on the economy:
• $733,128 of output;
• $334,332 of value added; and
• four full time jobs for one year.

Port of Melbourne Economic Contribution Study Executive Summary
5
Measuring the economic impact of Infrastructure Projects Over the next 22 years, the CDP will generate $1.7 billion in economic benefits to Australia, 80% of which would accrue to Victoria. In particular, some of the key impacts of the CDP are:
• an overall national gain from the CDP in discounted net present value (NPV) terms of $1.7 billion;
• an increase in employment compared to the base case of the CDP not proceeding;
• positive effects on aggregate consumption and, in the long run, on investment;
• additional investment in regional Victoria from 2009. The CDP would provide economic benefits to Melbourne from the beginning of the project (assumed start in 2006);
• an overlap of the construction and operational phases of the CDP. The capital cost of the CDP peaks in 2009 when investment amounts to $316 million; and
• savings in shipping costs associated with larger ships being able to access the Port of Melbourne would commence in 2009. The initial savings will be approximately $43 million per annum which will steadily rise over succeeding years to $87 million in 2015, and $582 million by 2035.
For the period 2005-2035, the estimated net welfare benefit of the CDP is $2.2 billion.
Geographic distribution of effects The outcomes of the analysis of the overall impacts of the Port and the CDP were further translated to the effects on particular parts of Victoria.
The following tables provide a picture of how the benefits from the Port of Melbourne are distributed at the local, regional, State and national levels. The indicative employment impacts of port related activities are outlined in Table ES.2.
Table ES.2: Geographical distribution of employment benefits from the Port of Melbourne
Region Direct effects (employment)
Flow-on effects (employment)
Total impact (employment)
City of Melbourne 309 253 562
City of Port Phillip 136 112 248
City of Hobsons Bay 1,240 1,014 2,253
City of Maribyrnong: 150 123 273
Bayside – TOTAL 1,836 1,501 3,337
Port of Melbourne Economic Contribution Study Executive Summary
6
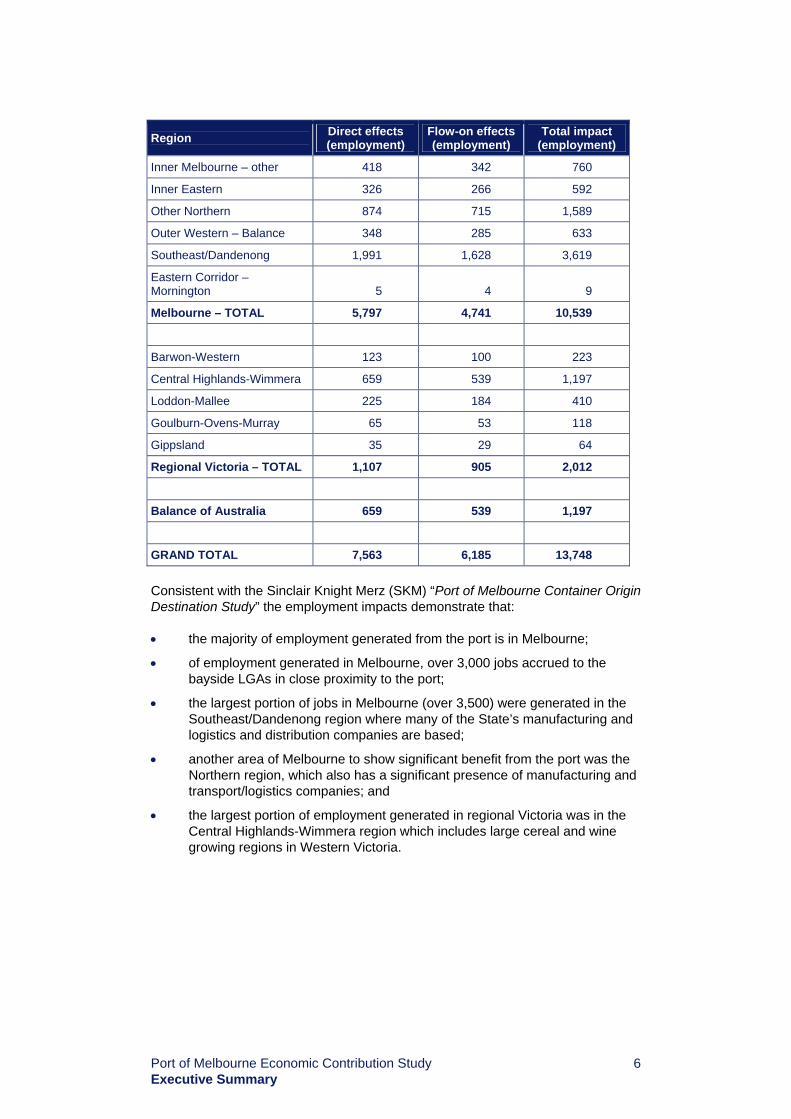
Region Direct effects (employment)
Flow-on effects (employment)
Total impact (employment)
Inner Melbourne – other 418 342 760
Inner Eastern 326 266 592
Other Northern 874 715 1,589
Outer Western – Balance 348 285 633
Southeast/Dandenong 1,991 1,628 3,619
Eastern Corridor – Mornington 5 4 9
Melbourne – TOTAL 5,797 4,741 10,539
Barwon-Western 123 100 223
Central Highlands-Wimmera 659 539 1,197
Loddon-Mallee 225 184 410
Goulburn-Ovens-Murray 65 53 118
Gippsland 35 29 64
Regional Victoria – TOTAL 1,107 905 2,012
Balance of Australia 659 539 1,197
GRAND TOTAL 7,563 6,185 13,748 Consistent with the Sinclair Knight Merz (SKM) “Port of Melbourne Container Origin Destination Study” the employment impacts demonstrate that: • the majority of employment generated from the port is in Melbourne;
• of employment generated in Melbourne, over 3,000 jobs accrued to the bayside LGAs in close proximity to the port;
• the largest portion of jobs in Melbourne (over 3,500) were generated in the Southeast/Dandenong region where many of the State’s manufacturing and logistics and distribution companies are based;
• another area of Melbourne to show significant benefit from the port was the Northern region, which also has a significant presence of manufacturing and transport/logistics companies; and
• the largest portion of employment generated in regional Victoria was in the Central Highlands-Wimmera region which includes large cereal and wine growing regions in Western Victoria.

Port of Melbourne Economic Contribution Study Executive Summary
7
Geographic distribution of the economic benefits of the Channel Deepening Project The following tables present the outcomes of the distribution of the benefits of channel deepening on a local, regional, State and National basis4.
Table ES.3: Geographical distribution of benefits from infrastructure development
Region Direct Effects
($m)
City of Melbourne Total 69.5
City of Port Phillip Total 30.7
City of Hobsons Bay Total 278.6
City of Maribyrnong: 33.8
Bayside – TOTAL 412.6
Inner Melbourne - other 94.0
Inner Eastern 73.2
Other Northern 196.5
Outer Western - Balance 78.2
Southeast/Dandenong 447.5
Eastern Corridor - Mornington 1.1
Melbourne – TOTAL 1,303.1
Barwon-Western 27.6
Central Highlands-Wimmera 148.0
Loddon-Mallee 50.7
Goulburn-Ovens-Murray 14.6
Gippsland 7.9
Regional Victoria – TOTAL 248.8
Balance of Australia 148.0
GRAND TOTAL 1,700.0
4 It is important to note that part of the benefits from the CDP will flow overseas. This effect is part of the modelling and is reflected in the final results but is not specifically detailed here.

Port of Melbourne Economic Contribution Study Executive Summary
8
The findings from this analysis are: • the largest part of the benefits from proposed infrastructure development of
the port and its key assets would be distributed within the Melbourne metropolitan area;
• within the Melbourne metropolitan area, the vast majority of those benefits would be distributed to areas in close physical proximity to the port and those areas that produce or use the goods and services that pass through the port; and
• outside Melbourne, the benefits are distributed unevenly with Central Highlands-Wimmera gaining the largest share of the Victorian regional benefits and NSW gaining the majority of the benefits outside Victoria.
Disruption during the CDP Several stakeholders raised concerns about the economic costs of disruption caused by the CDP. In particular, the dive industry noted its concerns about decreased economic activity and financial effects on that industry during the CDP. While these concerns may be contained to the period of channel deepening5, they will need to be taken into account by Government during its decision making processes. PwC notes that the Supplementary Environment Effects Statement (SEES) process is required to consider related benefits and impacts of the CDP including the possible effects of disruption during dredging works. PwC understands that the SEES will be completed and exhibited in early 2007.
Social and environmental effects The Port of Melbourne has had a significant social impact on Melbourne since it was established in the 1840s. The existence and nature of the port have been determining factors in the adjacent urban areas for over a century. The port and related industries’ provision of employment, opportunities for economic activity, and physical impacts on urban development have driven a great deal of the demographic, infrastructure, social and cultural aspects of those adjacent areas. Industry, people and infrastructure have been attracted to the opportunities the port presents. The key social issue identified by stakeholders, however, is the impact that greater activity at the port will have on road usage and congestion. PwC understands that this issue is the subject of ongoing discussion between State Government agencies, port users and neighbouring councils. Some stakeholders also raised concerns about decreased amenity from the Bay that may arise during the CDP. A particular example given was the disruption of opportunities for recreational diving.
5 Although the dive industry noted concerns with ongoing financial effects associated with residual turbidity.

Port of Melbourne Economic Contribution Study Executive Summary
9
As with any industry, the port has impacts on the natural environment within which it operates. The proposed CDP has also been the focus of much discussion with respect to possible environmental impacts. However, there are other processes that are looking at these issues and this report will not be exploring those impacts in detail. The potential environmental impacts of the CDP were identified in the Economic Impact Study undertaken as part of the Environment Effects Statement (EES) for the project, exhibited during 2004. Some of the key potential environmental impacts identified in this study included: • a reduction in local air pollution and greenhouse gas emissions which would
result from fewer total ships calls to the Port of Melbourne because larger ships could call at the port;
• short term disruption to commercial fishing, recreational fishing and diving and other bay users resulting from increased sediment in the water of the Bay during the dredging process;
• changes to hydrodynamic processes (the potential to disrupt water movements in the Bay, including tides, currents etc);
• changes to the denutrification process (i.e. the impact of the removal of or changes to seabed habitats could affect the Bay’s ability to remove nitrogen);
• translocation of marine pests (from the ballast of larger vessels and from the dredging process);
• turbidity and increased sedimentation in the water of the Bay; and
• increased mobilisation of contaminants.
A number of other possible side effects of the dredging process were also identified which could have an impact on the ecology of Port Phillip Bay. PwC notes that the SEES will look at the following issues in more detail: • turbidity;
• possible impacts of deepened channels on water currents and sediment movement;
• management of contaminated sediments;
• possible impacts on biodiversity and habitat; and
• refinement of the project design.
A significant part of the conduct of the SEES has been a trial dredging of parts of the channel and the entrance to the Bay to provide data on some of the above issues, particularly turbidity. The trial has also sought to demonstrate the technical capacity to undertake dredging as envisaged in the EES.

Port of Melbourne Economic Contribution Study 10
THIS PAGE HAS BEEN LEFT BLANK INTENTIONALLY
Port of Melbourne Economic Contribution Study 11
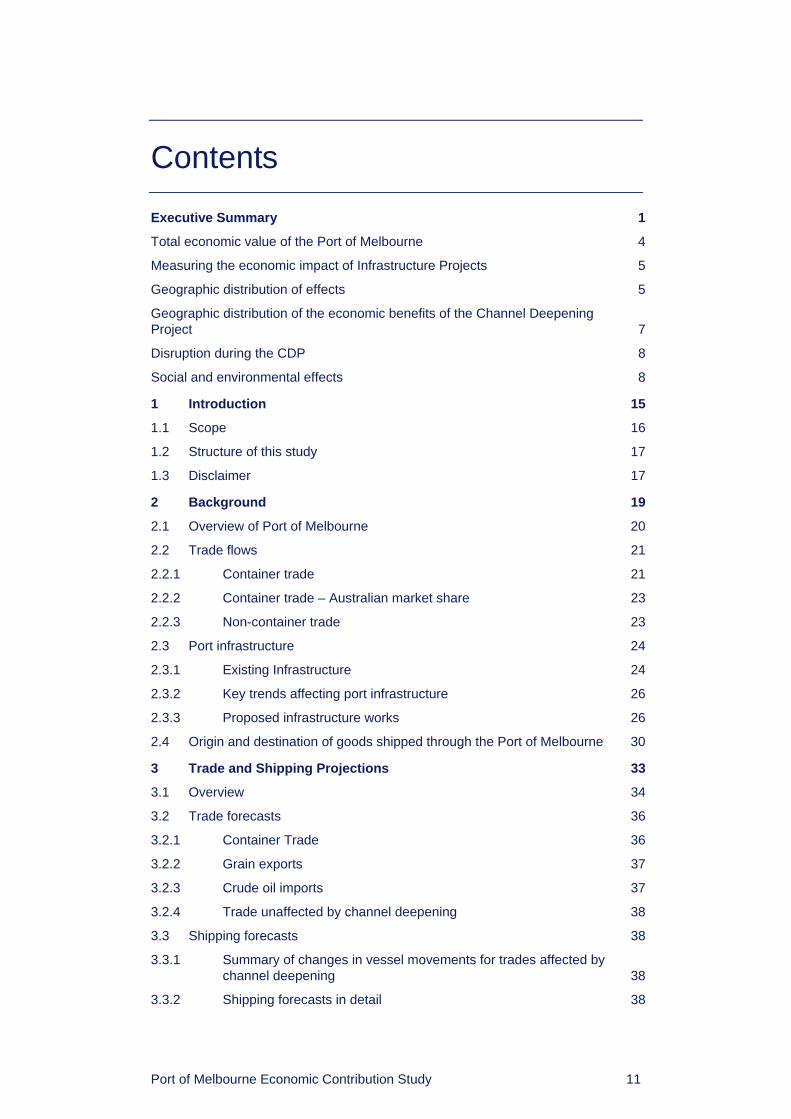
Contents
Executive Summary 1 Total economic value of the Port of Melbourne 4 Measuring the economic impact of Infrastructure Projects 5 Geographic distribution of effects 5 Geographic distribution of the economic benefits of the Channel Deepening Project 7 Disruption during the CDP 8 Social and environmental effects 8
1 Introduction 15 1.1 Scope 16 1.2 Structure of this study 17 1.3 Disclaimer 17
2 Background 19 2.1 Overview of Port of Melbourne 20 2.2 Trade flows 21 2.2.1 Container trade 21 2.2.2 Container trade – Australian market share 23 2.2.3 Non-container trade 23 2.3 Port infrastructure 24 2.3.1 Existing Infrastructure 24 2.3.2 Key trends affecting port infrastructure 26 2.3.3 Proposed infrastructure works 26 2.4 Origin and destination of goods shipped through the Port of Melbourne 30
3 Trade and Shipping Projections 33 3.1 Overview 34 3.2 Trade forecasts 36 3.2.1 Container Trade 36 3.2.2 Grain exports 37 3.2.3 Crude oil imports 37 3.2.4 Trade unaffected by channel deepening 38 3.3 Shipping forecasts 38 3.3.1 Summary of changes in vessel movements for trades affected by
channel deepening 38 3.3.2 Shipping forecasts in detail 38

Port of Melbourne Economic Contribution Study 12
3.4 Shipping cost forecasts 40
4 Current economic impact of the port: input-output analysis 41 4.1 Methodology 42 4.1.1 Bureau of Transport and Regional Economics General
Framework for Port Impact Studies 42 4.1.2 Methodological approach 44 4.2 Input-output framework 46 4.2.1 Multipliers 46 4.2.2 Stage 1: Economic impact of the Port of Melbourne Corporation 46 4.2.3 Stage 2: Economic impact of port-related businesses 48 4.2.4 Total economic value of the Port of Melbourne 50
5 Economic impact of infrastructure projects 51 5.1 Measuring the economic impact of Infrastructure Projects 52 5.2 Results of CoPS modelling 52 5.2.1 The Labour Market 53 5.2.2 Aggregate consumption and National Welfare 55 5.2.3 Income composition in each region 56 5.2.4 Regional industry impacts 56 5.2.5 Total GDP 57
6 Other economic studies of ports 59 6.1 The value of ports around Australia 60 6.2 The Port of Fremantle 61 6.3 The Port of Townsville 62 6.4 The Port of Sydney 62 6.5 The Port of Geelong 63 6.6 The Port of Brisbane 64 6.7 The Port of Melbourne 64
7 Socio-economic analysis 67 7.1 Non-quantifiable economic impacts 68 7.1.1 Port related industries (direct) 68 7.1.2 Other industries (indirect) 69 7.1.3 Impact on industries both directly and indirectly related to the
Port of Melbourne 69 7.1.4 Investment impacts 70 7.2 Disruption caused by the CDP 71 7.3 Non-economic impacts 71 7.3.1 Social impacts 71 7.3.2 Environmental impacts 72

Port of Melbourne Economic Contribution Study 13
7.4 Impacts on regions of Victoria 73 7.4.1 Methodology 73 7.4.2 Geographic distribution of the benefits of the Port of Melbourne 74 7.4.3 Geographic distribution of the benefits of the infrastructure
development 78
8 Conclusions 81 8.1 The economic impacts of the Port of Melbourne 82 8.2 The economic impacts of the Port of Melbourne at a regional and
local level 83 8.3 The economic impacts of proposed infrastructure projects 84 8.4 Conclusion 85
Appendix A CoPS Modelling 87 Dynamic CGE analysis of the economic effects of channel deepening in Port Phillip Bay 88 Summary 89 References 100 The model 101
Appendix B Glossary 105
Appendix C Stakeholders consulted 107
Appendix D Geographic distribution of indicative economic benefits of the Port of Melbourne 109
Appendix E Port Phillip Bay shipping channels 117
Appendix F Port of Melbourne: port precinct 119
Appendix G Minister’s Statement on SEES 121 Minister’s Foreword 122 Minister’s Statement For Channel Deepening Proposal 124 Supplementary Environment Effects Statement 124

Port of Melbourne Economic Contribution Study 14
THIS PAGE HAS BEEN LEFT BLANK INTENTIONALLY

Port of Melbourne Economic Contribution Study 15 Introduction
1
Introduction

Port of Melbourne Economic Contribution Study 16 Introduction
1.1 Scope This Study has been undertaken to assess the economic contribution of the Port of Melbourne to the Victorian and Australian economies. In addition, the Study has considered the economic impacts of the port on different regions of Victoria. The objectives of the Study were to: • identify the current contribution to the Victorian and Australian economies of
the Port of Melbourne’s activities, including on employment;
• establish the likely economic impacts of the port over the next 30 years if key proposed infrastructure were to go ahead compared to a scenario where this investment was not made;
• identify the current contribution the port’s activities make to the economy of metropolitan Melbourne and regional economies; and
• identify the flow-on effects from the port’s activities on the wider Australian economy, including key industry sectors.
A range of different analytical tools have been used to meet the aims of the Study. These have included: • modelling the current economic impacts of the Port of Melbourne on Victoria
and Australia, using an input-output model based on the Bureau of Transport and Regional Economics framework for valuing the activities of ports;
• modelling the differences in the long term impacts on the Victorian and Australia economies of proceeding and not proceeding with key port infrastructure investments. This was undertaken by the Centre of Policy Studies (CoPS) at Monash University using TERM (The Enormous Regional Model);
• using the results of our input-output model, extrapolating some indicative economic impacts for different regions of Victoria; and
• based on research and an extensive consultation process, developing a qualitative assessment of the impacts on the port on key sectors of the economy. This assessment has considered both the current impacts on industry and the economy of the port’s activities, as well as the implications of proceeding or not proceeding with proposed infrastructure investments.

Port of Melbourne Economic Contribution Study 17 Introduction
1.2 Structure of this study Section 2: of the Study provides background on the operations and physical infrastructure of the Port of Melbourne and the trade flows that pass through the port. Section 3: reviews the shipping and trade projections that underpin the economic models used in the Study. Section 4: contains the input-output analysis which measures the current economic impact of the port and its operations. Section 5: contains the comparative economic analysis of the impact of proceeding and not proceeding with the proposed Channel Deepening Project. Section 6: outlines other economic studies of Australian ports that have been undertaken in recent years. Section 7: outlines the findings from the consultation process, including socio-economic issues. Section 8: summarises the findings from the Study.
1.3 Disclaimer This Study was prepared for the Department of Treasury and Finance for the sole purpose of providing an analysis of the economic impact of the Port of Melbourne. The analysis is based upon a set of data and assumptions developed through input from stakeholders and desktop research. We have not endeavoured to seek any independent confirmation of the reliability and accuracy of the data inputs provided. It should be recognised that the identification of economic impacts is not a precise science. As with other studies of this nature, the assessment is necessarily based on the assumptions underpinning the modelling undertaken for this assignment, which may be subject to variations and uncertainties across both the short and long term. Actual impacts may vary from forecast as other anticipated events frequently do not occur as expected and the variations may be significant. Accordingly, whilst the statements made in this study are given in good faith, PwC or any partners or staff do not accept responsibility for errors or omissions, or any loss or damage as a result of any persons relying on this Study for any purposes other than that for which it has been prepared.

Port of Melbourne Economic Contribution Study 18
THIS PAGE HAS BEEN LEFT BLANK INTENTIONALLY

Port of Melbourne Economic Contribution Study 19 Background
2
Background

Port of Melbourne Economic Contribution Study 20 Background
2.1 Overview of Port of Melbourne The Port of Melbourne is the most important port in Victoria and one of the largest in Australia. Different figures for the value of trade through the port exist: according to the ABS, it handled around $53 billion of trade in 2004-05 ($35 billion of imports and around $18 billion of exports)6; the Port of Melbourne Corporation (PoMC) provides a higher figure of $75 billion of trade7. It is the nation’s largest container port, accounting for 38% of Australia’s container trade.8 In addition, the Port of Melbourne is the key international port for imports to, and exports from, Tasmania. This includes international exports and imports, as well as goods moving from and to mainland Australia. The key difference in these values is due to the inclusion of coastal (domestic) trade statistics in the PoMC estimate. Note, however, that these values do not affect the economic impact estimates of this Study (which are based on total trade volumes rather than trade values). The Port of Melbourne is at the centre of a transport hub, including: • extensive rail links extending to South Australia and New South Wales,
facilitating its role as the primary entry and exit point for goods for Southeastern Australia;
• major national road links, including the Hume, Western and Princes Highways;
• Melbourne’s international airport in close proximity;
• shipping links with more than 300 ports across the globe;
• being the key port for coastal shipping activities, including for goods moving to and from Tasmania.
Port of Melbourne Corporation
The port facility is managed by the Port of Melbourne Corporation (PoMC), which was established on 1 July 2003. The objectives, powers and functions of the PoMC are set out in the Port Services Act 1995 (“the Act”). The objectives of the PoMC as set out in the Act are: • to manage and develop the Port of Melbourne in an economically, socially
and environmentally sustainable manner;
• to ensure that essential port services of the Port of Melbourne are available and cost effective;
• to ensure, in co-operation with other relevant responsible bodies, that the Port of Melbourne is effectively integrated with other systems of infrastructure in the State;
• to facilitate, in co-operation with other relevant responsible bodies, the sustainable growth of trade through the Port of Melbourne; and
• to establish and manage channels in Port of Melbourne waters for use on a fair and reasonable basis.
6 Australian Bureau of Statistics, March 2006. Note that the Port of Melbourne Corporation website identifies the total value of annual trade through the port at $75 billion. 7 http://www.portofmelbourne.com.au/business/economiccont.asp 8 Port of Melbourne Corporation, Annual Report 2004/05, p. 25

Port of Melbourne Economic Contribution Study 21 Background
2.2 Trade flows The total volume of trade through the Port of Melbourne in 2004-05 was estimated at 28.3 million mass tonnes (or 64.4 million revenue tonnes). The bulk of this trade was containerised (69%), with different categories of bulk trade including liquid bulk, dry bulk and break bulk making up the remainder. Table 2.1 shows the major components of trade at the Port of Melbourne by cargo type.
Table 2.1: Total trade (mass tonnes) by cargo type 2004-05
Commodity Mass tonnes % of total
Container 44,470,042 69
Break bulk 8,603,518 13
Liquid bulk 5,125,118 8
Dry bulk 3,771,897 6
Other 2,457,970 4
TOTAL 64,428,545 100
Source: Port of Melbourne Corporation Annual Report 2004-05
2.2.1 Container trade As noted above, container trade accounts for the majority of throughput at the Port of Melbourne. The major types of exports and imports (by volume) are shown in the following tables. The percentage measures are based on trade volumes rather than value.
Table 2.2: Container trade: exports, 2004-05 (by volume)
Product category Export (TEUs) %
Miscellaneous manufactures 13.9
Dairy products 7.2
Cereal grains 7.1
Beverages 6.5
Stock feed 4.8
Paper and newsprint 4.6
Meat 4.2
Fruit and vegetables 3.7
Pulp and wastepaper 3.3
Miscellaneous food preparations 2.9
Other 41.8
TOTAL 100.0
Source: Port of Melbourne Corporation Annual Report 2004-05

Port of Melbourne Economic Contribution Study 22 Background
In volume terms, exports from the Port of Melbourne are diversified, with manufactured products, processed food and agricultural products accounting for significant portions. This reflects, in part, the diversified nature of the Victorian economy as well as the main export catchment areas for the port (Melbourne, regional Victoria and Southern NSW). Key Victorian industries dependent on the port for export include dairy, horticulture, forestry, cereals and meat production. The export of miscellaneous manufactured goods reflects Melbourne’s importance as a manufacturing centre for the Australian economy. Please note that “other goods” refers to a range of commodities and other manufactured exports. The port exports a diverse range of goods, most of which contribute a small proportion of total exports, and its container trade is not dominated by particular classes of products. For this reason, the “other” category represents a large number of smaller volume products, reflecting the diversity of exports from the port’s catchment area. The goods profile for imports through the port is quite different to that of exports. Table 2.3 highlights the key import categories by volume.
Table 2.3: Container trade: imports, 2004-05 (by volume)
Product category Import (TEUs)%
Miscellaneous manufactures 11.5
Paper and newsprint 8.1
Electrical equipment 6.7
Furniture 5.3
Machinery 4.1
Vehicle parts 3.8
Clothing 3.5
Metal manufactures 3.4
Toys and sporting 3.4
Other 50.2
TOTAL 100.0
Source: Port of Melbourne Corporation Annual Report 2004-05 The majority of container imports through the port consist of manufactured products, either consumables or inputs into the manufacturing or other processing industries in Victoria. The “other” category of imports accounts for large range of manufactured and other imports that pass through the port. The container import trade is comprised mainly of many classes of consumer and industrial products, and is extremely diverse. For this reason, many goods comprise only a small proportion of the trade, and captured in the “other” category.
Port of Melbourne Economic Contribution Study 23 Background
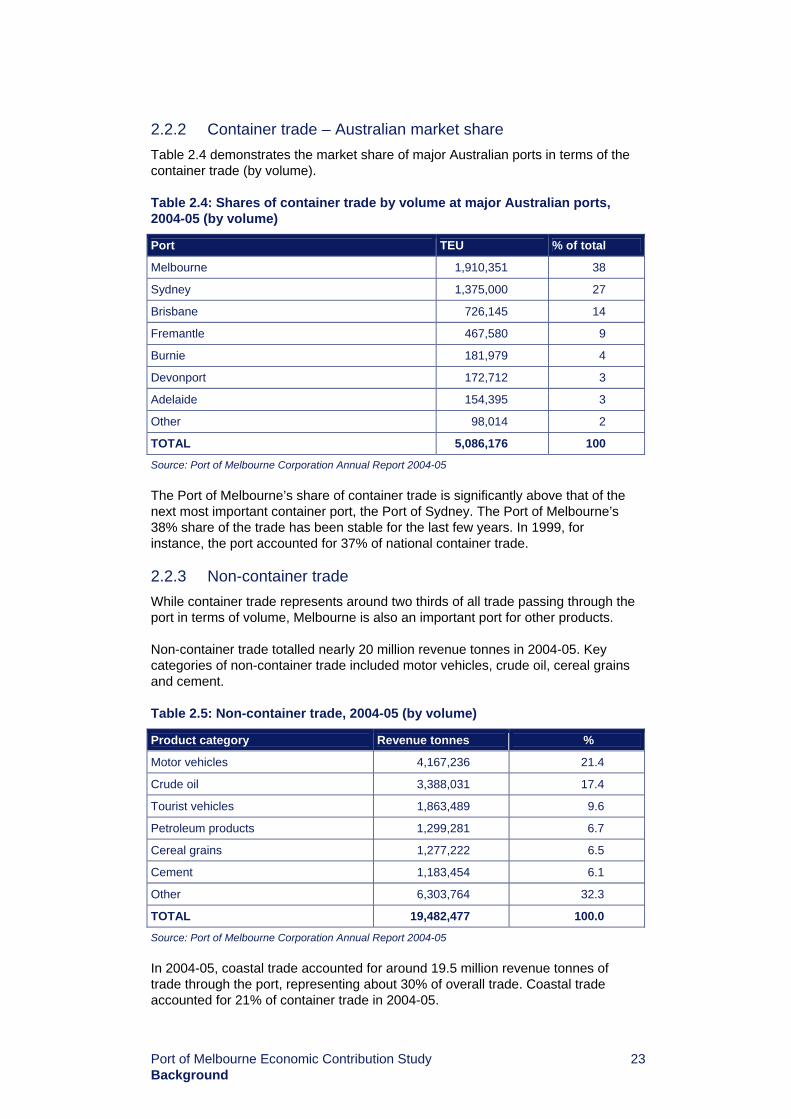
2.2.2 Container trade – Australian market share Table 2.4 demonstrates the market share of major Australian ports in terms of the container trade (by volume).
Table 2.4: Shares of container trade by volume at major Australian ports, 2004-05 (by volume)
Port TEU % of total
Melbourne 1,910,351 38
Sydney 1,375,000 27
Brisbane 726,145 14
Fremantle 467,580 9
Burnie 181,979 4
Devonport 172,712 3
Adelaide 154,395 3
Other 98,014 2
TOTAL 5,086,176 100
Source: Port of Melbourne Corporation Annual Report 2004-05 The Port of Melbourne’s share of container trade is significantly above that of the next most important container port, the Port of Sydney. The Port of Melbourne’s 38% share of the trade has been stable for the last few years. In 1999, for instance, the port accounted for 37% of national container trade.
2.2.3 Non-container trade While container trade represents around two thirds of all trade passing through the port in terms of volume, Melbourne is also an important port for other products. Non-container trade totalled nearly 20 million revenue tonnes in 2004-05. Key categories of non-container trade included motor vehicles, crude oil, cereal grains and cement.
Table 2.5: Non-container trade, 2004-05 (by volume)
Product category Revenue tonnes %
Motor vehicles 4,167,236 21.4
Crude oil 3,388,031 17.4
Tourist vehicles 1,863,489 9.6
Petroleum products 1,299,281 6.7
Cereal grains 1,277,222 6.5
Cement 1,183,454 6.1
Other 6,303,764 32.3
TOTAL 19,482,477 100.0
Source: Port of Melbourne Corporation Annual Report 2004-05 In 2004-05, coastal trade accounted for around 19.5 million revenue tonnes of trade through the port, representing about 30% of overall trade. Coastal trade accounted for 21% of container trade in 2004-05.
Port of Melbourne Economic Contribution Study 24 Background
2.3 Port infrastructure 2.3.1 Existing Infrastructure Infrastructure at the Port of Melbourne comprises those assets owned and/or managed by the PoMC, and those owned and/or managed by private port users. The majority of the land in the port precinct is owned by the PoMC over which port users hold long-term leases. A map of the port precinct is attached in Appendix F. The PoMC is responsible for maintenance and development of most of the land-side infrastructure at the port as well as maintaining the shipping channels. Land-side infrastructure that is owned and/or maintained by the PoMC includes: • wharves, dock, piers and other berthing facilities; and
• logistics infrastructure inside the port precinct (roads and related facilities).
The Port of Melbourne has 30 commercial berths, including international container terminals, multi-purpose berths for cargos and specialised berths (for dry bulk cargos such as cement, sugar and grain). Berths are licensed by stevedoring companies for loading and unloading ships. In terms of logistics facilities, the Australian Rail Track Corporation (ARTC) manages the operations of the port rail sidings on behalf of the PoMC. The PoMC is responsible for provision and maintenance of roads within the port precinct. Roads are the key means by which goods are transported within the port, as well as to and from the port. Port users have also developed infrastructure which they own and operate. This infrastructure is usually developed on land or other assets leased from the PoMC. The key private infrastructure in terms of the port precinct is those owned by terminal operators, and includes: • cranes;
• straddles;
• yards and yard handling equipment (for storage of containers and other cargo); and
• rail assets (eg. terminals).
Key port facilities include shipping and stevedoring facilities and port logistics facilities. Key shipping and stevedoring facilities are outlined in table 2.6.

Port of Melbourne Economic Contribution Study 25 Background
Table 2.6: Key shipping facilities at the Port of Melbourne: Docks and terminals
Facility Purpose User
Swanson Dock East Container trade Patrick Corporation
Swanson Dock West Container trade P&O Ports
Appleton Dock B-D General cargo P&O Ports
Appleton Dock E Container trade ANL
Appleton Dock F Common user berth Common user berth
Victoria Dock General cargo Common user berth
South Wharf Bulk cement, general cargo and tug berthing
MCF Bulk Cement, common user berths
Maribyrnong 1 Bulk liquid terminal Common user berth
Yarraville Bulk sugar and gypsum; other bulk cargo
CSR Australia and common user berths
Holden Dock Oil terminal Common user berth
Webb Dock East Coastal and Ro/Ro (vehicles); general cargo
Toll Shipping, Patrick Shipping
Webb Dock West Ro/Ro (vehicles) AAT
Gellibrand Pier Oil terminal Mobil
Station Pier Ferries and passenger ships TT Line, other
Source: Port of Melbourne Corporation Key logistics facilities at the port include: • Coode Road, West Melbourne – port infrastructure and operations;
• Appleton Dock Road, West Melbourne – container packing/unpacking facilities and a rail terminal under development;
• Enterprize Road, West Melbourne – Australian Customs Facility;
• Lorimer Street, Port Melbourne – a warehouse and distribution centre, and a freight forwarding facility;
• Williamstown Road, Port Melbourne – a warehouse, coolstore and container packing/unpacking facility; and
• Somerville Road, Yarraville – a container park with rail connections.
A map of the port and its key facilities is listed in Appendix F.

Port of Melbourne Economic Contribution Study 26 Background
2.3.2 Key trends affecting port infrastructure A number of trends will drive the development of the port precinct and investment in infrastructure by both the PoMC and port users. The key driver will be the continuing growth in the volume of trade passing through the Port of Melbourne. The increasing volume of goods will, over time, result in pressure to: • increase the depth of the shipping channels in Port Phillip Bay to
accommodate ships with larger capacity;
• increase berth capacity to take ships with larger cargo carrying capacities;
• improve stevedoring and cargo loading/unloading productivity through investment in new infrastructure;
• increase the number of berthing facilities;
• improve road access in and to the port to accommodate a larger number of trucks, and to accommodate bigger and heavier trucks;
• improve rail access to the port; and
• provide greater capacity to temporarily store goods at terminals, just prior to leaving the port or just after delivery to the port precinct.
In addition, growth in the port and its operations will need to be balanced against the need to manage the issues of pollution and congestion that the increased volume of goods passing through the port will inevitably generate.
2.3.3 Proposed infrastructure works A range of infrastructure work at the port is expected over the next few decades. These infrastructure requirements have been outlined in the PoMC’s draft Port Development Plan 2006-2035. The key aims of the PoMC’s future infrastructure strategies are to maximise the productivity of existing terminals, storage and capacity at the port, and develop new capacity for future expansion. The key projects projected for the port are listed in table 2.7, and are categorised into five-year periods. The table list reflects investment by the PoMC and port users, consistent with the Port Development Plan 2006-2035.
Table 2.7: Proposed infrastructure projects, Port of Melbourne, to 2035
Period Proposed Project
• Channel Deepening Project, if approved (see below).
• Integration of West Swanson Dock container terminal with the rail terminal (facilitated by closure of part of Coode Road).
• Productivity improvements at Swanson Dock container terminals through investments including an upgrade of container cranes and commencement of high density yard operations.
• Completion of Victoria Dock development, a rail terminal to an external rail link.
• Upgrade and extension of berths at Victoria Dock.
2005-10
• Port rail access improvement through the grade separation of Footscray, Appleton Dock and Enterprize Roads.

Port of Melbourne Economic Contribution Study 27 Background
Period Proposed Project
• Increased train network capacity to the port.
• Dynon Port Rail Link project. This will provide a port precinct vehicle link between the port and Dynon rail precinct.
• Upgrade of motor vehicle import/export facilities at Webb Dock.
• Road access improvements to Webb Dock.
• Construction of an internal road link between West Swanson Dock and Appleton and Victoria Docks for high axle load vehicles.
• Integration of the East Swanson container terminal with container park sites to the north of Coode Road.
• Extension of Swanson Dock.
• Further productivity at Swanson Dock container terminals through a capital investment program which includes upgrading of container cranes and high density yard operations.
• Construction of Webb Dock rail link.
• Relocation of Melbourne Wholesale Fruit and Vegetable Market. This would facilitate the Dynon precinct and port and the development of a new rail terminal.
• Appleton Dock coastal operations (intra-Australian trade) transferred to Webb Dock.
2011-2015
• Three of the five berths at Appleton Dock (Berths B, C and D) converted and upgraded for break bulk operations.
• Transfer of motor vehicle operations from Webb Dock East to Webb Dock West.
• Provision of rail connection to Webb Dock East.
• Upgrade of Webb Dock East berth to accommodate 14 m draught ships.
• Establishment of international container operations, including a rail terminal, at Webb Dock East.
• Extension of Tasmanian trade terminals at Webb Dock East.
2016-2025
• Extension of Webb Dock with new berths to accommodate vehicle trade and coastal shipping.
• Relocation of motor vehicle trade from Webb Dock to another location either within the port or at another port.
• Relocation of Tasmanian trade terminals to Webb Dock.
• Construction of new international container berths at Webb Dock East.
• Extension of international container terminal operations at Webb Dock East.
2026-2035
• Extension of Webb Dock rail terminal capacity.
Source: Port of Melbourne Corporation Please note that all projects in table 2.7 are subject to the necessary approvals and authorities and may be subject to change.

Port of Melbourne Economic Contribution Study 28 Background
Channel Deepening Project
The Channel Deepening Project (CDP) is the largest individual infrastructure project proposed for the Port of Melbourne. The CDP involves dredging defined sections of the shipping channels in the Yarra River and Port Phillip Bay. Dredging involves the physical removal of channel materials and is focused on sections close to the entrance of Port Phillip Bay and the entrance to the Port of Melbourne. The diagram below highlights which areas of the channels would be dredged according to current infrastructure plans.
Figure 2.1: Port of Melbourne shipping channels
Source: http://www.channelproject.com/global/docs/Overview.pdf The rationale for the CDP is that, because of insufficient depth of parts of the shipping channels, some container ships enter and leave Melbourne under capacity. This means that ships are operating at sub-optimal capacity, which results in higher costs per unit of goods shipped and, consequently, higher prices for those goods. The PoMC estimates that around 25% of ships visiting the port are affected by draught restrictions. In addition, draught restrictions mean that some larger ships are currently unable to visit the port. This capacity issue is expected to grow over time in line with the global trend towards utilising ships of larger capacities. Likely impacts without the CDP include: • more ships will arrive and leave the port under capacity; and
• the largest (and most efficient) ships will increasingly by-pass Melbourne in favour of ports with fewer draught restrictions.
Both of these trends would have negative impacts on the competitiveness of the port. An Environment Effects Statement (EES) for the CDP was released on 5 July 2004. A Supplementary EES is currently underway which should address outstanding issues from the original EES. These processes are outside the scope of the PwC Study and are not addressed in the analysis or findings.
Port of Melbourne Economic Contribution Study 29 Background
Dynon Port Rail Link
The Dynon Port Rail Link project will provide a direct new rail link to the port. The current link crosses Footscray Road, and gives priority to road vehicles. The new link will provide uninterrupted rail access to the port, and should deliver improved road conditions for Footscray Road traffic over the medium term. It will also reduce some operational constraints on rail traffic serving the dock terminals.
Tottenham to West Footscray rail link
The Commonwealth Government is providing funding to the ARTC for the Tottenham to West Footscray rail link. This project is to upgrade the line and signal system on the track between Tottenham and West Footscray. These infrastructure works should reduce bottlenecks and increase capacity between Tottenham and South Dynon Junction, and improve rail access into the Port of Melbourne.
Melbourne Port@L
Melbourne Port@L is a long-term strategic framework for improving the efficiency of the port through better integration of its freight and logistics facilities. Projects that are currently being undertaken as part of the Melbourne Port@L include: • the Dynon Port Rail Link (see above);
• the relocation of the Melbourne Wholesale Markets on Footscray Road to free up land in the port precinct;
• the closure of Coode Road and extension of Mackenzie Road, to reduce the cost of moving freight in and out of the port precinct; and
• changes to the rail network in the port precinct to strengthen rail links with some of the major terminals.

Port of Melbourne Economic Contribution Study 30 Background
2.4 Origin and destination of goods shipped through the Port of Melbourne The origin and destination of exports and imports passing through the Port of Melbourne has been the subject of a study by Sinclair Knight Merz (SKM) Port of Melbourne Container Origin Destination Study. The study used a survey based approach to analyse the movements of container goods in and out of the port by both road and rail. For the purposes of this Study, we have used the findings of this report as a proxy for determining where all goods passing through the port are shipped to and from. There are limitations to this approach as the SKM report only analysed containerised goods and, as it is survey-based, may not accurately represent the origins and destinations of products. Despite these qualifications, and given an absence of other data of this nature, the SKM study provides a guide to which geographic regions rely most on the operation of the port, and where the benefits of trade through the port are dispersed.
Table 2.8: Origin and destination of containerised goods through the Port of Melbourne (by no. of journeys)
Region % of export journeys
% of import journeys
LGAs bordering the Port City of Melbourne Port Phillip Hobsons Bay Maribrynong Total
8.0 2.3
20.5 3.4
34.2
2.9 1.5
13.7 1.1
20.3
Balance of Greater Melbourne 26.3 67.7
Regional Victoria 31.2 4.3
Balance of Australia and elsewhere 8.3 8.8
TOTAL 100 100
Source: Sinclair Knight Merz, Melbourne Port Container Origin Destination Study, Final Report, March 2003 With regard to container exports, the SKM study indicates that: • a large portion of exports are sourced directly from regional Victoria (31.2%)
and elsewhere in Australia (8.3%), principally from NSW. Most of these exports are agricultural products or processed food, beverages and other commodities, including horticultural produce, dairy and grains. This reflects the trend towards the containerisation of agricultural commodities;
• the largest portion of exports are sourced from metropolitan Melbourne (a total of 60.5%). These represent a mix of manufactured goods and commodities. This figure does not, however, indicate that this proportion of goods was produced in Melbourne. Instead, while some of the goods in question originated from the metropolitan area, others may have been transported from elsewhere via logistics or storage facilities in Melbourne;

Port of Melbourne Economic Contribution Study 31 Background
• a large portion (around one third) of product origins identified in the SKM study were from the local government areas (LGAs) in close proximity to the port (Cities of Melbourne, Port Phillip, Hobsons Bay and Maribrynong). This reflects the importance of manufacturing and transport, distribution and logistics (TDL) industries around the port, particularly in Hobsons Bay and Maribrynong.
In terms of imports, the majority of imported goods (nearly 90%) were sent to destinations in metropolitan Melbourne. As noted earlier, many of these imports are either consumer goods or inputs for industrial and other purposes. The findings of the SKM study therefore indicate that: • many goods are destined either for logistics centres located on the fringes of
Melbourne (especially in the West and South east) for distribution to third parties. Most of these goods in this category are consumer imports;
• another large portion of imports represent inputs into production processes in Melbourne-based enterprises, especially manufacturing. In common with many TDL businesses, many of these enterprises are located in the West and Southeast of the metropolitan area; and
• a significant proportion of imports are consumed directly by the metropolitan market or in Melbourne’s hinterland in regional Victoria.

Port of Melbourne Economic Contribution Study 32
THIS PAGE HAS BEEN LEFT BLANK INTENTIONALLY

Port of Melbourne Economic Contribution Study 33 Trade and Shipping Projections
3
Trade and Shipping Projections

Port of Melbourne Economic Contribution Study 34 Trade and Shipping Projections
3.1 Overview The key inputs for the economic modelling in this Study include estimates of future shipping and trade movements through the Port of Melbourne. The forecasts used in the Study have been provided by the PoMC, and are based on the long-term growth trends for exports and imports passing through the Port of Melbourne, as well as long-terms trends in global shipping forecasts. These forecasts have been developed by the PoMC for planning purposes, and have been accepted by the Board and by its shareholder, the Victorian Government. The shipping and trade estimates have been developed for two scenarios. These are: • long-term shipping and trade patterns at the port if key infrastructure
investments (including the CDP) proceed; and
• long-term shipping and trade patterns at the Port of Melbourne if these investments do not proceed.
Please note that shipping forecasts are based on the size and carrying capacity of ships. Shipping forecasts have been provided for container goods, grain exports and the crude oil trade. The trade forecasts are in terms of the volume of goods transported through the Port of Melbourne, rather than value. Note that these are consistent with the Draft Port Development Plan which was released by the PoMC in August 2006. The key infrastructure investment considered under the two scenarios is the CDP.
CDP proceeding
Under this scenario, the CDP would be undertaken during the period covering 2006-2009. The CDP would influence shipping capacity in two ways: • it would enable ships with greater carrying capacities (and consequently,
deeper draughts) to navigate the shipping channels; and
• it would enable more ships of greater draught to use the shipping channels at full capacity than is currently the case.
Both of these factors would result in the average size of ships calling at the Port of Melbourne being larger than would otherwise be the case, and, consequently, have a positive impact on the average efficiency (i.e average cost) of shipping goods in and out of the port. These efficiencies would also depend on ongoing investment in berth and logistics facilities at the port, as well as increasing efficiencies in stevedoring and cargo movements at the port. It is worth noting that the port and related industries would take action to seek efficiency through various investments regardless of the CDP but that the CDP will enhance efficiency on top of these actions. That said, some activities at the port would not be affected by the CDP proceeding (these are listed in section 3.2.4). These sectors, which include naval operations, coastal shipping and vehicle shipping operations, use ships which are unaffected by existing draught restrictions, and are expected to unaffected in the future.
Port of Melbourne Economic Contribution Study 35 Trade and Shipping Projections
The modelling undertaken in this Study assumes that the Tasmanian trade will not be affected by the CDP. The cost and efficiency of shipping goods to and from Tasmania from the Port of Melbourne would be unaffected by the CDP. In reality, however, there could be gains for Tasmania from the CDP. If goods are sent to Melbourne for re-export there may be some price efficiencies that would accrue to Tasmanian producers who would benefit from lower international shipping costs from Melbourne. Similarly, Tasmanian consumers may benefit from lower costs to the international component of shipping imports to the State, even if the cost of the coastal trade is unaffected.
CDP not proceeding
Under this scenario, the CDP would not go ahead. The implications for shipping of this scenario are: • while the average capacity of ships entering Port Phillip Bay would continue
to grow, and would ultimately be constrained by the dimensions of the channel, any increase would be slower than under the CDP proceeding scenario;
• import and export competitiveness could be negatively effected compared to the CDP scenario as per unit costs would be higher; and
• an increasing proportion of ships would not be able to enter or leave Port Phillip Bay fully laden, because of the limits on draught imposed by the existing depth of the shipping channels.
The forecasts assume that, while this would have no impact on the volume of goods leaving or entering the port, it would have negative impact on the prices of transporting goods9. This is a conservative assumption, where the gains to be made as a result of the CDP accrue from efficiencies realised. Under this assumption, lower shipping costs are passed on to consumers in the form of lower prices for imported goods (or import competing goods produced locally). Similarly, because it is assumed that the prices for exports are fixed, any decrease in shipping costs would increase the returns to exporters.
9 Note that this is a conservative assumption. Other parties believe that, if the CDP does not go ahead, there will be significantly greater negative effects including trade diversion to other ports. The extent of such effects cannot be definitively estimated and hence are not modelled.
Port of Melbourne Economic Contribution Study 36 Trade and Shipping Projections
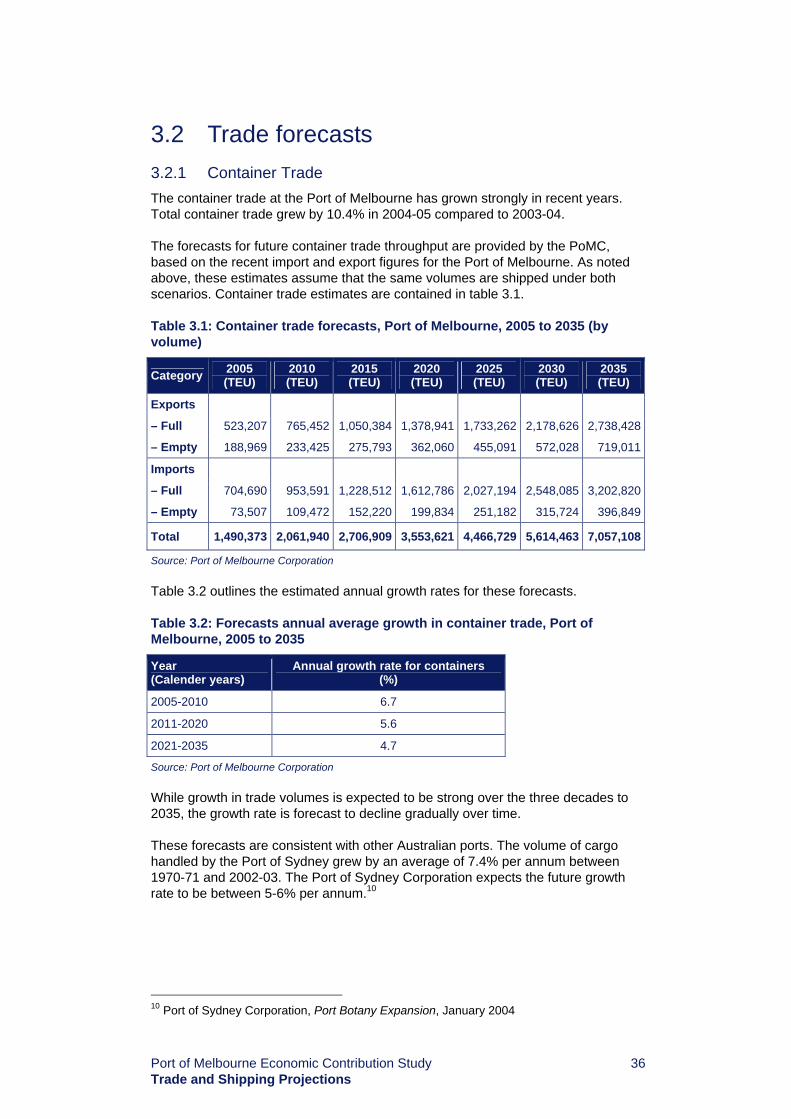
3.2 Trade forecasts 3.2.1 Container Trade The container trade at the Port of Melbourne has grown strongly in recent years. Total container trade grew by 10.4% in 2004-05 compared to 2003-04. The forecasts for future container trade throughput are provided by the PoMC, based on the recent import and export figures for the Port of Melbourne. As noted above, these estimates assume that the same volumes are shipped under both scenarios. Container trade estimates are contained in table 3.1.
Table 3.1: Container trade forecasts, Port of Melbourne, 2005 to 2035 (by volume)
Category 2005 (TEU)
2010 (TEU)
2015 (TEU)
2020 (TEU)
2025 (TEU)
2030 (TEU)
2035 (TEU)
Exports
– Full 523,207 765,452 1,050,384 1,378,941 1,733,262 2,178,626 2,738,428
– Empty 188,969 233,425 275,793 362,060 455,091 572,028 719,011
Imports
– Full 704,690 953,591 1,228,512 1,612,786 2,027,194 2,548,085 3,202,820
– Empty 73,507 109,472 152,220 199,834 251,182 315,724 396,849
Total 1,490,373 2,061,940 2,706,909 3,553,621 4,466,729 5,614,463 7,057,108
Source: Port of Melbourne Corporation Table 3.2 outlines the estimated annual growth rates for these forecasts.
Table 3.2: Forecasts annual average growth in container trade, Port of Melbourne, 2005 to 2035
Year (Calender years)
Annual growth rate for containers (%)
2005-2010 6.7
2011-2020 5.6
2021-2035 4.7
Source: Port of Melbourne Corporation While growth in trade volumes is expected to be strong over the three decades to 2035, the growth rate is forecast to decline gradually over time. These forecasts are consistent with other Australian ports. The volume of cargo handled by the Port of Sydney grew by an average of 7.4% per annum between 1970-71 and 2002-03. The Port of Sydney Corporation expects the future growth rate to be between 5-6% per annum.10
10 Port of Sydney Corporation, Port Botany Expansion, January 2004
Port of Melbourne Economic Contribution Study 37 Trade and Shipping Projections
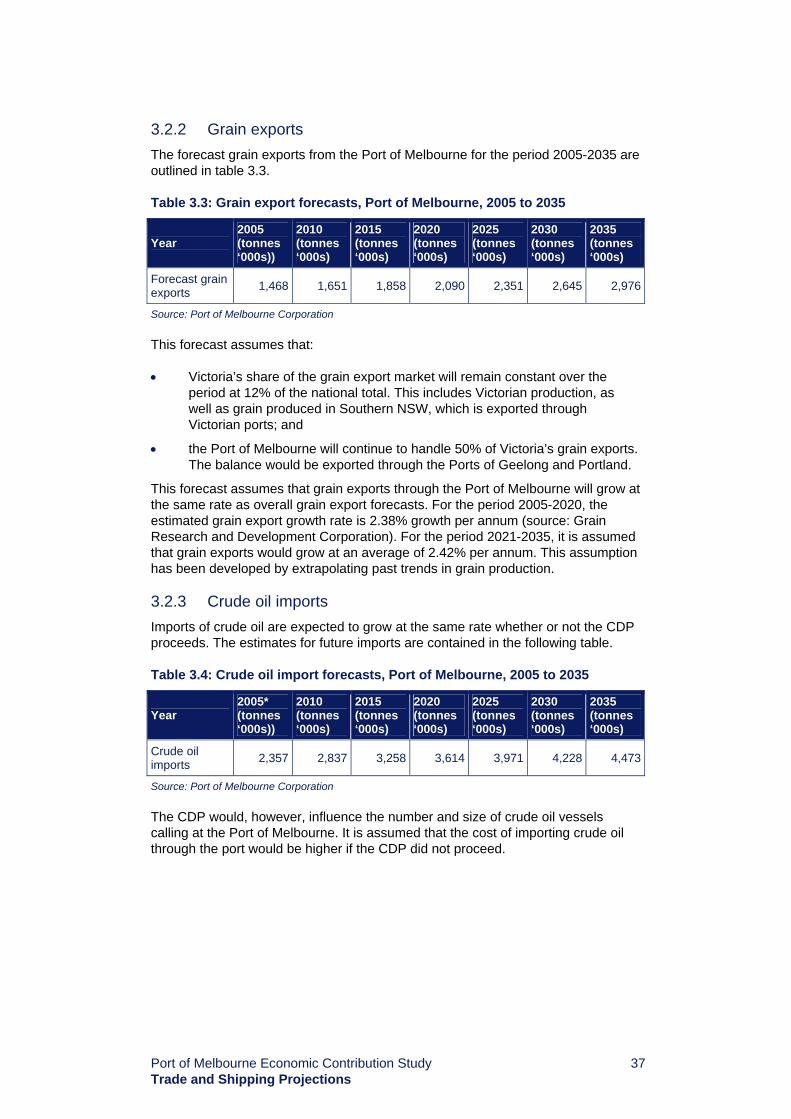
3.2.2 Grain exports The forecast grain exports from the Port of Melbourne for the period 2005-2035 are outlined in table 3.3.
Table 3.3: Grain export forecasts, Port of Melbourne, 2005 to 2035
Year 2005 (tonnes ‘000s))
2010 (tonnes ‘000s)
2015 (tonnes ‘000s)
2020 (tonnes ‘000s)
2025 (tonnes ‘000s)
2030 (tonnes ‘000s)
2035 (tonnes ‘000s)
Forecast grain exports 1,468 1,651 1,858 2,090 2,351 2,645 2,976
Source: Port of Melbourne Corporation This forecast assumes that: • Victoria’s share of the grain export market will remain constant over the
period at 12% of the national total. This includes Victorian production, as well as grain produced in Southern NSW, which is exported through Victorian ports; and
• the Port of Melbourne will continue to handle 50% of Victoria’s grain exports. The balance would be exported through the Ports of Geelong and Portland.
This forecast assumes that grain exports through the Port of Melbourne will grow at the same rate as overall grain export forecasts. For the period 2005-2020, the estimated grain export growth rate is 2.38% growth per annum (source: Grain Research and Development Corporation). For the period 2021-2035, it is assumed that grain exports would grow at an average of 2.42% per annum. This assumption has been developed by extrapolating past trends in grain production.
3.2.3 Crude oil imports Imports of crude oil are expected to grow at the same rate whether or not the CDP proceeds. The estimates for future imports are contained in the following table.
Table 3.4: Crude oil import forecasts, Port of Melbourne, 2005 to 2035
Year 2005* (tonnes ‘000s))
2010 (tonnes ‘000s)
2015 (tonnes ‘000s)
2020 (tonnes ‘000s)
2025 (tonnes ‘000s)
2030 (tonnes ‘000s)
2035 (tonnes ‘000s)
Crude oil imports 2,357 2,837 3,258 3,614 3,971 4,228 4,473
Source: Port of Melbourne Corporation The CDP would, however, influence the number and size of crude oil vessels calling at the Port of Melbourne. It is assumed that the cost of importing crude oil through the port would be higher if the CDP did not proceed.
Port of Melbourne Economic Contribution Study 38 Trade and Shipping Projections
3.2.4 Trade unaffected by channel deepening A number of major trades at the Port of Melbourne would not be affected by the CDP, as they are carried out in vessels which are not and are unlikely to be draught constrained. These include: • domestic and international cruise shipping;
• international car carriers;
• shipping services to Tasmania, New Zealand and the Pacific Islands;
• domestic carriers of bulk products, including cement, fertiliser and sugar; and
• naval operations.
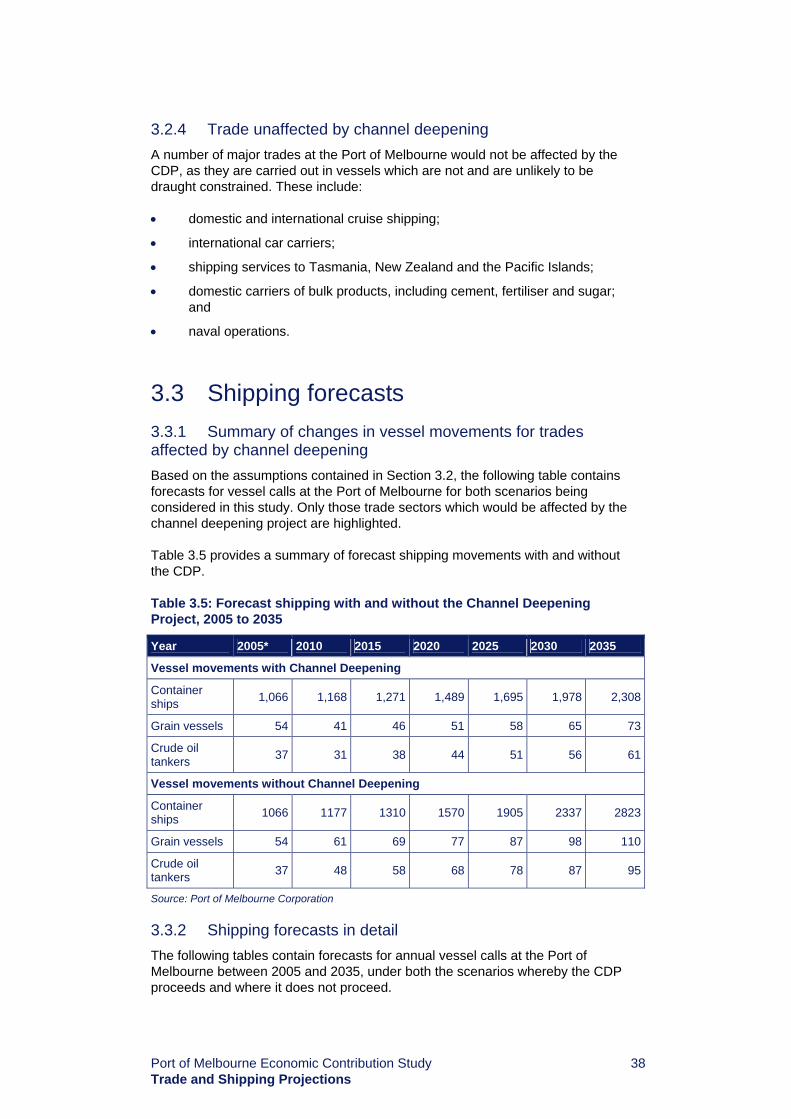
3.3 Shipping forecasts 3.3.1 Summary of changes in vessel movements for trades affected by channel deepening Based on the assumptions contained in Section 3.2, the following table contains forecasts for vessel calls at the Port of Melbourne for both scenarios being considered in this study. Only those trade sectors which would be affected by the channel deepening project are highlighted. Table 3.5 provides a summary of forecast shipping movements with and without the CDP.
Table 3.5: Forecast shipping with and without the Channel Deepening Project, 2005 to 2035
Source: Port of Melbourne Corporation 3.3.2 Shipping forecasts in detail The following tables contain forecasts for annual vessel calls at the Port of Melbourne between 2005 and 2035, under both the scenarios whereby the CDP proceeds and where it does not proceed.
Year 2005* 2010 2015 2020 2025 2030 2035
Vessel movements with Channel Deepening
Container ships 1,066 1,168 1,271 1,489 1,695 1,978 2,308
Grain vessels 54 41 46 51 58 65 73
Crude oil tankers 37 31 38 44 51 56 61
Vessel movements without Channel Deepening
Container ships 1066 1177 1310 1570 1905 2337 2823
Grain vessels 54 61 69 77 87 98 110
Crude oil tankers 37 48 58 68 78 87 95
Port of Melbourne Economic Contribution Study 39 Trade and Shipping Projections
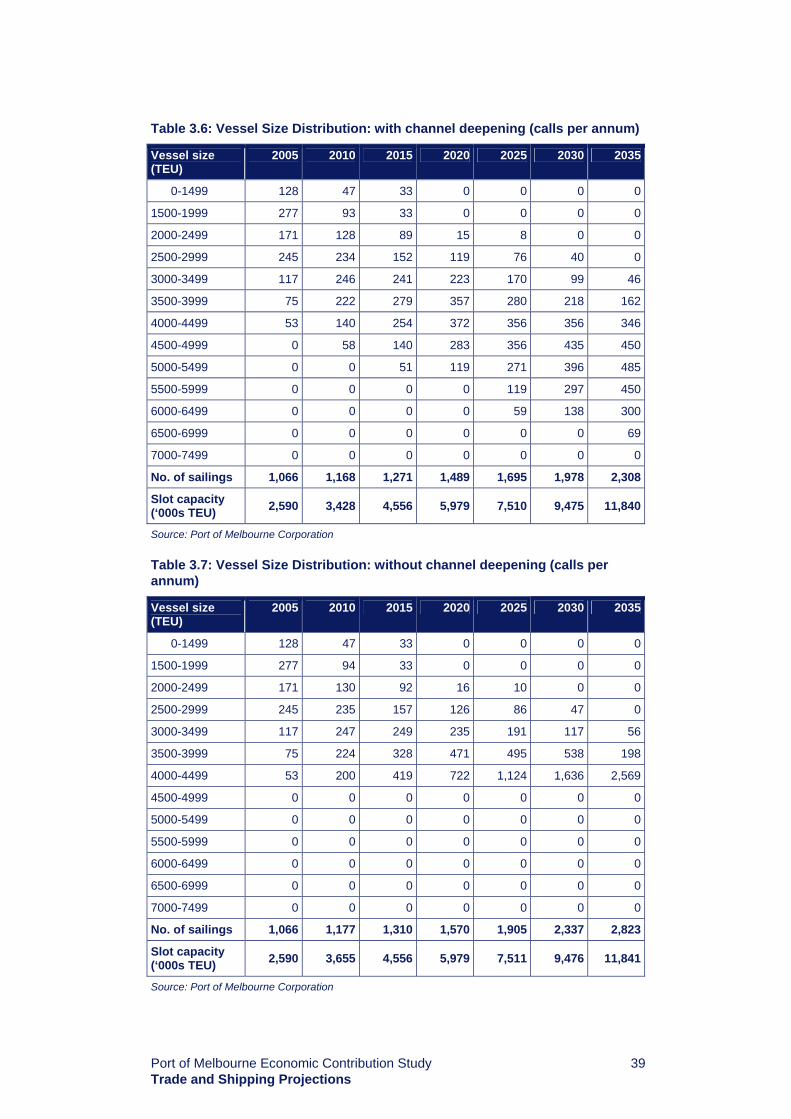
Table 3.6: Vessel Size Distribution: with channel deepening (calls per annum)
Vessel size (TEU)
2005 2010 2015 2020 2025 2030 2035
0-1499 128 47 33 0 0 0 0
1500-1999 277 93 33 0 0 0 0
2000-2499 171 128 89 15 8 0 0
2500-2999 245 234 152 119 76 40 0
3000-3499 117 246 241 223 170 99 46
3500-3999 75 222 279 357 280 218 162
4000-4499 53 140 254 372 356 356 346
4500-4999 0 58 140 283 356 435 450
5000-5499 0 0 51 119 271 396 485
5500-5999 0 0 0 0 119 297 450
6000-6499 0 0 0 0 59 138 300
6500-6999 0 0 0 0 0 0 69
7000-7499 0 0 0 0 0 0 0
No. of sailings 1,066 1,168 1,271 1,489 1,695 1,978 2,308
Slot capacity (‘000s TEU) 2,590 3,428 4,556 5,979 7,510 9,475 11,840
Source: Port of Melbourne Corporation
Table 3.7: Vessel Size Distribution: without channel deepening (calls per annum)
Vessel size (TEU)
2005 2010 2015 2020 2025 2030 2035
0-1499 128 47 33 0 0 0 0
1500-1999 277 94 33 0 0 0 0
2000-2499 171 130 92 16 10 0 0
2500-2999 245 235 157 126 86 47 0
3000-3499 117 247 249 235 191 117 56
3500-3999 75 224 328 471 495 538 198
4000-4499 53 200 419 722 1,124 1,636 2,569
4500-4999 0 0 0 0 0 0 0
5000-5499 0 0 0 0 0 0 0
5500-5999 0 0 0 0 0 0 0
6000-6499 0 0 0 0 0 0 0
6500-6999 0 0 0 0 0 0 0
7000-7499 0 0 0 0 0 0 0
No. of sailings 1,066 1,177 1,310 1,570 1,905 2,337 2,823
Slot capacity (‘000s TEU) 2,590 3,655 4,556 5,979 7,511 9,476 11,841
Source: Port of Melbourne Corporation

Port of Melbourne Economic Contribution Study 40 Trade and Shipping Projections
These forecasts assume that the slot capacity (carrying capacity available) will be the same under both scenarios. The average size of vessels calling at Melbourne would be larger if channel deepening proceeds. More vessels (with smaller average capacities) would call at the port if the CDP did not go ahead.
3.4 Shipping cost forecasts The PoMC has estimated the difference in shipping costs to 2035 with and without the CDP proceeding. The difference in costs would result from the need for fewer ships (but, on average, larger ships) to call at the port if the CDP went ahead. Larger ships, with greater carrying capacities, are able to transport goods at a lower cost on average than smaller ships. The forecasts estimate that the difference in total shipping costs at the port between the CDP proceeding and not proceeding scenarios would be $582.2 million per annum by 2035. A possible scenario (that has not been modelled here) is that larger ships may call at Melbourne in the future without the CDP proceeding. However, these ships would need to operate at less than full capacity (i.e. not fully laden). The result would be the same in terms of economic outcomes, with efficiencies of larger ships not being fully realised, and additional costs imposed on exporters and importers than would otherwise be the case.

Port of Melbourne Economic Contribution Study 41 Current economic impact of the port: input-output analysis
4
Current economic impact of the port: input-output analysis

Port of Melbourne Economic Contribution Study 42 Current economic impact of the port: input-output analysis
4.1 Methodology The economic value of the Port of Melbourne provides a basis on which to understand the significance of the port and its operations to Victoria and Australia. This value is estimated using an input-output model. Under an input-output framework, the economic impact of a project, event or activity is estimated using a series of integrated input-output multipliers which trace the relationship between the transactions of various industries in the economy. Multipliers measure the direct and flow-on effects of “shocks” to the economy, resulting from changes in demand for the output of specific sectors. They summarise, in a quantitative sense, all the economic responses, both direct and indirect, to a change in the economic system. Relevant multipliers used in the assessment were obtained from the Australian Bureau of Statistics (ABS). Three outcomes are provided by the input-output analysis. These are: • the total output multiplier, which provides a measure of the total economic
activity created directly and indirectly from port related activities;
• a value added multiplier, which provides a measure of the net increase in the economic activity resulting directly and indirectly in response to a change in final demand (i.e. the increase in economic activity less the cost of inputs); and
• the employment multiplier, which relates to the additional employment generated from an event or project. The employment multiplier used in this analysis calculates additional full time equivalent (FTE) positions generated by the Port of Melbourne.
The total output and value added multiplier units are represented in dollar terms. For employment multipliers, units are persons employed per million dollars of final demand. Employment multipliers have been adjusted to account for inflation since they were released in 1996-97. The employment multipliers used in this analysis were adjusted for the movement in the Australian All Groups Consumers Price Index (CPI) from June 1997.
4.1.1 Bureau of Transport and Regional Economics General Framework for Port Impact Studies The Bureau of Transport and Regional Economics’ (BTRE) report “Regional Impacts of Ports” outlines a general framework for undertaking port impact studies in Australia. The approach emphasises the importance of clearly defining the port industries and port-related activities to ensure that all costs are captured in the analysis and an accurate valuation is performed.

Port of Melbourne Economic Contribution Study 43 Current economic impact of the port: input-output analysis
BTRE defines port industries as: All activities that are required for the movement of ships and their cargoes and passengers through the port. Ships comprise commercial trading vessels and passenger vessels (excluding intra-port ferries), which are the primary focus of Australian ports. Naval ships, fishing vessels and recreational boating activities are excluded from the general definition. This definition does not include either the economic benefits of exports and imports handled at the port or the impact of industrial activities in the port area. The following table outlines the port-related activities covered by the general definition. This list can be modified for individual ports depending on the extent of certain activities, eg expenditure by cruise ship passengers.
Table 4.1: Bureau of Transport and Regional Economics – definition of port activities
Activities / components
Port authority / corporation operations
• Planning, co-ordination and promotion • Land and property management • Safety and emergency response • Shipping channels and navigation aids • Port authority wharves, berths, jetties, etc a
Ship operations • Shipping lines / agents • Pilotage • Towage • Line boats • Mooring / unmooring • Bunkering • Ship supplies b • Ship repairs and maintenance c • Container repairs d • Container maintenance and servicing
Ship loading and unloading • Private wharves, berths, jetties, etc a • Container and break bulk stevedoring • Livestock stevedoring • Bulk cargo loading / unloading
Cargo services • Customs brokers • Freight forwarders • Container packing / unpacking • Cargo surveyors • Wool dumping • Fumigation
Land transport and storage • Road transport • Rail transport • Transfer between road / rail and storage facilities • Storage

Port of Melbourne Economic Contribution Study 44 Current economic impact of the port: input-output analysis
Activities / components
Government Agencies • Customs • Quarantine • Ship safety • Port safety • Environmental management • Port policy administration
a Operation and maintenance b Sometimes called chandlering or providoring. Excludes supplies to commercial fishing and
recreational boating. c Only for vessels in the port for the purpose of bringing in or taking out cargo or passengersd Includes container parks / depots e Involves movement of cargo within the port, movement of cargo between the port and
closest inland points (e.g. warehouses, bonded storage, processing plant, other storage facilities), and port-related storage.
Source: Bureau of Transport and Regional Economics, “Regional Impact of Ports”, Report 101 The research and consultation conducted as part of this Study have identified data on the revenue and costs associated with shipping through the Port of Melbourne.
4.1.2 Methodological approach This section sets out the specific methodological approach used to estimate the economic impact of the Port of Melbourne. It is consistent with the BTRE methodology in that it only considers port related activities.
Stage 1: Port of Melbourne Corporation
Stage 1 involved an analysis of the PoMC’s expenditure and its impact on Victoria. This was completed by using operating and capital expenditure for the financial year 2004-05. The forecast capital expenditure and past capital expenditure is variable from year to year, reflecting the nature of the investment program, not just for the PoMC, but for all port authorities. Investment in infrastructure for ports tends to be “lumpy”, i.e. each individual investment is usually significant and concentrated over a relatively short time frame. In addition, because port infrastructure has a lifespan of decades, re-investment in infrastructure does not take place very often. This creates some methodological challenges when modelling the average capital expenditure in one year. To overcome this problem a ten year structural average was calculated. This approached smoothes the capital expenditure and calculates figures based on an average of the past five years and forecasts for the next five years.
Stage 2: Port-related activities
The second stage of this methodology consists of estimations of the impacts of the businesses that support the Port of Melbourne. This consists of estimating the expenditures required for the transportation of goods through the Port of Melbourne. The service fees charged by the providers incorporate expenses incurred by the service providers.

Port of Melbourne Economic Contribution Study 45 Current economic impact of the port: input-output analysis
Estimates of costs ($/TEU or $/tonne) were obtained for the following services provided at the Port of Melbourne: • ship handling costs: this includes tonnage, pilotage, towage,
mooring/unmooring and stevedoring costs (wharfage and channel fees are excluded from this estimate as they are effectively captured in the PoMC’s operating expenditure included in stage 1);
• road and rail transport charges: this have been estimated on the basis of road transport costs published by the BTRE. For the purposes of the Study, we have assumed a parity between road and rail transport costs. Note that road transport accounts for the majority of goods shipped in and out of the port precinct; and
• customs broker’s fees: fees associated with the importing and exporting of commodities through the port.
Cost estimates are calculated to establish the dollars per TEU or the dollars per tonne of imports or exports loaded or unloaded at the port. Estimates are then applied to the following five categories to determine the overall cost per year to the shipping industry at the Port of Melbourne: • containers;
• empty containers;
• liquid bulk;
• break bulk; and
• dry bulk.
The total costs of port services are used with the multipliers to calculate the total economic output, value added and employment created. Combined with the PoMC’s economic impact it is possible to gain an understanding of the economic value of the port.
Capital expenditure at the Port of Melbourne
The modelling in this report is based on data provided by the Department of Treasury and Finance. As the data provides quite a detailed picture of commercial operations and investments at the port, it will not be reproduced here. The data includes ongoing maintenance requirements for existing land side and channel assets, as well as improvements to the port facilities. This amount includes funding for maintenance dredging of the shipping channels (which generally takes place every five years) and maintenance of berth pockets (which occurs annually). This represents normal ongoing maintenance to the channel, and should not be confused with the CDP.
Shipping and trade forecasts
The most recent container trade forecasts are provided by the PoMC, including estimates of trade and shipping volumes and price.
Port of Melbourne Economic Contribution Study 46 Current economic impact of the port: input-output analysis
4.2 Input-output framework 4.2.1 Multipliers Multipliers were estimated for the port as a whole and port activities disaggregated on the basis of function such as administration and ship handling.
Table 4.2: Input-output multiplier components
Multiplier Component Description
Direct (initial) effects The stimulus for the impact analysis – normally assumed to be a dollar change in sales to final demand
Flow-on effects: Production-induced effects
• First round effects Refers to the purchase of inputs required from other sectors in the economy in order to produce the additional output
• Industrial-support effects Refer to second, third and subsequent-round industrial flow-on effects triggered by the purchases in the first round
Total effect (Type I multiplier) Direct + Production induced effects
Direct (or initial) multiplier Direct effects
Flow-on Production induced effects
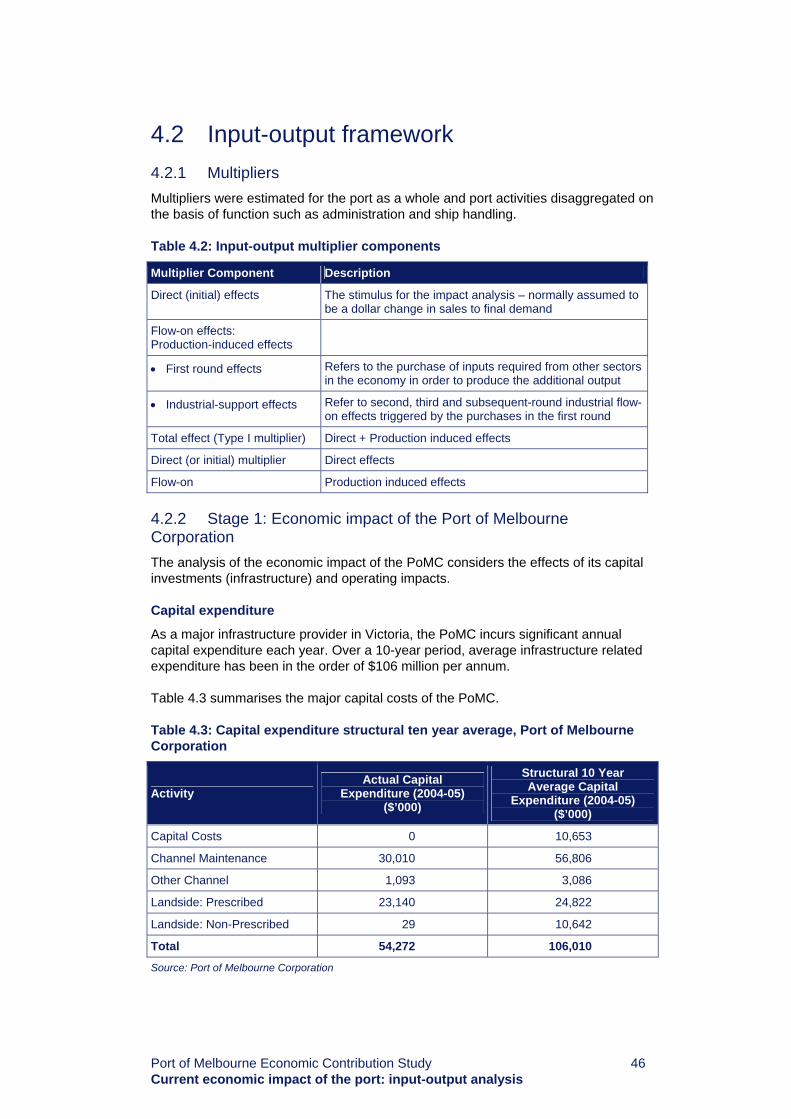
4.2.2 Stage 1: Economic impact of the Port of Melbourne Corporation The analysis of the economic impact of the PoMC considers the effects of its capital investments (infrastructure) and operating impacts.
Capital expenditure
As a major infrastructure provider in Victoria, the PoMC incurs significant annual capital expenditure each year. Over a 10-year period, average infrastructure related expenditure has been in the order of $106 million per annum. Table 4.3 summarises the major capital costs of the PoMC.
Table 4.3: Capital expenditure structural ten year average, Port of Melbourne Corporation
Activity Actual Capital
Expenditure (2004-05) ($’000)
Structural 10 Year Average Capital
Expenditure (2004-05) ($’000)
Capital Costs 0 10,653
Channel Maintenance 30,010 56,806
Other Channel 1,093 3,086
Landside: Prescribed 23,140 24,822
Landside: Non-Prescribed 29 10,642
Total 54,272 106,010
Source: Port of Melbourne Corporation
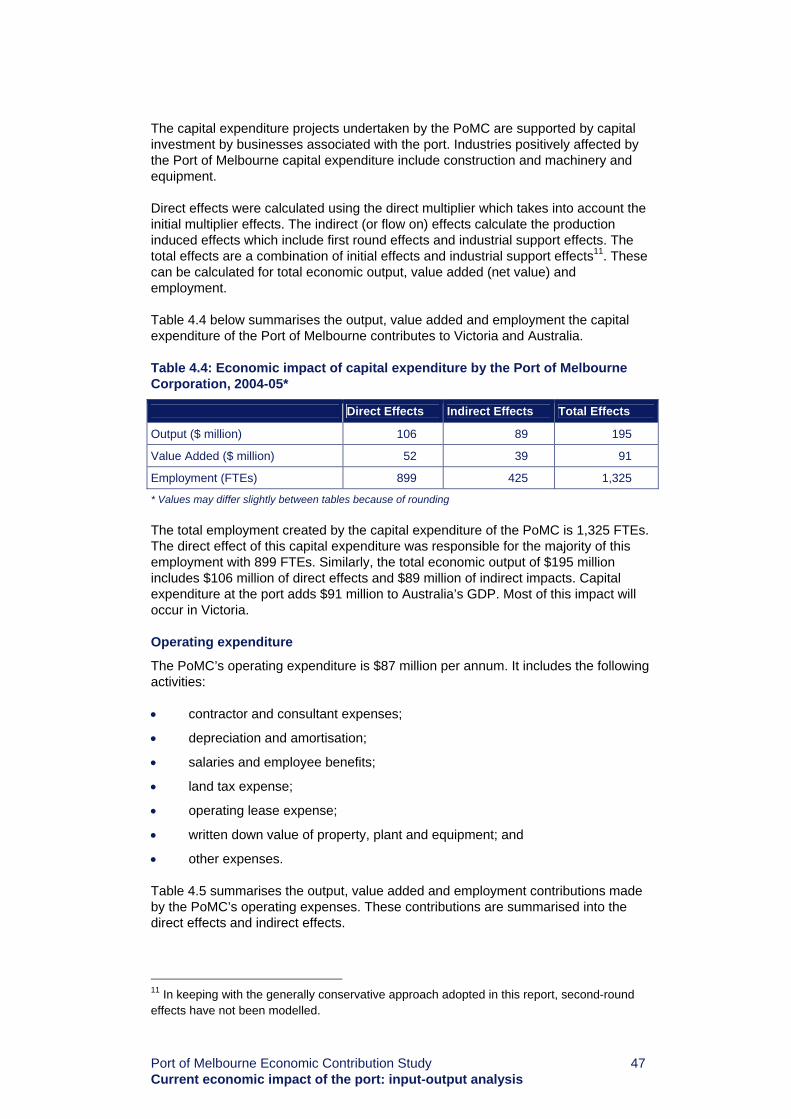
Port of Melbourne Economic Contribution Study 47 Current economic impact of the port: input-output analysis
The capital expenditure projects undertaken by the PoMC are supported by capital investment by businesses associated with the port. Industries positively affected by the Port of Melbourne capital expenditure include construction and machinery and equipment. Direct effects were calculated using the direct multiplier which takes into account the initial multiplier effects. The indirect (or flow on) effects calculate the production induced effects which include first round effects and industrial support effects. The total effects are a combination of initial effects and industrial support effects11. These can be calculated for total economic output, value added (net value) and employment. Table 4.4 below summarises the output, value added and employment the capital expenditure of the Port of Melbourne contributes to Victoria and Australia.
Table 4.4: Economic impact of capital expenditure by the Port of Melbourne Corporation, 2004-05*
Direct Effects Indirect Effects Total Effects
Output ($ million) 106 89 195
Value Added ($ million) 52 39 91
Employment (FTEs) 899 425 1,325
* Values may differ slightly between tables because of rounding The total employment created by the capital expenditure of the PoMC is 1,325 FTEs. The direct effect of this capital expenditure was responsible for the majority of this employment with 899 FTEs. Similarly, the total economic output of $195 million includes $106 million of direct effects and $89 million of indirect impacts. Capital expenditure at the port adds $91 million to Australia’s GDP. Most of this impact will occur in Victoria.
Operating expenditure
The PoMC’s operating expenditure is $87 million per annum. It includes the following activities: • contractor and consultant expenses;
• depreciation and amortisation;
• salaries and employee benefits;
• land tax expense;
• operating lease expense;
• written down value of property, plant and equipment; and
• other expenses.
Table 4.5 summarises the output, value added and employment contributions made by the PoMC’s operating expenses. These contributions are summarised into the direct effects and indirect effects.
11 In keeping with the generally conservative approach adopted in this report, second-round effects have not been modelled.

Port of Melbourne Economic Contribution Study 48 Current economic impact of the port: input-output analysis
Table 4.5: Economic impact of operating expenditure by the Port of Melbourne Corporation, 2004-05*
Direct Effects Indirect Effects Total Effects
Output ($ million) 88 77 165
Value Added ($ million) 41 39 79
Employment (FTEs) 683 415 1,098
* Values may differ slightly between tables because of rounding The annual operating expenses of the PoMC contributed a total of $79 million dollars of value to and created 1,098 FTEs. Indirect impacts provided almost the same value added and employment impact, indicating a strong flow on effect from the PoMC operating expenses.
Total economic impact of the Port of Melbourne Corporation
The total economic impact created by the PoMC is calculated by adding the value of the capital expenditure and the value of the operating expenditure. Table 4.6 shows that the overall value of these activities is $170 million.
Table 4.6: Total economic impact of the Port of Melbourne Corporation, 2004-05*
Direct Effects Indirect Effects Total Effects
Output ($ million) 194 166 359
Value Added ($ million) 93 78 170
Employment (FTEs) 1,582 840 2,423
* Values may differ slightly between tables because of rounding 4.2.3 Stage 2: Economic impact of port-related businesses
Capital expenditure
The capital expenditure undertaken by the businesses at the port includes the upgrading of port infrastructure involved in loading and unloading ships. Infrastructure is upgraded when required which means that a ten year average is the most accurate way of measuring capital expenditure. On average, infrastructure related expenditure by port related businesses has been around $23 million per annum. Table 4.7 shows the impact this capital expenditure. This data has been provided by the PoMC.
Table 4.7: Economic impact of capital expenditure by port related businesses, 2004-05*
Direct Effects Indirect Effects Total Effects
Output ($ million) 23 19 41
Value Added ($ million) 11 8 19
Employment (FTEs) 183 90 273
* Values may differ slightly between tables because of rounding

Port of Melbourne Economic Contribution Study 49 Current economic impact of the port: input-output analysis
Operating expenditure
The activities provided by port related businesses include: • pilotage: for the majority of ships it is compulsory that an experienced pilot
steer the ship through the heads and into the Port of Melbourne;
• towage: many of the larger ships need to be towed into dock for safety reasons;
• tonnage: each ship is charged a certain amount to dock to be loaded and unloaded. The cost varies depending on the size and weight of the ship;
• mooring/unmooring: the process of securing a ship to the dock to be unloaded and safely releasing a ship;
• stevedoring: the process of loading and unloading ships;
• Pre-Delivery Inspections (PDIs) and other activities relating to imported vehicles: imported vehicles are driven off car carriers and parked in large parking areas for pre-delivery inspection. Other activities that may be undertaken in the port precinct include de-waxing and cleaning. This process is undertaken prior to vehicles being distributed to dealers;
• customs brokers fees: the charge for international cargo; and
• road and rail transport charges: the cost associated with moving cargos around the port.
The activities of businesses situated at the port providing services to ships have a greater economic impact that those of the PoMC. Table 4.8 shows the value generated by port-related activities. The industries that were strongly affected include: • business services;
• accounting and legal services;
• government administration;
• construction; and
• maintenance and equipment.
These industries were the recipients of the economic activity generated by the port. Table 4.8 outlines the economic impacts of operating expenditure from port related businesses.
Table 4.8: Economic impact of operating expenditure by port related businesses, 2004-05*
Direct Effects Indirect Effects Total Effects
Output ($ million) 1,122 978 2,100
Value Added ($ million) 492 459 951
Employment (FTEs) 5,798 5,255 11,053
* Values may differ slightly between tables because of rounding

Port of Melbourne Economic Contribution Study 50 Current economic impact of the port: input-output analysis
Total economic impact of port related businesses
Total economic impact created by the businesses operating at the Port of Melbourne is calculated by adding the value of capital expenditure and operating expenditure. Table 4.9 shows the total economic impact of port related businesses.
Table 4.9: Total economic impact of port related businesses, 2004-05*
Direct Effects Indirect Effects Total Effects
Output ($ million) 1,144 997 2,141
Value Added ($ million) 503 467 970
Employment (FTEs) 5,981 5,345 11,326
* Values may differ slightly between tables because of rounding These impacts represent the bulk of the economic impacts of the port, with output of $2.141 billion generated, and 11,326 FTEs created. 4.2.4 Total economic value of the Port of Melbourne Activity at the Port of Melbourne generated a total economic impact of $2.501 billion in output in 2004-05. Value added to Australia equalled $1.1 billion and port activities supported 13,748 FTEs. The results of this analysis are summarised in table 4.10. Please note that, while this model has not differentiated between the economic impacts for Victoria and for Australia, most of the impacts would accrue to Victoria.
Table 4.10: Total economic value of the Port of Melbourne, 2004-05*
Direct Effects Indirect Effects Total Effects
Output ($ million) 1,338 1,163 2,501
Value Added ($ million) 596 545 1,140
Employment (FTEs) 7,563 6,185 13,748
* Values may differ slightly between tables because of rounding There were 3,411 ship visits to the port in 2004-05 by commercial vessels. The results of this analysis indicate that, on average, each ship call at the Port of Melbourne involved the following impact on the economy: • $733,128 of output;
• $334,332 of value added; and
• four FTEs for one year.

Port of Melbourne Economic Contribution Study 51 Economic impact of infrastructure projects
5
Economic impact of infrastructure projects

Port of Melbourne Economic Contribution Study 52 Economic impact of infrastructure projects
5.1 Measuring the economic impact of Infrastructure Projects One of the key objectives of this Study is to assess the economic impact of infrastructure projects within and around the port precinct, including the CDP. To determine the net economic benefit that the CDP could bring to Victoria and Australia, modelling was undertaken by the Centre of Policy Studies (CoPs) at Monash University. As noted in section 3 of this Study, PwC has not created new data regarding the likely trade volumes with and without the CDP. This data has been provided by the PoMC and other sources, and used by Monash to determine the impacts of infrastructure projects. CoPs utilised the TERM (The Enormous Regional Model) to model the impacts of the CDP. TERM is a dynamic, multi-regional Computable General Equilibrium model of Australia which has the capacity to distinguish 167 sectors and differentiate 58 different regions across Australia. CoPS used TERM to compare models of the Victorian and Australian economies for the two scenarios: • CDP proceeding; and
• CDP not proceeding.
The CoPs model used the savings in shipping costs created by the channel deepening project and calculated percentage changes to current forecasts in employment, output and GDP. Employment has been measured in full time equivalent jobs (FTE) whilst output, national welfare and GDP have been calculated using discounted net present value. The key findings are summarised in the section below.
5.2 Results of CoPS modelling The details of the CoPS modelling are provided in Appendix A with some of the key findings summarised below. It is important to note that the CoPS modelling only considers the impact proceeding and not proceeding with the CDP. All other infrastructure projects are assumed to go ahead under both scenarios, and are accounted for in both cases. The CoPS modelling was initially undertaken for the period 2005-2027. Any results beyond this period are difficult to predict as the model relies increasingly on straight line predictions and less on behavioural aspects, decreasing its reliability. For this reason, most of the results presented outline benefits to 2027. We have, however, included overall net welfare calculations to 2035.

Port of Melbourne Economic Contribution Study 53 Economic impact of infrastructure projects
Over the next 22 years, the CDP will generate $1.7 billion in economic benefits to Australia, 80% of which would accrue to Victoria. In particular, some of the key impacts of the CDP are: • an overall national welfare gain from the CDP in discounted net present
value (NPV) terms of $1.7 billion (i.e. increase in aggregate net consumption and investment);
• an increase in employment compared to the base case of the CDP not proceeding;
• positive effects on aggregate consumption and, in the long run, on investment;
• additional investment in regional Victoria from 2009. The CDP would provide economic benefits to Melbourne from the beginning of the project (assumed start in 2006);
• an overlap of the construction and operational phases of the CDP. The capital cost of the CDP peaks in 2009 when investment amounts to $316 million; and
• savings in shipping costs associated with larger ships being able to access the Port of Melbourne would commence in 2009. The initial savings will be approximately $43 million per annum which will steadily rise over succeeding years to $87 million in 2015, and $582 million by 2035.
For the period 2005-2035, the estimated net welfare benefit of the CDP is $2.2 billion. The CoPS model only measures the economic impacts of the CDP for Australia and Victoria. While it assumes that there will be benefits for the rest of the world arising from the CDP, these have not been modelled or quantified.
5.2.1 The Labour Market Employment in Victoria will be positively influenced by the CDP with increases in FTE positions in regional Victoria and Melbourne. The largest impact on Melbourne’s employment occurs during the construction phase of the CDP with an employment peak in 2009 of over 2,200 jobs above the forecast number. This employment impact will decrease in 2010 to approximately 700 jobs and continue to reduce until 2014.

Port of Melbourne Economic Contribution Study 54 Economic impact of infrastructure projects
Figure 5.1: Change in employment for Victoria, Regional Victoria and Melbourne
-500
0
500
1,000
1,500
2,000
2,500
2006 2007 2008 2009 2010 2011 2012 2013 2014 2015 2016 2017 2018 2019 2020 2021 2022 2023 2024 2025 2026 2027
Cha
nge
in E
mpl
oym
ent
Change in Melb Employ Change in Vic Employ Change in Regional Employ The increase in employment during the CDP corresponds to employment created through: • the employment of Victorians to carry out the dredging process; and
• employment of support vessels and other services before, during and after the project.
In the short term, this employment effect leads to a small increase in real wages, which in turn, will lead to a gradual decrease in employment over time. After 2014, a stabilisation of real wages combined with the positive impacts of lower costs of shipping will have a net positive impact on employment. This will lead to a relatively stable prediction of approximately 300 FTEs above non-CDP forecast values. It should be noted that the majority of capital expenditure will be spent on transporting and using foreign equipment. This means that a large proportion of the capital expenditure will be spent off-shore and not directly benefit Victoria or the rest of Australia. The long term employment impact will occur mostly in Melbourne. Many of the new jobs may be created in port services and transport and logistics, which will be concentrated in the metropolitan area. Long term employment effects in regional Victoria will be less important than in Melbourne. This is because the major benefit associated with the CDP is the reduction in shipping costs which will not have a significant impact on regional employment. This overall increase in jobs across Victoria will cause employment in the rest of Australia to decrease slightly compared to the current forecast.

Port of Melbourne Economic Contribution Study 55 Economic impact of infrastructure projects
5.2.2 Aggregate consumption and National Welfare Overall consumption and investment will increase because of the CDP. Consumption is the measure used as the economic benefit to Victoria and the rest of Australia and is referred to as the welfare measure. The discounted NPV of aggregate consumption from forecast is the measure of welfare. Disposable income in each region is calculated net of interest payments to foreigners, while government consumption is assumed to be exogenous, leaving aggregate consumption (which is linked to disposable income via the consumption function) as a measure of welfare. The discounted net present value of the welfare gain to Australia from the CDP until 2027 is $1.7 billion. 80% of this benefit would accrue to Victoria, with the balance accruing to the rest of Australia. During the dredging project, aggregate consumption in Victoria increases to approximately $350 million above current forecast. Most of this consumption accrues to Melbourne, as this is where the majority of employment will be generated. After the completion of the CDP, consumption benefits in Melbourne begin to decrease while those in regional Victoria begin to expand significantly. When cost savings resulting from the CDP are realised from 2009, regional areas will experience aggregate consumption and investment which is slightly above the scenario without the CDP. This is a result of lower port costs which will increase the rate of return in a number of sectors across the State, thereby inducing additional investment. Aggregate consumption benefits begin to grow again in Melbourne after 2014, in line with increasing employment. By 2026, the total additional consumption benefit from the CDP in Melbourne will reach over $250 million per annum. Combined with the estimated benefits to regional Victoria of over $150 million per annum, the total net economic benefit to Victoria of the CDP will reach $418 million by 2026.
Figure 5.2: Change in National Welfare for Victoria, Regional Victoria and Melbourne
-50
0
50
100
150
200
250
300
350
2006 2007 2008 2009 2010 2011 2012 2013 2014 2015 2016 2017 2018 2019 2020 2021 2022 2023 2024 2025 2026
Cha
nge
in H
ouse
hold
Con
sum
ptio
n ($
m)
Change in MelbConsumption Change in Regional Consumption Change in Vict Consumption

Port of Melbourne Economic Contribution Study 56 Economic impact of infrastructure projects
Beyond 2027, the model relies on a straight line projection rather than behavioural details within the model. A straight line projection has been performed to estimate the benefit associated with the CDP until 2035. This estimates the additional benefit generated between 2027 and 2035 is approximately $500 million which means the total economic benefit for Victoria and Australia for the next 30 years equals $2.2 billion. The straight line projection has been used beyond 2027 rather than, say, a trend line, in keeping with our overriding principle of conservatism adopted in this project. If a trend line had been applied, it would have made little material difference to the modelling outcomes as the flow of benefits that far into the future (however considerable they may be) would be heavily discounted and contribute little to the reported total.
5.2.3 Income composition in each region GDP can be considered in terms of income and expenditure. The income side of GDP comprises several components including capital stocks, employment and real wages. As discussed previously, employment returns to forecast levels once the CDP is completed. However, capital stocks continue to increase after the completion of the project in 2009. Melbourne’s capital stocks experience the greatest impact and start to rise above forecast in 2007. Employment returns to forecast levels after 2011, although capital stocks would continue to grow faster than forecast. This trend can be explained as follows: • at the national level, rates of return on capital adjust back to forecast levels
in the long run, while in the labour market, national employment returns to forecast. That is, there is a quantity adjustment in the capital market and a price adjustment in the labour market in the long run;
• cost savings in Melbourne’s port services should therefore translate, at the national level, to a higher aggregate capital stock and, with higher capital-to-labour ratios, higher real wages.
The proportional increase in capital stocks is larger in Melbourne than other regions, reflecting the direct impact of the project. Capital stocks in Barwon, the Northern and Western Victoria all eventually increase relative to forecast.
5.2.4 Regional industry impacts For Australia as a whole, the model results find that the main industries that receive immediate beneficiaries from the Project are the manufacturing, trade and construction industries. In the longer term agricultural industries and providers of services to the agricultural industries also benefit from the project. However, the impact of the CDP would be felt differently, not just in Melbourne compared to regional Victoria, but also between each of the regions. In Melbourne, the construction has a short term impact on construction output, which rises relative to forecast until 2010 (and thereafter shifts back to forecast), and outputs of water transport and services to transport increase from 2009, reflecting productivity gains from the CDP. Output of petroleum products also rises relative to forecast.

Port of Melbourne Economic Contribution Study 57 Economic impact of infrastructure projects
In regional Victoria, construction output rises relative to forecast after 2009 once gains from the reduced cost of shipping goods through the Port of Melbourne begin to be realised. The effects in the various regions will be different as result of factors such as the type of industry make-up, destination of goods and access to different ports. Industry in all regions will receive a boost from the CDP but it will not be uniform. In Gippsland, for instance, there will be a smaller positive impact from the CDP than in other regions, as more of its produce is shipped through ports other than the Port of Melbourne (the cost competitiveness of Gippsland may therefore decrease slightly compared to other regions which depend on the Port of Melbourne). Mining in Gippsland, which consists mainly of oil and gas, is import competing and would lose competitiveness slightly against imports following the completion of the CDP. However, the losses in the Gippsland region are quite small relative to forecast, with neither mining nor broadacre crop production decreasing significantly (around 0.1% compared to forecast. However, other regional areas that depend on the Port of Melbourne will experience economic growth once the cost savings of the CDP have been realised post 2009. Regions including Ovens-Murray, Loddon, Goulburn and Mallee will experience growth in industries such as construction, new dwellings, communication services and trade as a result of the CDP. This is because lower port costs in Melbourne raise the rates of return in a number of sectors across the state, thereby inducing additional investment.
5.2.5 Total GDP Welfare gains are the measure used to evaluate the benefit to Victoria from the CDP. Total GDP is the overall gain from the CDP which incorporates measures such as aggregate consumption, aggregate investment, Government investment, capital stocks and national and international exports and imports. When analysing the total GDP it becomes clear that the greatest impact occurs in Melbourne with significantly less impacts in regional Victoria. After peaking in 2009, due mainly to the effects of construction, the difference between the CDP and non-CDP forecasts drops to approximately $200 million. Regional GDP is affected most strongly between 2010 and 2020 when cost savings have been realised and aggregate consumption and investment in regional Victoria grows. During this time regional GDP increases to approximately $50 million above current forecasts before returning to the non-CDP forecast values in 2022. However, regional GDP does begin to grow again beyond forecast values from 2025 onwards. This does not have a significant impact on overall State GDP. Growth in Victorian GDP, which is primarily made up of growth in Melbourne reaching almost $950 million above forecast GDP.

Port of Melbourne Economic Contribution Study 58 Economic impact of infrastructure projects
Figure 5.3: Change in Total GDP for Victoria, Regional Victoria and Melbourne
-50
0
50
100
150
200
250
300
2006 2007 2008 2009 2010 2011 2012 2013 2014 2015 2016 2017 2018 2019 2020 2021 2022 2023 2024 2025 2026
Cha
nge
in G
DP
($m
)
Change in Melb GDP Change in Regional GDP Change in Vic GDP
Activity in Melbourne during the construction phase accounts for the majority of total GDP change. Figure 5.3 shows that, once completed, growth in GDP generated by the project in Melbourne slows briefly (although it is still greater than the level without the CDP) and GDP generated by the project in regional Victoria grows above the ‘without the project’ level at a steady rate. However, by 2022, the majority of GDP generated by the channel deepening is created in Melbourne.

Port of Melbourne Economic Contribution Study 59 Other economic studies of ports around Australia
6
Other economic studies of ports around Australia

Port of Melbourne Economic Contribution Study 60 Other economic studies of ports around Australia
6.1 The value of ports around Australia Since 1998-99, a number of ports throughout Australia have been valued using the general framework for port impact studies developed by the Bureau of Transport and Regional Economics (BTRE). The framework was initially used to value the Port of Fremantle and has since been used on the Ports of Townsville, Sydney, Geelong, Brisbane and Melbourne. The framework, explained in greater detail in section 4, uses three measures to estimate the economic value of ports. These are the total economic contribution of the port, the value added (or Gross Domestic Product) and the employment that it generates. These measures are outlined below: Output The gross business revenue of firms affected by operations at the
port
Value Added The total output from port related organisations less the costs associated with brought in materials, services and components
Employment Number of jobs created by port-related activities (full-time equivalents)
Typically the largest impact in both direct effects and ‘flow on’ effects, in terms of output and value added, is generated in the land transport and storage sector, ship loading and unloading process, and ship operations and cargo services.
Manufacturing firms, distributors and retailers that import and export goods through the port in the course of their business, although dependent on the port to move their cargo, are not considered to be directly involved in port related activity.
This section examines previous economic impact studies undertaken on major ports in Australia. All of the following reports have exclusively used the BTRE framework to value a port with two exceptions:
• in its 2002 Port of Melbourne valuation study, Econsearch developed a
concept called the ‘Global Efficiency Impact’ in addition to the BTRE framework. Econsearch’s resulting modelling reports a larger outcome. This methodology has not been used in other studies; and
• NIEIR used its proprietary economic modelling capabilities to arrive at a value of $14.8 billion for the CDP in its recent report.
PwC has chosen to take a much more conservative approach to valuation in its report and accordingly has only used the accepted BTRE methodology. The following summary includes the break down of ‘direct’ and ‘flow-on’ operational effects for the output, value added and employment generated for different ports across Australia. It is important to note that PwC has not attempted to adjust the figures in each of the reports for inflation since the time they were written – ie. each is expressed in dollars of the day.

Port of Melbourne Economic Contribution Study 61 Other economic studies of ports around Australia
6.2 The Port of Fremantle The Port of Fremantle is the largest general cargo port in Western Australia, handling 93% (by value) of the State’s seaborne imports and 34% (by value) of the State’s seaborne exports. Total trade throughput at the Port of Fremantle in 1998-99 was 23.5 million revenue tonnes, with bulk cargoes accounting for 83% of this traffic. In addition to bulk cargoes, container trade experienced average growth of 11% between 1991-92 and 1998-99 to total 275,000 containers in 1999. The Port of Fremantle was valued in 1999 using published data and surveys from the 198 organisations involved with importing and exporting through the port. It was selected as the case study for a valuations framework developed by the BTRE which aimed to illustrate the practical issues involved in port economic impact studies. This framework has since been used to value several ports across Australia. Section 4 of this study has used the BTRE methodology to calculate the current value of the Port of Melbourne. Table 6.1 highlights the key findings of the 1999 valuation of the Port of Fremantle.
Table 6.1: Economic Impact of the Port of Fremantle (1998-99)
Direct Effects Indirect Effects Total Effects
Output ($’000) 341 387 728
Value Added ($’000) 215 225 440
Employment (FTEs) 2,294 3,499 5,792
The total economic effect of $728 million represents the annual contribution that the port makes to the State economy each year. The $440 million of value added is equivalent to 0.9% of the Gross State Product and the 5,792 full-time equivalent jobs created is equivalent to 0.8% of the total employment in Western Australia. In the 1998-99 financial year, 1,771 commercial vessels visited the Port of Fremantle, meaning that each ship represented: • $411,000 of output;
• $248,000 of value added; and
• 3.3 full time equivalent jobs.
Activities which contributed the greatest value to Western Australia were ship loading and unloading which mainly comprises of stevedoring and loading and unloading of bulk cargoes; ship operations which includes pilotage, towage and bunkerage; and cargo services such as freight forwarding and customs broking.

Port of Melbourne Economic Contribution Study 62 Other economic studies of ports around Australia
6.3 The Port of Townsville The Port of Townsville is one of Queensland’s largest cargo ports, accounting for 17.8% to Queensland’s exports (by value) in 1998-99. Between 1992-93 and 1998-99, the Port of Townsville experienced an average annual growth rate of 6%, and in 1998-99 exported approximately 3.3 million tonnes of commodities and imported 4.9 million tonnes. The Port of Townsville is instrumental to the continued growth of North Queensland. The industries which derive the greatest economic benefit from port activities are mining, manufacturing and service industries, which include large businesses such as AMH Abattoir, MIM copper refinery, QNI nickel refinery and CSR Sugar. The results of this study are summarised in Table 6.2.
Table 6.2: Economic Impact of the Port of Townsville (1998-99)
Direct Effects Indirect Effects Total Effects
Output ($’million) 699.6 677.5 1,377.1
Value Added ($’million) 215.6 402.5 618.1
Employment (FTEs) 1,566 6,349 7,915
The economic output, calculated by summing all individual transactions resulting from port related activity, both direct and indirect, totalled $1,377.1. The value added from the economic activity was $618.1 million and accounted for 7,915 full time equivalent jobs. In 1998-99, 700 commercial trading vessels docked at the Port of Townsville. On average, each ship brought the following economic benefits, both direct and indirect, to North Queensland: • $1.9 million of output;
• $883,000 of value added; and
• 11.3 fulltime equivalent jobs.
The value added from port-related activities contributed around 10% of North Queensland’s ‘value added’ with the additional employment generated totally 10% of North Queensland’s full time equivalent labour force.
6.4 The Port of Sydney Sydney Ports are a major infrastructure asset for New South Wales handling approximately $45.5 billion worth of trade annually. The BTRE framework was used to value the Port of Sydney in 2001-02. During this time, 24.2 million mass tonnes of cargo, including over onr million containers, were handled. Sydney Ports comprise Australia’s second largest port facility, handling over 30% of the containerised trade in Australia. The economic activity, flow on effects and employment were calculated by surveying organisations involved in port related activities. Results from the analysis are detailed in table 6.3.

Port of Melbourne Economic Contribution Study 63 Other economic studies of ports around Australia
Table 6.3: Economic Impact of the Port of Sydney (2001-02)
Direct Effects Indirect Effects Total Effects
Output ($’million) 1,162.7 1,345.7 2,508.5
Value Added ($’million) 640.8 738.2 1,379.0
Employment (FTEs) 6,945 10,075 17,020
During 2001-02, 2,189 vessels docked at Sydney Ports. Each vessel that called provided the following economic benefit: • $1.1 million of economic output;
• an average contribution to Gross State Product of over $600,000; and
• 7.9 full time equivalent jobs.
Overall the value added by the Port of Sydney in 2002 was approximately 0.3% of NSW’s Gross State Product. Over 60% of these impacts are generated from container trade in commodities. Liquid bulk and gas made up 19% of all ship visits, motor vehicles 12%, dry bulk cargo 9%, general cargo 6.6% and passenger vessels 2.7%.
6.5 The Port of Geelong The BTRE valuation framework has also been used to value some of the smaller ports across Australia, including the Port of Geelong in 2004-05. The Port of Geelong is the second largest port in Victoria and handled over 12 million tonnes of cargo, worth an estimated $5.6 billion, in 2004-05. This figure equalled 2.1% of the Gross Regional Product and 0.08% to Victoria’s Gross State Product. Analysis showed that the 1,385 full time equivalent jobs created by the Port of Geelong accounted for 1.7% of total regional employment. The results from the analysis are summarised below.
Table 6.4: Economic Impact of the Port of Geelong (2004-05)
Total Effects
Output ($’000) 328.0
Value Added ($’000) 176.9
Employment (FTEs) 1385
In total there were 543 ship visits to the Port of Geelong by commercial vessels. Each visit contributed to the following impacts on the Victorian economy: • $604,000 of output;
• $309,000 of value added; and
• 2.6 full time equivalent jobs
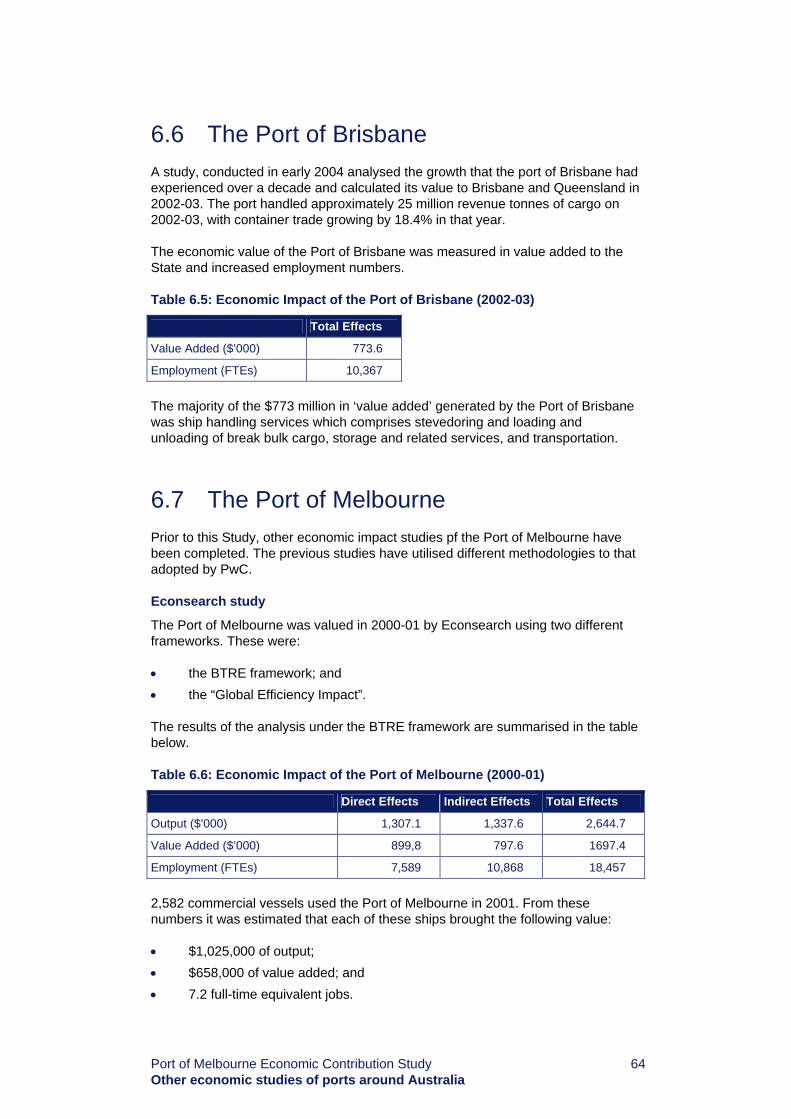
Port of Melbourne Economic Contribution Study 64 Other economic studies of ports around Australia
6.6 The Port of Brisbane A study, conducted in early 2004 analysed the growth that the port of Brisbane had experienced over a decade and calculated its value to Brisbane and Queensland in 2002-03. The port handled approximately 25 million revenue tonnes of cargo on 2002-03, with container trade growing by 18.4% in that year. The economic value of the Port of Brisbane was measured in value added to the State and increased employment numbers.
Table 6.5: Economic Impact of the Port of Brisbane (2002-03)
Total Effects
Value Added ($’000) 773.6
Employment (FTEs) 10,367
The majority of the $773 million in ‘value added’ generated by the Port of Brisbane was ship handling services which comprises stevedoring and loading and unloading of break bulk cargo, storage and related services, and transportation.
6.7 The Port of Melbourne Prior to this Study, other economic impact studies pf the Port of Melbourne have been completed. The previous studies have utilised different methodologies to that adopted by PwC.
Econsearch study
The Port of Melbourne was valued in 2000-01 by Econsearch using two different frameworks. These were: • the BTRE framework; and • the “Global Efficiency Impact”.
The results of the analysis under the BTRE framework are summarised in the table below.
Table 6.6: Economic Impact of the Port of Melbourne (2000-01)
Direct Effects Indirect Effects Total Effects
Output ($’000) 1,307.1 1,337.6 2,644.7
Value Added ($’000) 899,8 797.6 1697.4
Employment (FTEs) 7,589 10,868 18,457
2,582 commercial vessels used the Port of Melbourne in 2001. From these numbers it was estimated that each of these ships brought the following value: • $1,025,000 of output; • $658,000 of value added; and • 7.2 full-time equivalent jobs.

Port of Melbourne Economic Contribution Study 65 Other economic studies of ports around Australia
Clearly the Econsearch results are different to those derived in this study even though both use the BTRE methodology. We do not have access to the inputs to the Econsearch study but we understand that the differences may arise because: • Econsearch used a survey of port user businesses as its data source
whereas PwC based its data on that received from the Port, Waterline reports, interviews with port businesses and ACCC reports12; and
• PwC has taken a more conservative and narrower definitional approach towards the range of businesses that can be associated with the port.
In addition to the economic impact calculated using the BTRE framework, Econsearch developed another measure in an attempt to estimate the broader economic value of the port including industries that do not have a direct relationship with the port, but which rely on the operations of the port. The ‘Global Efficiency Impact’ was used to capture the value that the Port of Melbourne brings to users of the port including manufacturing firms, distributors and retailers that import and export goods through the port in the course of their business. The ‘Global Efficiency Impact’ is measured by estimating of the costs that would be imposed on Victorian industry if the Port of Melbourne was not available and industries reliant on the port were forced to use interstate ports. Econsearch added the operational impact of the Port of Melbourne with the Global Efficiency Impact to gain the gross impact of employment that the port creates and the total ‘value added’. Table 6.7 summarises the findings which are significantly larger than results gained from the BTRE framework.
Table 6.7: Gross Impact of the Port of Melbourne, 2000-01
Operational Impact
Global Efficiency Impact
Gross Impact
Gross State Product (Value added - $m) 1,697 3,668 5,365
Employment 18,457 61,798 80,255
Use of the gross impact measure for the Port of Melbourne represents an expanded understanding of the value of the port. This approach calculates the difference in value of shipping goods through the Port of Melbourne and having to ship goods through the Ports of Adelaide and Sydney. This could be considered to be an unrealistic assumption as without the port, the economic, industry and demographic character of Victoria would be very different. The Gross Efficiency Impact is not included in the calculations to determine the current value of the Port of Melbourne in section 4.
National Institute of Economic and Industry Research (NIEIR) study
NIEIR also conducted an analysis of the value of the CDP using its proprietary modelling capabilities. The NIEIR study concluded that the CDP had the potential to add $13.6 billion to national gross domestic product by 2030. While the model used was not available for this Study, the basis of the NIEIR outcome is largely premised on the assumption that massive trade diversion (mainly exports) will occur from the Port of Melbourne to the ports of Adelaide and
12 Note that PwC did approach port related businesses seeking information on throughput, turnover etc but none was forthcoming.

Port of Melbourne Economic Contribution Study 66 Other economic studies of ports around Australia
Sydney in the event that the CDP did not proceed. For instance, NIEIR estimates the costs of trade diversion would be $900 million in additional freight costs by 2015 in the absence of the project. Further, NIEIR estimates that the national employment impact of the CDP would be around 82,000 jobs by 2030. We again note that the approach used in the PwC Study takes a substantially more conservative position on the project, largely because different assets are included and because the base data is different. The PwC study remains consistent with the widely accepted BTRE methodology.

Port of Melbourne Economic Contribution Study 67 Socio-economic analysis
7
Socio-economic analysis

Port of Melbourne Economic Contribution Study 68 Socio-economic analysis
Part of the task of this report is to investigate some of the socio-economic factors associated with the operation of the Port of Melbourne and the proposed CDP. We have divided this discussion into three sections: • non-quantifiable and related economic factors;
• social impacts; and
• environmental impacts.
PwC is not, however, intending to duplicate the current studies being conducted into environmental and other issues associated with the port or the CDP. The intention of this chapter is to, where possible, provide some description of socio-economic factors associated with the port rather than to present stand alone, in-depth studies of each of these issues. Much of the discussion in this chapter is drawn from our consultation discussions with various stakeholders. It is also worth noting that PwC considered attempting to map some of the distribution of these effects by comparisons with such measures as the ABS Travel to Work Survey. However, analysis of the information from that survey indicated that we would not be able to place much reliability on results.
7.1 Non-quantifiable economic impacts The preceding sections have provided a detailed discussion of a range of quantifiable economic issues related to the operation of the Port of Melbourne and the proposed CDP. This chapter will look at some of the non-quantifiable and related aspects.
7.1.1 Port related industries (direct) The direct employment impact of the port’s activities includes companies directly engaged in the movement of goods through the port. The key industries which are directly engaged in the port’s activities are described below.
Terminal operators
The terminal operators or stevedoring companies load and unload the freight from the ships calling at the port. Given the consolidation that has taken place in the freight and logistics industry over the last few years, the major operators now provide integrated sea and land transport services beyond the port terminals. Key terminal operators include P&O Ports Ltd and Toll Stevedoring. These three operators dominate the handling of container cargo. A number of smaller players also operate terminals, although these tend to handle non-containerised cargo such as liquid and dry bulk.

Port of Melbourne Economic Contribution Study 69 Socio-economic analysis
Port service providers and ancillary services
Port support services include all of those services which support ships moving in and out of the port and while they are at port, including pilotage, linesmen, tug operators, maintenance, bunkering, cleaning, security and mooring. These support services are commercially operated, however, coordination occurs through the POMC shipping management functions.
Shipping
This group includes shipping lines and shipping agents. Shipping lines and shipping agents are the companies that own and/or operate the vessels that carry cargo. Over 40 shipping lines call at the Port of Melbourne.
Government and administration
This includes the Port of Melbourne Corporation, which manages and administers the operations of the port. The PoMC is also responsible for the maintenance of port infrastructure. It also includes several other Government agencies which are responsible for enforcing relevant regulations. These include the Australian Customs Service (ACS), the Australian Quarantine and Inspection Service (AQIS), and ship safety and environmental inspection services.
Land transport and storage services
This includes a range of transport and logistics services, including rail and road freight operators, storage services, and others who are part of the supply chain.
7.1.2 Other industries (indirect) There are a large number of indirect employment impacts resulting from the activities of the port. These include businesses that directly service the port, as well as the employment linked to the goods and services purchased by port employees. Some of the most important indirect employment impacts are in the industries that support the activities of the port or are dependent on the port, including business services, transport services, financial services, manufacturing and retail and wholesale trades. These industries have a close relationship with the PoMC or the businesses which have a presence at the port.
7.1.3 Impact on industries both directly and indirectly related to the Port of Melbourne The existence of the port and the nature of the trade that goes through it have an impact on industry in Victoria. However, it is just as true and maybe more correct to say that the nature of industry in Victoria drives the nature of the port and its activities. Victoria has traditionally been Australia’s manufacturing State, producing the greatest volume of manufactured goods and exporting and importing a disproportionate volume of such goods.

Port of Melbourne Economic Contribution Study 70 Socio-economic analysis
There are inevitably synergies that arise from that position. The existence of economies of scale arising from the greater throughput volumes at the port and support services mean that importers and exporters of containerised goods in Melbourne benefit in comparison to some of their counterparts in other States. Nowhere is this more obvious than in the comparison between Victoria and Tasmania. With generally only one direct international shipment of containerised goods in and out of Tasmania each week, the Port of Melbourne is now the export and import point for many Tasmanian companies. Inevitably this will lead to effects for Tasmanian importers and exporters. While it is unclear to what extent the existence of the port drives the structure of Victorian industry, it is true to say that, without the port, Victorian industry would be substantially different.
7.1.4 Investment impacts The specific direct and indirect investment impacts of the port and the CDP have been discussed in earlier sections of this report. However it is worth giving a further description here. The existence of the port and the infrastructure of the port and the proposed CDP have had a major impact on investment in Victoria over time.
Transport, distribution and logistics sector
Stakeholders expressed a range of views on the extent to which the CDP would have an impact on the transport, distribution and logistics (TDL) sector in Victoria. Views expressed included suggestions that:
• the CDP would have no impact on the long term growth prospects for the TDL sector in Australia, because land bridging costs to alternative ports such as Brisbane were likely to be too high to make an impact on the level of port usage;
• the CDP would have a minor positive impact on the growth of TDL in Victoria, and would assist in consolidating Victoria as an important transport and logistics hub nationally; and
• not proceeding with the CDP would have a significant negative impact on the port’s efficiency, and the attractiveness of Victoria to TDL companies. This view argued that a significant proportion of trade through the port was contestable, and that the no CDP scenario would benefit the TDL sector in other States, particularly Queensland and NSW.
The consultation process has not provided sufficient evidence to make a definitive statement about the likely impacts on the TDL sector. However, the cost savings arising from the CDP could result in some positive benefits for the TDL sector in Victoria, and should assist in at least maintaining the level of investment and activity in this State. It is likely that other infrastructure issues (eg. pricing of and investment in the national road and rail network) could have a greater impact on the sector than the CDP.
Other sectors
Stakeholders did not identify other sectors, other than agriculture and processed food, that would be likely to directly benefit from the CDP. Indeed, cheaper imports may potentially have a slight negative impact on import competing manufacturing (eg. motor vehicles).

Port of Melbourne Economic Contribution Study 71 Socio-economic analysis
7.2 Disruption caused by the CDP During the consultation process several participants raised the issue of disruption to economic activities that would be caused during and after the CDP. For example, representatives of the dive industry13 stated that the CDP would have a significant impact on their business. In particular, the owner of the Bay’s largest dive operation stated that, if the CDP caused a downturn in business of 20% or more for 6 months, it would be forced out of business. The industry also pointed to the indirect effects on related tourism and accommodation industries that any CDP caused down turn in the dive industry may cause. A particular concern raised by the industry was the possible effects of any possible residual turbidity that might occur after CDP is completed. Similar concerns were expressed by other industries, such as the fishing industry. It is difficult for us to quantify these impacts given the number of unknown or unquantifiable factors involved. In particular, as noted previously, the SEES is looking at issues associated with turbidity. While we believe it is important to note and take into account these concerns, it is beyond the scope of this study to quantify them.
7.3 Non-economic impacts 7.3.1 Social impacts The Port of Melbourne has had a significant social impact on Melbourne since it was established in the 1840s. The existence and nature of the port have been determining factors in the adjacent urban areas for over a century. The port and related industries provision of employment, opportunities for economic activity, and physical impacts on urban development have driven a great deal of the demographic, infrastructure, social and cultural aspects of those adjacent areas. Industry, people and infrastructure have been attracted to the opportunities the port presents. The key social issue identified by stakeholders, however, is the impact that greater activity at the port will have on road usage and congestion. PwC understands that this issue is the subject of ongoing discussion between State Government agencies, port users and neighbouring councils. A further issue or concern that was raised by some stakeholders was any loss of community amenity caused during the CDP, particularly with regard to, for instance, recreational diving opportunities.
13 The Dive Industry Victoria Association estimated that there are 42-43 commercial dive operators in the Bay catering to over 33,000 customers per year They further estimated that approximately 70% of those customers are taken to areas that will be affected by the CDP, particularly the ‘Lonsdale Wall’ area near the Bay mouth.

Port of Melbourne Economic Contribution Study 72 Socio-economic analysis
7.3.2 Environmental impacts As with any industry, the port has impacts on the natural environment within which it operates. The proposed CDP has also been the focus of much discussion with respect to possible environmental impacts. However, there are other processes that are looking at these issues and this report will not be exploring those impacts in detail. The potential environmental impacts of the CDP were identified in the Economic Impact Study undertaken as part of the Environment Effects Statement (EES) for the project, exhibited during 2004. Some of the key potential environmental impacts identified in this study included:
• a reduction in local air pollution and greenhouse gas emissions which would result from fewer total ships calls to the Port of Melbourne because larger ships could call at the port;
• short term disruption to commercial fishing, recreational fishing and diving and other bay users resulting from increased sediment in the water of the Bay during the dredging process;
• changes to hydrodynamic processes (the potential to disrupt water movements in the Bay, including tides, currents etc);
• changes to the denutrification process (i.e. the impact of the removal of or changes to seabed habitats could affect the Bay’s ability to remove nitrogen);
• translocation of marine pests (from the ballast of larger vessels and from the dredging process);
• turbidity and increased sedimentation in the water of the Bay; and • increased mobilisation of contaminants. A number of other possible side effects of the dredging process were also identified which could have an impact on the ecology of Port Phillip Bay. PwC notes that the SEES will look at the following issues in more detail:
• turbidity;
• possible impacts of deepened channels on water currents and sediment movement;
• management of contaminated sediments;
• possible impacts on biodiversity and habitat; and
• refinement of the project design.
A significant part of the conduct of that SEES has been a trial dredging of parts of the channel and the entrance to the Bay to provide data on some of the above issues, particularly turbidity. The trial has also sought to demonstrate the technical capacity to undertake dredging as envisaged in the EES. In discussion with stakeholders, the potential for valuing environmental assets and amenity was raised. Such an approach is beyond the scope of this study.

Port of Melbourne Economic Contribution Study 73 Socio-economic analysis
7.4 Impacts on regions of Victoria The terms of reference for this project specify that, as far as possible, PwC should attempt to provide a break-down of the economic impacts of the port of Melbourne and the CDP at the most disaggregated local geographic level. The purpose of this task is to provide an indication of which geographic areas have the strongest links with the port (and may be most dependent on it for employment and industry growth), and, as far as possible, which areas receive the greatest economic benefit from port related activities. To fulfil this requirement, PwC has taken the outputs of the modelling described in the preceding chapters and translated it to the local level.
7.4.1 Methodology PwC considered several possible methods that could have been used to carry out this task, including use of ABS data on employment and industry by local areas. However, we considered that the most valid approach was to use the results of the survey data in container origin and destination and apportion economic outcomes to local levels on the basis of to where goods are transported and from where goods are transported. However, we recognise that there are several limitations to this approach and ask that those limitations be kept in mind when viewing the outcomes in this chapter. The main caveats are: • just because a container is packed or stripped in a particular locality does
not mean that locality was the ultimate origin/destination of the contents of the container. Those who prepare containers (eg freight forwarders and combiners) may source goods from a range of places. Similarly, after a container is stripped, the goods may end up in disparate destinations; and
• this method provides only a very rough proxy of some of the direct and indirect benefits. For example, it is unlikely to be a good indicator of how the benefits of direct employment at the port are distributed or where the benefits of investment in the port reside.
For these reasons, caution must be exercised in interpreting these results. While the economic benefits identified in this exercise are indicative only, they are less important than identifying the likely relative economic benefits (i.e., where economic benefits are generally located geographically). Please also note that, with regard to the rest of Australia, the key benefits are assumed to accrue to New South Wales and South Australia. This is because exports from and imports to the port are sourced or destined for these two States. By contrast, we have assumed that Tasmania will not benefit from the CDP, even though it is reliant on the shipping facilities of the port. As noted earlier in this Study, Tasmanian trade is considered to be coastal trade for modelling purposes, which is unaffected by the CDP.

Port of Melbourne Economic Contribution Study 74 Socio-economic analysis
7.4.2 Geographic distribution of the benefits of the Port of Melbourne Section 2.4 discussed the findings of the origin and destination study for goods entering and leaving the Port of Melbourne. The study found that the bulk of goods entering the port were focused in several geographic areas, those being: • LGAs in close proximity to the port and which have significant industrial
profiles (particularly Hobsons Bay and Maribyrnong in Melbourne’s West);
• suburbs in Melbourne’s Southeast, centred around the industrial areas of Dandenong; and
• regional Victoria.
The distribution of export origins have been apportioned to the findings of the input-output analysis undertaken in Section 4 of this Study to determine indicative economic benefits from port related activities. We have therefore determined indicative economic benefits for regions of Victoria in terms of: • employment;
• output; and
• value added (net effects).
The following tables provide a picture of how the benefits from the Port of Melbourne are distributed at the local, regional, State and national levels. The indicative employment impacts of port related activities are outlined in table 7.1.
Table 7.1: Geographical distribution of employment benefits from the Port of Melbourne
Region Direct effects (employment)
Flow-on effects (employment)
Total impact (employment)
City of Melbourne 309 253 562
City of Port Phillip 136 112 248
City of Hobsons Bay 1,240 1,014 2,253
City of Maribyrnong: 150 123 273
Total Bayside 1,836 1,501 3,337
Inner Melbourne – other 418 342 760
Inner Eastern 326 266 592
Other Northern 874 715 1,589
Outer Western – Balance 348 285 633
Southeast/Dandenong 1,991 1,628 3,619
Eastern Corridor – Mornington 5 4 9
Melbourne – TOTAL 5,757 4,741 10,539
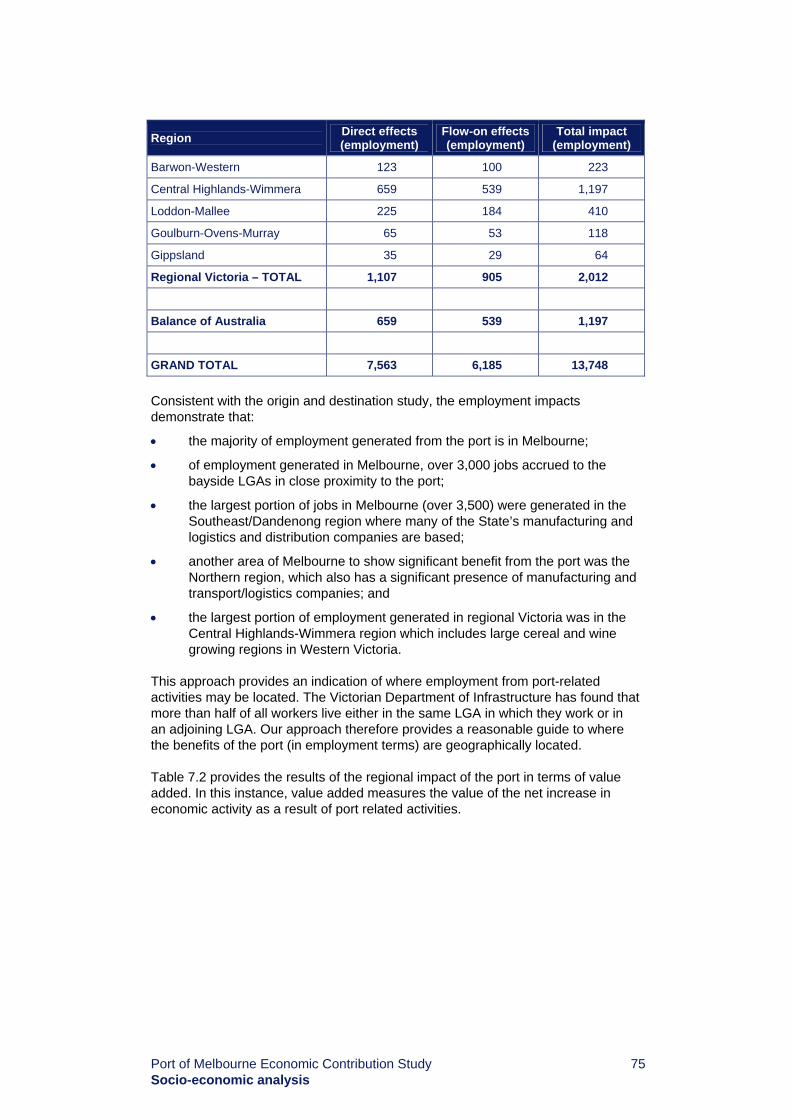
Port of Melbourne Economic Contribution Study 75 Socio-economic analysis
Region Direct effects (employment)
Flow-on effects (employment)
Total impact (employment)
Barwon-Western 123 100 223
Central Highlands-Wimmera 659 539 1,197
Loddon-Mallee 225 184 410
Goulburn-Ovens-Murray 65 53 118
Gippsland 35 29 64
Regional Victoria – TOTAL 1,107 905 2,012
Balance of Australia 659 539 1,197
GRAND TOTAL 7,563 6,185 13,748 Consistent with the origin and destination study, the employment impacts demonstrate that:
• the majority of employment generated from the port is in Melbourne;
• of employment generated in Melbourne, over 3,000 jobs accrued to the bayside LGAs in close proximity to the port;
• the largest portion of jobs in Melbourne (over 3,500) were generated in the Southeast/Dandenong region where many of the State’s manufacturing and logistics and distribution companies are based;
• another area of Melbourne to show significant benefit from the port was the Northern region, which also has a significant presence of manufacturing and transport/logistics companies; and
• the largest portion of employment generated in regional Victoria was in the Central Highlands-Wimmera region which includes large cereal and wine growing regions in Western Victoria.
This approach provides an indication of where employment from port-related activities may be located. The Victorian Department of Infrastructure has found that more than half of all workers live either in the same LGA in which they work or in an adjoining LGA. Our approach therefore provides a reasonable guide to where the benefits of the port (in employment terms) are geographically located. Table 7.2 provides the results of the regional impact of the port in terms of value added. In this instance, value added measures the value of the net increase in economic activity as a result of port related activities.

Port of Melbourne Economic Contribution Study 76 Socio-economic analysis
Table 7.2: Geographical distribution of value added benefits from the Port of Melbourne
Region Direct Effects ($ million)
Flow-on Effects($ million)
Total Impact ($ million)
City of Melbourne Total 24.4 22.3 46.6
City of Port Phillip Total 10.7 9.8 20.6
City of Hobsons Bay Total 97.6 89.2 186.9
City of Maribyrnong: 11.8 10.8 22.7
Bayside – TOTAL 144.6 132.2 276.8
Inner Melbourne - other 32.9 30.1 63.1
Inner Eastern 25.6 23.5 49.1
Other Northern 68.8 63.0 131.8
Outer Western - Balance 27.4 25.1 52.5
Southeast/Dandenong 156.8 143.4 300.2
Eastern Corridor - Mornington 0.4 0.4 0.8
Melbourne – TOTAL 456.6 417.6 874.2
Barwon-Western 9.7 8.8 18.5
Central Highlands-Wimmera 51.9 47.4 99.3
Loddon-Mallee 17.8 16.2 34.0
Goulburn-Ovens-Murray 5.1 4.7 9.8
Gippsland 2.8 2.5 5.3
Regional Victoria – TOTAL 87.2 79.7 166.9
Balance of Australia 51.9 47.4 99.3
GRAND TOTAL 595.6 544.8 1,140.4 Consistent with the results of the employment analysis, this demonstrates that much of the net increase in economic activity accruing to the Victorian economy is the bayside areas surrounding the port, as well as in Melbourne’s Southeast. This indicates that the economic benefit to the Southeast region of Melbourne (including Dandenong and the suburbs stretching to the Mornington Peninsula) may benefit to a greater degree from the activities of the port compared to some other areas. Table 7.3 demonstrates the regional effects of total output. In this context, output measures the value of the gross economic impact on the economy of the port and its related activities.

Port of Melbourne Economic Contribution Study 77 Socio-economic analysis
Table 7.3: Geographical distribution of production benefits from the Port of Melbourne
Region Direct Effects ($ million)
Flow-on Effects($ million)
Total Impact ($ million)
City of Melbourne Total 54.7 47.6 102.3
City of Port Phillip Total 24.1 21.0 45.1
City of Hobsons Bay Total 219.3 190.6 409.9
City of Maribyrnong: 26.6 23.1 49.7
Bayside – TOTAL 324.7 282.3 607.0
Inner Melbourne - other 74.0 64.3 138.3
Inner Eastern 57.6 50.1 107.6
Other Northern 154.6 134.4 289.0
Outer Western - Balance 61.6 53.5 115.1
Southeast/Dandenong 352.1 306.2 658.3
Eastern Corridor - Mornington 0.9 0.8 1.7
Melbourne - TOTAL 1,025.4 891.5 1,916.9
Barwon-Western 21.7 18.9 40.6
Central Highlands-Wimmera 116.5 101.3 217.8
Loddon-Mallee 39.9 34.7 74.5
Goulburn-Ovens-Murray 11.5 10.0 21.5
Gippsland 6.2 5.4 11.6
Regional Victoria - TOTAL 195.8 170.2 366.0
Balance of Australia 116.5 101.3 217.8
GRAND TOTAL 1,337.7 1,163.0 2,500.7 To sum up, the regional analysis indicates that: • the greatest benefits from the Port of Melbourne are geographically
concentrated in metropolitan Melbourne;
• not surprisingly, the areas within Melbourne that benefit the most are the areas around the port and the industrialised areas in the West, North and Southeast;
• regional Victoria’s benefits from the port are smaller than metropolitan Melbourne’s but are still substantial, with industries in the Central Highlands-Wimmera region obtaining a particularly large benefit from the port; and
• outside Victoria, New South Wales South Australia and Tasmania are the main beneficiaries from the Port of Melbourne.
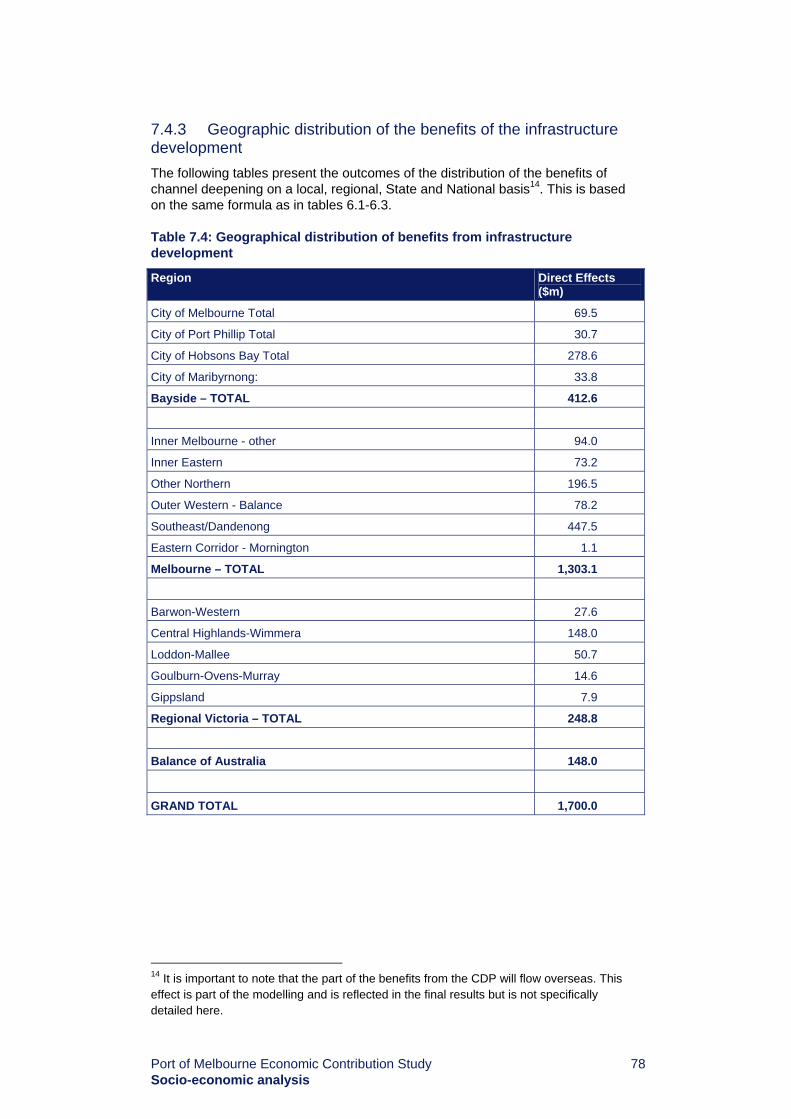
Port of Melbourne Economic Contribution Study 78 Socio-economic analysis
7.4.3 Geographic distribution of the benefits of the infrastructure development The following tables present the outcomes of the distribution of the benefits of channel deepening on a local, regional, State and National basis14. This is based on the same formula as in tables 6.1-6.3.
Table 7.4: Geographical distribution of benefits from infrastructure development
Region Direct Effects ($m)
City of Melbourne Total 69.5
City of Port Phillip Total 30.7
City of Hobsons Bay Total 278.6
City of Maribyrnong: 33.8
Bayside – TOTAL 412.6
Inner Melbourne - other 94.0
Inner Eastern 73.2
Other Northern 196.5
Outer Western - Balance 78.2
Southeast/Dandenong 447.5
Eastern Corridor - Mornington 1.1
Melbourne – TOTAL 1,303.1
Barwon-Western 27.6
Central Highlands-Wimmera 148.0
Loddon-Mallee 50.7
Goulburn-Ovens-Murray 14.6
Gippsland 7.9
Regional Victoria – TOTAL 248.8
Balance of Australia 148.0
GRAND TOTAL 1,700.0
14 It is important to note that the part of the benefits from the CDP will flow overseas. This effect is part of the modelling and is reflected in the final results but is not specifically detailed here.

Port of Melbourne Economic Contribution Study 79 Socio-economic analysis
The findings from this analysis are: • the largest part of the benefits from proposed infrastructure development of
the port and its key assets would be distributed within the Melbourne metropolitan area;
• within the Melbourne metropolitan area, the vast majority of those benefits would be distributed to areas in close physical proximity to the port and those areas that produce or use the goods and services that pass through the port; and
• outside Melbourne, the benefits are distributed unevenly with Central Highlands-Wimmera gaining the largest share of the Victorian regional benefits and NSW gaining the majority of the benefits outside Victoria.

Port of Melbourne Economic Contribution Study 80
THIS PAGE HAS BEEN LEFT BLANK INTENTIONALLY

Port of Melbourne Economic Contribution Study 81 Conclusions
8
Conclusions
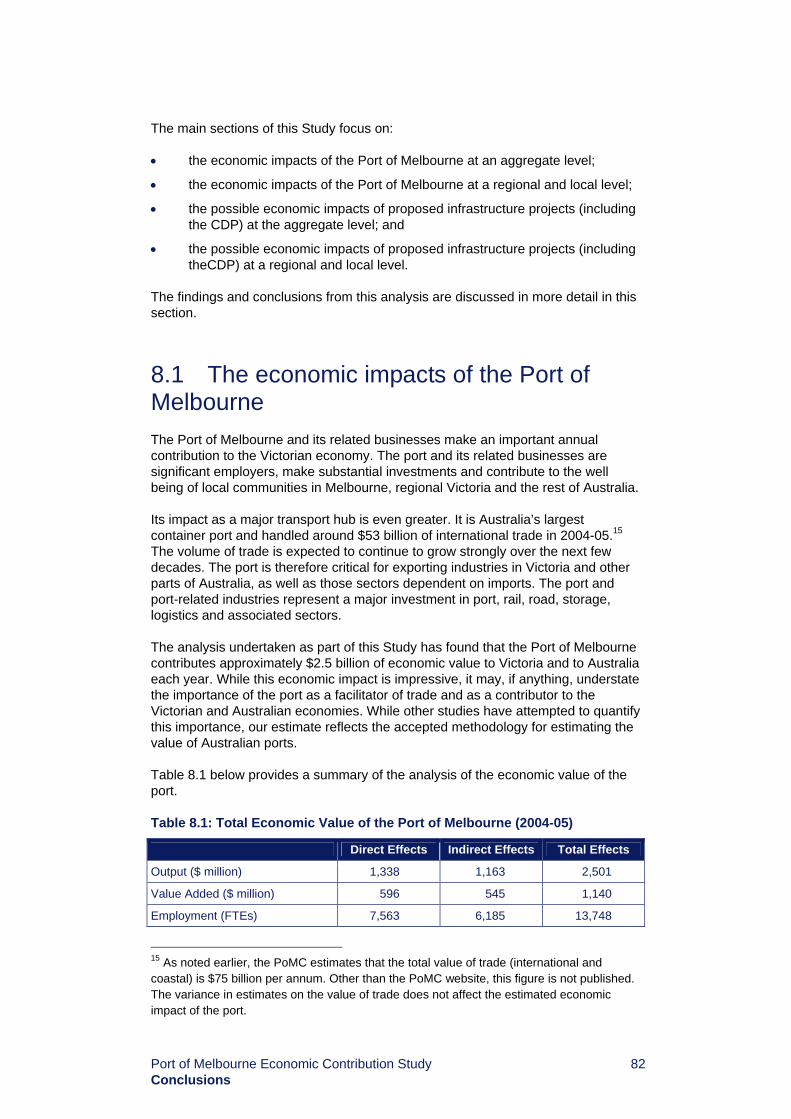
Port of Melbourne Economic Contribution Study 82 Conclusions
The main sections of this Study focus on: • the economic impacts of the Port of Melbourne at an aggregate level;
• the economic impacts of the Port of Melbourne at a regional and local level;
• the possible economic impacts of proposed infrastructure projects (including the CDP) at the aggregate level; and
• the possible economic impacts of proposed infrastructure projects (including theCDP) at a regional and local level.
The findings and conclusions from this analysis are discussed in more detail in this section.
8.1 The economic impacts of the Port of Melbourne The Port of Melbourne and its related businesses make an important annual contribution to the Victorian economy. The port and its related businesses are significant employers, make substantial investments and contribute to the well being of local communities in Melbourne, regional Victoria and the rest of Australia. Its impact as a major transport hub is even greater. It is Australia’s largest container port and handled around $53 billion of international trade in 2004-05.15 The volume of trade is expected to continue to grow strongly over the next few decades. The port is therefore critical for exporting industries in Victoria and other parts of Australia, as well as those sectors dependent on imports. The port and port-related industries represent a major investment in port, rail, road, storage, logistics and associated sectors. The analysis undertaken as part of this Study has found that the Port of Melbourne contributes approximately $2.5 billion of economic value to Victoria and to Australia each year. While this economic impact is impressive, it may, if anything, understate the importance of the port as a facilitator of trade and as a contributor to the Victorian and Australian economies. While other studies have attempted to quantify this importance, our estimate reflects the accepted methodology for estimating the value of Australian ports. Table 8.1 below provides a summary of the analysis of the economic value of the port.
Table 8.1: Total Economic Value of the Port of Melbourne (2004-05)
Direct Effects Indirect Effects Total Effects
Output ($ million) 1,338 1,163 2,501
Value Added ($ million) 596 545 1,140
Employment (FTEs) 7,563 6,185 13,748
15 As noted earlier, the PoMC estimates that the total value of trade (international and coastal) is $75 billion per annum. Other than the PoMC website, this figure is not published. The variance in estimates on the value of trade does not affect the estimated economic impact of the port.

Port of Melbourne Economic Contribution Study 83 Conclusions
In addition to transport, distribution and logistics, the port directly influences employment and investment in those export sectors which rely on the port to ship goods to overseas markets. Sectors which rely on the port include some of the most important industries in Victoria, such as grain, horticulture and wine, vehicles, machinery and other manufactured goods. The efficiency of the Victorian economy, therefore, is in part dependent on the efficient and effective operation of the port, and its continued capacity to grow and handle increased trade volumes.
8.2 The economic impacts of the Port of Melbourne at a regional and local level While the Port of Melbourne makes a substantial contribution to the economy of Victoria, its impact is not uniform across the State. A number of areas or regions within metropolitan Melbourne and in regional Victoria benefit relatively more than other parts of the State. As noted in section 6 of this report, PwC has undertaken an analysis of the geographic impact of the port’s economic activities. While not a definitive measure of where the economic benefit of the port is concentrated, the analysis indicates that: • the most significant economic benefits from the port are in metropolitan
Melbourne. In particular, economic impacts are concentrated in the LGAs around the port itself, and in the industrialised areas of the Southeast and North. These areas have a concentration of manufacturing and transport, distribution and logistics companies, and rely on the port for to transport exports and imports;
• regional Victoria’s benefits from the port are smaller than metropolitan Melbourne’s but are still substantial, with industries in the Central Highlands-Wimmera region obtaining a particularly large benefit from the port;
• outside Victoria, New South Wales and South Australia are the main beneficiaries from the Port of Melbourne. In particular, commodity exporters (grains, minerals etc) use the port, which is often closer to these regions than other major ports (Sydney and Adelaide);and
• by contrast, Tasmania is not expected to realise significant benefits from the CDP. This is because most of its trade is shipped to and from the Port of Melbourne in coastal shipping vessels, which are too small to experience any draught restrictions and are therefore unaffected by the CDP.
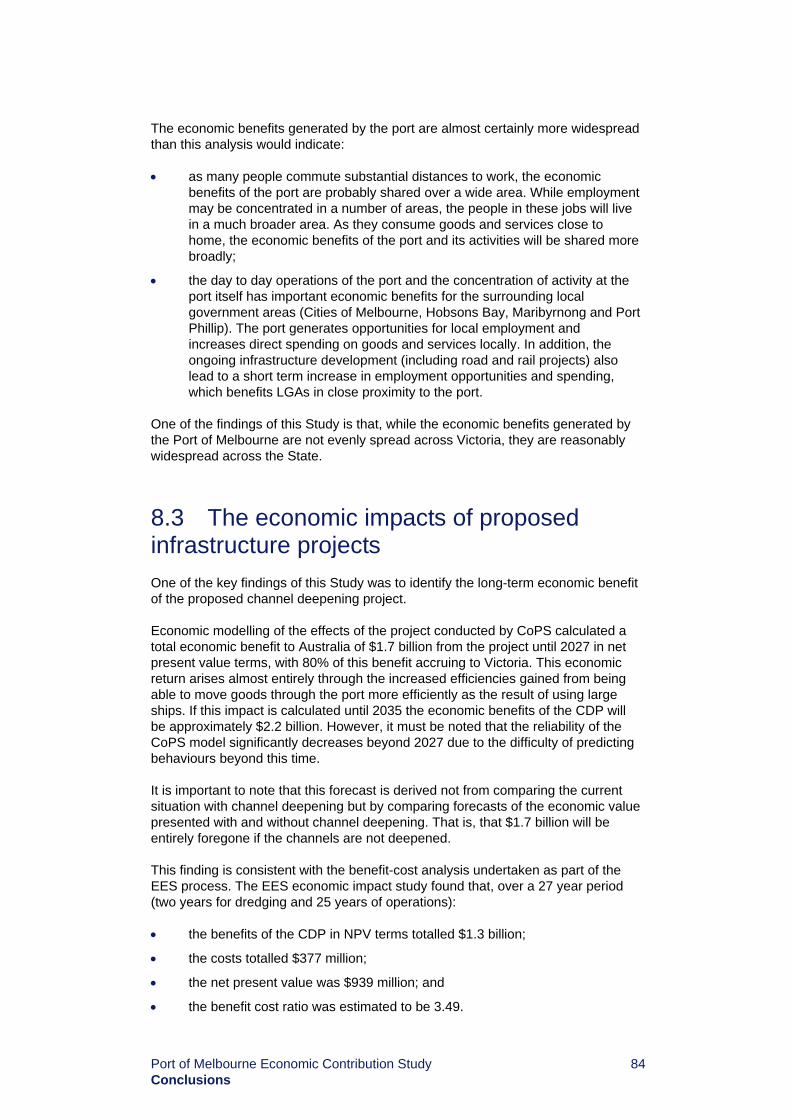
Port of Melbourne Economic Contribution Study 84 Conclusions
The economic benefits generated by the port are almost certainly more widespread than this analysis would indicate: • as many people commute substantial distances to work, the economic
benefits of the port are probably shared over a wide area. While employment may be concentrated in a number of areas, the people in these jobs will live in a much broader area. As they consume goods and services close to home, the economic benefits of the port and its activities will be shared more broadly;
• the day to day operations of the port and the concentration of activity at the port itself has important economic benefits for the surrounding local government areas (Cities of Melbourne, Hobsons Bay, Maribyrnong and Port Phillip). The port generates opportunities for local employment and increases direct spending on goods and services locally. In addition, the ongoing infrastructure development (including road and rail projects) also lead to a short term increase in employment opportunities and spending, which benefits LGAs in close proximity to the port.
One of the findings of this Study is that, while the economic benefits generated by the Port of Melbourne are not evenly spread across Victoria, they are reasonably widespread across the State.
8.3 The economic impacts of proposed infrastructure projects One of the key findings of this Study was to identify the long-term economic benefit of the proposed channel deepening project. Economic modelling of the effects of the project conducted by CoPS calculated a total economic benefit to Australia of $1.7 billion from the project until 2027 in net present value terms, with 80% of this benefit accruing to Victoria. This economic return arises almost entirely through the increased efficiencies gained from being able to move goods through the port more efficiently as the result of using large ships. If this impact is calculated until 2035 the economic benefits of the CDP will be approximately $2.2 billion. However, it must be noted that the reliability of the CoPS model significantly decreases beyond 2027 due to the difficulty of predicting behaviours beyond this time. It is important to note that this forecast is derived not from comparing the current situation with channel deepening but by comparing forecasts of the economic value presented with and without channel deepening. That is, that $1.7 billion will be entirely foregone if the channels are not deepened. This finding is consistent with the benefit-cost analysis undertaken as part of the EES process. The EES economic impact study found that, over a 27 year period (two years for dredging and 25 years of operations): • the benefits of the CDP in NPV terms totalled $1.3 billion;
• the costs totalled $377 million;
• the net present value was $939 million; and
• the benefit cost ratio was estimated to be 3.49.
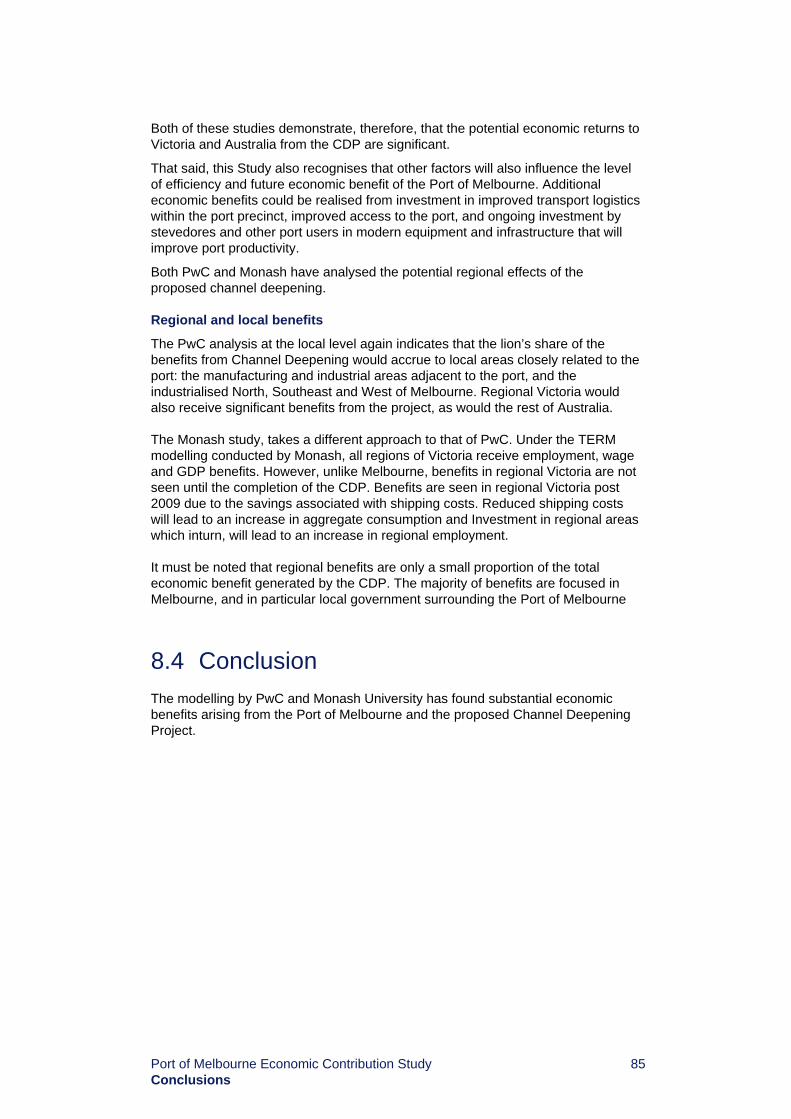
Port of Melbourne Economic Contribution Study 85 Conclusions
Both of these studies demonstrate, therefore, that the potential economic returns to Victoria and Australia from the CDP are significant.
That said, this Study also recognises that other factors will also influence the level of efficiency and future economic benefit of the Port of Melbourne. Additional economic benefits could be realised from investment in improved transport logistics within the port precinct, improved access to the port, and ongoing investment by stevedores and other port users in modern equipment and infrastructure that will improve port productivity.
Both PwC and Monash have analysed the potential regional effects of the proposed channel deepening.
Regional and local benefits
The PwC analysis at the local level again indicates that the lion’s share of the benefits from Channel Deepening would accrue to local areas closely related to the port: the manufacturing and industrial areas adjacent to the port, and the industrialised North, Southeast and West of Melbourne. Regional Victoria would also receive significant benefits from the project, as would the rest of Australia. The Monash study, takes a different approach to that of PwC. Under the TERM modelling conducted by Monash, all regions of Victoria receive employment, wage and GDP benefits. However, unlike Melbourne, benefits in regional Victoria are not seen until the completion of the CDP. Benefits are seen in regional Victoria post 2009 due to the savings associated with shipping costs. Reduced shipping costs will lead to an increase in aggregate consumption and Investment in regional areas which inturn, will lead to an increase in regional employment. It must be noted that regional benefits are only a small proportion of the total economic benefit generated by the CDP. The majority of benefits are focused in Melbourne, and in particular local government surrounding the Port of Melbourne
8.4 Conclusion The modelling by PwC and Monash University has found substantial economic benefits arising from the Port of Melbourne and the proposed Channel Deepening Project.

Port of Melbourne Economic Contribution Study 86
THIS PAGE HAS BEEN LEFT BLANK INTENTIONALLY

Port of Melbourne Economic Contribution Study 87 CoPS Modelling
Appendix A
CoPS Modelling

Port of Melbourne Economic Contribution Study 88 CoPS Modelling
Dynamic CGE analysis of the economic effects of channel deepening in Port Phillip Bay Report by Glyn Wittwer
Centre of Policy Studies Menzies Building, Wellington Rd, Monash University 3800 Victoria

Port of Melbourne Economic Contribution Study 89 CoPS Modelling
Summary The channel deepening project provides economic benefits to Melbourne from the beginning of construction (assumed to start in 2006). Employment rises relative to forecast in Melbourne, with positive effects on aggregate consumption and eventually on investment in sectors other than port services. By the time Melbourne’s aggregate investment starts to return to forecast levels, the cost lowering benefits of the project are being realised. The benefits of larger ships entering the port of Melbourne from 2009 contribute to additional investment in the non-metropolitan regions of Victoria. The benefits are small but positive for non-metropolitan Victorian regions. The national welfare gain from channel deepening in discounted net present value terms is $1.7 billion.
Overview of the direct impacts imposed on TERM
The construction and operational phases of the channel deepening project overlap. Investment in addition to that of forecast is required from 2006 to 2010. This peaks in 2009, when the investment in channel deepening amounts to $316 million. The benefits of the project, in terms of lower shipping costs as a consequence of larger ships gaining access to Port Phillip Bay, commence in 2009. The estimated cost savings in 2009 are $43 million. These rise steadily over succeeding years to $87 million in 2015. Thereafter, we assume that the same proportional cost savings apply as in earlier years, but to the extent that the volume of shipping grows, a given proportional cost savings benefit translates into a growing annual dollar benefit. Details on the dynamic, multiregional CGE model used in this application are provided below.
The labour market
The largest impacts relative to forecast on Melbourne’s employment occur during the construction phase, with an employment peak in 2009 at 0.12% or 2,200 jobs above forecast (figure 1). Further construction work continues in 2010, albeit on a smaller scale, so that employment falls to 0.04% or 700 jobs above forecast. Since real wages have risen to around 0.1% above forecast by 2010, and the benefit from cheaper shipping is still relatively small, downward pressure is exerted on wages and employment in succeeding years, so that by 2013 employment has fallen slightly below forecast. Wages, which by assumption adjust sluggishly, are still 0.09% above forecast in 2013. Thereafter, with enlarging costs savings from shipping to and from Melbourne, the labour market strengthens slightly. Eventually, in the 2020s, the real wage settles around 0.1% above forecast, with employment 0.015% or 300 jobs above forecast. The appendix contains an explanation of the theory of regional labour market adjustment. In the other regions of Victoria, little happens in the labour market until larger ships have access to the bay and costs start to fall in 2009 (figures 2 to 5). In each Victorian region, there is a gradual rise in employment relative to forecast from 2009. The number of additional jobs in each region is relatively small. For example, in the River regions of Victoria (combining the statistical divisions of Ovens-Murray, Loddon, Goulburn and the Mallee), additional employment peaks in 2012 at 0.05% above forecast – this is around 120 jobs. The main lasting impact in the labour markets of non-metropolitan Victoria is that real wages remain around 0.05 to 0.06% above forecast in the 2020s.

Port of Melbourne Economic Contribution Study 90 CoPS Modelling
It follows that since the labour supply has increased in Victoria, there is a very small decrease in the labour supply in the rest of Australia. Labour supply and employment in the rest of Australia decreases in the long run by 0.004% or 400 jobs, with those jobs moving to Victoria. Victoria’s employment peak relative to forecast as a consequence of the project is in 2009 at 2,300 jobs, concentrated in Melbourne.
Figure 1: Melbourne’s labour market (% change relative to forecast)
-0.02
0.00
0.02
0.04
0.06
0.08
0.10
0.12
0.14
2006 2009 2012 2015 2018 2021 2024 2027
Real wageEmployment
Labour supply
Figure 2: Barwon’s labour market (% change relative to forecast)
-0.04
-0.02
0
0.02
0.04
0.06
0.08
0.1
0.12
2006 2009 2012 2015 2018 2021 2024 2027
Real wage
Employment
Labour supply

Port of Melbourne Economic Contribution Study 91 CoPS Modelling
Figure 3: Gippsland’s labour market (% change relative to forecast)
-0.02
0
0.02
0.04
0.06
0.08
0.1
0.12
2006 2009 2012 2015 2018 2021 2024 2027
Real wage
Employment
Labour supply
Figure 4: Victorian River regions’ labour market (% change relative to forecast)
-0.02
0
0.02
0.04
0.06
0.08
0.1
0.12
2006 2009 2012 2015 2018 2021 2024 2027
Real wage
Employment
Labour supply
Figure 5: Western regions’ labour market (% change relative to forecast)
-0.01
0
0.01
0.02
0.03
0.04
0.05
0.06
0.07
2006 2009 2012 2015 2018 2021 2024 2027
Real wage
Employment
Labour supply

Port of Melbourne Economic Contribution Study 92 CoPS Modelling
Aggregate consumption and investment
Why do both employment and real wages in Melbourne remain above forecast in 2011 and 2012, after the port deepening project has finished? In part, this is because costs savings in port services are already being realised in 2009. But this is not a complete explanation, because both employment and real wages move back towards control in 2012. The answer is that both aggregate investment and consumption in Melbourne rise relative to forecast between 2006 and 2009, and remain above forecast in 2010 and 2011. Aggregate investment persists above forecast throughout the simulation period. The rise in consumption and investment relative to forecast keeps both wages and employment above forecast, even after the investment phase has finished, as investment in sectors other than “water transport services” grows with additional demands in the local economy. Sluggish wage adjustments mean that employment drops below supply from 2012 to 2015, after which real wages start to rise. The latter phase of rising wages is a consequence of Melbourne’s labour market strengthening relative to forecast as cost savings in port services grow. In the non-metropolitan Victorian regions, generally both aggregate investment and consumption rise relative to forecast when the cost savings in the port services commence in 2009. This is because lower port costs in Melbourne raise the rates of return in a number of sectors across the state, thereby inducing additional investment. This temporarily strengthens employment in each non-metropolitan region until a combination of rates of return being returned to control by additional investments and rising real wages take effect. There is a consequent return in aggregate investment to forecast in each region, although real consumption persists above forecast in all non-metropolitan Victorian regions in the 2020s (figures 6 to 10).
Figure 6: Melbourne’s aggregate consumption and investment (% change relative to forecast)
-0.05
0.00
0.05
0.10
0.15
0.20
0.25
0.30
0.35
0.40
0.45
2006 2009 2012 2015 2018 2021 2024
Aggregate consumption
Aggregate investment

Port of Melbourne Economic Contribution Study 93 CoPS Modelling
Figure 7: Barwon’s aggregate consumption and investment (% change relative to forecast)
-0.10
-0.05
0.00
0.05
0.10
0.15
0.20
0.25
2006 2009 2012 2015 2018 2021 2024
Aggregate consumption
Aggregate investment
Figure 8: Gippsland’s aggregate consumption and investment (% change relative to forecast)
-0.10
-0.05
0.00
0.05
0.10
0.15
0.20
0.25
2006 2009 2012 2015 2018 2021 2024
Aggregate consumption
Aggregate investment

Port of Melbourne Economic Contribution Study 94 CoPS Modelling
Figure 9: Victoria River regions’ aggregate consumption and investment (% change relative to forecast)
-0.05
0.00
0.05
0.10
0.15
0.20
0.25
2006 2009 2012 2015 2018 2021 2024
Aggregate consumption
Aggregate investment
Figure 10: Western regions’ aggregate consumption and investment (% change relative to forecast)
-0.04
-0.02
0.00
0.02
0.04
0.06
0.08
0.10
0.12
0.14
2006 2009 2012 2015 2018 2021 2024
Aggregate consumption
Aggregate investment
Income composition in each region
Melbourne’s capital stocks start to rise above forecast in 2007. Employment heads back to forecast levels after 2011, yet capital stocks continue to grow relative to forecast. An explanation starts at the national level: in the long run, rates of return on capital adjust back to forecast levels, while in the labour market, national employment returns to forecast (figure 11). That is, there is a quantity adjustment in the capital market and a price adjustment in the labour market in the long run. Therefore, the cost savings in Melbourne’s port services should translate, at the national level, to a higher aggregate capital stock and, with higher capital-to-labour ratios, higher real wages.

Port of Melbourne Economic Contribution Study 95 CoPS Modelling
The proportional increase in capital stocks is larger in the Melbourne region than other regions, reflecting the direct impact of the project. Capital stocks in Barwon, the River regions and West Victoria (a composite of Wimmera, Central Highlands and Western Districts statistical divisions) all eventually rise relative to forecast (figures 13, 15 and 16). Gippsland does not fare as well. An explanation for this appears in the next section, as it relates to the industry composition and sales destinations of Gippsland output.
Figure 11: Australia’s real GDP, factor inputs and wages (% change relative to forecast)
-0.005
0
0.005
0.01
0.015
0.02
0.025
0.03
0.035
2006 2009 2012 2015 2018 2021 2024 2027
Real GDP
Real wage
Capital stocks
Employment
Figure 12: Melbourne’s real GRP and aggregate factor inputs (% change relative to forecast)
-0.02
0
0.02
0.04
0.06
0.08
0.1
0.12
0.14
0.16
2006 2009 2012 2015 2018 2021 2024 2027
Real GRP
Employment
Capital stocks

Port of Melbourne Economic Contribution Study 96 CoPS Modelling
Figure 13: Barwon’s real GRP and aggregate factor inputs (% change relative to forecast)
-0.02
-0.01
0
0.01
0.02
0.03
0.04
0.05
0.06
2006 2009 2012 2015 2018 2021 2024 2027
Real GRP
Employment
Capital stocks
Figure 14: Gippsland’s real GRP and aggregate factor inputs (% change relative to forecast)
-0.015
-0.01
-0.005
0
0.005
0.01
0.015
0.02
0.025
0.03
0.035
0.04
2006 2009 2012 2015 2018 2021 2024 2027
Real GRP
Employment
Capital stocks

Port of Melbourne Economic Contribution Study 97 CoPS Modelling
Figure 15: Victorian River regions’ real GRP and aggregate factor inputs (% change relative to forecast)
-0.01
0
0.01
0.02
0.03
0.04
0.05
0.06
0.07
0.08
2006 2009 2012 2015 2018 2021 2024 2027
Real GRP
Employment
Capital stocks
Figure 16: Western Regions’ real GRP and aggregate factor inputs (% change relative to forecast)
-0.005
0
0.005
0.01
0.015
0.02
0.025
0.03
0.035
0.04
2006 2009 2012 2015 2018 2021 2024 2027
Real GRP
Employment
Capital stocks
Sectoral changes in each region
Reflecting the direct impacts of the channel deepening project, construction output rises relative to forecast in Melbourne until 2010, and thereafter moves back to control, and water transport and services to transport output rises from 2009 as the productivity gains take effect. Output of petroleum products rises relative to forecast (0.1% above forecast in the 2020s), with slightly larger proportional gains for drinks and slightly less for transport. In other regions, construction output rises relative to forecast once shipping costs are reduced in the port of Melbourne in 2009. Generally, industry output changes are quite small relative to forecast. For example, in Barwon, construction output peaks at 0.2% above control in 2013, In the 2020s, dwellings output, as less than 0.1% above forecast, is the largest winner among the sectors.

Port of Melbourne Economic Contribution Study 98 CoPS Modelling
Gippsland is the (slight) exception among the non-metropolitan regions. This is because more of its sales go via ports outside Victoria than for the other Victorian regions, so that its cost competitiveness may fall slightly with cheaper port services in Melbourne. This appears to be so for broadacre production. Gippsland mining, consisting mainly of oil and gas, is import-competing and loses competitiveness slightly again imports following channel deepening. Nevertheless, the losses in Gippsland are quite small relative to forecast, with neither mining nor broadacre production falling more than 0.1% below forecast (figure 19). The small loss in agricultural output relative to forecast in Gippsland reduces returns to land slightly in the region. This explains why real GRP in figure 14 lies below both employment and capital stocks, as the figure omits the third major income factor, land.
The impact on national welfare
The discounted net present value in the deviation of aggregate consumption from forecast is our measure of welfare. To the extent that foreigners pay for additional capital, net foreign liabilities grow relative to forecast. Disposable income in each region is calculated net of interest payments to foreigners, while government consumption is assumed to be exogenous, leaving aggregate consumption (which is linked to disposable income via the consumption function) as the measure of welfare. The discounted net present value of the welfare gain is $1,700 million, which equates to a continuous annual gain (at 6% discount rate) of $100 million.
Figure 17: Melbourne’s industry outputs (% change relative to forecast)
-0.1
0
0.1
0.2
0.3
0.4
0.5
0.6
0.7
0.8
2006 2009 2012 2015 2018 2021 2024 2027
Water transport services
Drinks
Petrol products
Transport
Construction
Figure 18: Barwon’s industry outputs (% change relative to forecast)
-0.05
0
0.05
0.1
0.15
0.2
0.25
2006 2009 2012 2015 2018 2021 2024 2027
Dwellings
Transport
Construction
Communication services Trade

Port of Melbourne Economic Contribution Study 99 CoPS Modelling
Figure 19: Gippsland’s industry outputs (% change relative to forecast)
-0.1
-0.05
0
0.05
0.1
0.15
2006 2009 2012 2015 2018 2021 2024 2027
Trade
Other Manufactures
Dwellings
Broadacre Mining
Figure 20: Victorian River regions’ industry outputs (% change relative to forecast)
-0.05
0
0.05
0.1
0.15
0.2
0.25
2006 2009 2012 2015 2018 2021 2024 2027
DwellingsCommunication services
Trade
Construction
Other services
Figure 21: Western Regions’ industry outputs (% change relative to forecast)
-0.02
0
0.02
0.04
0.06
0.08
0.1
0.12
0.14
2006 2009 2012 2015 2018 2021 2024 2027
Dwellings
Communication services
Trade
Construction
Other services

Port of Melbourne Economic Contribution Study 100 CoPS Modelling
References ABS (2001), Agricultural census.
Access Economics (2003), Business Outlook, March 2003, Canberra.
Adams, P., Horridge, M. Wittwer, G. (2002), MMRF-Green: A dynamic multi-regional applied general equilibrium model of the Australian economy, based on the MMR and MONASH models, prepared for the Regional GE Modelling Course, 25-29 November 2002.
Dixon P.B. and Rimmer, M.T. (2002), Dynamic General Equilibrium Modelling for Forecasting and Policy: a Practical Guide and Documentation of MONASH, Contributions to Economic Analysis 256, North-Holland Publishing Company, Amsterdam.
Horridge, M., Madden, J. and Wittwer, G. 2003, ‘Using a highly disaggregated multi-regional single-country model to analyse the impacts of the 2002-03 drought on Australia’, Centre of Policy Studies Working Paper G-141, http://www.monash.edu.au/policy/elecpapr.htm
Naqvi, F. and Peter, M. (1996), ‘A Multiregional, Multisectoral model of the Australian Economy with an Illustrative Application’ Australian Economic Papers, 35, 94-113.

Port of Melbourne Economic Contribution Study 101 CoPS Modelling
The model TERM (The Enormous Regional Model) is a dynamic, multi-regional CGE model of Australia (Horridge et al. 2003). This is a new multi-regional model, in the style of the Monash Multiregional Forecasting (MMRF) model (Naqvi & Peter 1996; Adams et al. 2002). Potentially, it can distinguish 167 sectors and the 58 states and territories. In applications, it is computationally convenient to aggregate the model with the choice of aggregation determined by the focus of the study. For the application reported in this paper, we use a six-region aggregation of the master database, with Melbourne, Barwon, the composite River regions (Ovens-Murray, Loddon, Goulburn and the Mallee), the composite West of Victoria regions (Wimmera, Central Highlands and Western Districts), Gippsland and the rest of Australia represented separately. Horridge et al. (2003) describes the preparation of the master database, which was further disaggregated to meet the requirements of Plant Health Australia (see Background). The theory of TERM is much the same as that in national dynamic CGE models such as MONASH (Dixon and Rimmer 2002). Each industry in TERM selects inputs of labour, capital and materials to minimise the costs of producing its output. The levels of output are chosen to satisfy demands and demands reflect prices and incomes. Investment in each industry reflects rates of return and capital reflects past investments and depreciation. However, instead of a commodity being produced by a single national industry, in TERM model the commodity is produced by an industry in each region. Instead of having two sources of supply (domestic and imported), in TERM commodity users have many sources of supply (each region in the chosen aggregation plus imports). Instead of having a single government and a single household, TERM has a national government, state governments (in this application, Victoria and the rest of Australia) and a household in each region. Regions in TERM are specified as separate economies, linked by trade. TERM imposes a fixed exchange rate and free trade between regions, and common external tariffs. In this sense, TERM remains a national model, rather than international. This means that behaviour in foreign markets is determined outside the model (i.e. exogenously). TERM can be run in two modes: forecasting and policy. In forecasting mode, it takes as inputs forecasts of macro and trade variables from organisations such as Access Economics (2003) and ABARE, together with trend forecasts of demographic, technology and consumer-preference variables. It then produces detailed forecasts for industries, regions and occupations. In policy mode, it produces deviations from forecast paths in response to shocks such as changes in taxes, tariffs, technologies, world commodity prices and, in agriculture, disease outbreaks.
The key assumptions
CGE models such as TERM can be run under many different sets of assumptions concerning macro- and micro-economic behaviour. The key assumptions underlying our simulation of the effects of the hypothetical disease outbreak are as follows.

Port of Melbourne Economic Contribution Study 102 CoPS Modelling
Public expenditure and taxes
We assume that the disease outbreak makes no difference to the path of real public consumption with changes in budgetary balances arising from changes in the level of economic activity.
Labour market
The regional labour market adjustment mechanism, in levels, is given by:
1
1
1 1r r rr
tt t tr r r rt t t t
W W LSEMPWf Wf EMPf LSf
α−
−
⎛ ⎞ ⎛ ⎞ ⎛ ⎞− = − + −⎜ ⎟ ⎜ ⎟ ⎜ ⎟⎜ ⎟ ⎜ ⎟ ⎜ ⎟
⎝ ⎠ ⎝ ⎠ ⎝ ⎠ (1)
The interpretation of (1) is that if the deviation shock weakens the labour market in region r and period t relative to forecast, real wages r
tW in deviation will fall
relative to forecast rtWf . In addition, there will be an initial enlarged gap between
labour market demand rtEMP and supply LSr
t , relative to forecast levels EMPf rt
and LSf rt . In successive years, the gap between demand and supply will
gradually return to forecast through a further decline in real wages. The speed of labour market adjustment is governed by α (a positive parameter). The regional labour supply equation is:
( )( )
( )( )
rrrttt
r q q q qt t t t tq q
WfWLSLSf W S Wf Sf
γγ
γ γ=∑ ∑
(2)
The deviation in regional labour supply from forecast depends on the deviation in regional relative to national real wages from forecast. In (2), ( )∑
q
qt
qt SWγ is a
measure of labour responsiveness to real wages summed across all regions, where γ is a positive parameter and Sq
t the share of region q in national employment. This equation implies that should the deviation in real wages in a region fall relative to the deviation in national real wages from forecast, its labour supply will fall, while that in other regions will rise. Combining (1) and (2), adjustment in the labour market in a given region will initially occur via a combination of additional unemployment and lower real wages. Unemployment will eventually return to forecast rates, with lower real wages. As real wages fall relative to control, the region’s labour supply will also fall. Within this theory, long run labour market adjustment occurs as a combination of inter-regional labour migration and changes in regional real wage differentials.

Port of Melbourne Economic Contribution Study 103 CoPS Modelling
Rates of return on industry capital stocks
In simulations of the effects of shocks, TERM allows for short-run divergences in the ratios of actual to required rates of return from their levels in the base case forecasts. Short-run increases/decreases in these ratios cause increases/decreases in investment. Movements in investment are reflected with a lag in capital stocks. These adjustments in capital stocks gradually erode initial divergences in the rate of return ratios.
Production technologies
TERM contains variables describing: primary-factor and intermediate-input-saving technical change in current production; input-saving technical change in capital creation; and input-saving technical change in the provision of margin services (e.g. transport and retail trade). In our simulation, all these variables are held on their base case forecast paths except for shipping services, with productivity gains being attributed to the water transport & services to transport sector.

Port of Melbourne Economic Contribution Study 104
THIS PAGE HAS BEEN LEFT BLANK INTENTIONALLY

Port of Melbourne Economic Contribution Study 105 Glossary
Appendix B
Glossary

Port of Melbourne Economic Contribution Study 106 Glossary
Break bulk General (i.e. non-bulk) cargo which is not containerised (eg. vehicles, timber, paper)
Coastal trade Sea trade between Australian ports
Containerised cargo Cargo that is transported in standard shipping containers
Displacement The total weight of the vessel, i.e. the amount of water the vessel will displace
Draught The depth of water that a ship must displace in order to remain afloat. The maximum draught is the amount of water displaced by a ship to remain afloat while carrying its capacity load.
Dry bulk cargo Non-liquid cargos which are transported and handled in bulk (eg. cement, grain)
General cargo All non-bulk cargos (including containerised and break bulk cargo)
Revenue tonnes Greater of one mass tonne or one cubic metre of cargo
Ro-Ro (Roll on-Roll off) Transportation mode utilising ramp equipped vessels where wheeled equipment and cargo on flatbeds can be driven on or off
Stripping The process of removing cargo from a container, or the process for pumping the last of the cargo from a liquid bulk carrier
TEU Twenty foot equivalent unit. This is a unit of measurement equal to the space occupied by a standard 20 foot container.

Port of Melbourne Economic Contribution Study 107 Stakeholders consulted
Appendix C
Stakeholders consulted

Port of Melbourne Economic Contribution Study 108 Stakeholders consulted
Australian Industry Group Australian Shippers Association Business Council of Australia Channel Deepening Project Stakeholder Advisory Committee (PSAC), Port of Melbourne Corporation Department of Infrastructure Department of Innovation, Industry and Regional Development Dive Industry Victoria Association P&O Ports Pacific National Port of Melbourne Corporation Shell Australia Toll Shipping Associate Professor Kim Hassall, University of Melbourne and Raptour Consulting Victorian Employers Chamber of Commerce and Industry Victorian Farmers Federation VFLC Secretariat, Victorian Freight and Logistics Council Victorian Transport Association

Port of Melbourne Economic Contribution Study 109 Geographic distribution of the indicative economic benefits of the Port of Melbourne
Appendix D
Geographic distribution of the indicative economic benefits of the
Port of Melbourne
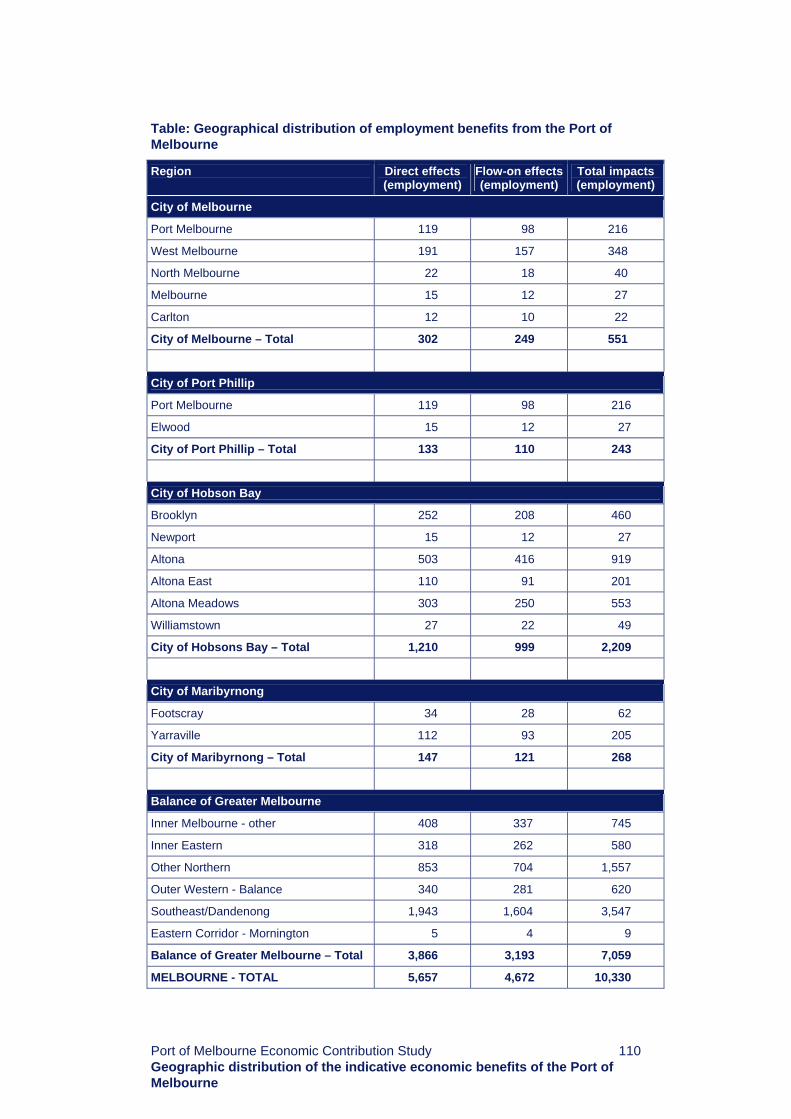
Port of Melbourne Economic Contribution Study 110 Geographic distribution of the indicative economic benefits of the Port of Melbourne
Table: Geographical distribution of employment benefits from the Port of Melbourne
Region Direct effects (employment)
Flow-on effects (employment)
Total impacts(employment)
City of Melbourne
Port Melbourne 119 98 216
West Melbourne 191 157 348
North Melbourne 22 18 40
Melbourne 15 12 27
Carlton 12 10 22
City of Melbourne – Total 302 249 551
City of Port Phillip
Port Melbourne 119 98 216
Elwood 15 12 27
City of Port Phillip – Total 133 110 243
City of Hobson Bay
Brooklyn 252 208 460
Newport 15 12 27
Altona 503 416 919
Altona East 110 91 201
Altona Meadows 303 250 553
Williamstown 27 22 49
City of Hobsons Bay – Total 1,210 999 2,209
City of Maribyrnong
Footscray 34 28 62
Yarraville 112 93 205
City of Maribyrnong – Total 147 121 268
Balance of Greater Melbourne
Inner Melbourne - other 408 337 745
Inner Eastern 318 262 580
Other Northern 853 704 1,557
Outer Western - Balance 340 281 620
Southeast/Dandenong 1,943 1,604 3,547
Eastern Corridor - Mornington 5 4 9
Balance of Greater Melbourne – Total 3,866 3,193 7,059
MELBOURNE - TOTAL 5,657 4,672 10,330

Port of Melbourne Economic Contribution Study 111 Geographic distribution of the indicative economic benefits of the Port of Melbourne
Region Direct effects
(employment) Flow-on effects
(employment)
Total impacts (employment)
Barwon-Western 120 99 219
Central Highlands-Wimmera 643 531 1,174
Loddon-Mallee 220 182 402
Goulburn-Ovens-Murray 64 52 116
Gippsland 34 28 62
Regional Victoria - TOTAL 1,080 892 1,972
NSW 435 359 794
Queensland 2 2 4
South Australia 15 12 27
Other 191 157 348
Balance of Australia and Other 643 531 1,174
GRAND TOTAL 7,380 6,095 13,475

Port of Melbourne Economic Contribution Study 112 Geographic distribution of the indicative economic benefits of the Port of Melbourne
Table: Geographical distribution of value added benefits from the Port of Melbourne
Region Direct Effects ($)
Flow-on Effects
($) Total Impact
($)
City of Melbourne
Port Melbourne 9,396,539 8,616,739 18,013,277
West Melbourne 15,111,959 13,857,848 28,969,807
North Melbourne 1,743,688 1,598,982 3,342,670
Melbourne 1,162,458 1,065,988 2,228,447
Carlton 968,715 888,324 1,857,039
City of Melbourne – Total 23,927,269 21,941,592 45,868,861
City of Port Phillip
Port Melbourne 9,396,539 8,616,739 18,013,277
Elwood 1,162,458 1,065,988 2,228,447
City of Port Phillip – Total 10,558,997 9,682,727 20,241,724
City of Hobson Bay
Brooklyn 19,955,536 18,299,465 38,255,001
Newport 1,162,458 1,065,988 2,228,447
Altona 39,911,071 36,598,931 76,510,002
Altona East 8,718,438 7,994,912 16,713,350
Altona Meadows 24,024,140 22,030,424 46,054,565
Williamstown 2,131,174 1,954,312 4,085,486
City of Hobsons Bay – Total 95,902,817 87,944,033 183,846,851
City of Maribyrnong
Footscray 2,712,403 2,487,306 5,199,709
Yarraville 8,912,181 8,172,577 17,084,758
City of Maribyrnong – Total 11,624,584 10,659,883 22,284,467
Balance of Greater Melbourne
Inner Melbourne – other 32,355,092 29,670,007 62,025,099
Inner Eastern 25,186,599 23,096,413 48,283,011
Other Northern 67,616,330 62,004,985 129,621,315
Outer Western - Balance 26,930,286 24,695,395 51,625,681
Southeast/Dandenong 154,025,737 141,243,447 295,269,184
Eastern Corridor - Mornington 387,486 355,329 742,816
Balance of Greater Melbourne – Total 306,501,530 281,065,576 587,567,106
Melbourne - TOTAL 448,515,197 411,293,811 859,809,008
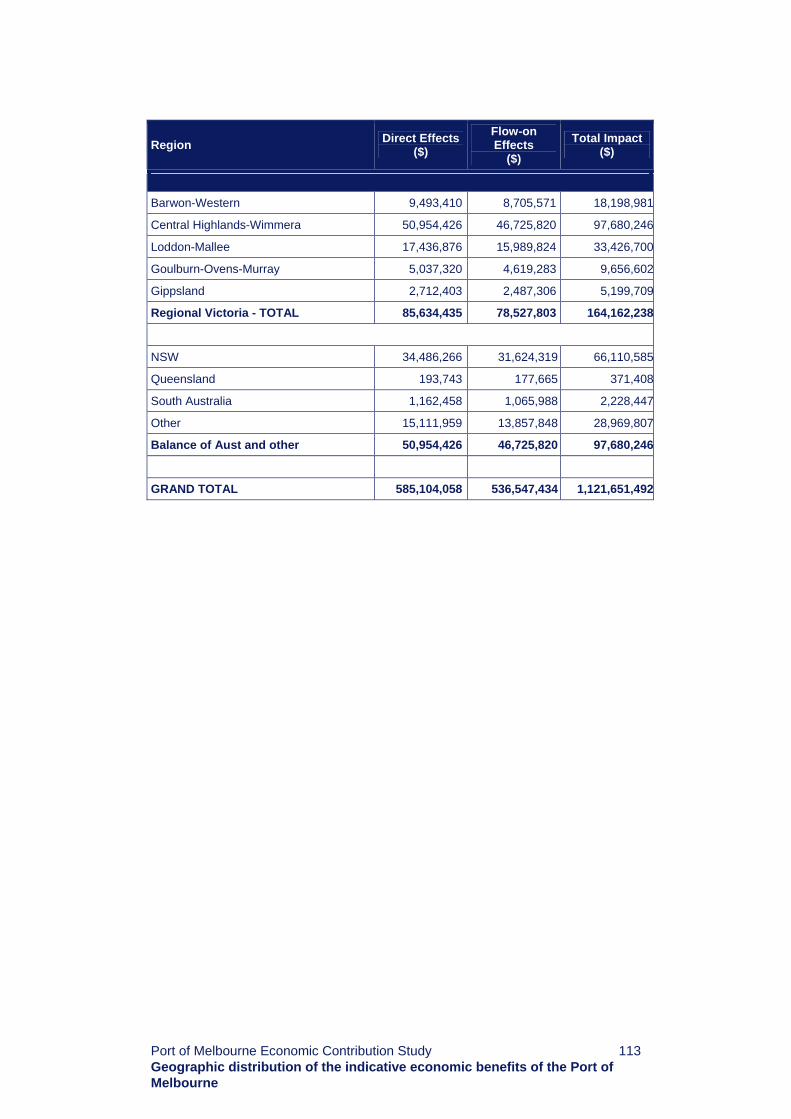
Port of Melbourne Economic Contribution Study 113 Geographic distribution of the indicative economic benefits of the Port of Melbourne
Region Direct Effects ($)
Flow-on Effects
($) Total Impact
($)
Barwon-Western 9,493,410 8,705,571 18,198,981
Central Highlands-Wimmera 50,954,426 46,725,820 97,680,246
Loddon-Mallee 17,436,876 15,989,824 33,426,700
Goulburn-Ovens-Murray 5,037,320 4,619,283 9,656,602
Gippsland 2,712,403 2,487,306 5,199,709
Regional Victoria - TOTAL 85,634,435 78,527,803 164,162,238
NSW 34,486,266 31,624,319 66,110,585
Queensland 193,743 177,665 371,408
South Australia 1,162,458 1,065,988 2,228,447
Other 15,111,959 13,857,848 28,969,807
Balance of Aust and other 50,954,426 46,725,820 97,680,246
GRAND TOTAL 585,104,058 536,547,434 1,121,651,492

Port of Melbourne Economic Contribution Study 114 Geographic distribution of the indicative economic benefits of the Port of Melbourne
Table: Geographical distribution of production benefits from the Port of Melbourne
Output Direct Effects ($ million)
Flow-on Effects ($ million)
Total Impact ($ million)
City of Melbourne
Port Melbourne 21,121,383 18,373,636 39,495,019
West Melbourne 33,968,410 29,549,353 63,517,763
North Melbourne 3,919,432 3,409,541 7,328,973
Melbourne 2,612,955 2,273,027 4,885,982
Carlton 2,177,462 1,894,189 4,071,651
City of Melbourne – Total 53,783,316 46,786,476 100,569,792
City of Port Phillip
Port Melbourne 21,121,383 18,373,636 39,495,019
Elwood 2,612,955 2,273,027 4,885,982
City of Port Phillip – Total 23,734,338 20,646,663 44,381,001
City of Hobson Bay
Brooklyn 44,855,721 39,020,300 83,876,021
Newport 2,612,955 2,273,027 4,885,982
Altona 89,711,442 78,040,599 167,752,041
Altona East 19,597,160 17,047,704 36,644,863
Altona Meadows 54,001,062 46,975,895 100,976,957
Williamstown 4,790,417 4,167,216 8,957,633
City of Hobsons Bay – Total 215,568,756 187,524,741 403,093,497
City of Maribyrnong
Footscray 6,096,894 5,303,730 11,400,624
Yarraville 20,032,652 17,426,542 37,459,194
City of Maribyrnong – Total 26,129,546 22,730,272 48,859,818
Balance of Greater Melbourne
Inner Melbourne - other 72,727,237 63,265,923 135,993,160
Inner Eastern 56,614,017 49,248,922 105,862,939
Other Northern 151,986,860 132,214,413 284,201,274
Outer Western - Balance 60,533,449 52,658,463 113,191,911
Southeast/Dandenong 346,216,487 301,176,099 647,392,586
Eastern Corridor - Mornington 870,985 757,676 1,628,661
Balance of Greater Melbourne – Total 688,949,034 599,321,495 1,288,270,529
Melbourne - TOTAL 1,008,164,990 877,009,646 1,885,174,637

Port of Melbourne Economic Contribution Study 115 Geographic distribution of the indicative economic benefits of the Port of Melbourne
Output Direct Effects ($ million)
Flow-on Effects ($ million)
Total Impact ($ million)
Barwon-Western 21,339,129 18,563,055 39,902,185
Central Highlands-Wimmera 114,534,511 99,634,357 214,168,868
Loddon-Mallee 39,194,319 34,095,407 73,289,727
Goulburn-Ovens-Murray 11,322,803 9,849,784 21,172,588
Gippsland 6,096,894 5,303,730 11,400,624
Regional Victoria - TOTAL 192,487,657 167,446,334 359,933,991
NSW 77,517,654 67,433,139 144,950,793
Queensland 435,492 378,838 814,330
South Australia 2,612,955 2,273,027 4,885,982
Other 33,968,410 29,549,353 63,517,763
Balance of Australia and Other 114,534,511 99,634,357 214,168,868
GRAND TOTAL 1,315,187,158 1,144,090,338 2,459,277,496

Port of Melbourne Economic Contribution Study 116
THIS PAGE HAS BEEN LEFT BLANK INTENTIONALLY

Port of Melbourne Economic Contribution Study 117 Port Phillip Bay shipping channels
Appendix E
Port Phillip Bay shipping channels
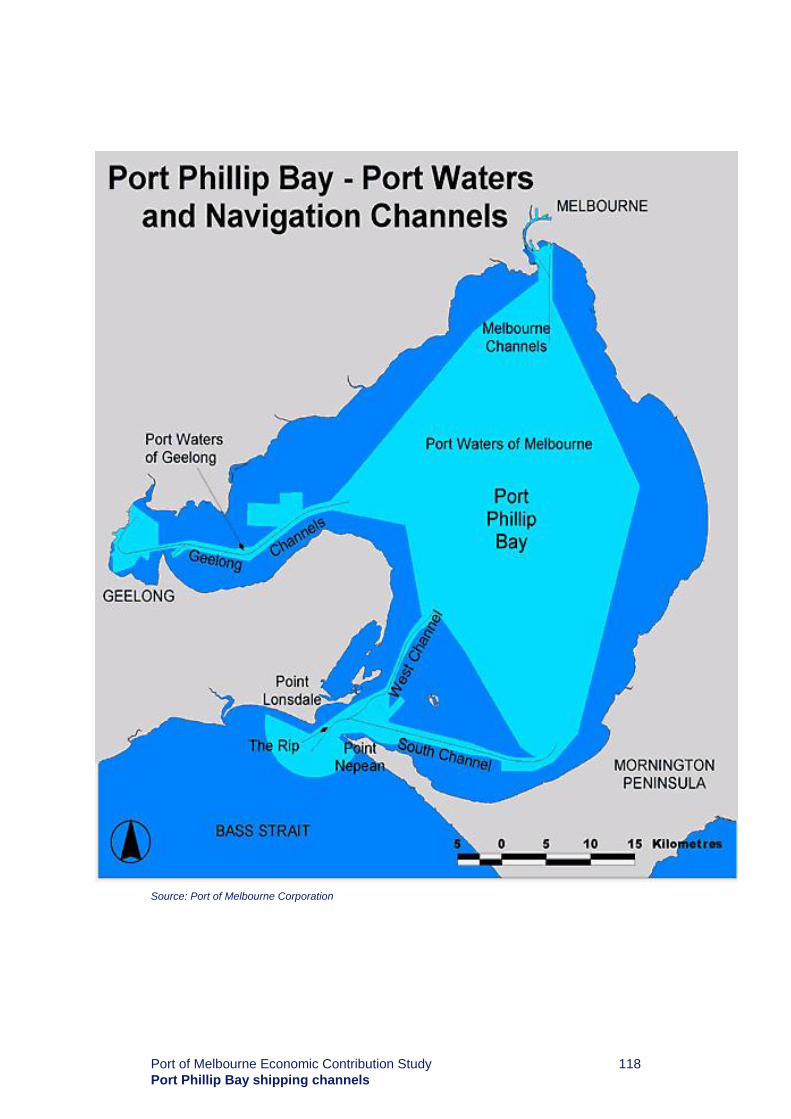
Port of Melbourne Economic Contribution Study 118 Port Phillip Bay shipping channels
Source: Port of Melbourne Corporation

Port of Melbourne Economic Contribution Study 119 Port of Melbourne: port precinct
Appendix F
Port of Melbourne: port precinct

Port of Melbourne Economic Contribution Study 120 Port of Melbourne: port precinct
Source: Port of Melbourne Corporation

Port of Melbourne Economic Contribution Study 121 Minister’s Statement on SEES
Appendix G
Minister’s Statement on SEES

Port of Melbourne Economic Contribution Study 122 Minister’s Statement on SEES
Minister’s Statement Port Phillip Bay Channel Deepening Supplementary Environment Effects Statement
July 2005
Minister’s Foreword On 31 March 2005, I released a Statement in response to the Report of the independent Panel Inquiry on the Port Phillip Bay Channel Deepening Proposal, together with the Panel’s Report. My Statement presented a provisional response to the Panel’s findings and recommendations and invited public submissions in response. A total of 80 submissions were received. I now confirm that the Port of Melbourne Corporation (PoMC) must prepare a supplementary statement or “Supplementary Environment Effects Statement” (SEES) in accordance with section 5 of the Environment Effects Act 1978. The SEES must now be prepared and exhibited for public comment before I complete an Assessment of the environmental effects of the proposal under the Act to inform relevant approval decisions. This document sets out the process that I intend to be applied for the preparation of the SEES, as well as the further stages of the assessment process. The SEES is intended to provide supplementary information to that contained in PoMC’s Environment Effects Statement (EES) exhibited on 5 July 2004. This is necessary in the context of a range of shortcomings in the exhibited EES documentation. The Panel’s recommendations, when taken together, focus on: • Justification of the project design;
• Benchmarking of available technologies for dredging and dredged material placement as well as demonstration of their feasibility; and
• Direct physical changes resulting from the project (e.g. hydrodynamic changes, turbidity generation, dredging and placement of contaminated sediment).
The Panel also identified concerns with the risk assessment applied in the EES, which has consequences for the evaluation of the spectrum of environmental effects. My general response to the recommendations of the Panel, including in relation to the matters that the SEES will need to address, is set out in the Statement on the following pages. However, a few preliminary observations are needed to establish the context for the SEES: 1 While the Panel focussed on issues related to project design, technology
and physical impacts, there is a need to consider any consequential environmental, social and economic effects, directly attributable to the project.

Port of Melbourne Economic Contribution Study 123 Minister’s Statement on SEES
2 The investigations underpinning the EES, with limited exceptions, were methodologically sound. This work can now be built upon in the SEES to provide the foundations for further targeted studies to assist a comprehensive and integrated assessment of existing and new information.
3 PoMC has undertaken extensive further studies since the completion of the Panel hearing, including obtaining expert peer reviews of key investigations. Much of this work, together with additional work necessary to address outstanding matters, will need to be incorporated in the SEES.
4 The EES and the SEES deal with the project proposed by the Victorian Channels Authority and its successor, PoMC. This proposal for the deepening of the main channels in Port Phillip Bay, was proposed after a strategic review found it to be the superior economic option for Victoria to accommodate predicted trade growth, compared to alternatives such as developing the Port of Hastings and “land bridging” to move freight to and from other Australian ports. The Government has given its in-principle support of the proposal, subject to environmental, financial and technical provisos.
One of the Panel’s recommendations was that a trial dredging program be conducted in or near the Heads to test its feasibility. The Panel also recommended further field testing of turbidity plumes and other aspects. The response in my March Statement gave provisional support to the concept of a trial dredging program. Such a program would provide a valuable means of field testing a range of aspects, including technical feasibility, environmental effects and environmental management measures. A detailed proposal has now been prepared by PoMC for a trial dredging program. Having received advice from the Department of Sustainability and Environment that the proposed trial dredging program would not have a significant effect on the environment, if the proposed works are managed in accordance with PoMC’s proposed environmental management framework, I have determined that an order under section 3(1) of the Environment Effects Act is not required for the trial dredging works. Consequently, an EES is not required for the trial dredging. I am satisfied that trial dredging will significantly assist the assessment of the Channel Deepening Proposal. A more detailed framework for the scope of the SEES is set out in Draft Assessment Guidelines, released for public comment for a period of four weeks. The SEES is intended to enable the full and effective assessment of the potential environmental effects of the Channel Deepening Proposal. There will be a formal opportunity for public comment in response to the exhibited SEES, which will be followed by a further independent Panel Inquiry. ROB HULLS MP MINISTER FOR PLANNING

Port of Melbourne Economic Contribution Study 124 Minister’s Statement on SEES
Minister’s Statement for Channel Deepening Proposal Supplementary Environment Effects Statement
Preamble
This Statement sets out the directions for the preparation of the Port Phillip Bay Channel Deepening SEES and the further stages of the assessment process. The contents are summarised as follows: 1 The purpose of the SEES process;
2 The objectives of the SEES;
3 A proposed structured approach for undertaking the SEES investigations; and
4 The elements of the SEES process, including the steps involved and the responsibilities of key parties.
More detailed guidance for the SEES will be set out in the SEES Assessment Guidelines, a draft of which is available for public comment. The Guidelines will identify the matters needing to be investigated and documented to inform the Assessment of the project under the Environment Effects Act. While the EES substantially covered these matters, an update to the original EES Assessment Guidelines (issued in 2002) is needed to identify the matters to be further investigated in the SEES to inform the final Assessment. The SEES Assessment Guidelines will encompass and therefore replace the original EES Assessment Guidelines, largely to provide clarity on the full range of matters relevant to the final Assessment under the Environment Effects Act. The results of further investigations will need to be integrated with the EES studies. Some components of the EES may also need to be updated or revised to achieve a sound and effectively integrated body of analysis. It will be the responsibility of the proponent to investigate and document relevant matters, including those that emerge during the course of preparing the SEES.
1 Purpose of SEES
A supplementary statement or “Supplementary Environment Effects Statement” (SEES) is now to be prepared by the Port of Melbourne Corporation (PoMC) in accordance with section 5 of the Environment Effects Act. The purpose of the SEES is to provide a clearly documented body of analysis to inform the final Assessment by the Minister for Planning of the Channel Deepening Proposal under the Environment Effects Act. Public submissions and the report of a Panel Inquiry to be appointed under the Act will also inform the Assessment. The Assessment will in turn inform decision-making under relevant legislation, including the Coastal Management Act 1995 and Environment Protection and Biodiversity Conservation Act 1999.

Port of Melbourne Economic Contribution Study 125 Minister’s Statement on SEES
2 Objectives of SEES
The SEES is part of the extended assessment process under the Environment Effects Act. Four specific objectives of the SEES are set out below.
Project Description
• Objective 1 - Provide a description of the Channel Deepening project, following necessary technical reviews of the proposed project design and technology, supported by documentation of:
a The project rationale;
b Its technical feasibility (especially the proposed dredging technology and management of contaminated sediment from the Yarra);
c Consistency with statutory provisions and performance standards, including for navigational safety and environment protection;
d The merits of design, technological and work method alternatives; and
e The consideration of environmental, social, safety and economic factors.
• Objective 2 - Provide a description of the implementation strategy for the Channel Deepening Proposal, including for the proposed technology and work arrangements to manage environmental risks, supported by documentation of:
a Technical reviews and field testing;
b Evaluation of the likely effectiveness of the proposed environmental management regime, including its practical measures; and
c An improved framework for managing environmental risks.
Assessment of Impacts
• Objective 3 - Provide an assessment of the risks of specific environmental effects arising from the refined project, on the basis of further investigations building on the EES studies, especially with respect to:
a Space-time modelling of turbidity plumes generated during the proposed dredging campaign;
b Modelling of ecological process responses, including both primary production and nutrient cycling;
c Implications for risks associated with contaminated sediments;
d Implications for risks to ecological communities and species of conservation significance; and
e Implications for risks to other beneficial (non shipping) uses of the Bay’s environmental assets, including related economic and social risks.
• Objective 4 - Consolidate and integrate the results of the new SEES studies with the key outcomes of the EES studies, having regard to relevant legislative and policy provisions.

Port of Melbourne Economic Contribution Study 126 Minister’s Statement on SEES
3 Structured Approach to Preparing the Supplementary EES
To address the four objectives under section 2 (above), the following general approach for preparing the SEES should be adopted: 1 Refinement of the environmental risk assessment methodology and criteria
used in the EES, to ensure that:
• The methodology to be applied in the SEES is clearly described and represents the significance of potential changes to ecological and other environmental assets, as well as takes account of uncertainty associated with both the current knowledge of environmental processes and the management of environmental risks; and
• Risk assessment criteria reflect relevant technical and scientific knowledge, as well as applicable statutory provisions and associated policy.
2 Critical review of the characterisation of the environmental risks associated with the Channel Deepening proposal. Disciplinary experts and other people with expert knowledge of the Bay environment and available management measures should work together (with PoMC) to develop a shared understanding of environmental risks associated with the affected systems, as well as critical information gaps, relevant performance indicators and management options.
3 A critical review of the project design, as well as relevant alternatives, should determine whether changes are needed to minimise risks, comply with policy requirements, and achieve an optimal balance of environmental, economic and social outcomes.
4 Benchmarking of the proposed dredging technology and dredged material management methods for the project should occur, against the availability of best practice technologies that might be economically applied to minimise environmental and related risks.
5 Field testing of turbidity plumes, seasonal and light dependency of primary production, effects on denitrification processes, as well as methods for management of dredging and dredged material is needed.
6 Relevant calibration and further modelling is needed for the turbidity plumes that would be generated during the dredging campaign, as well as further assessment of potential long-term changes to sediment transport and coastal processes in southern Port Phillip Bay as a result of any change in currents.
7 Necessary extension of previous baseline studies and research should occur, as well as consolidation with the results of previous studies, to characterise the existing environment assets that may be impacted by the project, especially in the context of predictions of turbidity plumes and other physical changes.
8 Refinement of ecological modelling to underpin the assessment and management of risks to primary production and nutrient cycling should occur.
9 Assessment of the risks to environmental assets arising from the following is needed, to an extent proportionate to the magnitude of the risks involved:
• Direct removal, destruction or burial of assets;

Port of Melbourne Economic Contribution Study 127 Minister’s Statement on SEES
• Effects on primary production or nutrient cycling within Bay ecosystems;
• Effects on species, ecological communities or areas of conservation significance; and
• Changes to the availability or quality of assets (i.e. beneficial uses) for other Bay users.
10 Assessment of the effectiveness of proposed risk mitigation and management measures, in the context of uncertainties about both operational measures and capacities as well as environmental responses, including in relation to:
• ‘Proof of concept’ modelling of the effects of elevated turbidity on primary production;
• The proposed environmental management system;
• The proposed ‘adaptive management’ regime, including the statistical design of the monitoring program, and demonstrated capacities to implement response measures in real-time to ensure satisfactory environmental performance; and
• Proposed offsetting measures.
11 Integrated assessment of anticipated outcomes with respect to relevant evaluation objectives and performance criteria, in light of the applicable legislation and policy and the potential effects of the proposal.
4 Elements of SEES Process
The preparation of a SEES by PoMC is intended to build upon both the studies done for the EES and the review undertaken by the independent Panel Inquiry. The following outlines the steps in the SEES process, which will ultimately lead to the completion of an Assessment of the proposal under the Environment Effects Act: 1 Draft Assessment Guidelines on the scope of the SEES are prepared by the
Department of Sustainability and Environment1 (DSE), after considering public comments received in response to the Minister’s Statement and the Panel Report which were issued on 31 March 2005;
2 The Draft SEES Assessment Guidelines are advertised for public comment by DSE for a period of four weeks;
3 Final SEES Assessment Guidelines are prepared after considering public comments on the exhibited draft, as well as advice from an Independent Expert Group to be appointed by DSE. If a trial dredging program is carried out by PoMC, the Assessment Guidelines will be reviewed by DSE, with advice from the Independent Expert Group, in light of monitoring and evaluation of the trial dredging to determine whether any changes to the guidelines are needed.
4 The SEES will be prepared either by or on behalf of PoMC. The proponent will need to investigate and document relevant matters, including those that emerge during the course of developing the SEES. During the preparation of the SEES the following should occur:
a PoMC will need to undertake a program of stakeholder and community consultation for the purposes of:
• informing interested parties of its proposal, its program of investigation and interim results;

Port of Melbourne Economic Contribution Study 128 Minister’s Statement on SEES
• seeking views and local knowledge with respect to environmental risks that may need closer investigation;
• discussing opportunities to address environmental risks; and
• providing constructive feedback on inputs received.
b A Project Taskforce, convened by the Department of Infrastructure, is to provide practical advice and support to PoMC with respect to taking forward its program of investigations.
c DSE will coordinate advice to PoMC on the preparation of the SEES, including any necessary clarification regarding the matters to be investigated and documented in relation to the Assessment Guidelines.
d The Independent Expert Group will use its individual members’ expertise to advise DSE on:
• the SEES Assessment Guidelines;
• the technical adequacy of study briefs and study outputs as part of the preparation of the SEES;
• the need for and scope of any other necessary independent peer reviews of SEES studies; and
• other matters referred to it by DSE.
5 The suitability of the SEES for public exhibition will be determined by DSE1, having regard to the SEES Assessment Guidelines.
6 The SEES will be exhibited for public comment for a period of six weeks, after it is completed by PoMC to a satisfactory quality.
7 An inquiry will be appointed under section 9(1) of the Environment Effects Act to consider public submissions, hold public hearings and provide its Report to the Minister for Planning in response to its terms of reference.
8 The Minister for Planning will determine and release an Assessment of the Channel Deepening Proposal under the Environment Effects Act and provide this to the relevant decision-makers.
The terms of reference and protocols for the Independent Expert Group should clearly establish its independence from PoMC. It should be appointed with expertise in the fields of shallow marine ecosystem processes, shallow marine hydrodynamics, and dredging, at a minimum. Similarly, the terms of reference and protocols for the Project Taskforce should clearly establish its independence from the administration of the SEES process. The appointment of a stakeholder advisory committee will be a valuable element in the program of stakeholder and community consultation to be undertaken by PoMC during the preparation of the SEES. The stakeholder advisory committee could provide advice to PoMC on both the design of the program of stakeholder and community consultation and feedback on its implementation. The committee could also provide advice to PoMC on their program of investigations necessary to address the required scope for the SEES.

THIS PAGE HAS BEEN LEFT BLANK INTENTIONALLY

THIS PAGE HAS BEEN LEFT BLANK INTENTIONALLY

Liability limited by a scheme approved under Professional Standards Legislation
The Economic Contribution of the Port of Melbourne
PART 2

THIS PAGE HAS BEEN LEFT BLANK INTENTIONALLY

Port of Melbourne Economic Contribution Study 133
Contents
1 Introduction 135
2 Sensitivity Analysis 137
3 Importance of the Port of Melbourne to business 143
Appendix A Terms of Reference 149
Appendix B Shipping scenarios (from the base case Port of Melbourne economic impact report) 153
Appendix C Value of the Port of Melbourne 157
Appendix D References for case studies 159

Port of Melbourne Economic Contribution Study 134
THIS PAGE HAS BEEN LEFT BLANK INTENTIONALLY

Port of Melbourne Economic Contribution Study 135 Introduction
1
Introduction

Port of Melbourne Economic Contribution Study 136 Introduction
This study builds on the “base case” work undertaken in the Economic Impact of the Port of Melbourne study (Part 1 of the study), completed by PwC on behalf of the Department of Treasury and Finance in August 2006.
Two of the key outcomes of the base case were:
• an estimate of the economic impact of the Port of Melbourne (“the Port”) on the Victorian and Australian economies. The study estimated that this impact was $2.5 billion per annum; and
• an estimate of the likely economic gain resulting from the Channel Deepening Project (CDP). The study estimated that the total gain in net welfare would be $1.7 billion for the period 2005-2027, and up to $2.2 billion for the period 2005-2035.
In order to test some of the findings of the base case, PwC was commissioned by the Department of Infrastructure and the Department of Treasury and Finance to undertake some additional analysis of the economic significance of the Port and the potential benefits of the CDP.
This report includes:
• sensitivity analysis on:
o the economic impact of the Port varying the definition of port-related infrastructure;
o the net welfare gains from the CDP based on differing assumptions about the rate of gain during the period 2005-2035; and
o the impact on the net welfare gain if the cost of the CDP project were to vary.
• a summary of discussions held with a sample of companies that are major users of the Port. This section provides a description of the importance of the Port to industry as well as some quantitative indications about the significance of these companies to the Victorian economy.

Port of Melbourne Economic Contribution Study 137 Sensitivity Analysis
2
Sensitivity Analysis

Port of Melbourne Economic Contribution Study 138 Sensitivity Analysis
2.1 Economic impact of the Port of Melbourne – varying the definition of port-related infrastructure 2.1.1 Background Based on the capital expenditure and service offering of the Port of Melbourne Corporation (PoMC) and port related businesses, the economic value of the Port was estimated in the base case at $2.5 billion.
The base case considered port-related infrastructure investments undertaken through the PoMC and port services companies (eg. stevedores). It also considered the impact of the CDP investment. The model used an annual average of past and future infrastructure expenditure to determine an average capital investment figure.
This was a conservative approach to modelling which defined port users in a way that is consistent with the BTRE framework and some previous studies of Australian ports.
2.1.2 Sensitivity analysis with additional infrastructure inputs PwC undertook a sensitivity analysis which varied the definition of port-related infrastructure. The analysis included additional logistics and transport infrastructure that would be funded by the Victorian Government, and which will have an impact on the efficiency of the port-linked transport, distribution and logistics network.
The results of economic modelling differ if this other port-related infrastructure expenditure is included in the economic impact calculation.
The sensitivity analysis involved a re-estimation of the economic impact of the Port of Melbourne using additional infrastructure data. To do this, the Victorian Government provided additional capital data for the period 2005-06 to 2011-12. The total combined average capital expenditure (from Government and private sources) in 2004-05 dollars is estimated at $42 million per annum. This amount takes into account the capital expenditure data used in the base case as well as the additional data estimates.
An average capital expenditure is calculated for a number of years in order to counteract the “lumpy” nature of this expenditure. The average capital expenditure has been calculated for the Port of Melbourne Corporation, port users and the Victorian Government. The modelling now includes:
• the data from the base case Port of Melbourne report, which was a ten year average of capital expenditure calculated for the Port of Melbourne Corporation and port users; and
• additional infrastructure data, which was calculated as a seven year average of capital expenditure for port-related infrastructure projects funded by the Victorian Government.
Table 2.1 presents the modelled impacts of the revised operating and capital investment by the PoMC and the Victorian Government. This modelling includes the new capital expenditure estimates.

Port of Melbourne Economic Contribution Study 139 Sensitivity Analysis
Table 2.1: Economic value of capital and operating investment by the PoMC and the Victorian Government (using additional capital investment from the sensitivity analysis plus original capital data)
Direct Effects
Indirect Effects
Total Effects
Output ($ million) 267 226 493
Value Added ($ million) 132 105 237
Employment (FTEs) 2,256 1,133 3,390
Table 2.2 outlines the impacts of operating and capital expenditure by port users.
Table 2.2: Economic value of capital and operating expenditure by port users (this uses data from the original report)
Direct Effects
Indirect Effects
Total Effects
Output ($ million) 1,144 997 2,141
Value Added ($ million) 503 467 970
Employment (FTEs) 5,981 5,345 11,326
Table 2.3 shows that the revised overall economic output of the Port of Melbourne is $2.63 billion with $1.4 billion being attributed to direct impacts. When compared with the original value of $2.5 billion, the inclusion of capital expenditure forecast by the Victorian Government has increased the estimate of the port’s value by approximately $130 million.
Table 2.3: New total economic value of the Port of Melbourne (the total of combined economic outcomes shown in Tables 2.1 and 2.2)
Direct Effects
Indirect Effects
Total Effects
Output ($ million) 1,411 1,224 2,634
Value Added ($ million) 635 572 1,207
Employment (FTEs) 8,237 6,478 14,715
It is important to note that capital (Table 2.3) contributes only a small proportion to the overall value of the Port of Melbourne.
The major driver behind the economic value of the Port of Melbourne is the provision of shipping services.
There were 3,411 ship visits to the port in 2004-05 by commercial vessels. The results of this analysis indicate that, on average, each ship call at the Port of Melbourne resulted in the following impact on the economy:
• $772,288 of output;
• $353,808 of value added; and
• four full time jobs for one year.

Port of Melbourne Economic Contribution Study 140 Sensitivity Analysis
2.2 Economic impact of the CDP – varying the assumptions about net welfare gains beyond 2027 2.2.1 Background The base case Port of Melbourne modelling was undertaken by the Centre of Policy Studies (CoPS) at Monash University to determine the long-term impacts of the CDP. Using a Computable General Equilibrium (CGE) model, CoPS considered two scenarios for the impact of the CDP, those being:
• the impact on the Victorian and Australian economies of proceeding with the CDP; and
• the impact on the Victorian and Australian economies of not proceeding with the CDP.
The base case presented the economic benefit of the Channel Deepening Project (CDP) over the course of 22 years until 2027, estimating the overall national benefit from the CDP at $1.7 billion for the period 2005-2027.
CoPS was also asked to estimate the net benefits of the project for the period to 2035. The net welfare gain estimate for the period 2027-2035 was estimated to increase at 2% per annum, a very conservative rate. Extending the timeframe to 2035 and adopting the assumption of a 2% increase in welfare between 2027 and 2035 increased the overall net welfare provided by the CDP to $2.2 billion.
2.2.2 Alternative trend analysis The assumptions which underpinned the long-term net welfare benefits arising from the CDP in the base case were conservative. In particular, the net welfare gains were estimated to level out after 2027.
There are likely to be substantial efficiency gains as a result of the CDP. Data in the base case of the report (see Appendix B) shows that the differential in shipping numbers (and sizes) becomes marked from 2025 onwards and continues to increase over the remainder of the forecast period. This indicates that the growth in net welfare will be concentrated towards the end of the forecast period.
To provide an alternative and potentially more realistic estimate of the value of the CDP between 2027 and 2035, PwC has therefore undertaken some sensitivity analysis of the net welfare assumptions. In particular, we have developed and calculated three alternative trend assumptions. These trends have been based on different timeframes.
Option one calculates a trend based on the first 22 years of the CDP (2005-2027). Options two and three are based on the trend in net welfare growth over the final 10 years and four years of the project respectively to 2027. The rationale for this approach relates to the fact that the benefits of the CDP are more substantial towards the end of the forecast period. It may therefore be more realistic to adopt a less conservative approach to the ongoing growth of net welfare than 2% per annum.

Port of Melbourne Economic Contribution Study 141 Sensitivity Analysis
The options are outlined in more detail below:
• Option one: Conduct a trend analysis between 2005 and 2027 and extend this until 2035. The approximate yearly increase in net welfare is 4.8%;
• Option two: Conduct a trend analysis between 2018 and 2027 and extend until 2035 at the same rate. The approximate yearly increase is 10%;
• Option three: Conduct a trend analysis between 2024 and 2027 and extend until 2035 at the same rate. The approximate yearly increase is 33%.
These three options are a less conservative approach than the base case assumption of a 2% increase in forecast values. All three options utilise the same discount rate of 6% per annum.
The outcomes of the modelling are outlined in Table 2.4.
Table 2.4: Total forecast value of the CDP (net welfare gain)
Option CDP value – 2005-2027 ($bn)
CDP value – 2005-2035 ($bn)
Base Case $1.7 billion $2.2 billion
Option 1 – yearly increase of 4.8%
$1.7 billion $2.22 billion
Option 2 – yearly increase of 10%
$1.7 billion $2.25 billion
Option 3 – yearly increase of 33%
$1.7 billion $2.35 billion
All of the options result in a larger net welfare gain. However, the gains are only moderate because of the effect of the discount rate – the values forecast between the years 2027 and 2035 are so heavily discounted that they do not have a large impact on the net welfare gain.
Based on the analysis above, the most “reasonable” rate of welfare gain is likely to be Option 2.
The other options may be less realistic because:
• Option 1 (4.8%) may under-state the substantial trade benefits that should be realised by this time. The reason for this thinking is that by 2035, there would be significant capacity constraints on ships without the CDP, which would translate to a greater number of visits by smaller vessels, with the concomitant impact on the cost of shipping goods through the Port of Melbourne; and

Port of Melbourne Economic Contribution Study 142 Sensitivity Analysis
• Option 3 (at 33% per annum) appears to be too high to be realised over the long term. Net welfare gains from Port activities will be in large part driven by increased trade volumes as well as any price reductions in shipping costs resulting from ships with larger capacities using the Port of Melbourne. In particular:
o container shipping forecasts expect annual growth to be 6.7% until 2010, slowing to an annualised rate of 5.6% until 2020 and 4.7% beyond 2020. This would indicate that net welfare gains of 33% per annum would be unlikely; and
o in terms of shipping price reductions driven by larger capacity ships, in the period after 2027 the Port of Melbourne will again begin to face capacity constraints, and the rapid net welfare gains of the period 2024-2027 are unlikely to be realised in future years.
2.3 Economic impact of the CDP – different cost assumptions The base case assumed that the cost of the CDP would be $568 million (in current dollars), or the equivalent of $465 million in discounted net present value terms.
As costs may vary due to a range of factors (eg. fuel prices), it was considered prudent to model the effect of increased CDP costs on the overall economic impact of the project. Additional modelling was therefore undertaken on the basis that the CDP cost 20% more than base case assumed. This means that the assumed cost of the CDP is, for the purposes of the analysis, now $558 million in Net Present Value terms.
When the model is run under this scenario, the discounted net present value of welfare falls by $30 million. That is, an increase in the costs of the CDP will decrease the eventual net welfare gain for Victoria and Australia. The key reason for this is that there are no additional trade or price benefits from a costlier CDP. The additional costs of the CDP would, therefore, decrease the net benefits (benefits less costs) of the project.
As indicated, the scenario assumed that the costs of the CDP increased by $93 million (discounted net present value terms). So the decrease in net welfare ($30 million) is only a fraction of the increased cost. The reason for this is that some of the additional cost would be spent on wages, which would realise some economic benefits through spending in the local economy.
That said, the impact on net welfare arising from additional project costs of the CDP would be different if the nature of those additional costs was different. For instance, if the additional costs consisted entirely of higher import costs associated with purchasing equipment from overseas rather than wages, the decrease in net welfare would be larger. This is because there would be no off-setting wage and expenditure increases (i.e. a benefit) in the local economy.

Port of Melbourne Economic Contribution Study 143 Importance of the Port of Melbourne to business
3
Importance of the Port of Melbourne to business

Port of Melbourne Economic Contribution Study 144 Importance of the Port of Melbourne to business
3.1 Introduction
This section provides a broader perspective on the economic importance of the Port of Melbourne, from the point of view of businesses which use the Port.
The Port of Melbourne is Australia’s largest container and general cargo port, handling 39% of the nation’s container trade.1 As identified in the base case, activity at the Port of Melbourne generated a total economic impact of $2.5 billion in output in 2004-05. Value added to Australia equalled $1.1 billion and port activities supported 13,748 FTEs.
It is difficult to overstate the importance of the Port given the wide range of industries and businesses that depend on it as a gateway for importing and exporting inputs and finished products, and the flow-on effects of these activities on our daily lives.
A diverse range of commodities are handled through the Port including motor vehicles; tea and coffee; wood and timber; chemicals; fruit, vegetables and nuts; dairy products; cereals; petroleum; and many other raw materials and manufactured goods.
3.2 Users’ Perspective The perspectives of a number of companies which use the Port of Melbourne were gained to understand the importance of the Port to business. Qualitative and quantitative data was collected through interviews with a sample of 11 national and global companies with operations in Victoria. These interviews focused on eliciting information relating to the company’s business profile; the nature and characteristics of its markets, distribution channels and logistics; its future business outlook; and the role played by the Port of Melbourne in current and future business operations.
A list of interviewed companies is provided below:
Australian Paper SCA Hygiene Australasia BlueScope Steel Simplot Australia Heinz Watties Australasia Smorgon Steel Distribution Masterfoods Petcare Toyota Motor Corporation Murray Goulburn Co-operative Visy Recycling Qenos
Collectively, the 11 companies reported annual turnover of almost $9 billion and direct employment of more than 13,000 people in Victoria. The companies have a total annual expenditure of around $1.7 billion on freight and logistics activities and export around $4 billion worth of commodities each year. Despite the impressive scale of these activities, it is interesting to note that these companies generate only around 6% (approximately 86,000 TEUs of exports and 28,000 TEUs of imports) of Melbourne’s total container throughput.
1 Port of Melbourne Corporation website

Port of Melbourne Economic Contribution Study 145 Importance of the Port of Melbourne to business
Some of the key themes that emerged from the consultations with this select group of users are outlined below.
Sensitivity of export markets
All companies stressed the need for high reliability and strong service levels to support their export markets. Few companies were immune to competition, and service and reliability ranked along side price when it came to satisfying export customers. Concern about potential loss of export markets was a common theme amongst companies interviewed. Because exports are generally sold into very competitive markets and most products have direct substitutes from other countries, there was considered to be a real risk that entire markets could be lost if service, price or reliability are threatened.
Regular and reliable shipping services
Regular and reliable shipping services are critical for business success. For an export-focussed business, changes to regularity and reliability of services could impact upon its ability to deliver export goods to clients overseas, and therefore affect competitiveness in the market. Likewise, receiving goods on time is important for businesses reliant on imported supplies.
Many of the companies interviewed believed that the Port of Melbourne delivered a regular and reliable service comparable to (if not better than) other ports around Australia. Ongoing frequency and reliability of services were also considered important for future growth opportunities in export markets.
Good supporting infrastructure
In addition to consistent and frequent shipping services, good rail and road infrastructure is also vital to support port operations. The users interviewed were generally satisfied with the Port of Melbourne’s support and connectivity of services to other modes of land transportation. The Port is noted as having less congestion and a better national distribution footprint compared with other locations interstate. Some users felt that these services could be enhanced with better rail connectivity.
Value for money
Cost is a major consideration for business activities and for some companies, profitability is highly sensitive to freight and logistics costs. Some companies believed that the associated costs of transportation into and out of the Port of Melbourne are more economical relative to the costs at other major ports in Australia. For example, Simplot Australia estimates that it saves 10-20% in logistics costs by using the port in Melbourne (where the operating environment is more efficient) instead of Sydney.
Proximity to business operations
For trade-focussed businesses, close proximity to a port and business operations is a key consideration. All of the companies interviewed have operations in Victoria – almost all of them export out of and the majority receive imported goods at the Port of Melbourne.
Some companies such as Toyota and Murray Goulburn use Melbourne as the hub of their trade activities. Murray Goulburn exports the majority of its production and it is almost entirely based in Victoria. It would incur a considerable increase in transportation costs if it were to transfer its business to another port.

Port of Melbourne Economic Contribution Study 146 Importance of the Port of Melbourne to business
General observations
The case studies reinforce the relevance of Melbourne’s history as a trading economy with high reliance on the Port to import and export goods. Melbourne developed into one of Australia’s key freight and manufacturing hubs, at least in part, by investing in efficient port facilities. Industry has grown up around these facilities and has invested and built their own businesses to take advantage of these attributes.
Many of the companies interviewed regarded Melbourne as offering the best manufacturing and logistics package in Australia. It has the necessary freight volumes, shipping connectivity, smooth port operations and good land side logistics, and compares very favourably with other capital cities. It is the preferred location for many national and international companies.
There was a common view that failure to maintain a competitive port service would adversely impact the chances of Victoria both attracting new investment and generating export focused jobs and may, ultimately, set it on a course for decline as a manufacturing and logistics hub for Australia. All of the businesses strongly supported an innovative and competitive port with strong landside logistics backup to ensure Victoria retains its position as Australia’s freight gateway.
3.3 Indicative economic modelling for the case study companies The 11 companies which took part in the survey collectively account for significant turnover and a major source of employment in Victoria.
It is possible from the reported employment of the 11 companies to estimate and aggregate their total economic output and value to the Victoria economy. This analysis does not imply that the aggregate economic impact of these companies is dependent on the Port. Instead, it provides an indication of the economic significance of companies which rely, to varying degrees, on the Port facility and whose ongoing contribution to the economy is therefore in part dependent on the efficient operation of the Port.
Table 3.1 provides the results of economic modelling based on the Victorian employment of the companies in the survey. We have used the number of company employees in Victoria as a proxy for the impact in Victoria. In practice, the distinction between economic impacts in Victoria and the rest of Australia (or overseas) is unlikely to be so clear cut.

Port of Melbourne Economic Contribution Study 147 Importance of the Port of Melbourne to business
Table 3.1: Total Economic Impact (for Victoria) for the selected 11 companies which rely on the Port of Melbourne
Total Effects Direct Effects Flow-on Effects Total Impact
Output ($m) 4,4032 5,125 9,528
Value Added ($m) 1,268 2,345 3,614
Employment (full time equivalent) 13,000 25,508 38,508
Based on the data collected directly from the selected 11 companies, the direct employment impact in Victoria is reported 13,000. The flow on effect of employment across Victoria is far greater at 25,508 full time equivalent jobs. This equals an overall employment impact of 38,508.
The results for Table 3.1 (Victoria only) indicate that the business activities of these 11 companies alone are important contributors of employment in the Victorian economy.
This economic modelling exercise was also performed for Australia, using the number of employees as a proxy for estimating the economic impact.
Table 3.2: Total Economic Impact (for Australia) for the selected 11 companies which rely on the Port of Melbourne
Total Effects Direct Effects Flow-on Effects Total Impact
Output 8,817 10,222 19,039
Value Added 2,636 4,624 7,260
Employment (full time equivalent) 27,150 47,783 74,933
A key conclusion is that, while these companies do not rely on the Port of Melbourne for all (or even most) of their turnover, they could not have achieved their scale or growth in Victoria without the Port.
2 The output or company turnover shown in the table is substantially less than the actual company turnover of $9 billion. The economic model is based on a series of average industry multipliers which can use either turnover or employment as a basis for calculation. Employment has been used here as a basis for this calculation as this is more conservative and will not overstate the employment impacts of the 11 companies interviewed. The 11 companies have much higher levels of productivity than the average, and their output per employee is much higher than an “average” firm in their respective sectors. For this reason, while the employment impacts shown are accurate, the output/turnover impacts are understated.

Port of Melbourne Economic Contribution Study 148
THIS PAGE HAS BEEN LEFT BLANK INTENTIONALLY

Port of Melbourne Economic Contribution Study 149 Terms of Reference
Appendix A
Terms of Reference

Port of Melbourne Economic Contribution Study 150 Terms of Reference
The Economic Contribution of the Port of Melbourne
- Additional Study -
1. Purpose of the Study
The Department of Infrastructure (DOI) is seeking to have prepared a supplementary report providing additional modelling and analysis of the economic impact of the Port of Melbourne and the Channel Deepening Project on the Victorian and the Australian economies.
2. Background and Overview of the Task
The report of the Economic Impact of the Port of Melbourne study, commissioned by the Department of Treasury and Finance (DTF), was submitted by PricewaterhouseCoopers in August 2006 and sought to analyse the economic ccontribution to the Victorian and Australian economies of the Port of Melbourne and directly related industries. As part of this study the likely long-term economic impacts of the proposed Channel Deepening Project were also estimated.
The study adopted a robust but conservative approach, predicting a benefit from channel deepening of $1.7 billion over the next 22 years, that is, until 2027. Given that the benefits of the Channel Deepening Project are expected to continue well beyond 2027 until at least 2035, it is proposed that this additional study should capture the full estimated benefits over this longer timeframe by utilizing an approach which extrapolates the trend line from 2027. It is further proposed that a sensitivity analysis in relation to the cost of the Project be conducted, reflecting the fact that the base case used a preliminary estimate and that various factors, such as increase in fuel costs, may affect the total cost of the project.
In relation to modeling the broader economic impact of the Port of Melbourne, a range of public and private sector infrastructure investment projects were included in the base case. However, a number of anticipated Government infrastructure investment projects relevant to the Port of Melbourne were not included and it is proposed that these further investments be included in this additional study.
The conservative methodology adopted in the base case required that the benefits identified were those attributed only to activity at the Port of Melbourne. While this approach confirmed the significant economic benefits to the economy of the Port of Melbourne, it is considered that there is merit in broadening the focus in this additional study to include case studies which analyse the economic benefits attributable to selected companies/industry sectors which rely significantly on the Port of Melbourne.
3. Terms of Reference
The consultant is required to carry out the following tasks:
a. Prepare an estimate of the benefits of the Channel Deepening Project based on an extrapolation of the identified trend line until 2035.
b. Prepare a sensitivity analysis based on a 20% increase in the Channel Deepening Project costs.

Port of Melbourne Economic Contribution Study 151 Terms of Reference
c. Undertake further modeling that includes port related Government infrastructure investment not included in the base case.
d. Prepare case studies of a number of companies/industry sectors which rely heavily on the Port of Melbourne for the supply of inputs and/or the export of outputs. The case studies should clearly illustrate the significance of the Port of Melbourne to these businesses and estimate the contribution of each company/industry sector to the Victorian economy.

Port of Melbourne Economic Contribution Study 152
THIS PAGE HAS BEEN LEFT BLANK INTENTIONALLY

Port of Melbourne Economic Contribution Study 153 Shipping scenarios
Appendix B
Shipping scenarios (from the base case Port of Melbourne
economic impact report)

Port of Melbourne Economic Contribution Study 154 Shipping scenarios
These tables are from the base case Port of Melbourne report.
Table B.1: Shipping forecasts with and without the CDP going ahead
Source: Port of Melbourne Corporation
Table B.2: Vessel Size Distribution: with channel deepening (calls per annum)
Vessel size (TEU)
2005 2010 2015 2020 2025 2030 2035
0-1499 128 47 33 0 0 0 0
1500-1999 277 93 33 0 0 0 0
2000-2499 171 128 89 15 8 0 0
2500-2999 245 234 152 119 76 40 0
3000-3499 117 246 241 223 170 99 46
3500-3999 75 222 279 357 280 218 162
4000-4499 53 140 254 372 356 356 346
4500-4999 0 58 140 283 356 435 450
5000-5499 0 0 51 119 271 396 485
5500-5999 0 0 0 0 119 297 450
6000-6499 0 0 0 0 59 138 300
6500-6999 0 0 0 0 0 0 69
7000-7499 0 0 0 0 0 0 0
No. of sailings 1,066 1,168 1,271 1,489 1,695 1,978 2,308
Slot capacity (‘000s TEU) 2,590 3,428 4,556 5,979 7,510 9,475 11,840
Source: Port of Melbourne Corporation
Year 2005* 2010 2015 2020 2025 2030 2035
Vessel movements with Channel Deepening
Container ships 1,066 1,168 1,271 1,489 1,695 1,978 2,308
Grain vessels 54 41 46 51 58 65 73
Crude oil tankers 37 31 38 44 51 56 61
Vessel movements without Channel Deepening
Container ships 1066 1177 1310 1570 1905 2337 2823
Grain vessels 54 61 69 77 87 98 110
Crude oil tankers 37 48 58 68 78 87 95

Port of Melbourne Economic Contribution Study 155 Shipping scenarios
Table B.3: Vessel Size Distribution: without channel deepening (calls per annum)
Vessel size (TEU)
2005 2010 2015 2020 2025 2030 2035
0-1499 128 47 33 0 0 0 0
1500-1999 277 94 33 0 0 0 0
2000-2499 171 130 92 16 10 0 0
2500-2999 245 235 157 126 86 47 0
3000-3499 117 247 249 235 191 117 56
3500-3999 75 224 328 471 495 538 198
4000-4499 53 200 419 722 1,124 1,636 2,569
4500-4999 0 0 0 0 0 0 0
5000-5499 0 0 0 0 0 0 0
5500-5999 0 0 0 0 0 0 0
6000-6499 0 0 0 0 0 0 0
6500-6999 0 0 0 0 0 0 0
7000-7499 0 0 0 0 0 0 0
No. of sailings 1,066 1,177 1,310 1,570 1,905 2,337 2,823
Slot capacity (‘000s TEU) 2,590 3,655 4,556 5,979 7,511 9,476 11,841
Source: Port of Melbourne Corporation

Port of Melbourne Economic Contribution Study 156
THIS PAGE HAS BEEN LEFT BLANK INTENTIONALLY
Port of Melbourne Economic Contribution Study 157 Value of the Port of Melbourne
Appendix C
Value of the Port of Melbourne
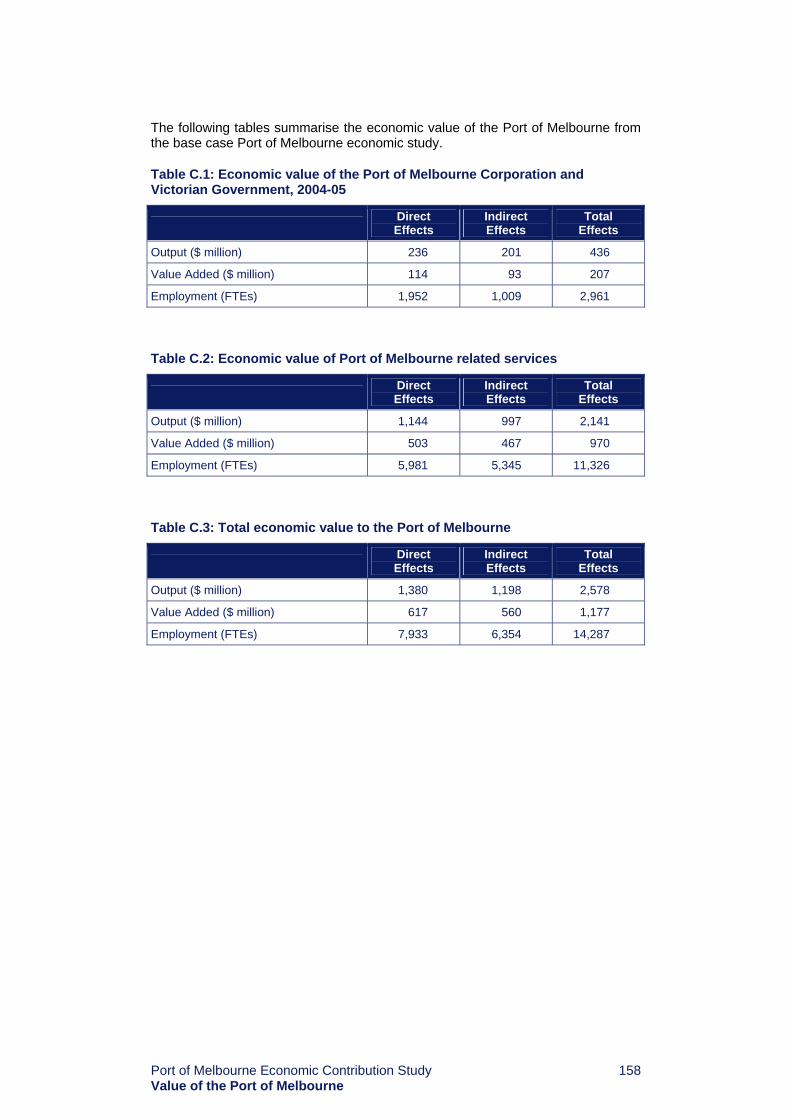
Port of Melbourne Economic Contribution Study 158 Value of the Port of Melbourne
The following tables summarise the economic value of the Port of Melbourne from the base case Port of Melbourne economic study.
Table C.1: Economic value of the Port of Melbourne Corporation and Victorian Government, 2004-05
Direct Effects
Indirect Effects
Total Effects
Output ($ million) 236 201 436
Value Added ($ million) 114 93 207
Employment (FTEs) 1,952 1,009 2,961
Table C.2: Economic value of Port of Melbourne related services
Direct Effects
Indirect Effects
Total Effects
Output ($ million) 1,144 997 2,141
Value Added ($ million) 503 467 970
Employment (FTEs) 5,981 5,345 11,326
Table C.3: Total economic value to the Port of Melbourne
Direct Effects
Indirect Effects
Total Effects
Output ($ million) 1,380 1,198 2,578
Value Added ($ million) 617 560 1,177
Employment (FTEs) 7,933 6,354 14,287

Port of Melbourne Economic Contribution Study 159 References for case studies
Appendix D
References for case studies

Port of Melbourne Economic Contribution Study 160 References for case studies
IBISWORLD Company Premium Report; Bluescope Steel Pty Ltd
IBISWORLD Company Premium Report; Effem Foods Pty Limited
IBISWORLD Company Premium Report; PaperlinX Limited
IBISWORLD Company Premium Report; Simplot Australia (Holdings) Pty Limited
IBISWORLD Company Premium Report; Smorgon Steel Group Ltd
IBISWORLD Company Premium Report; Toyota Motor Corporation Australia Limited
IBISWORLD Company Profile Report; Pratt Holdings Proprietary Limited; September 2006
IBISWORLD Company Profile Report; Qenos Holdings Pty Ltd
IBISWORLD Industry Report; Corrugated Paperboard Container Manufacturing in Australia; May 2006
IBISWORLD Profile Company Profile Report: SCA Hygiene Australia Pty Ltd
IBISWORLD; Company Profile Report; Heinz Wattie’s Limited
Perkins Group; Port of Melbourne Economic Study: Interviews with a range of users of the Port of Melbourne; December 2006
www.australianpaper.com.au
www.bluescopesteel.com
www.heinz.com.au
www.hygenex.com.au
www.masterfoods.com.au
www.paperlinx.com.au
www.qenos.com.au
www.simplot.com.au
www.smorgonsteel.com.au
www.toyota.com.au
www.visy.com.au


Department of Treasury and Finance 1 Treasury Place Melbourne Victoria 3002 Australia Telephone: +61 3 9651 1511 Facsimile: +61 3 9651 5298 Website: www.dtf.vic.gov.au Published by the Department of Treasury and Finance March 2007. Printed by On-Demand Printers, 152 Sturt Street, South Melbourne © Copyright State of Victoria This book is copyright. No part may be reproduced by any process except in accordance with the provisions of the Copyright Act 1968 ISBN 1 9209 2195 8 Important disclaimer:
The contents in this report are provided for information purposes only. The views expressed herein are those of the author and do not purport to represent the position of the State of Victoria. Neither the author nor the State of Victoria accept any liability to any persons for the information (or the use of such information) which is provided in this review or incorporated into it by reference. The information in this report is provided on the basis that all persons having access to it undertake responsibility for assessing the relevance and accuracy of its content.