econ rev 2011-12
TRANSCRIPT
agriculture,forestry & fisheriesDepartment:Agriculture, Forestry and FisheriesREPUBLIC OF SOUTH AFRICA
2011/122011/12

Economic Review
of the
South African
Agriculture
2011/12
DEPARTMENT OF AGRICULTURE, FORESTRY AND FISHERIES
2012
Compiled by
Directorate: Statistics and Economic Analysis Private Bag X246 PRETORIA 0001
Published in the Republic of South Africa by
Department of Agriculture, Forestry and Fisheries
Obtainable from
Resource Centre Directorate: Communication Services Private Bag X144 PRETORIA 0001
ISBN 978-1-86871-364-6
This publication or any part thereof may be reproduced without prior permission, provided that the Directorate Statistics and Economic Analysis, Department of Agriculture, Forestry and Fisheries, is acknowledged as the source.

iii
CONTENTS
Foreword ............................................................................................................................................... v
Economic review of South African agriculture for the year ended 30 June 2012 .................................. 1
Summary ............................................................................................................................................... 1
Volume of agricultural production .......................................................................................................... 1
Producer prices of agricultural products ................................................................................................ 2
Gross value of agricultural production ................................................................................................... 2
Farming income ..................................................................................................................................... 3
Expenditure on intermediate goods and services.................................................................................. 5
Prices of farming requisites ................................................................................................................... 5
Domestic terms of trade in agriculture (2005 = 1) ................................................................................. 6
Contribution of agriculture to value added at basic prices ..................................................................... 7
Capital assets and investment in agriculture ......................................................................................... 7
Farming debt ......................................................................................................................................... 8
Cash fl ow of farmers.............................................................................................................................. 8
Consumption expenditure on food......................................................................................................... 9
Consumer prices ................................................................................................................................... 9
Imports and exports of agricultural products ......................................................................................... 10


v
FOREWORD
Despite its relatively small share of the total GDP, primary agriculture is an important sector in the South African economy. Agriculture remains a signifi cant provider of employment, especially in the rural areas, and a major earner of foreign exchange.
The value of agricultural production in South Africa was R148 235 million in 2011, while its contribution to the GDP was approximately R63 billion. The primary agricultural sector has grown by an average of approximately 11,8% per annum since 1970, while the total economy grew by 14,9% per annum over the same period, resulting in a drop in agriculture’s share of the GDP from 7,1% in 1970 to 1,9% in 2010.
Agriculture’s prominent, indirect role in the economy is a function of backward and forward linkages to other sectors. Purchases of goods such as fertilisers, chemicals and implements form backward linkages with the manufacturing sector, while forward linkages are established through the supply of raw materials to the manufacturing industry. About 70% of agricultural output is used as intermediate products in the sector. Agriculture is therefore a crucial sector and an important engine of growth for the rest of the economy.
This publication, which appears every six months, offers easy-to-fi nd information to give some idea of the macroeconomic position of agriculture. The focus areas are the calculation of agriculture’s contribution to the national economy and the determination of trends with regard to the most important agricultural eco-nomic indicators.
Whether you are involved directly or only have an interest in agriculture, you will fi nd this publication useful and informative. We welcome your observations on its content and format. If you have comments or ques-tions, please contact the Director: Statistics and Economic Analysis.
Tel 012 319 8454
Fax 012 319 8031
Email [email protected]
PRETORIA Ms Ellen Matsei
September 2012 Director: Statistics and Economic Analysis


1Department of Agriculture, Forestry and Fisheries
ECONOMIC REVIEW OF SOUTH AFRICAN AGRICULTURE FOR THE YEAR ENDED 30 JUNE 2012
Summary
Gross farming income from all agricultural products for the year ended 30 June 2012 is estimated at R161 131 million, which is 21,9% higher than for the previous corresponding period.
Gross farming income from fi eld crops increased by 63,1% and amounted to R45 893 million. The income from horticultural products rose by 9,2%, from R36 278 million to R39 623 million. Income from animal products amounted to R75 615 million, an increase of 11,6%.
Prices received by farmers for agricultural products and prices paid by farmers for farming requisites in-creased on average by 15,5% and 13,8% respectively, resulting in the terms of trade rising from 0,85 to 0,86 during the period under review.
The weighted average price of fi eld crops increased by 31,7%. This resulted from an increase of 65,2% in the prices received for summer grain, 27,9% for dry beans, 16,6% for hay, 14,0% for cotton, 8,1% for sugar cane, 3,7% for winter grain, 2,1% for oilseeds and 1,1% for tobacco.
The prices of horticultural products increased on average by 5,9%, mainly because of the increases in the prices of vegetables and fruit by 9,1% and 4,6% respectively, while the average price of viticultural products remained virtually unchanged.
Prices of animal products increased by 10,8%. The average prices of pastoral products, slaughtered stock, dairy products and poultry meat rose by 21,4%, 16,5%, 10,4% and 5,7% respectively.
The prices paid for farming requisites, including machinery and implements, material for fi xed improve-ments as well as intermediate goods and services, increased by 13,8%, compared with 13,0% the previous year. Prices for fertilisers and fuel increased by 20,8%, packaging material by 17,8%, trucks by 16,5%, seeds by 16,0%, feeds by 14,6%, maintenance and repairs by 12,8%, tractors by 12,4%, dips and sprays by 11,8% and fuel by 7,9%.
Net farming income increased by 55,8% and amounted to R51 547 million for the 12 months up to 30 June 2012
Volume of agricultural production
The estimated volume of agricultural production in 2011/12 was 2,1% higher than in 2010/11.
The volume of fi eld-crop production refl ected a 5,2% increase, mainly as a result of an improvement in the production of winter grains, maize and sugar cane. Wheat production increased by 577 554 tons or 40,2% and maize production increased by 551 000 tons or 5,0% from the previous season. Sugar cane showed an increase of 2,1 million tons or 12,5% from 2010/11.
Volume index of agricultural production2007/08–2011/12 (July to June)
90
100
110
120
130
140
2007/08 2008/09 2009/10 2010/11 2011/12Year
2005
= 1
00

2 Economic Review of the South African Agriculture 2011/12
Horticultural production showed an increase of 1,7%, which can mainly be attributed to an increase in the production of citrus and deciduous fruit. The production of oranges increased by 80 724 tons or 5,7% and that of grapefruit by 72 544 tons or 21,2% from the previous season. Deciduous fruit, specifi cally wine grapes and table grapes, increased by 41 549 tons (2,5%) and 11 342 tons (4,3%) respectively.
Animal production increased by 1,0% as a result of increases in poultry meat (by 19 093 tons or 1,3%) and eggs (by 40 504 tons or 5,2%) from 2010/11.
Producer prices of agricultural products
Producer prices of agricultural products increased on average by 15,5% from 2010/11 to 2011/12.
The weighted average price of fi eld crops increased by 31,7%. The prices of summer grain increased by 65,2%, dry beans by 27,9%, hay by 16,6%, cotton by 14%, sugar cane by 8,1%, winter grain by 3,7%, oil-seeds by 2,1% and tobacco by 1,1%.
Producer prices of horticultural products rose by 5,9% from 2010/11 to 2011/12. Prices of vegetables and fruit increased by 9,1% and 4,6% respectively, while the average price of viticultural products remained virtually unchanged.
Prices of animal products increased by 10,8%. The average prices of pastoral products, slaughtered stock, dairy products and poultry meat increased by 21,4%, 16,5%, 10,4% and 5,7% respectively.
Producer price indices2007/08–2011/12 (July to June)
90
120
150
180
210
240
270
2007/08 2008/09 2009/10 2010/11 2011/12Year
2005
= 1
00
Field crops Horticulture Animal products
Gross value of agricultural production
The total gross value of agricultural production (total production during the production season valued at the average basic prices received by producers) for 2011/12 is estimated at R158 557 million, compared to R140 433 million the previous year—an increase of 12,9%. This increase can be attributed mainly to an increase in the value of fi eld crops.
The gross value of animal products, fi eld crops and horticultural products contributed 47,7%, 27,3% and 25,0%, respectively, to the total gross value of agricultural production. The poultry meat industry made the largest contribution with 16,9%, followed by cattle and calves slaughtered with 15,9% and maize with 13,5%.

3Department of Agriculture, Forestry and Fisheries
Gross value of agricultural production2007/08–2011/12 (July to June)
010 00020 00030 00040 00050 00060 00070 00080 000
2007/08 2008/09 2009/10 2010/11 2011/12Year
R'm
illio
n
Field crops Horticulture Animal products
Farming income
The gross income of producers (the value of sales and production for other uses, plus the value of changes in inventories) for the year ended 30 June 2012 amounted to R161 131 million, compared to R132 189 million the previous year, an increase of 21,9%. The increase in income can be ascribed mainly to a com-bination of increases in prices that farmers received for their products, better than expected production and earlier deliveries of maize in particular.
The gross income from fi eld crops increased by 63,1% to R45 893 million for the year ended 30 June 2012. Income from maize at R25 872 million was R14 206 million or 121,8% higher than in the previous 12 months. Income from sugar cane at R6 122 million was R1 545 million or 33,7% higher than that of the previous 12 months. Income from groundnuts increased by 50,9% to R568 million. However, income from sunfl ower seed showed a decrease of 18,2% to R2 529 million.
The gross income from horticultural products increased by 9,2% to R39 623 million, from R36 278 million in 2010/11. Income from citrus and deciduous fruit increased by 5,2% and 7,6% and amounted to R6 934 million and R10 060 million respectively. Income from subtropical fruit increased slightly by 0,8% to R2 367 million. Income from viticulture increased by only 0,8% to R3 630 million. Income from vegetable production increased, by 13,5% to R14 138 million.
Gross farm sector income (GFI)2007/08–2011/12 (July to June)
010 00020 00030 00040 00050 00060 00070 00080 000
2007/08 2008/09 2009/10 2010/11 2011/12Year
R'm
illio
n
Field crops Horticulture Animal products

4 Economic Review of the South African Agriculture 2011/12
The gross income from animal products was 11,6% higher than in 2010/11 and amounted to R75 615 mil-lion, compared to R67 768 million for the previous year. Producers earned R17 643 million from slaughtered cattle and calves, as against the previous R15 089 million—an increase of 16,9%. Income from slaughtered sheep increased by 13,0% to R3 909 million. Income from poultry meat production rose by 7,9% to R26 874 million and income from egg production, at R7 447 million, was 8,3% higher than in the previous year. Pro-ducers earned R10 148 million from milk production, which is 11,5% more than in the previous year. Income from ostrich products, however, decreased by 26,0% to R295 million.
The net farm income (after the deduction of all production expenditure, excluding expenditure on fi xed assets and capital goods) amounted to R51 547 million for the 12 months that ended on 30 June 2012, which is 56,9% more than in the previous 12 months. The increase in net farming income is the result of the increase of 21,9% in gross farming income as against an increase of 12,4% in expenditure on intermediate production inputs and services.
Payments for salaries and wages, which represented 11,3% of the total farming costs, amounted to R12 941 million. Interest paid by farmers to banks and other fi nanciers during the 12 months up to 30 June 2012 is estimated at R5 451 million, or 4,8% of the total farming cost.
Net farm sector income (NFI)2007/08–2011/12 (July to June)
0
10 000
20 000
30 000
40 000
50 000
60 000
2007/08 2008/09 2009/10 2010/11 2011/12Year
R'm
illio
n
15
20
25
30
35
40
Perc
enta
ge
NFI (left axis) NFI as % of GFI (right axis)
Gross income from major products2011/12 compared to 2010/11 (July to June)
0 3 000 6 000 9 000 12 000 15 000 18 000 21 000 24 000 27 000
Sugar cane (+33,7%)
Milk (+11,5%)
Vegetables (+13,5%)
Fruit (+5,9%)
Maize (+121,8%)
Red meat (+16,0%)
Poultry meat (+7,9%)
R'million2010/11 2011/12
5Department of Agriculture, Forestry and Fisheries
Price indices of farming requisites2007/08–2011/12 (July to June)
75100125150175200225250
2007/08 2008/09 2009/10 2010/11 2011/12Year
2005
= 1
00
Machinery and implements Fixed improvements
Intermediate goods and services
Expenditure on intermediate goods and services2007/08–2011/12 (July to June)
2 000
4 000
6 000
8 000
10 000
2007/08 2008/09 2009/10 2010/11 2011/12Year
R'm
illio
n
Maintenance and repairs Packaging materials Dips and sprays Seed and plants
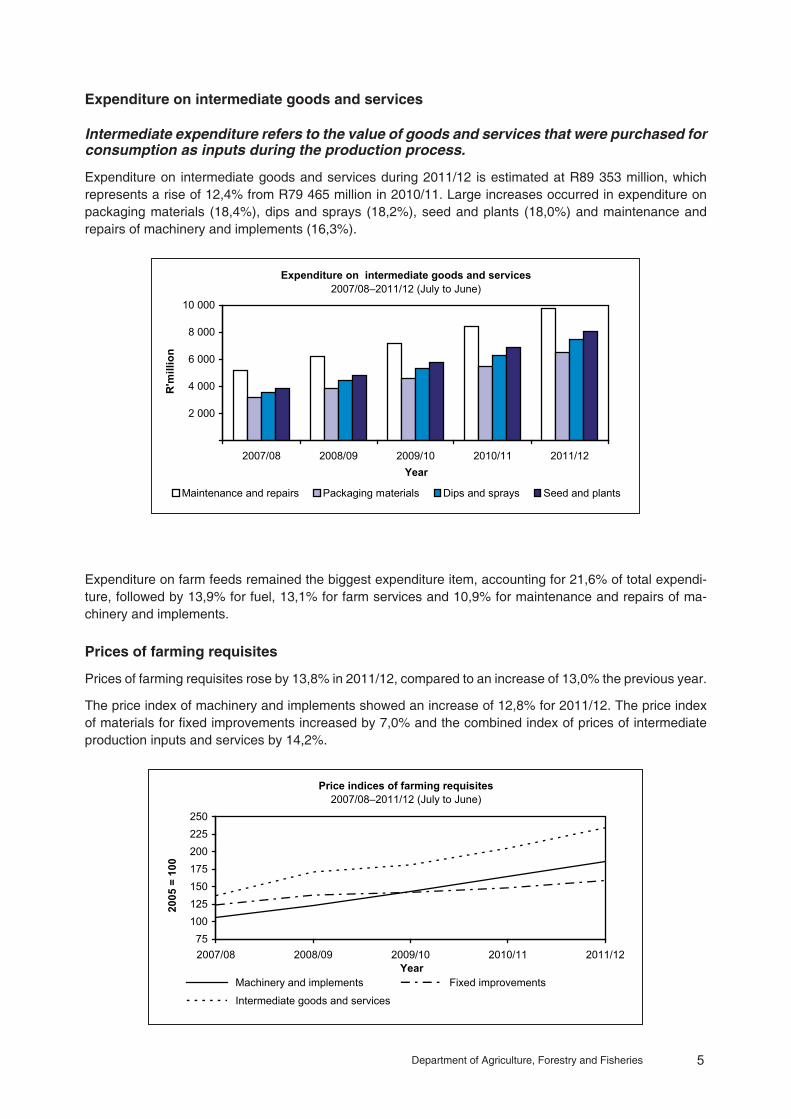
Expenditure on intermediate goods and services
Intermediate expenditure refers to the value of goods and services that were purchased for consumption as inputs during the production process.
Expenditure on intermediate goods and services during 2011/12 is estimated at R89 353 million, which represents a rise of 12,4% from R79 465 million in 2010/11. Large increases occurred in expenditure on packaging materials (18,4%), dips and sprays (18,2%), seed and plants (18,0%) and maintenance and repairs of machinery and implements (16,3%).
Expenditure on farm feeds remained the biggest expenditure item, accounting for 21,6% of total expendi-ture, followed by 13,9% for fuel, 13,1% for farm services and 10,9% for maintenance and repairs of ma-chinery and implements.
Prices of farming requisites
Prices of farming requisites rose by 13,8% in 2011/12, compared to an increase of 13,0% the previous year.
The price index of machinery and implements showed an increase of 12,8% for 2011/12. The price index of materials for fi xed improvements increased by 7,0% and the combined index of prices of intermediate production inputs and services by 14,2%.

6 Economic Review of the South African Agriculture 2011/12
The increase of 20,8% in the price of fertilisers made the most signifi cant contribution to the increase in the prices of intermediate goods and services. The prices of packaging materials, seeds and farm feeds rose by 17,8%, 16,0% and 14,6% respectively.
Price indices of machinery and implements2007/08–2011/12(July to June)
100
120
140
160
180
200
220
2007/08 2008/09 2009/10 2010/11 2011/12Year
2005
= 1
00
Tractors Implements Trucks
Domestic terms of trade in agriculture (2005 = 1)
The terms of trade indicate the extent to which producer prices received by farmers kept pace with the prices paid for farming requisites.
The terms of trade in agriculture strengthened by 1,2%, from 0,85 in 2010/11 to 0,86 in 2011/12.
The terms of trade for fi eld crops increased by 16,0%, from 1,01 in 2010/11 to 1,17 in 2011/12. In the case of the horticultural industry, the terms of trade decreased by 7,0%, from 0,80 to 0,74. The terms of trade for the animal production industry dropped by 2,5%, from 0,80 to 0,78.
Price indices of certain intermediate goods2007/08–2011/12 (June to July)
90120150180210240270300
2007/08 2008/09 2009/10 2010/11 2011/12Year
2005
= 1
00
Farm feeds Fertilisers Fuel

7Department of Agriculture, Forestry and Fisheries
Terms of trade in agriculture2007/08–2011/12 (July to June)
0,700,800,901,001,101,201,301,40
2007/08 2008/09 2009/10 2010/'11 2011/'12Year
2005
= 1
Field crops Horticulture Animal production
Contribution of agriculture to value added at basic prices
Value added is the value of total output less the value of intermediate consumption during the pro-duction period.
The contribution of agriculture to value added for the year ended 31 December 2011 is estimated at R63 984 million. This represents 2,4% of the total value added to the economy.
Year
Total value added
R’million
Contribution of agriculture
to value added
R’million
Contribution of agriculture
as % of total value added
%
2005
2006
2007
2008
2009
2010
2011*
1 401 067
1 572 319
1 792 075
2 033 207
2 174 513
2 412 491
2 670 504
30 213
37 475
45 152
50 263
52 903
46 024
63 984
2,2
2,4
2,5
2,5
2,4
1,9
2,4
*Note: Figure is for agriculture, forestry and fi sheries.
Capital assets and investment in agriculture
The value of capital assets in agriculture as at 30 June 2012 is estimated at R257 417 million, as against R232 708 million at the end of June 2011—an increase of 10,6%. Land and fi xed improvements constituted R152 247 million, machinery and implements R49 049 million and livestock R56 121 million of the total value of capital assets. The gross investment in respect of fi xed improvements for the year ended 30 June 2012 increased by 3,7% to R4 158 million. In the case of machinery, implements and vehicles, investment increased by 42,0% and amounted to R9 300 million. The livestock inventory rose by R214,0 million from the previous year.

8 Economic Review of the South African Agriculture 2011/12
Cash fl ow of farmers
The cash fl ow of farmers amounted to R52 017 million for the year ended 30 June 2012, compared to the previous R33 976 million, an increase of 53,1%. This was the result of a signifi cant increased in the gross income of producers.
Farming debt
The total farming debt as at the end of June 2012 is estimated at R85 130 million (R75 250 million), an increase of 13,1%.
Investment in agriculture2007/08–2011/12 (July to June)
- 1 000
1 000
3 000
5 000
7 000
9 000
11 000
2007/08 2008/09 2009/10 2010/11 2011/12Year
R'm
illio
n
Fixed improvements Machinery and implements Change in livestock inventory
Agricultural debt2007/08–2011/12 (July to June)
20 000
30 000
40 000
50 000
60 000
70 000
80 000
90 000
2007/08 2008/09 2009/10 2010/11 2011/12Year
R'm
illio
n
20
23
26
29
32
35
Perc
enta
ge
Debt (left axis) Debt as % of assets (right axis)

9Department of Agriculture, Forestry and Fisheries
Private consumption expenditure on major food items 2007/08–2011/12 (July to June)
020 00040 00060 00080 000
100 000120 000140 000
2007/08 2008/09 2009/10 2010/11 2011/12Year
R'm
illio
n
Meat Bread and grains Vegetables and fruit Milk, milk products and eggs Oils and fats
Consumption expenditure on food
The consumption expenditure on food for the year which ended 30 June 2012 increased by 12,4% and amounted to R401 300 million, as against the R356 970 million of the previous year. Expenditure on meat increased by 12,0% to R130 519 million, on bread and grain products by 16,4% to R111 379 million, on sugar by 16,5% to R6 578 million, on milk, milk products and eggs 7,7% to R41 800 million. Fruit and vegetables (including potatoes) as well as oils and fats also show increases of 6,3% to R54 966 million and 34,8% to R8 702 million, respectively.
Cash flow of farmers 2007/08–2011/12 (July to June)
10 000
20 000
30 000
40 000
50 000
60 000
2007/08 2008/09 2009/10 2010/11 2011/12Year
R'm
illio
n
20
25
30
35
40
Perc
enta
ge
Cash flow (left axis) Cash flow as % of GFI (right axis)
Meat represented 33% of the expenditure on the food component; bread and grains 28%; fruit and veg-etables (including potatoes) 14%; milk, milk products and eggs 10%; and sugar and oils and fats 2% each.
Consumer prices
The consumer price index (with base year 2005 = 100) of all items increased by 5,8%, from 142,9 to 151,2, during the year ended 30 June 2012. The CPI of food increased by 9,1%, from 156,0 to 170,1; and that of non-food items increased by 5,0%, from 129,4 to 135,9. Meat prices rose by 11,6%, from an index fi gure of 154,4 to 172,3, while the prices of grain products increased by 9,3%, from 166,3 to 181,8. The consumer price index of vegetables increased by 5,7%, from 159,4 to 168,5, and that of fruit by 5,9%, from 146,1 to 154,6. In the case of dairy products and eggs, prices rose by 5,0 %, from an index of 157,7 to 165,6, while an increase of 11,9% was recorded for sugar and related products, from 151,9 to 169,9.

10 Economic Review of the South African Agriculture 2011/12
Imports and exports of agricultural products
The estimated value of imports for 2011/12 came to R64 924 million, an increase of 23,2% compared to R52 688 million for 2010/11. The value of exports increased by 11,4%, from R62 716 million in 2010/11 to R69 881 million in 2011/12.
According to the 2011/12 export values, citrus fruit (R7 032 million), wine (R5 743 million), chemical wood pulp, dissolving grades (R5 146 million), maize (R4 778 million) and grapes (R4 107 million) were the most important agricultural export products. Rice (R4 520 million), wheat and meslin (R3 650 million), poultry (R3 280 million), palm oil (R3 203 million) and undenatured ethyl alcohol (R2 637 million) accounted for the highest imports in terms of value.
During 2011/12, the Netherlands, with exports to the value of R5 918 million, the United Kingdom (R5 394 million), Zimbabwe (R5 305 million), Mozambique (R3 212 million) and Japan (R2 984 million) were the fi ve largest trading partners of South Africa in terms of export destinations for agricultural products. About 16,2% of the total value of agricultural exports for the period July 2011 to June 2012 went to the Nether-lands and the United Kingdom.
The fi ve largest trading partners for South Africa’s imported agricultural products during 2011/12 were Ar-gentina (R5 531 million), China (R5 075 million), Brazil (R4 931 million), Germany (R4 112 million) and the United States (R3 861 million).
Imports and exports of agriculture, forestry and fisheries products2007/08–2011/12 (July to June)
25 000
35 000
45 000
55 000
65 000
75 000
2007/08 2008/09 2009/10 2010/11 2011/12Year
R'm
illio
n
Imports Exports