econ 202 - macroeconomic principles - github pages · 2020-03-10 · econ 202 - macroeconomic...
TRANSCRIPT
ECON 202 - MACROECONOMIC PRINCIPLES
Instructor: Dr. Juergen Jung
Towson University
J.Jung Chapter 1 - Introduction Towson University 1 / 39
Disclaimer
These lecture notes are customized for the Macroeconomics Principles 202course at Towson University. They are not guaranteed to be error-free.Comments and corrections are greatly appreciated. They are derived fromthe Powerpoint c© slides from online resources provided by PearsonAddison-Wesley. The URL is: http://www.pearsonhighered.com/osullivan/
These lecture notes are meant as complement to the textbook and not asubstitute. They are created for pedagogical purposes to provide a link tothe textbook. These notes can be distributed with prior permission.
This version was compiled on: September 5, 2017.
J.Jung Chapter 1 - Introduction Towson University 2 / 39
Chapter 1 - Introduction toMacroeconomics
J.Jung Chapter 1 - Introduction Towson University 3 / 39
Topics
What is Macroeconomics?
Some US Facts
What is a Model?
J.Jung Chapter 1 - Introduction Towson University 4 / 39
Some US Facts
J.Jung Chapter 1 - Introduction Towson University 5 / 39
Considering the biggest economy in the world
Figure 1: The United States of America
J.Jung Chapter 1 - Introduction Towson University 6 / 39
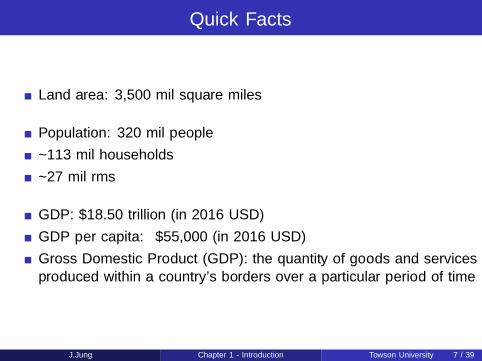
Quick Facts
Land area: 3,500 mil square miles
Population: 320 mil people˜113 mil households˜27 mil firms
GDP: $18.50 trillion (in 2016 USD)GDP per capita: ≈$55,000 (in 2016 USD)Gross Domestic Product (GDP): the quantity of goods and servicesproduced within a country’s borders over a particular period of time
J.Jung Chapter 1 - Introduction Towson University 7 / 39
GDP
J.Jung Chapter 1 - Introduction Towson University 8 / 39
GDP - Purchasing Power Parity (PPP) Adjusted
J.Jung Chapter 1 - Introduction Towson University 9 / 39
GDP - Per Capita
J.Jung Chapter 1 - Introduction Towson University 10 / 39
GDP - Per Capita PPP Adjusted
J.Jung Chapter 1 - Introduction Towson University 11 / 39

Gini Index
J.Jung Chapter 1 - Introduction Towson University 12 / 39
Gini Index
J.Jung Chapter 1 - Introduction Towson University 13 / 39
Aggregate Variables
Figure 2: Per Capita Real GDP (2000 USD)
J.Jung Chapter 1 - Introduction Towson University 14 / 39
Figure 3: Real GDP (2009 USD)
J.Jung Chapter 1 - Introduction Towson University 15 / 39
Note: Base year for real GDP is 2009
J.Jung Chapter 1 - Introduction Towson University 16 / 39
Figure 4: GDP and Consumption (2009 USD)
J.Jung Chapter 1 - Introduction Towson University 17 / 39
Figure 5: Growth Rates of GDP vs. Personal Consumption
J.Jung Chapter 1 - Introduction Towson University 18 / 39
Figure 6: Growth Rates of Real GDP and Non-Durables Consumption
J.Jung Chapter 1 - Introduction Towson University 19 / 39

Figure 7: Growth Rate GDP vs. Consumption of Clothing/Shoes
J.Jung Chapter 1 - Introduction Towson University 20 / 39
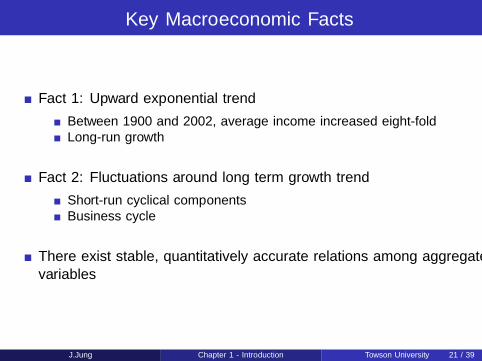
Key Macroeconomic Facts
Fact 1: Upward exponential trendBetween 1900 and 2002, average income increased eight-foldLong-run growth
Fact 2: Fluctuations around long term growth trendShort-run cyclical componentsBusiness cycle
There exist stable, quantitatively accurate relations among aggregatevariables
J.Jung Chapter 1 - Introduction Towson University 21 / 39
A Stable Relationship?
Figure 8: Okun’s Law
J.Jung Chapter 1 - Introduction Towson University 22 / 39
Original Phillips Curve: 1954-1970
J.Jung Chapter 1 - Introduction Towson University 23 / 39
Phillips Curve: 1954-2013
J.Jung Chapter 1 - Introduction Towson University 24 / 39
Beveridge Curve
J.Jung Chapter 1 - Introduction Towson University 25 / 39
A Stable Relationship?
Figure 9: Interest Rates and Unemployment
J.Jung Chapter 1 - Introduction Towson University 26 / 39

A Macroeconomic Model
J.Jung Chapter 1 - Introduction Towson University 27 / 39

Model
J.Jung Chapter 1 - Introduction Towson University 28 / 39

Some fundamental macro questions
1 What causes sustained economic growth?
2 Is economic growth indefinite i.e. limit to growth?
3 Can governments (policymakers) alter the rate of growth?
4 What causes business cycles?
5 Can the booms (expansions) and busts (recessions) be repeated?
6 Should governments (policymakers) smooth business cycles?
J.Jung Chapter 1 - Introduction Towson University 29 / 39
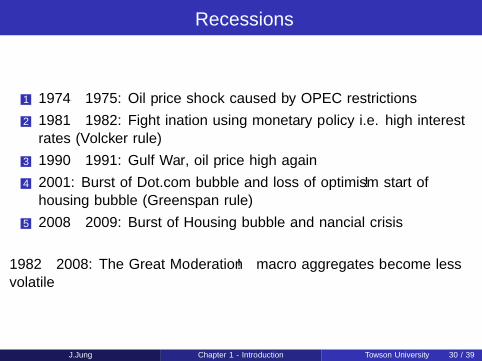
Recessions
1 1974− 1975: Oil price shock caused by OPEC restrictions2 1981− 1982: Fight inflation using monetary policy i.e. high interest
rates (Volcker rule)3 1990− 1991: Gulf War, oil price high again4 2001: Burst of Dot.com bubble and loss of optimism → start of
housing bubble (Greenspan rule)5 2008− 2009: Burst of Housing bubble and financial crisis
1982− 2008: The Great Moderation → macro aggregates become lessvolatile
J.Jung Chapter 1 - Introduction Towson University 30 / 39
Figures
J.Jung Chapter 1 - Introduction Towson University 31 / 39

Figures (cont.)
Figure 10: Percentage Deviation from Trend in Real GDP, 1947-2009
J.Jung Chapter 1 - Introduction Towson University 32 / 39
Figures (cont.)
Figure 11: Total Taxes and Total Government Spending
J.Jung Chapter 1 - Introduction Towson University 33 / 39
Figures (cont.)
Figure 12: Government Surplus (Deficit) as fraction of GDP
Figure 13: The Inflation Rate and the Money Growth Rate
Figure 14: The Unemployment Rate in the United States, 1948-2012
Figure 15: Deviations from Trend in the Unemployment Rate and Percentage Devi-ations from Trend in Real GDP
J.Jung Chapter 1 - Introduction Towson University 34 / 39
Appendix
J.Jung Chapter 1 - Introduction Towson University 35 / 39
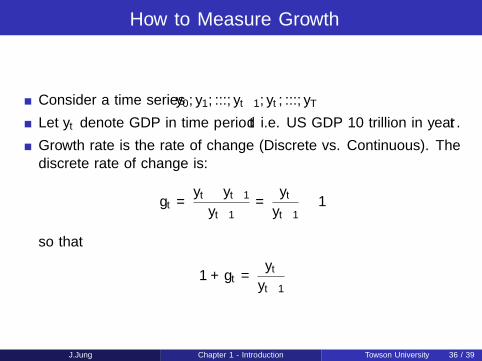
How to Measure Growth
Consider a time series y0, y1, ..., yt−1, yt , ..., yT
Let yt denote GDP in time period t i.e. US GDP 10 trillion in year t.Growth rate is the rate of change (Discrete vs. Continuous). Thediscrete rate of change is:
gt = yt − yt−1yt−1
= ytyt−1
− 1
so that
1 + gt = ytyt−1
J.Jung Chapter 1 - Introduction Towson University 36 / 39

How to Measure Growth (cont.)
Note: If x is small then log(1 + x) ≈ x . So, if gt is small then:
log(1 + gt) ≈ gt
log( yt
yt−1
)≈ gt
orlog yt − log yt−1 ≈ gt
∆ log yt ≈ gt
gt is the slope of the log yt line.Can think of growth rates in log as continuous time analogue ofdiscrete approximation
J.Jung Chapter 1 - Introduction Towson University 37 / 39
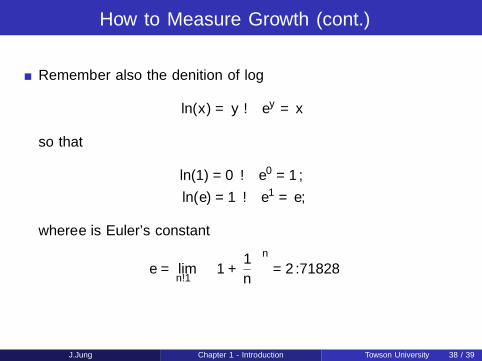
How to Measure Growth (cont.)
Remember also the definition of log
ln(x) = y → ey = x
so that
ln(1) = 0→ e0 = 1,
ln(e) = 1→ e1 = e,
where e is Euler’s constant
e = limn→∞
(1 + 1
n
)n= 2.71828
J.Jung Chapter 1 - Introduction Towson University 38 / 39
Figure 16: Natural Log of Per Capita Real GDP
J.Jung Chapter 1 - Introduction Towson University 39 / 39