ecology and biology of nuisance algae in rice fields...vii tables table 1 summary of information...
TRANSCRIPT

Ecology and biology of nuisance algae in rice fields A report for the Rural Industries Research and Development Corporation by A.J. Grant, M. Pavlova, L. Wilkinson-White, A. Haythornthwaite, I. Grant, D. Ko, B. Sutton, & R. Hinde School of Biological Sciences, University of Sydney. May 2006 RIRDC Publication No 06/010 RIRDC Project No US-115A

ii
© 2006 Rural Industries Research and Development Corporation. All rights reserved. ISBN 1 74151 273 5 ISSN 1440-6845 Ecology and Biology of Nuisance Algae in Rice Fields Publication No. 06/010 Project No. US-115A The information contained in this publication is intended for general use to assist public knowledge and discussion and to help improve the development of sustainable industries. The information should not be relied upon for the purpose of a particular matter. Specialist and/or appropriate legal advice should be obtained before any action or decision is taken on the basis of any material in this document. The Commonwealth of Australia, Rural Industries Research and Development Corporation, the authors or contributors do not assume liability of any kind whatsoever resulting from any person's use or reliance upon the content of this document. This publication is copyright. However, RIRDC encourages wide dissemination of its research, providing the Corporation is clearly acknowledged. For any other enquiries concerning reproduction, contact the Publications Manager on phone 02 6272 3186. Researcher Contact Details A.J. Grant School of Biological Sciences, A08, University of Sydney, NSW, 2006. Phone: 02 9351 4488 Fax: 02 9351 4119 Email: [email protected]
In submitting this report, the researcher has agreed to RIRDC publishing this material in its edited form. RIRDC Contact Details Rural Industries Research and Development Corporation Level 2, 15 National Circuit, Barton ACT 2600 PO Box 4776 KINGSTON ACT 2604 Phone: 02 6272 4819 Fax: 02 6272 5877 Email: [email protected]. Web: http://www.rirdc.gov.au Electronically Published in May 2006

iii
Foreword Current methods of more intensive cropping and fertilising, together with flooding rice fields prior to sowing pre-germinated rice seed, have increased competition for nutrients between rice and other organisms. Competition from nuisance slime has been considered a factor in reducing the economic potential of rice crops by some rice growers. Two forms of slime can reduce rice seedling establishment. There are few data on this phenomenon with only one detailed study on algal slime, done in 1980 (Noble & Happey-Wood, 1987). To maintain high productivity, it is important to determine the source and identity of these forms of nuisance slime, and the conditions that favour the growth of slime organisms over rice. Green slime includes several species of filamentous green algae, single-celled green and blue-green algae. We have now learned that farmers are readily able to manage green slime. However, farmers are still concerned about brown slime which was previously believed to be caused by the growth of silica-walled algae, called diatoms (Noble and Happey-Wood, 1987). We have now determined that brown slime is actually caused by bacteria, primarily iron-oxidizing bacteria. Bacteria produce a sticky slime and many other organisms (invertebrates and green algae) and residue left from previous crops, bind to it. Mats of brown slime up to 1 cm thick may form, covering small to large (2 x 50 m) areas, which may hinder the emergence of rice seedlings during establishment. This study revealed several conditions that lead to an increase in brown slime over rice seedling growth. These conditions include high levels of urea combined with still water. We have suggested changes in management practices for farmers that will reduce competition from brown slime. This project was funded from industry revenue which is matched by funds provided by the Australian Government through the Rural Industries Research and Development Corporation. It is an addition to RIRDC’s diverse range of over 1500 research publications and forms part of our Rice R&D program, which aims to improve the profitability and sustainability of the Australian rice industry.. Most of our publications are available for viewing, downloading or purchasing online through our website: • downloads at www.rirdc.gov.au/fullreports/index.html • purchases at www.rirdc.gov.au/eshop Peter O’Brien Managing Director Rural Industries Research and Development Corporation

iv
Acknowledgments D. Patterson for identifying oxidized iron in the early brown slime samples, H. Hanert for identifying species of bacteria, B. Singh for advice about biological iron oxidation, Malcolm Ricketts for help with photography, Rice Research Committee delegates who were particularly helpful in providing contact with farmers, DPI regional agronomists, S. Skinner of the Royal Botanic Gardens (Sydney), scientists at CRC, Yanco, L. Parker of MIA, A. McLean of DIPNR, Leeton and the many farmers who patiently advised us about their methods for rice growing.
Abbreviations Within the results, individual farms are numbered and linked to the following codes for each locality. Area code Locality
CB Cobram CL Colleambally DE Deniliquin FN Finley GG Gogeldrie GR Griffith HA Hanwood JE Jerilderie LE Leeton MD Morundah ML Moulamein MU Murrami TC Tocumwal WA Wakool WD Widgelli WL Willbriggie
Within this report, the following abbreviations are used. Abbreviation Full name CRC Co-operative Research Centre DPI Department of Primary Industries DIPNR Department of Infrastructure, Planning and
Natural Resources DLWC Department of Land and Water Conservation MIA Murrumbidgee Irrigation Authority MIL Murray Irrigation Limited PI Panicle Initiation (growth phase of rice)

v
Contents Foreword ............................................................................................................................................... iii Acknowledgments................................................................................................................................. iv Abbreviations........................................................................................................................................ iv List of tables and figures...................................................................................................................... vi
Figures................................................................................................................................................ vi Tables ................................................................................................................................................ vii
Executive Summary ........................................................................................................................... viii Introduction ........................................................................................................................................... 1
1. Background ..................................................................................................................................... 1 2. Objectives of the project.................................................................................................................. 2
Methodology .......................................................................................................................................... 2 1. Information gathering...................................................................................................................... 2 2. Collection of soil and water samples and analysis of green slime .................................................. 3 3. Collection of soil and brown slime samples.................................................................................... 3 4. Microscopic examination of organisms in brown slime.................................................................. 3 5. Laboratory experiments determining the effect of flooding and urea on rice growth..................... 3 6. Consequences of brown slime for rice yield ................................................................................... 5
Results .................................................................................................................................................... 6 1. Information gathering...................................................................................................................... 6 2. Incidence of green slime in farm samples October 2002 ................................................................ 6 3. Quantity of green algae present in water supply channels and several farms ................................. 7 4. Brown slime collected from farms in October, 2002 ...................................................................... 9 5. Brown slime appears in several colours and forms ....................................................................... 10 6. Microscopic organisms found in brown slime samples................................................................. 13 7. Types of iron-oxidizing bacteria identified in samples of brown slime ....................................... 15 8. Brown slime and its management.................................................................................................. 16 9. Effect of sowing rice into damp soil versus flooded soil .............................................................. 20 9. Effects of fertiliser on the formation of brown slime .................................................................... 20 10. Selection of urease producing bacteria from brown slime samples ............................................ 22 11. Effects of fertilisers on rice seedling growth............................................................................... 23 12. Effect of pH on rice growth......................................................................................................... 25 13. Effect of brown slime on final crop............................................................................................. 27
Discussion............................................................................................................................................. 29 The nature of brown slime in rice bays ............................................................................................. 29 The link between urea and brown slime in flooded rice bays ........................................................... 30 Why is brown slime sometimes a problem?...................................................................................... 31
Conclusions .......................................................................................................................................... 33 Recommendations – suggestions for management of brown slime .................................................. 33
References ............................................................................................................................................ 36 Extensions ............................................................................................................................................ 38 Publications arising from this project ............................................................................................... 38
vi
List of tables and figures Figures Fig. 1 Concentration of chlorophyll a in water samples taken from the Murrumbidgee River in
October 2002 (shaded bars) and August 2003 (stippled bars). Values represent the mean + SEM (n=3). Error bars are absent from August 2003 (n=2).
Fig. 2 Concentration of chlorophyll a in water collected from rice farms and adjacent supply
channels in October 2002. Values represent the mean + SEM (n=3). Fig. 3 Concentrations of chlorophyll a in water collected from water supply channels in June
2003. Fig. 4A Showing green algae growing in a mat of brown slime Fig. 4B A thin layer of brown slime that has remained at the soil surface. Fig. 4C An example of brown slime that has lifted off the soil surface but is not a problem but the
mat is sufficiently fragmented to enable rice plants to penetrate. Fig. 4D Showing rice seedlings having difficulty growing through a mat of brown slime Fig. 4E An example of organic matter in brown slime that has accumulated at the edge of a rice
bay Fig. 5 Percentage of samples of brown slime from Table 4 in which iron deposits and
microscopic organisms were found (n = 30), collected from the soil (shaded bars, n = 14) and water surface (open bars, n = 16), during November 2003 and November 2004.
Fig. 6 This photograph shows a diatom caught up in brown slime produced by iron oxidizing
bacteria collected from Site WD1 (photograph taken by D. J. Patterson). Bacteria are barely visible at this magnification
Fig. 7 Siderobacter sp. bacteria and iron oxide present in a sample collected from site JE1 in
November, 2004. Fig. 8 Photograph of bacteria predominantly Siderococcus sp., with iron oxide present in a slime
sample collected from JE1 in November, 2004 Fig. 9A Growth of rice seeds in flooded (3 left-hand side tubes) versus damp soil (3 right-hand
side tubes) 10 days after sowing Fig. 9B Growth of rice seeds in flooded (3 left-hand side tubes) versus damp soil (3 right-hand
side tubes) 18 days after sowing Fig. 10 Increase in iron oxidation with increasing urea (0, 58, 108, 198, 413 mg from left to right)
at 8 days after flooding Fig. 11 Leaf lengths of the first three leaves to emerge from rice seeds. Fig. 12 Showing a rice farmer measuring the pH of water in a rice bay, in November 2004. Fig. 13 Showing brown slime during establishment (left-hand side) compared with the same crop
just before harvest (right-hand side). Fig. 14 Three examples of grey soils that contain reduced iron (grey visible in footprints) beneath
a layer of oxidized iron (brown)

vii
Tables Table 1 Summary of information gathering visits, October 2002–March 2005. Table 2 Green nuisance algae identified in samples of green slime (n.d. = not determined). Table 3 Samples of brown slime collected in October, 2002. Table 4 Range of the numbers of microscopic organisms, other than bacteria, found in samples of
brown slime (n = 30) collected from the soil or water surface during rice establishment in November 2003 and November 2004.
Table 5 Nitrogen source and amount and slime problems. Table 6 Iron oxidation occurred in water above soil incubated with urea (810 mg) or urea plus
phosphate (54 mg) under flooded conditions in the laboratory for 7 days. Table 7 Preliminary data showing that the addition of urea selects for soil bacteria that produce
urease. Table 8 Range of pH in paddy water and soil samples measured between 23rd and 29th
November, 2004.
viii
Executive Summary Introduction This report describes an RIRDC-funded study of the causes and management of slimes affecting rice production in the irrigated areas of southern New South Wales. At the start of the project it was believed that two types, green slime and brown slime, were problematic and that both were caused by algae – hence the title of our project. However, green slime is already very well managed and is, therefore, a minor problem. Bacteria proved to be the major cause of significant brown slime formation, and this became the major focus of our research. The occurrence of slime in rice bays is important because it can reduce the yield of rice by killing seedlings. Organisms in the slime also compete for nitrogen with the rice plants. Potential benefits of the research include better yields of rice, lower fertiliser costs for farmers and possibly further economies in the use of water. Prior to this project, there had been very little research on the effects, causes and management of slime in Australian rice production. The main work was that of Noble and Happey-Wood (1987). Intended Audience This report provides information on green and brown slime for rice farmers, agricultural extension workers, educators and future researchers. It includes descriptions of the components and causes of slime and recommendations for control, supported by field observations (by farmers themselves and by researchers) and experimental evidence gained in our laboratory. Background Coherent, floating slime is common in rice fields. When rice seedlings are small, particularly before the 3-leaf stage, slime may prevent them from growing through the water/slime surface layer, reducing rice establishment. Even at later stages, slime may compete with the rice for nutrients. Farming practices have changed in the last 20 years or so. Currently rice production is intensive, with a crop each year and shorter periods of crop rotation; these two changes have led to more intensive use of fertilisers, particularly urea. It is now more common to flood fields before sowing rice, rather than after sowing into dry soil. Our research suggests that these changed practices have caused the increase in nuisance slime reported by farmers. Green slime is caused by algae – several types of filamentous green and blue-green algae form mats that float on the water in rice bays. However, existing management practices deal with this effectively, and farmers were not concerned about green slime affecting yields. Brown slime is stickier and more tenacious, and may form mats up to 1 cm thick on the water surface; they may cover large areas (at least 2m x 50m). These mats may reduce rice establishment, and are seen as a problem by some farmers. Previous work by Noble and Happey-Wood (1987) suggested that brown slime was caused by diatoms – golden-brown algae with silica cell walls. We found that bacteria cause brown slime, and that relatively few diatoms are found in it. Farmers variously attributed growth of slime to the presence of decomposing organic matter, poor water circulation, poor land preparation and arrival of algae in irrigation water. Evidence from their study led Noble & Happey-Wood (1987) to conclude that input of algae from rivers was small and that conditions within rice bays increased algal populations. In spite of this, farmers we spoke to were still concerned that algae from rivers or irrigation channels might be causing slime. We were able to show that the algal populations of this incoming irrigation water are, indeed, very low.
ix
While green slime is common, it is easily controlled and does not seem to affect yield.
It is caused by algae.
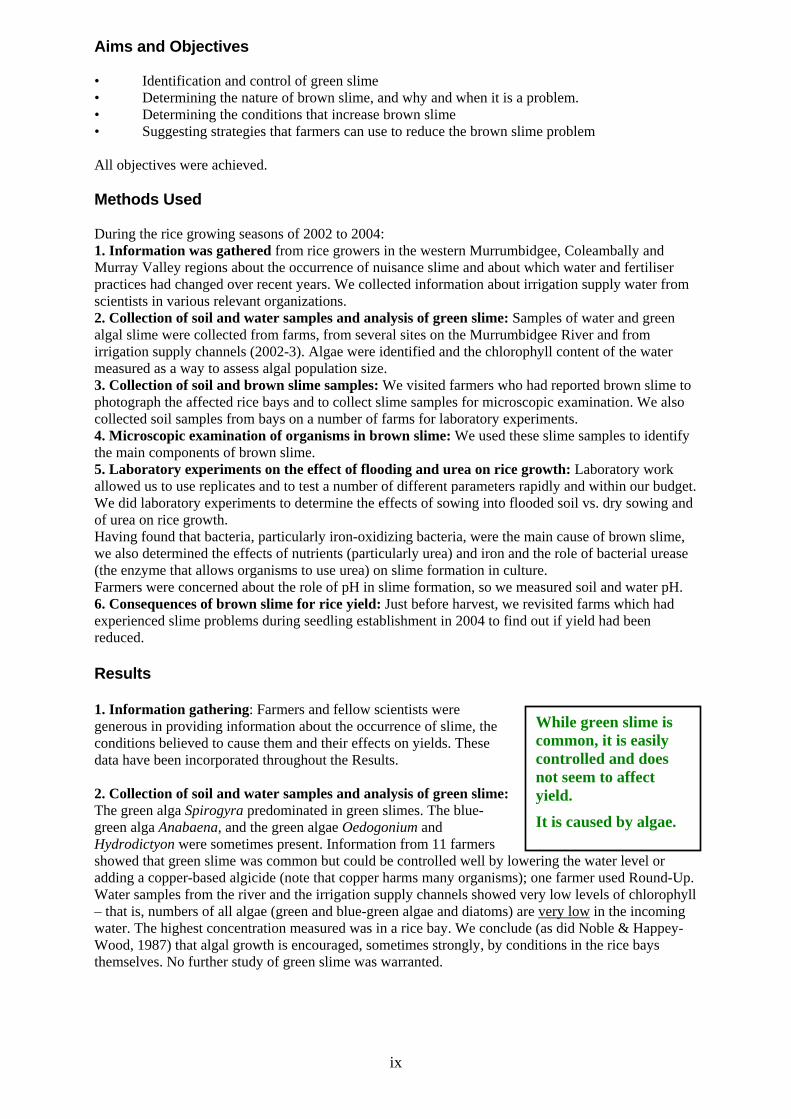
Aims and Objectives • Identification and control of green slime • Determining the nature of brown slime, and why and when it is a problem. • Determining the conditions that increase brown slime • Suggesting strategies that farmers can use to reduce the brown slime problem All objectives were achieved. Methods Used During the rice growing seasons of 2002 to 2004: 1. Information was gathered from rice growers in the western Murrumbidgee, Coleambally and Murray Valley regions about the occurrence of nuisance slime and about which water and fertiliser practices had changed over recent years. We collected information about irrigation supply water from scientists in various relevant organizations. 2. Collection of soil and water samples and analysis of green slime: Samples of water and green algal slime were collected from farms, from several sites on the Murrumbidgee River and from irrigation supply channels (2002-3). Algae were identified and the chlorophyll content of the water measured as a way to assess algal population size. 3. Collection of soil and brown slime samples: We visited farmers who had reported brown slime to photograph the affected rice bays and to collect slime samples for microscopic examination. We also collected soil samples from bays on a number of farms for laboratory experiments. 4. Microscopic examination of organisms in brown slime: We used these slime samples to identify the main components of brown slime. 5. Laboratory experiments on the effect of flooding and urea on rice growth: Laboratory work allowed us to use replicates and to test a number of different parameters rapidly and within our budget. We did laboratory experiments to determine the effects of sowing into flooded soil vs. dry sowing and of urea on rice growth. Having found that bacteria, particularly iron-oxidizing bacteria, were the main cause of brown slime, we also determined the effects of nutrients (particularly urea) and iron and the role of bacterial urease (the enzyme that allows organisms to use urea) on slime formation in culture. Farmers were concerned about the role of pH in slime formation, so we measured soil and water pH. 6. Consequences of brown slime for rice yield: Just before harvest, we revisited farms which had experienced slime problems during seedling establishment in 2004 to find out if yield had been reduced. Results 1. Information gathering: Farmers and fellow scientists were generous in providing information about the occurrence of slime, the conditions believed to cause them and their effects on yields. These data have been incorporated throughout the Results. 2. Collection of soil and water samples and analysis of green slime: The green alga Spirogyra predominated in green slimes. The blue-green alga Anabaena, and the green algae Oedogonium and Hydrodictyon were sometimes present. Information from 11 farmers showed that green slime was common but could be controlled well by lowering the water level or adding a copper-based algicide (note that copper harms many organisms); one farmer used Round-Up. Water samples from the river and the irrigation supply channels showed very low levels of chlorophyll – that is, numbers of all algae (green and blue-green algae and diatoms) are very low in the incoming water. The highest concentration measured was in a rice bay. We conclude (as did Noble & Happey-Wood, 1987) that algal growth is encouraged, sometimes strongly, by conditions in the rice bays themselves. No further study of green slime was warranted.
x
Brown slime needs urea, iron and iron-oxidizing bacteria to form. Iron and iron-oxidizing bacteria occur in all soils. Urea levels are the key to controlling brown slime.
Brown slime is caused by bacteria. Algae are not important. The bacteria produce iron oxide (rust) making the slime brown.
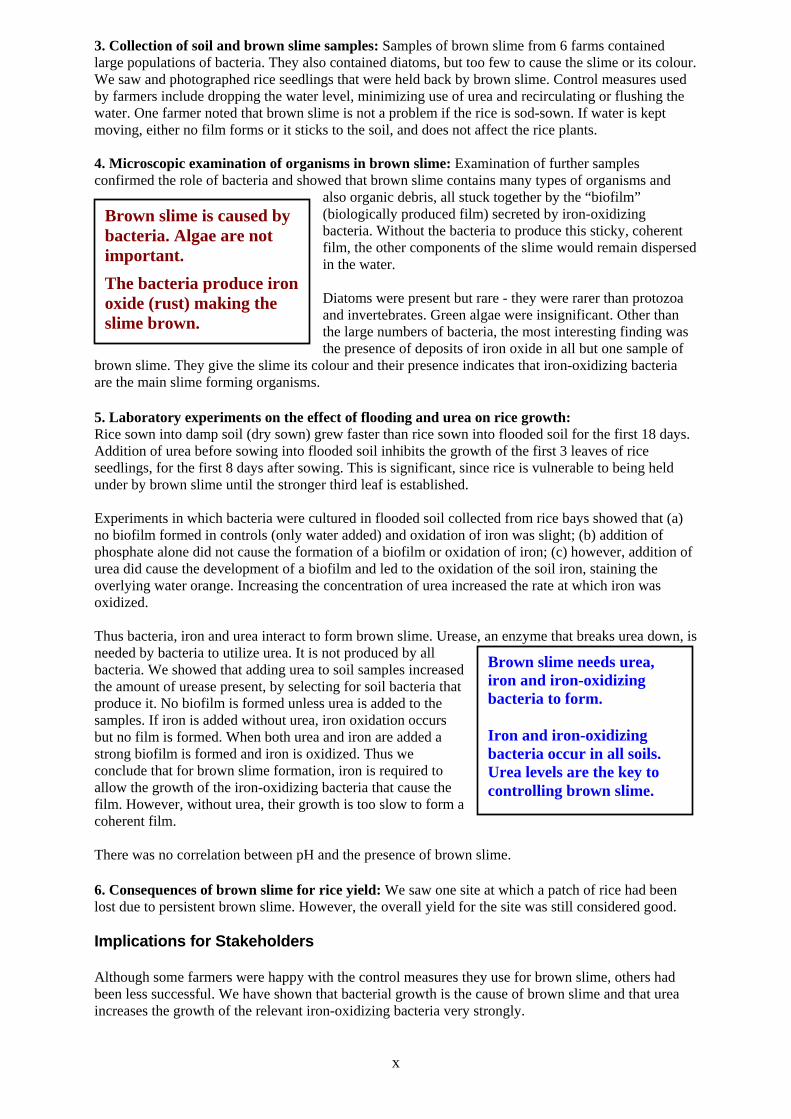
3. Collection of soil and brown slime samples: Samples of brown slime from 6 farms contained large populations of bacteria. They also contained diatoms, but too few to cause the slime or its colour. We saw and photographed rice seedlings that were held back by brown slime. Control measures used by farmers include dropping the water level, minimizing use of urea and recirculating or flushing the water. One farmer noted that brown slime is not a problem if the rice is sod-sown. If water is kept moving, either no film forms or it sticks to the soil, and does not affect the rice plants. 4. Microscopic examination of organisms in brown slime: Examination of further samples confirmed the role of bacteria and showed that brown slime contains many types of organisms and
also organic debris, all stuck together by the “biofilm” (biologically produced film) secreted by iron-oxidizing bacteria. Without the bacteria to produce this sticky, coherent film, the other components of the slime would remain dispersed in the water. Diatoms were present but rare - they were rarer than protozoa and invertebrates. Green algae were insignificant. Other than the large numbers of bacteria, the most interesting finding was the presence of deposits of iron oxide in all but one sample of
brown slime. They give the slime its colour and their presence indicates that iron-oxidizing bacteria are the main slime forming organisms. 5. Laboratory experiments on the effect of flooding and urea on rice growth: Rice sown into damp soil (dry sown) grew faster than rice sown into flooded soil for the first 18 days. Addition of urea before sowing into flooded soil inhibits the growth of the first 3 leaves of rice seedlings, for the first 8 days after sowing. This is significant, since rice is vulnerable to being held under by brown slime until the stronger third leaf is established. Experiments in which bacteria were cultured in flooded soil collected from rice bays showed that (a) no biofilm formed in controls (only water added) and oxidation of iron was slight; (b) addition of phosphate alone did not cause the formation of a biofilm or oxidation of iron; (c) however, addition of urea did cause the development of a biofilm and led to the oxidation of the soil iron, staining the overlying water orange. Increasing the concentration of urea increased the rate at which iron was oxidized. Thus bacteria, iron and urea interact to form brown slime. Urease, an enzyme that breaks urea down, is needed by bacteria to utilize urea. It is not produced by all bacteria. We showed that adding urea to soil samples increased the amount of urease present, by selecting for soil bacteria that produce it. No biofilm is formed unless urea is added to the samples. If iron is added without urea, iron oxidation occurs but no film is formed. When both urea and iron are added a strong biofilm is formed and iron is oxidized. Thus we conclude that for brown slime formation, iron is required to allow the growth of the iron-oxidizing bacteria that cause the film. However, without urea, their growth is too slow to form a coherent film. There was no correlation between pH and the presence of brown slime. 6. Consequences of brown slime for rice yield: We saw one site at which a patch of rice had been lost due to persistent brown slime. However, the overall yield for the site was still considered good. Implications for Stakeholders Although some farmers were happy with the control measures they use for brown slime, others had been less successful. We have shown that bacterial growth is the cause of brown slime and that urea increases the growth of the relevant iron-oxidizing bacteria very strongly.

xi
Evidence from our discussions with farmers and our observations show other factors that are involved as well (see Recommendations, below), including the presence of still water during rice establishment. Thus we have now provided a rationale for control measures for brown slime. This will benefit rice growers and hence the whole industry. Recommendations to rice growers Suggested management practices to reduce brown slime.
avoid using urea at rates above 57.5 kg N/ha in slime-prone soils prior to flooding where possible, sow clover in rotation to fix nitrogen dry sow rice or sow as soon as possible after flooding
If brown slime does form
keep water moving, especially in corners of bays, to prevent the formation of large slime mats reduce water levels to keep rice leaves above slime BUT only after rice seedlings have
reached the 3 leaf stage if the slime mats are limited, try raking the mats and throwing them onto nearby banks
How can farmers tell whether there will be a likelihood of brown slime
past experience of particular bays/paddocks soil type; e.g. brown slime is more likely if the surface of grey soils always turns orange after
flooding, as iron is probably abundant. Many grey soils contain reduced iron. about 3 weeks before sowing, test soil from bays thought to be likely candidates for brown
slime. Test by adding urea to soil plus water in a glass jar - watch for the appearance of brown-orange coloured iron oxides in the next two weeks.
1
Introduction 1. Background In Australia, rice (Oryza sativa L.) is grown only in the irrigated regions of southern NSW where about 2000 family farms produce about 1.2 million tonnes of rice a year. Rice production in Australia is fully irrigated and 80-90 % of the rice crop is exported to more than sixty destinations throughout the world where it competes against highly subsidised products In the Murrumbidgee, Coleambally and Murray Valley regions, rice farmers have reported an increasing problem of competition from both green and brown 'slime' which may hinder rice seedling development. It has been assumed that these nuisance slimes are caused by the growth of aquatic algae that may clog waterways as well as impeding the growth of young rice plants, especially if conditions favour the growth of slime organisms over rice. Green slime is caused by the growth of aquatic green algae and blue-green algae, which include simple photosynthetic organisms that reproduce by spore production, or vegetatively by cell division (Entwisle, 1998). Both filamentous and single-celled green and blue-green algae may form green slime that clogs waterways and impedes the growth of young rice plants, especially if conditions favour the growth of algae over rice. Brown slime has previously been assumed to be caused by the growth of silica-walled diatoms (golden-brown algae) which attach themselves to rice seedlings (Noble & Happey-Wood, 1987). In 1980, a scientific study (Noble & Happey-Wood, 1987) attempted to estimate the importance of the algal slime problem in rice fields of southern NSW. The response of 668 rice growers to a postal survey which included multiple choice questions asking about the extent and incidence of algal slime problems, indicated that more than a third of the respondents experienced a slime problem every 1-3 years. Some farmers believed that the main factors linked to slime occurrence were the presence of large amounts of decomposing organic matter, poor water circulation and poor land preparation (Noble & Happey-Wood, 1987). Other farmers claimed that they had an annual slime problem from algae that came in with irrigation water. However, only small numbers of filamentous algae and diatoms were found in the water coming from the Water Resources Commission channel. Once water was retained in rice bays, the algal population increased both in quantity and species diversity. These findings suggested that the water supply was not the prime source of algae and that the conditions within the rice bays contributed to algal growth (Noble & Happey-Wood, 1987). In their study, three sites (2 bays in each site) in the Denimein Irrigation District of the Murray Valley were studied in detail over one season (Noble & Happey-Wood, 1987). Sites included: one that had an annual problem of brown slime (considered to be due to diatoms); a site that experienced a slime problem only rarely (type unspecified) and a site of natural grassland that had not previously been used for rice. Prior to sowing and during the growth period, algal species and biomass were determined in the incoming irrigation water and in rice bays. Nutrients were also measured in soil samples (N, P, PO4, organic C, Cl, Ca, Mg, Na, K) prior to irrigation and rice sowing. All sites were seeded by aerial sowing of Calrose rice. However, no correlation was found between high levels of nuisance algae and either soil nutrient levels or rice yield (Noble & Happey-Wood, 1987). Rice farms range between 100 and 1000 hectares in size although only approx. 30% of each farm may be sown to rice per year. However, the amount of rice sown each season is also dependent upon the water allocation to each farm so that less rice may be grown during dry years.

2
Current practices for growing rice vary considerably between individual farms but methods include the following: (i) drilling fertilisers into dry soil prior to flooding the bays with water. Nitrogen (N) and phosphorus (P) are the main fertilisers added to rice crops (Ricecheck, 2003) (ii) the main form of nitrogen added before planting has been urea because of its low cost and ready availability. Recently, anhydrous NH3 has been used by some farmers which requires specialised equipment for its application. (iii) sowing rice into dry soil or sowing pregerminated rice seeds by air into flooded rice bays (iv) adding herbicides into flooded rice bays and keeping the water 'locked up' (i.e. still) for up to 10 days to control pre-emergent weeds (v) flushing water through the rice bays to remove herbicides then adding permanent water until just prior to harvest when the bays are drained. (vi) another application of nitrogen may be made at panicle initiation (PI) To reduce the quantity of brown slime in rice fields, Ricecheck (2003) has recommended minimising decaying organic matter on the soil surface and lowering water levels to expose both rice and slime to sunlight. Nevertheless, the slime problem is now considered to be worse than 20 years ago which may be due to changes in cultural practices. These changes include a preference for aerial sowing into flooded bays rather than dry sowing, continuous rather than rotational rice crops and, higher levels of residual soil nutrients due to more frequent fertiliser applications to sustain continuous cropping. A continuing concern for some farmers is that increased levels of nutrients enter rice paddies through the supply channel water. Although green slime has been clearly linked to green algae, at the start of this project the cause and identity of nuisance brown slime was still unknown. 2. Objectives of the project • Identification and control of green slime. • Determining the nature of brown slime, why and when it is a problem. • Determining the conditions that increase brown slime formation. • Suggesting strategies that farmers can use to reduce the brown slime problem.
Methodology
1. Information gathering
This project was conducted during the rice growing seasons of 2002-2004. We gathered information from rice growers in the western Murrumbidgee, Coleambally and Murray Valley regions about the location and seasonal appearance of nuisance slime and established which water and fertiliser practices had changed over recent years. We collected information about irrigation supply water from scientists at the Dept. of Infrastructure Planning and Natural Resources at Leeton (DIPNR), and from the Murrumbidgee Irrigation Authority (MIA) at Leeton and Murray Irrigation Limited (MIL) at Deniliquin. We also contacted scientists at the Cooperative Research Centre (CRC) for Sustainable Rice Production at Yanco Agricultural Institute and Charles Sturt University at Wagga Wagga.

3
At field days, rice establishment meetings and during each field trip, we talked to farmers who continued to have problems with brown slime and to those who successfully manage brown slime.
2. Collection of soil and water samples and analysis of green slime During October 2002, we collected samples of green slime from 10 farms for identification of algae. As several farmers still consider that the supply water to be the source of algal slime, water samples (25-30 ml) were also collected from the Murrumbidgee River at Narrandera, Gundagai and Jugiong in October 2002 and August 2003. Samples from several irrigation supply channel sites collected during June 2003 were supplied by Dr. Mark Stevens of Yanco Agricultural College for analysis. We identified the predominant green algal species that were present (Entwisle et al., 1988) in green slime samples using an Olympus, compound microscope. Green algae in water samples were quantified using a Water pulse amplitude fluorometer which measures chlorophyll a .
3. Collection of soil and brown slime samples Initially, we planned to study up to 10 rice farms and to collect water samples and soil samples (core of 20 mm deep, 50 mm diameter) from rice paddocks and then examine several parameters that cause algal slime. In the first field trip in October 2002, we collected samples of both brown and green slime. After we found that green (algal) slime was manageable and that brown slime was due to bacteria rather than to algae, we changed our approach and concentrated on the problem of brown slime. Farm selection for brown slime sample collection was made on the basis of (i) farmers who contacted their local Rice Research Committee delegate and asked us to visit them (ii) farmers who contacted their local Department of Primary Industries (DPI) agronomists with reports of nuisance brown slime (iii) farmers who had heard of our project Photographs of slime in rice bays were taken using either a Canon Ixus M-1 with Advanced Photo System Fuji film or a Canon Powershot A70 digital camera. 4. Microscopic examination of organisms in brown slime Samples of brown slime collected from farms were examined microscopically (Olympus CH-2 compound microscope) and the types and numbers or organisms were counted in a 1.8 mm field of view. Microscopic photographs were taken using a Zeiss Axiophot microscope attached to a Leica DC 300F digital camera (Leica IM 1000 software, and OS98 operating system) with the assistance of M. Ricketts. 5. Laboratory experiments determining the effect of flooding and urea on rice growth Variables such as climate, rain and wind are beyond the control of farmers. Thus we concentrated on the parameters that are within their control.
4
To compare the rate of growth of rice seedlings in damp or flooded soil and the effect of fertilisers, soil samples (up to 15 cm depth) collected from several rice farms were cultured in sterile transparent 50 ml tubes (Greiner, Disposable Products, Australia). These tubes allowed replicates of several treatments to be included in each experiment and being transparent, enabled visual inspection of the soil surface. Tubes were placed in a growth cabinet with 13 h light and a temperature range of 9 - 23oC based on the long-term average temperatures for October (DPI, Deniliquin) to simulate conditions found in the rice growing region during rice establishment. 5.1. The effect of flooding on early rice growth To compare the effect of flooding versus sowing onto damp soil in early rice seedling growth, urea was omitted. Soil (10 g) was added to each tube and distilled water added until the soil was just damp or to a depth of 3 cm above the soil surface to simulate flooded conditions. Water was added to compensate for evaporation during the experiment as necessary. Amaroo rice seeds were soaked for 24 h in distilled water then drained for 24 h prior to dropping three seeds into each tube 5.2. The effect of pre-sown nutrients on early rice growth Yates superphosphate was used as a source of phosphorus in preliminary experiments. As phosphate stimulated the growth of green algae but had no effect on the growth of brown slime it was omitted from later experiments. Urea (Incitec) was included as the nitrogenous fertiliser as it is the most commonly used form of nitrogen. The addition of nitrogen is usually estimated from paddock history. For areas in which there has been continuous rice cropping, RiceCheck (2003) suggests adding 180 - 240 kg N/ha but lower amounts (0 - 60 kg N/ha) when subclover has been grown for the past 1-4 years. In 'cut' areas where topsoil has been removed and not replaced, farmers are advised to add extra nitrogen, up to 300 kg N/ha depending upon the depth of the cut (RiceCheck, 2003). After visiting several farms and talking to farmers we realised that it would be impossible to accurately simulate field conditions in test tubes. Urea is applied at the required number of kg of N/ha, to the dry soil of rice paddocks over large areas by machinery. Nevertheless, within a rice bay, due to a variety of spatial and physical parameters, the amount of urea will not necessarily be uniform over each square centimeter of soil. To best simulate field conditions in laboratory experiments we added urea at 27.5 mg per 50 ml tube as a rough approximation of 180 kg N/ha. To determine the effect of urea on early seedling growth under flooded conditions, urea was added to the base of 50 ml tubes (in triplicate) at the following concentrations: none (Controls), 27.5 mg or 55 mg. Ten g of soil (collected from rice paddocks) were then added to each tube, followed by the addition of distilled water to a depth of 3 cm above the soil. The tubes were placed in a growth cabinet with the lids removed (as described in Section 5). Rice seeds were added to each tube three days after flooding. 5.3. Measurement of pH The pH was monitored using Sigma pH strips or a TPS WP-81 pH meter.

5
5.4. Selection of urease producing bacteria from brown slime samples Sterile tubes containing 25 ml of modified P medium (pH 6.1) for bacterial culture (Kolbel-Boelke et al., 1988) including Peptone (Amyl Media) as a source of nitrogen (Agudelo et al., 2004), were inoculated with 100 μl of samples of brown slime supplemented with FeSO4 (700 μM) and urea (1 gm/L) as required. These cultures were further subcultured into fresh medium at 4 week intervals. To measure urease activity, 12 ml of each culture were centrifuged at 13,000 g for 5 min, the supernatant discarded and the pellets resuspended in 500 μl of 200 mM K2HPO4 buffer pH 7.6 in a 1.5 ml microfuge tube and frozen at -70oC for 24 h. After thawing, the pellets were sonicated (Bronson Sonifier B 12) for 3 rounds of 10 seconds each, keeping the tube on ice. Cell debris was pelleted by centrifugation and the supernatant used to measure urease activity, using the NADH coupled assay at 25oC (Kaltwasser & Schlegel, 1966). Non-specific NADH oxidase activity was determined in samples run in parallel without urea and was deducted from the rates obtained in the presence of urea. Amounts of urease were determined using a standard curve and Jack Bean urease (Merck). Protein in the supernatant was determined in triplicate (20 μl aliquots) using the fluorescamine assay (Udenfriend et. al., 1972). 6. Consequences of brown slime for rice yield In March 2005, about 2 weeks before harvest, we revisited farms that had experienced brown slime problems during the establishment period of November, 2004. We took photographs of the same sites and talked to farmers to determine whether brown slime had reduced the potential yield of the crop.

6
Results 1. Information gathering Table 1 Summary of information gathering visits, October 2002 – March 2005. sampling time summary October 2002 Visited 10 farms, collected water and slime samples
Collected water samples from Murrumbidgee River (3 sites) Information collected from DLWC and MIA, Leeton
August 2003 Visited farms, collected 18 soil samples Collected water samples from Murrumbidgee River (same 3 sites Oct ‘02)
November 2003 Attended 8 rice establishment meetings, presented poster Contact made with 55 farmers from Western Murray Valley and Murrumbidgee regions Collect 31 soil samples, 25 brown slime samples from 13 farms
March 2004 Presented poster at rice information field day at Yanco Agric. Institute. Spoke with scientists from Yanco, CSIRO Plant Industry, and soil scientists at Charles Sturt University, Wagga Wagga. Visited 13 farms.
October 2004 Visited 11 farms, collected 27 soil samples Spoke to 4 agric. Scientists at Yanco Agric. Institute
November 2004 Visited 11 farms (same as in Oct ’04). Responded to 7 other farmers experiencing brown slime problems
March 2005 Presented talk to 130 farmers at 3 fields days at Yanco Agric. Institute. Liaised with 3 scientists at Yanco Agric. Institute. Visited 18 farmers.
August 2003, 2004, 2005
Presented findings at annual RIRDC rice workshop at Yanco Agric. Institute
2. Incidence of green slime in farm samples October 2002 The predominant species of green alga identified in green slime samples was Spirogyra. Oedogonium, Hydrodictyon and Anaebaena (blue-green alga) were also present at 2 sites. The methods of control were also noted (Table 2).

7
Table 2 Green nuisance algae identified in samples of green slime (n.d. = not determined). *Coptrol is a commercial copper-based algicide. Farmer Code
Frequency Perceived source/cause
Control methods main types found in sample
WD1 less common than brown
water channel lowers water level
Anabaena
WD2 annual, worse 1 in 3 years
n.d. lowers water level or adds *Coptrol
n.d.
LE1 a major problem 1 in 5 years
organic matter, nutrients
lowers water level
Spirogyra
CL1 annual water channel lowers water level, drains, or applies CuSO4
n.d.
CL2 annual water channel lowers water level
Spirogyra
JE1 occasional still weather (dispersed by strong wind following day)
drains bays or applies CuSO4
Spirogyra
GR4 occasional vegetative matter applies Round-up Spirogyra
GR5 n.d. n.d. n.d. Spirogyra
Oedogonium, Hydrodictyon
WL1 annual water channel, organic matter
applies CuSO4 or *Coptrol
n.d.
WL3 annual organic matter lowers water level
Anabaena
WL5 previous and current season
n.d. n.d. Spirogyra
3. Quantity of green algae present in water supply channels and several farms The quantity of green microalgae, measured as chlorophyll a, was lowest in all water supply channels and highest in a rice bay (CL1 RB 2, 92ng/ml, represented less than 1 ml of algae dispersed in 100 litres of water). Levels of chlorophyll a collected from 3 sites of the Murrumbidgee River were similar in both October 2002 and in August 2003, at less than 8 ng/ml (Fig. 1). Chlorophyll a levels in water samples collected from rice farms and adjacent supply channels in October 2002, also had less than 20 ng/ml with one exception. In this case green algae were visible in this sample collected from a rice bay at site CL1 RB 2 (Fig. 2). Chlorophyll a levels in several water supply channels collected in June 2003 were also < 20 ng/ml (Fig. 3). Thus, there were fewer algae in the Murrumbidgee River than in water supply channels.

8
Fig. 1 Concentration of chlorophyll a (in green algae) in water samples taken from the Murrumbidgee River in October 2002 (shaded bars) and August 2003 (stippled bars). Values for October 2002 represent the mean + SEM (n=3). Error bars are absent from August 2003 (n=2).
0
1
2
3
4
5
6
7
8
9
Narrandera Gundagai Jugiong
ng c
hlor
ophy
ll a/
ml
Fig. 2 Concentration of chlorophyll a in water collected from rice farms and adjacent supply channels in October 2002. Values represent the mean + SEM (n=3).
0102030405060708090
100
WL5BW
CL2MC
CL1MC1
CL1MC2
CL1RB1
CL1FS
CL1RB2
WD2RB
WD2FS
sampling site
ng c
hlor
ophy
ll a/
ml
Abbreviations of sampling sites for Fig. 2
Sampling site Farm code and source of sample WL5 BW WL5 bore water CL2 MC CL2 main channel CL1 MC1 CL1 main channel mid-Oct CL1 MC2 CL1 main channel late-Oct CL1 RB1 CL1 rice bay 1 CL1 FS CL1 farm supply channel mid-Oct CL1 RB2 CL1 rice bay 2 WD2 RB WD2 rice bay WD2 FS WD2 farm supply channel

9
Fig. 3 Concentrations of chlorophyll a in water collected from water supply channels in June 2003.
0
2
4
6
8
10
12
14
16
18
C1 C2 C3 C4 C5 R1 R2 W1sampling site
ng c
hlor
ophy
ll a/
ml
Sampling site abbreviations for Fig. 3 are explained in the table below.
Sampling site Location C1 Main channel Yanco Agricultural Institute C2 Channel opposite Yanco Agric High main gate C3 Channel near bridge past Argyle St C4 Channel near Leeton Dept. Agric. Field station C5 Channel at Merungle Hill Rd. turnoff R1 Murrumbidgee River, 10m upstream from Euroley Bridge R2 Murrumbidgee River, Euroley Bridge W1 Water wheel 796-3 near Whitton rice sheds
4. Brown slime collected from farms in October, 2002 Samples of brown slime were collected from 6 of the same farms in which green algal samples were collected in October, 2002 (Table 3). Microscopic analysis of the slime indicated that diatoms (golden algae) were present in all samples but in four out of six samples, there was evidence of bacterial slime (Table 4). Table 3 Samples of brown slime collected in October, 2002. *Coptrol is a commercial copper-based algicide Farmer Code
Frequency and appearance
Perceived source/cause
Control methods main type of algae found in sample
WD1 annual 'strangles' rice
rotting organic matter
lower water level, circulate water
diatoms (and bacteria)
LE1 once in 5 years increased organic matter and nutrients and climate
lowers water level diatoms
CL1 annual hot and calm lowers water level diatoms (and bacteria)
CL2 annual more prevalent in some bays
lowers water level diatoms (and

10
Farmer Code
Frequency and appearance
Perceived source/cause
Control methods main type of algae found in sample bacteria)
GR4 annual high level of vegetable matter
grazes sheep to reduce vegetable matter and lowers water level (*Coptrol no effect)
diatoms
WL3 brown slime that 'pulls down rice leaves'
dead/dirty green algae plus silt
lowers water level to mud stage
diatoms (and bacteria)
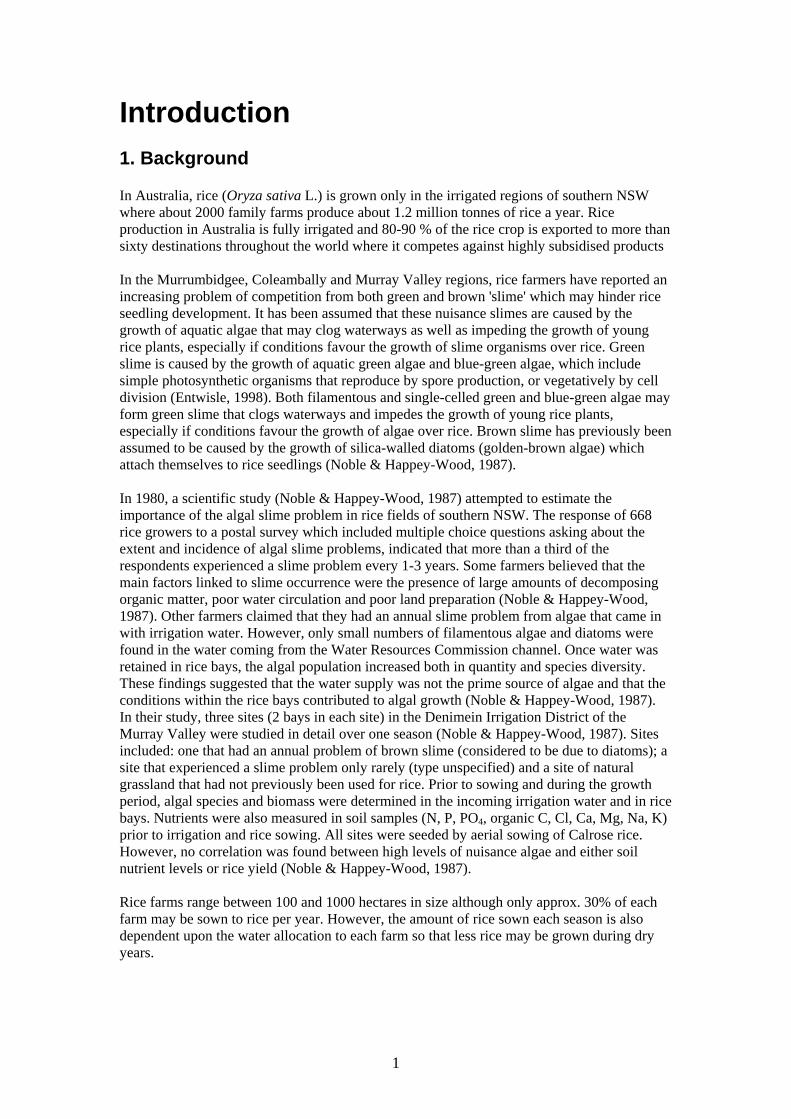
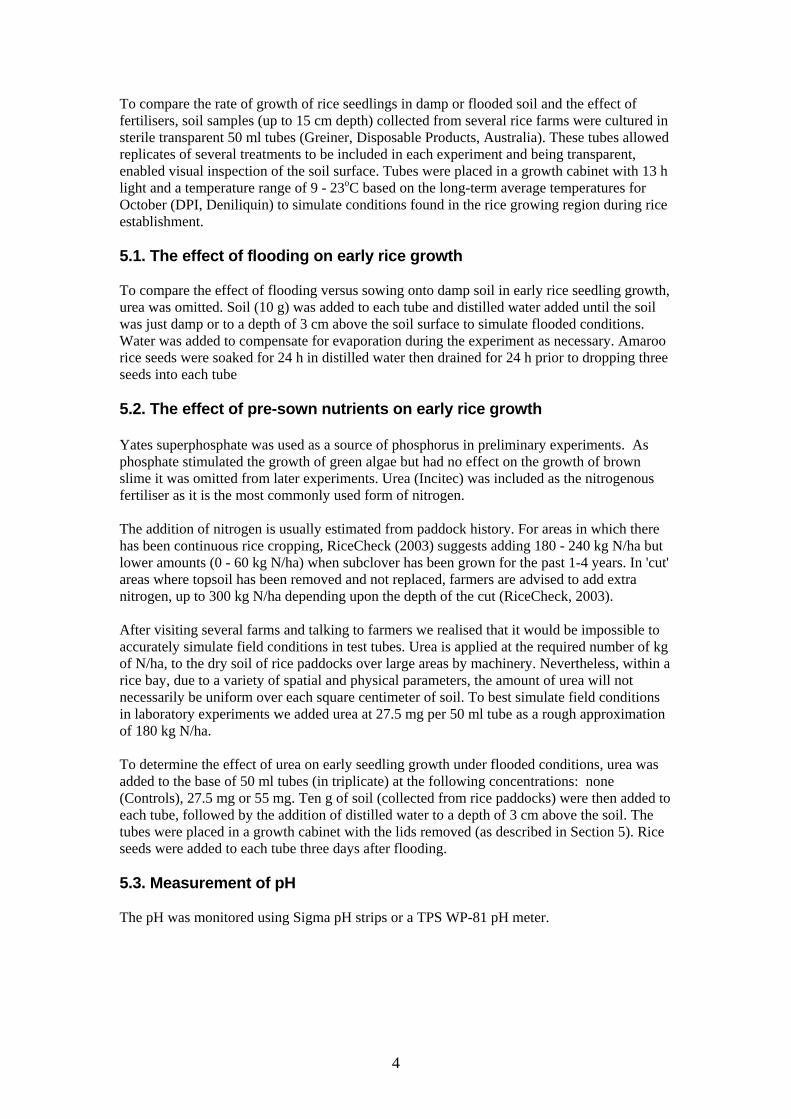
5. Brown slime appears in several colours and forms There is a range of colours found in brown slime, which consists of a mixture of different organisms that adhere to the sticky slime produced by iron-oxidizing bacteria. It is the bacterial slime that binds other components such as diatoms, organic matter and iron oxides, giving it a firm structure. Figure 4A shows a floating mat of brown slime that includes green algae that have become attached to the slime produced by iron-oxidizing bacteria. In Fig. 4B, the layer of brown slime has remained at the soil surface without hindering the growth of rice seedlings. In Fig. 4C, while some brown slime has lifted off the soil surface and is now floating, it is in small patches and has not hindered rice seedling growth. Figure 4D shows a thick (~1 cm deep) layer of brown slime which is preventing the penetration of rice seedlings. Figure 4E shows organic matter that has become attached to brown slime forming a mat which was blown to the corner of a rice bay. In this instance some rice seedlings have become trapped in the mat. In such cases, if the water is removed while rice seedlings are still at the 2-3 leaf stage, they may be smothered and be unable to continue growing.
11
Fig. 4A Showing green algae growing beneath a mat of brown slime (area shown ~ 25 cm across)
Fig. 4B A thin layer of brown slime that has remained at the soil surface (area shown approx. 30 cm across)

12
Fig. 4C An example of brown slime that has lifted off the soil surface but is not a problem but the mat is sufficiently fragmented to enable rice plants to penetrate. Area shown approx. 30 cm across.
Fig. 4D Showing rice seedlings having difficulty growing through a mat of brown slime. Area shown approx. 50 cm across.

13
Fig. 4E An example of organic matter in brown slime that has accumulated at the edge of a rice bay. Area shown approx. 5 m across.
6. Microscopic organisms found in brown slime samples Samples of brown slime were examined microscopically and the types of organisms noted. Bacteria were present in all samples, but were not counted. Oxidized iron deposits were present in all but one water sample. Diatoms were present in all soil samples and in most of the water samples (Table 4) within a range of 0 to 49. Table 4 Range of the numbers of microscopic organisms, other than bacteria, found in samples of brown slime (n=30) collected from the soil or water surface during rice establishment in November 2003 and November 2004. Field of view = 1.8 mm. Oxidized iron deposits measured between 20 and 150 µm. Bacteria were also present in large numbers in all samples. Locality Number
of samples
Number of oxidized iron deposits
Diatoms (golden algae)
Protists and invertebrates
Green microalgae
Conargo 2 3 – 3 11 - 11 22 - 60 0 - 2 Deniliquin 2 1 – 3 1 - 8 5 - 50 1 - 1 Gogeldrie 3 2 – 14 21 - 49 1 - 65 0 - 1 Moulamein 7 0 – 33 0 - 22 0 - 80 0 - 3 Wakool 6 1 – 20 0 - 45 0 - 50 0 - 10 Willbriggie 10 2 – 35 0 - 49 0 - 68 0 - 4

14
Fig. 5 Percentage of samples of brown slime from Table 4 in which iron deposits and microscopic organisms were found (n = 30), collected from the soil (shaded bars, n = 14) and water surface (open bars, n = 16), during November 2003 and November 2004.
0
20
40
60
80
100
diatoms protists greenmicroalgae
% p
rese
nt in
sam
ples
Fe3+
Fig. 6 This photograph shows a diatom caught up in brown slime produced by iron oxidizing bacteria collected from Site WD1 (photograph taken by D. J. Patterson). Bacteria are barely visible at this magnification. Examples of a diatom, bacterial slime and oxidized iron are indicated by arrows.
______________ Scale bar = 50 μm
15
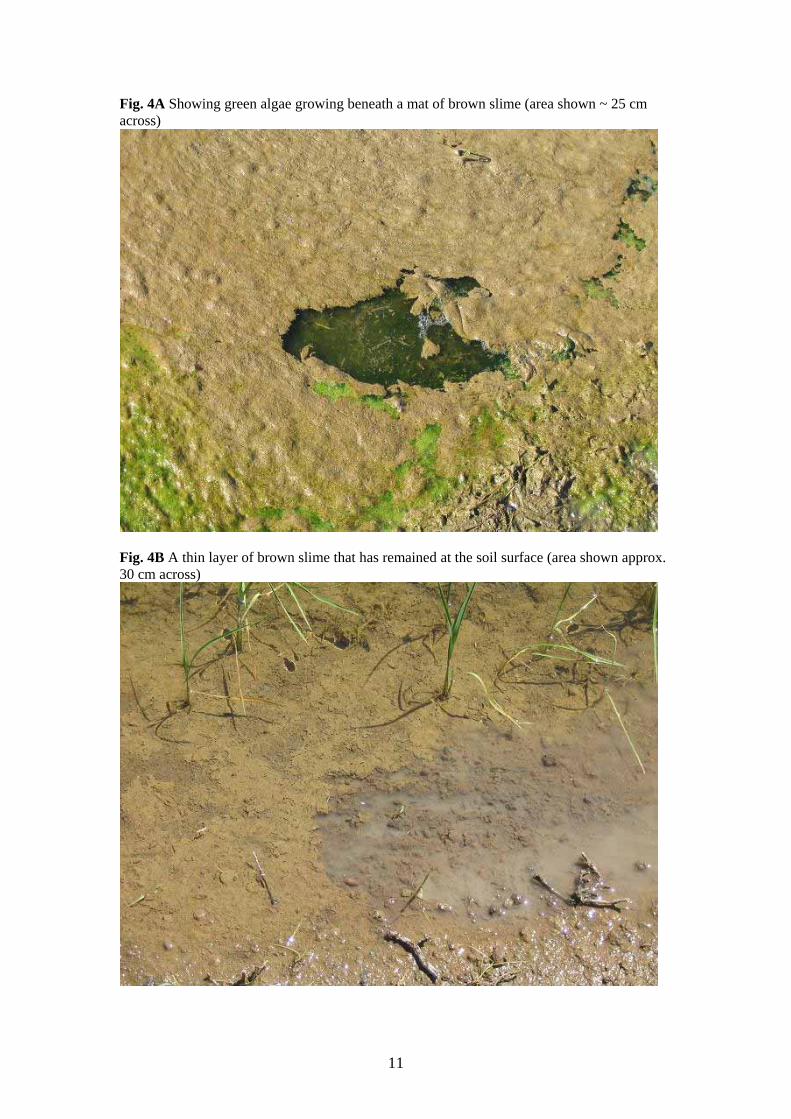
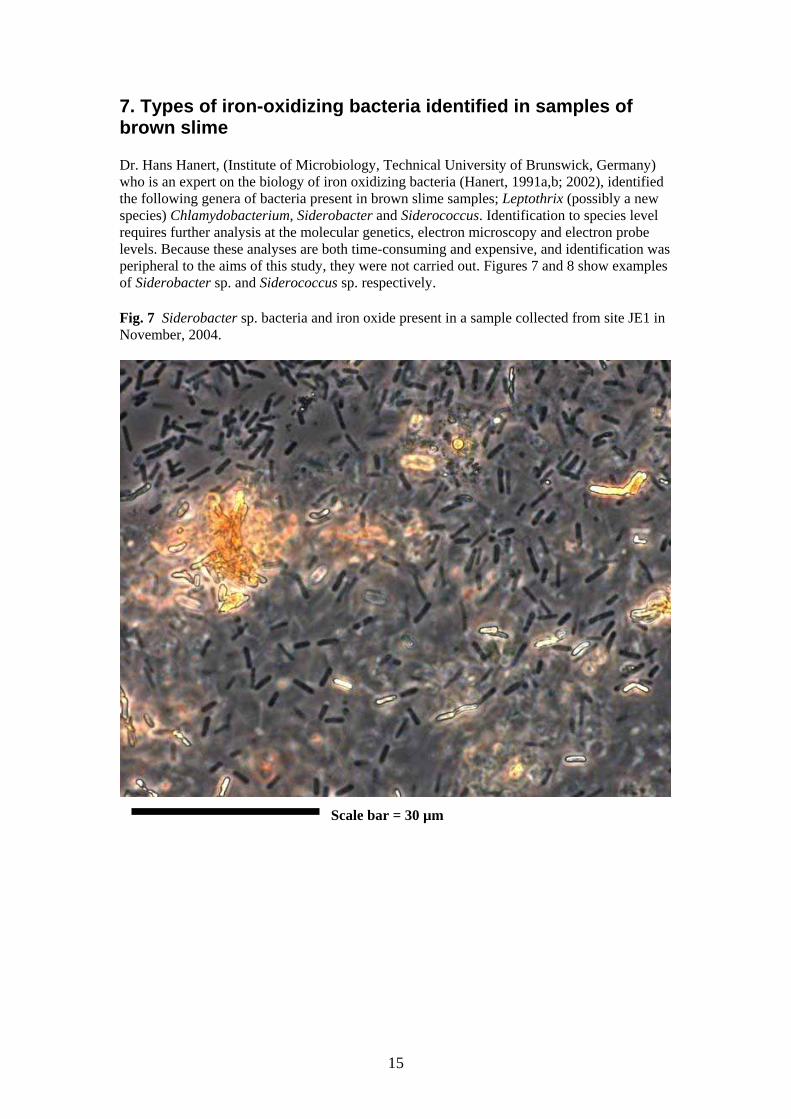
7. Types of iron-oxidizing bacteria identified in samples of brown slime Dr. Hans Hanert, (Institute of Microbiology, Technical University of Brunswick, Germany) who is an expert on the biology of iron oxidizing bacteria (Hanert, 1991a,b; 2002), identified the following genera of bacteria present in brown slime samples; Leptothrix (possibly a new species) Chlamydobacterium, Siderobacter and Siderococcus. Identification to species level requires further analysis at the molecular genetics, electron microscopy and electron probe levels. Because these analyses are both time-consuming and expensive, and identification was peripheral to the aims of this study, they were not carried out. Figures 7 and 8 show examples of Siderobacter sp. and Siderococcus sp. respectively. Fig. 7 Siderobacter sp. bacteria and iron oxide present in a sample collected from site JE1 in November, 2004.
Scale bar = 30 µm
16
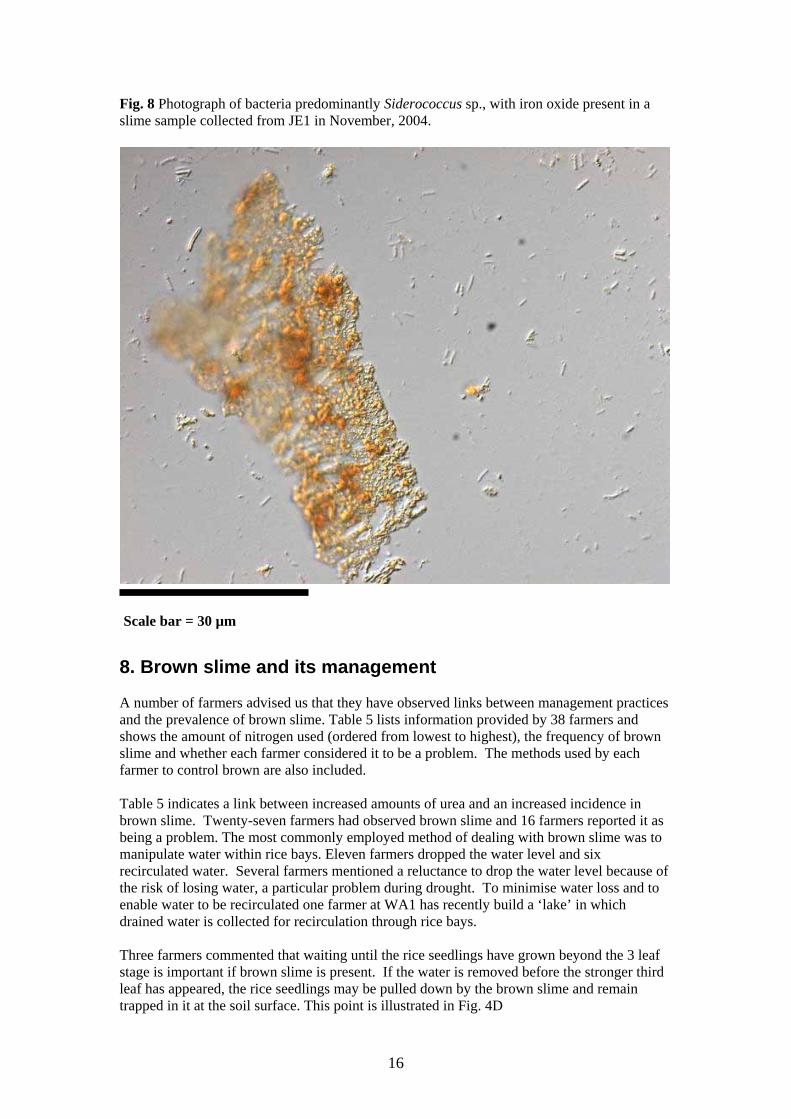
Fig. 8 Photograph of bacteria predominantly Siderococcus sp., with iron oxide present in a slime sample collected from JE1 in November, 2004.
Scale bar = 30 µm
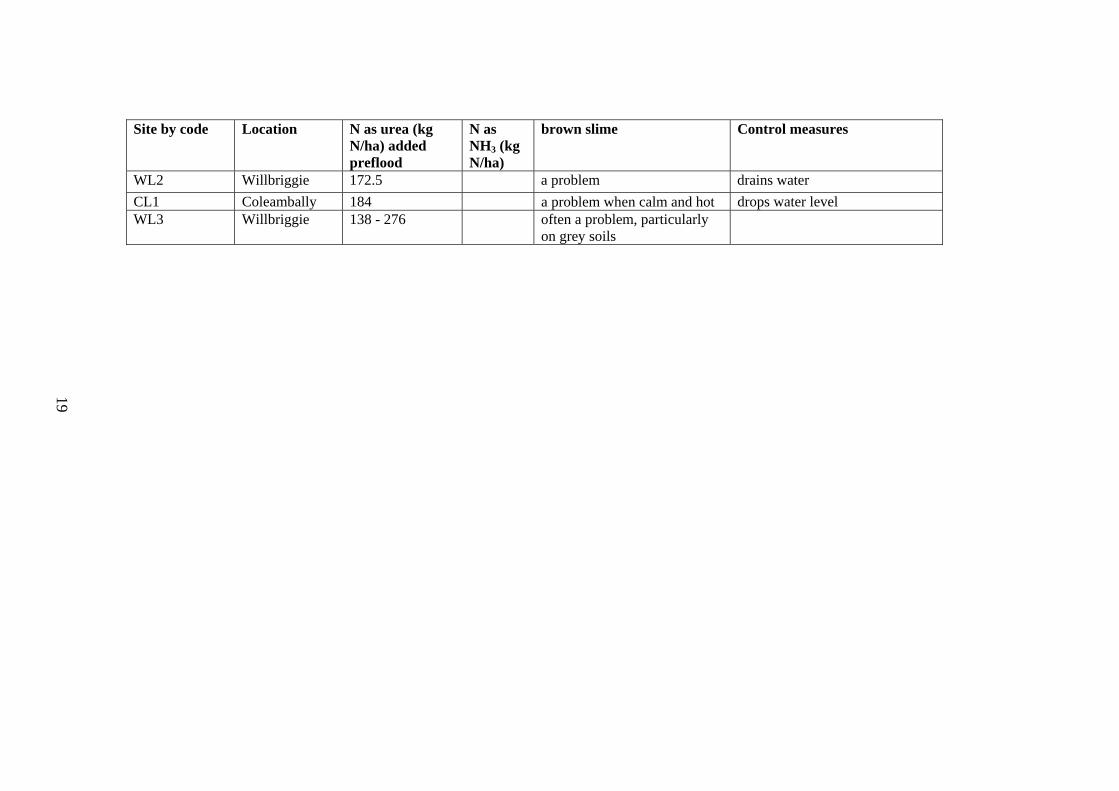
8. Brown slime and its management A number of farmers advised us that they have observed links between management practices and the prevalence of brown slime. Table 5 lists information provided by 38 farmers and shows the amount of nitrogen used (ordered from lowest to highest), the frequency of brown slime and whether each farmer considered it to be a problem. The methods used by each farmer to control brown are also included. Table 5 indicates a link between increased amounts of urea and an increased incidence in brown slime. Twenty-seven farmers had observed brown slime and 16 farmers reported it as being a problem. The most commonly employed method of dealing with brown slime was to manipulate water within rice bays. Eleven farmers dropped the water level and six recirculated water. Several farmers mentioned a reluctance to drop the water level because of the risk of losing water, a particular problem during drought. To minimise water loss and to enable water to be recirculated one farmer at WA1 has recently build a ‘lake’ in which drained water is collected for recirculation through rice bays. Three farmers commented that waiting until the rice seedlings have grown beyond the 3 leaf stage is important if brown slime is present. If the water is removed before the stronger third leaf has appeared, the rice seedlings may be pulled down by the brown slime and remain trapped in it at the soil surface. This point is illustrated in Fig. 4D

17
Table 5 Nitrogen source and amount and slime problems. Site by code Location N as urea (kg
N/ha) added preflood
N as NH3 (kg N/ha)
brown slime Control measures
GR3 Griffith 14 - 28 present in small area WL4 Willbriggie 30 (fill area) to
172.5 (cut area) slime in cut areas
JE2 Jerilderie 33 not a problem when it appeared, he dropped water after 3 leaf stage
MU2 Murrami 35 - 57.5 At >57.5 kg N/ha as urea sees brown slime
avoids adding more than 57.5 kg N/ha prior to sowing. If slime appears, drops water level but not until rice is at 3 leaf stage
GG7 Gogeldrie 37
85 present but not a problem drops water level
WA1 Wakool 40 - 83 a problem in some bays recirculates water DE5 Deniliquin 46 present (more in black than in
red soils) recirculates water
MU3 Murrami 56-112 present, not a problem GR2 Griffith 57.5 not a problem unless >57.5 kg
N/ha as urea are added avoids adding >57.5 kg N/ha as urea
FN1 Finley 57.5 sometimes a problem drops water until almost dry GG3 Gogeldrie 57.5 not a problem DE2 Deniliquin 64.4 not determined FN2 Finley 72 not a problem GG6 Gogeldrie 72 sometimes a problem zig-zags water LE1 Leeton 72.2 not a problem ML2 Moulamein 84 - 113 not a problem can always rescue if it occurs

18
Site by code Location N as urea (kg N/ha) added preflood
N as NH3 (kg N/ha)
brown slime Control measures
ML1 Moulamein 86 present in bottom bays flushes water through MD1 Morundah 86 - 115 a problem in some areas MD2 Morundah 92 not a problem TC1 Tocumwal 92 - 120
always present in some bays drops water level
GG5 Gogeldrie 96 115 a problem even with NH3 DE1 Deniliquin 99 present flushes with fresh water GG1 Gogeldrie 100 present, not a problem GG2 Gogeldrie 100 not a problem DE3 Deniliquin 101 not determined CB1 Cobram 104 not a problem GR1 Griffith 115
120 occasionally if >57.5 kg N/ha
as urea added but not a problem when sod sown
DE4 Deniliquin 115 present but not a problem recirculates water MU1 Murrami 115 a problem for 5 days drops water level but not until
rice is at 3 leaf stage JE1 Jerilderie 115 sometimes a problem drops water level WD1 Widgelli 115 sometimes a problem if water is stagnant for more than
1 week, recirculates water HA1 Hanwood 129 present sometimes drops water level until soil is just
damp GG4 Gogeldrie 150 not a problem CL2 Coleambally 152
always a problem in some bays
drops water level
WL1 Willbriggie 161 a problem Sprayed 12 kg/ha of CuSO4 at 2 leaf stage
19
Site by code Location N as urea (kg N/ha) added preflood
N as NH3 (kg N/ha)
brown slime Control measures
WL2 Willbriggie 172.5 a problem drains water CL1 Coleambally 184 a problem when calm and hot drops water level WL3 Willbriggie 138 - 276 often a problem, particularly
on grey soils

20
9. Effect of sowing rice into damp soil versus flooded soil Initial growth of rice sown onto damp soil without any addition of urea was faster than rice grown into flooded soil, up until 10 days (Fig 9A). However, by 18 days, growth was similar under both conditions (Fig 9B). Thus, at the crucial early stages of rice establishment up to 18 days, growth of rice grown under flooded conditions is relatively slow compared with rice that is dry sown. Fig. 9A Growth of rice seeds in flooded (3 left-hand side tubes) versus damp soil (3 right-hand side tubes) 10 days after sowing
Fig. 9B Growth of rice seeds in flooded (3 left-hand side tubes) versus damp soil (3 right-hand side tubes) 18 days after sowing

21
9. Effects of fertiliser on the formation of brown slime In preliminary experiments we compared the effect of urea and phosphorus on brown slime formation. Urea (810 mg) or phosphate (54 mg), or urea plus phosphate were added to the base of 50 ml tubes and 10 g of soil were placed on top, then distilled water was added. Visual symptoms of bacterial iron oxidation under laboratory conditions in this experiment used an unrealistically high concentration of urea to ensure that the system was saturated. After 7 days, a biofilm, which is the early stage of slime (O'Toole et al., 2000), had appeared on the water surface of tubes containing either urea or urea plus phosphate but not in the tubes containing phosphate alone. Table 6. Iron oxidation occurred in water above soil incubated with urea (810 mg) or urea plus phosphate (54 mg) under flooded conditions in the laboratory for 7 days. All distilled water controls and phosphate only samples lacked the colour of iron oxidation. Colour ranged from 0 (clear) to 3 (deepest shade of orange). The biofilm covered about 10% of the water surface. Farm Soil
sample Distilled water controls
Phosphate
Urea or urea plus phosphate
Biofilm which was present in urea only and in urea plus phosphate tubes
CL2 1 0 0 2.5 yes FN2 1 0 0 <0.5 absent FN2 2 0 0 1 yes GR2 1 0 0 2 yes LE1 2 0 0 2.5 yes MU2 1 0 0 2 yes WL3 2 0 0 2 yes
22
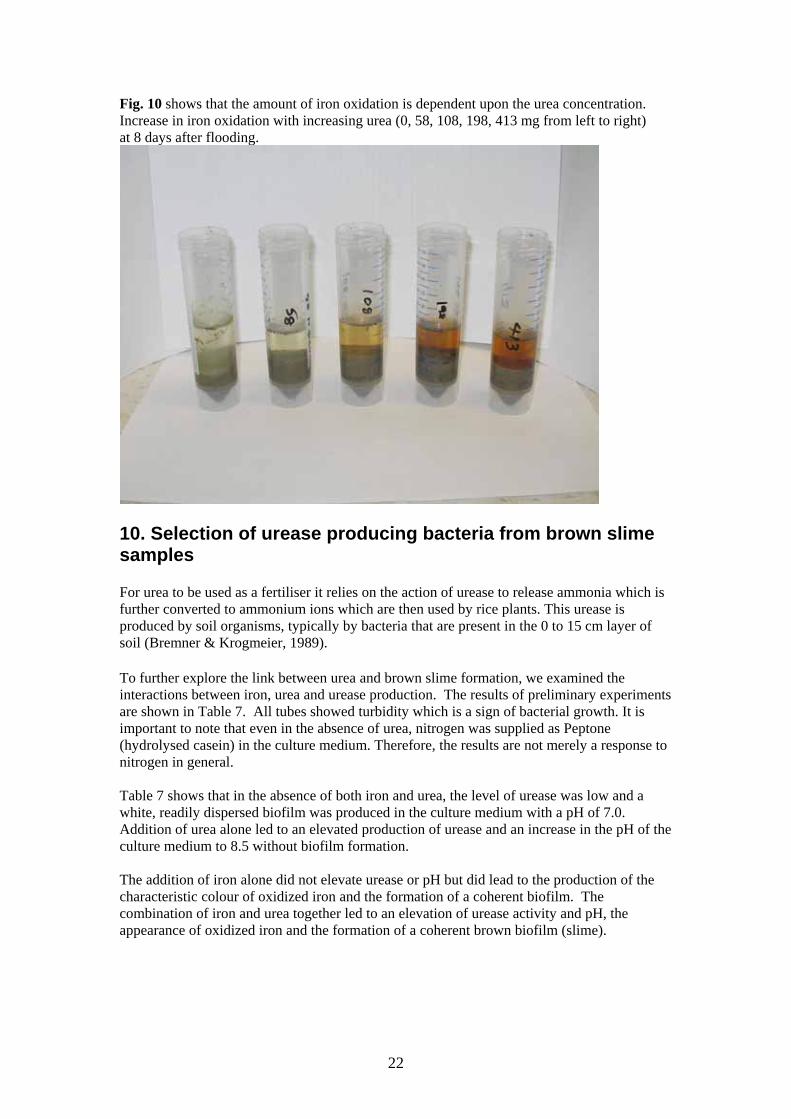
Fig. 10 shows that the amount of iron oxidation is dependent upon the urea concentration. Increase in iron oxidation with increasing urea (0, 58, 108, 198, 413 mg from left to right) at 8 days after flooding.
10. Selection of urease producing bacteria from brown slime samples For urea to be used as a fertiliser it relies on the action of urease to release ammonia which is further converted to ammonium ions which are then used by rice plants. This urease is produced by soil organisms, typically by bacteria that are present in the 0 to 15 cm layer of soil (Bremner & Krogmeier, 1989). To further explore the link between urea and brown slime formation, we examined the interactions between iron, urea and urease production. The results of preliminary experiments are shown in Table 7. All tubes showed turbidity which is a sign of bacterial growth. It is important to note that even in the absence of urea, nitrogen was supplied as Peptone (hydrolysed casein) in the culture medium. Therefore, the results are not merely a response to nitrogen in general. Table 7 shows that in the absence of both iron and urea, the level of urease was low and a white, readily dispersed biofilm was produced in the culture medium with a pH of 7.0. Addition of urea alone led to an elevated production of urease and an increase in the pH of the culture medium to 8.5 without biofilm formation. The addition of iron alone did not elevate urease or pH but did lead to the production of the characteristic colour of oxidized iron and the formation of a coherent biofilm. The combination of iron and urea together led to an elevation of urease activity and pH, the appearance of oxidized iron and the formation of a coherent brown biofilm (slime).

23
Table 7 Preliminary data showing that the addition of urea selects for soil bacteria that produce urease. Details are described in Methods. Dominant type of bacteria
Appearance (pH of culture
medium)
Selection medium Urease units/mg protein
cocci + rods white, easily dispersed
biofilm (7.0)
- Fe - urea 5.61
rods + cocci white (8.5 - 9.0)
- Fe + urea 19.15
rods orange (6.5)
+ Fe - urea 6.87
rods with oxidized Fe
coherent orange biofilm
(8.5 - 9.0)
+Fe + urea 16.41
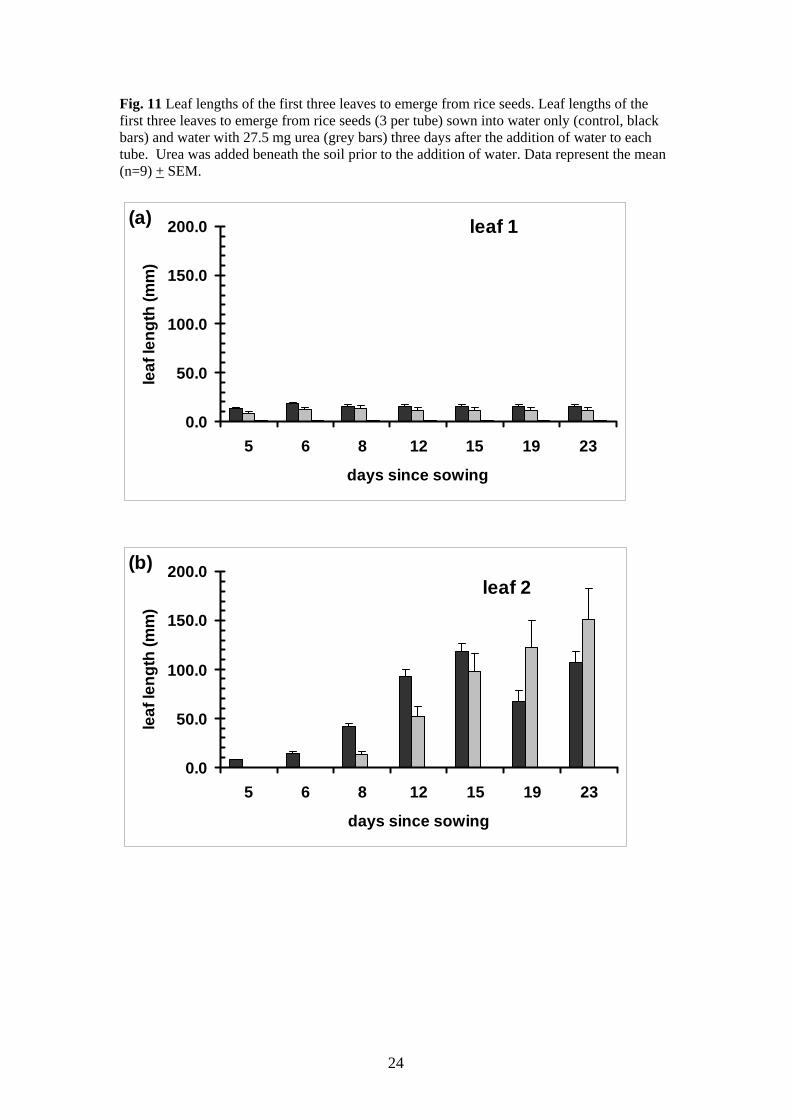
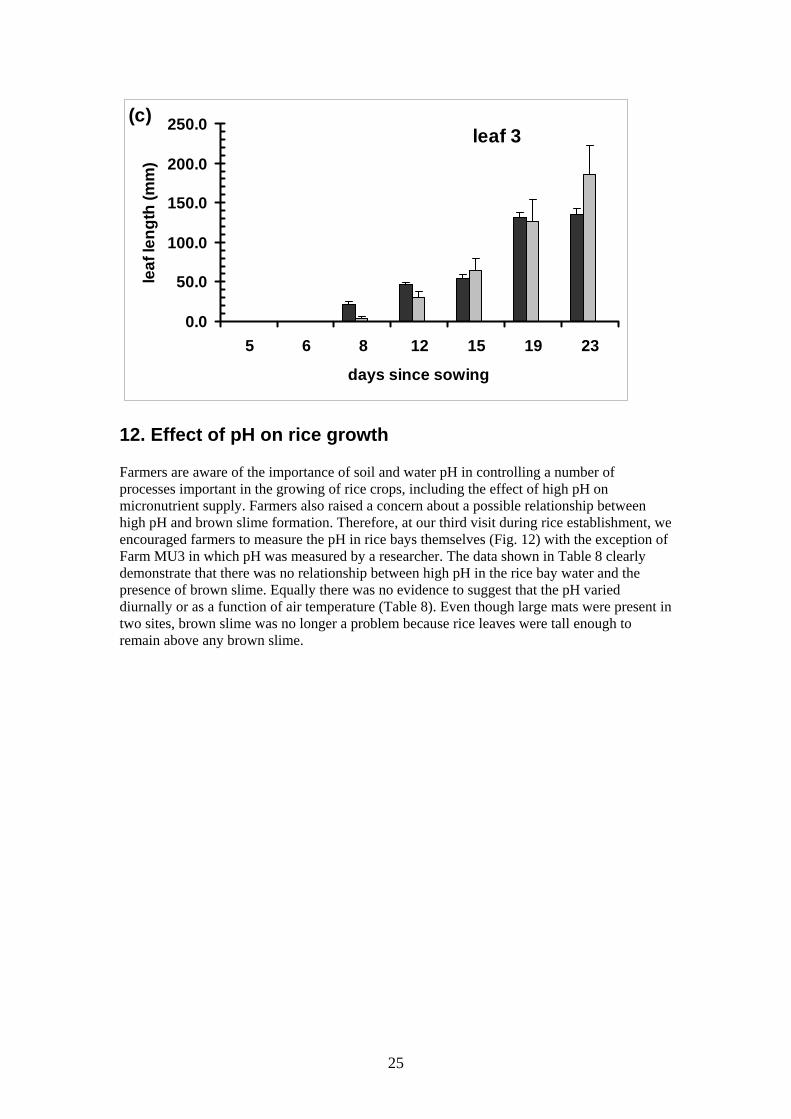
11. Effects of fertilisers on rice seedling growth The growth of the first leaf (Fig. 11a) was slightly inhibited by the addition or urea (27.5 mg/10 g of soil) between 5 and 23 days after sowing (tubes were flooded 3 days before sowing). The second and third leaves did not appear in tubes containing urea until day 8. Growth was lower in the presence of urea until day 15 after sowing when plants in urea (27.5 mg) treated soil exceeded growth of water controls (Fig 6b, c). That is, the presence of urea depressed the early growth of rice seedlings. In the tubes containing 55 mg of urea, by 11 days, only 4 out of 9 seeds had produced one leaf (1-2 mm) and no further growth was observed.
24
Fig. 11 Leaf lengths of the first three leaves to emerge from rice seeds. Leaf lengths of the first three leaves to emerge from rice seeds (3 per tube) sown into water only (control, black bars) and water with 27.5 mg urea (grey bars) three days after the addition of water to each tube. Urea was added beneath the soil prior to the addition of water. Data represent the mean (n=9) + SEM.
0.0
50.0
100.0
150.0
200.0
5 6 8 12 15 19 23
days since sowing
leaf
leng
th (m
m)
leaf 1(a)
0.0
50.0
100.0
150.0
200.0
5 6 8 12 15 19 23
days since sowing
leaf
leng
th (m
m)
leaf 2(b)
25
0.0
50.0
100.0
150.0
200.0
250.0
5 6 8 12 15 19 23
days since sowing
leaf
leng
th (m
m)
leaf 3(c)
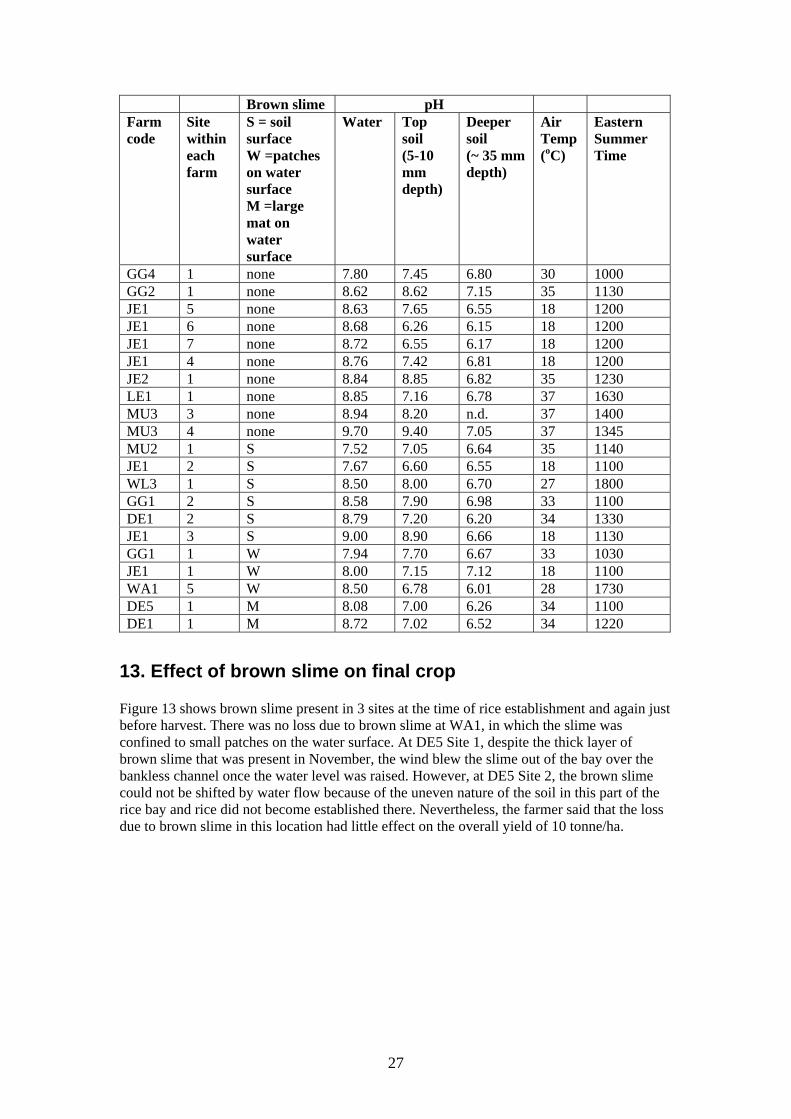
12. Effect of pH on rice growth Farmers are aware of the importance of soil and water pH in controlling a number of processes important in the growing of rice crops, including the effect of high pH on micronutrient supply. Farmers also raised a concern about a possible relationship between high pH and brown slime formation. Therefore, at our third visit during rice establishment, we encouraged farmers to measure the pH in rice bays themselves (Fig. 12) with the exception of Farm MU3 in which pH was measured by a researcher. The data shown in Table 8 clearly demonstrate that there was no relationship between high pH in the rice bay water and the presence of brown slime. Equally there was no evidence to suggest that the pH varied diurnally or as a function of air temperature (Table 8). Even though large mats were present in two sites, brown slime was no longer a problem because rice leaves were tall enough to remain above any brown slime.

26
Fig. 12 Showing a rice farmer measuring the pH of water in a rice bay, in November 2004. The yellow coloured water is due to stirring up the brown slime present on the submerged soil surface.
Table 8 Range of pH in paddy water and soil samples measured between 23rd and 29th November, 2004. Rice seedling size (15-38 cm). Brown slime pH Farm code
Site within each farm
S = soil surface W =patches on water surface M =large mat on water surface
Water Top soil (5-10 mm depth)
Deeper soil (~ 35 mm depth)
Air Temp (oC)
Eastern Summer Time
MU3 1 none 6.45 6.18 5.96 37 1500 WA1 1 none 6.90 6.43 6.06 28 1700 WA1 4 none 6.98 6.70 6.18 28 1700 WA1 3 none 7.02 6.91 6.03 28 1700 WA1 2 none 7.05 6.82 6.31 28 1700 GG3 2 none 7.15 6.98 6.80 34 1200 GG3 1 none 7.40 6.78 6.48 34 1200 LE1 2 none 7.50 7.84 6.70 37 1630 DE1 3 none 7.62 6.48 5.98 34 1400 DE1 4 none 7.67 7.35 6.22 34 1430 MU3 2 none 7.80 6.66 6.16 37 1200
27
Brown slime pH Farm code
Site within each farm
S = soil surface W =patches on water surface M =large mat on water surface
Water Top soil (5-10 mm depth)
Deeper soil (~ 35 mm depth)
Air Temp (oC)
Eastern Summer Time
GG4 1 none 7.80 7.45 6.80 30 1000 GG2 1 none 8.62 8.62 7.15 35 1130 JE1 5 none 8.63 7.65 6.55 18 1200 JE1 6 none 8.68 6.26 6.15 18 1200 JE1 7 none 8.72 6.55 6.17 18 1200 JE1 4 none 8.76 7.42 6.81 18 1200 JE2 1 none 8.84 8.85 6.82 35 1230 LE1 1 none 8.85 7.16 6.78 37 1630 MU3 3 none 8.94 8.20 n.d. 37 1400 MU3 4 none 9.70 9.40 7.05 37 1345 MU2 1 S 7.52 7.05 6.64 35 1140 JE1 2 S 7.67 6.60 6.55 18 1100 WL3 1 S 8.50 8.00 6.70 27 1800 GG1 2 S 8.58 7.90 6.98 33 1100 DE1 2 S 8.79 7.20 6.20 34 1330 JE1 3 S 9.00 8.90 6.66 18 1130 GG1 1 W 7.94 7.70 6.67 33 1030 JE1 1 W 8.00 7.15 7.12 18 1100 WA1 5 W 8.50 6.78 6.01 28 1730 DE5 1 M 8.08 7.00 6.26 34 1100 DE1 1 M 8.72 7.02 6.52 34 1220
13. Effect of brown slime on final crop Figure 13 shows brown slime present in 3 sites at the time of rice establishment and again just before harvest. There was no loss due to brown slime at WA1, in which the slime was confined to small patches on the water surface. At DE5 Site 1, despite the thick layer of brown slime that was present in November, the wind blew the slime out of the bay over the bankless channel once the water level was raised. However, at DE5 Site 2, the brown slime could not be shifted by water flow because of the uneven nature of the soil in this part of the rice bay and rice did not become established there. Nevertheless, the farmer said that the loss due to brown slime in this location had little effect on the overall yield of 10 tonne/ha.

28
Fig. 13 showing brown slime during establishment (left-hand side, A, C & E) compared with the same crop just before harvest (right-hand side, B, D & F). A Farm WA1 B
ft C Site 1 at DE5 D
E Site 2 at DE5 F
Each of these sites was photographed in November 2004 and again shortly before harvest in March 2005. The area lacking rice plants in Site 2 at DE5 was attributed to being unable to shift brown slime during establishment because of the uneven nature of the soil in this part of the rice bay.

29
Discussion
After visiting ten rice farmers during our first field trip in October, 2002, it quickly became apparent that nuisance green slime, caused by green algae and blue green algae, was an intermittent but manageable problem. The predominant algae identified in samples of green slime collected from rice bays were: Spirogyra, Anabaena, Oedogonium and Hydrodictyon (Table 1). Farmers usually manage green slime by flushing water through the rice bays and in severe cases, by using copper compounds (Table 1). However, it should be stressed that the use of Cu2+ as an algicide should be avoided as it also causes oxidative damage to many other organisms (Halliwell & Gutteridge, 1999, Grant et al., 2003). Several farmers believed that the source of green slime was the supply water, due to nutrients entering the Murrumbidgee River before it reached the Riverina district. At their request, we sampled water from the Murrumbidgee River and several supply channels. We found that the levels of green and blue-green algae were very low in water supply channels (Fig. 3) which is in agreement with the previous study by Noble and Happey-Wood (1987). Their study found that both algal abundance and species richness increased in flooded rice bays due to favourable conditions prevailing within the rice bays. We then investigated the problem of brown slime to identify the organisms responsible, to determine why and when it is a nuisance and which conditions increase its prevalence. We were then in a position to suggest possible methods to manage brown slime. The nature of brown slime in rice bays In the brown slime samples that were collected in the first field trip, we observed diatoms (golden brown algae) which were considered to be the cause of brown slime by Noble & Happey-Wood (1987), but also we consistently found bacterial slime and some orange lumps that we did not recognise. For assistance with diatom identification, we approached D.J. Patterson (Patterson & Burford, 2001) who identified the orange lumps as being oxidized iron produced by iron-oxidizing bacteria. In the light of this observation, we then realised that we would need to modify our original research plan. Our approach to investigating brown slime was determined largely by current rice growing practices in Australia. For example, because each rice farm may cover several hundred hectares, comprehensive soil analysis of even ten sites would be time consuming, impractical and well beyond the allotted budget for this project. Similarly, field trials would be possible only for a limited number of sites and therefore would be impractical. Also, as a result of laser guided landforming (used to improve water efficiency), the soil profile in rice bays is often heterogeneous within quite small areas making it impossible to compare experimental plots within the same bay. Therefore, we concentrated our efforts on talking to farmers to learn how they managed brown slime and to determine any links between cultural and management practices and brown slime occurrence. We ascertained that brown slime contains a variety of organisms (Table 4). The slime is produced by bacteria and the brown colour is due to oxidized iron produced by iron-oxidizing bacteria. Virtually all bacteria produce polysaccharides on their membrane surfaces. These polysaccharides (complex carbohydrates) may form a sticky biofilm which can lead to the formation of slime. Because this slime is sticky many other organisms including invertebrates and green algae will adhere to it. Organic matter left over from previous crops may also become trapped in it leading to the formation of large mats. Leptothrix and Gallionella bacteria are known to oxidize iron and it has been suggested that there is a wider range of organisms not yet fully characterised, that are able to oxidize iron at neutral pH (Emerson & Moyer 1997).
30
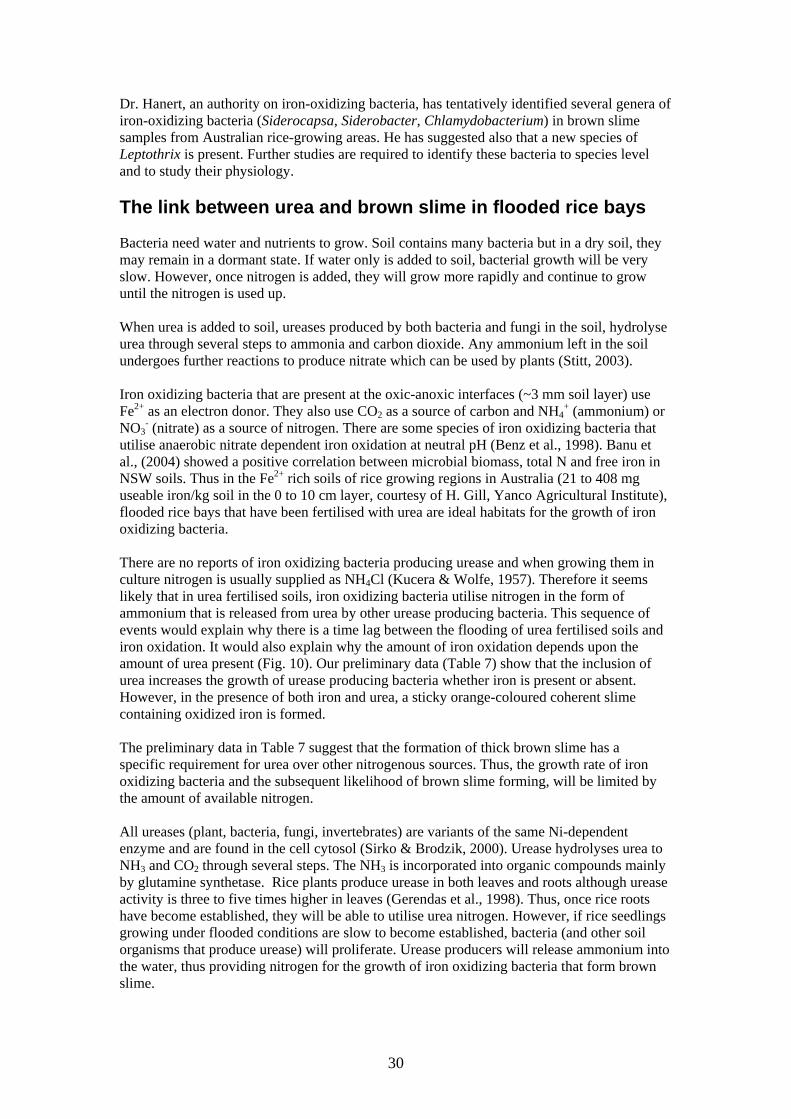
Dr. Hanert, an authority on iron-oxidizing bacteria, has tentatively identified several genera of iron-oxidizing bacteria (Siderocapsa, Siderobacter, Chlamydobacterium) in brown slime samples from Australian rice-growing areas. He has suggested also that a new species of Leptothrix is present. Further studies are required to identify these bacteria to species level and to study their physiology. The link between urea and brown slime in flooded rice bays Bacteria need water and nutrients to grow. Soil contains many bacteria but in a dry soil, they may remain in a dormant state. If water only is added to soil, bacterial growth will be very slow. However, once nitrogen is added, they will grow more rapidly and continue to grow until the nitrogen is used up. When urea is added to soil, ureases produced by both bacteria and fungi in the soil, hydrolyse urea through several steps to ammonia and carbon dioxide. Any ammonium left in the soil undergoes further reactions to produce nitrate which can be used by plants (Stitt, 2003). Iron oxidizing bacteria that are present at the oxic-anoxic interfaces (~3 mm soil layer) use Fe2+ as an electron donor. They also use CO2 as a source of carbon and NH4
+ (ammonium) or NO3
- (nitrate) as a source of nitrogen. There are some species of iron oxidizing bacteria that utilise anaerobic nitrate dependent iron oxidation at neutral pH (Benz et al., 1998). Banu et al., (2004) showed a positive correlation between microbial biomass, total N and free iron in NSW soils. Thus in the Fe2+ rich soils of rice growing regions in Australia (21 to 408 mg useable iron/kg soil in the 0 to 10 cm layer, courtesy of H. Gill, Yanco Agricultural Institute), flooded rice bays that have been fertilised with urea are ideal habitats for the growth of iron oxidizing bacteria. There are no reports of iron oxidizing bacteria producing urease and when growing them in culture nitrogen is usually supplied as NH4Cl (Kucera & Wolfe, 1957). Therefore it seems likely that in urea fertilised soils, iron oxidizing bacteria utilise nitrogen in the form of ammonium that is released from urea by other urease producing bacteria. This sequence of events would explain why there is a time lag between the flooding of urea fertilised soils and iron oxidation. It would also explain why the amount of iron oxidation depends upon the amount of urea present (Fig. 10). Our preliminary data (Table 7) show that the inclusion of urea increases the growth of urease producing bacteria whether iron is present or absent. However, in the presence of both iron and urea, a sticky orange-coloured coherent slime containing oxidized iron is formed. The preliminary data in Table 7 suggest that the formation of thick brown slime has a specific requirement for urea over other nitrogenous sources. Thus, the growth rate of iron oxidizing bacteria and the subsequent likelihood of brown slime forming, will be limited by the amount of available nitrogen. All ureases (plant, bacteria, fungi, invertebrates) are variants of the same Ni-dependent enzyme and are found in the cell cytosol (Sirko & Brodzik, 2000). Urease hydrolyses urea to NH3 and CO2 through several steps. The NH3 is incorporated into organic compounds mainly by glutamine synthetase. Rice plants produce urease in both leaves and roots although urease activity is three to five times higher in leaves (Gerendas et al., 1998). Thus, once rice roots have become established, they will be able to utilise urea nitrogen. However, if rice seedlings growing under flooded conditions are slow to become established, bacteria (and other soil organisms that produce urease) will proliferate. Urease producers will release ammonium into the water, thus providing nitrogen for the growth of iron oxidizing bacteria that form brown slime.
31
Several farmers have noted a link between brown slime and higher amounts of added urea (Table 5). In our experiments, we found that after the addition of water to soil containing urea, the water above the soil surface turned orange which indicated oxidation of iron; the depth of colour depended upon the concentration of urea (Fig 10). The colour change was followed by the appearance of a biofilm in tubes that contained urea or urea plus phosphate, but not those that contained phosphate alone (Table 5). Thus, oxidation of iron was dependent upon the addition of urea. We rarely observed a complex mat of brown slime in laboratory experiments but we deliberately omitted organic matter (which was present in field samples of brown slime), from experimental tubes. Some farmers believe that adding a large amount of urea is necessary to achieve a high yield. However, a study by Kealey et al. (1994) found that applying urea at 120 kg N/ha before aerial sowing of rice did not increase the yield significantly (P= 0.05) above that found with 60 kg N/ha. We found that up to 15 days after sowing, rice leaf growth was faster in water controls than in urea (Fig. 11). Equally, when urea of twice the concentration was used, growth of rice seedlings was almost completely inhibited, suggesting that high levels of urea could be harmful to early rice growth. Toxic effects of urea on seed germination and seedling growth have been observed in several crops and had previously been attributed to impurities in the urea itself or to a high pH resulting from urea hydrolysis (Bremner & Krogmeier, 1989). However, a pH of 10.8 had no effect on germination of wheat, barley, corn and rye seeds, and it was found that the inhibitory effect was due to ammonia, produced by urease present in the 0 to 15 cm soil layer (Bremner & Krogmeier, 1989). Addition of as little as 1 mg urea/g of soil inhibited seed germination by 5 to 16% and inhibition increased with increasing urea concentration, up to 58% for 1.5 mg urea/g soil and 100% inhibition at 2.5 mg urea/g soil (Bremner & Krogmeier, 1989). That the release of ammonia was due to urease activity was confirmed as inhibition of germination was prevented when the soil was autoclaved (destroying urease activity) or a urease inhibitor was included (Bremner & Krogmeier, 1989). Thus, there is a clear relationship between increasing urea, production of ammonia by urease activity and inhibitory effects on early plant growth. Urea nitrogen may be lost to the atmosphere as ammonia. Black et al. (1987), observed almost twice as high a loss of urea-N by volatilization as NH3 when 300 kg N/ha was applied to the soil surface compared with 100 kg N/ha. These results suggest that as more urea is added, soil urease activity and ammonia production increase resulting in much of the added fertiliser being wasted. Why is brown slime sometimes a problem? Brown slime usually forms on the soil surface of rice bays beginning as a biofilm and may rise to the water surface and form a mat. If the mat is sufficiently dense it can strangle small rice seedlings and prevent them from growing through the mat, thus reducing rice establishment, which may in turn lead to a lower crop yield. As there is still no accurate method available for measuring soil nitrogen (RiceCheck, 2003), the amount of nitrogen that is added prior to rice sowing is estimated from previous crop history. Following landforming, the amount of nitrogen added to 'cut' areas is higher, on the basis that those areas contain less nitrogen after the removal of topsoil.
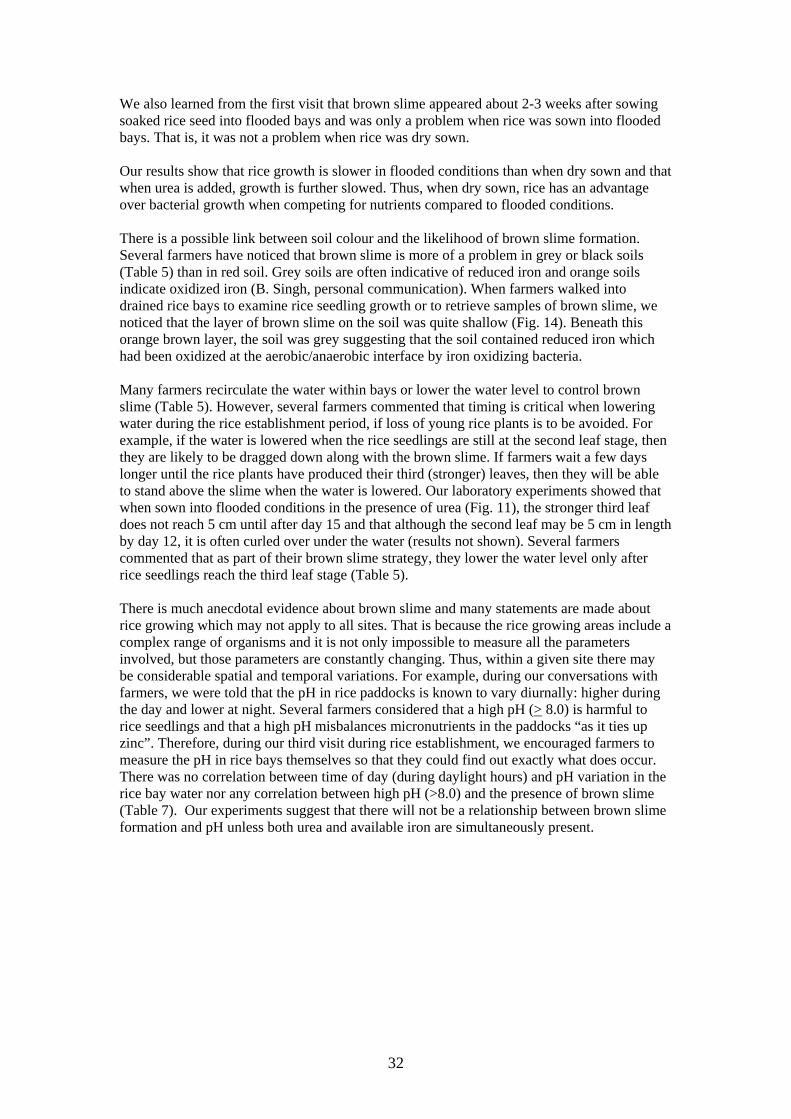
32
We also learned from the first visit that brown slime appeared about 2-3 weeks after sowing soaked rice seed into flooded bays and was only a problem when rice was sown into flooded bays. That is, it was not a problem when rice was dry sown. Our results show that rice growth is slower in flooded conditions than when dry sown and that when urea is added, growth is further slowed. Thus, when dry sown, rice has an advantage over bacterial growth when competing for nutrients compared to flooded conditions. There is a possible link between soil colour and the likelihood of brown slime formation. Several farmers have noticed that brown slime is more of a problem in grey or black soils (Table 5) than in red soil. Grey soils are often indicative of reduced iron and orange soils indicate oxidized iron (B. Singh, personal communication). When farmers walked into drained rice bays to examine rice seedling growth or to retrieve samples of brown slime, we noticed that the layer of brown slime on the soil was quite shallow (Fig. 14). Beneath this orange brown layer, the soil was grey suggesting that the soil contained reduced iron which had been oxidized at the aerobic/anaerobic interface by iron oxidizing bacteria. Many farmers recirculate the water within bays or lower the water level to control brown slime (Table 5). However, several farmers commented that timing is critical when lowering water during the rice establishment period, if loss of young rice plants is to be avoided. For example, if the water is lowered when the rice seedlings are still at the second leaf stage, then they are likely to be dragged down along with the brown slime. If farmers wait a few days longer until the rice plants have produced their third (stronger) leaves, then they will be able to stand above the slime when the water is lowered. Our laboratory experiments showed that when sown into flooded conditions in the presence of urea (Fig. 11), the stronger third leaf does not reach 5 cm until after day 15 and that although the second leaf may be 5 cm in length by day 12, it is often curled over under the water (results not shown). Several farmers commented that as part of their brown slime strategy, they lower the water level only after rice seedlings reach the third leaf stage (Table 5). There is much anecdotal evidence about brown slime and many statements are made about rice growing which may not apply to all sites. That is because the rice growing areas include a complex range of organisms and it is not only impossible to measure all the parameters involved, but those parameters are constantly changing. Thus, within a given site there may be considerable spatial and temporal variations. For example, during our conversations with farmers, we were told that the pH in rice paddocks is known to vary diurnally: higher during the day and lower at night. Several farmers considered that a high pH (> 8.0) is harmful to rice seedlings and that a high pH misbalances micronutrients in the paddocks “as it ties up zinc”. Therefore, during our third visit during rice establishment, we encouraged farmers to measure the pH in rice bays themselves so that they could find out exactly what does occur. There was no correlation between time of day (during daylight hours) and pH variation in the rice bay water nor any correlation between high pH (>8.0) and the presence of brown slime (Table 7). Our experiments suggest that there will not be a relationship between brown slime formation and pH unless both urea and available iron are simultaneously present.

33
Conclusions Rice sown into water grows more slowly than dry sown rice. Addition of urea prior to sowing rice may further slow seedling growth under flooded conditions. Thus, when rice is sown into flooded bays containing urea, there will be a greater chance for brown slime to grow faster than rice and therefore, a likelihood of brown slime formation which may interfere with rice establishment, and in some cases, may decrease the final yield. Recommendations – suggestions for management of brown slime Iron oxidizing bacteria and iron cannot be removed from rice growing soils. Thus, the conditions that favour their growth need to be managed to reduce competition for nutrients between rice, bacteria and subsequent slime formation. However, there are clearly several strategies that can be implemented to reduce the nuisance of brown slime, and several farmers already apply these successfully. Suggested management practices to reduce brown slime
avoid using urea above rates of 57.5 kg N/ha in slime-prone soils prior to flooding where possible, sow clover to fix nitrogen in rotation with rice crops sow rice as soon as possible after flooding.
If brown slime does form
keep water moving, especially in the corners of rice bays, to prevent the formation of large slime mats
reduce water levels to keep rice leaves above slime BUT only after rice seedlings have reached the 3 leaf stage
if the slime mats are limited, try raking them off and throw them onto nearby banks. How farmers can tell whether there will be a likelihood of brown slime
past experience of brown slime in particular bays/paddocks soil type e.g. if the surface of grey soils always turns orange after flooding (Fig. 14) test suspect soils. About 3 weeks before sowing, add some urea to a small soil sample
taken from bays where brown slime may be a concern. Place in a glass jar, add some water, put in a warm place and watch for the appearance of brown-orange coloured iron oxides (takes about 2 weeks).
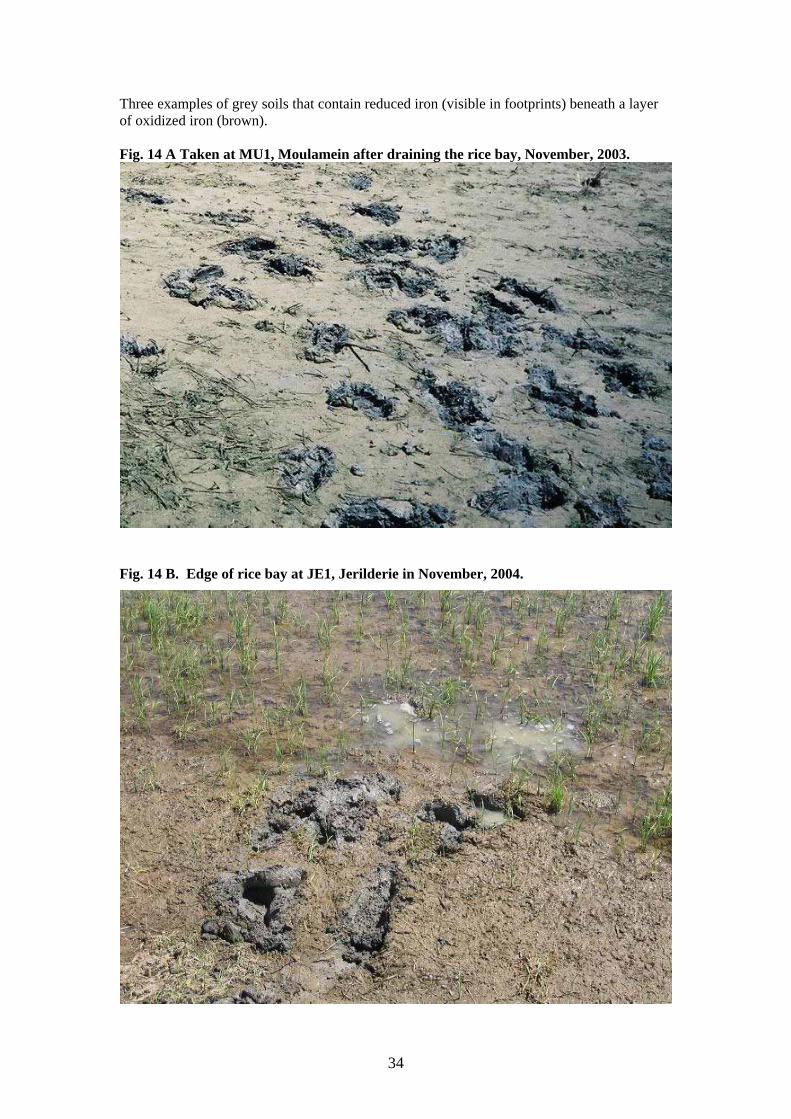
34
Three examples of grey soils that contain reduced iron (visible in footprints) beneath a layer of oxidized iron (brown). Fig. 14 A Taken at MU1, Moulamein after draining the rice bay, November, 2003.
Fig. 14 B. Edge of rice bay at JE1, Jerilderie in November, 2004.
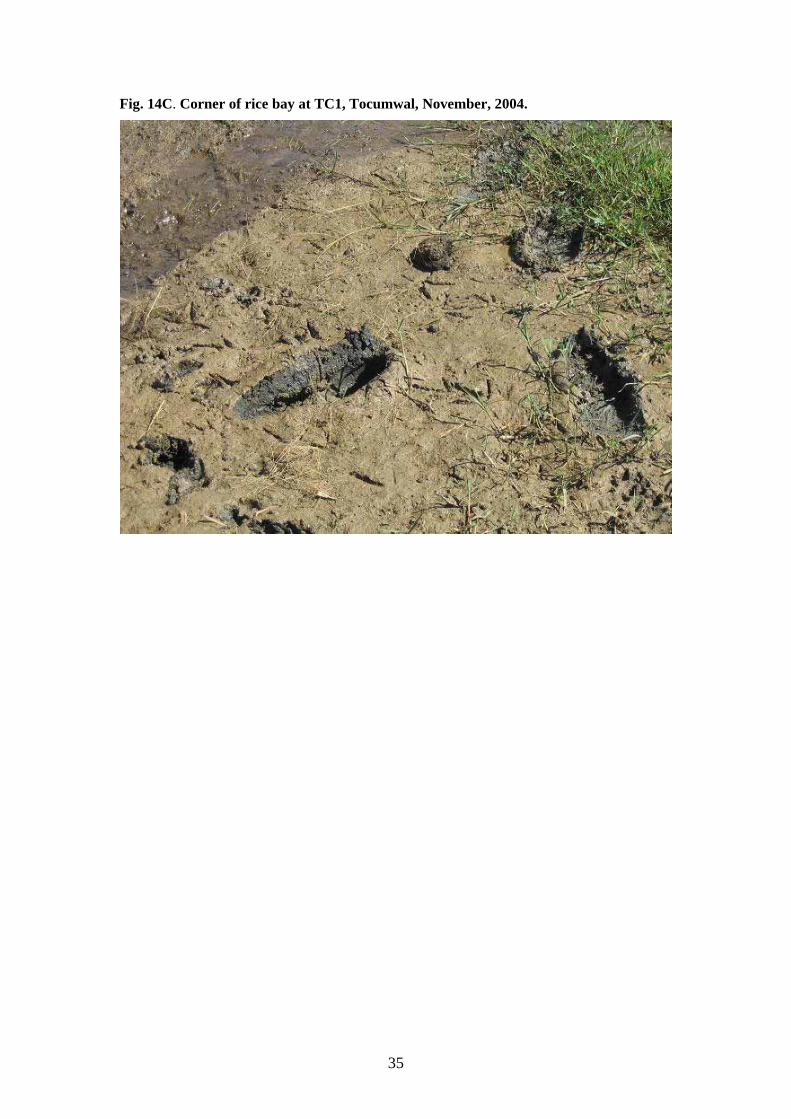
35
Fig. 14C. Corner of rice bay at TC1, Tocumwal, November, 2004.

36
References Agudelo, RA, Gauthier, SF, Pouliot, Y, Marin, J & Savoie, L 2004, ‘Kinetics of peptide fraction release during in vitro digestion of casein’, Journal of the Science of Food and Agriculture, vol. 84, pp. 325-332. Banu, NA, Singh, B & Copeland, L 2004, ‘Soil microbial biomass and microbial biodiversity in some soils from New South Wales, Australia’, Australian Journal of Soil Research, vol. 42, pp. 777-82. Benz, M, Brune, A & Schink, B 1998, ‘Anaerobic and aerobic oxidation of ferrous iron at neutral pH by chemoheterotrophic nitrate-reducing bacteria’, Archives of Microbiology, vol. 169, pp. 159-65. Black, AS, Sherlock, RR & Smith, NP 1987, ‘Effect of urea granule size on ammonia volatilization from surface-applied urea’, Fertilizer Research, vol. 11, pp. 87-96. Bremner, JM & Krogmeier, MJ 1989, ‘Evidence that the adverse effect of urea fertilizer on seed germination in soil is due to ammonia formed through hydrolysis of urea by soil urease’, Proceedings of the National Academy of Science USA, vol. 86, pp. 8185-8. Emerson, D & Moyer, C 1997, ‘Isolation and characterization of novel iron-oxidizing bacteria that grow at circumneutral pH’, Applied & Environmental Microbiology, vol. 63, pp. 4784-92. Entwisle, TJ, Sonneman, JA & Lewis, SH 1988, Freshwater algae in Australia, Sainty & Assoc., NSW, Australia. Gerendas, J, Zhu, Z & Sattelmacher, B 1998, ‘Influence of N and Ni supply on nitrogen metabolism and urease activity in rice (Oryza sativa L.)’, Journal of Experimental Botany, vol. 49, pp. 1545-54. Grant, AJ, Graham, K, Frankland, S & Hinde, R 2003, ‘Effect of copper on algal-host interactions in the coral Plesiastrea versipora’, Plant Physiology & Biochemistry, vol. 41, pp. 383-90. Halliwell, B & Gutteridge, JMC 1999, Free radicals in biology and medicine, Oxford University Press, Oxford. Hanert, HH 1991a, ‘The genus Gallionella’, In: The Prokaryotes: a handbook on habitats, isolation, and identification of bacteria, (eds. Starr, MP, Stolp, H, Truper, HG, Balows, A & Schlegel, HG). Vol. 4, pp. 4082-8, Springer-Verlag, Berlin. Hanert, HH 1991b, ‘The genus Siderocapsa (and other iron- or manganese-oxidizing eubacteria)’, In: The Prokaryotes: a handbook on habitats, isolation, and identification of bacteria, (eds. Starr, MP, Stolp, H, Truper, HG, Balows, A & Schlegel, HG). Vol. 4, pp. 4102-13, Springer-Verlag, Berlin. Hanert, HH 2002, ‘Bacterial and chemical iron oxide deposition in a shallow bay on Palaea Kameni, Santorini, Greece: Microscopy, electron probe microanalysis, and photometry of in situ experiments’, Geomicrobiology Journal, vol. 19, pp. 317-42. Kaltwasser, H & Schlegel, HG 1966, ‘NADH-dependent coupled enzyme assay for urease and other ammonia-producing systems’, Analytical Biochemistry, vol. 16, pp. 132.

37
Kasai, F 1999, ‘Shifts in herbicide tolerance in paddy field periphyton following herbicide application’, Chemosphere, vol. 389, pp. 919-31. Kealey, LM, Humphreys, E, Black, AS & Muirhead, WA 1994, ‘Presowing nitrogen fertiliser management for aerial-sown rice on puddled soil’, Australian Journal of Experimental Agriculture, vol. 34, pp. 1013-20. Koelbel-Boelke, J 1988, ‘Microbial communities in the saturated groundwater environment I. Methods of isolation and characterization of hetertrophic bacteria’, Microbial Ecology, vol. 16(1), pp. 17-30. Kucera, S & Wolfe, RS 1957, ‘A selective enrichment method for Gallionella ferruginea’, Journal of Bacteriology, vol. 74, pp. 344-349. Mobley, HL & Hausinger, RP 1989, ‘Microbial ureases: significance, regulation, and molecular characterization’, Microbiology Review, vol. 53, pp. 85–108. Noble, JC & Happey-Wood, CM 1987, ‘Some aspects of the ecology of algal communities in ricefields and rice irrigation systems of southern New South Wales’, Journal of the Australian Institute of Agricultural Science, vol. 53, pp. 170-84. O’Toole, G, Kaplan, HB, Kolter, R 2000, ‘Biofilm formation as microbial development’, Annual Review of Microbiology, vol. 54, pp. 49-79. Patterson, DJ & Burford, MA 2001, A guide to the protozoa of marine aquaculture ponds, CSIRO, Collingwood, VIC. Ricecheck Recommendations 2003, Best management practice for ricegrowers, NSW Agriculture & RIRDC. Sirko, A & Brodzik, R 2000, ‘Plant ureases: 2000 Roles and regulation’, Acta Biochim. Polonica., vol. 47, pp. 1189-95. Stitt, M, Mueller, C, Matt, P, Gibon, Y, Carillo, P, Morcuende, R, Scheible, WR & Krapp, A 2002, ‘Steps towards an integrated view of nitrogen metabolism’, Journal of Experimental Botany, vol. 53, pp. 959-970. Udenfriend, S, Stanley, S, Bohlen, P, Dairman, W, Leimgruber, W & Weigele, M 1972, ‘Fluorescamine: A Reagent for Assay of Amino Acids, Peptides, Proteins, and Primary Amines in the Picomole Range’, Science, vol. 178, pp. 871-2.
38
Extensions Presentation at rice workshops. RIRDC Rice Research Workshops at Yanco Agricultural Institute 2003, 2004 and 2005. Direct Interaction with farmers: Visited 40 farms as part of this study Spoke at rice establishment meetings November, 2003 presented our current findings at 8 rice establishment meetings in the Western Murray Valley (Wakool and Deniliquin) and Murrumbidgee (Willbriggie and Benerembah) regions (55 farmers) And at Field Days: Oral presentation of our work at the Rice Information Field Day at Yanco Agricultural Institute, March 2004 (about 150 farmers). Oral presentation at three field days held at selected farms, March 2005 (130 farmers)
Publications arising from this project Grant, A & Wilkinson-White, L 2004, ‘Nuisance algae in rice fields’, Farmers’ Newsletter Rice R&D Edition, vol. 165 (summer), pp. 28. Grant, A, Pavlova, M, Wilkinson-White, L, Grant, I & Ko, D 2005, ‘Ecology and biology of nuisance algae in rice fields’, Farmers’ Newsletter Rice R&D Edition, vol. 171 (summer), in press.