ecological systems of latin america and the … · ecological systems of latin america and the...
TRANSCRIPT

ECOLOGICAL SYSTEMS OF LATIN AMERICA AND THE CARIBBEAN
A WORKING CLASSIFICATION OF TERRESTRIAL SYSTEMS
Ecological Systems of Latin America and the Caribbean Page 2
NatureServe is a non-profit organization dedicated to providing the scientific knowledge that forms the basis for effective conservation action. Citation: Josse, C., G. Navarro, P. Comer, R. Evans, D. Faber-Langendoen, M. Fellows, G. Kittel, S. Menard, M. Pyne, M. Reid, K. Schulz, K. Snow, and J. Teague. 2003. Ecological Systems of Latin America and the Caribbean: A Working Classification of Terrestrial Systems. NatureServe, Arlington, VA. © NatureServe 2003 Ecological Systems of Latin America and the Caribbean is a component of NatureServe’s International Terrestrial Ecological Systems Classification. Funding for this report was provided by a grant from The Nature Conservancy. Front cover: Cushion plant community, Antisana Volcano, Ecuador. Photo © Hugo Arnal NatureServe 1101 Wilson Boulevard, 15th Floor Arlington, VA 22209 (703) 908-1800 www.natureserve.org

Ecological Systems of Latin America and the Caribbean Page 3
ECOLOGICAL SYSTEMS OF LATIN AMERICA AND THE CARIBBEAN A WORKING CLASSIFICATION OF TERRESTRIAL SYSTEMS
Carmen Josse Gonzalo Navarro
Pat Comer Rob Evans
Don Faber-Langendoen Meghan Fellows
Gwen Kittel Shannon Menard
Milo Pyne Marion Reid Keith Schulz Kristin Snow Judy Teague
OCTOBER 2003
Ecological Systems of Latin America and the Caribbean Page 4
Collaborators Alejandro Brown (Universidad Nacional de Tucumán, Argentina) Darién E. Prado (Universidad Nacional de Rosario, Argentina) Carlos Saravia T. (Fundación para el Desarrollo del Chaco, Argentina) Stephan Beck (Herbario Nacional de Bolivia, Bolivia) Pierre Ibisch (Fundación Amigos de la Naturaleza FAN, Bolivia) Raul Lara (Bolivia) Moacir B. Arruda (IBAMA, Brasil) Ary T. de Oliveira-Filho (Universidad Federal de Lavras, Brasil) Maria Jesús N. Rodal (Universidad Federal de Pernambuco, Brasil) Federico Luebert (Departamento de Silvicultura, Universidad de Chile, Chile) Orlando Rangel (Universidad Nacional de Colombia, Colombia) Francisco González Medrano (INEGI, México) Fátima Mereles (Universidad Nacional de Asunción, Paraguay) Lidia Pérez (Universidad Nacional de Asunción, Paraguay) Blanca León (Museo de Historia Natural – Universidad Nacional Mayor San Marcos, Perú) Antonio Tovar (Centro de Datos para la Conservación - Universidad Nacional Agraria La Molina Perú) Shirley Keel (The Nature Conservancy, United States) Rodrigo Sierra (University of Texas at Austin, United States) Kenneth Young (University of Texas at Austin, United States) Michele Ataroff (Instituto de Ciencias Ambientales y Ecológicas, Universidad de Los Andes, Venezuela) Eulogio Chacón (Instituto de Ciencias Ambientales y Ecológicas, Universidad de Los Andes, Venezuela) Otto Huber (Corolab Humboldt - Instituto Venezolano de Investigaciones Científicas, Venezuela) Juan Silva (Center for International Development, Harvard University & Universidad de los Andes, Venezuela) Acknowledgements
We wish to acknowledge the generous support provided for this effort by The Nature
Conservancy, mostly through allocation of discretionary funds and also with additional funding from
USAID and the U.S. Forest Service. We are extremely grateful to Roger Sayre, the contact person for
this project at The Nature Conservancy, for his sustained support and help. Many of the concepts and
approaches for defining and applying ecological systems have greatly benefited from collaborations
with Conservancy staff and the classification has been refined during its application in Conservancy-
sponsored conservation assessments.
The NatureServe Science staff engaged in this effort included: Pat Comer, Rob Evans, Don
Faber-Langendoen, Meghan Fellows, Denny Grossman, Carmen Josse, Gwen Kittel, Stephanie Lu,
Larry Master, Shannon Menard, Larry Morse, Milo Pyne, Marion Reid, Mary Russo, Keith Schulz,
Leslie Sneddon, Kristin Snow, and Alan Weakley (now with University of North Carolina
Herbarium). Dr. Gonzalo Navarro (Universidad Complutense de Madrid) coordinated classification
development for most of Bolivia, the Andes, and the Chaco in Paraguay and Argentina.

Ecological Systems of Latin America and the Caribbean Page 5
Table of Contents
Acknowledgements and Collaborators .......................................................................................4
Executive Summary .......................................................................................................................6
Introduction and Background ......................................................................................................8
Ecological Scope and Geographical Coverage of Classification............................................ ....9 The Iterative Nature of Classification..................................................................................... ..10 Objectives of this Report ........................................................................................................ ..10
Key issues and decisions in developing Ecological Systems .....................................................11
Ecological Systems as Functional Units versus Landscape Units .......................................... ..11 Ecological Systems as Geo-Systems versus Bio-Systems...................................................... ..12 The Scale of Ecological Systems............................................................................................ ..13
Conceptual Basis ..........................................................................................................................14
Meso-Scale Systems ............................................................................................................... ..15 Diagnostic Classifiers ............................................................................................................. ..18
Methods of Classification Development.....................................................................................22
Classification Structure........................................................................................................... ..22 Development of Diagnostic Criteria and Descriptions ........................................................... ..23 Nomenclature for Ecological Systems.................................................................................... ..24
Results ...........................................................................................................................................26
Number and Distribution of Systems...................................................................................... ..26 Data Management and Access ................................................................................................ ..27
Applications ..................................................................................................................................30
Applications to Conservation Assessment.............................................................................. ..30 Applications to Element Occurrence Inventory and Mapping ............................................... ..31 Mapping Applications............................................................................................................. ..34 Applications to Management and Monitoring ........................................................................ ..37 Future Applications................................................................................................................. ..41
References .....................................................................................................................................43
Ecological Systems of Latin America and the Caribbean Page 6
Executive Summary
Conservation of the Earth’s rich diversity of life requires a sound understanding of the distribution
and condition of the components of that diversity. Efforts to understand our natural world are directed
toward different biological and ecological scales—from genes and species, to natural communities,
local ecosystems, and landscapes. While scientists have made considerable progress classifying fine-
grained species and communities on the one hand, and coarse-grained ecoregions on the other, land
managers have identified a critical need for practical, mid-scale ecological units to inform
conservation and resource management decisions. This report introduces and outlines the conceptual
basis for such a mid-scale classification unit—ecological systems.
Ecological systems represent recurring groups of biological communities that are found in similar
physical environments and are influenced by similar dynamic ecological processes, such as fire or
flooding. They are intended to provide a “meso-scale” classification unit that is readily mappable,
often from remote imagery, and readily identifiable in the field.
NatureServe and its member programs, with funding from The Nature Conservancy, have
completed a working classification of terrestrial ecological systems in Latin America and the
Caribbean. This report summarizes the nearly 700 ecological systems that currently are classified and
described, emphasizing the natural portion of the landscape. We document applications of these
ecological systems for conservation assessment, ecological inventory, mapping, land management,
and ecological monitoring.
Terrestrial ecological systems are specifically defined as a group of plant community types that
tend to co-occur within landscapes with similar ecological processes, substrates, and/or environmental
gradients. A given system will typically manifest itself in a landscape at intermediate geographic
scales of tens to thousands of hectares and persist for 50 or more years. This temporal scale allows
typical successional dynamics to be integrated into the concept of each unit. With these temporal and
spatial scales bounding the concept of ecological systems, we then integrate multiple ecological
factors – or diagnostic classifiers - to define each classification unit. The multiple ecological factors
are evaluated and combined in different ways to explain the spatial co-occurrence of vegetation.
Summarizing across the range of natural variation, some 477 ecological systems types (69%) are
from uplands, 199 types (29%) wetland, and 17 types (2%) are complexes of uplands and wetlands.
Considering prevailing vegetation structure, 512 types (71%) are predominantly forest, woodland, or
shrubland, and 198 types (28%) are predominantly herbaceous, savanna, or shrub steppe. Seventeen
types (2%) are sparsely vegetated.
Ecological Systems of Latin America and the Caribbean Page 7
Terrestrial ecological systems represent practical, systematically defined units that provide the
basis for mapping terrestrial ecosystems at multiple scales of spatial and thematic resolution. The
working classification presented in this report will serve as the basis for NatureServe to facilitate the
on-going development and refinement of the Latin America and Caribbean components of an
International Ecological Systems Classification.
Introduction and Background
Attempts to understand and conserve our natural world have often been directed at different
biological and ecological levels, from genes and species, to communities, local ecosystems,
landscapes. Ecological conservation and resource management typically require the
identification, description, and assessment of some or all levels of biodiversity within a given
planning area or ecoregion. Practically speaking, the focal elements that define these levels need
to be clearly specified to clarify exactly what is to be protected or managed (Groves et al. 2002).
Conservationists and resource managers now use a variety of approaches to assess
biodiversity at different scales (Redford et al. 2003). Species and ecoregions have received a
great deal of attention. Species approaches include a focus on rare or endemic species, key or
umbrella species, and biodiversity hotspots. Ecoregional approaches include global
prioritizations, such as the WWF Global 2000 ecoregions (Redford et al. 2003) or ecological land
classifications (e.g. Albert 1995, Bailey 1996, Griffith et al. 1998). Community and local
ecosystem approaches have been less-well developed, however with the development of national
and international vegetation classifications (Hueck & Seibert 1972, Devillers & Devillers-
Terschuren 1996, Grossman et al. 1998, Eva et al. 2002, Rodwell et al. 2002, Jennings et al.
2003), the community approach is now applicable at broader geographic scales. The local
ecosystem approach has included mapping and assessment of fine-scaled landscape ecosystem
units (e.g. see Barnes et al. 1998) or the definition of ecological system units within ecoregions
(e.g. Neely et al 2001, Tuhy et al. 2002).
A common set of concerns of conservation or resource managers are a) the spatial scale of the
focal element (the “grain”), b) the degree of consistency in the element definition or taxonomy, c)
the extent to which they can be applied across multiple jurisdictions or even continents, and d) the
extent to which information can be readily assembled to assess their distribution. The species
approach may require that grain be assessed on a species-by-species basis. The degree of
consistency is improving as taxonomies improve, but parts of the world are not well surveyed.
World wide lists and Red Books are increasingly available, but information on many species is
often difficult to obtain.
Ecoregional approaches often provide multiple levels of spatial scales, but typically the grain
is quite coarse, and the units are typically unique subsets of the geographic space, with varying
degrees of heterogeneity. They are either used as focal elements directly or as organizing units
for focusing on more specific focal elements within the region. They are are now increasingly
available around the world, and information can be readily assembled, depending on the features
of the ecoregion being assessed.
Ecological Systems of Latin America and the Caribbean Page 9
Community approaches, often considered a more convenient focal element (the “coarse
filter’) , as compared to species (the “fine filter”) (sensu Jenkins 1976), often have a fine grain,
are relatively consistent, but are often not available world-wide. Their fine grain may hinder
ability to assemble information and conduct assessment, limiting their practical value. Finally,
the intermediate-scaled landscape ecosystems (e.g. USFS ECOMAP Land Type Associations) are
often difficult to define consistently, and on top of it, may be rather heterogeneous with respect to
biodiversity. They are not widely available across the country, or across continents, making
regional/national assessments difficult.
Lacking in these approaches is a focal element that is more coarsely grained than the
community approach, retains a standard of consistency that allows ready identification and
application of the unit at local or regional scales, and that is widely applicable at continental or
hemispheric levels. In addition, gathering information on such focal elements should not make
excessive demands of conservation or resource managers. Here we describe a standardized
terrestrial ecological system classification designed to meet these objectives. Our purpose is to
demonstrate that these systems, though related to both community and landscape ecosystem
approaches, provide a greatly improved set of focal elements for conservation and resource
management. NatureServe’s experience in application of the U.S. National Vegetation
Classification (NVC) has indicated the need for standardized classification units that more fully
integrate environmental factors into unit definition (e.g. see Anderson et al 1999). The same is
true for Latin America, where many countries share ecosystems and/or ecoregions and each one
has a different approach to vegetation or land cover maps, and where there are still large
geographical gaps of this kind of information. There is also a need to define units somewhat more
broadly than the NVC alliance and association units – i.e. allowing for a greater range of biotic
and abiotic heterogeneity in type definition – without “scaling up” to the vegetation classification
formation unit (Grossman et al. 1998, UNESCO 1973), which is defined solely through
vegetation physiognomy and limited environmental factors.
Ecological Scope and Geographical Coverage of Classification The emphasis of this classification is directed towards surficial terrestrial environments,
encompassing both upland (terra firme) and wetland areas where rooted and non-vascular
vegetation – as well as readily identifiable environmental features (e.g. alpine, coastal, cliff, sand
dune, river floodplain, depressional wetland, etc.) - may be used to recognize and describe each
type. We do not address subterranean environments where vertebrate and/or invertebrate species,
along with environmental features could be used for type recognition and description. Nor do we

Ecological Systems of Latin America and the Caribbean Page 10
address aquatic environments, either freshwater or marine, where aquatic animal and/or
environmental features are often used for type recognition and description. Also, we focus here on
ecological system types that can be considered “natural” or “near-natural,” i.e., those that appear to
be unmodified or only marginally impacted by human activities. We have made no attempt to
describe agricultural ecosystems or urban ecosystems where human-caused elements are clearly
novel. A given area could therefore be comprehensively mapped in terms of natural ecological
systems and coupled with a classification of human-induced land use.
NatureServe is currently working towards a first-draft classification of terrestrial ecological
systems across North, Central, South America and the Caribbean. As part of this report we provide a
working list and descriptions of nearly 700 terrestrial ecological systems of Mexico, the Caribbean
Islands, Central America, South America and their near-shore islands. Regions of South America
such as Patagonia, the temperate Pampas, the Peruvian Chilean desert, and the Galapagos Islands,
have not yet been classified and described under our approach, though we expect to complete their
classification in the near future, adding around 150 more types to this first list of ecological systems.
The Iterative Nature of Classification Ecological classifications are often portrayed as being “complete.” Classification is more
appropriately viewed as an ongoing process of stating assumptions, data gathering, data analysis
and synthesis, testing new knowledge through field application, and classification refinement. A
classification system provides a framework for this ongoing process and the resulting
classification should continually change as new knowledge is gained. The effort documented
here represents the first attempt to synthesize data and apply a standard approach to documenting
natural upland and wetland ecological systems comprehensively across Latin America and the
Caribbean. NatureServe will continue to provide a mechanism for ongoing development and
dissemination of this classification.
Objectives of this Report This report documents the development of terrestrial ecological systems, emphasizing the key
issues and requirements of such a system in relation to other approaches. We review the criteria
used to identify systems, and the standards that were used to develop, name, and describe them.
We also describe the process for gathering information on these systems and summarize the
results of this initial classification effort. We then describe the application of ecological systems
for mapping and assessing occurrence quality or ecological integrity. Finally we address the next
steps in the process of further enhancing the systems classification.

Ecological Systems of Latin America and the Caribbean Page 11
Key issues and decisions in developing Ecological Systems Ecosystems have been defined generally as “ a community of organisms and their physical
environment interacting as an ecological unit” (Lincoln et al. 1982). Classification of ecological
systems can be based on a variety of factors (e.g., vegetation, soils, landforms) at a variety of
spatial and temporal scales (hectares to millions of kilometers and annual to millennial), and with
varying degrees of concern over spatial interactions. A full review of the variety of
classifications currently used is beyond the scope of this document. Rather, some key issues will
be highlighted that includes discussions of other approaches.
Ecological Systems as Functional Units versus Landscape Units
Historically, ecological systems have been defined from a wide variety of perspectives,
depending on the investigator, with some emphasizing ecosystem function and processes (nutrient
cycling, energy flows); others the “physical” (land) factors that structure the system (Golley
1993, Bailey 1996). Odum (2001) emphasizes the functional perspective in his definition:
An ecological system, or ecosystem, is any unit (a biosystem) that includes all the organisms
(the biotic community) in a given area interacting with the physical environment so that a flow
of energy leads to clearly defined biotic structures and cycles of materials between living and
non-living parts. An ecosystem is more than a geographic unit (or ecoregion); it is a
functional system with inputs and outputs, and with boundaries that can be either natural or
arbitrary.
Emphasis on these studies is on energy flow and nutrient cycling, looking at how primary and
secondary producers shape the flow of energy and materials through a system. By contrast, Bailey
(1996) emphasizes the landscape ecosystem approach:
J. S. Rowe … defined an ecosystem as “a topographic unit, a volume of land and air plus
organic contents extending areally over a particular part of the earth’s surface for a certain
time.” This definition stresses the reality of ecosystems as geographic units of the landscape that
include all natural phenomena and that can be identified and surrounded by boundaries.”
These definitions do not lead to mutually exclusive approaches to ecosystem studies. Many
functional studies use watershed geographic units to define their ecosystems; and landscape
ecosystem studies often emphasize functional properties within and across geographic units. Our
decision was to emphasize a classification approach to ecosystems that does not rely on a fixed
landscape map unit and which is still amenable to process-functional studies. We emphasize how
Ecological Systems of Latin America and the Caribbean Page 12
processes on the landscape shape ecological systems, and define them through a combination of
biotic and abiotic criteria.
Ecological Systems as Geo-Systems versus Bio-Systems Given that ecosystems generally are defined as an ecological unit of both organisms and their
environment, there are various approaches to choosing which set of factors to emphasize in a
classification. The landscape ecosystem, or geo-ecosystems (Rowe and Barnes 1994),
emphasizes the controlling factors of climate, soils, and topography over that of biota. The bio-
ecosystems approach gives more emphasis to the controlling factors of biota (akin to the
“biogeocoenosis” of Sukachev 1945, in Mueller-Dombois and Ellenberg 1974, or the biogeocene
unit of Walter 1985).
The bio-ecosystem approach has recently received more widespread attention for conservation
and resource management through the development of “biotope” units. A biotope (sometimes
called “habitats”) is a small to meso-scale ecosystem unit, defined as “a limited geographic area
with a particular environment and set of flora and fauna” (Devillers et al. 1991). In Europe,
biotopes have been defined at a variety of scales by the CORINE Biotope Manual, which defined
and described hundreds of biotopes (Devillers et al. 1991). The same methodology used for the
CORINE Biotopes typology, was applied to classify the habitats of South America, resulting in
hundreds of types organized in a hierarchical arrangement where the biogeographical criterion
was used in such a way that led to the definition of very localized, site scale, units.
Our decision was to take the approach of defining ecological systems using a “bio-ecosystem”
approach. We also chose to classify these systems at a meso-scale (akin to the “biogeocene
complex” unit of Walter 1985). This approach defines the boundaries of a system in part based
on the combination of component plant communities and abiotic factors. The plant communities
are based on existing vegetation, and so our systems are also based on “existing ecosystems,” not
potential systems.
Nonetheless, the geo-ecosystem approach has an important role to play in helping define the
abiotic template on which ecological systems may be found.
Ecological Systems as Discrete Units versus Individualistic Units
Although there is continuous variation in species composition and environmental gradients,
in some places the level of compositional and environmental change is low (e.g., within a readily
recognizable plant community) whereas in other places the level of compositional change is high
(e.g., across an ecotone).

Ecological Systems of Latin America and the Caribbean Page 13
The necessary consequence of these findings is that in most cases there are no clear and
unambiguous boundaries between plant communities or ecological systems in nature, and species
assemblages or ecosystem processes are not entirely predictable. Any decision as to how to
divide the continuously varying and somewhat unpredictable phenomenon of community types
and systems must be somewhat arbitrary with multiple acceptable solutions. Ecological
classification only requires that it is reasonable to separate the continuum of variation in
ecological composition and structure into a series of somewhat arbitrary classes (Whittaker 1975,
Kimmins 1997). Furthermore, ecosystem factors are typically more temporally and spatially
stable than vegetation factors on their own, facilitating repeated recognition of the same unit.
Our decision is to recognize that ecological systems do grade more-or-less continually across
the landscape. We rely on a combination of diagnostic classifiers of both abiotic and biotic
factors to create reasonable classes of units.
The Scale of Ecological Systems In principle, ecosystems can be defined at any geographic scale, from a rotting log or vernal
pond to the entire biosphere. Thus they range from <10 to 1,000,000s of hectares. They can also
vary in the definition of their stability, from annual to 1,000s of years (Delcourt and Delcourt
1988). Recent classifications or regionalizations using the geo-ecosystem approach explicitly
define a nested series of spatial scales, from broad ranging ecoregional units that span millions of
hectares to “micro-ecosystem” land types that span 10s of hectares. The expectation is that these
units are stable on the order of hundreds of years. Functional approaches work at a variety of
temporal and spatial scales as well, depending on the processes being studied.
For the purposes of developing an ecological systems classification, our decision was to focus
on the scale of greatest need. The micro-ecosystem level has not been comprehensively
developed for all of Latin America and doing it consistently would require a long term,
resourceful project. Good classifications however, exist at the macro-ecosystem level; vegetation
formations (UNESCO 1973), a recent vegetation and land use map of South America (Eva et al.
2002), or ecoregions (Olsen et al. 2001) can be used. Spatially, these macro-systems often span
continents. Temporally, formations reflect short to long-term stability (though the recognition of
units tends to focus on the more stable units), and ecoregions emphasize stability on the order of
100s to 1000s of years.
Notably lacking, however, are good meso-scale units. For bio-ecosystems that utilize local
plant communities for their definition, the conceptual “distance” between UNESCO formations
and local community units is rather large, given that formations are defined solely through

Ecological Systems of Latin America and the Caribbean Page 14
vegetation physiognomy and limited environmental factors. In Latin America, probably the most
common type of classification applied at the national level has been the Holdridge Life Zone
system, which due to its mathematical model, leaves out wetlands and many other “azonal” types
related to special substrates or hydrogeomorphology. Nor is its use of latitudinal and altitudinal
regions a good enough surrogate for the bio/phytogeographical criterion.
Conceptual Basis
A terrestrial ecological system is defined as a group of plant community types that tend to co-
occur within landscapes with similar ecological processes, substrates, and/or environmental
gradients. A given terrestrial ecological system will typically manifest itself in a landscape at
intermediate geographic scales of 10s to 1,000s of hectares and persist for 50 or more years.
Ecological processes include natural disturbances such as fire and flooding. Substrates may
include a variety of soil surface and bedrock features, such as shallow soils, alkaline parent
materials, sandy/gravelling soils, etc.. Finally, environmental gradients include local climates,
hydrologically defined patterns in coastal zones, arid grassland or desert areas, or life zones such
as montane, alpine or subalpine zones
In Latin America and the Caribbean, where classification at the floristic levels equivalent to
the US NVC association and alliance is not available region-wide, multiple references on plant
communities at local scale become the potential units to group through an iterative “bottom-up”
and “top-down” process of information synthesis, where abiotic and environmental
characterizations within a given geographic setting help to define the spatial criteria that bond
these communities.
Given the relative ease of recognizing vegetative structure and composition, this approach is
preferable to, for example, defining biotic components using animal species that are more
difficult to consistently observe and identify. Ecological systems are defined using both spatial
and temporal criteria that influence the grouping of communities.
In developing an ecological systems approach, we are mindful that in principle ecological
systems can be defined in a number of ways. Indeed, there are so many different definitions, that
perhaps the concept is in danger of losing its utility for ecological research and application.
Recently, O’Neill (2001) made a number of suggestions to help improve the ecosystem concept;
namely, that the ecosystem (1) be explicitly scaled, (2) include variability, (3) consider long-term
sustainability in addition to local stability, and (4) include population processes as explicit system
dynamics. Here we define our ecological system concept as follows:

Ecological Systems of Latin America and the Caribbean Page 15
1. We explicitly scale the unit to represent:
a. spatial scales of 10s to 1000s of hectares.
b. temporal scales of 50 to 100 years
2. We make explicit the variability in the system by describing them in terms of a consistent
list of abiotic and biotic criteria and by linking ecological systems to a number of local
references to plant community types that describe the biotic community variation within
the system.
3. We propose to consider long-term sustainability and local stability by mapping and
evaluating the occurrence of ecological systems at the local site and the regional level.
4. We do not formally include population processes as explicit system dynamics, but through
knowledge of the component plant communities, it would be possible to at least describe
the major plant species and their dynamics within the systems. Additional work could
formalize the roles of additional biotic elements such as invertebrates and vertebrates.
Meso-Scale Systems Our conceptualization of terrestrial ecological systems includes temporal and geographic
scales intermediate between those commonly considered for local stand and landscape-scale
analyses, which can range from 50 to 1,000s of years and 10s to 1,000s of hectares (Delcourt and
Delcourt 1988). These “meso-scales” are intended to constrain the definition of system types to
scales that are of prime interest for conservation and resource managers who are managing
landscapes in the context of a region or state. More precise bounds on both temporal and
geographic scales take into account specific attributes of the ecological patterns that characterize
a given region.
Temporal Scale. The temporal scale we have chosen determines the means by which we account
for both successional changes and disturbance regimes in each classification unit. Relatively
rapid successional changes resulting from disturbances are encompassed within the concept of a
given system unit. Therefore, daily tidal fluctuations will be encompassed within a system type.
Some of the communities describing one system may represent multiple successional stages. For
example, a given floodplain system may include both early successional associations and later
mature woodland stages that form dynamic mosaics along many kilometers of a river. Many
vegetative mosaics resulting from annual to decadal changes in coastal shorelines will be
encompassed within a system type. Many forest and grassland systems will encompass common
successional pathways that occur over 20-50 year periods. Selecting this temporal scale shares

Ecological Systems of Latin America and the Caribbean Page 16
some aspects with the “habitat type” approach to describe potential vegetation, but differs in that
no “climax” vegetation is implied, and all “seral” components are explicitly included in the
system concept.
Of course, many environmental attributes, such as climate, continually change through time.
We assume that a given “natural/near-natural” ecological system type will encompass continual
change resulting from climatic patterns as they have occurred in recent millennia, with little or no
human influence, and will continue to change into the future.
Pattern and Geographic Scale. Spatial patterns that we observe at “intermediate” scales can
often be explained by landscape attributes that control the location and dynamics of moisture,
nutrients, and disturbance events. For example, throughout the tropical Andes it is possible to see
distinctions in vegetation along the elevation gradient, with the slope aspect adding complexity to
the moisture patterns. In extensive plains such as the ones of the South American Chaco, micro
topography and substrate induce clear distinctions in vegetation, going abruptly from wetlands to
xerophylous types. Rivers provide moisture, nutrients, and scouring soil disturbance that regulate
the regeneration of some plant species. In each of these settings we find a number of plant
communities co-occurring due to controlling factors in the environment. The communities that
co-occur may or may not share the same physiognomy or floristic characteristics that would place
them in the same UNESCO formation. More often than not, we see mosaics of communities
from different formations, such as woodlands, shrublands, and herbaceous meadows, occurring in
a complex mosaic along a riparian corridor, and we can often predict that along riparian corridors
within a given elevation zone, and along a given river size and gradient, we should encounter a
limited suite of communities.
Having said this, we still define “intermediate” spatial scales within rather broad bounds of
10s to 1,000s of hectares. For the purposes of guiding field identification, mapping, and
interpreting ecological relations among terrestrial ecological systems, it is often helpful to
categorize ecological system types based on their typical patch type characteristics. Table 1
describes four categories for patch types that encompass all terrestrial ecological systems. These
include “matrix-forming,” “large patch,” “small patch,” and “linear.” In each of these instances,
an expected geographic scale (size of the patch) is included as initial guidance for identifying
systems within a given area. Review of broad scale ecological pattern for a given region should
result in an initial suite of ecological systems types that could fall into each of these categories.
For example, matrix-forming forests, shrublands, and/or grasslands may dominate extensive
uplands for a given regional landscape. Both large patch and small patch systems tend to appear

Ecological Systems of Latin America and the Caribbean Page 17
nested within those matrix system types, while linear system types occur along riverine corridors,
coastal areas, and major physiographic breaks (e.g. escarpments or cliff faces). Analysis of more
local-scale patterns nested within the region’s natural matrix clarifies the diversity of potential
patch and linear system types, and similar evaluations of composition and correlated abiotic
attributes may be used to differentiate system types.
Table 1. Categories for patch types used to describe ecological systems
Patch Type Definition Matrix Ecological Systems that form extensive and contiguous cover, occur on the most
extensive landforms, and typically have wide ecological tolerances. Disturbance patches typically occupy a relatively small percentage (e.g. <5%) of the total occurrence. In undisturbed conditions, typical occurrences range in size from 2,000 to 10,000s ha.
Large Patch Ecological Systems that form large areas of interrupted cover and typically have narrower ranges of ecological tolerances than matrix types. Individual disturbance events tend to occupy patches that can encompass a large proportion of the overall occurrence (e.g. >20%). Given common disturbance dynamics, these types may tend to shift somewhat in location within large landscapes over time spans of several hundred years. In undisturbed conditions, typical occurrences range from 50-2,000 ha.
Small patch Ecological Systems that form small, discrete areas of vegetation cover typically limited in distribution by localized environmental features. In undisturbed conditions, typical occurrences range from 1-50 ha.
Linear Ecological Systems that occur as linear strips. They are often ecotonal between terrestrial and aquatic ecosystems. In undisturbed conditions, typical occurrences range in linear distance from 0.5 to 100 km.
The concepts of both “linear” and “small patch” types result in the definition of units that can
only fall into either category. The same is not always true with “large patch” vs. “matrix” types.
There are circumstances where an ecological system form the matrix within one part of its range,
but then occurs as a “large patch” type in another part of its range. This likely results in differing
dynamics of climate and related disturbance processes – and interactions with other systems –
that vary in ways that are unique to each system type. For example, a savanna system may form
the matrix of one ecoregion where landscape-scale fire regimes have historically been supported
by regional climate. But an adjacent, more humid, ecoregion might support the same type of
savanna system, where it occurs as patches within a matrix of forests. Importantly, we have
established as a classification rule that this type of change in spatial character – between “large
patch” and “matrix” categories across the range of a type - does not force the distinction of two
system types. The environmental and disturbance dynamics that result in that variation can be
described and addressed for conservation purposes without defining a distinct type. With these

Ecological Systems of Latin America and the Caribbean Page 18
temporal and spatial scales bounding the concept of ecological systems, we may then integrate
multiple ecological factors to define each classification unit.
Diagnostic Classifiers As the definition for ecological systems indicates, this is a multi-factor approach to ecological
classification. Multiple environmental factors – or diagnostic classifiers - are evaluated and
combined in different ways to explain the spatial co-occurrence of natural communities.
Diagnostic classifiers is used here in the sense of Di Gregorio and Jansen (2000); that is, the
structure of the ecological systems classification is more “modular” than “hierarchical” in that it
aggregates diagnostic classifiers in multiple, varying combinations, without a specific hierarchy.
The focus is on a single set of ecological system types. This is in contrast to, for example, the
framework and approach of most vegetation classification systems where the lower level units are
grouped into the upper levels of the hierarchy based solely on floristic and/or physiognomic
criteria. These hierarchies provide more of a conceptual aggregation with no presumption that
communities co-occur in a given landscape. The ecological system unit links plant communities
using multiple factors that help to explain why they tend to be found together in a given
landscape due to similar ecological processes, substrates, and/or ecological gradients. Therefore,
ecological systems tend to be better “grounded” as ecological units than most vegetation
classification types and are more readily identified, mapped, and understood as practical
ecological classification units. Diagnostic classifiers include a wide variety of factors
representing bioclimate, biogeographic history, physiography, landform, physical and chemical
substrates, dynamic processes, landscape juxtaposition, and vegetative structure and composition.
Biogeographic and Bioclimatic Classifiers. Ecological Divisions are sub-continental
landscapes reflecting both climate and biogeographic history, modified from Bailey (1996 and
1998) at the Division scale (Figure 1). Continent-scaled climatic variation, reflecting variable
humidity and seasonality (e.g. Mediterranean vs. dry continental vs. humid oceanic) are reflected
in these units, as are broad patterns in phytogeography (e.g. Takhtajan 1986). These units were
adapted and more precisely described using ecoregion lines established by The Nature
Conservancy (Groves et al. 2002) and World Wildlife Fund (Olson et al. 2001) throughout the
Western Hemisphere.
These regional units aid in organizing the classification and in describing the distribution of
each ecological system type. Regional patterns of climate, physiography, disturbance regimes,
and biogeographic history are well described by each Division. Examples of these Divisions

Ecological Systems of Latin America and the Caribbean Page 19
include North-Central Moist Andes, South-Central Dry Andes, Orinoquia, Caribbean, Chaco,
Patagonia, Peruvian-Chilean Desert. A “Chaco” ecological system type is predominantly found
(>80% of it’s total range) within the Chaco Division. A “Meridional Chaco” ecological system
type is limited in distribution to southern portions of the broader Chaco Division. In a few
instances, ecological systems remain very similar across two or more Ecological Divisions. In
these instances, the Domain scale of Bailey (1996) was used to name and characterize the
distribution of types.
Subregional bioclimatic factors are also useful for classification purposes, especially where
relatively abrupt elevation-based gradients exist, or where maritime climate has a strong influence
on vegetation. We integrated global bioclimatic categories of Rivas-Martinez (1997) to
characterize subregional climatic classifiers. These included relative temperature, moisture, and
seasonality. They may be applied globally, so they aid in describing life zone concepts (e.g.
‘maritime,’ ‘lowland,’ ‘montane,’ ‘subalpine,’ ‘alpine’) in appropriate context from arctic through
tropical latitudes.
Environment. Within the context of biogeographic and bioclimatic factors, ecological
composition, structure and function in upland and wetland systems are strongly influenced by
factors determined by local physiography, landform, and surface substrate. Some environmental
variables are described through existing, standard classifications and serve as excellent diagnostic
classifiers for ecological systems. For example, soil moisture characteristics have been well
described in the United States by the USDA Natural Resource Conservation Service (NRCS
1998). Practical hydrogeomorphic classes are established for describing all wetland
circumstances (Brinson 1993). Other factors such as landforms, specialized soil chemistry may
be defined in standard ways to allow for their consistent application as diagnostic classifiers.
Ecological Dynamics. Many dynamic processes are sufficiently understood to serve as
diagnostic classifiers in ecosystem classification. In many instances, a characteristic disturbance
regime may provide the single driving factor that distinguishes system types. For example, many
wetland systems are distinguishable based on the hydroperiod, as well as water flow rate,
direction, and origin (Brinson 1993; Cowardin 1979). Once characterized in standard form (e.g.
Frost 1998), these and other dynamic processes apply to multi-factor classification.
Landscape Juxtaposition. Local-scale climatic regime, physiography, substrate, and dynamic
processes can often result in recurring mosaics. For example, large rivers often support recurring

Ecological Systems of Latin America and the Caribbean Page 20
Figure 1. Ecological Divisions of America used in organization and nomenclature of NatureServe Ecological Systems

Ecological Systems of Latin America and the Caribbean Page 21
patterns of levee, floodplain, and back swamps, all resulting from seasonal hydrodynamics that
continually scour and deposit sediment. Many depressional wetlands or lakeshores have
predictable vegetative zonation driven by water level fluctuation. The recurrent juxtaposition of
recognizable vegetative communities provides a useful and important criterion for multi-factor
classification.
Vegetation Structure, Composition, and Abundance. As is well recognized in vegetation
classification, both the physiognomy and composition of vegetation suggests much about
ecosystem composition, structure, and function. However, the relative significance of vegetative
physiognomy may vary among different ecosystems, especially at local scales. For example,
many upland systems support vegetation of distinct physiognomy in response to fire frequency
and soil moisture regimes. In general, physiognomic distinctions such as “forest and woodland,”
“shrubland” “savanna,” “shrub steppe,” “grassland, “ and “sparsely vegetated” are useful
distinctions in upland environments. On the other hand, needleleaf or broadleaf tree species that
are either evergreen vs. deciduous may co-occur in many combinations due more to
phytogeographic history than current environmental conditions. Many wetland systems could
support herbaceous vegetation, shrubland, and forest structures in the same location, again, based
on the particular strategies of the species involved and local site history.
Therefore, while recognizable differences in vegetative physiognomy may initially suggest
distinctions among ecosystem types, knowledge of vegetative composition should be relied upon
more heavily to indicate significant distinctions. As in vegetation classification, we recognize
beta diversity, or the turnover of species composition through space, as a primary means of
differentiating ecosystem types. The task of classification is to recognize where that turnover is
relatively abrupt, and explain why that abrupt change occurs on the ground.
In the absence of a standarized vegetation classification for Latin America and Caribbean,
especially at the floristic level, we have relied on qualitative description and evaluation of non-
standard classification units and on finer phytogeographic classifications below the level used for
defining the Ecological Divisions, since they serve as a useful surrogate for detailed data on the
physiognomy and floristics of vegetation across the region.
While beta diversity is a primary consideration, the relative abundance of vegetation can also
be an important consideration. For example, many riparian and floodplain systems can share
many plant species, due to their adaptation for dispersal along a seasonally flowing river.
However, there may be substantial differences in the relative abundance of species between, for
example, riparian systems with small, flashy stream dynamics and a large, well-developed river

Ecological Systems of Latin America and the Caribbean Page 22
floodplain many kilometers downstream. Measurement of vegetation abundance, and the
environmental factors that support it, are needed to adequately address this facet of ecological
classification.
Methods of Classification Development
Ideally, ecological classification proceeds through several phases in a continual process of
refinement. These phases could include 1) literature review and synthesis of current knowledge,
2) formulating an initial hypothesis describing each type, 3) establishing a stratified sampling
design, 4) gathering of field data, 5) data analysis, 6) description of types, 7) establishing
dichotomous keys to classification units, 8) mapping of classification units, and 9) refinement of
classification, establishing relative priorities for new data collection. Our approach presented
here is qualitative and rule-based, focusing on steps 1 and 2 above. We used existing information
from other classifications as much as possible. National or regional vegetation or ecosystems
maps were used, particularly to select the diagnostic classifiers at the division level and organize
the process of defining systems. We utilized also the existing ecoregional frameworks provided
by WWF (www.worldwildlife.org) and additional detailed information available for a few
ecoregions. We also reviewed hundreds of references, thus our approach draws extensively on
the existing literature available to us.
In the process of developing the classification we have consulted with several regional experts
affiliated with a number of institutions (see list of Collaborators). Their participation was
facilitated by the organization of three workshops carried out in Ecuador, Peru, and Bolivia,
where draft versions of portions of the classification were discussed and reviewed. We consider
their participation as a valuable and initial peer review process.
Classification Structure As previously mentioned, the structure of the ecological systems classification could be
described as “modular” in that it aggregates diagnostic classifiers in multiple, varying
combinations. This approach has allowed us maximum flexibility in the definition of multi-factor
units. For the landscape hierarchy, we emphasize the division level and the WWF version of the
ecoregional level, because that level is being used for conservation planning by The Nature
Conservancy.
However, it is possible that some type of hierarchy may be advantageous. With approximately
1,000 upland and wetland system types across Latin America and the Caribbean, a hierarchy
Ecological Systems of Latin America and the Caribbean Page 23
would at least improve the organization of the units. But more importantly, a hierarchy may also
allow us to further interpret the ecological patterns over a range of intermediate-scales.
Hierarchical arrangements of biotopes or habitats in Europe (such as by EUNIS) may provide
some guidance on establishing a hierarchy of ecological systems presented here.
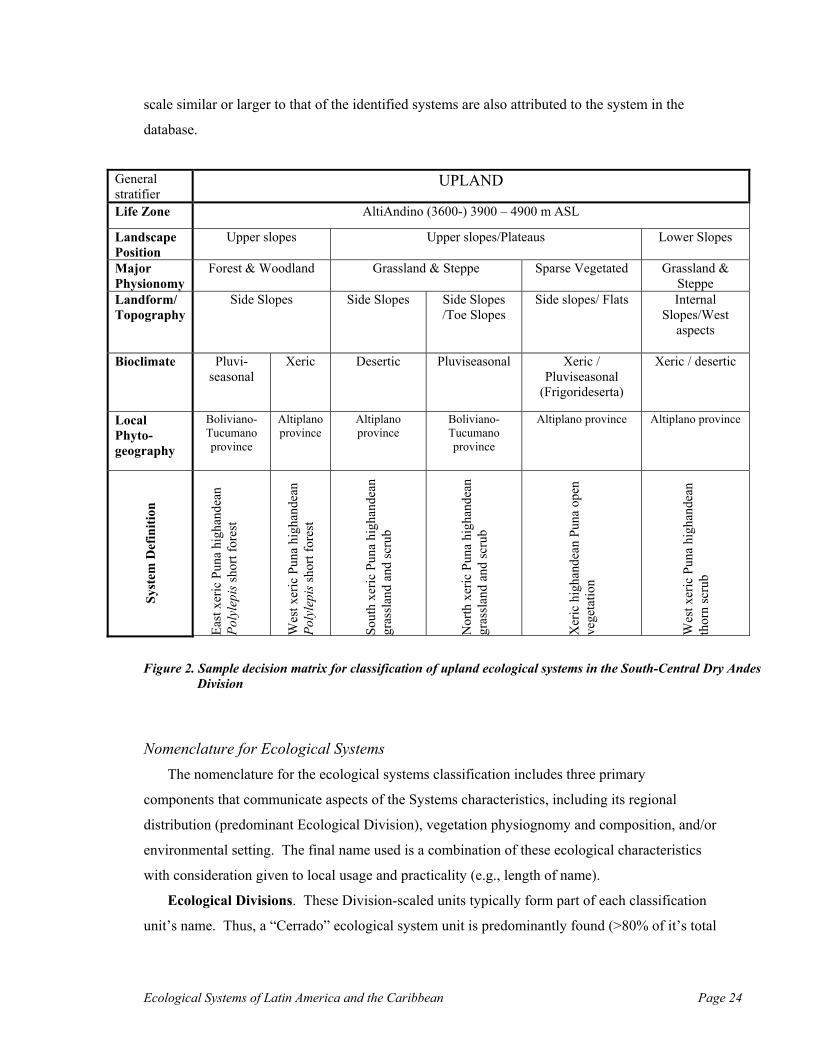
Development of Diagnostic Criteria and Descriptions Diagramming factors. Multiple diagnostic criteria may be arranged to allow for a visual
expression of the combinations that define each ecological system unit. Figure 2 depicts a subset
of upland ecological system types that are found in the South Central Dry Andes Division. The
major break between “upland” and “wetland” was used as the initial stratifier. Global life zones
of “montane” vs. “alpine/altiandino” vs. “lowland” and subordinate belts of “upper montane,”
“montane,” “lower montane,” and “subalpine” are usually the next level classifier in montane
areas, which may then break in physiognomic types. Landscape position can affect soil drainage
and exposure to wind, giving way to finer-scale bioclimate and landform/ substrate
characteristics, which further set up constraints on the type of disturbance regimes and resulting
vegetation that a given site will support. This type of diagramming allows for major diagnostic
classifiers to be organized and visibly display the logic of how they were used. Subsequent
description and qualitative analysis allow these initial assumptions to be tested, then built upon.
Qualitative description. Each type is described in a database that includes a summary of known
distribution, environmental setting, vegetative structure and composition, and dynamic processes.
A separate portion of the database allows any combination of classifying criteria to be selected,
then attributed as a diagnostic classifier. This permits subsequent sorts and further evaluation of
types using any combination of diagnostic classifiers (e.g. all riparian systems, all High Andean
systems, all upper slope systems found in the Andean Divisions, etc.).
Attribution of Vegetative Communities. Numerous literature sources were used to identify,
classify, and describe the ecological systems. Many of those besides describing the vegetation
types or communities within a given region, go a step further and describe the relationship
between a community type and a particular environment or environmental attribute. This is the
type of reference that provides evidence of the correlation between vegetation types and specific
(abiotic) diagnostic criteria. When a local terminology is used to name the vegetative
communities, this information is added to the database. Units of existing vegetation maps at a
Ecological Systems of Latin America and the Caribbean Page 24
scale similar or larger to that of the identified systems are also attributed to the system in the
database.
General stratifier
UPLAND
Life Zone AltiAndino (3600-) 3900 – 4900 m ASL
Landscape Position
Upper slopes Upper slopes/Plateaus Lower Slopes
Major Physionomy
Forest & Woodland Grassland & Steppe Sparse Vegetated Grassland & Steppe
Landform/ Topography
Side Slopes Side Slopes Side Slopes /Toe Slopes
Side slopes/ Flats Internal Slopes/West
aspects
Bioclimate Pluvi-seasonal
Xeric Desertic Pluviseasonal Xeric / Pluviseasonal
(Frigorideserta)
Xeric / desertic
Local Phyto- geography
Boliviano-Tucumano province
Altiplano province
Altiplano province
Boliviano-Tucumano province
Altiplano province Altiplano province
Syst
em D
efin
ition
East
xer
ic P
una
high
ande
an
Poly
lepi
s sho
rt fo
rest
W
est x
eric
Pun
a hi
ghan
dean
Po
lyle
pis s
hort
fore
st
Sout
h xe
ric P
una
high
ande
an
gras
slan
d an
d sc
rub
Nor
th x
eric
Pun
a hi
ghan
dean
gr
assl
and
and
scru
b
Xer
ic h
igha
ndea
n Pu
na o
pen
vege
tatio
n
Wes
t xer
ic P
una
high
ande
an
thor
n sc
rub
Figure 2. Sample decision matrix for classification of upland ecological systems in the South-Central Dry Andes Division
Nomenclature for Ecological Systems The nomenclature for the ecological systems classification includes three primary
components that communicate aspects of the Systems characteristics, including its regional
distribution (predominant Ecological Division), vegetation physiognomy and composition, and/or
environmental setting. The final name used is a combination of these ecological characteristics
with consideration given to local usage and practicality (e.g., length of name).
Ecological Divisions. These Division-scaled units typically form part of each classification
unit’s name. Thus, a “Cerrado” ecological system unit is predominantly found (>80% of it’s total

Ecological Systems of Latin America and the Caribbean Page 25
range) within the Cerrado Division, but could also occur in neighboring Divisions. This
nomenclatural standard applies for many ecological system units, except in those types that are
more localized (>80% of the range) within a phytogeographic subunit of the Division (e.g. Xeric
Puna, within the South Central Dry Andes Division), or span many several Divisions (e.g., some
tidal or freshwater marsh systems).
Vegetation Structure and Phenology. Vegetation structure (e.g. Forest and Woodland,
Grassland), and phenology (e.g. seasonal evergreen, deciduous) are commonly used in the name
of a system. In sparse to unvegetated types, reference to characteristic landforms (e.g. cliff) may
substitute for vegetative structure and/or composition. It will typically come after Ecological
Division, but may come before or after Environment (see below).
Environment. Environmental factors (e.g., xeric, hygrophilous, montane) can be used in
conjunction with Vegetative Structure and Phenology or on their own to name system types. This
will typically come after Ecological Division, but may come before or after Vegetation Structure
and Composition.
Results Number and Distribution of Systems
This first iteration has resulted thus far in the identification and description of some 700
upland and wetland ecological system types within 19 of the 23 Divisions encompassed in Latin
America and the Caribbean, and we expect to identify at least 150 additional types in the
remaining divisions. This selection represents almost the full range of natural settings that can be
encountered in the region, with the exception of the temperate grasslands of the Southern Cone,
the Pacific Desert, and the unique environments of the Galapagos Islands.
A total of 694 types give the following preliminary results when grouped in different
categories: some 477 types (69%) are uplands, 199 (29%) are wetlands, and 17 types (2%) are
complexes of uplands and wetlands, these proportions may change slightly towards a reduction in
the number of wetlands when some of these systems are more accurately classified as complexes
of uplands and wetlands. Looking at prevailing vegetation physiognomy, some 512 types (71%)
are predominantly forest, woodland, and/or shrubland, and some 198 types (28%) are
predominantly herbaceous, savanna, and/or grassland. Only 17 types have been recorded as
sparsely vegetated. Clearly this number does not represent the full diversity of these restricted,
isolated, and usually rare types, and more detailed information is required in order to better
represent them in the classification.
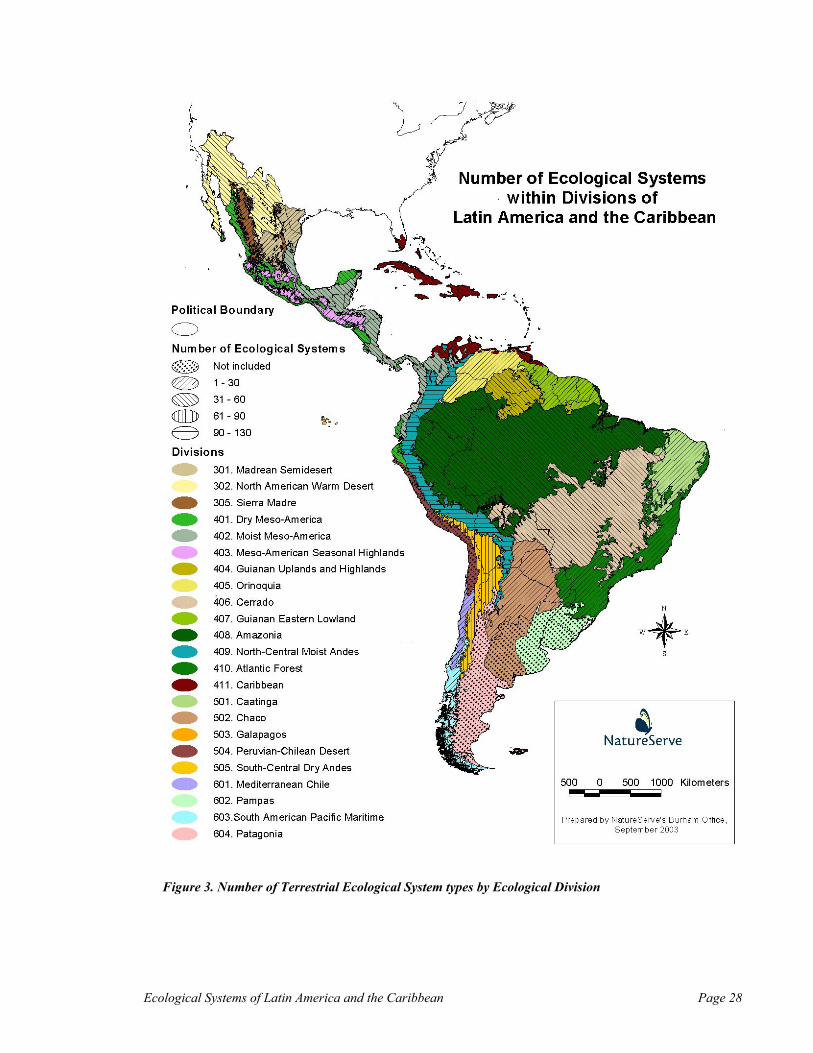
Figure 3 categorizes Ecological Divisions by the number of ecological systems. The first
evident pattern is the habitat diversity of the Andes, an expected result given the broad altitudinal
and latitudinal gradients encompassed in the cordillera. A perhaps less expected pattern is the
comparatively poorer diversity of the rainforests of the tropical lowlands. Adding the systems of
the two Andean divisions the total number is 202, with little overlapping, whereas the sum of the
systems of all the typical tropical rainforest regions is 184 (Amazonia, Atlantic Forest, Guianan
Eastern Lowlands, Guianan Uplands and Highlands, and Moist Meso America). Table 2 indicates
the number of ecological systems within each ecological division.
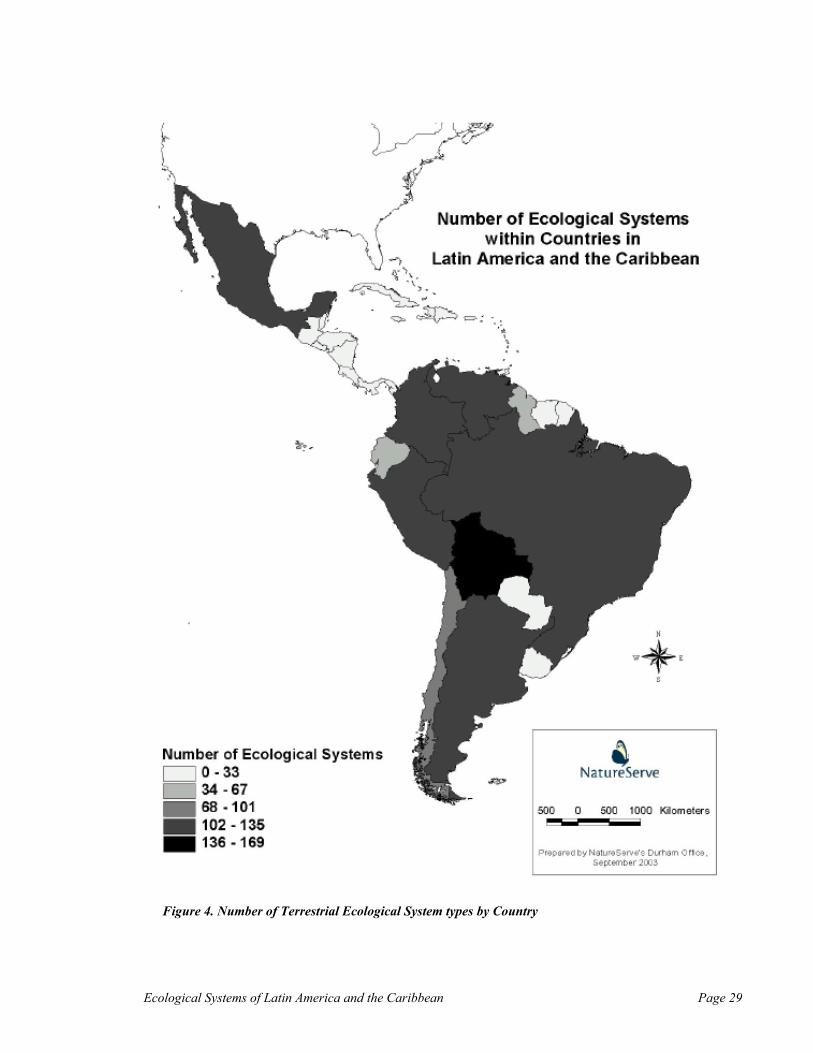
Figure 4 illustrates the number of ecological systems by country. A direct correspondence
exists between the number of divisions occurring in one country, and the number of ecological
systems for the same country. This explains in part the unexpected large number of systems found
to occur in Argentina or Bolivia, for instance. It is again important to recognize is that these
figures reflects to some degree the availability of information, or rather, the level of detail of the
available information, as well as geographical expertise of involved reviewers.
Ecological Systems of Latin America and the Caribbean Page 27
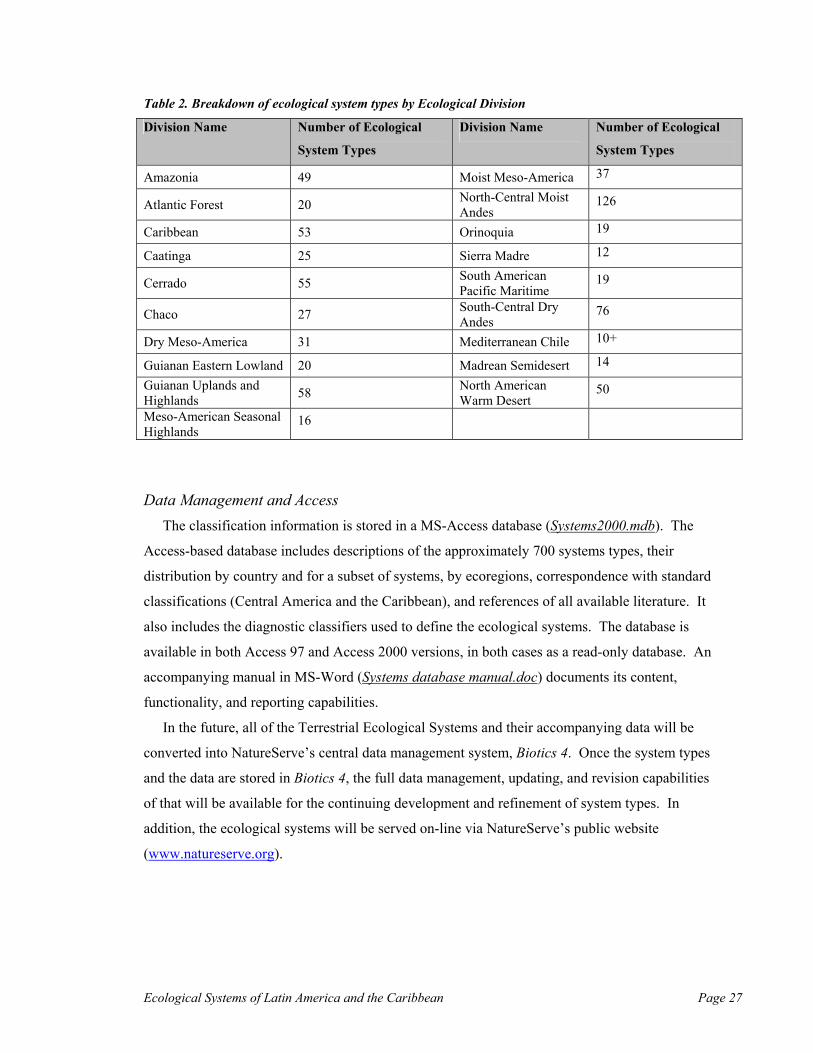
Table 2. Breakdown of ecological system types by Ecological Division
Division Name Number of Ecological
System Types
Division Name Number of Ecological
System Types
Amazonia 49 Moist Meso-America 37
Atlantic Forest 20 North-Central Moist Andes
126
Caribbean 53 Orinoquia 19
Caatinga 25 Sierra Madre 12
Cerrado 55 South American Pacific Maritime
19
Chaco 27 South-Central Dry Andes
76
Dry Meso-America 31 Mediterranean Chile 10+
Guianan Eastern Lowland 20 Madrean Semidesert 14
Guianan Uplands and Highlands 58 North American
Warm Desert 50
Meso-American Seasonal Highlands
16
Data Management and Access The classification information is stored in a MS-Access database (Systems2000.mdb). The
Access-based database includes descriptions of the approximately 700 systems types, their
distribution by country and for a subset of systems, by ecoregions, correspondence with standard
classifications (Central America and the Caribbean), and references of all available literature. It
also includes the diagnostic classifiers used to define the ecological systems. The database is
available in both Access 97 and Access 2000 versions, in both cases as a read-only database. An
accompanying manual in MS-Word (Systems database manual.doc) documents its content,
functionality, and reporting capabilities.
In the future, all of the Terrestrial Ecological Systems and their accompanying data will be
converted into NatureServe’s central data management system, Biotics 4. Once the system types
and the data are stored in Biotics 4, the full data management, updating, and revision capabilities
of that will be available for the continuing development and refinement of system types. In
addition, the ecological systems will be served on-line via NatureServe’s public website
(www.natureserve.org).
Ecological Systems of Latin America and the Caribbean Page 28
Figure 3. Number of Terrestrial Ecological System types by Ecological Division
Ecological Systems of Latin America and the Caribbean Page 29
Figure 4. Number of Terrestrial Ecological System types by Country

Ecological Systems of Latin America and the Caribbean Page 30
Applications
Applications to Conservation Assessment Conservation assessment occurs at varying spatial scales to serve the priority-setting needs of
various users. Assessment at a regional scale is often necessary to evaluate status and trends in
regional biodiversity. Places are then identified that capture ecological and genetic variation
across a broad range of environmental gradients (Johnson et al. 1999). At these regional scales,
planning efforts may identify networks of places that, taken together, fully represent characteristic
biological diversity. One might then identify areas where more intensive natural resource
development could take place in a compatible fashion. That network of places is sometimes
referred to as a “portfolio,” because an ever-changing variety of approaches may exist to conserve
biological diversity over time through on-the-ground actions. As knowledge expands, and the
“market” for conservation changes, one can expect that new places will gain importance, while
other places may contribute less to conservation goals. Much like a financial portfolio, a regional
conservation network embodies this portfolio concept.
Assessments using ecoregions as a spatial planning framework have become increasingly
common in recent years, and standardized classifications of ecological systems can serve a central
role in these types of assessments. Ecoregions are regional landscapes, or relatively large areas of
land and water defined by similar geology, landforms, climates and ecological processes.
Further, ecoregions contain geographically-distinct assemblages of ecological systems that share
a large majority of their communities, species, dynamics, and environmental conditions, and
function effectively as a framework for conservation assessment at global and continental scales
(Bailey 1996, Olsen et al. 2001). In most instances, upland and wetland ecological system units
can be mapped comprehensively across ecoregions or any other regional planning area.
Therefore they aid in evaluating the status and trends of numerous ecological phenomena, from
trends in land conversion or wildlife habitats to creating repeatable metrics for landscape
fragmentation.
An “element-based” approach to conservation assessment commonly establishes a suite of
species, communities, and ecological systems that provide the focus for representing biodiversity.
An additional suite of elements may also be included in the analysis to represent overall
conservation value (e.g., those identified under environmental regulations, open space, scenic or
cultural values.). The objective should be to select a limited set of elements that could serve as
effective surrogates for all (or nearly all) biological diversity. Through conservation of these
elements across the planning area, one seeks to efficiently secure the ecological environments and
Ecological Systems of Latin America and the Caribbean Page 31
dynamic interactions that support the vast majority of species. Occurrences of these elements, as
well as the relative quality of their occurrences, are used to characterize biodiversity value and
identify specific locations for conservation action.
Three levels of biological or ecological organization: ecological systems, communities, and
species, should be represented among selected elements. As these categories indicate, this
reflects a “coarse filter/fine filter” hypothesis – i.e. the conservation of multiple, high-quality
occurrences of all ecological systems will also support the majority of native biodiversity. Since
this “coarse filter” on its own would be unlikely to represent all biodiversity, especially those
communities and species that are rare and thus not reliably found within most examples of
ecological systems, additional elements, those that are imperiled or vulnerable, are also needed –
the “fine filter.” Lambeck (1997) proposed a generic set of criteria for selection of focal species
for conservation planning. Experience suggests that this combined “coarse filter/fine filter”
approach is the most efficient and effective approach to capturing biodiversity in a network of
reserves (e.g. Jenkins 1976, 1985; Noss and Cooperider 1994, Haufler et al. 1996, Groves et al.
2002, Kintsch and Urban 2002). The coarse filter/fine filter approach also helps us to minimize
complexity and cost associated with strict species-based approaches (e.g. Scott et al 1987,
Beissinger and Westphal 1998; Willis and Whittaker 2002) while allowing sufficient flexibility to
integrate new approaches as technical hurdles are overcome (e.g. Fleishman et al. 2001, Carroll et
al. 2001, Scott et al. 2002).
Careful element selection therefore provides appropriate focus for subsequent efforts to map
and evaluate element occurrences, then establish specific conservation goals and objectives.
Applications to Element Occurrence Inventory and Mapping Here we discuss the issues about identifying the systems on the ground and developing
detailed information on their locations or occurrences (“element occurrence requirements”). In
the Applications to Management and Monitoring section, we introduce the issue of assessing the
ecological integrity of these occurrences.
Elements, then are the units of biodiversity, whether species, communities, or systems.
Element occurrences are geographic locations of those elements on the ground. Specifically,
NatureServe standards (NatureServe 2002) state that:
An element occurrences is an area of land and/or water in which a species, natural
community, or ecological system is, or was, present. An occurrence should have
practical conservation value for the Element…. For community Elements, the
occurrence may represent a stand or patch of a natural community, or a cluster of

Ecological Systems of Latin America and the Caribbean Page 32
stands or patches of a natural community. For system elements, the occurrence may
represent a cluster of stands from different communities that are part of the system.
Occurrences constitute the principal source of detailed information about the distribution of the
elements. The occurrences are typically mapped, but map scale can vary depending on the
application.
Key to the identification and mapping process is establishing the criteria for a given
occurrence. When is one occurrence of a system distinct from another occurrence of the same
system? For example, a mesic forest system (such as the Tumbesian Dry Montane Forest) may
occupy a series of ravines, and is distinct from either the riparian forests in the bottoms of ravines
or the xeric scrubs that predominate on the warmer and drier upland slopes. How far apart do the
dry forest stands need to be before they are treated as separate occurrences? And do small stands
of only a 0.5 hectare patch get recorded as a separate occurrence from xeric scrubs that surround
it? It is these questions about minimum patch size and separation distances between patches that
are addressed by the “occurrence requirements,” which ensure consistent application of the
systems approach.
Defining Occurrences. For ecological systems (as for communities), occurrences represent a
defined area that contains (or contained) a characteristic ecological setting and vegetation.
Occurrences are separated from each other by barriers to species interactions or ecological
processes, or by specific distances defined for each element across adjacent areas occupied by
other natural or semi-natural community types, or by cultural vegetation. Occurrences can be
created for both communities and systems. In some cases a system occurrence may encompass
several community-level occurrences, either of the same community type (in cases where the
separation distance requirement at the systems level is greater than at the community level) or
several community types. Recommended minimum sizes for the system types will meet or exceed
those of the component community types.
They are: 10 ha for matrix, 10 ha for upland large patch; 1 ha for wetland large patch; 0.5 ha for small patch; 100 m for all linear types. Stands/areas below the recommended minimum size become difficult to judge in terms of
community or system type characteristics, and, if isolated, become heavily influenced by edge
effects. For conservation purposes, generally only larger sized occurrences of each community or
system type are tracked and the threshold for minimum size is seldom approached.

Ecological Systems of Latin America and the Caribbean Page 33
Barriers and Separation Distances. Known barriers for Elements, either naturally
occurring or manmade, should be described in the occurrence requirements. For community or
system occurrences, barriers may be obstacles that limit the expansion or alter the function of
these types. These barriers either separate populations of most of the component species within
the community or system, thus obstructing or severely limiting gene flow and ecological
interactions, or they obstruct or limit ecological processes that these species depend on. Barriers
may be common for many wetland communities or systems, but are typically less common for
many upland terrestrial communities or systems.
In addition to barriers that totally, or almost completely, prevent ecological processes and
species interactions, there may be habitats between two stands of an element that partially restrict
species interactions or ecological processes. Unlike barriers, their effect depends on the kind and
extent of this intervening habitat and its effect on the stands. This leads to the issue of separation
distance. The intent of assigning values for separation distances between two stands is to achieve
consistency in the manner in which occurrences are defined and mapped. Smaller separation
distances are used when the intervening habitat is highly restrictive to the ecological processes or
species interactions the element depends, and greater distances are used when these habitats are
less prohibitive to ecological processes or species interactions.
We use two broad categories of intervening habitats to define separation distances, namely –
natural/semi-natural vegetation or cultural vegetation. Generally speaking, intervening natural
and semi-natural vegetation will have less of an ecological effect between two stands of an
occurrence than intervening cultural vegetation. Thus rather simplistically, we suggest that
different separation distances be specified for these two kinds of situations. Typically, a shorter
separation distance is specified when the intervening habitat is cultural vegetation than when it is
natural/semi-natural. Minimum values for separation distances have been recommended to ensure
that occurrences are not separated by unreasonably small distances, which would lead to the
identification of unnecessarily splintered stands as potential targets for conservation planning or
action. For communities or systems, the minimum separation distance for intervening areas of
different natural or semi-natural communities is set at 1 km or greater, and for intervening areas
of cultural vegetation, the distance is set at 0.5 km or greater (Table 3). These separation
distances may, of course, be much larger. For communities or systems found primarily in
mountainous regions, where habitat tends to be less fragmented, separation distances may be 5
km or more. A few elements may require separation distances that are less than the established
minimum; in such cases, these distances should be justified in the occurrences.
Ecological Systems of Latin America and the Caribbean Page 34
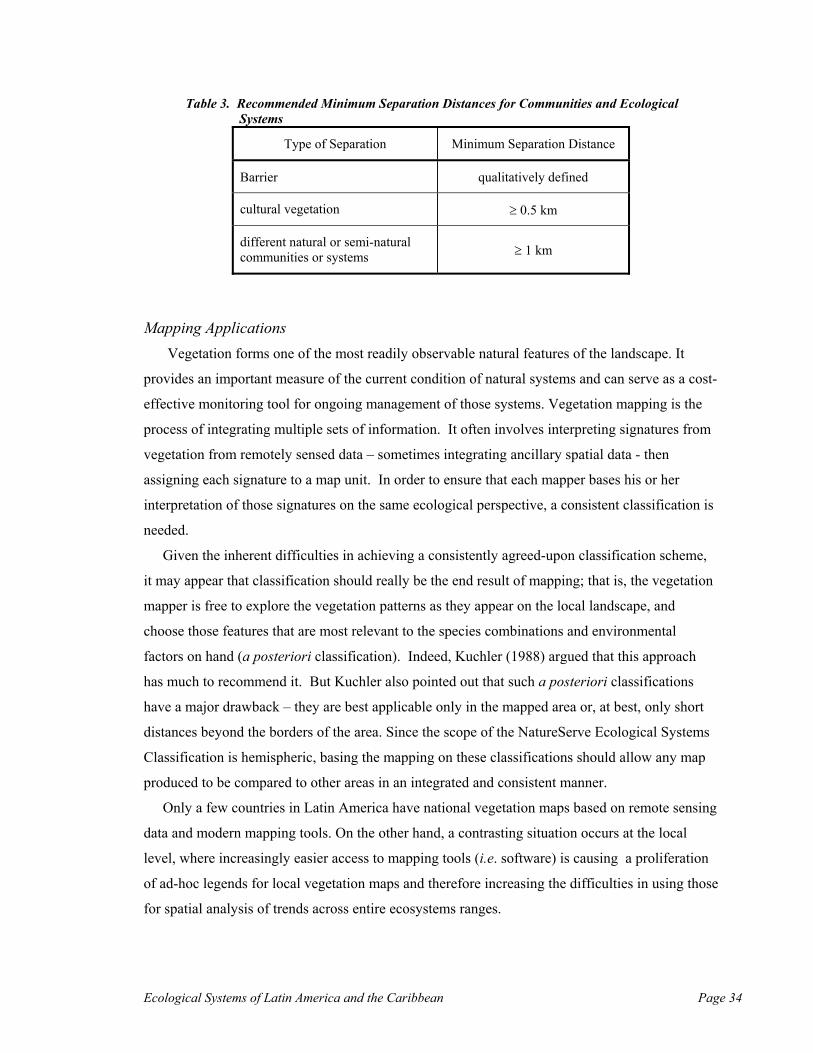
Table 3. Recommended Minimum Separation Distances for Communities and Ecological Systems
Type of Separation Minimum Separation Distance
Barrier qualitatively defined
cultural vegetation ≥ 0.5 km
different natural or semi-natural communities or systems ≥ 1 km
Mapping Applications Vegetation forms one of the most readily observable natural features of the landscape. It
provides an important measure of the current condition of natural systems and can serve as a cost-
effective monitoring tool for ongoing management of those systems. Vegetation mapping is the
process of integrating multiple sets of information. It often involves interpreting signatures from
vegetation from remotely sensed data – sometimes integrating ancillary spatial data - then
assigning each signature to a map unit. In order to ensure that each mapper bases his or her
interpretation of those signatures on the same ecological perspective, a consistent classification is
needed.
Given the inherent difficulties in achieving a consistently agreed-upon classification scheme,
it may appear that classification should really be the end result of mapping; that is, the vegetation
mapper is free to explore the vegetation patterns as they appear on the local landscape, and
choose those features that are most relevant to the species combinations and environmental
factors on hand (a posteriori classification). Indeed, Kuchler (1988) argued that this approach
has much to recommend it. But Kuchler also pointed out that such a posteriori classifications
have a major drawback – they are best applicable only in the mapped area or, at best, only short
distances beyond the borders of the area. Since the scope of the NatureServe Ecological Systems
Classification is hemispheric, basing the mapping on these classifications should allow any map
produced to be compared to other areas in an integrated and consistent manner.
Only a few countries in Latin America have national vegetation maps based on remote sensing
data and modern mapping tools. On the other hand, a contrasting situation occurs at the local
level, where increasingly easier access to mapping tools (i.e. software) is causing a proliferation
of ad-hoc legends for local vegetation maps and therefore increasing the difficulties in using those
for spatial analysis of trends across entire ecosystems ranges.

Ecological Systems of Latin America and the Caribbean Page 35
The NatureServe ecological systems classification was utilized with the preparation of maps
of ecological systems in four different regional planning areas that constitute subunits of
NatureServe’s Ecological Divisions and groupings of WWF ecoregions (e.g. Venezuelan Andes,
Gran Chaco, Cordillera Real Oriental, and Equatorial Pacific). In these exercises existing
vegetation maps, climatic maps, and interpretation of satellite imagery by experts were used to
map the systems, and in cases, field trips have been conducted to identify the systems on the
ground. At the time of this publication, these remained ongoing efforts, so we have not yet
systematized the procedures followed, or performed map accuracy assessments. Figure 5 shows a
preliminary map depicting ecological systems of the Chaco and a selection of the units, as an
example. Not all of the 43 terrestrial ecological system units thought to occur in this region were
depicted in this map with existing data. Those not depicted tend to occur as very small patches,
or the ancillary information used was too coarse, such as in the Argentina side (Eva et al. 2002).
These LAC maps have relied strongly on existing spatial vegetation information. As far as this
information is available at a compatible scale it is a good alternative, otherwise resolution can be
improved by bringing in biophysical variables such as elevation, landform, surface geology, soils,
and hydrography in order to split coarse units in a number of systems. These variables should be
used for modeling with the concept statements of each ecological system type in mind.
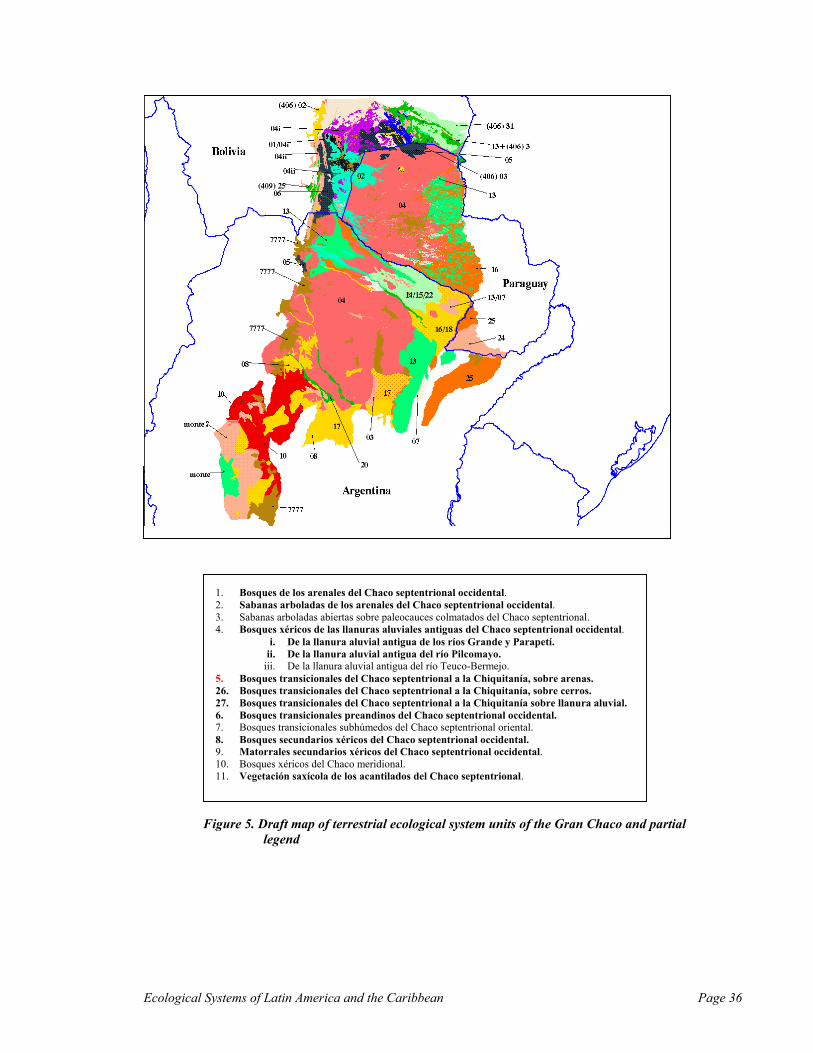
Ecological Systems of Latin America and the Caribbean Page 36
1. Bosques de los arenales del Chaco septentrional occidental. 2. Sabanas arboladas de los arenales del Chaco septentrional occidental. 3. Sabanas arboladas abiertas sobre paleocauces colmatados del Chaco septentrional. 4. Bosques xéricos de las llanuras aluviales antiguas del Chaco septentrional occidental.
i. De la llanura aluvial antigua de los ríos Grande y Parapetí. ii. De la llanura aluvial antigua del río Pilcomayo.
iii. De la llanura aluvial antigua del río Teuco-Bermejo. 5. Bosques transicionales del Chaco septentrional a la Chiquitanía, sobre arenas. 26. Bosques transicionales del Chaco septentrional a la Chiquitanía, sobre cerros. 27. Bosques transicionales del Chaco septentrional a la Chiquitanía sobre llanura aluvial. 6. Bosques transicionales preandinos del Chaco septentrional occidental. 7. Bosques transicionales subhúmedos del Chaco septentrional oriental. 8. Bosques secundarios xéricos del Chaco septentrional occidental. 9. Matorrales secundarios xéricos del Chaco septentrional occidental. 10. Bosques xéricos del Chaco meridional. 11. Vegetación saxícola de los acantilados del Chaco septentrional.
Figure 5. Draft map of terrestrial ecological system units of the Gran Chaco and partial
legend
Applications to Management and Monitoring Having mapped ecological systems and established occurrences on the ground, we may then
want to know if each mapped occurrence is of sufficient quality (viability or ecological integrity)
or can be feasibly restored to such quality. This is the next essential step towards developing
local-area management and monitoring objectives. Characterizing and evaluating the quality of
an occurrence provides the basis for assessing ecological stresses—the degradation, or
impairment—of element occurrences at a given site. There are three core components of
occurrence evaluation that can be applied to all focal conservation elements in a conservation site
of any scale – whether these are individual populations or species, assemblages of species,
ecological communities, or ecological systems. These core components and their function are as
follows:
1) Key Ecological Attributes – structure, composition, interactions and abiotic and biotic
processes that enable the Element Occurrence to persist.
2) Indicator – measurable entity that is used to assess the status and trend of a Key Ecological
Attribute.
3) Indicator rating – the point within a given expected range of variation one would rate each
Indicator that describes its current status.
To assess the quality of element occurrences, one must first identify and document a limited
number of key ecological attributes that support them (the terms “key ecological attribute” and
“indicators” are comparable to the term “ecological attributes” and “indicator” used by TNC in
Parrish et al. 2003 and by the EPA publication of Young and Sanzone 2002). After these are
identified, a set of measurable indicators are established to evaluate each attribute and document
their expected ranges of variation. For each indicator, we may then establish thresholds for
distinguishing their current status along a relative scale from “Excellent” to “Poor.”
Documentation of these basic assumptions about key ecological attributes, ranges of
variation, thresholds, and indicators for measurement, are called “Element Occurrence Rank
Criteria;” and form a central component of Heritage methodology. These criteria are needed to
consistently assess whether the attributes exhibited for a given occurrence are within desired
ranges or whether they will require significant effort to be maintained or restored to their desired
status. Each key attribute is reviewed, rated, and then combined with others to rank each
occurrence as A (excellent), B (good), C (fair), and D (poor). The higher the estimated viability

Ecological Systems of Latin America and the Caribbean Page 38
or integrity of the occurrence, the higher is its occurrence rank and presumed conservation value.
Table 4 lists the basic occurrence ranks assigned to each occurrence. The break between C and D
establishes a minimum quality threshold for occurrences. D-ranked occurrences are typically
presumed to be beyond practical consideration for ecological restoration. In subsequent
management planning, these ranks and underlying attributes and indicators aid in focusing
conservation activities and measure progress toward the local conservation objectives.
Table 4. Basic Element Occurrence Ranks
Occurrence
Rank
Description of Ecological Integrity
A excellent
B good
C fair
D poor
E verified extant (integrity not assessed)
H historical (not recently located)
X extirpated (no longer extant)
Because occurrence ranks are used to represent the relative conservation value of an
occurrence as it currently exists, occurrence ranks are based solely on attributes that reflect the
present status, or quality, of that occurrence. There are three generalized occurrence rank
categories used to organize the various key ecological attributes. These are condition, size, and
landscape context. They are combined further to arrive at an overall occurrence rank. Thus:
Condition+ Size + Landscape Context ⇒ Estimated Viability or Integrity ≈ Occurrence
Rank
For community and system Elements, the term “ecological integrity” is preferable to that of
viability, since communities and systems are comprised of many separate species, each with their
own viability. Ecological integrity is the “maintenance of…structure, species composition, and
the rate of ecological processes and functions within the bounds of normal disturbance regimes1.
More directly, occurrence ranks reflect the degree of negative anthropogenic impact to a
1From. Lindenmayer and Recher (in Lindenmayer and Franklin 2002). Similarly, Karr and Chu (1995) define ecological (or biological) integrity as “the capacity to support and maintain a balanced, integrated, adaptive biological system having the full range of elements (genes, species, and assemblages) and processes (mutations, demography, biotic interactions, nutrient and energy dynamics, and metapopulation processes) expected in the natural habitat of a region.
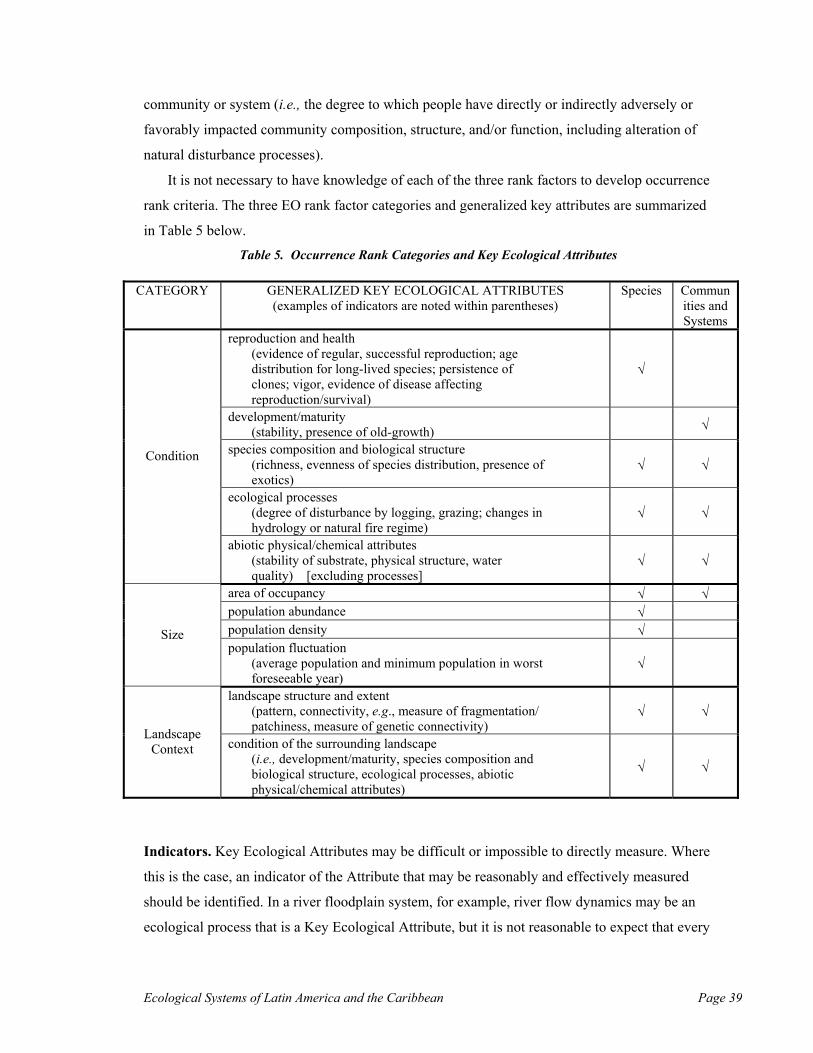
Ecological Systems of Latin America and the Caribbean Page 39
community or system (i.e., the degree to which people have directly or indirectly adversely or
favorably impacted community composition, structure, and/or function, including alteration of
natural disturbance processes).
It is not necessary to have knowledge of each of the three rank factors to develop occurrence
rank criteria. The three EO rank factor categories and generalized key attributes are summarized
in Table 5 below.
Table 5. Occurrence Rank Categories and Key Ecological Attributes
CATEGORY GENERALIZED KEY ECOLOGICAL ATTRIBUTES (examples of indicators are noted within parentheses)
Species Communities and Systems
reproduction and health (evidence of regular, successful reproduction; age distribution for long-lived species; persistence of clones; vigor, evidence of disease affecting reproduction/survival)
√
development/maturity (stability, presence of old-growth) √
species composition and biological structure (richness, evenness of species distribution, presence of exotics)
√ √
ecological processes (degree of disturbance by logging, grazing; changes in hydrology or natural fire regime)
√ √
Condition
abiotic physical/chemical attributes (stability of substrate, physical structure, water quality) [excluding processes]
√ √
area of occupancy √ √ population abundance √
population density √ Size
population fluctuation (average population and minimum population in worst foreseeable year)
√
landscape structure and extent (pattern, connectivity, e.g., measure of fragmentation/ patchiness, measure of genetic connectivity)
√ √
Landscape Context condition of the surrounding landscape
(i.e., development/maturity, species composition and biological structure, ecological processes, abiotic physical/chemical attributes)
√ √
Indicators. Key Ecological Attributes may be difficult or impossible to directly measure. Where
this is the case, an indicator of the Attribute that may be reasonably and effectively measured
should be identified. In a river floodplain system, for example, river flow dynamics may be an
ecological process that is a Key Ecological Attribute, but it is not reasonable to expect that every

Ecologic
possible parameter would be measured. A few parameters (e.g., flood seasonality and periodicity)
can be selected that will give us an overall indication (indicator) of how the status of our Key
Attribute (flow dynamics) is changing. So the indicator may be a subset of the variables defining
the Key Attribute, or a more measurable substitute for the Attribute.
Any element’s Key Ecological Attributes (and therefore their indicators) will vary over time in
a relatively undisturbed setting. This variation is not random, but limited to a particular range that
we recognize as either a) natural and consistent with the long-term persistence of each
occurrence, or b) outside the natural range because of human influences (e.g., fire suppression in
fire adapted systems).
Establishing Thresholds. In order to effectively evaluate occurrences relative to each other,
overall ecological integrity ranks should establish a scale for distinguishing between “A”, “B”,
“C”, and “D” occurrences. This scale should usually spread from a lowermost limit (the “D” rank
or minimum occurrence threshold) up through the threshold for an “A” rank. In addition, the
threshold delineating occurrences with “fair” vs. “poor” viability or integrity must be identified.
Figure 6 illustrates the rank scale for “A”, “B”, “C”, and “D”-ranked occurrences.
al Systems of Latin America and the Caribbean Page 40
Figure 10 - Model of the A, B, C, and D Rank Scale
Figure 6. Rank scale for “A”, “B”, “C”, and “D”-ranked Occurrences
minimum C rank criteria(C rank threshold)
minimum EO criteria
* within the next 10-25 years, based on historic evidence and current status
minimum A rank criteria(A rank threshold)
criteria for best conceivablyachievable EOs in future*A
B
C
D
Ecological Systems of Latin America and the Caribbean Page 41
Perhaps most critical for development of occurrence rank criteria is the establishment of
the threshold between occurrence s with “fair” and “poor” viability or integrity (the minimum
“C” rank criteria). As mentioned above, this clarifies whether or not one has a potentially
restorable occurrence. Next the A-ranked criteria are established. Typically these are the best
occurrences that are reasonably and conceivably achievable; generally, these will be the
minimum “A” rank criteria unless the best reasonably achievable occurrences have only “fair” or
“poor” viability or integrity. Finally, assuming the best occurrences that are reasonably and
conceivably achievable are at or above the “A” rank threshold, one can identify minimum “B”
rank criteria that achieve a spread between “A” and “C”-ranked occurrences.
An occurrence rank need not always be directly comparable to historical conditions. For
example, some fire-adapted ecological systems historically supported fire on vast landscape
scales that could not be feasibly repeated today. But under controlled conditions, many effects of
those landscape scale fires could be reintroduced in smaller areas. These are the types of practical
considerations that are documented in occurrence rank criteria. Further details are provided in
NatureServe’s (2003) Element Occurrence Data Standards.
Future Applications We envision this project as a point of departure to develop comprehensive mapping and
continually updated databases on the nomenclature, distribution, ecological characteristics, and
conservation status of terrestrial ecological system types throughout the western hemisphere. As
stated previously, ecological classification may ideally proceed through several phases in a
continual process of refinement. These phases could include 1) literature review and synthesis of
current knowledge, 2) formulating initial hypotheses and tentatively describing each type, that
support 3) establishing a field sample design, 4) gathering of field data, 5) data analysis and
interpretation, 6) description of types, 7) establishing dichotomous keys to classification units, 8)
mapping of classification units, and 9) refinement of the classification.
As noted by Jennings et al. (2003) and others before, a vegetation association or community
represents a statistical and conceptual synthesis of floristic patterns. It can be a “useful
abstraction,” representing a defined range of floristic, structural, and environmental variability.
Ecological systems represent a similar kind of “useful abstraction” that encompasses the
concepts of multiple vegetation associations, and emphasizes the environmental attributes that
result in their co-occurrence on the ground. The definition of both associations and ecological
systems as individual types is the result of a set of classification decisions based on field

Ecological Systems of Latin America and the Caribbean Page 42
sampling, data analysis, and interpretation. What may begin as only an “abstraction” may
become a truly “useful abstraction” when informed individuals can readily recognize units on the
ground. Mapping ecological systems serves as an immediate practical test of classification
concepts, ensuring that the mapped area is treated comprehensively by the classification,
providing for a consistent use of multiple spatial data, and clearer distinctions between types.
We expect that further classification development will be a sustained process involving the
participation of in-country experts net-working with NatureServe and international and local
partner organizations to identify, map, and assess the condition of ecological systems
occurrences, where NatureServe serves de role of “keeper” of this classification of terrestrial
ecological systems.
Ecological Systems of Latin America and the Caribbean Page 43
References Albert, D. A. 1995. Regional Landscape Ecosystems of Michigan, Minnesota, And Wisconsin:
A Working Map and Classification. U.S. Forest Service General Technical Report NC-178. North Central Forest Experiment Station, St. Paul, Minnesota, USA 250 P.
Anderson, M., P. Comer, D. Grossman, C. Groves, K. Poiani, M. Reid, R. Schneider, B. Vickery,
& A. Weakley. 1999. Guidelines for Representing Ecological Communities in Ecoregional Plans. The Nature Conservancy. 71 pp.
Bailey, R.G.. 1996. Ecosystem Geography. Springer-Verlag New York Inc., New York. 204 P. ________. 1998. Ecoregion Map of North America: Explanatory Note. USDA Forest Service
Misc. Publication No. 1548. 10 P. + Map [Scale 1:15,000,000]. Barnes, B.V., D.R. Zak, S.R. Denton, and S.H. Spurr. 1998. Forest Ecology, Fourth Edition. John
Wiley And Sons, New York. 774 Pp. Beissinger, S.R., and M.I. Westphal. 1998. On the use of demographic models of population
viability in endangered species management. Journal of Wildlife Management 62(3):821-841.
Brinson, M. M. 1993. A Hydrogeomorphic Classification for Wetlands. Technical Report WRP-
DE-4, U.S. Army Engineer Waterways Experiment Station, Vicksburg, MS. NTIS No. AD A270 053.
Carroll, C., R.F. Noss, and P.C. Paquet. 2001. Carnivores as focal species for conservation
planning in the Rocky Mountain region. Ecological Applications 11(4):961-980. Cowardin, L. W., V. Carter, F.C. Golet, and E. T. LaRoe. 1979. Classification of wetlands and
deepwater habitats of the United States. Biological Service Program, U.S. Fish and Wildlife Service, FWS/OBS 79/31. Office of Biological Services, Fish and Wildlife Service, U.S. Department of Interior, Washington, D.C.
Delcourt H.R., and P.A. Delcourt. 1988. Quaternary Landscape Ecology: Relevant Scales in
Space and Time. Landscape Ecology 2:23-44. Devillers, P., J. Devillers-Terschuren, and J. P. Ledant. 1991. CORINE biotopes manual.
Habitats of the European Community. Data Specifications – Part 2. Luxembourg: Office for Official Publications of the European Communities.
Devillers, P. and J. Devillers-Terschuren. 1996. A Classification of South American Habitats.
Institute of Terrestrial Ecology and Institute Royale des Sciences Naturelles de Belgique. 419 Pp.
Di Gregorio, A. and J. M. Jansen. 2000. Land Cover Classification System (LCCS):
Classification Concepts and User Manual. Environment and Natural Resources Service, GCP/RAF/287/ITA Africover - East Africa Project And Soil Resources, Management And Conservation Service. 179 Pages, 28 Figures, 3 Tables and including CD-ROM. FAO, Rome.
Ecological Systems of Latin America and the Caribbean Page 44
Eva,, H. (JRC Ispra), E.E. de Miranda (EMBRAPA CNPM) C.M.Di Bella (INTA) V.Gond (CIRAD / UMR - ECOFOG) et al., 2002. A Vegetation map of South America, EUR 20159.EN, European Commission, Luxembourg.
Fleishman, E., R.B. Blair, and D.D. Murphy. 2001. Empirical validation of a method for
umbrella species selection. Ecological Applications 11(5):1489-1501. Frost, C.C. 1998. Pre-settlement Fire Frequency Regimes of the United States: A First
Approximation. Pages 70-81 IN: Pruden, T.L., And L.A. Brennan, Eds. 1998. Fire in Ecosystem Management: Shifting the Paradigm from Suppression to Prescription. Tall Timbers Fire Ecology Conference Proceedings, No.20. Tall Timbers Research Station, Tallahassee, FL.
Golley, F. B. 1993. History of the Ecosystem Concept in Ecology. Yale University Press, New
Haven, CT. 254 Pp. Griffith, G.E., J. M. Omernik, And S. H. Azevedo. 1998. Ecological Classification of the Western
Hemisphere. USGS EROS Data Center and EPA WED NHEERL, Corvallis, Oregon. 47 Pp. Grossman, D.H., D. Faber-Langendoen, A.W. Weakley, M. Anderson, P. Bourgeron, R.
Crawford, K. Goodin, S. Landaal, K. Metzler, K.D. Patterson, M. Pyne, M. Reid, And L. Sneddon. 1998. International Classification Of Ecological Communities: Terrestrial Vegetation Of The United States. Volume I: The National Vegetation Classification Standard. (Draft June 1997.) The Nature Conservancy, Arlington, VA. 92 Pp.
Groves, C.R., D.B. Jensen, L.L. Valutis, K.H. Redford, M.L. Shaffer, J.M. Scott, J.V.
Baumgartner, J.V. Higgins, M.W. Beck, and M.G. Anderson. 2002. Planning for biodiversity conservation: putting conservation science into practice. Bioscience 52:499-512.
Haufler, J.B., C.A. Mehl, and G.J. Roloff. 1996. Using a coarse filter approach with species
assessment for ecosystem management. The Wildlife Society Bulletin 24: 200-208. Hueck, K. And P. Seibert. 1972. Vegetationskarte von Sudamerika. Gustav Fisher Verlag,
Stuttgart. 71 Pp. Jenkins, R.E. 1976. Maintenance of natural diversity: approach and recommendations. pp 441-
451. In proceedings of the Forty-first North American Wildlife and Natural Resources Conference, Washington, D.C.
Jenkins, R.E. 1985. The identification, acquisition, and preservation of land as a species
conservation strategy. Pp. 129-145 In R.J. Hoage, ed. Animal Extinctions. Smithsonian Institution Press, Washington.
Jennings, M., O. Loucks, D. Glenn-Lewin, R. Peet, D. Faber-Langendoen, D. Grossman, A.
Damman, M. Barbour, R.Pfister, M. Walker, S.Talbot, J. Walker, G. Hartshorn, G.Waggoner, M. Abrams, Alison Hill, David Roberts, David Tart. 2003. Guidelines for Describing Associations and Alliances of The U.S. National Vegetation Classification. The Ecological Society Of America Vegetation Classification Panel, Version 2.0. March 28, 2003. 142 Pp.
Johnson, K.N., F. Swanson, M. Herring, and S. Greene. 1999. Bioregional assessments: Science
at the crossroads of management and policy. Island Press, Washington DC. 398 p.

Ecological Systems of Latin America and the Caribbean Page 45
Karr, J.R. and E.W. Chu. 1995. Ecological integrity: Reclaiming lost connections. pp. 34-48. In
L. Westra and J. Lemons (eds). Perspectives on Ecological Integrity. Kluwer Academic. Dordrecht, Netherlands.
Kimmins, J.P. 1997. Forest Ecology: A Foundation for Sustainable Management. Second
Edition. Prentice Hall, Upper Saddle River, New Jersey, USA. 596 pp. Kintsch, J.A. and D. L. Urban. 2002. Focal species, community representation, and physical
proxies as conservation strategies: a case study in the Amphibolite Mountains, North Carolina, U.S.A. Conservation Biology Vol. 16 No.4 pp. 936-947.
Kuchler, A.W. 1988. Ecological Vegetation Maps and Their Interpretation. In: A.W. Kuchler And
I.S. Zonneveld (Editors). Vegetation Mapping, pp. 469–480. Kluwer Academic Publishers. Boston, Massachusetts, USA.
Lambeck, R.J., 1997. Focal species: a multi-species umbrella for nature conservation.
Conservation Biology 11:849-856. Lincoln, R.J., G. A. Boxshall, and P.F. Clark. 1982. A dictionary of ecology, evolution, and
systematics. Cambridge University Press, New York, NY. 298 pp. Lindenmayer, D.B. and J.F. Franklin. 2002. Conserving forest biodiversity: A comprehensive
multiscaled approach. Island Press, Washington, DC. 351 pp. Mueller-Dombois, D. and H. Ellenberg. 1974. Aims and methods of vegetation ecology. John
Wiley, New York. Natural Resource Conservation Service (NRCS). 1998. Keys to Soil Taxonomy. Eighth Edition.
http://www.pedosphere.com/resources/sg_usa/ NatureServe. 2002. Element Occurrence Data Standards. NatureServe, Arlington, VA. 147 pp.
+ Appendices. NatureServe. 2003. International Vegetation Classification: Terrestrial Vegetation. NatureServe
Central Databases. Natureserve, Arlington, VA. Neely, B., P. Comer, C. Moritz, M. Lammert, R. Rondeau, C. Pague, G. Bell, H. Copeland, J.
Humke, S. Spackman, T. Schulz, D. Theobald, & L. Valutis. 2001. Southern Rocky Mountains Ecoregion: An Ecoregional Assessment and Conservation Blueprint. Prepared by The Nature Conservancy With Support From The US Forest Service, Rocky Mountain Region, Colorado Division Of Wildlife, And Bureau Of Land Management. 472 Pp.
Noss, R.F. and A.Y. Cooperrider. 1994. Saving Nature’s Legacy. Island Press, Washington D.C. Odum, E.P. 2001. Concept of Ecosystem. pp. 205-310. In: Levin, S. (Editor-In-Chief),
Encyclopedia of Biodiversity, Volume 2. Academic Press.
Olson, D. M, E. Dinerstein, E. D. Wikramanayake, N.D. Burgess, G.V.N. Powell, E.C. Underwood, J.A. D’Amico, I. Itoua, H.E. Strand, J.C. Morrison, C.J. Loukes, T.F. Allnutt, T.H. Ricketts, Y. Kura, J.F. Lamoreux, W.W. Wettengel, P.Hedao, and K.R. Kassem. 2001.
Ecological Systems of Latin America and the Caribbean Page 46
Terrestrial Ecoregions of the World: A New Map of Life on Earth. Bioscience Volume 51 Number 11 Pp. 933-938.
O’Neill, R.V. 2001. Is it Time to Bury the Ecosystem Concept? Ecology 82 (12): 3275-3284. Parrish, J.D., D. Braun, and R. Unnasch. 2003 draft. Are we conserving what we say we are?:
measuring ecological integrity in evaluations of protected area management effectiveness. (Draft paper)
Redford, K.H., P. Coppolillo, E.W. Sanderson, G.A.B. Da Fonseca, E. Dinerstein, C. Groves, G.
Mace, S. Maginnis, R.A. Mittermeier, R. Noss, D. Olson, J.G. Robinson, A. Vedder, And M. Wright. 2003. Mapping the Conservation Landscape. Conservation Biology 17: 116-131.
Rivas-Martinez, S. 1997. Syntaxonomical Synopsis of the Potential Natural Communities of
North America, I. Itinera Geobotanica 10: 5-148. Rodwell, J.S., J.H.J. Schaminee, L. Mucina, S. Pignatti, J. Dring, And D. Moss. 2002. The
Diversity of European Vegetation. An Overview of Phytosociological Alliances and their Relationships to EUNIS Habitats. Wageningen NL. EC-LNV. Report EC-LNV Nr. 2002/054.
Rowe, J.S. and B.V. Barnes. 1994. Geo-ecosystems and bio-ecosystems. Bulletin of the
Ecological Society of America 75 (1): 40-41. Scott, J.M., B. Csuti, J.D. Jacobi, and J.E. Estes. 1987. Species richness: a geographic approach to
protecting future biological diversity. Bioscience 37: 782-788. Scott, J.M., P.J. Heglund, M.L. Morrison (eds.). 2002. Predicting species occurrences: issues of
accuracy and scale. Island Press, Covelo, CA. 840 pp. Sukachev, V. 1945. Biogeocoenology and phytocoenology. Central Russia Academy of
Sciences, U.S.S.R 47:429-431. Takhtajan, A. 1986. Floristic Regions of the World. Transl. By T.J. Crovello And Ed. By A.
Cronquist. 522 Pp. Univ. California Press, Berkley. Tuhy, J., P. Comer, D. Dorfman, M. Lammert, B. Neely, L. Whitham, S. Silbert, G. Bell, J.
Humke, B. Baker, And B. Cholvin. 2002. A Conservation Assessment of the Colorado Plateau Ecoregion. The Nature Conservancy, Moab Project Office, Moab UT. 107 P. + Appendices.
UNESCO (United Nations Educational, Scientific, and Cultural Organization). 1973.
International Classification and Mapping of Vegetation. Series 6. Ecology and Conservation. United Nations, Paris, France.
Walter, H. 1985. Vegetation of the Earth and Ecological Systems of the Geo-Biosphere. 3rd
Edition. Springer-Verlag, New York. 318 P. Whittaker, R.H. 1975. Communities and ecosystems. Second edition. MacMillan, New York. Willis, K.J., and R.J. Whittaker. 2002. Species diversity – scale matters. Science 295:1245-
1248.

Ecological Systems of Latin America and the Caribbean Page 47
Young, T.F. and S. Sanzone (editors). 2002. A framework for assessing and reporting on
ecological condition. Prepared by the Ecological Reporting Panel, Ecological Processes and Effects Committee. EPA Science Advisory Board. Washington, DC. 142 p.