ecological study of the texas kangaroo rat
TRANSCRIPT

7
ECOLOGICAL STUDY OF THE TEXAS KANGAROO RAT
DIPODOMYS ELATOR
by
JIMMY DOSS ROBERTS, B.S.E.
A THESIS
IN
ZOOLOGY
Submltted to the Graduate Faculty of Texas Technological College
in Partial Fulfillment of the Requirements for
the Degree of
MASTER OF SCIENCE
Approved
Accepted
August, 1969

7>o^ T3
(iof>' -'^
ACKNOWLEDGMENTS
I am deeply indebted to Dr. Robert L. Packard for
his direction of this thesis and to my wife for her en-
couragement and assistance.
n

TABLE OF CONTENTS
ACKNOWLEDGMENTS ii
LIST OF TABLES iv
LIST OF ILLUSTRATIONS vi
CHAPTER
I. INTRODUCTION 1
II. MATERIALS AND METHODS 2
III. FINDINGS AND INTERPRETATIONS 15
IV. SUMMARY AND CONCLUSIONS 53
LITERATURE CITED 54
iii

LIST OF TABLES
TABLE
1. Summary of data obtained from live-trapping
four areas 16
2. Trap ranges of female Dipodomys elator 24
3. Trap ranges of male Dipodomys elator 26 4. Percentage of Dipodomys elator captured per
trapping effort on Grid 1 27
5. Percentage of Dipodomys elator captured per trapping effort on Grid II 27
6. Percentage of Dipodomys elator captured per trapping effort on Grid III. 28
7. Percentage of Dipodomys elator captured per trapping effort on Grid IV.... 28
8. Population of Dipodomys elator as estimated by Lincoln Index 30
9. Percentage of Perognathus merriami captured per trapping effort on Grid 1 40
10. Percentage of Perognathus merriami captured per trapping effort on Grid II 40
11. Percentage of Perognathus merriami captured per trapping effort on Grid III 41
12. Percentage of Perognathus merriami captured per trapping effort on Grid IV : 41
13. Percentage of Perognathus hispidus captured per trapping effort on Grid 1 42
14. Percentage of Perognathus hispidus captured per trapping effort on Grid lí 42
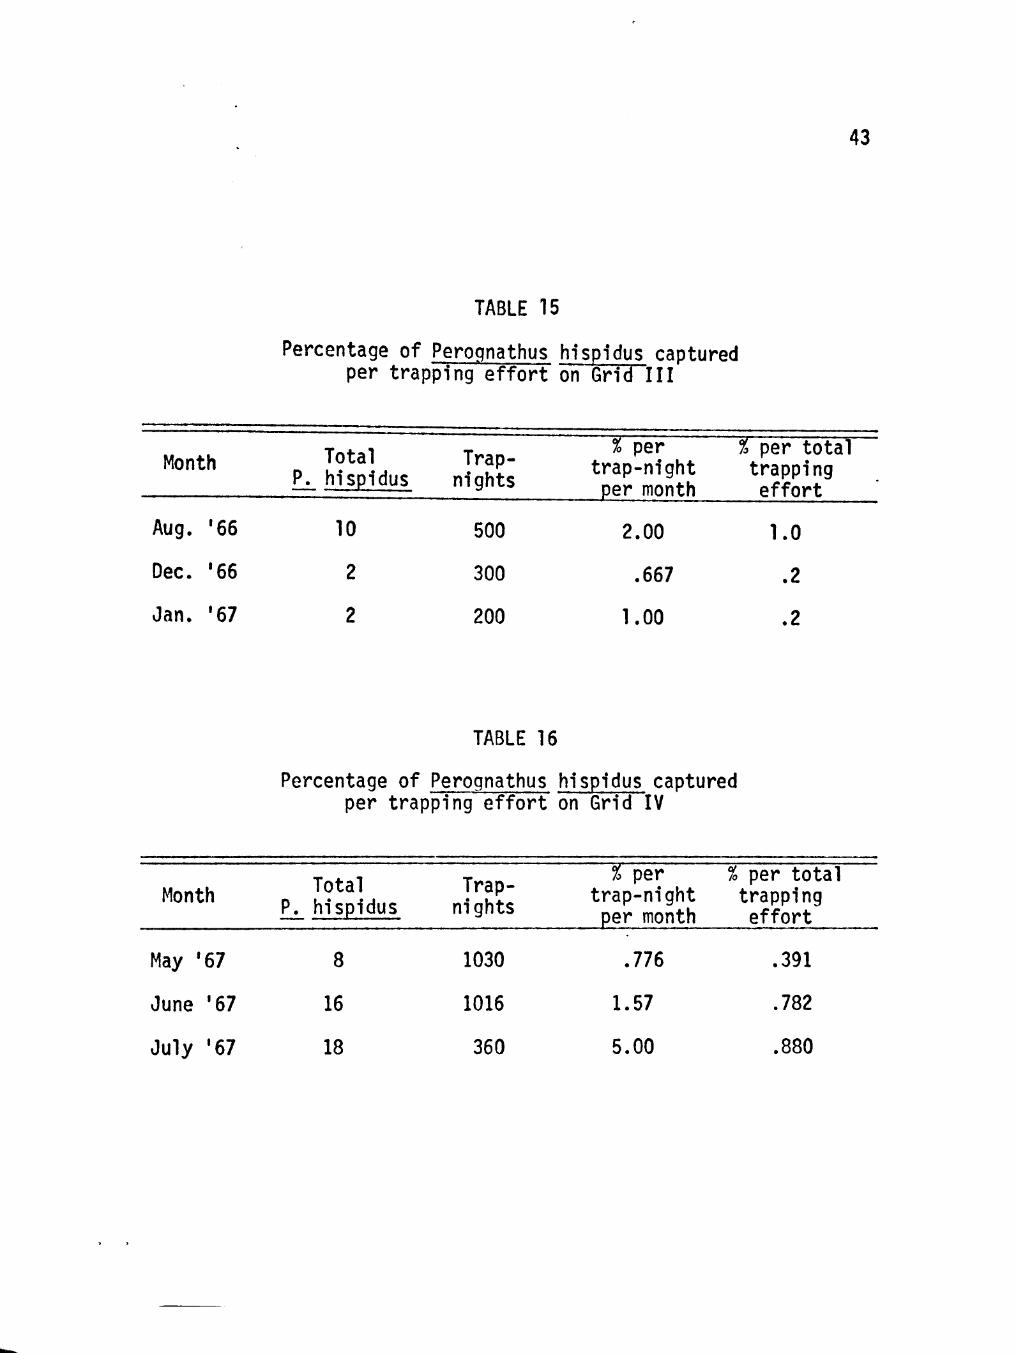
15. Percentage of Perognathus hispidus captured per trapping effort on Grid III 43
iv

List of Tables (continued)
16. Percentage of Perognathus hispidus captured per trapping effort on Grid IV 43
17. Record of nighttime observations of Dipodomys el ator 49

.IC
LIST OF ILLUSTRATIONS
FIGURE
1. Vegetational cover map of Grid 1 3
2. Variations of trapping areas on Grid 1 5
3. Vegetational cover map of Grid II 7
4. Vegetational cover map of Grid III 10
5. Vegetational cover map of Grid IV 12
6. Habitat of Dipodomys elator on Grid III 19
7. Open and plugged burrow openings of Dipodomys elator 21
8. Relative abundance and activity of species on Grid 1 32
9. Relative abundance and activity of species on Grid II 34
10. Relative abundance and activity of species on Grid III 36
11. Relative abundance and activity of species
on Grid IV 38
12. Dipodomys elator dusting and scratching area 46
13. Tracks and open burrow of Dipodomys elator in snow 50
vi

CHAPTER I
INTRODUCTION
The Texas kangaroo rat, Dipodomys eiator Merriam, has an ex-
tremely restricted geographic range, occuring in north-central Texas
in Clay, Wichita, Baylor, Wilbarger, Archer, and Foard counties. In
Oklahoma, D. elator was reported from Comanche County (Bailey, 1905);
a questionable record (see Dalquest, 1964, and Blair, 1954) has been
reported in Texas from Coryall County.
Published reports of D. elator are confined either to the re-
cording of sites of capture (Merriam, 1894; Bailey, 1905; Blair,
1949; Blair, 1954; Hedeen, 1953; Dalquest, 1968; Packard and Judd,
1968) or brief notes on the systematics (Grinnell, 1921; Davis, 1942;
Setzer, 1949; Lidicker, 1960). With the exception of cursory ob-
servations (Dalquest and Collier, 1964), no detailed ecological study
0"̂ 2i. elator has been made.
The purposes of this study were to determine: (1) types of
habitat; (2) trap range; (3) approximate population density;
(4) associated species of rodents; (5) predatorial species.
1

CHAPTER II
MATERIALS AND METHODS
Live-traps of the type described by Fitch (1950) were used.
This type of trap captured D. elator more effectively than snap traps
or Sherman live-traps. Traps were baited with either a chopped grain
mixture (milo, corn, and oats) or oatmeal. The chopped grain mix-
ture proved most successful and was used most of the time on the
areas of study. Non-absorbant cotton was used for nesting material
in the traps to reduce mortality in damp weather. Traps were set
25 feet apart in a grid. Four different areas known to be inhabited
^y 5JL e^ator were trapped.
Four variations of grid arrangements were used on one of the
areas (Grid I, see Figs. 1 and 2) located four miles northwest of .
lowa Park, Wichita County, Texas (now a part of the eastern edge of
Buffalo Creek Reservoir). Subarea I (1.37 acres) was trapped Decem-
ber 30, 1965, to January 3, 1966; subarea II (1.55 acres) was trapped
February 7, 1966, to March 11, 1966; subarea III (1.55 acres) was
trapped March 30, 1966, to Oune 12, 1966; and subarea IV (1.43 acres)
was trapped June 21, 1966 to August 1, 1966.
The second area covered .717 acre and possessed a man-made
terrace row in an abandoned field approximately one-half mile northwest
of Grid I (Grid II, see Fig. 3). A creek separated these two grid
sites. All burrov/s of D. elator on this grid were located in the
terrace itself. Two parallel rows of traps were placed 25 feet apart
on each side of the terrace with no traps set on the terrace. Grid II
S i W t <• npr

iimiiL ^ SJ- 'i'l M iÆt

FIGURE 1
Vegetational cover map of Grid I
O CP - mesquite trees - dense grass cover
- low area (standinq water after rain)
- boundaries of dirt road
- trap site
•• = 2 5 feet

4


FIGURE 2
Variations of trapping areas on Grid I
Subarea I
Subarea II
Subarea III
Subarea IV

• • k • '
•F 1
1
• •
• « • • • • • • • # • • . • « • • • • • • • • • • • • • • • • •
4 • • •
• • • . • • • • • • • • • • • • • • • • « • • • • • * • • • • •
»
5
"n 1
1
J


FIGURE 3
Vegetational cover map of Grid II
O^ - mesquite trees
- dense grass cover
- boundaries of terrace
row
- trap site
^ = 2 5 feet
•Ø''

8
Oc^ iO
c^
C'
'0 '
o> .0
Q

had little grass cover. A few mesquite trees (Prosopis glandulosa
Torrey) were located south of the terrace, but no burrov/s were found
there.
Grid III, comprising 1.43 acres approximately one-half mile
northwest of Grid II, was on land that sloped gently from east to
v/est with scattered mesquite trees. Dense grass was located near
a small water reservoir at the western edge of the grid. This marked
the boundary of the apparent activity of the kangaroo rats. This
grid consisted of ten rows of ten traps each (see Fig. 4).
The fourth area (Grid IV, see Fig. 5) was located on the Goetze
farm approximately seven miles northwest of lowa Park, Texas. The
area occupies 1.43 acres in a pasture approximately 200 yards from
a dwelling. The area had sparse grass cover, and scattered mesquite
trees were present.
All D. elator live-trapped on all four areas were toe-clipped,
weighed, sexed, and released. Males were checked for extended scrotal
sacs, and females were checked for crusty vaginal areas to indicate
breeding condition. Other kinds of rodents were toe-clipped and re-
leased. Residents were determined using McCarley's (1958) method
(a resident is a mouse captured two or more times, but if captured
only twice, at least one capture must be in a nonperimeter trap site).
Live-traps were set for a total of 1476 trap-nights in ten
different areas solely to determine the presence or absence of
D. elator. These areas v/ere located in Wiohita, Wilbarger, and Foard
counties. Most trapping was done near little-used dirt roads in

10
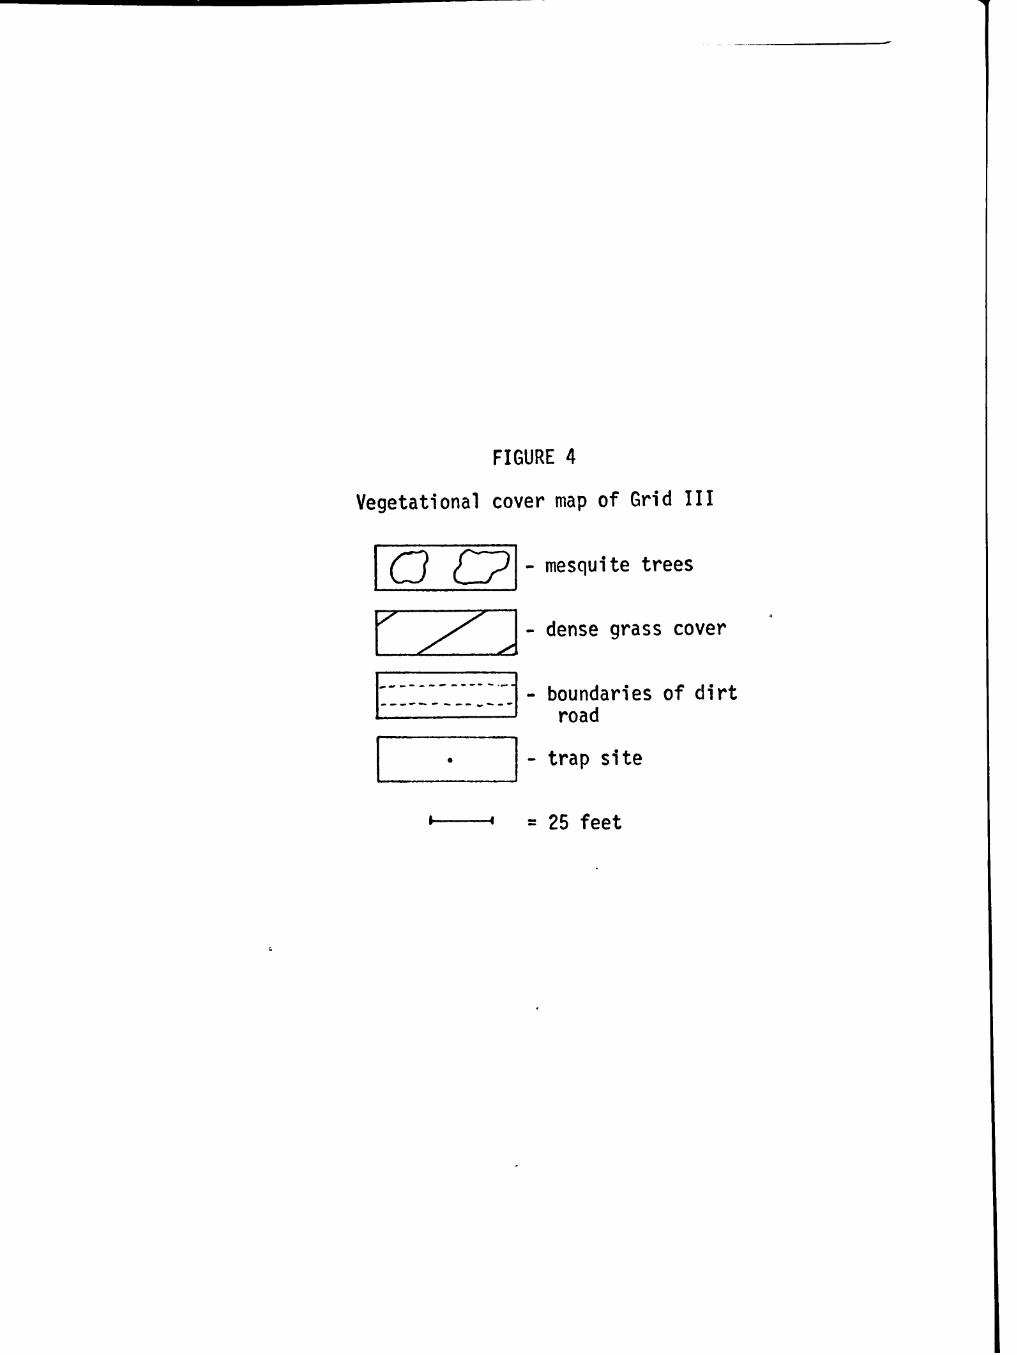
FIGURE 4
Vegetational cover map of Grid III
O CP
.
1 1
- mesquite trees
- dense grass cover
- boundaries of dirt road
- trap site
< = 25 feet

11

12

FIGURE 5
Vegetational cover map of Grid IV
- mesquite trees
- dense grass cover
- boundaries of abandoned dirt road
- trap site
* = 25 feet
O CP
.
y 1

í' -
13
Oo n .0\
0 oa o Q
CP-CP
•Oû (? a
' ^ ;
^
• o
4
o
• ^ , o o
l íu 1111111111111111111
i i i i m i i i i i i i i i m i í i ' n i i í r i í í i M i i i i
:« I I ' I I I I 1 I ' I I I I ' I I I I 1
lllllllllllllllllll
i í t | i i | í i i i i r " i! 11 11
I lî! lllllll!
1

14
areas sparsely vegetated. Live-trapping was supplemented by nighttime
driving to locate and observe D. elator.
Habitat occupied by D. elator was characterized by sparse
vegetation and proved unique enough to permit visual recognition. A
large part of the northwestern portion of Wichita County was surveyed
for the presence of suitable habitat for D. elator. Because much of
this area is inaccessible by road, a small motorcycle was used to
make this survey.
IhMilri..
iiiiii

CHAPTER III
FINDINGS AND INTERPRETATIONS
In fifteen months of study, fifty D. elator were marked and
recaptured 233 times (see Table 1); 52% of them were captured four
times or more. One male was recaptured 19 times in three months.
A female was recaptured 12 times. Grid I, trapped 4418 trap-nights,
provided the most data in numbers of recaptures, trap range, and e
distances between captures of individuals.
D. elator burrows were found in small isolated areas of clay
loam soil with scattered mesquite trees. The ground was relatively
barren of grass cover; dense grass cover seemed to delimit the burrow
systems and activity of the kangaroo rats. The results of trapping
similar areas, but with rocky soil, produced only a single D. elator. ; l
No D. elator burrows could be found in the area, suggesting that 3 _ _ _ _ _ _ _ _ _ ^
this animal was not resident to this area. No burrov/s v/ere found in \ rocky substrates.
Dalquest and Collier (1964) noted the lack of D. elator in
sandy areas. Efforts to locate D. elator in the sandy bed of the Red
River in the northern part of Wichita County were unsuccessful, al-
though populations exist nearby. Near the lowa Park Lake, D. elator
was found living in sand. This area is covered by a subsoil sand
from which the topsoil v/as removed in the construction of the lake.
This, to my knowledge, is the only known instance of D. elator living
in sand.
Man-made habitats such as terraces, road grades, and dozed earth
15

16
TABLE 1
Summary of data obtained from live-trapping four areas i'i
GRID I
Total trap-nights ^
Total captures
Dipodomys elator
Total captures
Females
Males
Total individuals
Total per acre
Residents per acre
Total individuals:
Peroqnathus hispidus
Peroqnathus merriami
Siqmodon hispidus
Peromyscus spp.
Reithrodontomys sp.
Neotoma sp.
\m 501
"
107
8
n 23
8.5
5.5
22
17
13
41
10
5
GRID II
856
196
54
2
8
10
14
10
20
11
0
15
4
0
GRID III
1000
82
20
2
3
7
4.9
3.5
12
10
3
6
4
0
GRID IV 1
2046
173
52
3
7
10
7
6.3
31
14
6
9
0
1
TOTAL
8320
952
233
15
29
50
85
52
22
71
18
6

17
are seemingly preferred by D. elator. It was found present around
the edges of fields with burrows in the loosened soil and where the
construction and grading of dirt roads produced loose dirt at the
shoulders of the roads. In all instances studied, D. elator dis-
tribution was arranged in a linear pattern along a road or field edge
unless adjacent areas were essentially barren of plant cover.
Animals trapped in these areas with D. elator were: Peromyscus
spp., Reithrodontomys spp., Neotoma sp., Sigmodon hispidus,
Perognathus hispidus, and Perognathus merriami. Sigmodon hispidus x
and D. elator may encounter one another occasionally, but high , i
grass seems to serve as an effective ecological boundary betv/een i
them. My observations suggest it is rare for either to encroach l
upon the habitat of the other. D. elator never went into the grass ] 3
unless frightened or surprised, and even then the animal left the (
grass quickly for the barren area. S. hispidus showed a clear pre-
ference for dense grass.
Presence of droppings, dens, and tracks on the study areas and
sight observations revealed the presence of: coyote (Canis latrans),
striped skunk (Mephitis mephitis), cottontail rabbit (Sylviligus sp.),
rattlesnakes (Crotalus spp.), thirteen-lined ground squirrel
(Citellus tridecemlineatus), coachwhip snake (Masticophis flagellum),
racer (Coluber constrictor), ornate box turtle (Terrapene ornata),
horned lizard (Phyrnosoma cornutum), and six-lined racerunner
(Cnemidophorous sexlineatus).
D. elator lives in a clay loam soil v/ith burrows either under
'''''''

18
a mesquite tree or a mound of dirt (see Fig. 6). No burrows were
found under flat barren ground. Burrow systems in firm soil were
approximately eighteen inches deep in most cases, and were complex
with many interwoven tunnels, some of which were only one inch below
a tunnel above. Burrows in the sandy area of the lowa Park Lake were
less complex and tunnels were not as closely interwoven. In the sides
of tunnels were scattered food-storage caches filled with grass and
seeds. Caches for other Dipodomys spp. are mentioned by Culbertson
(D. nitratoides, 1946), Hawbecker (D. venustus, 1940), Reynolds ><
(D. merriami, 1958), and Tappe (D. heermanni, 1941). A nest was n H
found in each burrow close to the bottom of the complex of tunnels. 'J c
Burrows opened in several directions from each system and were two ; j
to four inches in diameter. They were usually left open although 3
plugged burrow-openings were observed (see Fig. 7). Closed tunnels t
inside burrow systems were found. One individual ran into an opening
of a burrow complex after being released, reappeared at another
opening, exited, and dug out still another opening previously filled
with loose dirt. This burrow opening v\fas plugged within seconds after entry.
Carpenter (1966) and Schmidt-Nielsen (1950) cite the burrow
as being important in reducing evaporative losses by providing a cool
atmosphere of relatively high moisture content. The highest temper-
ature recorded in a D. elator burrow was 95° F. Similar temperatures
were found in burrows of D. aqilis and D. merriami by Carpenter (1966).
Burrow temperatures were found to vary little in comparison to out-

19
1 , í 1 1 1 t
; • , j • ^
1 • ')/ í
r

FIGURE 6
Habitat of Dipodomys elator on Grid III. Burrow openings are visible under the mes-quite tree and in the mound behind the tree

20
r

21
^t|yy^^yyiiíiyí!^t|yy^^yyiiíiyí!^t|yy^^yyiiíiyí!^t|yy^^yyiiíiyí!^t|yyiyyíiuiíi:
s ' jHnHijliÍJHnHijliÍJHnHijliÍJHnHijliÍJHni
i i i i i ••••••• i i i i i ••••••• i i i i i ••••••• i i i i i ••••••• i i i i j
i i i i i inHniiiii inHniiiii inHjjjii i i i i i 11 (' i 1 (' i '." i i i i i i '." i i i i i i "'
I . . . i i i i i i i i i ! ; ! i i ; i i i i i i ! ; ! i i ; i i i i i i ! ; ! i i ; i i i i i i ! ; ! i i ; i i i i i i i i ! ! i i i i i i i i i i i i i i i i î i i i i i i i i i i i î i i i i i i i i i i i î i i i i i i i i i i i î i i i i i i i i ii iiiiiiiiiiii!niiiiiiiii!niiiiiiiii!niiiiiiiii!niiiiiiiini
í Í imii i i i i i i i i i i i i i i i i i i i i i i i i i i i i i i i i i i i i i i i i i i i i i i i i i i
l î i i i i i i i i i i i i i i i i i i i i i i i i i i i i i i i i i i i i i i i i i i i i i i i i i i i i i i i i i i
2,iLa222^La222^La222^La222^La222^La222^La

FIGURE 7
Open and plugged burrow openings of Dipodomys elator.

22
'̂,' ii
iA.Í^ ... •m^^k
' » . j ^ ) ^
^^ '^
*m
\P
*
I

23
side temperatures. The probe of a Tempscribe v/as placed approxi-
mately 24 inches inside a burrow at an estimated depth of 7 inches
below the surface of the soil May 2-8, 1967. The temperature of the
burrow varied only 5° (60-65° F.) during the week whereas the outside
temperature varied 52° (45-97° F.). Similar comparisons in which
the probe was placed approximately 18 inches inside the burrow opening
of another system yielded larger variations - as much as 25° F. during
a week. Outside temperatures near this burrow opening varied as much
as 50° F. 1 ><
My observations indicate that some individuals have a larger n
home range than v/as revealed by trap ranges. Stickel (1954), Blair :J >•
(1941), Hayne (1949, 1950), and Burt (1943) discuss the uncertainty I
concerning the determination of home range. Hayne (1950) found a J
positive relationship between apparent size of home range and the 3 V
distance used between traps with Microtus. On several occasions an
animal, when released, ran outside the trap range to a burrow opening,
passing several other burrow openings on the way. My observations
suggest that D. elator ranges throughout suitable habitat, but this
is quite restricted.
The average trap range for both sexes of D^ elator captured
four or more times was .20 acre. Males used in the determination of
the trap ranges averaged 8.1 captures each whereas females averaged
7.1 captures each.
The largest trap range for any individual was a female with
.49 acre (see Table 2). The largest trap range for a male was .45

24
TABLE 2
Trap ranges of female Dipodomys elator.
Grid
I
I
I
I
I
AVERAGE
II
II
AVERAGE
III
III
AVERAGE
IV
AVERAGE
FINAL AVERAGE
Range in acres
.11
.34
.07
.49
-43
.29
.14
.09
.12
.07
.11
.09
.11
.11
.20
Times captured
7
11
5
12
11
9.1
4
6
5
5
4
4.5
6
6
7.1
Max. distance between caotures
105
175
55
356
305
199
150
90
120
75
90
83
92.5
92.5
149
H 1

25
acre (see Table 3). Both of these individuals were captured on Grid
I where the average trap ranges were .26 acre for males and .29 acre
for females. A U trap ranges were calculated using the inclusive
boundary strip method described by Blair (1940).
Abandoned dirt roads barren of grass v/ere on three of the grids.
Trap ranges near these roads had a more linear pattern than other
trap ranges. None of the trap ranges encompassed a sizable mesquite
clump or a stand of heavy grass, and they coincided roughly v/ith
the shape of the barren areas. Trap ranges on Grid II were the small- >< • >
est (see Fig. 3). Because burrows were located in the terrace row J
in the middle of the grid, size of trap range may have been restrict- j
ed. Burrows were scattered on the other three grids. Small size " 1
of trap range on Grid III may have resulted from small samples size. J
In trapping areas, most D. elator were erratic in their pattern ^
of movement when released but did not leave the vicinity of the trap
range. The maximum distance traveled between traps by a male was
285 feet (see Table 3), whereas two females moved 305 and 356 feet
(see Table 2). Kangaroo rats traveled over 1000 feet in some cases
on roads. Roads and terraces seemingly facilitate the route of
movement selected by D. elator.
Populations of D. elator were seemingly highar in mid-winter
and late spring (see Tables 4-7). A decline in density in July was
indicated by trapping records. This decline could have resulted from
seasonal bait acceptance (see Fitch, 1958;. This is further supported

26
TABLE 3
Trap ranges of male Dipodomys elator.
Grid Range in acres
Times captured
Max. distance between captures
I
I
I
I
I
AVERA6E
II
II
II
II
II
AVERA6E
III
AVERA6E
IV
IV
IV
IV
AVERA6E
FINAL AVERA6E
.16
.14
.45
.43
.11
.26
.04
.13
.24
.10
.12
.13
.10
.10
.35
.29
.12
.33
.27
.20
6
5
19
8
5
8.6
4
7
16
4
7
7.6
4
4
14
6
11
6
9.3
8.1
135
135
285
275
95
185
55
112
127
70
75
88
102
102
200
231
94
178
176
145
•4
n
I j
w
l l l

27
TABLE 4
Percentage of Dipodomys elator captured
Month
Dec. '65
Jan. '66
Feb. '66
March '66
April '66
May '66
June '66
July '66
August '66
per trapping effort
Total D. elator
6
6
5
8
6
2
9
5
1
Trap-nights
168
288
384
813
525
210
1230
700
100
on Grid I
% per trap-night per month
3.57
2.08
1.30
.985
1.14
.954
.733
.715
1.00
% per total trapping effort
.136
.136
.113
.181
.136
.0453
.204
.113
.0226
•H 1
•<
» )
A 1 i
TABLE 5
Percentage of Dipodomys elator captured per trapping effort on Grid II
Month
March '66
April '66
May '66
June '66
Total D. elator
7
18
5
Trap-nights
216
240
160
240
% per trap-niqhl per month
4.17
2.92
11.3
2.80
j per total trapping • effort
1.05
.818
2.15
.584

28
TABLE 6
Percentage of Dipodomys elator captured per trapping effort on Grid III
Month
Aug. '66
Dec. '66
Jan. '67
Total D. elator
2
4
4
Trap-nights
500
300
200
% per trap-night per month
0.40
L33
2.00
% per total trapping effort
.20
.40
.40
H
•<
»
1 i
TABLE 7
Percentage of Dipodomys elator captured per trappmg effort on Grid IV
Month
May '67
June '67
July '67
Total D. elator
6
9
Trap-nights
1030
1016
360
% per % per total trap-night trapping per month effort
.582
.886
.293
.440

29
by observations of activity made by nighttime driving. There was
continued use of burrows, run-ways, and scratching sites on the grids
in the summer. Captures of other rodents also decreased as avail-
ability of new vegetation increased.
High mortality of D. elator in traps may have influenced the
population data obtained in the winter and early spring. Although
nesting material of cotton and grass was provided in the traps, it
proved inadequate in subfreezing temperatures. In cold v/eather, it
was necessary to check traps twice a niqht to prevent casualties. T
<
Temperatures of 40-70° F. with moist conditions proved fatal to the i . . . i
rats if they were caught early in the night. ' m
D. elator entered both closed and open unbaited traps. This I
occasionally resulted in the death of animals, particularly between [
trapping periods. i
It seems unlikely the total population of rats on the areas of
study are represented in the trapping results. Dice (1931) and
Murray (1957) discuss the bias introduced by trapping grids and
encourage the use of combinations of population sampling techniques.
On each grid, active burrows were observed that released rats never
entered. The total population, therefore, was estimated to be slight-
ly greater than the total number of residents captured on a given
area (see Table 1). Use of the Lincoln Index provided an estimate of
the numbers of D. elator on the four grids (see Table 8). This number
proved slightly less than the calculated number of residents.
Perognathus hispidus and P_̂ merriami were caught on the same

30
TABLE 8
Population of Dipodomys elator as estimated by Lincoln Index
Month Grid I Grid II Grid III Grid IV
December, 1965
January, 1966
February, 1966
March, 1966
April, 1966
May, 1966
June, 1966
July, 1966
August, 1966
December, 1966
January, 1967
May, 1967
June, 1967
4.0
2.7
3.5
6.2
6.0
6.0
6.5
9.6
8.0
7.8
6.8
7.0
7.0
2.0
2.5
3.0
5.1
7.3
1 <
1
Average 5.8 7.2 2.5 6.2
11111III

H
31
areas and seemed to be limited to a similar habitat as D. elator.
Relatively large numbers of Peromyscus spp. were caught, but they did
not appear to be identified as closely with the habitat of D. elator
as P. hispidus and P. merriami. Trap ranges of these four species
overlapped considerably. The relative abundance of the four species
and their relative activity as expressed by captures is represented
in Figures 8-11.
P. merriami may have been hibernating during the colder months
(see Tables 9-12). It did not appear on Grid I until the temperature <
low reached 58° F. in March. The only time this species was captured J
in winter months was on a relatively v/arm night (low of 45° F.) on
Grid III. As it became warmer, the number of P. merriami trapped in- '
creased markedly until a population peak was reached in August. '
P. hispidus was also more abundant in the warmer months and ;
remained sporadically active in colder months (see Tables 13-16).
This species was trapped each month on all four grids. The population
reached a peak in the summer.
The data suggest no well defined breeding periods for D. elator.
More females were found in breeding condition in March than any other
month, although some were lactating in each month trapped from late
December to May. Some males, judging from extended scrotal sacs,
were reproductively active throughout the study. Scrotal sacs were
subject to extension and retraction within a 24 hour cycle. In some
cases, only one testis would be distended.
A nest containing four young D. elator v/as discovered in digging

32
í V

-^MHMMMbH
u
FI6URE 8
6RID I
Relative abundance of species expressed as a percent of total individuals captured each month.
f r.
CJ: X > z <
Dipodomys elator ~ Peirognath'us hispidus -
Peroqnathus merriami Peromyscus spp.
3
Relative activity of species expressed as a percent of total captures.
í«r

33
Dec. Jan. Feb. March '65 '66 '66 '66
April May June •66 '66 '66
J u 1 y A u g . '66 '66
-t 1 <
1
Dec. Jan. Feb. March April May June July Aug. '65 '66 '66 '66 '66 '66 '66 '66 '66

34

n t I
f r
FI6URE 9
6RID II
!! I ! i tt I I I !! I ! !
1 1 1 ! M I ! i ! ; t
• í.
Relative abundance of species expressed as a percent of total individuals captured each month.
h
' 'f %
r.
c
'.'• Rí
1 1 V , ! •! •! í
i 1 1 1 ..'-•í'. .'-•í'. .'y. .'y.
'Í^ *̂ *̂ ̂*
t i i i k t t t
Dipodomys elator Peroqnathus merriami Perognath'us hispidus Peromyscus spp.
Relative activity of species expressed as a percent of total captures.
a » » »
f '^ '^ '^
t t; t; t; \ \ \ \ u t t t

35
60 1
March April May June '66 '66 '66 '66
60 "
50 -
40 -
30 "
20 -
10 •
\
\
\ \-, • >
y/ V
March •66
\ *
\
\
April •66
• •
/
May •66
/
/
June •66
% •
\ f •
I
i * k í
r i \
!ll! * • * . ' -
î \ \'
• > • • >
•» f • •
ÍM

36
i

FIGURE 10
GRID III
Relative abundance of species expressed as a percent of total individuals captured each month
Dipodomys elator Perognathus merriami Perognathus hispidus Peromyscus spp.
Relative activity of species expressed as a percent of total captures.

37
50
40
30
20
10
\
• \
\
/ /
/ ^ \ « ' '. . • •
• ••
\
>
Aug. Dec. Jan •66 '66 '67
Aug. Dec. Jan, •66 '66 '67

38

>«'
FIGURE 11
GRID IV
Relative abundance of species expressed as a percent of total indiYiduals captured each month.
m
l a î r*
Dipodomys elator Perognathus hispidus
Perognathus merriami Peromyscus spp.
Relative activity of species expressed as a percent of total captures.

39
60-
50-
40"
30-
20-
10"
•
•
1
•
•
* *
• •
\ •
May June July •67 '67 «67
• 1
I 1 * í í
1 i ( j i
6 0 -
5 0 -
4 0 -
3 0 -
2 0 -
10 •
\
X
-s
May •67
• •
\ .
- i <
C\ June
•67
• • • •
p
\
July •67

40
TABLE 9
Percentage of Perognathus merriami captured per trapping effort on Grid I
Month Total P. merriami
Trap-nights
% per trap-night per month
% per total trapping effort
Dec. '65
Jan. '66
Feb. '66
March '66
April '66
May '66
June '66
July •̂ ^
August '66
0
0
0
4
5
4
10
12
5
Percentage
168
288
384
813
525
210
1230
700
100
TABLE 10
.492
.952
1.90
.813
1.72
5.00
of Perognathus merriami ca ptured
.0905
.113
.0905
.227
.273
.113
per trapping effort on Grid II
Month Total P. merriami
Trap-nights
March '66
April •̂ ^
May '66
June '66
3
7
4
10
216
240
260
240
% per trap-night per month
% per total trapping pffnrt.
1.39
2.91
2.50
416
.350
.819
-467
1.17

41
TABLE 11
Percentage of Perognathus merriami captured per trapping effort on Grid III
Month
Aug. '66
Dec. '66
Jan. '67
Total D. elator
12
0
1
Trap-nights
500
300
200
% per trap-night per month
%per total trapping effort
2.40
.50
1.20
.10
TABLE 12
Percentage of Perognathus merriami captured per trapping effort on Grid IV
Month
May '67
June '67
July '67
Total D. elator
8
7
10
Trap-nights
1030
1016
360
% per
.776
.688
2i78
% per total trap-night trapping per month effort
.391
.342
.489

42
TABLE 13
Percentage of Perognathus hispidus captured
Month
Dec. '65
Jan. '66
Feb. '66
March '66
April '66
May '66
Jine '66
July '66
August '66
Month
March '66
April '66
May '66
June '66
per trapping effort
Total P. hispidus
9
12
2
Trap-nights
168
288
384
813
525
210
1230
700
100
TABLE 14
Percentage of Perognathus h per trapping effort
Total P. hispidus
5
9
7
7
Trap-nights
216
240
160
240
on Grid I
% per trap-night per month
.596
.347
.261
.123
.763
.476
.732
1.72
2.00
% per total trapping effort
.0227
.0227
.0227
.0227
.0906
.0227
.204
.273
.0454
ispidus captured on Grid II
% per trap-night per month
2.31
3.75
4.37
2.92
% per total trapping effort
.584
1.05
.816
.816
43
TABLE 15
Percentage of Perognathus hispidus captured per trapping effort on Grid III
Month
Aug. '66
Dec. '66
Jan. '67
Total Trap-P. hispidus nights
10
2
2
500
300
200
% per trap-night per month
2.00
.667
1.00
% per total trapping effort
1.0
.2
.2
TABLE 16
Percentage of Perognathus hispidus captured per trapping effort on Grid IV
Month Total P. hispidus
Trap-nights
% per trap-night per month
% per total trapping effort
May '67
June '67
July '67
8
16
18
1030
1016
360
.776
1.57
5.00
.391
.782
.880

44
up a burrov/ system in late January, 1966. These nestlings were naked
and blind. The assumed mother v/as live-trapped, and nesting material
v/as later provided in a cage in the laboratory. Efforts v/ere made
not to disturb the female and her young. She appeared to make some
attempts to care for the young, but they died within tv/o days. The
female ate one nestling.
A male and a female D. elator, each v/eighing 19 grams, were
captured in June, 1967. These v/ere the youngest individuals caught
in traps. The male was unstable in his movement after being released.
The female, estimated to be of the same litter, was more adept at
running. If the development of D. elator is similar to that of
D. merriami and D. nitratoides (Eisenberg and Isaac, 1963), these
individuals were weaned near the time of capture and were 18-20
days old. This assumption is supported by their weight, physical
appearance, and level of coordination in movement.
A young male on Grid II underwent the greatest weight-gain
during the study. He v/as captured 16 times betv/een March 14, 1966,
and June 11, 1966, and his weight increased from 30 to 64 grams.
Another male on Grid IV gained 33 grams over a period of 36 days,
whereas a male on Grid I was observed to gain only 23 grams over a
period of four months.
D. elator burrow systems seemed less dispersed than those of
D. ordii and D. mcrriami in other areas. The close proximity of
the burrow systems seems to be necessitated by the small areas suit-
able for habitat rather than any possible social affinities.

45
D. elator. when released, seemed to recognize certain burrov/s and
enter only its suspected home burrow. This behavior was modified,
however, v/hen the animals were pursued by the investigator. In cer-
tain cases released animals would enter a burrow only briefly, then
move to the assumed home burrow. Two adults were rarely observed to
enter the same burrow, although in tv/o instances young D. elator may
have occupied the sama burrow system.
Distances between burrow systems were inconsistant. Separate
burrow systems belonging to D. elator were found as close as fifteen
feet apart on Grid I. On Grid II, the burrow systems were close
together on the terrace row and individual systems could not be dis-
tinguished without digging them.
Tv/o or more D. elator were never observed together and no mul-
tiple captures were recorded. On two occasions, D. elator v/as found
in a trap with a Peromyscus sp. Attempts to keep D. elator together
in cages proved unsuccessful. On tv/o occasions when pairs were
placed in the same cage, the male died within a week. The female
was observed to harass the male by nipping him about the body. Of
approximately 90 individuals handled, only one D. elator (a juvenile)
ever attempted to bite me.
Scratching and dusting places were numerous on the trapping
areas. They were found in barren areas and seemed to be used con-
sistently judging from the prevelance of loose, powdery dust (see
Fig. 12). Footprints, tail-drag marks, and scratched imprints of
toenails could be distinguished. Trails and runways v;ere not

46
:l

^^^^i^jujttímasåai
a i
i
FIGURE 12
Dipodomys elator dusting and scratching area.

47

48
conspicuous because of the barren type of habitat. In more abundant
vegetation, however, definite runways could be distinguished. These
did not have the tunnel-appearance of those of Sigmodon hispidus.
D^elator v/as observed active in weather ranging from hot to
cold, windy to calm, and wet to dry; they were also observed in moon-
light and darkness. They were most active two to three hours after
darkness (see Table 17). Although it is generally unusual to find
kangaroo rats foraging in the moonlight, six individuals were observed
on or near a road v/ithin a distance of 1.5 miles in bright moonlight
on December 29, 1965. Chew and Butterworth (1964) noted that a full
moon did not seem to deter captures of D. merriami. Captures of
D. elator were made during the coldest times of the year (see Tables
4-7), and tracks and open burrows v/ere observed with four inches of
snow on the ground in 1966 (see Fig. 13).
D. elator is capable of producing a thumping noise similar to
that described by Eisenberg (1963) for four species of Dipodomys.
A few rapid thumps were heard within seconds after the entry of a
single D. elator into a burrow. This thumping was repeated after
a short time, and then scratching sounds could be heard from within
the system. Other than thumping, the only noise produced by kangaroo
rats in this study was the constant squealing of one young (24 gram)
male v/hen I markcd him. No explanation could be given for this
squealing behavior other than possible fright. He continued squealing
after being released.
According to Bailey (1905), Professor D. E. Lantz noted a

49
TABLE 17
Record of nighttime observations of D. elator
Time
Sundown
Sundown - 10 pm
10 pm - midnight
Midnight - 2 am
Hours driven
20
10
12
6
D. elator ôFserved
2
7
42
14
D. elator per hour
.10
J
3.5
2.34

50

IM'BS
FI6URE 13
Tracks and open burrow of Dipodomys elator in snow.
4. .i,.

51

52
preference of D. elator for the vicinity of "houses, outbuildings,
and caves made for storing vegetables." The closest to human dwellings
recorded for D. elator was 200 yards. Residents of this dwelling said
that a number of years ago some kangaroo rats had taken up residence
under a cattle loading ramp adjacent to a barn, and approximately
50 yards from the house. No long-time resident could remember the
rats being closer to a dwelling.

CHAPTER IV
SUW1ARY AND CONCLUSIONS
An ecological study of Dipodomys elator was conducted from
September, 1965, to July, 1967, in Wilbarger and Wichita counties,
Texas. Principal study areas v/ere 5 to 10 miles northwest of lowa
Park, Texas. A total of 9,796 trap-nights revealed: (1) habitat of
D. elator consists of a clay loam soil in areas sparsely covered with
grass; (2) distribution and migration of D. elator has been facil-
itated by the building of roads and terrace rows by humans; (3) bur-
row systems were complex with a number of plugged and open entrahces;
(4) trap ranges for 15 males and 9 females averaged .20 acre for each
sex although observations made v/hile driving and trailing suggest
a larger home range; (5) populations of D. elator were estimated to
be from 4 to 11 per acre on the four areas of study; (6) D. elator
had higher trap-mortality due to adverse v/eather conditions than
other rodents captured on the same areas; (7) observations indicate
females may breed as early as December and as late as April, and some
males were in breeding condition each month of the study; (8) al-
though burrow systems v/ere found close together, D. elator appears
to be a solitary animal except at times of breeding.
53

LITERATURE CITED
Bailey, Vernon. 1905. Biological survey of Texas. N. Amer. Fauna, 25:1-222.
Blair, W. F. 1940. Home ranges and populations of the meadow vole in southern Michigan. J. Wildl. Manage., 4:149-161.
Blair, W. F. 1941. Techniques for the study of mammal populations. J. Mammal., 22:148-157.
Blair, W. F. 1949. Extensions of the known ranges of three species of Texas mammals. J. Mammal., 30:201-202.
Blair, W. F. 1954. Mammals of the mesquite plains biotic district in Texas and Oklahoma and speciation in the central grasslands. Texas J. Sci., 3:248.
Burt, W. H. 1943. Territoriality and home range concepts as applied to mammals. J. Mammal., 24:346-352.
Carpenter, R. E. 1966. A comparison of thermoregulation and v/ater metabolism in the kangaroo rats D. agilis and D. merriami. Univ. California Press, Berkeley, 36 pages.
Chew, R. M. and B. B. Butterworth. 1964. Ecology of rodents. J. Mammal., 45:203.
Culbertson, A. E. 1946. Observations on the natural history of the Fresno kangaroo rat. J..Mammal., 27:189-203.
Dalquest, W. W. and Glen Collier. 1964. Notes on Dipodomys elator, a rare kangaroo rat. The Southwest. Nat., 9:146-150.
Dalquest, W. W. 1968. Mammals of North-Central Texas. The South-west Nat., 13:13-22.
Davis, W. B. 1942. The systematic status of four kangaroo rats. J. Mammal., 23:328.
Dice, L. R. 1931. Methods of indicating the abundance of mammals. J. Mammal., 12:376-381.
Eisenberg, J. F. and D. E. Isaac. 1963. Reproduction of heteromyid rodents in captivity. J. Mammal., 44:61-67.
Eisenberg, J. F. 1963. The behavior of heteromyid rodents. Univ. California Press, Berkeley, 100 pages.
54

55 Fitch, H. S. 1950. A new style live-trap for small mammals. J.
Mammal., 31:364-365.
Fitch, H. S. 1958. Seasonal acceptance of bait by small mammals. J. Mammal., 1:39-47.
Grinnel, Joseph. 1921. Revised list of the species in the genus Dipodomys. J. Mammal., 2:94.
Hawbecker, A. C. 1940. The burrov7ing and feeding habits of Dipodomys venustus. J. Mammal., 21:388-396.
Hayne, D. W. 1949. Calculation of size of home range. J. Mammal., 30:1-18.
Hayne, D. W. 1950. Apparent home range of Microtus in relation to distance between traps. J. Mammal., 31:26-39.
Hedeen, R. A. 1953. Ectoparasites occuring on mammals in the vicinity of Fort Hood, Texas. Texas J. Sci., 5:125-129.
Lidicker, W. Z. 1960. The baculum of Dipodomys ornatus and its implication for superspecific groupings of kangaroo rats. J. Mammal., 41:498.
Lidicker, W. Z. 1960. An analysis of interspecific variation in the kangaroo rat Dipodomys merriami. Univ. California Press, Berkeley, 212 pages.
McCarley, W. H. 1954. Fluctuations and structure of Peromyscus gossypinus populations in eastern Texas. J. Mammal., 35:526.
Merriam, C. H. 1894. Preliminary descriptions of eleven new kangaroo rats of the genera Dipodomys and Perodipus. Proceedings Biol. Soc. Washington, 9:109-116.
Murray, K. F. 1957. Some problems of applied small mammal samp-lings in western North America. J. Mammal., 38:441-451.
Packard, R. L. and F. W. Judd. 1968. Comments on some mammals from v/estern Texas. J. Mammal., 49:535-538.
Reynolds, H. 6. 1958. The ecology of the Merriam kangaroo rat on the grading lands of southern Arizona. Ecol. Monogr., 28:111-127.
Schmidt-Nielsen, B. and K. Schmidt-Nielsen. 1950. Evaporative water loss in desert rodents in their natural habitat. Ecology 31:75-85.

1
56 Setzer, H. W. 1949, Subspeciation in the kangaroo rat, Dlpodbmys
ordll. Univ. Kans. Publ. Mus. Nat. Hist., 1:473-573.
Stlckel, L. F. 1954. A comparison of certain methods of measurîng ranges of small mammals. J. Mammal., 35:1-15.
Tappe, D. T. 1941. Natural history of the Tulare kangaroo rat. J. Mammal., 22:117-148.
