ecological applications 2009 by the ecological society of
TRANSCRIPT


Ecological Applications, 19(3), 2009, pp. 786–798� 2009 by the Ecological Society of America
Upper respiratory tract disease, force of infection, and effectson survival of gopher tortoises
ARPAT OZGUL,1,4 MADAN K. OLI,1 BENJAMIN M. BOLKER,2 AND CAROLINA PEREZ-HEYDRICH3
1Department of Wildlife Ecology and Conservation, 110 Newins-Ziegler Hall, University of Florida, Gainesville, Florida 32611 USA2Department of Zoology, 223 Bartram Hall, University of Florida, Gainesville, Florida 32611 USA
3Department of Infectious Diseases and Pathology, University of Florida, Gainesville, Florida 32610 USA
Abstract. Upper respiratory tract disease (URTD) caused by Mycoplasma agassizii hasbeen hypothesized to contribute to the decline of some wild populations of gopher tortoises(Gopherus polyphemus). However, the force of infection (FOI) and the effect of URTD onsurvival in free-ranging tortoise populations remain unknown. Using four years (2003–2006)of mark–recapture and epidemiological data collected from 10 populations of gopher tortoisesin central Florida, USA, we estimated the FOI (probability per year of a susceptible tortoisebecoming infected) and the effect of URTD (i.e., seropositivity to M. agassizii) on apparentsurvival rates. Sites with high (�25%) seroprevalence had substantially higher FOI (0.22 60.03; mean 6 SE) than low (,25%) seroprevalence sites (0.04 6 0.01). Our results provide thefirst quantitative evidence that the rate of transmission of M. agassizii is directly related to theseroprevalence of the population. Seropositive tortoises had higher apparent survival (0.99 60.0001) than seronegatives (0.88 6 0.03), possibly because seropositive tortoises representindividuals that survived the initial infection, developed chronic disease, and experiencedlower mortality during the four-year span of our study. However, two lines of evidencesuggested possible effects of mycoplasmal URTD on tortoise survival. First, one plausiblemodel suggested that susceptible (seronegative) tortoises in high seroprevalence sites had lowerapparent survival rates than did susceptible tortoises in low seroprevalence sites, indicating apossible acute effect of infection. Second, the number of dead tortoise remains detected duringannual site surveys increased significantly with increasing site seroprevalence, from ;1 to ;5shell remains per 100 individuals. If (as our results suggest) URTD in fact reduces adultsurvival, it could adversely influence the population dynamics and persistence of this late-maturing, long-lived species.
Key words: apparent survival; Florida, USA; force of infection; gopher tortoise; Gopheruspolyphemus; multistate mark–recapture models; Mycoplasma agassizii; pathogen transmission; upperrespiratory tract disease (URTD); wildlife diseases.
INTRODUCTION
Infectious diseases have been widely recognized as an
important factor influencing the dynamics and persis-
tence of wildlife populations (Dobson and May 1986,
Scott 1988, Cohn 1991, Wolff and Seal 1993, Daszak et
al. 2000, Hudson et al. 2002). The impact of disease can
be particularly severe in populations experiencing
environmental stress caused by anthropogenic activities
such as habitat fragmentation and ecosystem perturba-
tion (Hutchins et al. 1991, Nettles 1992, 1996, Viggers et
al. 1993, Woodford 1993, Cunningham 1996). Conse-
quently, wildlife diseases have been implicated in the
decline or extinction of several wildlife species (e.g.,
Hawaiian land birds [Vanriper et al. 1986], black-footed
ferrets, Mustela nigripes [Thorne and Williams 1988],
harbor seals, Phoca vitulina [Heidejorgensen et al. 1992],
marine turtles [Herbst and Klein 1995], Australian rain
forest frogs [Laurance et al. 1996], Serengeti lions,
Panthera leo [Roelke-Parker et al. 1996], African wild
dogs, Lycaon pictus [Woodroffe 1997], Ethiopian
wolves, Canis simensis [Randall et al. 2004], Tasmanian
devils, Sarcophilus harrisii [Lachish et al. 2007]).
However, studies investigating demographic effects of
infectious diseases on free-ranging wildlife populations,
other than those of economic or public health signifi-
cance, have been rare (but see Spalding and Forrester
1993, Dhondt et al. 2005).
Population declines are occurring in most chelonian
species, including the three North American Gopherus
spp. (Mitchell and Klemens 2000). Although habitat
degradation is the most significant threat to wild
populations of tortoises (Mitchell and Klemens 2000),
disease-related mortality is also considered a significant
factor contributing to population declines (Jacobson
1994). Upper respiratory tract disease (URTD), an
infectious disease caused by Mycoplasma agassizii, has
Manuscript received 31 January 2008; revised 24 July 2008;accepted 21 August 2008. Corresponding Editor: S. K.Collinge.
4 Present address: Division of Biology, Imperial CollegeLondon, Silwood Park, Ascot, Berkshire SL5 7PY UnitedKingdom. E-mail: [email protected]
786

been associated with the decline of several tortoise
populations (Berry 1997, McLaughlin 1997, Gates et al.
2002). URTD was first described in clinically ill captive
and wild desert tortoises (Gopherus agassizii) in the
southwestern United States (Jacobson et al. 1991). In the
1980s, major declines of desert tortoise populations were
documented at several sites in the Mojave Desert,
California, USA (Corn 1994). As a result of this decline,
desert tortoises in the Mojave Desert were declared
threatened (U.S. Fish and Wildlife Service 1990). Since
1989, serological evidence of M. agassizii exposure has
been detected in wild populations of gopher tortoises
(Gopherus polyphemus; see Plate 1) in Florida, some of
which have experienced significant mortality events
(McLaughlin 1997, Berish et al. 2000, Gates et al.
2002). Evidence suggests that URTD may be a factor
contributing to the observed population declines in the
desert tortoise as well as the gopher tortoise (Jacobson et
al. 1991, 1995); however, conclusive evidence of the effects
of URTD in wild populations is missing. Monitoring the
disease status of wild tortoises throughout their range is
crucial for understanding the dynamics of URTD in wild
populations and for evaluating its impact on tortoise
populations (U.S. Fish and Wildlife Service 1994).
Pathogens may influence the dynamics of host
populations by altering vital demographic rates such as
survival and reproduction. The spread of pathogens in
populations of susceptible hosts is governed by the force
of infection (FOI), defined here as the probability per
year of a susceptible tortoise becoming infected.
However, empirical estimates of the FOI and investiga-
tions of the effects of diseases on host demography are
rare for free-ranging wildlife populations (but see Pech
and Hone 1988, Caley and Hone 2002, Faustino et al.
2004, Heisey et al. 2006, Hosseini et al. 2006).
Investigations of the population-level effects of infec-
tious diseases, while challenging, are essential for a
better understanding of the host–pathogen dynamics
and also for development of effective management tools.
This is especially important when the species of interest
is a keystone species such as the gopher tortoise, which is
critical to the health of upland ecosystems and to
persistence of several commensal species that inhabit
gopher tortoise burrows (Eisenberg 1983, Diemer 1986).
Like most mycoplasmal respiratory tract infections,
the dynamics of URTD within host populations are
typically characterized by an acute phase with overt
clinical signs and high seroconversion rates, a chronic
phase with limited clinical signs and high seropreva-
lence, and intermittent recrudescent phases with mild to
severe clinical signs and high seroprevalence (Brown et
al. 1999, Wendland 2007). Although acute mortality
may occur, many tortoises likely develop chronic
disease, with intermittent expression of clinical signs.
The bacteria persist in the nasal cavity and damage the
mucosal tissue of the upper respiratory tract, resulting in
increased susceptibility to secondary infections (Homer
et al. 1998, McLaughlin et al. 2000). In tortoises with
chronic mycoplasmosis, mortality is presumed to be the
result of severe debilitation and multisystemic disease(Homer et al. 1998, Jacobson et al. 1991, McLaughlin et
al. 2000). However, the influence of URTD ondemography of wild tortoise populations remains
unknown, in large part because of the limited long-termmonitoring of infected tortoises in the wild, the chronicnature of URTD, and the long lifespan of the tortoise.
The goal of this study was to quantify the FOI and toinvestigate population-level effects of URTD on free-
ranging gopher tortoises. We conducted intensive mark–recapture and epidemiological studies of 10 discrete
populations of gopher tortoises in central Florida, USA,for four consecutive years. Using a multistate mark–
recapture model, we estimated the FOI (the probabilityof transition from susceptible or seronegative state to
exposed or seropositive state) and apparent survivalrates, and evaluated the effects of environmental factors
on the FOI and survival rates. We tested for possibleeffects of sex, site, and seroprevalence to M. agassizii on
the FOI and apparent survival of tortoises, andevaluated the effect of mycoplasma serological status
on apparent survival of tortoises. In addition, we testedfor potential influence of environmental factors hypoth-
esized to influence the FOI and tortoise survival. Finally,we used shell remains as biological markers of mortalityand evaluated the relationship between shell remains
and seroprevalence to M. agassizii.
MATERIALS AND METHODS
Study species
The gopher tortoise is a terrestrial, burrowing reptile
that plays an important ecological role in uplandecosystems (Eisenberg 1983, Jackson and Milstrey
1989, Moler 1992). It is the only North Americantortoise species found east of the Mississippi River,
where it occurs in Florida and portions of the coastalplain of South Carolina, Georgia, Alabama, Mississippi,
and Louisiana (Auffenberg and Franz 1982). Thegopher tortoise is currently state listed as threatened inFlorida (Florida Fish and Wildlife Conservation Com-
mission 2007).
Study area
In 2002, we conducted a preliminary study of tortoise
populations in central Florida to collect relevant data onpopulation and habitat conditions and to assess the
status of mycoplasmal upper respiratory tract disease(URTD). Based on the findings of the preliminary study,
we selected 10 sites that differed in Mycoplasma agassiziiseroprevalence for in-depth studies (Fig. 1). The selected
sites were Big Shoals State Park (BS), Camp BlandingWildlife Management Area (CB), Cecil Field/Branan
Field Wildlife and Environmental Area (CF), a private-ly-owned property in central Florida (CE), Fort CooperState Park (FC), Flying Eagle Wildlife Management
Area (FE), Gold Head Branch State Park (GH), PerryOldenburg Wildlife and Environmental Area (OL),
April 2009 787URTD EFFECT ON GOPHER TORTOISE

Ordway-Swisher Biological Station (OR), and Tenoroc
Fish Management Area (TE), all in Florida, USA.Habitat quality and type varied substantially among
sites. The ground cover at BS, CB, and FE is dominatedby Bahia grass (Paspalum notatum); BS and CB havebeen planted with pine trees (Pinus spp.). CF contains a
mixture of sandhill and pine flatwoods. CE and TE arepreviously disturbed sites that are dominated by non-
native, ruderal vegetation. GH, OR, FC, and OL aresandhill habitats with varying habitat quality and
degrees of management.
Field methods
The fieldwork was conducted between 2003 and 2006,during late spring/summer (May–September). System-
atic surveys were conducted to locate tortoise burrowsand shell remains from deceased tortoises at study sites
and consisted of a line of four to eight observers spaced10 m apart walking parallel transects across the studyarea. Dead tortoises were photo-documented, georefer-
enced, labeled, and collected for examination. Approx-imate time since death was estimated using previously
described methods (Dodd 1995).Mark–recapture protocol was standardized for all the
sites. At each of the 10 sites, tortoises were capturedopportunistically or with pitfall traps at known active
burrows. Each captured tortoise was marked forindividual identification on the first capture by drillingholes in the marginal scutes using an established scheme
(Cagle 1939), and the identity of previously markedtortoises was recorded. Morphometric measurements
were taken, and photographic documentation was madeof the face, plastron, carapace, and any lesions observed.
Complete health assessments (Berry 1997), standard
hematological and serum biochemical profiles (Christo-
pher et al. 2003), and diagnostic tests for the presence ofMycoplasma agassizii (Brown et al. 1995, Wendland et
al. 2007) were performed.
ELISA test
URTD is a chronic disease that is intermittentlyexpressed. Tortoises without clinical signs of URTD can
still be infected and may transmit the pathogen underappropriate conditions (Jacobson et al. 1995). There-
fore, we used an immunoassay, rather than visualassessment of clinical signs, to measure exposure to M.
agassizii in tortoises. An enzyme-linked immunosorbentassay (ELISA) that has been validated for both desertand gopher tortoises, and has been shown to be a
reliable and reproducible assay, was used to determinethe serological status of captured tortoises (Schumacher
et al. 1993, Wendland et al. 2007). Animals wereclassified as seronegative or seropositive based on the
ELISA results. Seronegative tortoises were considered assusceptible animals for the analyses described next.
Capture–mark–recapture (CMR) analysis
Estimation of apparent survival and force of infec-
tion.—We used four years of capture–mark–recapture(CMR) data from 340 adult male (carapace length � 180
mm) and 329 adult female (carapace length � 220 mm)tortoises (Table 1). We considered two serologic statesbased on results of the ELISA test: (1) susceptible
(seronegative, s) and (2) exposed (seropositive, p) states.We used the multistate CMR model (Hestbeck et al.
1991, Brownie et al. 1993, Williams et al. 2001, Fujiwaraand Caswell 2002) implemented using the RMark
interface (Laake and Rexstad 2007) for Program
FIG. 1. Location of study sites in Florida, USA.
ARPAT OZGUL ET AL.788 Ecological ApplicationsVol. 19, No. 3
MARK (White and Burnham 1999) to estimate sero-
logic state-specific recapture (qs, qp) and survival (Ss, Sp)
rates, and also the force of infection (FOI). The FOI (w)quantifies the probability that a susceptible tortoise
becomes infected the following year, conditional on
surviving the period in the susceptible state. Given the
chronic nature of mycoplasmal URTD and limited
evidence for clearance of the microbe from the
respiratory tract (Wendland 2007, Wendland et al.
2007), we assumed that once infected, tortoises remained
in the seropositive state and were presumed to be
colonized by M. agassizii. Therefore, the probability of
transition from seropositive to susceptible state (i.e.,
recovery rate) was fixed at zero. CMR data collected
from TE were not included in the analyses due to very
low recapture rates of adult tortoises at this site, but this
site was included in the analysis of tortoise remains.
We used Program UCARE V2.02 (Choquet et al.
2003) to assess the goodness-of-fit of the general
multistate model. We used Akaike’s Information Crite-
rion, corrected for small sample size (AICc), for model
comparison and for the identification of the most
parsimonious model from a candidate model set (Burn-
ham and Anderson 2002). Model comparison was based
on the differences in AICc values (DAICc). We used
AICc weight as a measure of relative support for each
model. We tested for the effects of sex, carapace length
(an index of age), site, serologic status, and seropreva-
lence (i.e., proportion of seropositive individuals in the
population) on apparent survival, and for the effects of
sex and M. agassizii seroprevalence on the FOI.
Effects of URTD on apparent survival.—Using the
most parsimonious model, we tested for the effects of
serologic state and M. agassizii seroprevalence on
apparent survival rates and evaluated the hypothesis
that mycoplasmal URTD reduces apparent survival. We
evaluated these potential effects using three different
approaches. First, we tested for the effect of the
serologic state (seropositive vs. susceptible or seroneg-
ative) on survival of tortoises. Second, we tested for the
difference in survival of all tortoises (i.e., regardless of
serologic state) in sites with high (�25%) vs. low (,25%)
seroprevalence. We chose the 25% cutoff point based on
the distribution of seroprevalence values. Most of the
sites characterized as low seroprevalence are believed to
be mycoplasma negative based on serology, culture/
polymerase chain reaction (PCR) analysis of nasal
flushes (Brown et al. 1995), and absence of clinical signs
of URTD among tortoises. Occasional seropositive
results from these sites likely represent false-positive
results given the predictive values of the assay at low
prevalence (Wendland et al. 2007); however, because
these results could not be confirmed, we classified the
sites as low seroprevalence. Finally, we compared
apparent survival of susceptible tortoises from high
seroprevalence sites to those from low seroprevalence
sites. This last analysis was conducted to test for possible
acute effects of the disease on tortoise survival (i.e.,
newly infected tortoises dying within weeks or months
post-infection). Because tortoises were sampled once
annually, within-year seroconversion and death was
unlikely to be detected. The majority of individuals
captured as seropositive were likely to be those that
survived the initial acute phase and transitioned into the
chronic form of the disease. Thus, we tested for potential
acute effects by comparing the survival of susceptible
individuals in high prevalence sites to those in low
prevalence sites. In all cases, we appropriately accounted
for factors that could influence capture probability,
FOI, or survival rate before testing for the effect of
mycoplasma serological status on the survival rate.
Effects of environmental covariates.—Using the most
parsimonious model identified here, we examined the
potential influence of environmental covariates on
survival, recapture, and the FOI. Environmental covar-
iates included site-specific estimates of tortoise density,
relocation history, extent of spatial sampling, relative
abundance of exotic plants, factors related to basking
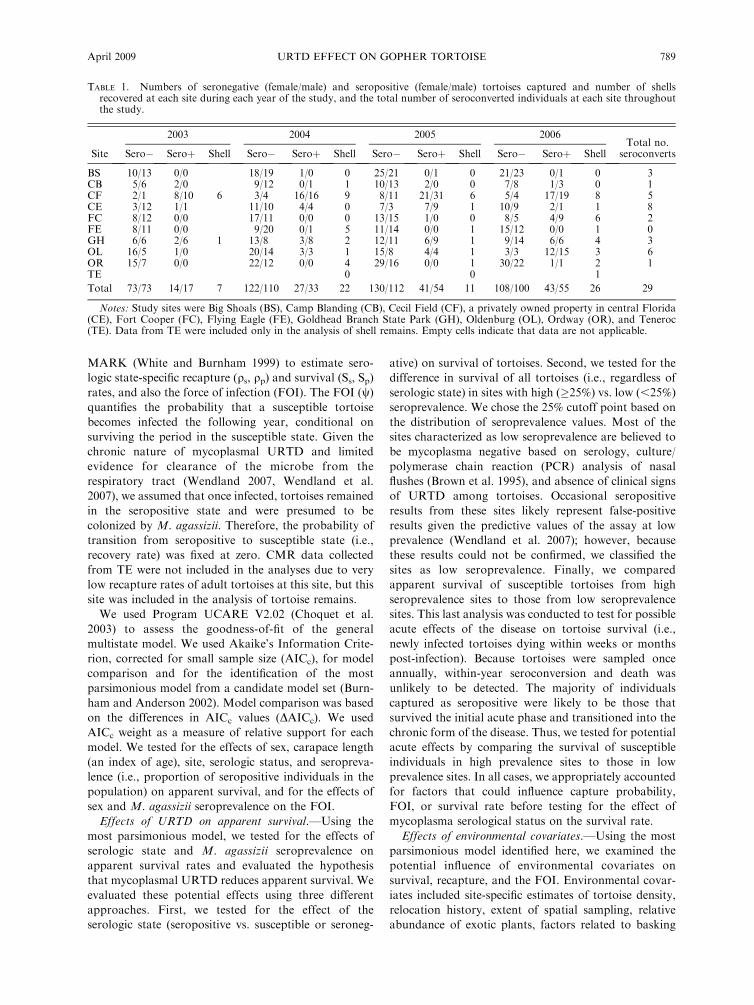
TABLE 1. Numbers of seronegative (female/male) and seropositive (female/male) tortoises captured and number of shellsrecovered at each site during each year of the study, and the total number of seroconverted individuals at each site throughoutthe study.
Site
2003 2004 2005 2006Total no.
seroconvertsSero� Seroþ Shell Sero� Seroþ Shell Sero� Seroþ Shell Sero� Seroþ Shell
BS 10/13 0/0 18/19 1/0 0 25/21 0/1 0 21/23 0/1 0 3CB 5/6 2/0 9/12 0/1 1 10/13 2/0 0 7/8 1/3 0 1CF 2/1 8/10 6 3/4 16/16 9 8/11 21/31 6 5/4 17/19 8 5CE 3/12 1/1 11/10 4/4 0 7/3 7/9 1 10/9 2/1 1 8FC 8/12 0/0 17/11 0/0 0 13/15 1/0 0 8/5 4/9 6 2FE 8/11 0/0 9/20 0/1 5 11/14 0/0 1 15/12 0/0 1 0GH 6/6 2/6 1 13/8 3/8 2 12/11 6/9 1 9/14 6/6 4 3OL 16/5 1/0 20/14 3/3 1 15/8 4/4 1 3/3 12/15 3 6OR 15/7 0/0 22/12 0/0 4 29/16 0/0 1 30/22 1/1 2 1TE 0 0 1
Total 73/73 14/17 7 122/110 27/33 22 130/112 41/54 11 108/100 43/55 26 29
Notes: Study sites were Big Shoals (BS), Camp Blanding (CB), Cecil Field (CF), a privately owned property in central Florida(CE), Fort Cooper (FC), Flying Eagle (FE), Goldhead Branch State Park (GH), Oldenburg (OL), Ordway (OR), and Teneroc(TE). Data from TE were included only in the analysis of shell remains. Empty cells indicate that data are not applicable.
April 2009 789URTD EFFECT ON GOPHER TORTOISE

site availability, and factors related to food availability.
Tortoise abundances were estimated at each site by
conducting burrow surveys to estimate the abundance of
tortoise burrows, and then applying site-specific esti-
mates of burrow occupancy rates as determined with a
burrow camera. Relocation history was determinedbased on relocation permits issued by Florida Fish and
Wildlife Commission (FWC) and one instance of
documented but non-permitted relocations (0 ¼ no
history of relocations, 1 ¼ documented history of
relocations; in past wildlife rescue operations, gopher
tortoises were relocated to some of the study popula-
tions). The covariate ‘‘extent of spatial sampling’’
grouped sites into two categories with respect to the
proportion of the available tortoise habitat sampled (0¼relatively open habitats, where immigration and emi-
gration are likely, and 1 ¼ relatively closed habitats,
where immigration and emigration are less likely). The
covariate ‘‘exotic vegetation’’ divided sites into two
groups with respect to the relative abundance of exotic
and native species of plants (0¼ low relative abundance
of exotic plants, 1 ¼ high relative abundance of exotic
plants). We used woody stem density, and percentcovers for woody vegetation, canopy, and bare ground
in a principal components analysis (PCA), and used the
first principal component as a measure of basking site
availability. Likewise, the first principal component of
PCA with percent covers of forbs, legumes, and grass
quantified the food availability.
We tested for the influence of the potentially
important covariates on survival rate by modeling the
logit of each rate as a linear function of the covariates. If
the 95% confidence interval for the slope parameter did
not include 0, the relationship was considered statisti-cally significant (Williams et al. 2001). Because we only
had data on a subset of the factors that could have
influenced FOI and survival rates, we considered the
influence of each covariate separately.
Analysis of tortoise remains
In addition to the CMR analysis, we analyzed the
number of fresh (,40 months old) tortoise shell remainsfound in each site and year to establish whether either
(1) the number of shell remains found was correlated
with seroprevalence in a given site and year or (2) the
number of shell remains found was greater in high- than
in low-prevalence sites. Specifically, we wanted to fit a
statistical model that would allow (given the total
population on a site) overdispersion in shell counts,
possible variation among sites and years, and a positiveeffect of prevalence on shell counts. Following Elston et
al. (2001), we used the model
S ; PoissonðTea0þa1PþesþeyþesyÞ
where S is the number of shell remains recovered at site s
in year y; T is the total population size (estimated as
described previously); P is the seroprevalence at a site ina given year; and es, ey, and esy are random zero-mean
normal variates which describe site effects, year effects,
and site–year interactions, respectively. Since there is
only one observation per site–year combination in the
data set, including esy is equivalent to a lognormal-
Poisson model, which allows for overdispersion and has
similar characteristics to the more familiar negative
binomial model, to describe the data rather than a
simple Poisson (Elston et al. 2001). Ignoring random
effects, the expected number of shells per individual at a
site is ea0þa1P; thus, a0 represents the expected log
proportion of shells/individual at 0 seroprevalence,
while a1 represents the increase in log proportion per
percentage increase in seroprevalence. For small values
of a1, this parameter approximately equals the percent-
age increase; for example, a1¼ 0.02 would correspond to
a 2% increase in shells/individual for a 1% increase in
seroprevalence.
A similar model allowing only for categorical, rather
than continuous, differences in seroprevalence is
S ; PoissonðTea0þa2HþesþeyþesyÞ
where now H is a dummy variable equal to 1 for high-
prevalence (�25% seropositive) sites and 0 otherwise; a2now represents the log ratio of shells/individual in high
vs. low sites. We also fitted a null model with a1 (or a2)
set to zero.
Fitting this model, which is technically a GLMM
(generalized linear mixed model), by standard frequentist
approaches is challenging because of the small sample
size (e.g., only 3 years and 10 sites with which to establish
the site and year variances). While various approxima-
tions such as penalized quasi-likelihood have been used
to fit such models, their accuracy is still debated (Browne
and Draper 2006). Thus, we used a Bayesian analysis
with weak priors to estimate the effect of prevalence on
shell counts. We used Normal priors with standard
deviations of 10 for a0 and a1, and uniform (0, 100)
priors on the inverse variances (i.e., the prior standard
deviation ranged from 0.1 to infinity); we also tried U(0,
100) priors on the standard deviations themselves. We
ran the model in WinBUGS (version 1.4; Spiegelhalter et
al. 2003) via the R2WinBUGS R interface, running 6000
iterations for each of three chains with overdispersed
starting points, discarding the first 3000 iterations and
thinning the final posterior sample to 1000 values, and
checking convergence according to the Gelman-Rubin
criterion (Gelman et al. 2003).
We evaluated the results of the models by examining
means and 95% credible intervals for the posterior
distributions of the parameters. We used the deviance
information criterion (DIC; Spiegelhalter et al. 2002) for
model comparison.
RESULTS
Apparent survival and force of infection
The goodness-of-fit test did not reveal evidence for
lack of fit (v24 ¼ 3.09, P ¼ 0.54). In the first set of
ARPAT OZGUL ET AL.790 Ecological ApplicationsVol. 19, No. 3
analyses, we ignored the serologic state-specific differ-
ences in survival and recapture rates and tested for (1)
main effects of sex, site, and carapace length, andadditive and interactive effects of sex and site on annual
recapture and apparent survival rates, and (2) effect ofsex on the force of infection (FOI). The most
parsimonious model included the effect of sex on
apparent survival rate, the effect of site on recapturerates, and constant FOI (Table 2, model 1). However, a
reduced model with DAICc , 1 indicated that the sexeffect on apparent survival rate was not substantial
(Table 2, model 2). The overall FOI (mean 6 SE) was
estimated as 0.10 6 0.01; sex-specific estimates weremales, 0.11 6 0.02, and females, 0.10 6 0.02. The
apparent survival rate was 0.95 6 0.04 for females and
0.89 6 0.04 for males. Recapture rates varied amongsites, ranging from 0.31 6 0.05 in Perry Oldenburg
Wildlife and Environmental Area (OL) to 0.69 6 0.05 inBig Shoals State Park (BS). Carapace length did not
have a substantial influence on either apparent survival
or recapture rate. The effect of sex on the serologic state-specific survival rates was retested later in our analyses.
Next, we evaluated the effect of Mycoplasma agassizii
serologic status on tortoise survival. First, we tested forthe effects of serologic state (of tortoises) and M.
agassizii seroprevalence (at each site) on apparentsurvival rates (Table 2). For these analyses, we ignored
the sex effect and used the model that included constant
survival rate as the base model (Table 2, model 2). Weused M. agassizii seroprevalence both as a continuous
site covariate and as a discrete variable (,25% ¼ lowseroprevalence and �25% ¼ high seroprevalence sites).
We also tested for the interactive effect of serologic state
and seroprevalence on survival to distinguish between
apparent survival rates of susceptible individuals in high
and low prevalence sites. As would be expected, the
survival rate of seropositive tortoises in low prevalencesites was inestimable due to the small sample sizes.
Therefore, we pooled the seropositive tortoises from lowand high prevalence sites together and estimated one
survival rate for seropositive tortoises. This modified
survival model will be referred to as S(sl-sh-p). For theseanalyses, we tested three alternative models of FOI (w),where w was (1) constant, (2) a function of M. agassiziiseroprevalence at a given site, or (3) differed between
high and low seroprevalence sites. Because only a small
number of individuals seroconverted from negative topositive during this study, we could not test for the effect
of site on w.The most parsimonious model included the effect of
serologic state on survival rate, the effect of site on
recapture rate, and the effect of M. agassizii seroprev-alence on FOI (Table 3, model 1). Not surprisingly, the
FOI was significantly higher at sites with higher
seroprevalence (odds ratio ¼ 203.5, 95% CI: 34.8,1188.8). Using seroprevalence as a discrete variable, wwas estimated as 0.23 6 0.04 in high prevalence sites,
and 0.04 6 0.01 in low prevalence or mycoplasma-negative sites (Table 3, model 6). Apparent survival rate
for susceptible tortoises was estimated as 0.88 6 0.03.The mean apparent survival of seropositive tortoises was
not lower than that of susceptible (seronegative)
individuals as one might expect; the survival rate ofseropositive tortoises was very close to one (0.99 6
0.0001). Apparent survival of all tortoises in highprevalence sites (0.92 6 0.05) was similar to that in
low prevalence sites (0.91 6 0.04). However, there was
some evidence for a difference in the survival of
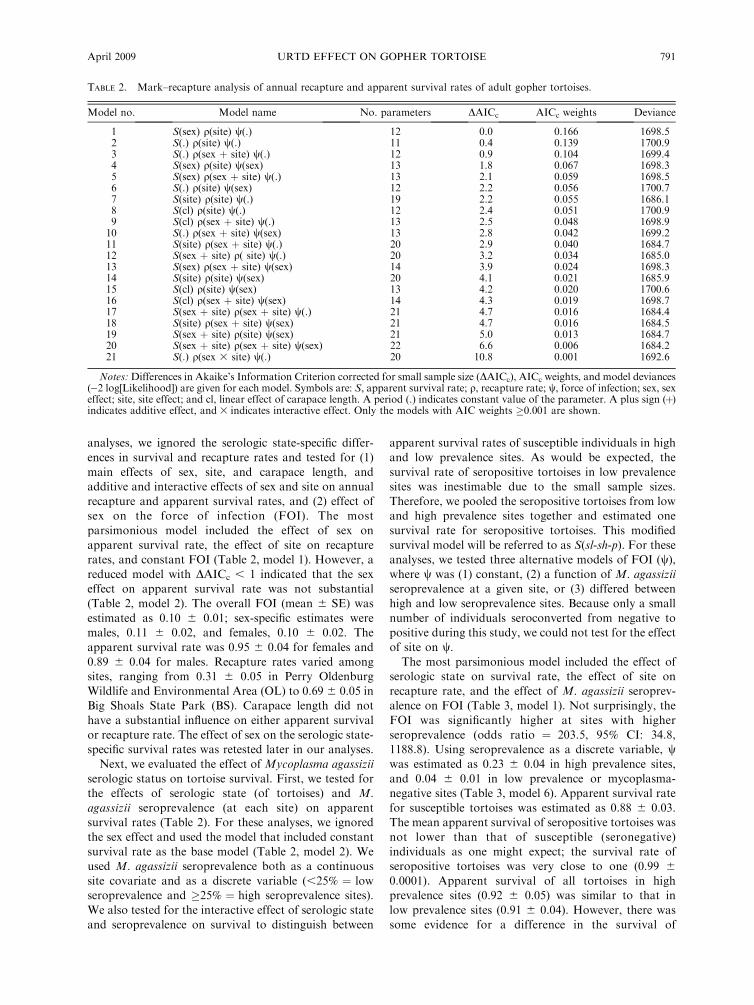
TABLE 2. Mark–recapture analysis of annual recapture and apparent survival rates of adult gopher tortoises.
Model no. Model name No. parameters DAICc AICc weights Deviance
1 S(sex) q(site) w(.) 12 0.0 0.166 1698.52 S(.) q(site) w(.) 11 0.4 0.139 1700.93 S(.) q(sex þ site) w(.) 12 0.9 0.104 1699.44 S(sex) q(site) w(sex) 13 1.8 0.067 1698.35 S(sex) q(sex þ site) w(.) 13 2.1 0.059 1698.56 S(.) q(site) w(sex) 12 2.2 0.056 1700.77 S(site) q(site) w(.) 19 2.2 0.055 1686.18 S(cl) q(site) w(.) 12 2.4 0.051 1700.99 S(cl) q(sex þ site) w(.) 13 2.5 0.048 1698.910 S(.) q(sex þ site) w(sex) 13 2.8 0.042 1699.211 S(site) q(sex þ site) w(.) 20 2.9 0.040 1684.712 S(sex þ site) q( site) w(.) 20 3.2 0.034 1685.013 S(sex) q(sex þ site) w(sex) 14 3.9 0.024 1698.314 S(site) q(site) w(sex) 20 4.1 0.021 1685.915 S(cl) q(site) w(sex) 13 4.2 0.020 1700.616 S(cl) q(sex þ site) w(sex) 14 4.3 0.019 1698.717 S(sex þ site) q(sex þ site) w(.) 21 4.7 0.016 1684.418 S(site) q(sex þ site) w(sex) 21 4.7 0.016 1684.519 S(sex þ site) q(site) w(sex) 21 5.0 0.013 1684.720 S(sex þ site) q(sex þ site) w(sex) 22 6.6 0.006 1684.221 S(.) q(sex 3 site) w(.) 20 10.8 0.001 1692.6
Notes:Differences in Akaike’s Information Criterion corrected for small sample size (DAICc), AICc weights, and model deviances(�2 log[Likelihood]) are given for each model. Symbols are: S, apparent survival rate; q, recapture rate; w, force of infection; sex, sexeffect; site, site effect; and cl, linear effect of carapace length. A period (.) indicates constant value of the parameter. A plus sign (þ)indicates additive effect, and 3 indicates interactive effect. Only the models with AIC weights �0.001 are shown.
April 2009 791URTD EFFECT ON GOPHER TORTOISE

susceptible tortoises between high and low prevalence
sites (model 2, DAICc , 2): survival of susceptible
tortoises in low prevalence sites (0.90 6 0.04) was
slightly higher than that in high prevalence sites (0.86 6
0.05).
We examined the effect of serologic state and
seroprevalence on sex-specific survival of tortoises. We
used the three most parsimonious models identified
above (Table 3, models 1–3) and tested for additive and
interactive effects of sex on apparent survival and FOI.
The most parsimonious model included additive effects
of sex and serologic state on survival (Table 4, model 1).
The apparent survival of susceptible females (0.93 6
0.04) was slightly higher than that of susceptible males
(0.85 6 0.04). However, a reduced model with DAICc ,
1 indicated that the sex effect on survival was not
substantial (model 2). A model with a similar support
indicated additive effect of sex and interactive effects of
serologic state and seroprevalence on survival rates
(model 3). Based on this model, apparent survival rates
of susceptible females were slightly higher than that of
susceptible males. Furthermore, apparent survival of
susceptible tortoises in high-seroprevalence sites was less
than that in low-seroprevalence sites. This effect was
more pronounced in susceptible males (low, 0.89 6 0.05
vs. high, 0.79 6 0.07) than in females (low, 0.96 6 0.04
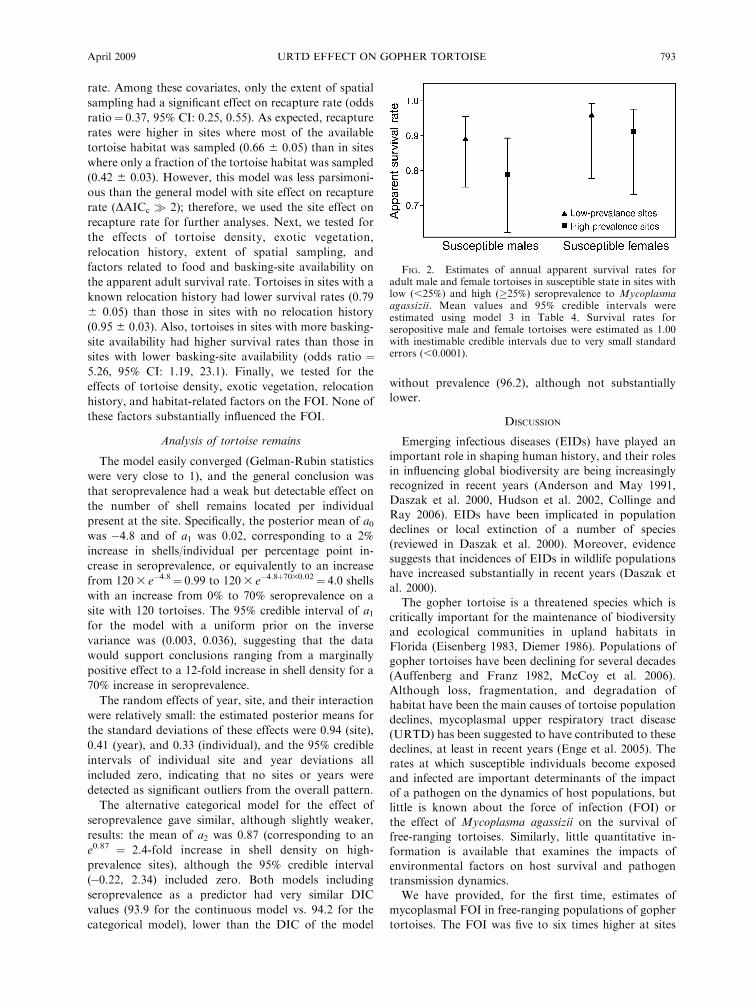
vs. high, 0.91 6 0.05; Fig. 2). In both models, survival
rates of seropositive males and females were very close
to one with very small standard errors.
Effects of environmental covariates
Using model 1 in Table 3 as the base model, we
examined the influence of environmental covariates on
apparent survival and recapture rates, and FOI. We first
tested for the effects of percent ground cover, popula-
tion density, and extent of spatial sampling on recapture
TABLE 3. Multistate mark–recapture analysis of the effect of mycoplasma serological status on the survival rate of adult gophertortoises.
Model no. Model name No. parameters DAICc AICc weights Deviance
1 S(serology) q(site) w(prevcov) 13 0.0 0.530 1651.72 S(sl-sh-p) q(site) w(prevcov) 14 1.6 0.240 1651.23 S(.) q(site) w(prevcov) 12 2.8 0.128 1656.64 S(prevcov) q(site) w(prevcov) 13 4.6 0.053 1656.35 S(prevgr) q(site) w(prevcov) 13 4.9 0.046 1656.66 S(serology) q(site) w( prevgr) 13 11.3 0.002 1663.07 S(sl-sh-p) q(site) w(prevgr) 14 12.9 0.001 1662.68 S(.) q(site) w(prevgr) 12 14.0 0.000 1667.89 S(prevcov) q(site) w(prevgr) 13 15.8 0.000 1667.510 S(prevgr) q(site) w(prevgr) 13 16.1 0.000 1667.811 S(serology) q(site) w(.) 12 42.1 0.000 1695.912 S(sl-sh-p) q(site) w(.) 13 43.5 0.000 1695.213 S(.) q(site) w(.) 11 45.1 0.000 1700.914 S(prevcov) q(site) w(.) 12 46.8 0.000 1700.615 S(prevgr) q(site) w(.) 12 47.1 0.000 1700.9
Notes: The base model used for these analyses was S(.) q(site) w(.) (Table 2, model 2). Abbreviations are: serology, serologic stateeffect (susceptible and seropositive); prevcov, effect of seroprevalence as site covariate; prevgr, effect of seroprevalence as a groupingfactor (high and low seroprevalence sites); and sl-sh-p, grouping factor based on serologic state and seroprevalence (susceptible inlow seroprevalence sites, susceptible in high seroprevalence sites, and seropositive). Other abbreviations are defined in Table 2.
TABLE 4. Multistate mark–recapture analysis of the additive and interactive effects of sex and mycoplasma serological status onadult survival, recapture, and force of infection of adult tortoises.
Model no. Model name No. parameters DAICc AICc weights Deviance
1 S(serology þ sex) q(site) w(prevcov) 14 0.0 0.182 1649.12 S(serology) q(site) w(prevcov) 13 0.5 0.141 1651.73 S(sl-sh-p þ sex) q(site) w(prevcov) 15 0.7 0.131 1647.74 S(serology þ sex) q(site) w(prevcov þ sex) 15 1.5 0.085 1648.65 S(serology) q(site) w(prevcov þ sex) 14 2.0 0.067 1651.16 S(serology 3 sex) q(site) w(prevcov) 15 2.1 0.064 1649.17 S(sl-sh-p) q(site) w(prevcov) 14 2.1 0.064 1651.28 S(sl-sh-p þ sex) q(site) w(prevcov þ sex) 16 2.2 0.061 1647.29 S(sex) q(site) w(prevcov) 13 3.0 0.041 1654.210 S(.) q(site) w(prevcov) 12 3.4 0.034 1656.611 S(sl-sh-p) q(site) w(prevcov þ sex) 15 3.6 0.030 1650.612 S(serology 3 sex) q(site) w(prevcov þ sex) 16 3.6 0.030 1648.613 S(sl-sh-p 3 sex) q(site) w(prevcov) 17 4.2 0.022 1647.114 S(sex) q(site) w(prevcov þ sex) 14 4.4 0.020 1653.515 S(.) q(site) w(prevcov þ sex) 13 4.8 0.017 1656.016 S(sl-sh-p 3 sex) q(site) w(prevcov þ sex) 18 5.7 0.010 1646.5
Notes:A plus sign (þ) indicates an additive effect, and3 indicates an interactive effect. Other symbols are defined in Tables 2 and 3.
ARPAT OZGUL ET AL.792 Ecological ApplicationsVol. 19, No. 3
rate. Among these covariates, only the extent of spatial
sampling had a significant effect on recapture rate (odds
ratio¼ 0.37, 95% CI: 0.25, 0.55). As expected, recapture
rates were higher in sites where most of the available
tortoise habitat was sampled (0.66 6 0.05) than in sites
where only a fraction of the tortoise habitat was sampled
(0.42 6 0.03). However, this model was less parsimoni-
ous than the general model with site effect on recapture
rate (DAICc � 2); therefore, we used the site effect on
recapture rate for further analyses. Next, we tested for
the effects of tortoise density, exotic vegetation,
relocation history, extent of spatial sampling, and
factors related to food and basking-site availability on
the apparent adult survival rate. Tortoises in sites with a
known relocation history had lower survival rates (0.79
6 0.05) than those in sites with no relocation history
(0.95 6 0.03). Also, tortoises in sites with more basking-
site availability had higher survival rates than those in
sites with lower basking-site availability (odds ratio ¼5.26, 95% CI: 1.19, 23.1). Finally, we tested for the
effects of tortoise density, exotic vegetation, relocation
history, and habitat-related factors on the FOI. None of
these factors substantially influenced the FOI.
Analysis of tortoise remains
The model easily converged (Gelman-Rubin statistics
were very close to 1), and the general conclusion was
that seroprevalence had a weak but detectable effect on
the number of shell remains located per individual
present at the site. Specifically, the posterior mean of a0was �4.8 and of a1 was 0.02, corresponding to a 2%
increase in shells/individual per percentage point in-
crease in seroprevalence, or equivalently to an increase
from 1203 e�4.8¼ 0.99 to 1203 e�4.8þ7030.02¼ 4.0 shells
with an increase from 0% to 70% seroprevalence on a
site with 120 tortoises. The 95% credible interval of a1for the model with a uniform prior on the inverse
variance was (0.003, 0.036), suggesting that the data
would support conclusions ranging from a marginally
positive effect to a 12-fold increase in shell density for a
70% increase in seroprevalence.
The random effects of year, site, and their interaction
were relatively small: the estimated posterior means for
the standard deviations of these effects were 0.94 (site),
0.41 (year), and 0.33 (individual), and the 95% credible
intervals of individual site and year deviations all
included zero, indicating that no sites or years were
detected as significant outliers from the overall pattern.
The alternative categorical model for the effect of
seroprevalence gave similar, although slightly weaker,
results: the mean of a2 was 0.87 (corresponding to an
e0.87 ¼ 2.4-fold increase in shell density on high-
prevalence sites), although the 95% credible interval
(�0.22, 2.34) included zero. Both models including
seroprevalence as a predictor had very similar DIC
values (93.9 for the continuous model vs. 94.2 for the
categorical model), lower than the DIC of the model
without prevalence (96.2), although not substantially
lower.
DISCUSSION
Emerging infectious diseases (EIDs) have played an
important role in shaping human history, and their roles
in influencing global biodiversity are being increasingly
recognized in recent years (Anderson and May 1991,
Daszak et al. 2000, Hudson et al. 2002, Collinge and
Ray 2006). EIDs have been implicated in population
declines or local extinction of a number of species
(reviewed in Daszak et al. 2000). Moreover, evidence
suggests that incidences of EIDs in wildlife populations
have increased substantially in recent years (Daszak et
al. 2000).
The gopher tortoise is a threatened species which is
critically important for the maintenance of biodiversity
and ecological communities in upland habitats in
Florida (Eisenberg 1983, Diemer 1986). Populations of
gopher tortoises have been declining for several decades
(Auffenberg and Franz 1982, McCoy et al. 2006).
Although loss, fragmentation, and degradation of
habitat have been the main causes of tortoise population
declines, mycoplasmal upper respiratory tract disease
(URTD) has been suggested to have contributed to these
declines, at least in recent years (Enge et al. 2005). The
rates at which susceptible individuals become exposed
and infected are important determinants of the impact
of a pathogen on the dynamics of host populations, but
little is known about the force of infection (FOI) or
the effect of Mycoplasma agassizii on the survival of
free-ranging tortoises. Similarly, little quantitative in-
formation is available that examines the impacts of
environmental factors on host survival and pathogen
transmission dynamics.
We have provided, for the first time, estimates of
mycoplasmal FOI in free-ranging populations of gopher
tortoises. The FOI was five to six times higher at sites
FIG. 2. Estimates of annual apparent survival rates foradult male and female tortoises in susceptible state in sites withlow (,25%) and high (�25%) seroprevalence to Mycoplasmaagassizii. Mean values and 95% credible intervals wereestimated using model 3 in Table 4. Survival rates forseropositive male and female tortoises were estimated as 1.00with inestimable credible intervals due to very small standarderrors (,0.0001).
April 2009 793URTD EFFECT ON GOPHER TORTOISE

with high (�25%) M. agassizii seroprevalence (0.22 6
0.04) than at sites with low (,25%) seroprevalence (0.04
6 0.01), in accordance with theoretically predicted
interplay between the FOI and disease prevalence
(Anderson and May 1991). Also, our results indicate
that the spread of M. agassizii was rapid at sites
characterized by high seroprevalence. When seropreva-
lence was low, the FOI remained low and clinical signs
of URTD were rare.
Although some gopher tortoise populations with high
M. agassizii seroprevalence have experienced recent or
historical die-offs and increased clinical disease expres-
sion (Berish et al. 2000, Gates et al. 2002), the specificrole of mycoplasmal URTD as a primary or an
exacerbating factor in the die-offs remains unknown.
Given the best available evidence about this pathogen,
we expected to find a negative effect on survival.
Contrary to our initial expectations, apparent survival
rate of seropositive tortoises was not lower than that of
seronegative tortoises. In fact, the apparent survival rate
of seropositive tortoises approached one and was higher
than that of seronegative tortoises. This result was
surprising, given our understanding of the dynamics of
chronic mycoplasmal respiratory disease in mammalsand birds (Simecka et al. 1992, Cartner et al. 1996, Vicca
et al. 2002, Faustino et al. 2004, Lesnoff et al. 2004). One
possible explanation for this finding is that seropositive
tortoises captured in our study represent individuals
within the population that survived the initial infection
and then developed chronic disease. Detecting low-level
chronic effects of URTD will likely require monitoring
tortoise populations over a substantially longer time
frame. For example, population declines in the desert
tortoise occurred 10–15 years after the initial observa-
tion of clinical signs of URTD (Berry 1997); short-term
studies would not have detected these effects. Also,
chronically infected tortoises may be less likely to
emigrate from a given site when compared to healthy
conspecifics, which could lead to a higher apparent
survival of infected tortoises as observed in our study.
Because tortoises were sampled only annually, it was
not possible to directly measure within-year seroconver-
sion or acute effects of the disease leading to death of
tortoises if they occurred (Simecka et al. 1992).
Therefore, we tested for potential acute effects of
mycoplasmal URTD indirectly by evaluating apparentsurvival in susceptible (i.e., seronegative) tortoises.
Survival of susceptible adult males in high seropreva-
lence sites was slightly lower than that in low
seroprevalence sites, providing evidence that URTD
may have an acute effect on tortoise survival. However,
only two of the populations studied were actually in the
acute phase of disease during the 5-year duration of the
study. One population, Cecil Field/Branan Field Wild-
life and Environmental Area (CF), was transitioningfrom acute to chronic disease during the study, and the
other, Fort Cooper State Park (FC), had a number of
newly seroconverted tortoises during the last year of the
study. Thus, our ability to detect the influence of URTD
on survival of tortoises was limited by the timing and
short duration of the study and by annual sampling
intervals used in the present study. Detection of acute
effects would be possible only with a fine-scale sampling
protocol (e.g., weekly or monthly), which is difficult to
implement under field conditions.
Faustino et al. (2004) used a similar capture–mark–
recapture (CMR) analysis and found that M. gallisepti-
cum infection significantly reduced apparent survival
PLATE 1. The gopher tortoise, Gopherus polyphemus. Photo credit: U.S. Geological Survey.
ARPAT OZGUL ET AL.794 Ecological ApplicationsVol. 19, No. 3

rates in house finches. In that study, data on clinical
signs were collected on weekly intervals; consequently,
acute effects of the disease on survival of finches were
likely to be detected. Our study was based on the
serological status of individuals sampled annually and
could not detect within-year seroconversion and ensuing
mortality if they occurred. Thus, differences in study
design and sampling frequency could partially explain
the difference in results between the two studies.
Further, the manifestation of clinical disease and life-
histories of these two hosts are vastly different;
differences in findings of these two studies, therefore,
are hardly surprising.
The analysis of shell remains, which did find an effect
of seroprevalence on density of shell remains, suggests a
slightly stronger conclusion. However, this analysis has
the following caveats: (1) like the site-dependent CMR
analysis, it ties effects of M. agassizii to sites and not to
individual infection status, so that the effects could be
caused by environmental correlates of disease or by
other population-level effects associated with disease; (2)
unlike CMR, we have no explicit estimate of detectabil-
ity or differences in detectability among sites.
Can we reconcile the differences among the analyses?
The CMR estimates approximate annual apparent
survival rates (averaged across sexes) to 0.90 in low-
prevalence vs. 0.86 in high-prevalence sites, equivalent to
a 40% decrease in annual mortality. The shell remains
analysis estimates that we recover ;1 shell per 100
individuals at low prevalence (ea0 ¼ 0.008), so only ;1 in
10 mortality events predicted by the CMR analysis
leaves a detectable shell. Provided that the ratio of shell
counts to population size is proportional to the
mortality probability, the proportional changes in shell
densities should match the proportional increase in
mortality. The estimated four-fold change in shell
densities for a change of 70% in mycoplasmal seroprev-
alence (from 0.99 to 4.0 shells per 120 tortoises) is higher
than the estimated 2.5-fold increase in apparent
mortality of susceptible tortoises in low- vs. high-
prevalence sites, but these values are not statistically
distinguishable. Nonetheless, the credible intervals on
the change in shell densities exclude 1.0 (indicating a
significant increase in shell densities), whereas the
confidence limits on the change in apparent mortality
include 1.0 (indicating no significant effect; Fig. 3).
The analysis of tortoise remains detected a difference
in shell recovery between high- and low-prevalence sites,
whereas CMR failed to detect a strong effect of
mycoplasmal serological status on tortoise survival. As
the shell analysis is less rigorous than CMR, its effects
could be biased by differences that CMR controls for
(such as sex or detectability differences). On the other
hand, the analysis of shells does use a different kind of
data; shells record dead individuals (although an
unknown, possibly nonrandom, sample), whereas
CMR detects only the absence of individuals. For both
analyses, the actual cause of the mortality is unknown.
Nevertheless, even with shell analysis, the effects
(although consistent across a variety of analyses) are
just detectable. In the case of a chronic disease in a long-
lived species, actually quantifying low-level impacts of
an infectious disease on an annual basis can be a
daunting task. As with many wildlife populations, it is
difficult to tease the evidence of ecological and
epidemiological processes apart from the noise of
environmental and sampling variability (Fieberg and
Ellner 2000). Nonetheless, such studies are crucial for
making quantitative assessments with regards to the
relative health of different populations.
Two covariates that have management implications
influenced apparent survival in our study. First,
tortoises in sites with low basking-site availability had
reduced apparent survival rates. Our findings provide
quantitative evidence that habitat parameters, and
therefore management activities, may significantly im-
pact vital demographic rates. Secondly, we found that
tortoises on sites with a history of relocation had lower
apparent survival rates than those on sites with no
documented relocation. Management strategies and
federal recovery plans for gopher tortoises include
relocation or restocking of tortoises as an option for
mitigating impacts of habitat loss due to anthropogenic
activities. It is important to note that we did not test forinteractions among the covariates, and therefore, further
research is required to determine underlying factors that
may influence these results. However, the well-inten-
tioned practice of tortoise relocation may negatively
impact populations, particularly with regard to the
spread of pathogens.
Chronic diseases have potentially severe long-term
consequences for populations (Spalding and Forrester
1993, Hess 1996). Population growth rates of species
characterized by delayed maturity, low recruitment, and
FIG. 3. Point estimates and confidence intervals for theproportional change in overall apparent mortality rate and inshell remains between a site with 0 seroprevalence and a sitewith 70% seroprevalence. In each case, the ratio is the predictedvalue (mortality or shell-remains density) for a high-prevalencesite divided by the predicted value for a low-prevalence site.Error bars represent 95% credible or confidence intervals.Dashed line at ratio ¼ 1.0 shows the null hypothesis of nochange in mortality or shell remains.
April 2009 795URTD EFFECT ON GOPHER TORTOISE

long lifespans are highly sensitive to changes in adult
survival (Crowder et al. 1994, Doak et al. 1994, Oli and
Dobson 2003). Thus, even a small decline in the survival
of adult gopher tortoises can significantly decrease the
population growth rate and the long-term persistence of
populations (Doak et al. 1994, Miller 2001). However,
statistical detection of small-scale increases in mortality
is exceedingly difficult. A concern regarding mycoplas-
mal URTD is that low-level, long-term increases in
mortality may be occurring within populations experi-
encing chronic disease. Our findings that susceptible
tortoises in high seroprevalence populations have
decreased apparent survival, coupled with the increase
in shell remains at high seroprevalence sites, would
suggest a low-level effect in the initial stages of disease.
Long-term sampling of well-characterized populations
and marked individuals over a 10–20-year period will be
required to fully understand the long-term population
level effects of the chronic disease state. Alternate
approaches may also be required to assess the effects
of URTD in populations where the pathogen is already
endemic. Finally, estimates of the FOI and survival rates
reported here, when incorporated into quantitative
demographic models, will provide a basis for predicting
the spread and impact of disease on the dynamics and
persistence of tortoise populations under different
management strategies.
ACKNOWLEDGMENTS
Our research was supported by the National ScienceFoundation and the National Institutes of Health (DEB-0224953). Special thanks go to M. B. Brown, P. A. Klein, L. D.Wendland, and J. Berish, who have contributed substantiallyduring all stages of this study and also provided many insightfulcomments on earlier versions of the manuscript; they chose notto be coauthors due to their unfamiliarity with the statisticalmethods used in this paper. We thank the agencies (FloridaFish and Wildlife Conservation Commission, Florida Depart-ment of Environmental Protection, Southwest Florida WaterManagement District, The Nature Conservancy, University ofFlorida Ordway-Swisher Biological Station, and the FloridaNational Guard) and private land owners who provided accessto the study sites and frequent assistance in data collection. L.White, J. Wooding, and several field assistants contributed todata collection; this work would not have been possible withouttheir dedicated help.
LITERATURE CITED
Anderson, R. M., and R. M. May. 1991. Infectious diseases ofhumans: dynamics and control. Oxford University Press,Oxford, UK.
Auffenberg, W., and R. Franz. 1982. The status anddistribution of the gopher tortoise (Gopherus polyphemus).Pages 95–126 in R. B. Bury, editor. North Americantortoises: conservation and ecology. Wildlife ResearchReport 12. U.S. Fish and Wildlife Service, Washington,D.C., USA.
Berish, J. E. D., L. D. Wendland, and C. A. Gates. 2000.Distribution and prevalence of upper respiratory tract diseasein gopher tortoises in Florida. Journal of Herpetology 34:5–12.
Berry, K. H. 1997. Demographic consequences of disease in twodesert tortoise populations in California, USA. Pages 91–99in Proceedings: conservation, restoration, and managementof tortoises and turtles—an international conference. Wildlife
Conservation Society Turtle Recovery Program and the NewYork Turtle and Tortoise Society, New York, New York,USA.
Brown, D. R., B. C. Crenshaw, G. S. McLaughlin, I. M.Schumacher, C. E. McKenna, P. A. Klein, E. R. Jacobson,and M. B. Brown. 1995. Taxonomic analysis of the tortoisemycoplasmas Mycoplasma agassizii and Mycoplasma testu-dinis by 16s ribosomal RNA gene sequence comparison.International Journal of Systematic Bacteriology 45:348–350.
Brown, M. B., G. S. McLaughlin, P. A. Klein, B. C. Crenshaw,I. M. Schumacher, D. R. Brown, and E. R. Jacobson. 1999.Upper respiratory tract disease in the gopher tortoise iscaused by Mycoplasma agassizii. Journal of Clinical Micro-biology 37:2262–2269.
Browne, W. J., and D. Draper. 2006. A comparison of Bayesianand likelihood-based methods for fitting multilevel models.Bayesian Analysis 1:473–514.
Brownie, C., J. E. Hines, J. D. Nichols, K. H. Pollock, and J. B.Hestbeck. 1993. Capture–recapture studies for multiple strataincluding non-markovian transitions. Biometrics 49:1173–1187.
Burnham, K. P., and D. R. Anderson. 2002. Model selectionand inference: a practical information-theoretic approach.Second edition. Springer-Verlag, New York, New York,USA.
Cagle, F. R. 1939. A system of marking turtles for futureidentification. Copeia 1939:170–172.
Caley, P., and J. Hone. 2002. Estimating the force of infection;Mycobacterium bovis infection in feral ferrets Mustela furo inNew Zealand. Journal of Animal Ecology 71:44–54.
Cartner, S. C., J. W. Simecka, D. E. Briles, G. H. Cassell, andJ. R. Lindsey. 1996. Resistance to mycoplasmal lung diseasein mice is a complex genetic trait. Infection and Immunity 64:5326–5331.
Choquet, R., A. M. Reboulet, R. Pradel, O. Gimenez, and J. D.Lebreton. 2003. User’s manual for U-Care. Mimeographeddocument, CEFE/CNRS, Montpellier, France. hhttp://www.cefe.cnrs.fr/biom/i
Christopher, M. M., K. H. Berry, B. T. Henen, and K. A.Nagy. 2003. Clinical disease and laboratory abnormalities infree-ranging desert tortoises in California (1990–1995).Journal of Wildlife Diseases 39:35–56.
Cohn, J. P. 1991. New focus on wildlife health—tracking andcontrolling animal disease in the wild may be important toconservation efforts. BioScience 41:448–450.
Collinge, S. K., and C. Ray. 2006. Disease ecology: communitystructure and pathogen dynamics. Oxford University Press,Oxford, UK.
Corn, P. S. 1994. Recent trends of desert tortoise populations inthe Mojave Desert. Pages 86–93 in R. B. Bury and D. J.Germano, editors. Biology of North American tortoises. Fishand Wildlife Research Technical Report 13. NationalBiological Survey, Washington, D.C., USA.
Crowder, L. B., D. T. Crouse, S. S. Heppell, and T. H. Martin.1994. Predicting the impact of turtle excluder devices onloggerhead sea turtle populations. Ecological Applications 4:437–445.
Cunningham, A. A. 1996. Disease risks of wildlife transloca-tions. Conservation Biology 10:349–353.
Daszak, P., A. A. Cunningham, and A. D. Hyatt. 2000.Emerging infectious diseases of wildlife—threats to humanhealth and biodiversity. Science 287:443–449.
Dhondt, A. A., et al. 2005. Dynamics of a novel pathogen in anavian host: mycoplasmal conjunctivitis in house finches. ActaTropica 94:77–93.
Diemer, J. E. 1986. The ecology and management of the gophertortoise in the southeastern United States. Herpetologica 42:125–133.
Doak, D. P., P. Karieva, and B. Klepetka. 1994. Modelingpopulation viability for the desert tortoise in the WesternMojave Desert. Ecological Applications 4:446–460.
ARPAT OZGUL ET AL.796 Ecological ApplicationsVol. 19, No. 3

Dobson, A. P., and R. M. May. 1986. Disease and conserva-tion. Conservation biology: the science of scarcity anddiversity. Sinauer Associates, Sunderland, Massachusetts,USA.
Dodd, C. K. 1995. Disarticulation of turtle shells in north-central Florida: How long does a shell remain in the woods?American Midland Naturalist 134:378–387.
Eisenberg, J. F. 1983. The gopher tortoise as a keystone species.Page 14 in The gopher tortoise: a keystone species. FourthAnnual Meeting. Gopher Tortoise Council, Valdosta,Georgia, USA.
Elston, D. A., R. Moss, T. Boulinier, C. Arrowsmith, and X.Lambin. 2001. Analysis of aggregation, a worked example:numbers of ticks on red grouse chicks. Parasitology 122:563–569.
Enge, K. M., J. E. Berish, R. Bolt, A. Dziergowski, and H. R.Mushinsky. 2005. Draft biological status report: gophertortoise. Florida Fish and Wildlife Conservation Commis-sion, Tallahassee, Florida, USA.
Faustino, C. R., C. S. Jenelle, V. Connolly, A. K. Davis, E. C.Swarthout, A. A. Dhondt, and E. G. Cooch. 2004.Mycoplasma gallisepcticum infection dynamics in a housefinch population: seasonal variation in survival, encounter andtransmission rate. Journal of Animal Ecology 73:651–669.
Fieberg, J., and S. P. Ellner. 2000. When is it meaningful toestimate an extinction probability? Ecology 81:2040–2047.
Florida Fish and Wildlife Conservation Commission. 2007.Rule 68A-27.004. Florida Administrative Code, Tallahassee,Florida, USA.
Fujiwara, M., and H. Caswell. 2002. Estimating populationprojection matrices from multi-stage mark–recapture data.Ecology 83:3257–3265.
Gates, C. A., M. J. Allen, J. E. Diemer Berish, D. M.Stillwaugh, Jr., and S. R. Shattler. 2002. Characterization ofa gopher tortoise mortality event in west-central Florida.Florida Scientist 65:185–197.
Gelman, A., J. B. Carlin, H. S. Stern, and D. B. Rubin. 2003.Bayesian data analysis. Chapman and Hall/CRC, BocaRaton, Florida, USA.
Heidejorgensen, M. P., T. Harkonen, R. Dietz, and P. M.Thompson. 1992. Retrospective of the 1988 European sealepizootic. Diseases of Aquatic Organisms 13:37–62.
Heisey, D. M., D. O. Joly, and F. Messier. 2006. The fitting ofgeneral force-of-infection models to wildlife disease preva-lence data. Ecology 87:2356–2365.
Herbst, L. H., and P. A. Klein. 1995. Green turtle fibropa-pillomatosis—challenges to assessing the role of environmen-tal cofactors. Environmental Health Perspectives 103:27–30.
Hestbeck, J. B., J. D. Nichols, and R. A. Malecki. 1991.Estimates of movement and site fidelity using mark–resightdata of wintering Canada geese. Ecology 72:523–533.
Homer, B. L., K. H. Berry, M. B. Brown, G. Ellis, and E. R.Jacobson. 1998. Pathology of diseases in wild desert tortoisesfrom California. Journal of Wildlife Disease 34:508–523.
Hosseini, P. R., A. A. Dhondt, and A. P. Dobson. 2006. Spatialspread of an emerging infectious disease: conjunctivitis inHouse Finches. Ecology 87:3037–3046.
Hudson, P. J., A. P. Rizzoli, B. T. Grenfell, J. A. P.Heesterbeek, and A. P. Dobson. 2002. Ecology of wildlifediseases. Pages 1–5 in P. J. Hudson, A. P. Rizzoli, B. T.Grenfell, J. A. P. Heesterbeek, and A. P. Dobson, editors.The ecology of wildlife diseases. Oxford University Press,Oxford, UK.
Hutchins, M., T. Foose, and U. S. Seal. 1991. The role ofveterinary medicine in endangered species conservation.Journal of Zoo and Wildlife Medicine 22:277–281.
Jackson, D. R., and E. G. Milstrey. 1989. The fauna of gophertortoise burrows. Pages 86–98 in Gopher Tortoise RelocationSymposium Proceedings. Nongame wildlife program techni-cal report 5. Florida Game and Fresh Water Fish Commis-sion, Tallahassee, Florida, USA.
Jacobson, E. R. 1994. Causes of mortality and diseases intortoises—a review. Journal of Zoo and Wildlife Medicine25:2–17.
Jacobson, E. R., M. B. Brown, I. M. Schumacher, B. R.Collins, R. K. Harris, and P. A. Klein. 1995. Mycoplasmosisand the desert tortoise (Gopherus agassizii) in Las VegasValley, Nevada. Chelonian Conservation and Biology 1:280–284.
Jacobson, E. R., J. M. Gaskin, M. B. Brown, R. K. Harris,C. H. Gardiner, J. L. Lapointe, H. P. Adams, and C.Reggiardo. 1991. Chronic upper respiratory tract disease offree-ranging desert tortoises (Xerobates agassizii). Journal ofWildlife Diseases 27:296–316.
Laake, J., and E. Rexstad. 2007. RMark—an alternativeapproach to building linear models. Appendix C in E. Coochand G. White, editors. Program MARK: a gentle introduc-tion. hhttp://www.phidot.org/software/mark/docs/book/i
Lachish, S., M. Jones, and H. McCallum. 2007. The impact ofdisease on the survival and population growth rate of theTasmanian devil. Journal of Animal Ecology 76:926–936.
Laurance, W. F., K. R. McDonald, and R. Speare. 1996.Epidemic disease and the catastrophic decline of Australianrain forest frogs. Conservation Biology 10:406–413.
Lesnoff, M., G. Laval, P. Bonnet, K. Chalvet-Monfray, R.Lancelot, and F. Thiaucourt. 2004. A mathematical model ofthe effects of chronic carriers on the within-herd spread ofcontagious bovine pleuropneumonia in an African mixedcrop–livestock system. Preventive Veterinary Medicine 62:101–117.
McCoy, E. D., H. R. Mushinsky, and J. Lindzey. 2006.Declines of the gopher tortoise on protected lands. BiologicalConservation 128:120–127.
McLaughlin, G. S. 1997. Upper respiratory tract disease ingopher tortoises, Gopherus polyphemus: pathology, immuneresponses, transmission, and implications for conservationand management. Dissertation. University of Florida,Gainesville, Florida, USA.
McLaughlin, G. S., E. R. Jacobson, D. R. Brown, C. E.McKenna, I. M. Schumacher, P. Adams, M. B. Brown, andP. A. Klein. 2000. Pathology of upper respiratory tractdisease of gopher tortoises in Florida. Journal of WildlifeDiseases 36:272–283.
Miller, P. S. 2001. Preliminary population viability assessmentfor the gopher tortoise (Gopherus polyphemus) in Florida.Conservation Breeding Specialist Group, Apple Valley,Minnesota, USA.
Mitchell, J. C., and M. W. Klemens. 2000. Primary andsecondary effects of habitat alteration. Pages 5–32 in M.Klemens, editor. Turtle conservation. Smithsonian InstitutePress, Washington, D.C., USA.
Moler, P. E. 1992. Rare and endangered biota of Florida:volume III. Amphibians and reptiles. R. E. Ashton, Jr.,editor. University Press of Florida, Gainesville, Florida,USA.
Nettles, V. F. 1992. Wildlife diseases and population medicine.Journal of the American Veterinary Medical Association 200:648–652.
Nettles, V. F. 1996. Reemerging and emerging infectiousdiseases: economic and other impacts on wildlife—Transportof animals sometimes spreads infections, while otheroutbreaks are a mystery. American Society for MicrobiologyNews 62:589–591.
Oli, M. K., and F. S. Dobson. 2003. The relative importance oflife-history variables to population growth rate in mammals:Cole’s prediction revisited. American Naturalist 161:422–440.
Pech, R. P., and J. Hone. 1988. A model of the dynamics andcontrol of an outbreak of foot and mouth disease in feral pigsin Australia. Journal of Applied Ecology 25:63–77.
Randall, D. A., S. D. Williams, I. V. Kuzmin, C. E. Rupprecht,L. A. Tallents, Z. Tefera, K. Argaw, F. Shiferaw, D. L.Knobel, C. Sillero-Zubiri, and M. K. Laurenson. 2004.
April 2009 797URTD EFFECT ON GOPHER TORTOISE

Rabies in endangered Ethiopian wolves. Emerging InfectiousDiseases 10:2214–2217.
Roelke-Parker, M. E., et al. 1996. A canine distemper virusepidemic in Serengeti lions (Panthera leo). Nature 379:441–445.
Schumacher, I. M., M. B. Brown, E. R. Jacobson, B. R.Collins, and P. A. Klein. 1993. Detection of antibodies to apathogenic mycoplasma in desert tortoises (Gopherus agassi-zii) with upper respiratory tract disease. Journal of ClinicalMicrobiology 31:1454–1460.
Scott, M. 1988. The impact of infection and disease on animalpopulations: implications for conservation biology. Conser-vation Biology 2:40–56.
Simecka, J. W., J. K. Davis, M. K. Davidson, S. E. Ross,C. T. K. H. Stadtlander, and G. H. Cassell. 1992.Mycoplasmas which infect animals. Pages 391–415 in J.Maniloff, R. N. McElhaney, L. R. Finch, and J. B. Baseman,editors. Mycoplasmas: molecular biology and pathogenesis.American Society for Microbiology, Washington, D.C.,USA.
Spalding, M. G., and D. J. Forrester. 1993. Disease monitoringof free-ranging and released wildlife. Journal of Zoo andWildlife Medicine 24:271–280.
Spiegelhalter, D. J., N. G. Best, B. R. Carlin, and A. van derLinde. 2002. Bayesian measures of model complexity and fit.Journal of the Royal Statistical Society Series B-StatisticalMethodology 64:583–616.
Spiegelhalter, D. J., A. Thomas, N. G. Best, and D. Lunn. 2003.WinBUGS. Version 1.4. Imperial College and MRC Biosta-tistics Unit, London, UK.
Thorne, E. T., and E. S. Williams. 1988. Disease andendangered species: the black-footed ferret as a recentexample. Conservation Biology 2:66–74.
U.S. Fish and Wildlife Service. 1990. Endangered andthreatened wildlife and plants; emergency determination ofthreatened status for the Mojave population of deserttortoise. Federal Register 55:12178–12191.
U.S. Fish and Wildlife Service. 1994. Desert tortoise (Mojavepopulation) recovery plan. U.S. Fish and Wildlife Service,Region 1, Portland, Oregon, USA.
Vanriper, C., S. G. Vanriper, M. L. Goff, and M. Laird. 1986.The epizootiology and ecological significance of malaria inHawaiian land birds. Ecological Monographs 56:327–344.
Vicca, J., D. Maes, L. Thermote, J. Peeters, F. Haesebrouck,and A. de Kruif. 2002. Patterns of Mycoplasma hyopneumo-niae infections in Belgian farrow-to-finish pig herds withdiverging disease-course. Journal of Veterinary MedicineSeries B-Infectious Diseases and Veterinary Public Health 49:349–353.
Viggers, K. L., D. B. Lindenmayer, and D. M. Spratt. 1993.The importance of disease in reintroduction programs.Wildlife Research 20:687–698.
Wendland, L. D. 2007. Epidemiology of mycoplasmal upperrespiratory tract disease in tortoises. Dissertaion. Universityof Florida, Gainesville, Florida, USA.
Wendland, L. D., L. A. Zacher, P. A. Klein, D. R. Brown, D.Demcovitz, R. Littell, and M. B. Brown. 2007. Improvedenzyme-linked immunosorbent assay to reveal Mycoplasmaagassizii exposure: a valuable tool in the management ofenvironmentally sensitive tortoise populations. Clinical andVaccine Immunology 14:1190–1195.
White, G. C., and K. P. Burnham. 1999. Program MARK:survival estimation from populations of marked animals.Bird Study 46:120–139.
Williams, B. K., J. D. Nichols, and M. J. Conroy. 2001.Analysis and management of animal populations. AcademicPress, San Diego, California, USA.
Wolff, P. L., and U. S. Seal. 1993. Implications of infectiousdisease for captive propagation and reintroduction ofthreatened species. Journal of Zoo and Wildlife Medicine24:229–230.
Woodford, M. H. 1993. International disease implications forwildlife translocation. Journal of Zoo and Wildlife Medicine24:265–270.
Woodroffe, R. 1997. The conservation implications of immo-bilizing, radio-collaring and vaccinating free-ranging wilddogs. Pages 124–138 in R. Woodroffe, J. R. Ginsberg, andD. W. Macdonald, editors. The African wild dog: statussurvey and conservation action plan. IUCN, Gland, Swit-zerland.
ARPAT OZGUL ET AL.798 Ecological ApplicationsVol. 19, No. 3