eceee 4-053-20 biermann efficient utilization of
TRANSCRIPT
2020‐10‐09
1
Efficient utilization of industrial excess heat for carbon capture and district heating
Heat integration options and seasonal effects on capture process design and operation
Presenter: M.Sc. Maximilian Biermann [email protected]
Co-authors: M.Sc. Åsa EliassonM.Sc. Elin FahrmanM.Sc. Johanna BeironAssoc. Prof. Fredrik NormannProf. Filip Johnsson
This work has been carried out at:The Division of Energy TechnologyDepartment of Space, Earth and EnvironmentChalmers University of Technology
Financial support:Gassnova (CLIMIT Demo)The Swedish Energy Agency
ECEEE Industrial Efficiency 2020 14-17 Sept. Gothenburg Panel 4
ECEEE Industrial Efficiency 2020 14-16 Sept. Gothenburg – Panel 4 2
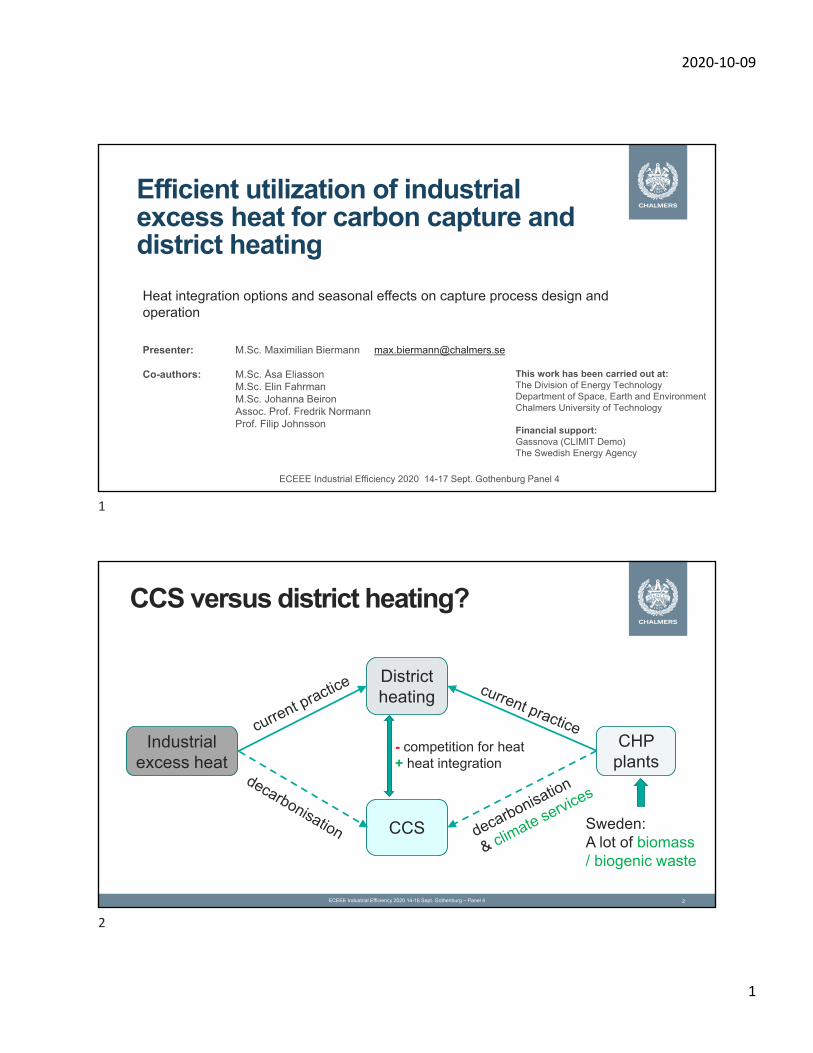
CCS versus district heating?
Industrial excess heat
CCS
Districtheating
CHP plants
Sweden:A lot of biomass/ biogenic waste
- competition for heat+ heat integration
1
2
2020‐10‐09
2
2020-10-09 ECEEE Industrial Efficiency 2020 14-16 Sept. Gothenburg – Panel 4 3
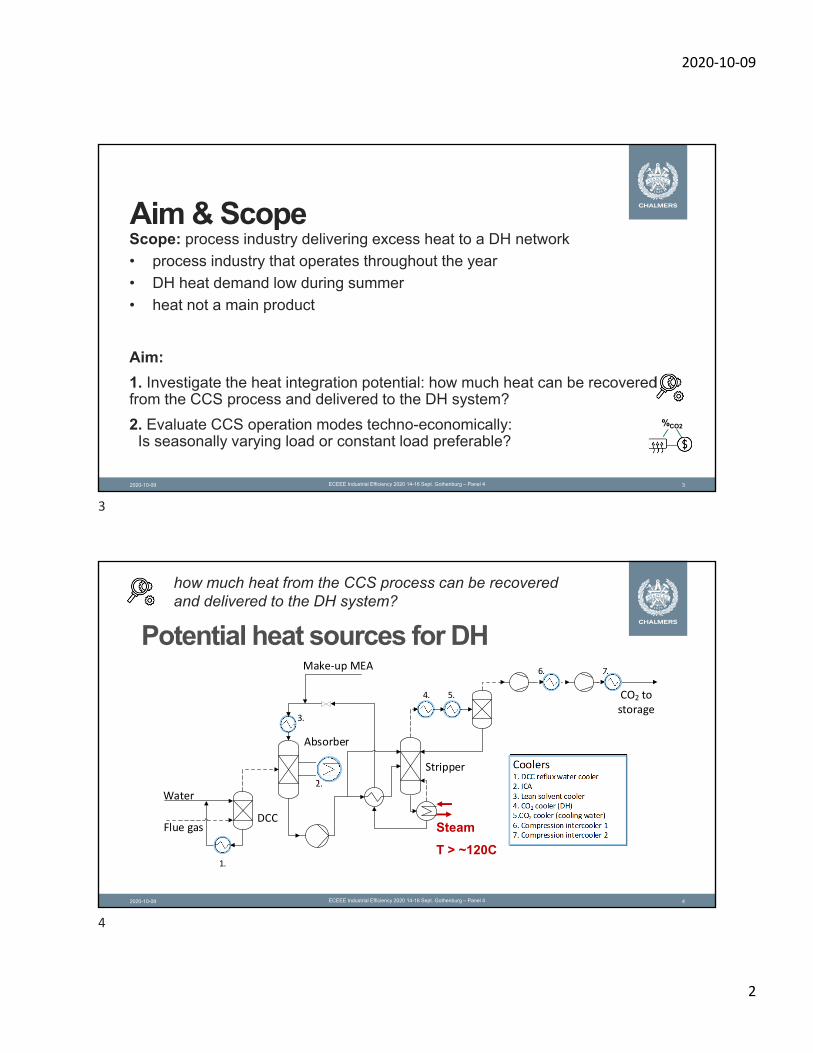
Aim & ScopeScope: process industry delivering excess heat to a DH network
• process industry that operates throughout the year
• DH heat demand low during summer
• heat not a main product
Aim:
1. Investigate the heat integration potential: how much heat can be recoveredfrom the CCS process and delivered to the DH system?
2. Evaluate CCS operation modes techno-economically: Is seasonally varying load or constant load preferable?
%CO2
2020-10-09 ECEEE Industrial Efficiency 2020 14-16 Sept. Gothenburg – Panel 4 4
Make‐up MEA
Absorber
Stripper
DCCFlue gas
Water
1.
Coolers 1. DCC reflux water cooler2. ICA3. Lean solvent cooler4. CO2 cooler (DH)5.CO2 cooler (cooling water)6. Compression intercooler 17. Compression intercooler 2
3.
2.
4.
6. 7.
5. CO2 to storage
Potential heat sources for DH
Steam
T > ~120C
how much heat from the CCS process can be recoveredand delivered to the DH system?
3
4

2020‐10‐09
3
ECEEE Industrial Efficiency 2020 14-16 Sept. Gothenburg – Panel 4 5
Operation modes and size of CCS
seasonally varying load or constant load?%CO2
• Current landscape: Excess heat for DH
• M3) smaller CCS plant, constant load + extra energy, DH upheld
Exc
ess
he
at
Process excess heat
DH
Process excess heat
CCS • M1): all excess heat to CCS, no DH
• M2): same sized CCS plant,seasonal varying load, DH upheld
Process excess heat
DH
CCS
Process excess heat
DHCCS
+energy+energy
2020-10-09 ECEEE Industrial Efficiency 2020 14-16 Sept. Gothenburg – Panel 4 6
SETUP/METHOD
5
6

2020‐10‐09
4
2020-10-09 ECEEE Industrial Efficiency 2020 14-16 Sept. Gothenburg – Panel 4 7
Case study setupRefinery flue gases Steelmill blast furnace gas
annual emissionsMt CO2 p.a.
0.45 1.20
CO2 concentration [vol.%] 8.9 24.6
DH delivery [GWh/a] 550 850
Heat source Process heat, heat collection network
Waste-gas fired CHP plant
• maximum available heat for CCS = amount currently delivered to DH• capture rate = 90%; gas flow varied to scale CCS plant• CO2 liquefaction to 7 bar transport pressure; • DH temperatures 50 – 90 °C
2020-10-09 ECEEE Industrial Efficiency 2020 14-16 Sept. Gothenburg – Panel 4 8
RESULTS
how much heat can be recovered from CCS and deliveredto the DH system?
Maximize heat supply to CCS; DH delivery not maintained; M1
7
8
2020‐10‐09
5
Make‐up MEA
Absorber
Stripper
DCCFlue gas
Water
1.
Coolers 1. DCC reflux water cooler2. ICA3. Lean solvent cooler4. CO2 cooler 5. Compression intercooler 16. Compression intercooler 2
3.
2.
4.
5. 6.
CO2 to storage
CCS process cooling demand
Minimum temperaturedifference: 10 °C
1. Cooling water recycle
2. Absorption intercooling
3. Lean solvent stream
4. Rich CO2 stream
5. Compression intercooler
6. Liquefaction precooler
0 5 10 15 20 25 30 35 40 45 50
Heat (MW)
0
20
40
60
80
100
120
140
Te
mpe
ratu
re (
°C)
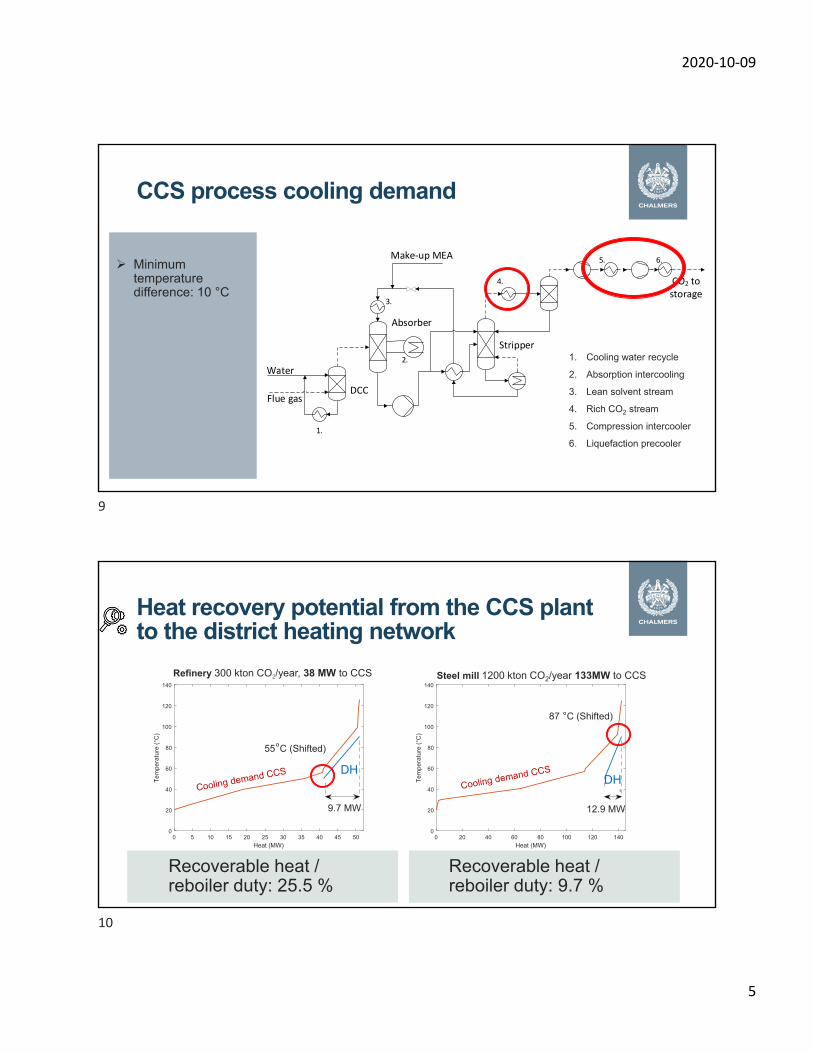
9.7 MW
0 20 40 60 80 100 120 140
Heat (MW)
0
20
40
60
80
100
120
140
Te
mpe
ratu
re (
°C)
12.9 MW
Refinery 300 kton CO2/year, 38 MW to CCS
9.7 MW
55°C (Shifted)
87 °C (Shifted)
Heat recovery potential from the CCS plant to the district heating network
Recoverable heat / reboiler duty: 25.5 %
Recoverable heat / reboiler duty: 9.7 %
DH
12.9 MW
Steel mill 1200 kton CO2/year 133MW to CCS
DH
9
10
2020‐10‐09
6
2020-10-09 ECEEE Industrial Efficiency 2020 14-16 Sept. Gothenburg – Panel 4 11
OPERATION MODES AND SIZEOF CCS
(STEEL MILL EXAMPLE)
%CO2
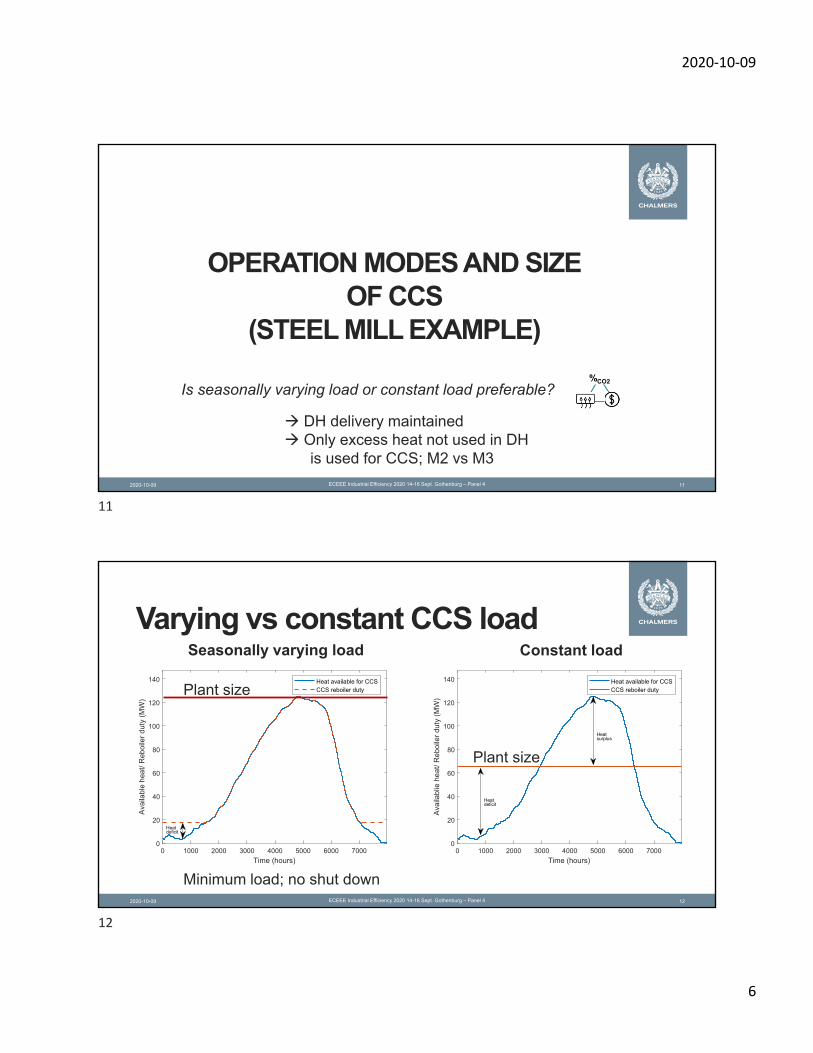
Is seasonally varying load or constant load preferable?
DH delivery maintained Only excess heat not used in DH
is used for CCS; M2 vs M3
2020-10-09 ECEEE Industrial Efficiency 2020 14-16 Sept. Gothenburg – Panel 4 12
Varying vs constant CCS load
0 1000 2000 3000 4000 5000 6000 7000
Time (hours)
0
20
40
60
80
100
120
140
Ava
ilab
le h
eat/
Reb
oile
r du
ty (
MW
)
Heat available for CCSCCS reboiler duty
Heatdeficit
0 1000 2000 3000 4000 5000 6000 7000
Time (hours)
0
20
40
60
80
100
120
140
Ava
ilabl
ie h
eat
/ R
ebo
iler
duty
(M
W)
Heat available for CCSCCS reboiler duty
Heatdeficit
Heatsurplus
Seasonally varying load Constant load
Minimum load; no shut down
Plant size
Plant size
11
12
2020‐10‐09
7
2020-10-09 ECEEE Industrial Efficiency 2020 14-16 Sept. Gothenburg – Panel 4 13
0 1000 2000 3000 4000 5000 6000 7000
Time (hours)
0
20
40
60
80
100
120
140
Cap
ture
d C
O2 (
ton/
h)
0 1000 2000 3000 4000 5000 6000 7000
Time (hours)
0
20
40
60
80
100
120
140
Cap
ture
d C
O2 (
ton/
h)
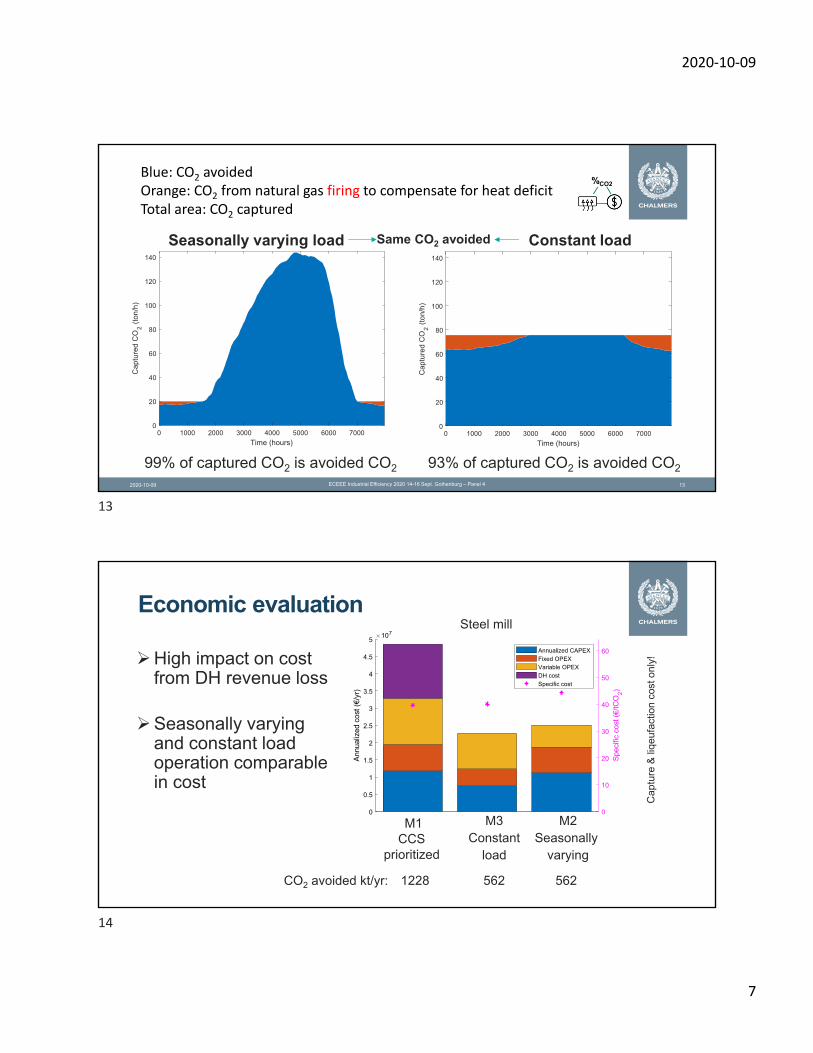
Blue: CO2 avoidedOrange: CO2 from natural gas firing to compensate for heat deficitTotal area: CO2 captured
Seasonally varying load Constant load
%CO2
99% of captured CO2 is avoided CO2 93% of captured CO2 is avoided CO2
Same CO2 avoided
Economic evaluation
High impact on cost from DH revenue loss
Seasonally varying and constant load operation comparable in cost
(1) 133.6 MW (2) CL, 65.6 MW (2) SV, 125.3 MW0
0.5
1
1.5
2
2.5
3
3.5
4
4.5
5107
0
10
20
30
40
50
60
2)
Annualized CAPEXFixed OPEXVariable OPEXDH cost
Specific cost
M1CCS
prioritized
M2Seasonally
varying
M3Constant
load
1228 562 562 CO2 avoided kt/yr:
Cap
ture
& li
qeuf
actio
nco
ston
ly!
Steel mill
13
14
2020‐10‐09
8
ECEEE Industrial Efficiency 2020 14-16 Sept. Gothenburg – Panel 4 15
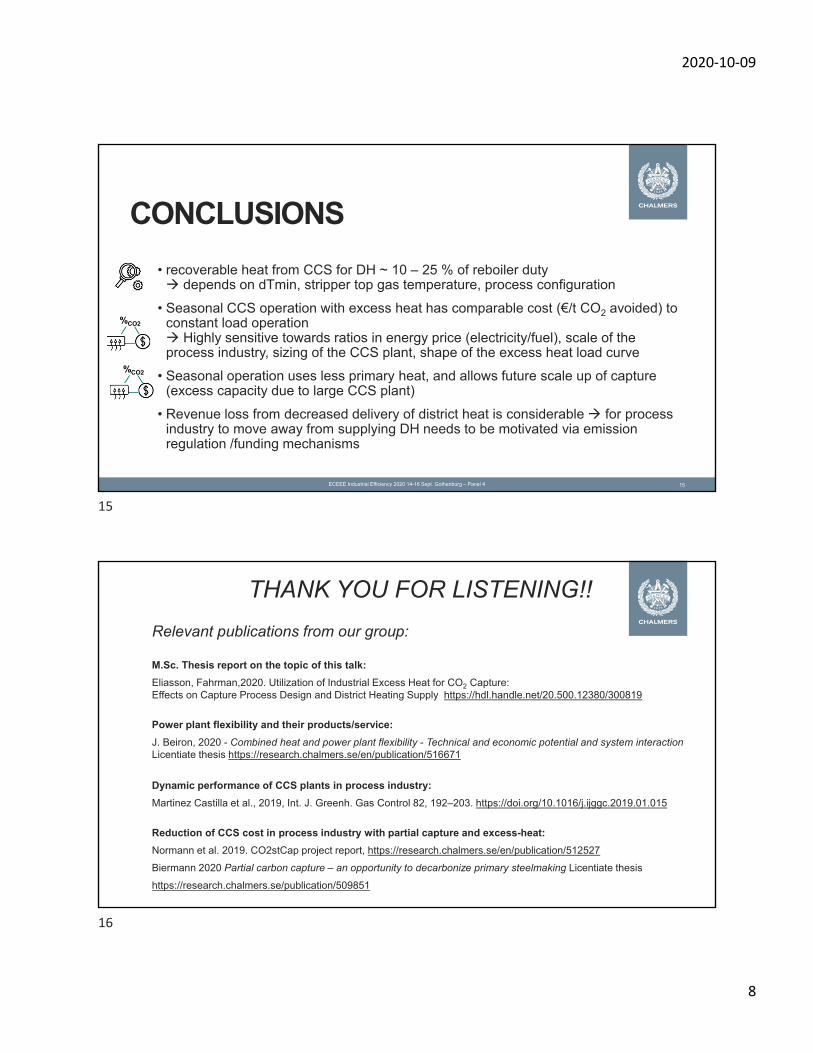
CONCLUSIONS
• recoverable heat from CCS for DH ~ 10 – 25 % of reboiler duty depends on dTmin, stripper top gas temperature, process configuration
• Seasonal CCS operation with excess heat has comparable cost (€/t CO2 avoided) to constant load operation Highly sensitive towards ratios in energy price (electricity/fuel), scale of the process industry, sizing of the CCS plant, shape of the excess heat load curve
• Seasonal operation uses less primary heat, and allows future scale up of capture(excess capacity due to large CCS plant)
• Revenue loss from decreased delivery of district heat is considerable for process industry to move away from supplying DH needs to be motivated via emission regulation /funding mechanisms
%CO2
%CO2
THANK YOU FOR LISTENING!!
Relevant publications from our group:
M.Sc. Thesis report on the topic of this talk:
Eliasson, Fahrman,2020. Utilization of Industrial Excess Heat for CO2 Capture: Effects on Capture Process Design and District Heating Supply https://hdl.handle.net/20.500.12380/300819
Power plant flexibility and their products/service:
J. Beiron, 2020 - Combined heat and power plant flexibility - Technical and economic potential and system interactionLicentiate thesis https://research.chalmers.se/en/publication/516671
Dynamic performance of CCS plants in process industry:
Martinez Castilla et al., 2019, Int. J. Greenh. Gas Control 82, 192–203. https://doi.org/10.1016/j.ijggc.2019.01.015
Reduction of CCS cost in process industry with partial capture and excess-heat:
Normann et al. 2019. CO2stCap project report, https://research.chalmers.se/en/publication/512527
Biermann 2020 Partial carbon capture – an opportunity to decarbonize primary steelmaking Licentiate thesis
https://research.chalmers.se/publication/509851
15
16

2020‐10‐09
9
2020-10-09
Methodology
Estimationof
available heat
Simulationsin
Aspen PLUS
Economicevaluation
Estimationof
recoverable
heat
Published data and literature
Rate-based modeling of
CO2
absorption in 30wt.%
MEA
Cost estimation of installed cost
for each piece of
equipment
Hot composite
curves
2020-10-09 Chalmers University of Technology 18
METHODTechnical modelling of CO2 capture process• Aspen Plus rate-based CO2 absorption model using 30 wt.% MEA 1
• Absorber CO2 separation rate 90%• Packing height: 20m absorber, 15 m stripper• Lean loading 0.30• Compressors in liquefaction plant: 20 bar (2 stage)
CAPEX estimations• Equipment cost from cost functions derived from detailed cost literature• Liquefaction cost scaled from Deng et al. 2
• Total plant cost estimation with enhanced-detailed factor method 3
• Individual cost factor for each piece of equipment 3
• No transport and storage cost considered
3 Ali et al., Int. J. Greenh. Gas Control 88, 10–23, 2019
2 Deng et al., Int. J. Refrig. 103, 301–315, 2019
1 Garđarsdóttir et al., Ind. Eng. Chem. Res. 54, 681–690. 2015
OPEX included:• Electricity price profiles (Sweden)• District heat price profiles (marginal system cost)• Cooling water, amine solvent, maintenance, labor, steam supply cost,
17
18

2020‐10‐09
10
2020-10-09 Chalmers University of Technology 19
COST SCOPEEquipment included:
Plant life time 25 years (2 years construction, and 23 years operation)Cost year 2016Discount rate 7.5 %First‐of‐a‐kind or N:th‐of‐a‐kind N:th‐of‐a‐kindGreenfield or brownfield BrownfieldLocation Rotterdam (Location factor 1)Currency conversion factor (€ to NOK 2016) 9.7 NOK/€Material flue gas fan CS (fmat 1)Material pumps SS316 Machine (fmat 1.3)Material other equipment SS316 Welded (fmat 1.75)
2020-10-09 Chalmers University of Technology 20
OPEX
19
20
2020‐10‐09
11
2020-10-09 Chalmers University of Technology 21
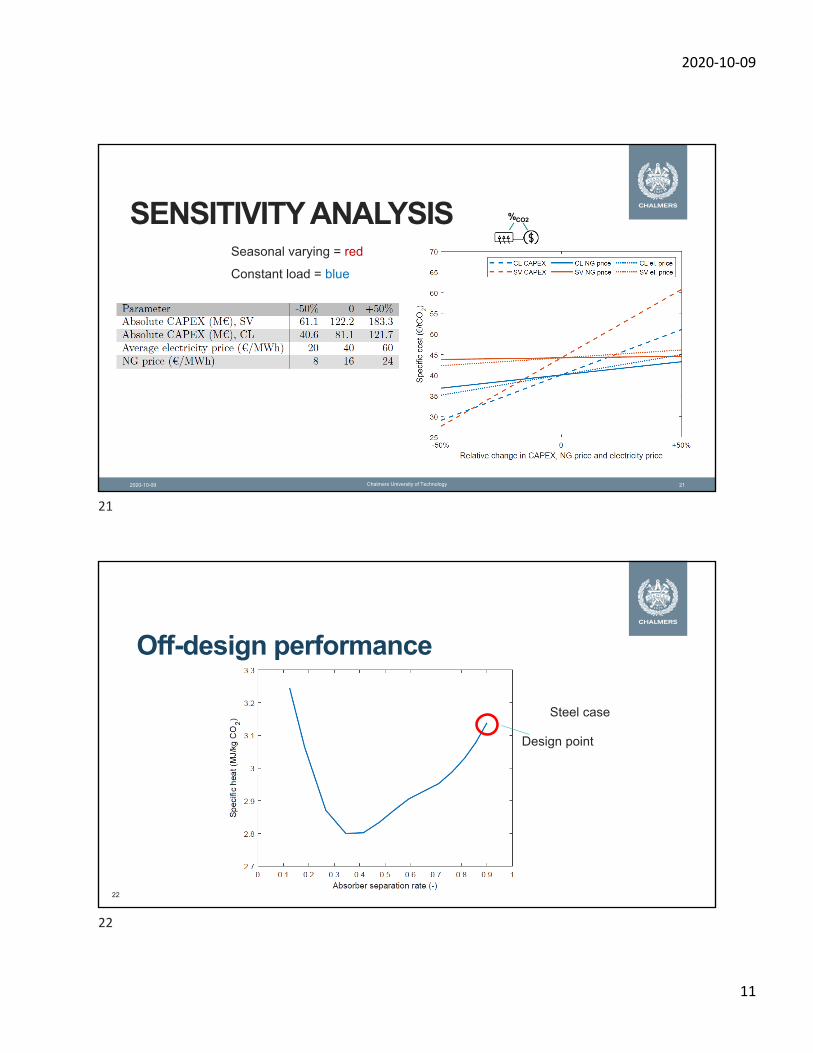
SENSITIVITYANALYSIS %CO2
Seasonal varying = red
Constant load = blue
Off-design performance
22
Steel case
Design point
21
22
2020‐10‐09
12
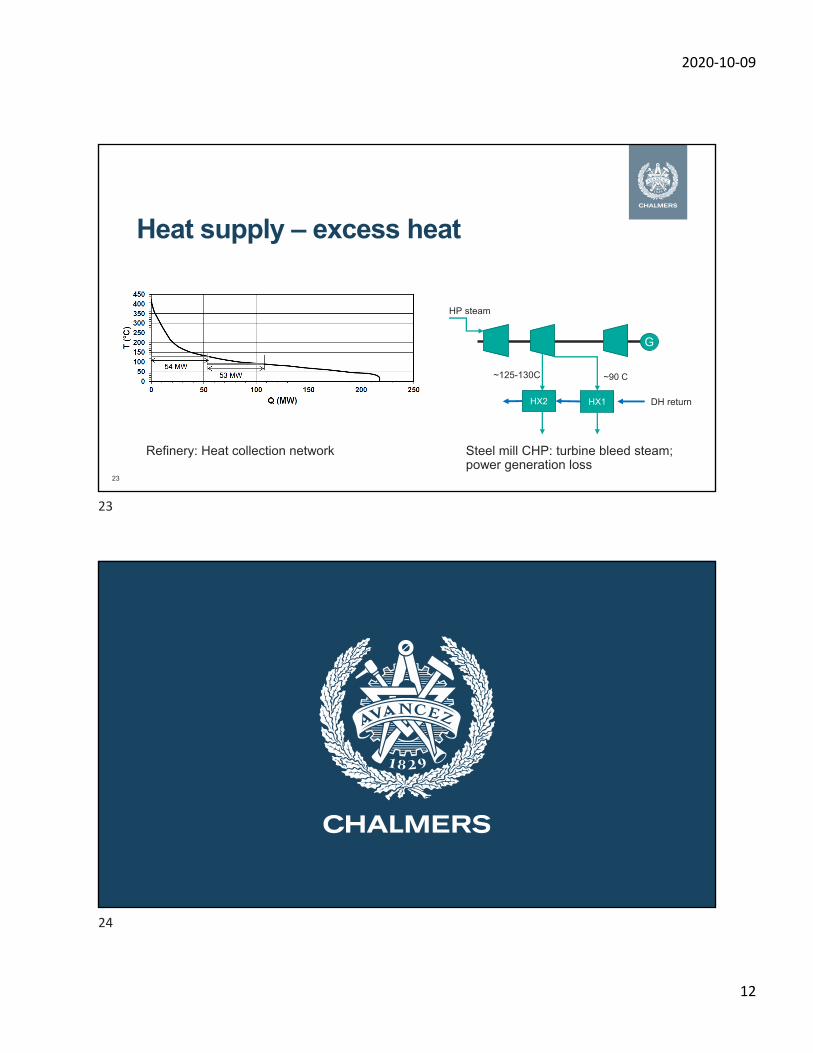
Heat supply – excess heat
23
Refinery: Heat collection network
HX2 HX1
~125-130C ~90 C
Steel mill CHP: turbine bleed steam; power generation loss
HP steam
DH return
G
23
24