eccolo media 2010 b2b technology collateral survey report
TRANSCRIPT

Eccolo Media 2010 B2B Technology Collateral Survey Report
September 2010
INTRODUCTIONFor three years now Eccolo Media has conducted its annual survey of US business technology purchasers to better understand how they perceive use and consume the most well-known types of marketing communications collateral in the sales cycle
With this historical perspective comes the opportunity to identify some ongoing trendsmdashand to cautiously predict the future This yearrsquos survey leads Eccolo to believe that traditional written collateral is evolving into two related but distinctly unique species and that the ability to embed multimedia elements into written documents will revolutionize the way marketing communications are planned distributed consumed and used
Above all Eccolo Mediarsquos third annual B2B Technology Collateral Survey Report reinforces a critical reality to which all marketers must pay heed the quality format length and topic of marketing collateral substantially affects the purchase decision as does the channels through which these assets are made available Those who donrsquot evolve their communications to satisfy end-user preferences are leaving potential advantage on the table
INSIDE
EXECUTIVE SUMMARY 2
ABOUT THE SURVEY 4
KEY FINDINGS 7 The Sphere of Influence 7How Technology Purchasers Consume Content 16The Emergence of Embedded Audio and Video in Written Collateral 22 The Channel Effect 25Marketing Collateral in the Sales Cycle 27
BEST PRACTICES FOR THE REAL WORLD 30
CONCLUSION 31
ACKNOWLEDGMENTS 31
ABOUT ECCOLO MEDIA 31copy Copyright 2010 Eccolo Media Inc This report may not be cited without the following full attribution Eccolo Media 2010 B2B Technology Collateral Survey Report wwweccolomediacom
2
EXECUTIVE SUMMARYWelcome to the third annual Eccolo Media B2B Technology Collateral Survey Report Conducting a survey of this detail analyzing the data and writing this report takes up a significant chunk of our time (and patience) every summer Why do we do it
Our initial desire was to validate some hypotheses around what makes good content and put some proof points behind our best practices Predictably wersquove had as many best practices debunked as wersquove had proven but the end result has always been nothing less than thrilling Few are looking as closely as Eccolo is at the art and science of writing marketing collateral and the opportunity to share our findings with our clients and colleagues makes the collateral survey report one of our favorite projects of the year
Five hundred US-based respondents responsible for making technology purchases were included in the 2010 survey We queried respondents on their use of five basic collateral types white papers case studies brochures amp data sheets audio or podcasted content and video collateral Respondents were subsequently segmented into ldquoinfluencersrdquo and ldquodecision makersrdquo they were further segmented by company size
Continuing Trends Respondents of every type continue to consume a wide variety of collateral when considering a technology purchase but once again brochures amp data sheets are the most frequently consumed collateral type They are followed very closely by white papers and less closely by case studies video collateral and audio files White papers were once again the winner however when it came to the perceived influence of collateral over the tech purchase They not only rank very high individually for the third year in a row white papers are ranked as the most influential when compared to the other collateral types overall While brochures amp data sheets are frequently consumed they impart less influence on the purchase decision White papers are also the most frequently shared type of content firmly cementing their place in the upper echelons of the marketerrsquos toolkit Our advice invest in white papers
Video use increased 82 percent from 2008 to 2009 The trend continues if a bit less dramatically in 2010 with video chalking up a 16 percent increase in use Wersquove anecdotally seen video more widely adopted as a collateral tool in the past 12 months and we predict that use will continue to grow both in terms of consumption and in the ways in which it can be creatively applied for marketing communications
A vast majority of respondents continue to consume all collateral types at the desktop and once again our advice is to optimize assets for digital consumption That means avoiding graphic elements and layouts that are difficult to view in a digital format but also taking advantage of this trend by embedding links to other
3
files in the written collateral We predict that file compression technologies will advance to the point where the level of interactivity in written collateral will be limited only by imagination And that leads us to what we believe to be the real jewel in this yearrsquos survey
Interactive Collateral Increases Influence This is the first year that Eccolo surveyed on the consumption of written content containing embedded audio andor video media While a bit less than half our respondents indicated that they had read written collateral that contained embedded audio or video files 93 percent clicked through to those media files and 80 percent indicated that the inclusion of the files positively or very positively increased the influence of the written collateral
Clearly the ability to embed multimedia files in written content is making meaningful changes in marketing communications We predict that improving compression technologies will lessen the big bump in overall file size that the addition of multimedia files creates making insertion of audio and video into written collateral types easier and more attractive Beyond the faddish appeal this type of interactive collateral allows marketers to insert a level of passion and personality into written content that is hard to ignore Written marketing communications that donrsquot include multimedia will begin to appear flat and old-fashioned by comparison
Content Strategy Is a C-Suite Opportunity Virtually all marketing and communications strategies require content for tactical deployment From lead generation to lead nurture to social media strategies to product launches and brand campaigns collateral and content assets are the tools required to spur interaction with the target end user
The majority of the 2010 survey respondents tell us that they consume the lionrsquos share of their marketing content in the pre-sales phase of the sales cyclemdashbefore they ever speak with a representative within a specific company Put in this context content becomes the entry point or the sales rep of every business Evangelizing proactive content strategy from the C-suite down will not only result in more cost-effective and targeted communications it will support a more nimble and relevant organization overallmdashone that is uniformly committed to more leads warmer leads and content assets that are more easily tuned for market advantage
We look forward to your comment and feedback on the Eccolo Media 2010 B2B Technology Collateral Survey Report
Warmly
Lorie Loe President and Chief Content Strategist
4
ABOUT THE SURVEY For the second year in a row Eccolo Media collaborated with Global Marketing Insite (GMI) a leading global market research firm to identify and manage participants for an in-depth survey on the use of B2B technology collateral during technology purchases GMI distributed the online survey in June 2010 and provided the results as raw data to Eccolo Media for analysis
Respondent titles included C-level executives vice presidents (VPs) managers directors developersprogrammers and technicians All worked for US-based companies All were responsible for either making B2B technology purchases or influencing purchasing decisions Only respondents who indicated that they had participated in a technology purchase in the last six months were included in the survey results
Of the 500 respondents included in the results 58 percent identified themselves as technology purchase decision makers the remaining 42 percent identified themselves as purchase influencers (Figure 1) Forty-five percent of respondents were under 40 years old 55 percent were over Respondents trended slightly toward having more experience in the technology industry this year as compared to 2009 a full 40 percent had in excess of 15 years experience 63 percent had upwards of 11 years of experience and 81 percent had more than eight years experience (Figure 2)
Thirty-two percent of respondents worked for enterprises (1000 employees or more) 39 percent for middle-market businesses (101-999 employees) and 29 percent for small businesses (less than 100 employees) as shown in Figure 3
Figure 1 Are you primarily an influencer or decision maker
5842
Influencers Decision makers
Figure 2 Respondentsrsquo years in the technology industry
0
10
20
30
40
14
1418
23
40
Less than2
2 to 4 5 to 7 8 to 10 11 to 15 More than15
5
When respondents were asked if they make purchasing decisions primarily from a business perspective a technology perspective or both the majority of respondents 61 percent indicated they consider both technical and business criteria when making a technology purchase Thirty-four percent used only technology criteria and only five percent of respondents considered purchases from a business perspective only
Respondent ProfilesAs in our 2009 report we used profiling questions to help us create two distinct respondent types the ldquodecision makerrdquo and the ldquoinfluencerrdquo Those respondents who identified themselves as decision makers tend to take a more holistic view of technology purchases considering them from both the business and technology perspectives Alternatively those respondents that identified as influencers are more likely to consider technology requirements alone Decision makers also tend to be higher up the organizational ladder C-level executives vice presidents (VPs) and directors Influencers on the other hand are more likely to identify themselves as managers developers and programmers (Figure 4)
Where our analyses identified statistically significant differences we also present data segmenting these two primary profiles by organizational size
Collateral Types and DefinitionsThe survey asked respondents questions about their use of five collateral types
bull White papers These provide analyses of technology or business trends from an independent vendor-neutral position
bull Case studiessuccess stories This type of collateral features stories of how customers successfully deployed a companyrsquos products or services
bull Podcasts These are digital audio recordings that can either be streamed from a Web site or downloaded onto a desktop or
39
32
29
Small business Less than 100 employees
Mid-market business 101-999 employees
Enterprise 1000 or more employees
Figure 3 Size of company
Profile 1 Decision Makers (58) Profile 2 Influencers (42)
Approach purchasing decisions from both business and technology perspectives
Approach purchasing decisions from a primarily technological perspective
C-level executives VPs or directors Managers developerstechnicians and programmers
Figure 4 Respective characteristics of decision makers and influencers
6
mobile device Topics vary but can include product overviews discussions by or interviews with subject matter experts or customer testimonials
bull Video This increasingly important form of collateral is being used for a broad range of marketing communications from customer success stories to product demonstrations to analyst or internal expert interviews
bull Product brochuresdata sheets These documents contain specific productservice or company information
In previous years survey questions were designed to determine respondent preferences for each collateral type What collateral did they find to be most influential Through what channel did they receive the collateral and did this affect the perceived influence of the collateral When in the purchasing cycle did they tend to view specific collateral types
These questions and more were then analyzed for useful data points
Presentation of Data and DiscussionFor our 2010 Survey Report we chose to organize our key findings into the following sections
bull The perceived influence of each type of collateral on the purchasing decision
bull What our respondents think makes ldquogoodrdquo (ie influential) content and collateral
bull The emerging practice of embedding audio and video files within written collateral and the perceived influence of this practice
bull The manner in which respondents received collateral (ie the channel)
bull How collateral is used in the sales cycle
As in previous years we used the results of our analysis to create a series of best practices that marketers can apply to optimize their content development processes and maximize the impact of their collateral assets Yoursquoll find this in the last section of our report
Respondents from larger companies are much more likely to consume contentWe found a marked difference in content consumption across all collateral types when looking at the size of the organization Both decision makers and influencers from both middle-market and enterprise companies were more likely to consume collateral than those from small companies
7
KEY FINDINGS
The Sphere of InfluenceOver the past three years we have probed to discover what types of collateral respondents consume and the degree to which each collateral type influences their purchasing decisions
As in previous years we found that both decision makers and influencers consume a wide range of collateral types when making technology purchases from product brochures to videos to podcasts case studies and white papers (Figure 5)
As we found in every past survey the most frequently consumed types of collateral are product brochures amp data sheets In fact respondents have only increased their use of this type of content over the years from 70 percent in 2008 to 78 percent in 2009 to this yearrsquos finding of 83 percent Case studies and white papers after making significant leaps in consumption rates between 2008 and 2009 remained relatively flat between 2009 and 2010 The biggest changes were in the frequency in which respondents consumed videos and podcasts amp audio files In 2008 only 28 percent of respondents had consumed these types of collateral In 2009 podcasts made a moderate gain up to 32 percent Video consumption increased more generously from 28 percent in 2008 to 51 percent in 2009
This year that trend continued Consumption of audio content increased 8 percentage points to 40 percent Video collateral consumption increased 8 points to 59 percentmdashthe same consumption levels that case studies were at in 2008
White Papers Remain Most InfluentialAlthough the number of respondents who had read a white paper in the past six months to evaluate a purchasing decision remained flat over the past 12 months (77 percent in 2009 and 76 percent in 2010) the vast majority of respondents
0 20 40 60 80 100
White papers
Case studiessuccess stories
Podcastsaudio files
Videos
Product brochuresdata sheets
83
59
40
67
76
Figure 5 Which of the following collateral types have you consumed in the last six months to evaluate a technology purchase
8
(83 percent) felt that white papers were moderately to extremely influential in helping them make their final purchase decisions Only one percent thought that white papers werenrsquot influential at all and 41 percent thought they were very to extremely influential (Figure 6)
In 2009 we identified a significant gap (22 percent) between decision makers and influencers in how influential they found white papersmdashwith 51 percent of decision makers finding white papers ldquovery to extremely influentialrdquo compared to just 29 percent of influencers who agreed with that statement That gap narrowed in 2010 and we now see a 13 percent difference between the two groups (Figure 7)
Organizational size also seems to make a considerable difference in how respondents view white papers Both decision makers and influencers from enterprise and mid-market companies are more likely to consume a white paper than their small business counterparts as seen in Figure 8
Figure 6 How influential are white papers in your purchasing decisions in 2010
0
10
20
30
40
50
Not influentialat all
Somewhatinfluential
Moderatelyinfluential
Veryinfluential
Extremelyinfluential
12
29
42
16
1
Figure 7 How influential are white papers in your purchasing decision (influencers versus decision makers)
0
10
20
30
40
50
Not influentialat all
Somewhatinfluential
Moderatelyinfluential
Very to extremelyinfluential
34
47 48
38
1714
1 1
Influencer Decision maker
9
Finally we asked respondents to rank all collateral types from most influential to least influential (Figure 9 on page 9) As in our previous surveys white papers were most frequently given as the most influential collateral type Statistically there was no difference between decision makers and influencers in this regard These findings continue to reinforce our position that the high usage rate of white papers coupled with their high perceived influence make them a very valuable asset in the marketing communications toolkit
0
20
40
60
80
100
EnterpriseMid-marketSmall business
Influencers Decision makers
7074
82
62
9085
Figure 8 Have you read any white papers in the past six months to evaluate a technology purchase
0
10
20
30
40
50
60
White papers Case studies Podcasts Videos Brochures
5Least influential
4321Most influential
Figure 11 Please rank the following collateral in order of influence in making purchasing decisions with 1 being most influential and 5 being least influential
39
18
5
10
2827
34
7
16 1617
27
1816
22
7
13
26
38
44
16
108
2018
Figure 9 Please rank the following collateral in order of influence in making purchasing decisions with 1 being most influential and 5 being least influential
10
When White Papers DisappointWhile other types of collateral such as case studies and brochures are fairly standard from company to company white papers can vary widely in terms of their format content and organization To better understand what makes for a ldquogoodrdquo white papermdashwhat increases influencemdashwe asked the 2010 respondents the reverse question what would most disappoint them when reading a white paper What would decrease its influence1
Poorly written content was most frequently ranked as the number one reason for respondents expressing disappointment in a white paper as seen in Figure 10 However other results surprised us For example contrary to what Eccolo has long believed white papers that donrsquot possess best practice recommendations do not disappoint implying that key take-aways or next steps are not particularly persuasive Neither do white papers that are too technical Instead white papers that donrsquot contain enough technical information are more likely to disappoint than those that possess too much
Case Studies Remain Valuable Collateral The frequency with which case studies were used to make technology purchases in 2010 remained statistically unchanged from 2009 (67 percent) When asked how influential they felt case studies were in making purchasing decisions (Figure 11) the answers were again statistically similar to 2009 79 percent of respondents in the 2010 survey felt that case studies were moderately to extremely influential Nineteen percent found them somewhat influential and only two percent found them not to be influential at all As in 2009 when compared to the influence of other collateral types 2010 respondents ranked them as the second-most influential after white papers (see Figure 9 on page 9)
Figure 10 When reading white papers what is most likely to disappoint you
Poorly written
Not technical enough
No real-life cases
Too much productvendor info
Poorly designed
No new industry developments
Not enough productvendor info
No best practicesguidelines
Too technical
MOST DISAPPOINTING
LEAST DISAPPOINTING
1 In previous surveys we attempted to answer this question by plainly asking respondents what increased the influence of white papers The resulting data sets however were flat with no real critical element for positive influence standing out Hence our decision to pose the question from the negative
11
As in 2009 we asked respondents if case study content would be more or less influential if offered in a different formatmdashfor example if delivered in non-written forms such as audio or video
There was virtually no change in the response to this query between 2009 and 2010 Written case studies were still most frequently tapped as the most influential of all case study formats (Figure 12)
When we compared the attitudes of decision makers and influencers toward case study format however we did find a statistically significant change in the 2010 survey results In the 2009 survey influencers were much more likely to find written case studies the most influential (76 percent) than decision makers (59 percent) In 2010 the difference in attitudes was just a single percentage point 65 percent of influencers found written case studies to be the most influential form of customer testimonial compared to 64 percent of decision makers who indicated the same thing The gap also closed in respondentsrsquo attitudes toward video testimonials In 2009 40 percent of decision makers specified video as the most influential format for customer testimonials compared to 23 percent of influencers In 2010 this gap narrowed to just three percentage points (35 percent and 33 percent respectively) (Figure 13)
65 33
2
Video testimonial
Audio testimonial
Written case study
Figure 16 In which format would youfind a customer testimonial
to be most influential
Figure 12 In which format would you find a customer testimonial to be most influential
0
5
10
15
20
25
30
35
40
Not influentialat all
Somewhatinfluential
Moderatelyinfluential
Veryinfluential
Extremelyinfluential
10
29
40
19
2
Figure 12 How influential are case studies in your purchasing decisionsFigure 11 How influential are case studies in your purchasing decisions
12
Podcasts More Frequently Consumed But Less Influential Podcasts continued to play a role in the technology purchasing cycle in 2010 The percentage of survey respondents who listened to a podcast in the past six months rose to 36 percent up from from 32 percent in 2009 (Figure 5) However the percentage of respondents who found them to be moderately to extremely influential dropped to 78 percent (see Figure 14) compared to 82 percent in 2009 As in 2009 podcasts are ranked the fifth-most influential type of collateral when compared to other surveyed collateral types (see Figure 9 on page 9)
One interesting change identified in this yearrsquos results in 2009 decision makers found podcasts more influential than influencers didmdashwith 87 percent finding them moderately to extremely influential compared to just 73 percent of influencers In 2010 these results flipped with 81 percent of influencers finding podcasts moderately to extremely influential compared to 76 percent of decision makers (Figure 15) Decision makers were still more likely to find podcasts very or extremely influential however
0
5
10
15
20
25
30
35
Not influentialat all
Somewhatinfluential
Moderatelyinfluential
Veryinfluential
Extremelyinfluential
12
3234
21
1
Figure 14 How influential were podcastsaudio files in making a final purchasing decision
0
10
20
30
40
50
60
70
Audio testimonialVideo testimonialWrtitten case study
64
33
65
35
30
Influencers Decision makers
Figure 13 In which format would you find a customer testimonial to be most influential (decision maker versus influencer)
13
In those cases when respondents indicated they had listened to a podcast we asked what type of podcast it had been By far the most common type of podcast consumed was one covering technology trends (78 percent) followed by business trends (55 percent) Forty-five percent listened to information on vendor products andor solutions with the smallest but still significant percentage (39 percent) listening to customer testimonials in that format (Figure 16)
Video Continued Growth in Consumption Our 2010 survey respondents indicated that their use of video when considering technology purchase continues to increase The percentage of respondents who watched a video in the past six months increased eight points to 59 percent This result continues a trend seen in the 2009 survey results when use of video increased from 28 percent in 2008 to 49 percent in 2009 (Figure 17)
Figure 16 What types of podcastaudio files have you listened to in order to evaluate a technology purchase Check all that apply
0
20
40
60
80
OtherInformationon vendor
productssolutions
Businesstrends
Technologytrends
Customertestimonial
1
39
78
55
45
0
10
20
30
40
50
Not influentialat all
Somewhatinfluential
Moderatelyinfluential
Veryinfluential
Extremelyinfluential
28
15
7
35
46
26
17
24
02
Influencers Decision makers
Figure 15 How influential were podcastsaudio files in making a final purchasing decision
14
In 2008 video was ranked fifth in influence when compared to other types of collateral In 2009 it moved into fourth place surpassing podcasts in influence In 2010 it held on to that position (Figure 9 on page 9) When asked how influential the video was on a technology purchase 26 percent of respondents indicated they found videos to be moderately to extremely influential (Figure 18)
We further inquired as to the type of video respondents consumed during a technology purchase Respondents watched more product tutorialsdemos by a wide margin over other types of video collateral (76 percent) Vendor marketing videos were the next most commonly viewed type of video (61 percent) followed by customer testimonials (37 percent) and on-demand webinars (33 percent) as seen in Figure 19
Figure 18 How influential were the videos in making a final purchasing decision
0
10
20
30
40
Not influentialat all
Somewhatinfluential
Moderatelyinfluential
Veryinfluential
Extremelyinfluential
9
39
31
19
2
Figure 17 Have you viewed any videos in the past six months to evaluate a technology purchase
0
20
40
60
80
NoYes
201020092008
28
49 50
72
51 50
15
Brochures and Data Sheets Consumed Most Frequently In 2009 brochures and data sheets were the most frequently consumed of all collateralmdashwith 78 percent of respondents using them to make a purchasing decision over the past six months In 2010 83 percent of respondents consumed these types of collateral But although 79 percent of respondents rated them as moderately to extremely influential when making a technology purchase (Figure 20) they still tend to rank behind white papers and case studies when compared with other collateral types (see Figure 9 on page 9)
As with many other types of collateral large enterprises were more likely to consume brochures than small companies (less than 100 employees) with mid-sized companies falling in between
This year we continue to recommend that brochures and data sheets be a part of every marketerrsquos collateral toolbox precisely because they are so frequently
Figure 20 How influential were brochuresdata sheets in making a final purchasing decision
0
10
20
30
40
50
Not influentialat all
Somewhatinfluential
Moderatelyinfluential
Veryinfluential
Extremelyinfluential
8
31
40
18
3
0
10
20
30
40
50
60
70
80
OtherProducttutorials demos
On-demandwebinars
Vendormarketing
videos
Customertestimonials
37
61
2
76
33
Figure 19 What types of video files have you listened to in order to evaluate a technology purchase
16
consumed We also reiterate our advice that it might not be strategically wise to rely solely on this type of collateral given that their perceived influence is lower than some other collateral types Rather brochures and data sheets should be ldquomust-haverdquo assets in a well-rounded collateral portfolio that includes a broad variety of other content types
How Technology Purchasers Consume ContentAs in previous years we devoted significant time to analyzing how technology purchasers consume and use collateral In this section we share our results plus our insight into what respondents believe makes ldquogoodrdquo collateral
Most Collateral Still Consumed Digitally One surprise in this yearrsquos survey results was that although respondents still have an overwhelming preference for consuming written content on the desktop rather than printing it out that number actually declined across all types of written collateral (Figure 21) For example in 2009 a full three-fourths (76 percent) of respondents read white papers digitally a similar percentage (77 percent) did the same with brochuresdata sheets and even more (84 percent) consumed case studies in this form Yet in 2010 these numbers declined The percentage that read white papers digitally dropped 15 full percentage points to 61 percent The percent of respondents who indicated that they preferred to consume brochuressdata sheets in digital form declined only slightly but just 71 percent of respondents said they preferred to consume case studies in digital formmdash10 percentage points less than in 2009
We also found significant changes in whether respondents downloaded audio files onto their desktops or mobile devices or listened to audio streams from Web sites In 2009 62 percent preferred to download audio files onto their desktop or mobile devices versus 38 percent that preferred to stream directly from a Web site Yet in
Figure 21 Did you view this collateral online or did you downloadprint before reading (2009 vs 2010)
0
20
40
60
80
100
Brochuresdata sheetsCase studiessuccess storiesWhite paper
Downloaded printed 2010
Downloaded printed 2009
Viewedonline 2010
Viewedonline 2009
76
61
24
39
84
74
16
26
77
71
23
29
17
2010 these numbers shifted substantially toward a preference for streaming this year 57 percent of respondents preferred streaming versus 43 percent that favored downloading these types of files
This brings the method of consumption of audio files more in line with respondentsrsquo preferences for streaming video Sixty-four percent of 2010 respondents preferred to watch video streamed live from the source versus 36 percent that preferred to download it to a desktop or mobile device (Figure 22)
However whether streamed or downloaded 92 percent of podcast listeners and 96 percent of video viewers still consumed content on the desktop This is a critical finding that has remained consistent from year to year given that the desktop is the platform of choice for consuming all types of content marketers should ensure that all written content leverages links to other files and other communication channels as much as possible giving technology purchasers the option of drilling down to more details as desired
All Collateral Has Viral PotentialWe continue to be interested in the fact that all collateral is highly viral Technology purchasers routinely share collateral with the vast majority of 2010 respondents (89 percent) sharing the white papers they read with others as seen in Figure 23 Nearly as many (87 percent) share case studies followed by podcasts (84 percent) and then brochuresdata sheets and video (80 percent each)
White papers are still the most viral with 34 percent of respondents sharing them with three or more people Thirty-two percent of respondents shared podcasts with three or more people and 28 percent shared case studies with as many Lagging slightly behind were video (25 percent) and brochuresdata sheets (23 percent)
0
20
40
60
80
Downloaded tomobile device
then listented toviewed
Downloaded todesktop
then listened
Streamed fromlive source
5764
35 32
84
Podcasts Videos
Figure 22 Did you consume this content online or did you download before viewinglistening
18
Another interesting development although all collateral is shared primarily in digital form more 2010 respondents say that they share written collateralmdashwhite papers case studies and brochuresdata sheetsmdashin both digital and printed forms (Figure 24) than did respondents to the 2009 survey For example whereas the percentage of respondents who shared digitalelectronic versions of white papers actually declined in the past yearmdashfrom 60 percent to 51 percentmdashthe percentage of respondents who shared white papers in both digital and printed form increased from 30 percent to 37 percent We therefore caution marketers not to discount the viral nature of hard copy content as it clearly still is considered useful by a significant percentage of respondents
In 2009 influencers were more likely to share only digital copy and decision makers were more likely to share both printed and digital content However in 2010 this is no longer the case and these two respondent types are now in parity on this issue
0
5
10
15
20
25
30
35
White papers Case studies Podcasts Videos Brochures
5 or more
43210
11
13
16
20 20
23
28
25 25
30
33
31
27
30
19
14
17
12
6 6
9
7
5
8 8
6 6 6
12
27
Figure 23 On average how many other decision makers or influencers in your organization did you share each piece of collateral with
19
Preferences For Length Are ChangingEccolo Media has established best practices for serving up marketing collateral in small well-written packages Our survey results over the past three years have reinforced our belief that this serves marketers best However this year we observed subtleties in the survey results that indicated respondents may be adjusting their preferences for longer collateral length
White papersWersquove stated repeatedly that white papers are a highly influential collateral consumed at a high frequency by both decision makers and influencers But marketing communications professionals continue to debate the ideal length of a white paper how do they give the right amount of informationmdashnot too much and not too little As Figure 25 shows the majority of respondents (55 percent) felt six pages or less to be the ideal number However this percentage is 10 points less than last yearrsquos 65 percent
Figure 25 What do you feel is the ideal length for a white paper in number of pages
0
10
20
30
40
50
More than10 pages
10 pages8 pages6 pages4 pages
21
34
27
13
5
Figure 24 In what format did you share collateral
0
10
20
30
40
50
60
70
BrochuresCasestudies
Whitepapers
51
37
52
12
35
12
49
19
32
Digitalelectronic version Hard copy Both
20
Simultaneously the percentage of respondents who preferred white papers of just four pages dropped from 24 percent down to 21 percent and the percentage of respondents who leaned toward eight pages increased from 21 percent to 27 percent This indicates that the ldquoideal lengthrdquo is shifting toward longer rather than shorter white papers
There were no general differences in length preferences between decision makers and influencers but technology purchasers from small companies tend to prefer shorter white papers with 31 percent preferring four pages or less compared to 19 percent of enterprise and 18 percent of mid-market companies that said the same
Case StudiesIn 2008 most respondents reported the ideal length of a case study to be two pages or approximately 800 to 1000 words Yet in 2009 we received different responses That year the largest proportion of respondents (39 percent) indicated that four is the ideal number of pages for a written case study This yearrsquos 2010 survey backed up last yearrsquos numbers with 37 percent preferring four pages and virtually identical percentages of respondents preferring two pages or less (35 percent) or six pages or more (28 percent) as seen in Figure 26
In general the larger the company the longer they prefer their case studies to be with the largest percentage of respondents from small companies (33 percent) preferring two-page case studies the largest percentage from middle-market firms (40 percent) and large enterprises (39 percent) preferring four-page case studies
Figure 26 What do you feel is the ideal number of pages for a case studysuccess story
0
10
20
30
40
50
More than6 pages
6 pages4 pages2 pages1 page
8
27
37
19
9
21
Podcasts The ideal length of a podcast decreased in 2010 Figure 27 shows that the greatest number of respondents (36 percent) selected five to seven minutes as the ideal length Most respondents (81 percent) prefer podcasts that are 10 minutes or less in length and in general the smaller the company the shorter they prefer their podcasts to be
Video The majority of 2010 respondents (38 percent) indicated that the ideal length of video content is five to seven minutes while 24 percent preferred videos of eight to 10 minutes (Figure 28) These results indicate a slight trending to shorter videos over the 2009 respondentrsquos preferences for length where 31 percent preferred five to seven minutes and 28 percent preferred eight to 10 minutes
Figure 28 What do you feel is the ideal length of a video in number of minutes
0
10
20
30
40
More than15 minutes
11 to 15minutes
8 to 10minutes
5 to 7minutes
2 to 4minutes
Less than2 minutes
6 5
19
38
24
8
Figure 27 What do you feel is the ideal length of a podcastaudio file in number of minutes
0
10
20
30
40
More than15 minutes
11 to 15minutes
8 to 10minutes
5 to 7minutes
2 to 4minutes
Less than2 minutes
4
15
36
26
13
6
22
The Emergence of Embedded Audio and Video in Written Collateral Over the past 12 months Eccolo has participated in an emerging trend in marketing collateral embedding audio and video files into digital versions of written documents such as white papers and case studies We therefore asked respondents if they had consumed any written collateral that contained embedded audio andor video files A significant proportion of themmdash45 percentmdashsaid they had done so
Respondents were most likely to encounter embedded files in case studies (66 percent) followed by white papers (55 percent) and brochures (48 percent) (Figure 29)
Perhaps the most dramatic of our findings in this part of the survey was the overwhelming percentage of respondents who clicked through to these embedded files 93 percent Twenty-five percent clicked through to video files six percent clicked through to audio files and 62 percent clicked through to both audio and video (Figure 30)
And most importantly when respondents were asked whether the inclusion of audio or video files positively or negatively affected the overall influence of the written collateral 80 percent indicated that they viewed it either ldquovery positivelyrdquo or ldquopositivelyrdquo (Figure 31)
0
10
20
30
40
50
60
70
80
OtherBrochuresCase studiesWhite paper
55
66
48
1
Figure 29 Which types of written collateral have you consumed that included embedded audio or video
23
In particular decision makers felt this trend was positive 83 percent ranked it as very positively or positively affecting the overall influence of the written collateral compared to 74 percent of influencers (Figure 32)
The size of company also mattered when it came to the perceived influence of embedded files with enterprises more likely to indicate that it was very positive (26 percent) compared to middle-market (14 percent) or small firms (15 percent) On a related note small businesses were more likely to say that embedded files had no influence at allmdash33 percent versus 15 percent of middle-market and 15 percent of enterprise firms (Figure 33)
0
10
20
30
40
50
60
70
80
NeitherBoth audiovideoAudio onlyVideo only
25
6
62
7
Figure 30 Did you click through or open any of the video or audio files embedded in the collateral
0
10
20
30
40
50
60
70
Very negativelyNegativelyNo influencePositivelyVery positively
18
62
18
1 1
Figure 31 How did the inclusion of embedded audio and video files affect the overall influence of the written collateral
24
These results support Eccolorsquos belief that interactivity is becoming ldquotable stakesrdquo for written marketing communications collateral Given the preference that purchasers have already expressed for consuming collateral at their desktop (see Figure 22) marketers that donrsquot experiment with embedded ausio video and other multimedia formats as well as links off to other communications and social media channels risk delivering assets that seem obsolete and old-fashioned
Figure 32 How did the inclusion of embedded audio and video files affect the overall influence of the written collateral
(decision makers versus influencers)
0
20
40
60
80
Very NegativelyNegativelyNo InfluencePositivelyVery Positively
24
59
66
15
26
1 0 018
Decision maker Influencer
0
10
20
30
40
50
60
70
80
Very negativelyNegativelyNo influencePositivelyVery positively
15 14
26
52
69
59
33
15 15
0 1 0 0 1 0
Small business Mid-market Enterprise
Figure 33 How did the inclusion of embedded audio and video files affect the overall influence of the written collateral
(small business vs mid-market vs enterprise)
25
The Channel EffectLast year we added a section to our annual survey that investigated how channel affects the perceived influence of collateral We defined channel as the specific avenue through which the respondent receives contentmdashwhether from a personal contact from a corporate Web site or from a sales representative for example
One fact immediately stood out in 2009 most respondents receive written collateral through the corporate Web site (Figure 34) This did not change in 2010 with 71 percent of respondents finding white papers through such sites 65 percent getting brochuresdata sheets through that channel and 56 percent acquiring case studies in that way
The next most frequently used channel for receiving a white paper in 2010 was a download from a direct response campaign (59 percent) which implies that this should be considered an important means of distribution for marketers This was followed by forwarded by a sales repcompany contact (54 percent) obtained from a personal contact (52 percent) accessed via social media (39 percent) and absorbed through webinars (34 percent) In 2009 podcasts and video collateral differed from written content when it came to how respondents ldquofoundrdquo them but that difference
0
10
20
30
40
50
60
70
80
Mentioned ina webinar
Linked to ordiscussed in
onlinesocial media
Linked in toan RSS feed
Forwarded bysales rep
company contact
BrowsingcorporateWeb site
Downloadedfrom
direct responsecampaign
Forwardedfrom
personalcontact
White papers Case studies Podcasts Videos Brochures
5253
46
34
37
59
71
5655
6665
54
4241
38
27
23
31
39
31
39
29
23
34
20
23
20
12
21
15
44
38
45
34 34
Figure 34 Through which channels have you received collateral
26
has vanished Last year podcasts were almost equally acquired from a personal contact or from a corporate Web site (48 percent and 49 percent respectively) However this year the corporate Web site trumped the personal contact channel (55 percent to 46 percent) And this was even more dramatically the case for video with only 34 percent of respondents indicating they had been forwarded a video by a personal contact while 66 percent found video on corporate Web sites This trend underscores the importance of the corporate Web site across all collateral types
When we examined the comparative influence of these various channels another interesting fact emerged although a piece of collateral referred to or forwarded by a personal contact was most frequently cited as the most influential channel for all types of collateral browsing the corporate Web site was the second most frequently cited answer (Figure 35) When you consider that the corporate Web site is clearly the most frequently used channel for collateral delivery coupled with its high perceived influence you understand why we recommend that you make investing in and frequently refreshing your Web site a priority
0
10
20
30
40
50
60
70
80
Mentioned ina webinar
Linked to ordiscussed in
onlinesocial media
Linked in toan RSS feed
Forwarded bysales rep
company contact
BrowsingcorporateWeb site
Downloadedfrom
direct responsecampaign
Forwardedfrom
personalcontact
White papers Case studies Podcasts Videos Brochures
73
79
767677
41
38
424343
6060
53
61
69
37
33
28
39
46
2220
31
1716
35
42
3836
31 31
27
33
29
19
Figure 35 Positive influence by channel
27
Marketing Collateral in the Sales CycleThe relationship between collateral and actual sales is an important one How do the various types of collateralmdashwhite papers case studies brochuresmdashimpact sales When should you deliver a white paper case study podcast or video to drive potential purchasers to the next step in the sales cycle Is there a way to time delivery of specific collateral types to nurture leads more effectively
For the purposes of this survey we defined the various stages of the technology evaluation and purchase process as
bull Pre-salemdashConsidering solutions and vendors
bull Initial salemdashReviewing vendor qualifications capabilities and RFP responses
bull Mid-salemdashReviewing details of the solution with one vendor
bull Final salemdashCustomization negotiation and procurement
In our 2008 survey results we saw that respondents most frequently consumed each collateral type for the first time in the pre-sale process by a significant margin that is before they send out RFPs or initiate discussions with specific vendors In that first Eccolo B2B survey white papers were read by 61 percent of respondents during this phase case studies by 48 percent podcasts by 53 percent video by 51 percent and brochuresdata sheets by 62 percent
0
10
20
30
40
50
60
70
Final sales processMid-sales processInitial sales processPre-sales process
White papers Case studies Podcasts Videos Brochures
53
49
41
49
31
3435
30
25
13
21
2018
11
4 3 4 3 4
60
Figure 36 In which phase of the purchasing cycle did you FIRST consume each type of collateral
28
Our 2010 survey indicates that these habits are shifting While the majority of respondents still consume most collateral for the first time in the pre-sales phase more respondents now indicate they first consumed collateral in either the initial sales or mid-sales phases than they did in 2008 For example the percentage of respondents who first consumed a white paper during the pre-sales process dropped to 53 percent the percentage that listened to a podcast dropped down to 41 percent (Figure 36) In both cases respondents appeared to move their first consumption of those types of collateral down to the next two stages of the sales process
When we further segmented the 2010 data to compare the habits of influencers to decision makers we observed some additional interesting trends across the board influencers tend to consume content earlier in the sales cycle than decision makers (Figure 37)
0 10 20 30 40 50 60 70 80
Final salesprocess
Mid-salesprocess
Initial salesprocess
Pre-salesprocess
Final salesprocess
Mid-salesprocess
Initial salesprocess
Pre-salesprocess
White papers Case studies Podcasts Videos Brochures
63
58
41
6458
4752
65
2526
3830
23
915
1417
9
2111
2
4542
3647
56
3339
3430
27
1614
2319
12
65
74
5
25
26
35
20
4
Infl
uen
cers
Deci
sio
n M
akers
Figure 37 In which phase of the purchasing cycle did you FIRST consume each type of collateral (influencers vs decision makers)
29
Likewise respondents from small businesses consume collateral for the first time during the pre-sales stage at much higher rates than respondents from middle-market or large companies For example 70 percent of small businesses consume white papers for the first time during this stage compared to just 40 percent of middle-market firms and 56 percent of large enterprises (Figure 38)
Small Business Mid-market Enterprise
0
10
20
30
40
50
60
70
80
Final sales processMid-sales processInitial Sales ProcessPre-sales Process
70
40
56
16
38
29
9
17
12
5 53
Figure 38 In which phase of the purchasing cycle did you FIRST consume white papers in 2010
As in previous years we find the data around use of collateral in the sales cycle interesting in the way it potentially sheds light on the relationship between influencers and decion makers We believe we are seeing the influencerrsquos role in terms of considering potential technology purchases and the subsequent sharing of that collatera and other information with decision makers a bit later in the cycle
30
BEST PRACTICES FOR THE REAL WORLD
As in previous years we conclude our delivery of the survey results by providing what we consider to be actionable advice that marketing professionals can apply right now to improve the quality and impact of their communications assets
1 Create white papers This is a repeating theme but one that is definitely worth saying once again white papers are frequently consumed and considered highly influential over the technology purchase Take advantage by creating a few well-written papers that clearly outline strategic advancements your solutions and products are aligned with Leverage your work by chunking up the main points into best practice documents blog posts ldquohow tordquo guides and other materials to support your broader campaign needs
2 Embed multimedia files Start with short video or audio clips to keep overall file sizes low but jump on this trend Once you get your feet under you you can advance to interactive charts and graphs Flash elements and other media types Donrsquot ignore the opportunity to be among the first to take advantage of this evolving practice
3 Consider all content to be social content We know that tech purchasers share content and that they consider materials forwarded from a personal contact to be very influential Plan all content and collateral assets from the perspective of stimulating discussion and sharing Think about interactivity links to discussion boards and user groups and point to blog posts and other communications channels in all materials
4 Deliver all content assets digitally and be prepared to have end users print them While the majority of respondents view collateral assets on the desktop a respectable number still enjoy printing out the materials they download and will further share print materials with others Avoid cross-page spreads and column designs that are hard to read digitally and remember to provide clear URLs for any links away from the materials for those reading print versions
5 Merchandise content on the Web Your company Web site is the most frequent location for obtaining content and it ranks second only to personal contacts in terms of influence Make the most of this channel by merchandising featured content and assets on landing pages and microsites that extend the thought leadership and discussion begun in your collateral Remember potential purchasers interact with your content before they interact with you so ensure viewers can easily see all the other channels through which they can engage with you all in one fun-filled information portal
31
CONCLUSIONAs we wrap up this yearrsquos annual survey report we find ourselves coming back to some basic advice that has been a theme of this section in each previous report plan
Eccolo believes that the requirement of content strategymdashidentifying communication topics and thoughtfully planning the assets required to achieve goalsmdashis relevant at every level of the marketing organization The proliferation of online channels and ever more sophisticated lead generation systems require a steady stream of fresh relevant content to successfully engage purchasers Itrsquos very easy to be distracted by looming deadlines and shifting priorities but creating a content strategy and identifying a clear development roadmap that describes topic format and channel is essential if you truly want to improve results
And the opportunity to improve results is significant Well-planned development cycles can shorten time to market reduce costs and ensure a consistent message across all external assets Further organizations that show a healthy respect for content planning and development from the top down will experience the entire enterprise shifting to a more responsive stance These companies are tuned toward deeper customer conversations that align with the end userrsquos preferences for sales and marketing information and by the very style of their collateral assets signal a positive experience for the potential buyer
Engage With UsEccolo Media welcomes your feedback on this report Email us at infoeccolomediacom with specific feedback or visit our blog at httpeccolomediatypepadcom to join in our ongoing discussion of best practices in content strategy
ACKNOWLEDGEMENTSWe would like to acknowledge the participation of the following team members for their efforts in bringing the Eccolo Media 2010 B2B Technology Collateral Survey Report to life Maite Figueroa Alice LaPlante Lorie Loe Courtney Love and Michael Sudol
32
ABOUT ECCOLO MEDIAEccolo Media specializes in strategic marketing insight and content development for some of the worldrsquos best-known technology companies An agency of exceptional writers Eccolo combines deep experience with ongoing research to identify and apply best practices for producing remarkable content The agency helps align clientsrsquo marketing needs with their key business goals by bringing a proactive innovative approach to the planning and execution of collateral in both traditional and new media channels Founded in 2007 Eccolo Media is headquartered in San Francisco California and fulfills a wide range of project needs throughout the Americas and EMEA Visit our Web site at wwweccolomediacom
ABOUT EMEDIA - Our Marketing Sponsoremedia has specialized in generating B2B sales leads and building demand since 1999 We reach more than 35 million decision makers across over 80 niche-oriented audiences within the following B2B areasInformation Technology ElectronicsSupply ChainLogistics Occupational HealthCorporate Finance Environmental ManagementHuman Resources Project ManagementMarketingSales PackagingConvertingB2B Events Construction amp ArchitectsManufacturing Professional DevelopmentSmall Business Design EngineersProcurement Control EngineersHospitality Management PrintingHealthcare Tech
emediarsquos expertise and personal service permit effective implementation of Guaranteed Cost-per-Lead programs for our clientsrsquo offers and collateral Or we can drive highly targeted traffic to clientsrsquo web pages
Contact emedia at 800-782-6167 630-288-8480 or inquiriesemediausacom
ACCELERATED B2B LEAD GENERATION mdash ON DEMAND
wwwemediausacom

2
EXECUTIVE SUMMARYWelcome to the third annual Eccolo Media B2B Technology Collateral Survey Report Conducting a survey of this detail analyzing the data and writing this report takes up a significant chunk of our time (and patience) every summer Why do we do it
Our initial desire was to validate some hypotheses around what makes good content and put some proof points behind our best practices Predictably wersquove had as many best practices debunked as wersquove had proven but the end result has always been nothing less than thrilling Few are looking as closely as Eccolo is at the art and science of writing marketing collateral and the opportunity to share our findings with our clients and colleagues makes the collateral survey report one of our favorite projects of the year
Five hundred US-based respondents responsible for making technology purchases were included in the 2010 survey We queried respondents on their use of five basic collateral types white papers case studies brochures amp data sheets audio or podcasted content and video collateral Respondents were subsequently segmented into ldquoinfluencersrdquo and ldquodecision makersrdquo they were further segmented by company size
Continuing Trends Respondents of every type continue to consume a wide variety of collateral when considering a technology purchase but once again brochures amp data sheets are the most frequently consumed collateral type They are followed very closely by white papers and less closely by case studies video collateral and audio files White papers were once again the winner however when it came to the perceived influence of collateral over the tech purchase They not only rank very high individually for the third year in a row white papers are ranked as the most influential when compared to the other collateral types overall While brochures amp data sheets are frequently consumed they impart less influence on the purchase decision White papers are also the most frequently shared type of content firmly cementing their place in the upper echelons of the marketerrsquos toolkit Our advice invest in white papers
Video use increased 82 percent from 2008 to 2009 The trend continues if a bit less dramatically in 2010 with video chalking up a 16 percent increase in use Wersquove anecdotally seen video more widely adopted as a collateral tool in the past 12 months and we predict that use will continue to grow both in terms of consumption and in the ways in which it can be creatively applied for marketing communications
A vast majority of respondents continue to consume all collateral types at the desktop and once again our advice is to optimize assets for digital consumption That means avoiding graphic elements and layouts that are difficult to view in a digital format but also taking advantage of this trend by embedding links to other
3
files in the written collateral We predict that file compression technologies will advance to the point where the level of interactivity in written collateral will be limited only by imagination And that leads us to what we believe to be the real jewel in this yearrsquos survey
Interactive Collateral Increases Influence This is the first year that Eccolo surveyed on the consumption of written content containing embedded audio andor video media While a bit less than half our respondents indicated that they had read written collateral that contained embedded audio or video files 93 percent clicked through to those media files and 80 percent indicated that the inclusion of the files positively or very positively increased the influence of the written collateral
Clearly the ability to embed multimedia files in written content is making meaningful changes in marketing communications We predict that improving compression technologies will lessen the big bump in overall file size that the addition of multimedia files creates making insertion of audio and video into written collateral types easier and more attractive Beyond the faddish appeal this type of interactive collateral allows marketers to insert a level of passion and personality into written content that is hard to ignore Written marketing communications that donrsquot include multimedia will begin to appear flat and old-fashioned by comparison
Content Strategy Is a C-Suite Opportunity Virtually all marketing and communications strategies require content for tactical deployment From lead generation to lead nurture to social media strategies to product launches and brand campaigns collateral and content assets are the tools required to spur interaction with the target end user
The majority of the 2010 survey respondents tell us that they consume the lionrsquos share of their marketing content in the pre-sales phase of the sales cyclemdashbefore they ever speak with a representative within a specific company Put in this context content becomes the entry point or the sales rep of every business Evangelizing proactive content strategy from the C-suite down will not only result in more cost-effective and targeted communications it will support a more nimble and relevant organization overallmdashone that is uniformly committed to more leads warmer leads and content assets that are more easily tuned for market advantage
We look forward to your comment and feedback on the Eccolo Media 2010 B2B Technology Collateral Survey Report
Warmly
Lorie Loe President and Chief Content Strategist
4
ABOUT THE SURVEY For the second year in a row Eccolo Media collaborated with Global Marketing Insite (GMI) a leading global market research firm to identify and manage participants for an in-depth survey on the use of B2B technology collateral during technology purchases GMI distributed the online survey in June 2010 and provided the results as raw data to Eccolo Media for analysis
Respondent titles included C-level executives vice presidents (VPs) managers directors developersprogrammers and technicians All worked for US-based companies All were responsible for either making B2B technology purchases or influencing purchasing decisions Only respondents who indicated that they had participated in a technology purchase in the last six months were included in the survey results
Of the 500 respondents included in the results 58 percent identified themselves as technology purchase decision makers the remaining 42 percent identified themselves as purchase influencers (Figure 1) Forty-five percent of respondents were under 40 years old 55 percent were over Respondents trended slightly toward having more experience in the technology industry this year as compared to 2009 a full 40 percent had in excess of 15 years experience 63 percent had upwards of 11 years of experience and 81 percent had more than eight years experience (Figure 2)
Thirty-two percent of respondents worked for enterprises (1000 employees or more) 39 percent for middle-market businesses (101-999 employees) and 29 percent for small businesses (less than 100 employees) as shown in Figure 3
Figure 1 Are you primarily an influencer or decision maker
5842
Influencers Decision makers
Figure 2 Respondentsrsquo years in the technology industry
0
10
20
30
40
14
1418
23
40
Less than2
2 to 4 5 to 7 8 to 10 11 to 15 More than15
5
When respondents were asked if they make purchasing decisions primarily from a business perspective a technology perspective or both the majority of respondents 61 percent indicated they consider both technical and business criteria when making a technology purchase Thirty-four percent used only technology criteria and only five percent of respondents considered purchases from a business perspective only
Respondent ProfilesAs in our 2009 report we used profiling questions to help us create two distinct respondent types the ldquodecision makerrdquo and the ldquoinfluencerrdquo Those respondents who identified themselves as decision makers tend to take a more holistic view of technology purchases considering them from both the business and technology perspectives Alternatively those respondents that identified as influencers are more likely to consider technology requirements alone Decision makers also tend to be higher up the organizational ladder C-level executives vice presidents (VPs) and directors Influencers on the other hand are more likely to identify themselves as managers developers and programmers (Figure 4)
Where our analyses identified statistically significant differences we also present data segmenting these two primary profiles by organizational size
Collateral Types and DefinitionsThe survey asked respondents questions about their use of five collateral types
bull White papers These provide analyses of technology or business trends from an independent vendor-neutral position
bull Case studiessuccess stories This type of collateral features stories of how customers successfully deployed a companyrsquos products or services
bull Podcasts These are digital audio recordings that can either be streamed from a Web site or downloaded onto a desktop or
39
32
29
Small business Less than 100 employees
Mid-market business 101-999 employees
Enterprise 1000 or more employees
Figure 3 Size of company
Profile 1 Decision Makers (58) Profile 2 Influencers (42)
Approach purchasing decisions from both business and technology perspectives
Approach purchasing decisions from a primarily technological perspective
C-level executives VPs or directors Managers developerstechnicians and programmers
Figure 4 Respective characteristics of decision makers and influencers
6
mobile device Topics vary but can include product overviews discussions by or interviews with subject matter experts or customer testimonials
bull Video This increasingly important form of collateral is being used for a broad range of marketing communications from customer success stories to product demonstrations to analyst or internal expert interviews
bull Product brochuresdata sheets These documents contain specific productservice or company information
In previous years survey questions were designed to determine respondent preferences for each collateral type What collateral did they find to be most influential Through what channel did they receive the collateral and did this affect the perceived influence of the collateral When in the purchasing cycle did they tend to view specific collateral types
These questions and more were then analyzed for useful data points
Presentation of Data and DiscussionFor our 2010 Survey Report we chose to organize our key findings into the following sections
bull The perceived influence of each type of collateral on the purchasing decision
bull What our respondents think makes ldquogoodrdquo (ie influential) content and collateral
bull The emerging practice of embedding audio and video files within written collateral and the perceived influence of this practice
bull The manner in which respondents received collateral (ie the channel)
bull How collateral is used in the sales cycle
As in previous years we used the results of our analysis to create a series of best practices that marketers can apply to optimize their content development processes and maximize the impact of their collateral assets Yoursquoll find this in the last section of our report
Respondents from larger companies are much more likely to consume contentWe found a marked difference in content consumption across all collateral types when looking at the size of the organization Both decision makers and influencers from both middle-market and enterprise companies were more likely to consume collateral than those from small companies
7
KEY FINDINGS
The Sphere of InfluenceOver the past three years we have probed to discover what types of collateral respondents consume and the degree to which each collateral type influences their purchasing decisions
As in previous years we found that both decision makers and influencers consume a wide range of collateral types when making technology purchases from product brochures to videos to podcasts case studies and white papers (Figure 5)
As we found in every past survey the most frequently consumed types of collateral are product brochures amp data sheets In fact respondents have only increased their use of this type of content over the years from 70 percent in 2008 to 78 percent in 2009 to this yearrsquos finding of 83 percent Case studies and white papers after making significant leaps in consumption rates between 2008 and 2009 remained relatively flat between 2009 and 2010 The biggest changes were in the frequency in which respondents consumed videos and podcasts amp audio files In 2008 only 28 percent of respondents had consumed these types of collateral In 2009 podcasts made a moderate gain up to 32 percent Video consumption increased more generously from 28 percent in 2008 to 51 percent in 2009
This year that trend continued Consumption of audio content increased 8 percentage points to 40 percent Video collateral consumption increased 8 points to 59 percentmdashthe same consumption levels that case studies were at in 2008
White Papers Remain Most InfluentialAlthough the number of respondents who had read a white paper in the past six months to evaluate a purchasing decision remained flat over the past 12 months (77 percent in 2009 and 76 percent in 2010) the vast majority of respondents
0 20 40 60 80 100
White papers
Case studiessuccess stories
Podcastsaudio files
Videos
Product brochuresdata sheets
83
59
40
67
76
Figure 5 Which of the following collateral types have you consumed in the last six months to evaluate a technology purchase
8
(83 percent) felt that white papers were moderately to extremely influential in helping them make their final purchase decisions Only one percent thought that white papers werenrsquot influential at all and 41 percent thought they were very to extremely influential (Figure 6)
In 2009 we identified a significant gap (22 percent) between decision makers and influencers in how influential they found white papersmdashwith 51 percent of decision makers finding white papers ldquovery to extremely influentialrdquo compared to just 29 percent of influencers who agreed with that statement That gap narrowed in 2010 and we now see a 13 percent difference between the two groups (Figure 7)
Organizational size also seems to make a considerable difference in how respondents view white papers Both decision makers and influencers from enterprise and mid-market companies are more likely to consume a white paper than their small business counterparts as seen in Figure 8
Figure 6 How influential are white papers in your purchasing decisions in 2010
0
10
20
30
40
50
Not influentialat all
Somewhatinfluential
Moderatelyinfluential
Veryinfluential
Extremelyinfluential
12
29
42
16
1
Figure 7 How influential are white papers in your purchasing decision (influencers versus decision makers)
0
10
20
30
40
50
Not influentialat all
Somewhatinfluential
Moderatelyinfluential
Very to extremelyinfluential
34
47 48
38
1714
1 1
Influencer Decision maker
9
Finally we asked respondents to rank all collateral types from most influential to least influential (Figure 9 on page 9) As in our previous surveys white papers were most frequently given as the most influential collateral type Statistically there was no difference between decision makers and influencers in this regard These findings continue to reinforce our position that the high usage rate of white papers coupled with their high perceived influence make them a very valuable asset in the marketing communications toolkit
0
20
40
60
80
100
EnterpriseMid-marketSmall business
Influencers Decision makers
7074
82
62
9085
Figure 8 Have you read any white papers in the past six months to evaluate a technology purchase
0
10
20
30
40
50
60
White papers Case studies Podcasts Videos Brochures
5Least influential
4321Most influential
Figure 11 Please rank the following collateral in order of influence in making purchasing decisions with 1 being most influential and 5 being least influential
39
18
5
10
2827
34
7
16 1617
27
1816
22
7
13
26
38
44
16
108
2018
Figure 9 Please rank the following collateral in order of influence in making purchasing decisions with 1 being most influential and 5 being least influential
10
When White Papers DisappointWhile other types of collateral such as case studies and brochures are fairly standard from company to company white papers can vary widely in terms of their format content and organization To better understand what makes for a ldquogoodrdquo white papermdashwhat increases influencemdashwe asked the 2010 respondents the reverse question what would most disappoint them when reading a white paper What would decrease its influence1
Poorly written content was most frequently ranked as the number one reason for respondents expressing disappointment in a white paper as seen in Figure 10 However other results surprised us For example contrary to what Eccolo has long believed white papers that donrsquot possess best practice recommendations do not disappoint implying that key take-aways or next steps are not particularly persuasive Neither do white papers that are too technical Instead white papers that donrsquot contain enough technical information are more likely to disappoint than those that possess too much
Case Studies Remain Valuable Collateral The frequency with which case studies were used to make technology purchases in 2010 remained statistically unchanged from 2009 (67 percent) When asked how influential they felt case studies were in making purchasing decisions (Figure 11) the answers were again statistically similar to 2009 79 percent of respondents in the 2010 survey felt that case studies were moderately to extremely influential Nineteen percent found them somewhat influential and only two percent found them not to be influential at all As in 2009 when compared to the influence of other collateral types 2010 respondents ranked them as the second-most influential after white papers (see Figure 9 on page 9)
Figure 10 When reading white papers what is most likely to disappoint you
Poorly written
Not technical enough
No real-life cases
Too much productvendor info
Poorly designed
No new industry developments
Not enough productvendor info
No best practicesguidelines
Too technical
MOST DISAPPOINTING
LEAST DISAPPOINTING
1 In previous surveys we attempted to answer this question by plainly asking respondents what increased the influence of white papers The resulting data sets however were flat with no real critical element for positive influence standing out Hence our decision to pose the question from the negative
11
As in 2009 we asked respondents if case study content would be more or less influential if offered in a different formatmdashfor example if delivered in non-written forms such as audio or video
There was virtually no change in the response to this query between 2009 and 2010 Written case studies were still most frequently tapped as the most influential of all case study formats (Figure 12)
When we compared the attitudes of decision makers and influencers toward case study format however we did find a statistically significant change in the 2010 survey results In the 2009 survey influencers were much more likely to find written case studies the most influential (76 percent) than decision makers (59 percent) In 2010 the difference in attitudes was just a single percentage point 65 percent of influencers found written case studies to be the most influential form of customer testimonial compared to 64 percent of decision makers who indicated the same thing The gap also closed in respondentsrsquo attitudes toward video testimonials In 2009 40 percent of decision makers specified video as the most influential format for customer testimonials compared to 23 percent of influencers In 2010 this gap narrowed to just three percentage points (35 percent and 33 percent respectively) (Figure 13)
65 33
2
Video testimonial
Audio testimonial
Written case study
Figure 16 In which format would youfind a customer testimonial
to be most influential
Figure 12 In which format would you find a customer testimonial to be most influential
0
5
10
15
20
25
30
35
40
Not influentialat all
Somewhatinfluential
Moderatelyinfluential
Veryinfluential
Extremelyinfluential
10
29
40
19
2
Figure 12 How influential are case studies in your purchasing decisionsFigure 11 How influential are case studies in your purchasing decisions
12
Podcasts More Frequently Consumed But Less Influential Podcasts continued to play a role in the technology purchasing cycle in 2010 The percentage of survey respondents who listened to a podcast in the past six months rose to 36 percent up from from 32 percent in 2009 (Figure 5) However the percentage of respondents who found them to be moderately to extremely influential dropped to 78 percent (see Figure 14) compared to 82 percent in 2009 As in 2009 podcasts are ranked the fifth-most influential type of collateral when compared to other surveyed collateral types (see Figure 9 on page 9)
One interesting change identified in this yearrsquos results in 2009 decision makers found podcasts more influential than influencers didmdashwith 87 percent finding them moderately to extremely influential compared to just 73 percent of influencers In 2010 these results flipped with 81 percent of influencers finding podcasts moderately to extremely influential compared to 76 percent of decision makers (Figure 15) Decision makers were still more likely to find podcasts very or extremely influential however
0
5
10
15
20
25
30
35
Not influentialat all
Somewhatinfluential
Moderatelyinfluential
Veryinfluential
Extremelyinfluential
12
3234
21
1
Figure 14 How influential were podcastsaudio files in making a final purchasing decision
0
10
20
30
40
50
60
70
Audio testimonialVideo testimonialWrtitten case study
64
33
65
35
30
Influencers Decision makers
Figure 13 In which format would you find a customer testimonial to be most influential (decision maker versus influencer)
13
In those cases when respondents indicated they had listened to a podcast we asked what type of podcast it had been By far the most common type of podcast consumed was one covering technology trends (78 percent) followed by business trends (55 percent) Forty-five percent listened to information on vendor products andor solutions with the smallest but still significant percentage (39 percent) listening to customer testimonials in that format (Figure 16)
Video Continued Growth in Consumption Our 2010 survey respondents indicated that their use of video when considering technology purchase continues to increase The percentage of respondents who watched a video in the past six months increased eight points to 59 percent This result continues a trend seen in the 2009 survey results when use of video increased from 28 percent in 2008 to 49 percent in 2009 (Figure 17)
Figure 16 What types of podcastaudio files have you listened to in order to evaluate a technology purchase Check all that apply
0
20
40
60
80
OtherInformationon vendor
productssolutions
Businesstrends
Technologytrends
Customertestimonial
1
39
78
55
45
0
10
20
30
40
50
Not influentialat all
Somewhatinfluential
Moderatelyinfluential
Veryinfluential
Extremelyinfluential
28
15
7
35
46
26
17
24
02
Influencers Decision makers
Figure 15 How influential were podcastsaudio files in making a final purchasing decision
14
In 2008 video was ranked fifth in influence when compared to other types of collateral In 2009 it moved into fourth place surpassing podcasts in influence In 2010 it held on to that position (Figure 9 on page 9) When asked how influential the video was on a technology purchase 26 percent of respondents indicated they found videos to be moderately to extremely influential (Figure 18)
We further inquired as to the type of video respondents consumed during a technology purchase Respondents watched more product tutorialsdemos by a wide margin over other types of video collateral (76 percent) Vendor marketing videos were the next most commonly viewed type of video (61 percent) followed by customer testimonials (37 percent) and on-demand webinars (33 percent) as seen in Figure 19
Figure 18 How influential were the videos in making a final purchasing decision
0
10
20
30
40
Not influentialat all
Somewhatinfluential
Moderatelyinfluential
Veryinfluential
Extremelyinfluential
9
39
31
19
2
Figure 17 Have you viewed any videos in the past six months to evaluate a technology purchase
0
20
40
60
80
NoYes
201020092008
28
49 50
72
51 50
15
Brochures and Data Sheets Consumed Most Frequently In 2009 brochures and data sheets were the most frequently consumed of all collateralmdashwith 78 percent of respondents using them to make a purchasing decision over the past six months In 2010 83 percent of respondents consumed these types of collateral But although 79 percent of respondents rated them as moderately to extremely influential when making a technology purchase (Figure 20) they still tend to rank behind white papers and case studies when compared with other collateral types (see Figure 9 on page 9)
As with many other types of collateral large enterprises were more likely to consume brochures than small companies (less than 100 employees) with mid-sized companies falling in between
This year we continue to recommend that brochures and data sheets be a part of every marketerrsquos collateral toolbox precisely because they are so frequently
Figure 20 How influential were brochuresdata sheets in making a final purchasing decision
0
10
20
30
40
50
Not influentialat all
Somewhatinfluential
Moderatelyinfluential
Veryinfluential
Extremelyinfluential
8
31
40
18
3
0
10
20
30
40
50
60
70
80
OtherProducttutorials demos
On-demandwebinars
Vendormarketing
videos
Customertestimonials
37
61
2
76
33
Figure 19 What types of video files have you listened to in order to evaluate a technology purchase
16
consumed We also reiterate our advice that it might not be strategically wise to rely solely on this type of collateral given that their perceived influence is lower than some other collateral types Rather brochures and data sheets should be ldquomust-haverdquo assets in a well-rounded collateral portfolio that includes a broad variety of other content types
How Technology Purchasers Consume ContentAs in previous years we devoted significant time to analyzing how technology purchasers consume and use collateral In this section we share our results plus our insight into what respondents believe makes ldquogoodrdquo collateral
Most Collateral Still Consumed Digitally One surprise in this yearrsquos survey results was that although respondents still have an overwhelming preference for consuming written content on the desktop rather than printing it out that number actually declined across all types of written collateral (Figure 21) For example in 2009 a full three-fourths (76 percent) of respondents read white papers digitally a similar percentage (77 percent) did the same with brochuresdata sheets and even more (84 percent) consumed case studies in this form Yet in 2010 these numbers declined The percentage that read white papers digitally dropped 15 full percentage points to 61 percent The percent of respondents who indicated that they preferred to consume brochuressdata sheets in digital form declined only slightly but just 71 percent of respondents said they preferred to consume case studies in digital formmdash10 percentage points less than in 2009
We also found significant changes in whether respondents downloaded audio files onto their desktops or mobile devices or listened to audio streams from Web sites In 2009 62 percent preferred to download audio files onto their desktop or mobile devices versus 38 percent that preferred to stream directly from a Web site Yet in
Figure 21 Did you view this collateral online or did you downloadprint before reading (2009 vs 2010)
0
20
40
60
80
100
Brochuresdata sheetsCase studiessuccess storiesWhite paper
Downloaded printed 2010
Downloaded printed 2009
Viewedonline 2010
Viewedonline 2009
76
61
24
39
84
74
16
26
77
71
23
29
17
2010 these numbers shifted substantially toward a preference for streaming this year 57 percent of respondents preferred streaming versus 43 percent that favored downloading these types of files
This brings the method of consumption of audio files more in line with respondentsrsquo preferences for streaming video Sixty-four percent of 2010 respondents preferred to watch video streamed live from the source versus 36 percent that preferred to download it to a desktop or mobile device (Figure 22)
However whether streamed or downloaded 92 percent of podcast listeners and 96 percent of video viewers still consumed content on the desktop This is a critical finding that has remained consistent from year to year given that the desktop is the platform of choice for consuming all types of content marketers should ensure that all written content leverages links to other files and other communication channels as much as possible giving technology purchasers the option of drilling down to more details as desired
All Collateral Has Viral PotentialWe continue to be interested in the fact that all collateral is highly viral Technology purchasers routinely share collateral with the vast majority of 2010 respondents (89 percent) sharing the white papers they read with others as seen in Figure 23 Nearly as many (87 percent) share case studies followed by podcasts (84 percent) and then brochuresdata sheets and video (80 percent each)
White papers are still the most viral with 34 percent of respondents sharing them with three or more people Thirty-two percent of respondents shared podcasts with three or more people and 28 percent shared case studies with as many Lagging slightly behind were video (25 percent) and brochuresdata sheets (23 percent)
0
20
40
60
80
Downloaded tomobile device
then listented toviewed
Downloaded todesktop
then listened
Streamed fromlive source
5764
35 32
84
Podcasts Videos
Figure 22 Did you consume this content online or did you download before viewinglistening
18
Another interesting development although all collateral is shared primarily in digital form more 2010 respondents say that they share written collateralmdashwhite papers case studies and brochuresdata sheetsmdashin both digital and printed forms (Figure 24) than did respondents to the 2009 survey For example whereas the percentage of respondents who shared digitalelectronic versions of white papers actually declined in the past yearmdashfrom 60 percent to 51 percentmdashthe percentage of respondents who shared white papers in both digital and printed form increased from 30 percent to 37 percent We therefore caution marketers not to discount the viral nature of hard copy content as it clearly still is considered useful by a significant percentage of respondents
In 2009 influencers were more likely to share only digital copy and decision makers were more likely to share both printed and digital content However in 2010 this is no longer the case and these two respondent types are now in parity on this issue
0
5
10
15
20
25
30
35
White papers Case studies Podcasts Videos Brochures
5 or more
43210
11
13
16
20 20
23
28
25 25
30
33
31
27
30
19
14
17
12
6 6
9
7
5
8 8
6 6 6
12
27
Figure 23 On average how many other decision makers or influencers in your organization did you share each piece of collateral with
19
Preferences For Length Are ChangingEccolo Media has established best practices for serving up marketing collateral in small well-written packages Our survey results over the past three years have reinforced our belief that this serves marketers best However this year we observed subtleties in the survey results that indicated respondents may be adjusting their preferences for longer collateral length
White papersWersquove stated repeatedly that white papers are a highly influential collateral consumed at a high frequency by both decision makers and influencers But marketing communications professionals continue to debate the ideal length of a white paper how do they give the right amount of informationmdashnot too much and not too little As Figure 25 shows the majority of respondents (55 percent) felt six pages or less to be the ideal number However this percentage is 10 points less than last yearrsquos 65 percent
Figure 25 What do you feel is the ideal length for a white paper in number of pages
0
10
20
30
40
50
More than10 pages
10 pages8 pages6 pages4 pages
21
34
27
13
5
Figure 24 In what format did you share collateral
0
10
20
30
40
50
60
70
BrochuresCasestudies
Whitepapers
51
37
52
12
35
12
49
19
32
Digitalelectronic version Hard copy Both
20
Simultaneously the percentage of respondents who preferred white papers of just four pages dropped from 24 percent down to 21 percent and the percentage of respondents who leaned toward eight pages increased from 21 percent to 27 percent This indicates that the ldquoideal lengthrdquo is shifting toward longer rather than shorter white papers
There were no general differences in length preferences between decision makers and influencers but technology purchasers from small companies tend to prefer shorter white papers with 31 percent preferring four pages or less compared to 19 percent of enterprise and 18 percent of mid-market companies that said the same
Case StudiesIn 2008 most respondents reported the ideal length of a case study to be two pages or approximately 800 to 1000 words Yet in 2009 we received different responses That year the largest proportion of respondents (39 percent) indicated that four is the ideal number of pages for a written case study This yearrsquos 2010 survey backed up last yearrsquos numbers with 37 percent preferring four pages and virtually identical percentages of respondents preferring two pages or less (35 percent) or six pages or more (28 percent) as seen in Figure 26
In general the larger the company the longer they prefer their case studies to be with the largest percentage of respondents from small companies (33 percent) preferring two-page case studies the largest percentage from middle-market firms (40 percent) and large enterprises (39 percent) preferring four-page case studies
Figure 26 What do you feel is the ideal number of pages for a case studysuccess story
0
10
20
30
40
50
More than6 pages
6 pages4 pages2 pages1 page
8
27
37
19
9
21
Podcasts The ideal length of a podcast decreased in 2010 Figure 27 shows that the greatest number of respondents (36 percent) selected five to seven minutes as the ideal length Most respondents (81 percent) prefer podcasts that are 10 minutes or less in length and in general the smaller the company the shorter they prefer their podcasts to be
Video The majority of 2010 respondents (38 percent) indicated that the ideal length of video content is five to seven minutes while 24 percent preferred videos of eight to 10 minutes (Figure 28) These results indicate a slight trending to shorter videos over the 2009 respondentrsquos preferences for length where 31 percent preferred five to seven minutes and 28 percent preferred eight to 10 minutes
Figure 28 What do you feel is the ideal length of a video in number of minutes
0
10
20
30
40
More than15 minutes
11 to 15minutes
8 to 10minutes
5 to 7minutes
2 to 4minutes
Less than2 minutes
6 5
19
38
24
8
Figure 27 What do you feel is the ideal length of a podcastaudio file in number of minutes
0
10
20
30
40
More than15 minutes
11 to 15minutes
8 to 10minutes
5 to 7minutes
2 to 4minutes
Less than2 minutes
4
15
36
26
13
6
22
The Emergence of Embedded Audio and Video in Written Collateral Over the past 12 months Eccolo has participated in an emerging trend in marketing collateral embedding audio and video files into digital versions of written documents such as white papers and case studies We therefore asked respondents if they had consumed any written collateral that contained embedded audio andor video files A significant proportion of themmdash45 percentmdashsaid they had done so
Respondents were most likely to encounter embedded files in case studies (66 percent) followed by white papers (55 percent) and brochures (48 percent) (Figure 29)
Perhaps the most dramatic of our findings in this part of the survey was the overwhelming percentage of respondents who clicked through to these embedded files 93 percent Twenty-five percent clicked through to video files six percent clicked through to audio files and 62 percent clicked through to both audio and video (Figure 30)
And most importantly when respondents were asked whether the inclusion of audio or video files positively or negatively affected the overall influence of the written collateral 80 percent indicated that they viewed it either ldquovery positivelyrdquo or ldquopositivelyrdquo (Figure 31)
0
10
20
30
40
50
60
70
80
OtherBrochuresCase studiesWhite paper
55
66
48
1
Figure 29 Which types of written collateral have you consumed that included embedded audio or video
23
In particular decision makers felt this trend was positive 83 percent ranked it as very positively or positively affecting the overall influence of the written collateral compared to 74 percent of influencers (Figure 32)
The size of company also mattered when it came to the perceived influence of embedded files with enterprises more likely to indicate that it was very positive (26 percent) compared to middle-market (14 percent) or small firms (15 percent) On a related note small businesses were more likely to say that embedded files had no influence at allmdash33 percent versus 15 percent of middle-market and 15 percent of enterprise firms (Figure 33)
0
10
20
30
40
50
60
70
80
NeitherBoth audiovideoAudio onlyVideo only
25
6
62
7
Figure 30 Did you click through or open any of the video or audio files embedded in the collateral
0
10
20
30
40
50
60
70
Very negativelyNegativelyNo influencePositivelyVery positively
18
62
18
1 1
Figure 31 How did the inclusion of embedded audio and video files affect the overall influence of the written collateral
24
These results support Eccolorsquos belief that interactivity is becoming ldquotable stakesrdquo for written marketing communications collateral Given the preference that purchasers have already expressed for consuming collateral at their desktop (see Figure 22) marketers that donrsquot experiment with embedded ausio video and other multimedia formats as well as links off to other communications and social media channels risk delivering assets that seem obsolete and old-fashioned
Figure 32 How did the inclusion of embedded audio and video files affect the overall influence of the written collateral
(decision makers versus influencers)
0
20
40
60
80
Very NegativelyNegativelyNo InfluencePositivelyVery Positively
24
59
66
15
26
1 0 018
Decision maker Influencer
0
10
20
30
40
50
60
70
80
Very negativelyNegativelyNo influencePositivelyVery positively
15 14
26
52
69
59
33
15 15
0 1 0 0 1 0
Small business Mid-market Enterprise
Figure 33 How did the inclusion of embedded audio and video files affect the overall influence of the written collateral
(small business vs mid-market vs enterprise)
25
The Channel EffectLast year we added a section to our annual survey that investigated how channel affects the perceived influence of collateral We defined channel as the specific avenue through which the respondent receives contentmdashwhether from a personal contact from a corporate Web site or from a sales representative for example
One fact immediately stood out in 2009 most respondents receive written collateral through the corporate Web site (Figure 34) This did not change in 2010 with 71 percent of respondents finding white papers through such sites 65 percent getting brochuresdata sheets through that channel and 56 percent acquiring case studies in that way
The next most frequently used channel for receiving a white paper in 2010 was a download from a direct response campaign (59 percent) which implies that this should be considered an important means of distribution for marketers This was followed by forwarded by a sales repcompany contact (54 percent) obtained from a personal contact (52 percent) accessed via social media (39 percent) and absorbed through webinars (34 percent) In 2009 podcasts and video collateral differed from written content when it came to how respondents ldquofoundrdquo them but that difference
0
10
20
30
40
50
60
70
80
Mentioned ina webinar
Linked to ordiscussed in
onlinesocial media
Linked in toan RSS feed
Forwarded bysales rep
company contact
BrowsingcorporateWeb site
Downloadedfrom
direct responsecampaign
Forwardedfrom
personalcontact
White papers Case studies Podcasts Videos Brochures
5253
46
34
37
59
71
5655
6665
54
4241
38
27
23
31
39
31
39
29
23
34
20
23
20
12
21
15
44
38
45
34 34
Figure 34 Through which channels have you received collateral
26
has vanished Last year podcasts were almost equally acquired from a personal contact or from a corporate Web site (48 percent and 49 percent respectively) However this year the corporate Web site trumped the personal contact channel (55 percent to 46 percent) And this was even more dramatically the case for video with only 34 percent of respondents indicating they had been forwarded a video by a personal contact while 66 percent found video on corporate Web sites This trend underscores the importance of the corporate Web site across all collateral types
When we examined the comparative influence of these various channels another interesting fact emerged although a piece of collateral referred to or forwarded by a personal contact was most frequently cited as the most influential channel for all types of collateral browsing the corporate Web site was the second most frequently cited answer (Figure 35) When you consider that the corporate Web site is clearly the most frequently used channel for collateral delivery coupled with its high perceived influence you understand why we recommend that you make investing in and frequently refreshing your Web site a priority
0
10
20
30
40
50
60
70
80
Mentioned ina webinar
Linked to ordiscussed in
onlinesocial media
Linked in toan RSS feed
Forwarded bysales rep
company contact
BrowsingcorporateWeb site
Downloadedfrom
direct responsecampaign
Forwardedfrom
personalcontact
White papers Case studies Podcasts Videos Brochures
73
79
767677
41
38
424343
6060
53
61
69
37
33
28
39
46
2220
31
1716
35
42
3836
31 31
27
33
29
19
Figure 35 Positive influence by channel
27
Marketing Collateral in the Sales CycleThe relationship between collateral and actual sales is an important one How do the various types of collateralmdashwhite papers case studies brochuresmdashimpact sales When should you deliver a white paper case study podcast or video to drive potential purchasers to the next step in the sales cycle Is there a way to time delivery of specific collateral types to nurture leads more effectively
For the purposes of this survey we defined the various stages of the technology evaluation and purchase process as
bull Pre-salemdashConsidering solutions and vendors
bull Initial salemdashReviewing vendor qualifications capabilities and RFP responses
bull Mid-salemdashReviewing details of the solution with one vendor
bull Final salemdashCustomization negotiation and procurement
In our 2008 survey results we saw that respondents most frequently consumed each collateral type for the first time in the pre-sale process by a significant margin that is before they send out RFPs or initiate discussions with specific vendors In that first Eccolo B2B survey white papers were read by 61 percent of respondents during this phase case studies by 48 percent podcasts by 53 percent video by 51 percent and brochuresdata sheets by 62 percent
0
10
20
30
40
50
60
70
Final sales processMid-sales processInitial sales processPre-sales process
White papers Case studies Podcasts Videos Brochures
53
49
41
49
31
3435
30
25
13
21
2018
11
4 3 4 3 4
60
Figure 36 In which phase of the purchasing cycle did you FIRST consume each type of collateral
28
Our 2010 survey indicates that these habits are shifting While the majority of respondents still consume most collateral for the first time in the pre-sales phase more respondents now indicate they first consumed collateral in either the initial sales or mid-sales phases than they did in 2008 For example the percentage of respondents who first consumed a white paper during the pre-sales process dropped to 53 percent the percentage that listened to a podcast dropped down to 41 percent (Figure 36) In both cases respondents appeared to move their first consumption of those types of collateral down to the next two stages of the sales process
When we further segmented the 2010 data to compare the habits of influencers to decision makers we observed some additional interesting trends across the board influencers tend to consume content earlier in the sales cycle than decision makers (Figure 37)
0 10 20 30 40 50 60 70 80
Final salesprocess
Mid-salesprocess
Initial salesprocess
Pre-salesprocess
Final salesprocess
Mid-salesprocess
Initial salesprocess
Pre-salesprocess
White papers Case studies Podcasts Videos Brochures
63
58
41
6458
4752
65
2526
3830
23
915
1417
9
2111
2
4542
3647
56
3339
3430
27
1614
2319
12
65
74
5
25
26
35
20
4
Infl
uen
cers
Deci
sio
n M
akers
Figure 37 In which phase of the purchasing cycle did you FIRST consume each type of collateral (influencers vs decision makers)
29
Likewise respondents from small businesses consume collateral for the first time during the pre-sales stage at much higher rates than respondents from middle-market or large companies For example 70 percent of small businesses consume white papers for the first time during this stage compared to just 40 percent of middle-market firms and 56 percent of large enterprises (Figure 38)
Small Business Mid-market Enterprise
0
10
20
30
40
50
60
70
80
Final sales processMid-sales processInitial Sales ProcessPre-sales Process
70
40
56
16
38
29
9
17
12
5 53
Figure 38 In which phase of the purchasing cycle did you FIRST consume white papers in 2010
As in previous years we find the data around use of collateral in the sales cycle interesting in the way it potentially sheds light on the relationship between influencers and decion makers We believe we are seeing the influencerrsquos role in terms of considering potential technology purchases and the subsequent sharing of that collatera and other information with decision makers a bit later in the cycle
30
BEST PRACTICES FOR THE REAL WORLD
As in previous years we conclude our delivery of the survey results by providing what we consider to be actionable advice that marketing professionals can apply right now to improve the quality and impact of their communications assets
1 Create white papers This is a repeating theme but one that is definitely worth saying once again white papers are frequently consumed and considered highly influential over the technology purchase Take advantage by creating a few well-written papers that clearly outline strategic advancements your solutions and products are aligned with Leverage your work by chunking up the main points into best practice documents blog posts ldquohow tordquo guides and other materials to support your broader campaign needs
2 Embed multimedia files Start with short video or audio clips to keep overall file sizes low but jump on this trend Once you get your feet under you you can advance to interactive charts and graphs Flash elements and other media types Donrsquot ignore the opportunity to be among the first to take advantage of this evolving practice
3 Consider all content to be social content We know that tech purchasers share content and that they consider materials forwarded from a personal contact to be very influential Plan all content and collateral assets from the perspective of stimulating discussion and sharing Think about interactivity links to discussion boards and user groups and point to blog posts and other communications channels in all materials
4 Deliver all content assets digitally and be prepared to have end users print them While the majority of respondents view collateral assets on the desktop a respectable number still enjoy printing out the materials they download and will further share print materials with others Avoid cross-page spreads and column designs that are hard to read digitally and remember to provide clear URLs for any links away from the materials for those reading print versions
5 Merchandise content on the Web Your company Web site is the most frequent location for obtaining content and it ranks second only to personal contacts in terms of influence Make the most of this channel by merchandising featured content and assets on landing pages and microsites that extend the thought leadership and discussion begun in your collateral Remember potential purchasers interact with your content before they interact with you so ensure viewers can easily see all the other channels through which they can engage with you all in one fun-filled information portal
31
CONCLUSIONAs we wrap up this yearrsquos annual survey report we find ourselves coming back to some basic advice that has been a theme of this section in each previous report plan
Eccolo believes that the requirement of content strategymdashidentifying communication topics and thoughtfully planning the assets required to achieve goalsmdashis relevant at every level of the marketing organization The proliferation of online channels and ever more sophisticated lead generation systems require a steady stream of fresh relevant content to successfully engage purchasers Itrsquos very easy to be distracted by looming deadlines and shifting priorities but creating a content strategy and identifying a clear development roadmap that describes topic format and channel is essential if you truly want to improve results
And the opportunity to improve results is significant Well-planned development cycles can shorten time to market reduce costs and ensure a consistent message across all external assets Further organizations that show a healthy respect for content planning and development from the top down will experience the entire enterprise shifting to a more responsive stance These companies are tuned toward deeper customer conversations that align with the end userrsquos preferences for sales and marketing information and by the very style of their collateral assets signal a positive experience for the potential buyer
Engage With UsEccolo Media welcomes your feedback on this report Email us at infoeccolomediacom with specific feedback or visit our blog at httpeccolomediatypepadcom to join in our ongoing discussion of best practices in content strategy
ACKNOWLEDGEMENTSWe would like to acknowledge the participation of the following team members for their efforts in bringing the Eccolo Media 2010 B2B Technology Collateral Survey Report to life Maite Figueroa Alice LaPlante Lorie Loe Courtney Love and Michael Sudol
32
ABOUT ECCOLO MEDIAEccolo Media specializes in strategic marketing insight and content development for some of the worldrsquos best-known technology companies An agency of exceptional writers Eccolo combines deep experience with ongoing research to identify and apply best practices for producing remarkable content The agency helps align clientsrsquo marketing needs with their key business goals by bringing a proactive innovative approach to the planning and execution of collateral in both traditional and new media channels Founded in 2007 Eccolo Media is headquartered in San Francisco California and fulfills a wide range of project needs throughout the Americas and EMEA Visit our Web site at wwweccolomediacom
ABOUT EMEDIA - Our Marketing Sponsoremedia has specialized in generating B2B sales leads and building demand since 1999 We reach more than 35 million decision makers across over 80 niche-oriented audiences within the following B2B areasInformation Technology ElectronicsSupply ChainLogistics Occupational HealthCorporate Finance Environmental ManagementHuman Resources Project ManagementMarketingSales PackagingConvertingB2B Events Construction amp ArchitectsManufacturing Professional DevelopmentSmall Business Design EngineersProcurement Control EngineersHospitality Management PrintingHealthcare Tech
emediarsquos expertise and personal service permit effective implementation of Guaranteed Cost-per-Lead programs for our clientsrsquo offers and collateral Or we can drive highly targeted traffic to clientsrsquo web pages
Contact emedia at 800-782-6167 630-288-8480 or inquiriesemediausacom
ACCELERATED B2B LEAD GENERATION mdash ON DEMAND
wwwemediausacom

3
files in the written collateral We predict that file compression technologies will advance to the point where the level of interactivity in written collateral will be limited only by imagination And that leads us to what we believe to be the real jewel in this yearrsquos survey
Interactive Collateral Increases Influence This is the first year that Eccolo surveyed on the consumption of written content containing embedded audio andor video media While a bit less than half our respondents indicated that they had read written collateral that contained embedded audio or video files 93 percent clicked through to those media files and 80 percent indicated that the inclusion of the files positively or very positively increased the influence of the written collateral
Clearly the ability to embed multimedia files in written content is making meaningful changes in marketing communications We predict that improving compression technologies will lessen the big bump in overall file size that the addition of multimedia files creates making insertion of audio and video into written collateral types easier and more attractive Beyond the faddish appeal this type of interactive collateral allows marketers to insert a level of passion and personality into written content that is hard to ignore Written marketing communications that donrsquot include multimedia will begin to appear flat and old-fashioned by comparison
Content Strategy Is a C-Suite Opportunity Virtually all marketing and communications strategies require content for tactical deployment From lead generation to lead nurture to social media strategies to product launches and brand campaigns collateral and content assets are the tools required to spur interaction with the target end user
The majority of the 2010 survey respondents tell us that they consume the lionrsquos share of their marketing content in the pre-sales phase of the sales cyclemdashbefore they ever speak with a representative within a specific company Put in this context content becomes the entry point or the sales rep of every business Evangelizing proactive content strategy from the C-suite down will not only result in more cost-effective and targeted communications it will support a more nimble and relevant organization overallmdashone that is uniformly committed to more leads warmer leads and content assets that are more easily tuned for market advantage
We look forward to your comment and feedback on the Eccolo Media 2010 B2B Technology Collateral Survey Report
Warmly
Lorie Loe President and Chief Content Strategist
4
ABOUT THE SURVEY For the second year in a row Eccolo Media collaborated with Global Marketing Insite (GMI) a leading global market research firm to identify and manage participants for an in-depth survey on the use of B2B technology collateral during technology purchases GMI distributed the online survey in June 2010 and provided the results as raw data to Eccolo Media for analysis
Respondent titles included C-level executives vice presidents (VPs) managers directors developersprogrammers and technicians All worked for US-based companies All were responsible for either making B2B technology purchases or influencing purchasing decisions Only respondents who indicated that they had participated in a technology purchase in the last six months were included in the survey results
Of the 500 respondents included in the results 58 percent identified themselves as technology purchase decision makers the remaining 42 percent identified themselves as purchase influencers (Figure 1) Forty-five percent of respondents were under 40 years old 55 percent were over Respondents trended slightly toward having more experience in the technology industry this year as compared to 2009 a full 40 percent had in excess of 15 years experience 63 percent had upwards of 11 years of experience and 81 percent had more than eight years experience (Figure 2)
Thirty-two percent of respondents worked for enterprises (1000 employees or more) 39 percent for middle-market businesses (101-999 employees) and 29 percent for small businesses (less than 100 employees) as shown in Figure 3
Figure 1 Are you primarily an influencer or decision maker
5842
Influencers Decision makers
Figure 2 Respondentsrsquo years in the technology industry
0
10
20
30
40
14
1418
23
40
Less than2
2 to 4 5 to 7 8 to 10 11 to 15 More than15
5
When respondents were asked if they make purchasing decisions primarily from a business perspective a technology perspective or both the majority of respondents 61 percent indicated they consider both technical and business criteria when making a technology purchase Thirty-four percent used only technology criteria and only five percent of respondents considered purchases from a business perspective only
Respondent ProfilesAs in our 2009 report we used profiling questions to help us create two distinct respondent types the ldquodecision makerrdquo and the ldquoinfluencerrdquo Those respondents who identified themselves as decision makers tend to take a more holistic view of technology purchases considering them from both the business and technology perspectives Alternatively those respondents that identified as influencers are more likely to consider technology requirements alone Decision makers also tend to be higher up the organizational ladder C-level executives vice presidents (VPs) and directors Influencers on the other hand are more likely to identify themselves as managers developers and programmers (Figure 4)
Where our analyses identified statistically significant differences we also present data segmenting these two primary profiles by organizational size
Collateral Types and DefinitionsThe survey asked respondents questions about their use of five collateral types
bull White papers These provide analyses of technology or business trends from an independent vendor-neutral position
bull Case studiessuccess stories This type of collateral features stories of how customers successfully deployed a companyrsquos products or services
bull Podcasts These are digital audio recordings that can either be streamed from a Web site or downloaded onto a desktop or
39
32
29
Small business Less than 100 employees
Mid-market business 101-999 employees
Enterprise 1000 or more employees
Figure 3 Size of company
Profile 1 Decision Makers (58) Profile 2 Influencers (42)
Approach purchasing decisions from both business and technology perspectives
Approach purchasing decisions from a primarily technological perspective
C-level executives VPs or directors Managers developerstechnicians and programmers
Figure 4 Respective characteristics of decision makers and influencers
6
mobile device Topics vary but can include product overviews discussions by or interviews with subject matter experts or customer testimonials
bull Video This increasingly important form of collateral is being used for a broad range of marketing communications from customer success stories to product demonstrations to analyst or internal expert interviews
bull Product brochuresdata sheets These documents contain specific productservice or company information
In previous years survey questions were designed to determine respondent preferences for each collateral type What collateral did they find to be most influential Through what channel did they receive the collateral and did this affect the perceived influence of the collateral When in the purchasing cycle did they tend to view specific collateral types
These questions and more were then analyzed for useful data points
Presentation of Data and DiscussionFor our 2010 Survey Report we chose to organize our key findings into the following sections
bull The perceived influence of each type of collateral on the purchasing decision
bull What our respondents think makes ldquogoodrdquo (ie influential) content and collateral
bull The emerging practice of embedding audio and video files within written collateral and the perceived influence of this practice
bull The manner in which respondents received collateral (ie the channel)
bull How collateral is used in the sales cycle
As in previous years we used the results of our analysis to create a series of best practices that marketers can apply to optimize their content development processes and maximize the impact of their collateral assets Yoursquoll find this in the last section of our report
Respondents from larger companies are much more likely to consume contentWe found a marked difference in content consumption across all collateral types when looking at the size of the organization Both decision makers and influencers from both middle-market and enterprise companies were more likely to consume collateral than those from small companies
7
KEY FINDINGS
The Sphere of InfluenceOver the past three years we have probed to discover what types of collateral respondents consume and the degree to which each collateral type influences their purchasing decisions
As in previous years we found that both decision makers and influencers consume a wide range of collateral types when making technology purchases from product brochures to videos to podcasts case studies and white papers (Figure 5)
As we found in every past survey the most frequently consumed types of collateral are product brochures amp data sheets In fact respondents have only increased their use of this type of content over the years from 70 percent in 2008 to 78 percent in 2009 to this yearrsquos finding of 83 percent Case studies and white papers after making significant leaps in consumption rates between 2008 and 2009 remained relatively flat between 2009 and 2010 The biggest changes were in the frequency in which respondents consumed videos and podcasts amp audio files In 2008 only 28 percent of respondents had consumed these types of collateral In 2009 podcasts made a moderate gain up to 32 percent Video consumption increased more generously from 28 percent in 2008 to 51 percent in 2009
This year that trend continued Consumption of audio content increased 8 percentage points to 40 percent Video collateral consumption increased 8 points to 59 percentmdashthe same consumption levels that case studies were at in 2008
White Papers Remain Most InfluentialAlthough the number of respondents who had read a white paper in the past six months to evaluate a purchasing decision remained flat over the past 12 months (77 percent in 2009 and 76 percent in 2010) the vast majority of respondents
0 20 40 60 80 100
White papers
Case studiessuccess stories
Podcastsaudio files
Videos
Product brochuresdata sheets
83
59
40
67
76
Figure 5 Which of the following collateral types have you consumed in the last six months to evaluate a technology purchase
8
(83 percent) felt that white papers were moderately to extremely influential in helping them make their final purchase decisions Only one percent thought that white papers werenrsquot influential at all and 41 percent thought they were very to extremely influential (Figure 6)
In 2009 we identified a significant gap (22 percent) between decision makers and influencers in how influential they found white papersmdashwith 51 percent of decision makers finding white papers ldquovery to extremely influentialrdquo compared to just 29 percent of influencers who agreed with that statement That gap narrowed in 2010 and we now see a 13 percent difference between the two groups (Figure 7)
Organizational size also seems to make a considerable difference in how respondents view white papers Both decision makers and influencers from enterprise and mid-market companies are more likely to consume a white paper than their small business counterparts as seen in Figure 8
Figure 6 How influential are white papers in your purchasing decisions in 2010
0
10
20
30
40
50
Not influentialat all
Somewhatinfluential
Moderatelyinfluential
Veryinfluential
Extremelyinfluential
12
29
42
16
1
Figure 7 How influential are white papers in your purchasing decision (influencers versus decision makers)
0
10
20
30
40
50
Not influentialat all
Somewhatinfluential
Moderatelyinfluential
Very to extremelyinfluential
34
47 48
38
1714
1 1
Influencer Decision maker
9
Finally we asked respondents to rank all collateral types from most influential to least influential (Figure 9 on page 9) As in our previous surveys white papers were most frequently given as the most influential collateral type Statistically there was no difference between decision makers and influencers in this regard These findings continue to reinforce our position that the high usage rate of white papers coupled with their high perceived influence make them a very valuable asset in the marketing communications toolkit
0
20
40
60
80
100
EnterpriseMid-marketSmall business
Influencers Decision makers
7074
82
62
9085
Figure 8 Have you read any white papers in the past six months to evaluate a technology purchase
0
10
20
30
40
50
60
White papers Case studies Podcasts Videos Brochures
5Least influential
4321Most influential
Figure 11 Please rank the following collateral in order of influence in making purchasing decisions with 1 being most influential and 5 being least influential
39
18
5
10
2827
34
7
16 1617
27
1816
22
7
13
26
38
44
16
108
2018
Figure 9 Please rank the following collateral in order of influence in making purchasing decisions with 1 being most influential and 5 being least influential
10
When White Papers DisappointWhile other types of collateral such as case studies and brochures are fairly standard from company to company white papers can vary widely in terms of their format content and organization To better understand what makes for a ldquogoodrdquo white papermdashwhat increases influencemdashwe asked the 2010 respondents the reverse question what would most disappoint them when reading a white paper What would decrease its influence1
Poorly written content was most frequently ranked as the number one reason for respondents expressing disappointment in a white paper as seen in Figure 10 However other results surprised us For example contrary to what Eccolo has long believed white papers that donrsquot possess best practice recommendations do not disappoint implying that key take-aways or next steps are not particularly persuasive Neither do white papers that are too technical Instead white papers that donrsquot contain enough technical information are more likely to disappoint than those that possess too much
Case Studies Remain Valuable Collateral The frequency with which case studies were used to make technology purchases in 2010 remained statistically unchanged from 2009 (67 percent) When asked how influential they felt case studies were in making purchasing decisions (Figure 11) the answers were again statistically similar to 2009 79 percent of respondents in the 2010 survey felt that case studies were moderately to extremely influential Nineteen percent found them somewhat influential and only two percent found them not to be influential at all As in 2009 when compared to the influence of other collateral types 2010 respondents ranked them as the second-most influential after white papers (see Figure 9 on page 9)
Figure 10 When reading white papers what is most likely to disappoint you
Poorly written
Not technical enough
No real-life cases
Too much productvendor info
Poorly designed
No new industry developments
Not enough productvendor info
No best practicesguidelines
Too technical
MOST DISAPPOINTING
LEAST DISAPPOINTING
1 In previous surveys we attempted to answer this question by plainly asking respondents what increased the influence of white papers The resulting data sets however were flat with no real critical element for positive influence standing out Hence our decision to pose the question from the negative
11
As in 2009 we asked respondents if case study content would be more or less influential if offered in a different formatmdashfor example if delivered in non-written forms such as audio or video
There was virtually no change in the response to this query between 2009 and 2010 Written case studies were still most frequently tapped as the most influential of all case study formats (Figure 12)
When we compared the attitudes of decision makers and influencers toward case study format however we did find a statistically significant change in the 2010 survey results In the 2009 survey influencers were much more likely to find written case studies the most influential (76 percent) than decision makers (59 percent) In 2010 the difference in attitudes was just a single percentage point 65 percent of influencers found written case studies to be the most influential form of customer testimonial compared to 64 percent of decision makers who indicated the same thing The gap also closed in respondentsrsquo attitudes toward video testimonials In 2009 40 percent of decision makers specified video as the most influential format for customer testimonials compared to 23 percent of influencers In 2010 this gap narrowed to just three percentage points (35 percent and 33 percent respectively) (Figure 13)
65 33
2
Video testimonial
Audio testimonial
Written case study
Figure 16 In which format would youfind a customer testimonial
to be most influential
Figure 12 In which format would you find a customer testimonial to be most influential
0
5
10
15
20
25
30
35
40
Not influentialat all
Somewhatinfluential
Moderatelyinfluential
Veryinfluential
Extremelyinfluential
10
29
40
19
2
Figure 12 How influential are case studies in your purchasing decisionsFigure 11 How influential are case studies in your purchasing decisions
12
Podcasts More Frequently Consumed But Less Influential Podcasts continued to play a role in the technology purchasing cycle in 2010 The percentage of survey respondents who listened to a podcast in the past six months rose to 36 percent up from from 32 percent in 2009 (Figure 5) However the percentage of respondents who found them to be moderately to extremely influential dropped to 78 percent (see Figure 14) compared to 82 percent in 2009 As in 2009 podcasts are ranked the fifth-most influential type of collateral when compared to other surveyed collateral types (see Figure 9 on page 9)
One interesting change identified in this yearrsquos results in 2009 decision makers found podcasts more influential than influencers didmdashwith 87 percent finding them moderately to extremely influential compared to just 73 percent of influencers In 2010 these results flipped with 81 percent of influencers finding podcasts moderately to extremely influential compared to 76 percent of decision makers (Figure 15) Decision makers were still more likely to find podcasts very or extremely influential however
0
5
10
15
20
25
30
35
Not influentialat all
Somewhatinfluential
Moderatelyinfluential
Veryinfluential
Extremelyinfluential
12
3234
21
1
Figure 14 How influential were podcastsaudio files in making a final purchasing decision
0
10
20
30
40
50
60
70
Audio testimonialVideo testimonialWrtitten case study
64
33
65
35
30
Influencers Decision makers
Figure 13 In which format would you find a customer testimonial to be most influential (decision maker versus influencer)
13
In those cases when respondents indicated they had listened to a podcast we asked what type of podcast it had been By far the most common type of podcast consumed was one covering technology trends (78 percent) followed by business trends (55 percent) Forty-five percent listened to information on vendor products andor solutions with the smallest but still significant percentage (39 percent) listening to customer testimonials in that format (Figure 16)
Video Continued Growth in Consumption Our 2010 survey respondents indicated that their use of video when considering technology purchase continues to increase The percentage of respondents who watched a video in the past six months increased eight points to 59 percent This result continues a trend seen in the 2009 survey results when use of video increased from 28 percent in 2008 to 49 percent in 2009 (Figure 17)
Figure 16 What types of podcastaudio files have you listened to in order to evaluate a technology purchase Check all that apply
0
20
40
60
80
OtherInformationon vendor
productssolutions
Businesstrends
Technologytrends
Customertestimonial
1
39
78
55
45
0
10
20
30
40
50
Not influentialat all
Somewhatinfluential
Moderatelyinfluential
Veryinfluential
Extremelyinfluential
28
15
7
35
46
26
17
24
02
Influencers Decision makers
Figure 15 How influential were podcastsaudio files in making a final purchasing decision
14
In 2008 video was ranked fifth in influence when compared to other types of collateral In 2009 it moved into fourth place surpassing podcasts in influence In 2010 it held on to that position (Figure 9 on page 9) When asked how influential the video was on a technology purchase 26 percent of respondents indicated they found videos to be moderately to extremely influential (Figure 18)
We further inquired as to the type of video respondents consumed during a technology purchase Respondents watched more product tutorialsdemos by a wide margin over other types of video collateral (76 percent) Vendor marketing videos were the next most commonly viewed type of video (61 percent) followed by customer testimonials (37 percent) and on-demand webinars (33 percent) as seen in Figure 19
Figure 18 How influential were the videos in making a final purchasing decision
0
10
20
30
40
Not influentialat all
Somewhatinfluential
Moderatelyinfluential
Veryinfluential
Extremelyinfluential
9
39
31
19
2
Figure 17 Have you viewed any videos in the past six months to evaluate a technology purchase
0
20
40
60
80
NoYes
201020092008
28
49 50
72
51 50
15
Brochures and Data Sheets Consumed Most Frequently In 2009 brochures and data sheets were the most frequently consumed of all collateralmdashwith 78 percent of respondents using them to make a purchasing decision over the past six months In 2010 83 percent of respondents consumed these types of collateral But although 79 percent of respondents rated them as moderately to extremely influential when making a technology purchase (Figure 20) they still tend to rank behind white papers and case studies when compared with other collateral types (see Figure 9 on page 9)
As with many other types of collateral large enterprises were more likely to consume brochures than small companies (less than 100 employees) with mid-sized companies falling in between
This year we continue to recommend that brochures and data sheets be a part of every marketerrsquos collateral toolbox precisely because they are so frequently
Figure 20 How influential were brochuresdata sheets in making a final purchasing decision
0
10
20
30
40
50
Not influentialat all
Somewhatinfluential
Moderatelyinfluential
Veryinfluential
Extremelyinfluential
8
31
40
18
3
0
10
20
30
40
50
60
70
80
OtherProducttutorials demos
On-demandwebinars
Vendormarketing
videos
Customertestimonials
37
61
2
76
33
Figure 19 What types of video files have you listened to in order to evaluate a technology purchase
16
consumed We also reiterate our advice that it might not be strategically wise to rely solely on this type of collateral given that their perceived influence is lower than some other collateral types Rather brochures and data sheets should be ldquomust-haverdquo assets in a well-rounded collateral portfolio that includes a broad variety of other content types
How Technology Purchasers Consume ContentAs in previous years we devoted significant time to analyzing how technology purchasers consume and use collateral In this section we share our results plus our insight into what respondents believe makes ldquogoodrdquo collateral
Most Collateral Still Consumed Digitally One surprise in this yearrsquos survey results was that although respondents still have an overwhelming preference for consuming written content on the desktop rather than printing it out that number actually declined across all types of written collateral (Figure 21) For example in 2009 a full three-fourths (76 percent) of respondents read white papers digitally a similar percentage (77 percent) did the same with brochuresdata sheets and even more (84 percent) consumed case studies in this form Yet in 2010 these numbers declined The percentage that read white papers digitally dropped 15 full percentage points to 61 percent The percent of respondents who indicated that they preferred to consume brochuressdata sheets in digital form declined only slightly but just 71 percent of respondents said they preferred to consume case studies in digital formmdash10 percentage points less than in 2009
We also found significant changes in whether respondents downloaded audio files onto their desktops or mobile devices or listened to audio streams from Web sites In 2009 62 percent preferred to download audio files onto their desktop or mobile devices versus 38 percent that preferred to stream directly from a Web site Yet in
Figure 21 Did you view this collateral online or did you downloadprint before reading (2009 vs 2010)
0
20
40
60
80
100
Brochuresdata sheetsCase studiessuccess storiesWhite paper
Downloaded printed 2010
Downloaded printed 2009
Viewedonline 2010
Viewedonline 2009
76
61
24
39
84
74
16
26
77
71
23
29
17
2010 these numbers shifted substantially toward a preference for streaming this year 57 percent of respondents preferred streaming versus 43 percent that favored downloading these types of files
This brings the method of consumption of audio files more in line with respondentsrsquo preferences for streaming video Sixty-four percent of 2010 respondents preferred to watch video streamed live from the source versus 36 percent that preferred to download it to a desktop or mobile device (Figure 22)
However whether streamed or downloaded 92 percent of podcast listeners and 96 percent of video viewers still consumed content on the desktop This is a critical finding that has remained consistent from year to year given that the desktop is the platform of choice for consuming all types of content marketers should ensure that all written content leverages links to other files and other communication channels as much as possible giving technology purchasers the option of drilling down to more details as desired
All Collateral Has Viral PotentialWe continue to be interested in the fact that all collateral is highly viral Technology purchasers routinely share collateral with the vast majority of 2010 respondents (89 percent) sharing the white papers they read with others as seen in Figure 23 Nearly as many (87 percent) share case studies followed by podcasts (84 percent) and then brochuresdata sheets and video (80 percent each)
White papers are still the most viral with 34 percent of respondents sharing them with three or more people Thirty-two percent of respondents shared podcasts with three or more people and 28 percent shared case studies with as many Lagging slightly behind were video (25 percent) and brochuresdata sheets (23 percent)
0
20
40
60
80
Downloaded tomobile device
then listented toviewed
Downloaded todesktop
then listened
Streamed fromlive source
5764
35 32
84
Podcasts Videos
Figure 22 Did you consume this content online or did you download before viewinglistening
18
Another interesting development although all collateral is shared primarily in digital form more 2010 respondents say that they share written collateralmdashwhite papers case studies and brochuresdata sheetsmdashin both digital and printed forms (Figure 24) than did respondents to the 2009 survey For example whereas the percentage of respondents who shared digitalelectronic versions of white papers actually declined in the past yearmdashfrom 60 percent to 51 percentmdashthe percentage of respondents who shared white papers in both digital and printed form increased from 30 percent to 37 percent We therefore caution marketers not to discount the viral nature of hard copy content as it clearly still is considered useful by a significant percentage of respondents
In 2009 influencers were more likely to share only digital copy and decision makers were more likely to share both printed and digital content However in 2010 this is no longer the case and these two respondent types are now in parity on this issue
0
5
10
15
20
25
30
35
White papers Case studies Podcasts Videos Brochures
5 or more
43210
11
13
16
20 20
23
28
25 25
30
33
31
27
30
19
14
17
12
6 6
9
7
5
8 8
6 6 6
12
27
Figure 23 On average how many other decision makers or influencers in your organization did you share each piece of collateral with
19
Preferences For Length Are ChangingEccolo Media has established best practices for serving up marketing collateral in small well-written packages Our survey results over the past three years have reinforced our belief that this serves marketers best However this year we observed subtleties in the survey results that indicated respondents may be adjusting their preferences for longer collateral length
White papersWersquove stated repeatedly that white papers are a highly influential collateral consumed at a high frequency by both decision makers and influencers But marketing communications professionals continue to debate the ideal length of a white paper how do they give the right amount of informationmdashnot too much and not too little As Figure 25 shows the majority of respondents (55 percent) felt six pages or less to be the ideal number However this percentage is 10 points less than last yearrsquos 65 percent
Figure 25 What do you feel is the ideal length for a white paper in number of pages
0
10
20
30
40
50
More than10 pages
10 pages8 pages6 pages4 pages
21
34
27
13
5
Figure 24 In what format did you share collateral
0
10
20
30
40
50
60
70
BrochuresCasestudies
Whitepapers
51
37
52
12
35
12
49
19
32
Digitalelectronic version Hard copy Both
20
Simultaneously the percentage of respondents who preferred white papers of just four pages dropped from 24 percent down to 21 percent and the percentage of respondents who leaned toward eight pages increased from 21 percent to 27 percent This indicates that the ldquoideal lengthrdquo is shifting toward longer rather than shorter white papers
There were no general differences in length preferences between decision makers and influencers but technology purchasers from small companies tend to prefer shorter white papers with 31 percent preferring four pages or less compared to 19 percent of enterprise and 18 percent of mid-market companies that said the same
Case StudiesIn 2008 most respondents reported the ideal length of a case study to be two pages or approximately 800 to 1000 words Yet in 2009 we received different responses That year the largest proportion of respondents (39 percent) indicated that four is the ideal number of pages for a written case study This yearrsquos 2010 survey backed up last yearrsquos numbers with 37 percent preferring four pages and virtually identical percentages of respondents preferring two pages or less (35 percent) or six pages or more (28 percent) as seen in Figure 26
In general the larger the company the longer they prefer their case studies to be with the largest percentage of respondents from small companies (33 percent) preferring two-page case studies the largest percentage from middle-market firms (40 percent) and large enterprises (39 percent) preferring four-page case studies
Figure 26 What do you feel is the ideal number of pages for a case studysuccess story
0
10
20
30
40
50
More than6 pages
6 pages4 pages2 pages1 page
8
27
37
19
9
21
Podcasts The ideal length of a podcast decreased in 2010 Figure 27 shows that the greatest number of respondents (36 percent) selected five to seven minutes as the ideal length Most respondents (81 percent) prefer podcasts that are 10 minutes or less in length and in general the smaller the company the shorter they prefer their podcasts to be
Video The majority of 2010 respondents (38 percent) indicated that the ideal length of video content is five to seven minutes while 24 percent preferred videos of eight to 10 minutes (Figure 28) These results indicate a slight trending to shorter videos over the 2009 respondentrsquos preferences for length where 31 percent preferred five to seven minutes and 28 percent preferred eight to 10 minutes
Figure 28 What do you feel is the ideal length of a video in number of minutes
0
10
20
30
40
More than15 minutes
11 to 15minutes
8 to 10minutes
5 to 7minutes
2 to 4minutes
Less than2 minutes
6 5
19
38
24
8
Figure 27 What do you feel is the ideal length of a podcastaudio file in number of minutes
0
10
20
30
40
More than15 minutes
11 to 15minutes
8 to 10minutes
5 to 7minutes
2 to 4minutes
Less than2 minutes
4
15
36
26
13
6
22
The Emergence of Embedded Audio and Video in Written Collateral Over the past 12 months Eccolo has participated in an emerging trend in marketing collateral embedding audio and video files into digital versions of written documents such as white papers and case studies We therefore asked respondents if they had consumed any written collateral that contained embedded audio andor video files A significant proportion of themmdash45 percentmdashsaid they had done so
Respondents were most likely to encounter embedded files in case studies (66 percent) followed by white papers (55 percent) and brochures (48 percent) (Figure 29)
Perhaps the most dramatic of our findings in this part of the survey was the overwhelming percentage of respondents who clicked through to these embedded files 93 percent Twenty-five percent clicked through to video files six percent clicked through to audio files and 62 percent clicked through to both audio and video (Figure 30)
And most importantly when respondents were asked whether the inclusion of audio or video files positively or negatively affected the overall influence of the written collateral 80 percent indicated that they viewed it either ldquovery positivelyrdquo or ldquopositivelyrdquo (Figure 31)
0
10
20
30
40
50
60
70
80
OtherBrochuresCase studiesWhite paper
55
66
48
1
Figure 29 Which types of written collateral have you consumed that included embedded audio or video
23
In particular decision makers felt this trend was positive 83 percent ranked it as very positively or positively affecting the overall influence of the written collateral compared to 74 percent of influencers (Figure 32)
The size of company also mattered when it came to the perceived influence of embedded files with enterprises more likely to indicate that it was very positive (26 percent) compared to middle-market (14 percent) or small firms (15 percent) On a related note small businesses were more likely to say that embedded files had no influence at allmdash33 percent versus 15 percent of middle-market and 15 percent of enterprise firms (Figure 33)
0
10
20
30
40
50
60
70
80
NeitherBoth audiovideoAudio onlyVideo only
25
6
62
7
Figure 30 Did you click through or open any of the video or audio files embedded in the collateral
0
10
20
30
40
50
60
70
Very negativelyNegativelyNo influencePositivelyVery positively
18
62
18
1 1
Figure 31 How did the inclusion of embedded audio and video files affect the overall influence of the written collateral
24
These results support Eccolorsquos belief that interactivity is becoming ldquotable stakesrdquo for written marketing communications collateral Given the preference that purchasers have already expressed for consuming collateral at their desktop (see Figure 22) marketers that donrsquot experiment with embedded ausio video and other multimedia formats as well as links off to other communications and social media channels risk delivering assets that seem obsolete and old-fashioned
Figure 32 How did the inclusion of embedded audio and video files affect the overall influence of the written collateral
(decision makers versus influencers)
0
20
40
60
80
Very NegativelyNegativelyNo InfluencePositivelyVery Positively
24
59
66
15
26
1 0 018
Decision maker Influencer
0
10
20
30
40
50
60
70
80
Very negativelyNegativelyNo influencePositivelyVery positively
15 14
26
52
69
59
33
15 15
0 1 0 0 1 0
Small business Mid-market Enterprise
Figure 33 How did the inclusion of embedded audio and video files affect the overall influence of the written collateral
(small business vs mid-market vs enterprise)
25
The Channel EffectLast year we added a section to our annual survey that investigated how channel affects the perceived influence of collateral We defined channel as the specific avenue through which the respondent receives contentmdashwhether from a personal contact from a corporate Web site or from a sales representative for example
One fact immediately stood out in 2009 most respondents receive written collateral through the corporate Web site (Figure 34) This did not change in 2010 with 71 percent of respondents finding white papers through such sites 65 percent getting brochuresdata sheets through that channel and 56 percent acquiring case studies in that way
The next most frequently used channel for receiving a white paper in 2010 was a download from a direct response campaign (59 percent) which implies that this should be considered an important means of distribution for marketers This was followed by forwarded by a sales repcompany contact (54 percent) obtained from a personal contact (52 percent) accessed via social media (39 percent) and absorbed through webinars (34 percent) In 2009 podcasts and video collateral differed from written content when it came to how respondents ldquofoundrdquo them but that difference
0
10
20
30
40
50
60
70
80
Mentioned ina webinar
Linked to ordiscussed in
onlinesocial media
Linked in toan RSS feed
Forwarded bysales rep
company contact
BrowsingcorporateWeb site
Downloadedfrom
direct responsecampaign
Forwardedfrom
personalcontact
White papers Case studies Podcasts Videos Brochures
5253
46
34
37
59
71
5655
6665
54
4241
38
27
23
31
39
31
39
29
23
34
20
23
20
12
21
15
44
38
45
34 34
Figure 34 Through which channels have you received collateral
26
has vanished Last year podcasts were almost equally acquired from a personal contact or from a corporate Web site (48 percent and 49 percent respectively) However this year the corporate Web site trumped the personal contact channel (55 percent to 46 percent) And this was even more dramatically the case for video with only 34 percent of respondents indicating they had been forwarded a video by a personal contact while 66 percent found video on corporate Web sites This trend underscores the importance of the corporate Web site across all collateral types
When we examined the comparative influence of these various channels another interesting fact emerged although a piece of collateral referred to or forwarded by a personal contact was most frequently cited as the most influential channel for all types of collateral browsing the corporate Web site was the second most frequently cited answer (Figure 35) When you consider that the corporate Web site is clearly the most frequently used channel for collateral delivery coupled with its high perceived influence you understand why we recommend that you make investing in and frequently refreshing your Web site a priority
0
10
20
30
40
50
60
70
80
Mentioned ina webinar
Linked to ordiscussed in
onlinesocial media
Linked in toan RSS feed
Forwarded bysales rep
company contact
BrowsingcorporateWeb site
Downloadedfrom
direct responsecampaign
Forwardedfrom
personalcontact
White papers Case studies Podcasts Videos Brochures
73
79
767677
41
38
424343
6060
53
61
69
37
33
28
39
46
2220
31
1716
35
42
3836
31 31
27
33
29
19
Figure 35 Positive influence by channel
27
Marketing Collateral in the Sales CycleThe relationship between collateral and actual sales is an important one How do the various types of collateralmdashwhite papers case studies brochuresmdashimpact sales When should you deliver a white paper case study podcast or video to drive potential purchasers to the next step in the sales cycle Is there a way to time delivery of specific collateral types to nurture leads more effectively
For the purposes of this survey we defined the various stages of the technology evaluation and purchase process as
bull Pre-salemdashConsidering solutions and vendors
bull Initial salemdashReviewing vendor qualifications capabilities and RFP responses
bull Mid-salemdashReviewing details of the solution with one vendor
bull Final salemdashCustomization negotiation and procurement
In our 2008 survey results we saw that respondents most frequently consumed each collateral type for the first time in the pre-sale process by a significant margin that is before they send out RFPs or initiate discussions with specific vendors In that first Eccolo B2B survey white papers were read by 61 percent of respondents during this phase case studies by 48 percent podcasts by 53 percent video by 51 percent and brochuresdata sheets by 62 percent
0
10
20
30
40
50
60
70
Final sales processMid-sales processInitial sales processPre-sales process
White papers Case studies Podcasts Videos Brochures
53
49
41
49
31
3435
30
25
13
21
2018
11
4 3 4 3 4
60
Figure 36 In which phase of the purchasing cycle did you FIRST consume each type of collateral
28
Our 2010 survey indicates that these habits are shifting While the majority of respondents still consume most collateral for the first time in the pre-sales phase more respondents now indicate they first consumed collateral in either the initial sales or mid-sales phases than they did in 2008 For example the percentage of respondents who first consumed a white paper during the pre-sales process dropped to 53 percent the percentage that listened to a podcast dropped down to 41 percent (Figure 36) In both cases respondents appeared to move their first consumption of those types of collateral down to the next two stages of the sales process
When we further segmented the 2010 data to compare the habits of influencers to decision makers we observed some additional interesting trends across the board influencers tend to consume content earlier in the sales cycle than decision makers (Figure 37)
0 10 20 30 40 50 60 70 80
Final salesprocess
Mid-salesprocess
Initial salesprocess
Pre-salesprocess
Final salesprocess
Mid-salesprocess
Initial salesprocess
Pre-salesprocess
White papers Case studies Podcasts Videos Brochures
63
58
41
6458
4752
65
2526
3830
23
915
1417
9
2111
2
4542
3647
56
3339
3430
27
1614
2319
12
65
74
5
25
26
35
20
4
Infl
uen
cers
Deci
sio
n M
akers
Figure 37 In which phase of the purchasing cycle did you FIRST consume each type of collateral (influencers vs decision makers)
29
Likewise respondents from small businesses consume collateral for the first time during the pre-sales stage at much higher rates than respondents from middle-market or large companies For example 70 percent of small businesses consume white papers for the first time during this stage compared to just 40 percent of middle-market firms and 56 percent of large enterprises (Figure 38)
Small Business Mid-market Enterprise
0
10
20
30
40
50
60
70
80
Final sales processMid-sales processInitial Sales ProcessPre-sales Process
70
40
56
16
38
29
9
17
12
5 53
Figure 38 In which phase of the purchasing cycle did you FIRST consume white papers in 2010
As in previous years we find the data around use of collateral in the sales cycle interesting in the way it potentially sheds light on the relationship between influencers and decion makers We believe we are seeing the influencerrsquos role in terms of considering potential technology purchases and the subsequent sharing of that collatera and other information with decision makers a bit later in the cycle
30
BEST PRACTICES FOR THE REAL WORLD
As in previous years we conclude our delivery of the survey results by providing what we consider to be actionable advice that marketing professionals can apply right now to improve the quality and impact of their communications assets
1 Create white papers This is a repeating theme but one that is definitely worth saying once again white papers are frequently consumed and considered highly influential over the technology purchase Take advantage by creating a few well-written papers that clearly outline strategic advancements your solutions and products are aligned with Leverage your work by chunking up the main points into best practice documents blog posts ldquohow tordquo guides and other materials to support your broader campaign needs
2 Embed multimedia files Start with short video or audio clips to keep overall file sizes low but jump on this trend Once you get your feet under you you can advance to interactive charts and graphs Flash elements and other media types Donrsquot ignore the opportunity to be among the first to take advantage of this evolving practice
3 Consider all content to be social content We know that tech purchasers share content and that they consider materials forwarded from a personal contact to be very influential Plan all content and collateral assets from the perspective of stimulating discussion and sharing Think about interactivity links to discussion boards and user groups and point to blog posts and other communications channels in all materials
4 Deliver all content assets digitally and be prepared to have end users print them While the majority of respondents view collateral assets on the desktop a respectable number still enjoy printing out the materials they download and will further share print materials with others Avoid cross-page spreads and column designs that are hard to read digitally and remember to provide clear URLs for any links away from the materials for those reading print versions
5 Merchandise content on the Web Your company Web site is the most frequent location for obtaining content and it ranks second only to personal contacts in terms of influence Make the most of this channel by merchandising featured content and assets on landing pages and microsites that extend the thought leadership and discussion begun in your collateral Remember potential purchasers interact with your content before they interact with you so ensure viewers can easily see all the other channels through which they can engage with you all in one fun-filled information portal
31
CONCLUSIONAs we wrap up this yearrsquos annual survey report we find ourselves coming back to some basic advice that has been a theme of this section in each previous report plan
Eccolo believes that the requirement of content strategymdashidentifying communication topics and thoughtfully planning the assets required to achieve goalsmdashis relevant at every level of the marketing organization The proliferation of online channels and ever more sophisticated lead generation systems require a steady stream of fresh relevant content to successfully engage purchasers Itrsquos very easy to be distracted by looming deadlines and shifting priorities but creating a content strategy and identifying a clear development roadmap that describes topic format and channel is essential if you truly want to improve results
And the opportunity to improve results is significant Well-planned development cycles can shorten time to market reduce costs and ensure a consistent message across all external assets Further organizations that show a healthy respect for content planning and development from the top down will experience the entire enterprise shifting to a more responsive stance These companies are tuned toward deeper customer conversations that align with the end userrsquos preferences for sales and marketing information and by the very style of their collateral assets signal a positive experience for the potential buyer
Engage With UsEccolo Media welcomes your feedback on this report Email us at infoeccolomediacom with specific feedback or visit our blog at httpeccolomediatypepadcom to join in our ongoing discussion of best practices in content strategy
ACKNOWLEDGEMENTSWe would like to acknowledge the participation of the following team members for their efforts in bringing the Eccolo Media 2010 B2B Technology Collateral Survey Report to life Maite Figueroa Alice LaPlante Lorie Loe Courtney Love and Michael Sudol
32
ABOUT ECCOLO MEDIAEccolo Media specializes in strategic marketing insight and content development for some of the worldrsquos best-known technology companies An agency of exceptional writers Eccolo combines deep experience with ongoing research to identify and apply best practices for producing remarkable content The agency helps align clientsrsquo marketing needs with their key business goals by bringing a proactive innovative approach to the planning and execution of collateral in both traditional and new media channels Founded in 2007 Eccolo Media is headquartered in San Francisco California and fulfills a wide range of project needs throughout the Americas and EMEA Visit our Web site at wwweccolomediacom
ABOUT EMEDIA - Our Marketing Sponsoremedia has specialized in generating B2B sales leads and building demand since 1999 We reach more than 35 million decision makers across over 80 niche-oriented audiences within the following B2B areasInformation Technology ElectronicsSupply ChainLogistics Occupational HealthCorporate Finance Environmental ManagementHuman Resources Project ManagementMarketingSales PackagingConvertingB2B Events Construction amp ArchitectsManufacturing Professional DevelopmentSmall Business Design EngineersProcurement Control EngineersHospitality Management PrintingHealthcare Tech
emediarsquos expertise and personal service permit effective implementation of Guaranteed Cost-per-Lead programs for our clientsrsquo offers and collateral Or we can drive highly targeted traffic to clientsrsquo web pages
Contact emedia at 800-782-6167 630-288-8480 or inquiriesemediausacom
ACCELERATED B2B LEAD GENERATION mdash ON DEMAND
wwwemediausacom

4
ABOUT THE SURVEY For the second year in a row Eccolo Media collaborated with Global Marketing Insite (GMI) a leading global market research firm to identify and manage participants for an in-depth survey on the use of B2B technology collateral during technology purchases GMI distributed the online survey in June 2010 and provided the results as raw data to Eccolo Media for analysis
Respondent titles included C-level executives vice presidents (VPs) managers directors developersprogrammers and technicians All worked for US-based companies All were responsible for either making B2B technology purchases or influencing purchasing decisions Only respondents who indicated that they had participated in a technology purchase in the last six months were included in the survey results
Of the 500 respondents included in the results 58 percent identified themselves as technology purchase decision makers the remaining 42 percent identified themselves as purchase influencers (Figure 1) Forty-five percent of respondents were under 40 years old 55 percent were over Respondents trended slightly toward having more experience in the technology industry this year as compared to 2009 a full 40 percent had in excess of 15 years experience 63 percent had upwards of 11 years of experience and 81 percent had more than eight years experience (Figure 2)
Thirty-two percent of respondents worked for enterprises (1000 employees or more) 39 percent for middle-market businesses (101-999 employees) and 29 percent for small businesses (less than 100 employees) as shown in Figure 3
Figure 1 Are you primarily an influencer or decision maker
5842
Influencers Decision makers
Figure 2 Respondentsrsquo years in the technology industry
0
10
20
30
40
14
1418
23
40
Less than2
2 to 4 5 to 7 8 to 10 11 to 15 More than15
5
When respondents were asked if they make purchasing decisions primarily from a business perspective a technology perspective or both the majority of respondents 61 percent indicated they consider both technical and business criteria when making a technology purchase Thirty-four percent used only technology criteria and only five percent of respondents considered purchases from a business perspective only
Respondent ProfilesAs in our 2009 report we used profiling questions to help us create two distinct respondent types the ldquodecision makerrdquo and the ldquoinfluencerrdquo Those respondents who identified themselves as decision makers tend to take a more holistic view of technology purchases considering them from both the business and technology perspectives Alternatively those respondents that identified as influencers are more likely to consider technology requirements alone Decision makers also tend to be higher up the organizational ladder C-level executives vice presidents (VPs) and directors Influencers on the other hand are more likely to identify themselves as managers developers and programmers (Figure 4)
Where our analyses identified statistically significant differences we also present data segmenting these two primary profiles by organizational size
Collateral Types and DefinitionsThe survey asked respondents questions about their use of five collateral types
bull White papers These provide analyses of technology or business trends from an independent vendor-neutral position
bull Case studiessuccess stories This type of collateral features stories of how customers successfully deployed a companyrsquos products or services
bull Podcasts These are digital audio recordings that can either be streamed from a Web site or downloaded onto a desktop or
39
32
29
Small business Less than 100 employees
Mid-market business 101-999 employees
Enterprise 1000 or more employees
Figure 3 Size of company
Profile 1 Decision Makers (58) Profile 2 Influencers (42)
Approach purchasing decisions from both business and technology perspectives
Approach purchasing decisions from a primarily technological perspective
C-level executives VPs or directors Managers developerstechnicians and programmers
Figure 4 Respective characteristics of decision makers and influencers
6
mobile device Topics vary but can include product overviews discussions by or interviews with subject matter experts or customer testimonials
bull Video This increasingly important form of collateral is being used for a broad range of marketing communications from customer success stories to product demonstrations to analyst or internal expert interviews
bull Product brochuresdata sheets These documents contain specific productservice or company information
In previous years survey questions were designed to determine respondent preferences for each collateral type What collateral did they find to be most influential Through what channel did they receive the collateral and did this affect the perceived influence of the collateral When in the purchasing cycle did they tend to view specific collateral types
These questions and more were then analyzed for useful data points
Presentation of Data and DiscussionFor our 2010 Survey Report we chose to organize our key findings into the following sections
bull The perceived influence of each type of collateral on the purchasing decision
bull What our respondents think makes ldquogoodrdquo (ie influential) content and collateral
bull The emerging practice of embedding audio and video files within written collateral and the perceived influence of this practice
bull The manner in which respondents received collateral (ie the channel)
bull How collateral is used in the sales cycle
As in previous years we used the results of our analysis to create a series of best practices that marketers can apply to optimize their content development processes and maximize the impact of their collateral assets Yoursquoll find this in the last section of our report
Respondents from larger companies are much more likely to consume contentWe found a marked difference in content consumption across all collateral types when looking at the size of the organization Both decision makers and influencers from both middle-market and enterprise companies were more likely to consume collateral than those from small companies
7
KEY FINDINGS
The Sphere of InfluenceOver the past three years we have probed to discover what types of collateral respondents consume and the degree to which each collateral type influences their purchasing decisions
As in previous years we found that both decision makers and influencers consume a wide range of collateral types when making technology purchases from product brochures to videos to podcasts case studies and white papers (Figure 5)
As we found in every past survey the most frequently consumed types of collateral are product brochures amp data sheets In fact respondents have only increased their use of this type of content over the years from 70 percent in 2008 to 78 percent in 2009 to this yearrsquos finding of 83 percent Case studies and white papers after making significant leaps in consumption rates between 2008 and 2009 remained relatively flat between 2009 and 2010 The biggest changes were in the frequency in which respondents consumed videos and podcasts amp audio files In 2008 only 28 percent of respondents had consumed these types of collateral In 2009 podcasts made a moderate gain up to 32 percent Video consumption increased more generously from 28 percent in 2008 to 51 percent in 2009
This year that trend continued Consumption of audio content increased 8 percentage points to 40 percent Video collateral consumption increased 8 points to 59 percentmdashthe same consumption levels that case studies were at in 2008
White Papers Remain Most InfluentialAlthough the number of respondents who had read a white paper in the past six months to evaluate a purchasing decision remained flat over the past 12 months (77 percent in 2009 and 76 percent in 2010) the vast majority of respondents
0 20 40 60 80 100
White papers
Case studiessuccess stories
Podcastsaudio files
Videos
Product brochuresdata sheets
83
59
40
67
76
Figure 5 Which of the following collateral types have you consumed in the last six months to evaluate a technology purchase
8
(83 percent) felt that white papers were moderately to extremely influential in helping them make their final purchase decisions Only one percent thought that white papers werenrsquot influential at all and 41 percent thought they were very to extremely influential (Figure 6)
In 2009 we identified a significant gap (22 percent) between decision makers and influencers in how influential they found white papersmdashwith 51 percent of decision makers finding white papers ldquovery to extremely influentialrdquo compared to just 29 percent of influencers who agreed with that statement That gap narrowed in 2010 and we now see a 13 percent difference between the two groups (Figure 7)
Organizational size also seems to make a considerable difference in how respondents view white papers Both decision makers and influencers from enterprise and mid-market companies are more likely to consume a white paper than their small business counterparts as seen in Figure 8
Figure 6 How influential are white papers in your purchasing decisions in 2010
0
10
20
30
40
50
Not influentialat all
Somewhatinfluential
Moderatelyinfluential
Veryinfluential
Extremelyinfluential
12
29
42
16
1
Figure 7 How influential are white papers in your purchasing decision (influencers versus decision makers)
0
10
20
30
40
50
Not influentialat all
Somewhatinfluential
Moderatelyinfluential
Very to extremelyinfluential
34
47 48
38
1714
1 1
Influencer Decision maker
9
Finally we asked respondents to rank all collateral types from most influential to least influential (Figure 9 on page 9) As in our previous surveys white papers were most frequently given as the most influential collateral type Statistically there was no difference between decision makers and influencers in this regard These findings continue to reinforce our position that the high usage rate of white papers coupled with their high perceived influence make them a very valuable asset in the marketing communications toolkit
0
20
40
60
80
100
EnterpriseMid-marketSmall business
Influencers Decision makers
7074
82
62
9085
Figure 8 Have you read any white papers in the past six months to evaluate a technology purchase
0
10
20
30
40
50
60
White papers Case studies Podcasts Videos Brochures
5Least influential
4321Most influential
Figure 11 Please rank the following collateral in order of influence in making purchasing decisions with 1 being most influential and 5 being least influential
39
18
5
10
2827
34
7
16 1617
27
1816
22
7
13
26
38
44
16
108
2018
Figure 9 Please rank the following collateral in order of influence in making purchasing decisions with 1 being most influential and 5 being least influential
10
When White Papers DisappointWhile other types of collateral such as case studies and brochures are fairly standard from company to company white papers can vary widely in terms of their format content and organization To better understand what makes for a ldquogoodrdquo white papermdashwhat increases influencemdashwe asked the 2010 respondents the reverse question what would most disappoint them when reading a white paper What would decrease its influence1
Poorly written content was most frequently ranked as the number one reason for respondents expressing disappointment in a white paper as seen in Figure 10 However other results surprised us For example contrary to what Eccolo has long believed white papers that donrsquot possess best practice recommendations do not disappoint implying that key take-aways or next steps are not particularly persuasive Neither do white papers that are too technical Instead white papers that donrsquot contain enough technical information are more likely to disappoint than those that possess too much
Case Studies Remain Valuable Collateral The frequency with which case studies were used to make technology purchases in 2010 remained statistically unchanged from 2009 (67 percent) When asked how influential they felt case studies were in making purchasing decisions (Figure 11) the answers were again statistically similar to 2009 79 percent of respondents in the 2010 survey felt that case studies were moderately to extremely influential Nineteen percent found them somewhat influential and only two percent found them not to be influential at all As in 2009 when compared to the influence of other collateral types 2010 respondents ranked them as the second-most influential after white papers (see Figure 9 on page 9)
Figure 10 When reading white papers what is most likely to disappoint you
Poorly written
Not technical enough
No real-life cases
Too much productvendor info
Poorly designed
No new industry developments
Not enough productvendor info
No best practicesguidelines
Too technical
MOST DISAPPOINTING
LEAST DISAPPOINTING
1 In previous surveys we attempted to answer this question by plainly asking respondents what increased the influence of white papers The resulting data sets however were flat with no real critical element for positive influence standing out Hence our decision to pose the question from the negative
11
As in 2009 we asked respondents if case study content would be more or less influential if offered in a different formatmdashfor example if delivered in non-written forms such as audio or video
There was virtually no change in the response to this query between 2009 and 2010 Written case studies were still most frequently tapped as the most influential of all case study formats (Figure 12)
When we compared the attitudes of decision makers and influencers toward case study format however we did find a statistically significant change in the 2010 survey results In the 2009 survey influencers were much more likely to find written case studies the most influential (76 percent) than decision makers (59 percent) In 2010 the difference in attitudes was just a single percentage point 65 percent of influencers found written case studies to be the most influential form of customer testimonial compared to 64 percent of decision makers who indicated the same thing The gap also closed in respondentsrsquo attitudes toward video testimonials In 2009 40 percent of decision makers specified video as the most influential format for customer testimonials compared to 23 percent of influencers In 2010 this gap narrowed to just three percentage points (35 percent and 33 percent respectively) (Figure 13)
65 33
2
Video testimonial
Audio testimonial
Written case study
Figure 16 In which format would youfind a customer testimonial
to be most influential
Figure 12 In which format would you find a customer testimonial to be most influential
0
5
10
15
20
25
30
35
40
Not influentialat all
Somewhatinfluential
Moderatelyinfluential
Veryinfluential
Extremelyinfluential
10
29
40
19
2
Figure 12 How influential are case studies in your purchasing decisionsFigure 11 How influential are case studies in your purchasing decisions
12
Podcasts More Frequently Consumed But Less Influential Podcasts continued to play a role in the technology purchasing cycle in 2010 The percentage of survey respondents who listened to a podcast in the past six months rose to 36 percent up from from 32 percent in 2009 (Figure 5) However the percentage of respondents who found them to be moderately to extremely influential dropped to 78 percent (see Figure 14) compared to 82 percent in 2009 As in 2009 podcasts are ranked the fifth-most influential type of collateral when compared to other surveyed collateral types (see Figure 9 on page 9)
One interesting change identified in this yearrsquos results in 2009 decision makers found podcasts more influential than influencers didmdashwith 87 percent finding them moderately to extremely influential compared to just 73 percent of influencers In 2010 these results flipped with 81 percent of influencers finding podcasts moderately to extremely influential compared to 76 percent of decision makers (Figure 15) Decision makers were still more likely to find podcasts very or extremely influential however
0
5
10
15
20
25
30
35
Not influentialat all
Somewhatinfluential
Moderatelyinfluential
Veryinfluential
Extremelyinfluential
12
3234
21
1
Figure 14 How influential were podcastsaudio files in making a final purchasing decision
0
10
20
30
40
50
60
70
Audio testimonialVideo testimonialWrtitten case study
64
33
65
35
30
Influencers Decision makers
Figure 13 In which format would you find a customer testimonial to be most influential (decision maker versus influencer)
13
In those cases when respondents indicated they had listened to a podcast we asked what type of podcast it had been By far the most common type of podcast consumed was one covering technology trends (78 percent) followed by business trends (55 percent) Forty-five percent listened to information on vendor products andor solutions with the smallest but still significant percentage (39 percent) listening to customer testimonials in that format (Figure 16)
Video Continued Growth in Consumption Our 2010 survey respondents indicated that their use of video when considering technology purchase continues to increase The percentage of respondents who watched a video in the past six months increased eight points to 59 percent This result continues a trend seen in the 2009 survey results when use of video increased from 28 percent in 2008 to 49 percent in 2009 (Figure 17)
Figure 16 What types of podcastaudio files have you listened to in order to evaluate a technology purchase Check all that apply
0
20
40
60
80
OtherInformationon vendor
productssolutions
Businesstrends
Technologytrends
Customertestimonial
1
39
78
55
45
0
10
20
30
40
50
Not influentialat all
Somewhatinfluential
Moderatelyinfluential
Veryinfluential
Extremelyinfluential
28
15
7
35
46
26
17
24
02
Influencers Decision makers
Figure 15 How influential were podcastsaudio files in making a final purchasing decision
14
In 2008 video was ranked fifth in influence when compared to other types of collateral In 2009 it moved into fourth place surpassing podcasts in influence In 2010 it held on to that position (Figure 9 on page 9) When asked how influential the video was on a technology purchase 26 percent of respondents indicated they found videos to be moderately to extremely influential (Figure 18)
We further inquired as to the type of video respondents consumed during a technology purchase Respondents watched more product tutorialsdemos by a wide margin over other types of video collateral (76 percent) Vendor marketing videos were the next most commonly viewed type of video (61 percent) followed by customer testimonials (37 percent) and on-demand webinars (33 percent) as seen in Figure 19
Figure 18 How influential were the videos in making a final purchasing decision
0
10
20
30
40
Not influentialat all
Somewhatinfluential
Moderatelyinfluential
Veryinfluential
Extremelyinfluential
9
39
31
19
2
Figure 17 Have you viewed any videos in the past six months to evaluate a technology purchase
0
20
40
60
80
NoYes
201020092008
28
49 50
72
51 50
15
Brochures and Data Sheets Consumed Most Frequently In 2009 brochures and data sheets were the most frequently consumed of all collateralmdashwith 78 percent of respondents using them to make a purchasing decision over the past six months In 2010 83 percent of respondents consumed these types of collateral But although 79 percent of respondents rated them as moderately to extremely influential when making a technology purchase (Figure 20) they still tend to rank behind white papers and case studies when compared with other collateral types (see Figure 9 on page 9)
As with many other types of collateral large enterprises were more likely to consume brochures than small companies (less than 100 employees) with mid-sized companies falling in between
This year we continue to recommend that brochures and data sheets be a part of every marketerrsquos collateral toolbox precisely because they are so frequently
Figure 20 How influential were brochuresdata sheets in making a final purchasing decision
0
10
20
30
40
50
Not influentialat all
Somewhatinfluential
Moderatelyinfluential
Veryinfluential
Extremelyinfluential
8
31
40
18
3
0
10
20
30
40
50
60
70
80
OtherProducttutorials demos
On-demandwebinars
Vendormarketing
videos
Customertestimonials
37
61
2
76
33
Figure 19 What types of video files have you listened to in order to evaluate a technology purchase
16
consumed We also reiterate our advice that it might not be strategically wise to rely solely on this type of collateral given that their perceived influence is lower than some other collateral types Rather brochures and data sheets should be ldquomust-haverdquo assets in a well-rounded collateral portfolio that includes a broad variety of other content types
How Technology Purchasers Consume ContentAs in previous years we devoted significant time to analyzing how technology purchasers consume and use collateral In this section we share our results plus our insight into what respondents believe makes ldquogoodrdquo collateral
Most Collateral Still Consumed Digitally One surprise in this yearrsquos survey results was that although respondents still have an overwhelming preference for consuming written content on the desktop rather than printing it out that number actually declined across all types of written collateral (Figure 21) For example in 2009 a full three-fourths (76 percent) of respondents read white papers digitally a similar percentage (77 percent) did the same with brochuresdata sheets and even more (84 percent) consumed case studies in this form Yet in 2010 these numbers declined The percentage that read white papers digitally dropped 15 full percentage points to 61 percent The percent of respondents who indicated that they preferred to consume brochuressdata sheets in digital form declined only slightly but just 71 percent of respondents said they preferred to consume case studies in digital formmdash10 percentage points less than in 2009
We also found significant changes in whether respondents downloaded audio files onto their desktops or mobile devices or listened to audio streams from Web sites In 2009 62 percent preferred to download audio files onto their desktop or mobile devices versus 38 percent that preferred to stream directly from a Web site Yet in
Figure 21 Did you view this collateral online or did you downloadprint before reading (2009 vs 2010)
0
20
40
60
80
100
Brochuresdata sheetsCase studiessuccess storiesWhite paper
Downloaded printed 2010
Downloaded printed 2009
Viewedonline 2010
Viewedonline 2009
76
61
24
39
84
74
16
26
77
71
23
29
17
2010 these numbers shifted substantially toward a preference for streaming this year 57 percent of respondents preferred streaming versus 43 percent that favored downloading these types of files
This brings the method of consumption of audio files more in line with respondentsrsquo preferences for streaming video Sixty-four percent of 2010 respondents preferred to watch video streamed live from the source versus 36 percent that preferred to download it to a desktop or mobile device (Figure 22)
However whether streamed or downloaded 92 percent of podcast listeners and 96 percent of video viewers still consumed content on the desktop This is a critical finding that has remained consistent from year to year given that the desktop is the platform of choice for consuming all types of content marketers should ensure that all written content leverages links to other files and other communication channels as much as possible giving technology purchasers the option of drilling down to more details as desired
All Collateral Has Viral PotentialWe continue to be interested in the fact that all collateral is highly viral Technology purchasers routinely share collateral with the vast majority of 2010 respondents (89 percent) sharing the white papers they read with others as seen in Figure 23 Nearly as many (87 percent) share case studies followed by podcasts (84 percent) and then brochuresdata sheets and video (80 percent each)
White papers are still the most viral with 34 percent of respondents sharing them with three or more people Thirty-two percent of respondents shared podcasts with three or more people and 28 percent shared case studies with as many Lagging slightly behind were video (25 percent) and brochuresdata sheets (23 percent)
0
20
40
60
80
Downloaded tomobile device
then listented toviewed
Downloaded todesktop
then listened
Streamed fromlive source
5764
35 32
84
Podcasts Videos
Figure 22 Did you consume this content online or did you download before viewinglistening
18
Another interesting development although all collateral is shared primarily in digital form more 2010 respondents say that they share written collateralmdashwhite papers case studies and brochuresdata sheetsmdashin both digital and printed forms (Figure 24) than did respondents to the 2009 survey For example whereas the percentage of respondents who shared digitalelectronic versions of white papers actually declined in the past yearmdashfrom 60 percent to 51 percentmdashthe percentage of respondents who shared white papers in both digital and printed form increased from 30 percent to 37 percent We therefore caution marketers not to discount the viral nature of hard copy content as it clearly still is considered useful by a significant percentage of respondents
In 2009 influencers were more likely to share only digital copy and decision makers were more likely to share both printed and digital content However in 2010 this is no longer the case and these two respondent types are now in parity on this issue
0
5
10
15
20
25
30
35
White papers Case studies Podcasts Videos Brochures
5 or more
43210
11
13
16
20 20
23
28
25 25
30
33
31
27
30
19
14
17
12
6 6
9
7
5
8 8
6 6 6
12
27
Figure 23 On average how many other decision makers or influencers in your organization did you share each piece of collateral with
19
Preferences For Length Are ChangingEccolo Media has established best practices for serving up marketing collateral in small well-written packages Our survey results over the past three years have reinforced our belief that this serves marketers best However this year we observed subtleties in the survey results that indicated respondents may be adjusting their preferences for longer collateral length
White papersWersquove stated repeatedly that white papers are a highly influential collateral consumed at a high frequency by both decision makers and influencers But marketing communications professionals continue to debate the ideal length of a white paper how do they give the right amount of informationmdashnot too much and not too little As Figure 25 shows the majority of respondents (55 percent) felt six pages or less to be the ideal number However this percentage is 10 points less than last yearrsquos 65 percent
Figure 25 What do you feel is the ideal length for a white paper in number of pages
0
10
20
30
40
50
More than10 pages
10 pages8 pages6 pages4 pages
21
34
27
13
5
Figure 24 In what format did you share collateral
0
10
20
30
40
50
60
70
BrochuresCasestudies
Whitepapers
51
37
52
12
35
12
49
19
32
Digitalelectronic version Hard copy Both
20
Simultaneously the percentage of respondents who preferred white papers of just four pages dropped from 24 percent down to 21 percent and the percentage of respondents who leaned toward eight pages increased from 21 percent to 27 percent This indicates that the ldquoideal lengthrdquo is shifting toward longer rather than shorter white papers
There were no general differences in length preferences between decision makers and influencers but technology purchasers from small companies tend to prefer shorter white papers with 31 percent preferring four pages or less compared to 19 percent of enterprise and 18 percent of mid-market companies that said the same
Case StudiesIn 2008 most respondents reported the ideal length of a case study to be two pages or approximately 800 to 1000 words Yet in 2009 we received different responses That year the largest proportion of respondents (39 percent) indicated that four is the ideal number of pages for a written case study This yearrsquos 2010 survey backed up last yearrsquos numbers with 37 percent preferring four pages and virtually identical percentages of respondents preferring two pages or less (35 percent) or six pages or more (28 percent) as seen in Figure 26
In general the larger the company the longer they prefer their case studies to be with the largest percentage of respondents from small companies (33 percent) preferring two-page case studies the largest percentage from middle-market firms (40 percent) and large enterprises (39 percent) preferring four-page case studies
Figure 26 What do you feel is the ideal number of pages for a case studysuccess story
0
10
20
30
40
50
More than6 pages
6 pages4 pages2 pages1 page
8
27
37
19
9
21
Podcasts The ideal length of a podcast decreased in 2010 Figure 27 shows that the greatest number of respondents (36 percent) selected five to seven minutes as the ideal length Most respondents (81 percent) prefer podcasts that are 10 minutes or less in length and in general the smaller the company the shorter they prefer their podcasts to be
Video The majority of 2010 respondents (38 percent) indicated that the ideal length of video content is five to seven minutes while 24 percent preferred videos of eight to 10 minutes (Figure 28) These results indicate a slight trending to shorter videos over the 2009 respondentrsquos preferences for length where 31 percent preferred five to seven minutes and 28 percent preferred eight to 10 minutes
Figure 28 What do you feel is the ideal length of a video in number of minutes
0
10
20
30
40
More than15 minutes
11 to 15minutes
8 to 10minutes
5 to 7minutes
2 to 4minutes
Less than2 minutes
6 5
19
38
24
8
Figure 27 What do you feel is the ideal length of a podcastaudio file in number of minutes
0
10
20
30
40
More than15 minutes
11 to 15minutes
8 to 10minutes
5 to 7minutes
2 to 4minutes
Less than2 minutes
4
15
36
26
13
6
22
The Emergence of Embedded Audio and Video in Written Collateral Over the past 12 months Eccolo has participated in an emerging trend in marketing collateral embedding audio and video files into digital versions of written documents such as white papers and case studies We therefore asked respondents if they had consumed any written collateral that contained embedded audio andor video files A significant proportion of themmdash45 percentmdashsaid they had done so
Respondents were most likely to encounter embedded files in case studies (66 percent) followed by white papers (55 percent) and brochures (48 percent) (Figure 29)
Perhaps the most dramatic of our findings in this part of the survey was the overwhelming percentage of respondents who clicked through to these embedded files 93 percent Twenty-five percent clicked through to video files six percent clicked through to audio files and 62 percent clicked through to both audio and video (Figure 30)
And most importantly when respondents were asked whether the inclusion of audio or video files positively or negatively affected the overall influence of the written collateral 80 percent indicated that they viewed it either ldquovery positivelyrdquo or ldquopositivelyrdquo (Figure 31)
0
10
20
30
40
50
60
70
80
OtherBrochuresCase studiesWhite paper
55
66
48
1
Figure 29 Which types of written collateral have you consumed that included embedded audio or video
23
In particular decision makers felt this trend was positive 83 percent ranked it as very positively or positively affecting the overall influence of the written collateral compared to 74 percent of influencers (Figure 32)
The size of company also mattered when it came to the perceived influence of embedded files with enterprises more likely to indicate that it was very positive (26 percent) compared to middle-market (14 percent) or small firms (15 percent) On a related note small businesses were more likely to say that embedded files had no influence at allmdash33 percent versus 15 percent of middle-market and 15 percent of enterprise firms (Figure 33)
0
10
20
30
40
50
60
70
80
NeitherBoth audiovideoAudio onlyVideo only
25
6
62
7
Figure 30 Did you click through or open any of the video or audio files embedded in the collateral
0
10
20
30
40
50
60
70
Very negativelyNegativelyNo influencePositivelyVery positively
18
62
18
1 1
Figure 31 How did the inclusion of embedded audio and video files affect the overall influence of the written collateral
24
These results support Eccolorsquos belief that interactivity is becoming ldquotable stakesrdquo for written marketing communications collateral Given the preference that purchasers have already expressed for consuming collateral at their desktop (see Figure 22) marketers that donrsquot experiment with embedded ausio video and other multimedia formats as well as links off to other communications and social media channels risk delivering assets that seem obsolete and old-fashioned
Figure 32 How did the inclusion of embedded audio and video files affect the overall influence of the written collateral
(decision makers versus influencers)
0
20
40
60
80
Very NegativelyNegativelyNo InfluencePositivelyVery Positively
24
59
66
15
26
1 0 018
Decision maker Influencer
0
10
20
30
40
50
60
70
80
Very negativelyNegativelyNo influencePositivelyVery positively
15 14
26
52
69
59
33
15 15
0 1 0 0 1 0
Small business Mid-market Enterprise
Figure 33 How did the inclusion of embedded audio and video files affect the overall influence of the written collateral
(small business vs mid-market vs enterprise)
25
The Channel EffectLast year we added a section to our annual survey that investigated how channel affects the perceived influence of collateral We defined channel as the specific avenue through which the respondent receives contentmdashwhether from a personal contact from a corporate Web site or from a sales representative for example
One fact immediately stood out in 2009 most respondents receive written collateral through the corporate Web site (Figure 34) This did not change in 2010 with 71 percent of respondents finding white papers through such sites 65 percent getting brochuresdata sheets through that channel and 56 percent acquiring case studies in that way
The next most frequently used channel for receiving a white paper in 2010 was a download from a direct response campaign (59 percent) which implies that this should be considered an important means of distribution for marketers This was followed by forwarded by a sales repcompany contact (54 percent) obtained from a personal contact (52 percent) accessed via social media (39 percent) and absorbed through webinars (34 percent) In 2009 podcasts and video collateral differed from written content when it came to how respondents ldquofoundrdquo them but that difference
0
10
20
30
40
50
60
70
80
Mentioned ina webinar
Linked to ordiscussed in
onlinesocial media
Linked in toan RSS feed
Forwarded bysales rep
company contact
BrowsingcorporateWeb site
Downloadedfrom
direct responsecampaign
Forwardedfrom
personalcontact
White papers Case studies Podcasts Videos Brochures
5253
46
34
37
59
71
5655
6665
54
4241
38
27
23
31
39
31
39
29
23
34
20
23
20
12
21
15
44
38
45
34 34
Figure 34 Through which channels have you received collateral
26
has vanished Last year podcasts were almost equally acquired from a personal contact or from a corporate Web site (48 percent and 49 percent respectively) However this year the corporate Web site trumped the personal contact channel (55 percent to 46 percent) And this was even more dramatically the case for video with only 34 percent of respondents indicating they had been forwarded a video by a personal contact while 66 percent found video on corporate Web sites This trend underscores the importance of the corporate Web site across all collateral types
When we examined the comparative influence of these various channels another interesting fact emerged although a piece of collateral referred to or forwarded by a personal contact was most frequently cited as the most influential channel for all types of collateral browsing the corporate Web site was the second most frequently cited answer (Figure 35) When you consider that the corporate Web site is clearly the most frequently used channel for collateral delivery coupled with its high perceived influence you understand why we recommend that you make investing in and frequently refreshing your Web site a priority
0
10
20
30
40
50
60
70
80
Mentioned ina webinar
Linked to ordiscussed in
onlinesocial media
Linked in toan RSS feed
Forwarded bysales rep
company contact
BrowsingcorporateWeb site
Downloadedfrom
direct responsecampaign
Forwardedfrom
personalcontact
White papers Case studies Podcasts Videos Brochures
73
79
767677
41
38
424343
6060
53
61
69
37
33
28
39
46
2220
31
1716
35
42
3836
31 31
27
33
29
19
Figure 35 Positive influence by channel
27
Marketing Collateral in the Sales CycleThe relationship between collateral and actual sales is an important one How do the various types of collateralmdashwhite papers case studies brochuresmdashimpact sales When should you deliver a white paper case study podcast or video to drive potential purchasers to the next step in the sales cycle Is there a way to time delivery of specific collateral types to nurture leads more effectively
For the purposes of this survey we defined the various stages of the technology evaluation and purchase process as
bull Pre-salemdashConsidering solutions and vendors
bull Initial salemdashReviewing vendor qualifications capabilities and RFP responses
bull Mid-salemdashReviewing details of the solution with one vendor
bull Final salemdashCustomization negotiation and procurement
In our 2008 survey results we saw that respondents most frequently consumed each collateral type for the first time in the pre-sale process by a significant margin that is before they send out RFPs or initiate discussions with specific vendors In that first Eccolo B2B survey white papers were read by 61 percent of respondents during this phase case studies by 48 percent podcasts by 53 percent video by 51 percent and brochuresdata sheets by 62 percent
0
10
20
30
40
50
60
70
Final sales processMid-sales processInitial sales processPre-sales process
White papers Case studies Podcasts Videos Brochures
53
49
41
49
31
3435
30
25
13
21
2018
11
4 3 4 3 4
60
Figure 36 In which phase of the purchasing cycle did you FIRST consume each type of collateral
28
Our 2010 survey indicates that these habits are shifting While the majority of respondents still consume most collateral for the first time in the pre-sales phase more respondents now indicate they first consumed collateral in either the initial sales or mid-sales phases than they did in 2008 For example the percentage of respondents who first consumed a white paper during the pre-sales process dropped to 53 percent the percentage that listened to a podcast dropped down to 41 percent (Figure 36) In both cases respondents appeared to move their first consumption of those types of collateral down to the next two stages of the sales process
When we further segmented the 2010 data to compare the habits of influencers to decision makers we observed some additional interesting trends across the board influencers tend to consume content earlier in the sales cycle than decision makers (Figure 37)
0 10 20 30 40 50 60 70 80
Final salesprocess
Mid-salesprocess
Initial salesprocess
Pre-salesprocess
Final salesprocess
Mid-salesprocess
Initial salesprocess
Pre-salesprocess
White papers Case studies Podcasts Videos Brochures
63
58
41
6458
4752
65
2526
3830
23
915
1417
9
2111
2
4542
3647
56
3339
3430
27
1614
2319
12
65
74
5
25
26
35
20
4
Infl
uen
cers
Deci
sio
n M
akers
Figure 37 In which phase of the purchasing cycle did you FIRST consume each type of collateral (influencers vs decision makers)
29
Likewise respondents from small businesses consume collateral for the first time during the pre-sales stage at much higher rates than respondents from middle-market or large companies For example 70 percent of small businesses consume white papers for the first time during this stage compared to just 40 percent of middle-market firms and 56 percent of large enterprises (Figure 38)
Small Business Mid-market Enterprise
0
10
20
30
40
50
60
70
80
Final sales processMid-sales processInitial Sales ProcessPre-sales Process
70
40
56
16
38
29
9
17
12
5 53
Figure 38 In which phase of the purchasing cycle did you FIRST consume white papers in 2010
As in previous years we find the data around use of collateral in the sales cycle interesting in the way it potentially sheds light on the relationship between influencers and decion makers We believe we are seeing the influencerrsquos role in terms of considering potential technology purchases and the subsequent sharing of that collatera and other information with decision makers a bit later in the cycle
30
BEST PRACTICES FOR THE REAL WORLD
As in previous years we conclude our delivery of the survey results by providing what we consider to be actionable advice that marketing professionals can apply right now to improve the quality and impact of their communications assets
1 Create white papers This is a repeating theme but one that is definitely worth saying once again white papers are frequently consumed and considered highly influential over the technology purchase Take advantage by creating a few well-written papers that clearly outline strategic advancements your solutions and products are aligned with Leverage your work by chunking up the main points into best practice documents blog posts ldquohow tordquo guides and other materials to support your broader campaign needs
2 Embed multimedia files Start with short video or audio clips to keep overall file sizes low but jump on this trend Once you get your feet under you you can advance to interactive charts and graphs Flash elements and other media types Donrsquot ignore the opportunity to be among the first to take advantage of this evolving practice
3 Consider all content to be social content We know that tech purchasers share content and that they consider materials forwarded from a personal contact to be very influential Plan all content and collateral assets from the perspective of stimulating discussion and sharing Think about interactivity links to discussion boards and user groups and point to blog posts and other communications channels in all materials
4 Deliver all content assets digitally and be prepared to have end users print them While the majority of respondents view collateral assets on the desktop a respectable number still enjoy printing out the materials they download and will further share print materials with others Avoid cross-page spreads and column designs that are hard to read digitally and remember to provide clear URLs for any links away from the materials for those reading print versions
5 Merchandise content on the Web Your company Web site is the most frequent location for obtaining content and it ranks second only to personal contacts in terms of influence Make the most of this channel by merchandising featured content and assets on landing pages and microsites that extend the thought leadership and discussion begun in your collateral Remember potential purchasers interact with your content before they interact with you so ensure viewers can easily see all the other channels through which they can engage with you all in one fun-filled information portal
31
CONCLUSIONAs we wrap up this yearrsquos annual survey report we find ourselves coming back to some basic advice that has been a theme of this section in each previous report plan
Eccolo believes that the requirement of content strategymdashidentifying communication topics and thoughtfully planning the assets required to achieve goalsmdashis relevant at every level of the marketing organization The proliferation of online channels and ever more sophisticated lead generation systems require a steady stream of fresh relevant content to successfully engage purchasers Itrsquos very easy to be distracted by looming deadlines and shifting priorities but creating a content strategy and identifying a clear development roadmap that describes topic format and channel is essential if you truly want to improve results
And the opportunity to improve results is significant Well-planned development cycles can shorten time to market reduce costs and ensure a consistent message across all external assets Further organizations that show a healthy respect for content planning and development from the top down will experience the entire enterprise shifting to a more responsive stance These companies are tuned toward deeper customer conversations that align with the end userrsquos preferences for sales and marketing information and by the very style of their collateral assets signal a positive experience for the potential buyer
Engage With UsEccolo Media welcomes your feedback on this report Email us at infoeccolomediacom with specific feedback or visit our blog at httpeccolomediatypepadcom to join in our ongoing discussion of best practices in content strategy
ACKNOWLEDGEMENTSWe would like to acknowledge the participation of the following team members for their efforts in bringing the Eccolo Media 2010 B2B Technology Collateral Survey Report to life Maite Figueroa Alice LaPlante Lorie Loe Courtney Love and Michael Sudol
32
ABOUT ECCOLO MEDIAEccolo Media specializes in strategic marketing insight and content development for some of the worldrsquos best-known technology companies An agency of exceptional writers Eccolo combines deep experience with ongoing research to identify and apply best practices for producing remarkable content The agency helps align clientsrsquo marketing needs with their key business goals by bringing a proactive innovative approach to the planning and execution of collateral in both traditional and new media channels Founded in 2007 Eccolo Media is headquartered in San Francisco California and fulfills a wide range of project needs throughout the Americas and EMEA Visit our Web site at wwweccolomediacom
ABOUT EMEDIA - Our Marketing Sponsoremedia has specialized in generating B2B sales leads and building demand since 1999 We reach more than 35 million decision makers across over 80 niche-oriented audiences within the following B2B areasInformation Technology ElectronicsSupply ChainLogistics Occupational HealthCorporate Finance Environmental ManagementHuman Resources Project ManagementMarketingSales PackagingConvertingB2B Events Construction amp ArchitectsManufacturing Professional DevelopmentSmall Business Design EngineersProcurement Control EngineersHospitality Management PrintingHealthcare Tech
emediarsquos expertise and personal service permit effective implementation of Guaranteed Cost-per-Lead programs for our clientsrsquo offers and collateral Or we can drive highly targeted traffic to clientsrsquo web pages
Contact emedia at 800-782-6167 630-288-8480 or inquiriesemediausacom
ACCELERATED B2B LEAD GENERATION mdash ON DEMAND
wwwemediausacom

5
When respondents were asked if they make purchasing decisions primarily from a business perspective a technology perspective or both the majority of respondents 61 percent indicated they consider both technical and business criteria when making a technology purchase Thirty-four percent used only technology criteria and only five percent of respondents considered purchases from a business perspective only
Respondent ProfilesAs in our 2009 report we used profiling questions to help us create two distinct respondent types the ldquodecision makerrdquo and the ldquoinfluencerrdquo Those respondents who identified themselves as decision makers tend to take a more holistic view of technology purchases considering them from both the business and technology perspectives Alternatively those respondents that identified as influencers are more likely to consider technology requirements alone Decision makers also tend to be higher up the organizational ladder C-level executives vice presidents (VPs) and directors Influencers on the other hand are more likely to identify themselves as managers developers and programmers (Figure 4)
Where our analyses identified statistically significant differences we also present data segmenting these two primary profiles by organizational size
Collateral Types and DefinitionsThe survey asked respondents questions about their use of five collateral types
bull White papers These provide analyses of technology or business trends from an independent vendor-neutral position
bull Case studiessuccess stories This type of collateral features stories of how customers successfully deployed a companyrsquos products or services
bull Podcasts These are digital audio recordings that can either be streamed from a Web site or downloaded onto a desktop or
39
32
29
Small business Less than 100 employees
Mid-market business 101-999 employees
Enterprise 1000 or more employees
Figure 3 Size of company
Profile 1 Decision Makers (58) Profile 2 Influencers (42)
Approach purchasing decisions from both business and technology perspectives
Approach purchasing decisions from a primarily technological perspective
C-level executives VPs or directors Managers developerstechnicians and programmers
Figure 4 Respective characteristics of decision makers and influencers
6
mobile device Topics vary but can include product overviews discussions by or interviews with subject matter experts or customer testimonials
bull Video This increasingly important form of collateral is being used for a broad range of marketing communications from customer success stories to product demonstrations to analyst or internal expert interviews
bull Product brochuresdata sheets These documents contain specific productservice or company information
In previous years survey questions were designed to determine respondent preferences for each collateral type What collateral did they find to be most influential Through what channel did they receive the collateral and did this affect the perceived influence of the collateral When in the purchasing cycle did they tend to view specific collateral types
These questions and more were then analyzed for useful data points
Presentation of Data and DiscussionFor our 2010 Survey Report we chose to organize our key findings into the following sections
bull The perceived influence of each type of collateral on the purchasing decision
bull What our respondents think makes ldquogoodrdquo (ie influential) content and collateral
bull The emerging practice of embedding audio and video files within written collateral and the perceived influence of this practice
bull The manner in which respondents received collateral (ie the channel)
bull How collateral is used in the sales cycle
As in previous years we used the results of our analysis to create a series of best practices that marketers can apply to optimize their content development processes and maximize the impact of their collateral assets Yoursquoll find this in the last section of our report
Respondents from larger companies are much more likely to consume contentWe found a marked difference in content consumption across all collateral types when looking at the size of the organization Both decision makers and influencers from both middle-market and enterprise companies were more likely to consume collateral than those from small companies
7
KEY FINDINGS
The Sphere of InfluenceOver the past three years we have probed to discover what types of collateral respondents consume and the degree to which each collateral type influences their purchasing decisions
As in previous years we found that both decision makers and influencers consume a wide range of collateral types when making technology purchases from product brochures to videos to podcasts case studies and white papers (Figure 5)
As we found in every past survey the most frequently consumed types of collateral are product brochures amp data sheets In fact respondents have only increased their use of this type of content over the years from 70 percent in 2008 to 78 percent in 2009 to this yearrsquos finding of 83 percent Case studies and white papers after making significant leaps in consumption rates between 2008 and 2009 remained relatively flat between 2009 and 2010 The biggest changes were in the frequency in which respondents consumed videos and podcasts amp audio files In 2008 only 28 percent of respondents had consumed these types of collateral In 2009 podcasts made a moderate gain up to 32 percent Video consumption increased more generously from 28 percent in 2008 to 51 percent in 2009
This year that trend continued Consumption of audio content increased 8 percentage points to 40 percent Video collateral consumption increased 8 points to 59 percentmdashthe same consumption levels that case studies were at in 2008
White Papers Remain Most InfluentialAlthough the number of respondents who had read a white paper in the past six months to evaluate a purchasing decision remained flat over the past 12 months (77 percent in 2009 and 76 percent in 2010) the vast majority of respondents
0 20 40 60 80 100
White papers
Case studiessuccess stories
Podcastsaudio files
Videos
Product brochuresdata sheets
83
59
40
67
76
Figure 5 Which of the following collateral types have you consumed in the last six months to evaluate a technology purchase
8
(83 percent) felt that white papers were moderately to extremely influential in helping them make their final purchase decisions Only one percent thought that white papers werenrsquot influential at all and 41 percent thought they were very to extremely influential (Figure 6)
In 2009 we identified a significant gap (22 percent) between decision makers and influencers in how influential they found white papersmdashwith 51 percent of decision makers finding white papers ldquovery to extremely influentialrdquo compared to just 29 percent of influencers who agreed with that statement That gap narrowed in 2010 and we now see a 13 percent difference between the two groups (Figure 7)
Organizational size also seems to make a considerable difference in how respondents view white papers Both decision makers and influencers from enterprise and mid-market companies are more likely to consume a white paper than their small business counterparts as seen in Figure 8
Figure 6 How influential are white papers in your purchasing decisions in 2010
0
10
20
30
40
50
Not influentialat all
Somewhatinfluential
Moderatelyinfluential
Veryinfluential
Extremelyinfluential
12
29
42
16
1
Figure 7 How influential are white papers in your purchasing decision (influencers versus decision makers)
0
10
20
30
40
50
Not influentialat all
Somewhatinfluential
Moderatelyinfluential
Very to extremelyinfluential
34
47 48
38
1714
1 1
Influencer Decision maker
9
Finally we asked respondents to rank all collateral types from most influential to least influential (Figure 9 on page 9) As in our previous surveys white papers were most frequently given as the most influential collateral type Statistically there was no difference between decision makers and influencers in this regard These findings continue to reinforce our position that the high usage rate of white papers coupled with their high perceived influence make them a very valuable asset in the marketing communications toolkit
0
20
40
60
80
100
EnterpriseMid-marketSmall business
Influencers Decision makers
7074
82
62
9085
Figure 8 Have you read any white papers in the past six months to evaluate a technology purchase
0
10
20
30
40
50
60
White papers Case studies Podcasts Videos Brochures
5Least influential
4321Most influential
Figure 11 Please rank the following collateral in order of influence in making purchasing decisions with 1 being most influential and 5 being least influential
39
18
5
10
2827
34
7
16 1617
27
1816
22
7
13
26
38
44
16
108
2018
Figure 9 Please rank the following collateral in order of influence in making purchasing decisions with 1 being most influential and 5 being least influential
10
When White Papers DisappointWhile other types of collateral such as case studies and brochures are fairly standard from company to company white papers can vary widely in terms of their format content and organization To better understand what makes for a ldquogoodrdquo white papermdashwhat increases influencemdashwe asked the 2010 respondents the reverse question what would most disappoint them when reading a white paper What would decrease its influence1
Poorly written content was most frequently ranked as the number one reason for respondents expressing disappointment in a white paper as seen in Figure 10 However other results surprised us For example contrary to what Eccolo has long believed white papers that donrsquot possess best practice recommendations do not disappoint implying that key take-aways or next steps are not particularly persuasive Neither do white papers that are too technical Instead white papers that donrsquot contain enough technical information are more likely to disappoint than those that possess too much
Case Studies Remain Valuable Collateral The frequency with which case studies were used to make technology purchases in 2010 remained statistically unchanged from 2009 (67 percent) When asked how influential they felt case studies were in making purchasing decisions (Figure 11) the answers were again statistically similar to 2009 79 percent of respondents in the 2010 survey felt that case studies were moderately to extremely influential Nineteen percent found them somewhat influential and only two percent found them not to be influential at all As in 2009 when compared to the influence of other collateral types 2010 respondents ranked them as the second-most influential after white papers (see Figure 9 on page 9)
Figure 10 When reading white papers what is most likely to disappoint you
Poorly written
Not technical enough
No real-life cases
Too much productvendor info
Poorly designed
No new industry developments
Not enough productvendor info
No best practicesguidelines
Too technical
MOST DISAPPOINTING
LEAST DISAPPOINTING
1 In previous surveys we attempted to answer this question by plainly asking respondents what increased the influence of white papers The resulting data sets however were flat with no real critical element for positive influence standing out Hence our decision to pose the question from the negative
11
As in 2009 we asked respondents if case study content would be more or less influential if offered in a different formatmdashfor example if delivered in non-written forms such as audio or video
There was virtually no change in the response to this query between 2009 and 2010 Written case studies were still most frequently tapped as the most influential of all case study formats (Figure 12)
When we compared the attitudes of decision makers and influencers toward case study format however we did find a statistically significant change in the 2010 survey results In the 2009 survey influencers were much more likely to find written case studies the most influential (76 percent) than decision makers (59 percent) In 2010 the difference in attitudes was just a single percentage point 65 percent of influencers found written case studies to be the most influential form of customer testimonial compared to 64 percent of decision makers who indicated the same thing The gap also closed in respondentsrsquo attitudes toward video testimonials In 2009 40 percent of decision makers specified video as the most influential format for customer testimonials compared to 23 percent of influencers In 2010 this gap narrowed to just three percentage points (35 percent and 33 percent respectively) (Figure 13)
65 33
2
Video testimonial
Audio testimonial
Written case study
Figure 16 In which format would youfind a customer testimonial
to be most influential
Figure 12 In which format would you find a customer testimonial to be most influential
0
5
10
15
20
25
30
35
40
Not influentialat all
Somewhatinfluential
Moderatelyinfluential
Veryinfluential
Extremelyinfluential
10
29
40
19
2
Figure 12 How influential are case studies in your purchasing decisionsFigure 11 How influential are case studies in your purchasing decisions
12
Podcasts More Frequently Consumed But Less Influential Podcasts continued to play a role in the technology purchasing cycle in 2010 The percentage of survey respondents who listened to a podcast in the past six months rose to 36 percent up from from 32 percent in 2009 (Figure 5) However the percentage of respondents who found them to be moderately to extremely influential dropped to 78 percent (see Figure 14) compared to 82 percent in 2009 As in 2009 podcasts are ranked the fifth-most influential type of collateral when compared to other surveyed collateral types (see Figure 9 on page 9)
One interesting change identified in this yearrsquos results in 2009 decision makers found podcasts more influential than influencers didmdashwith 87 percent finding them moderately to extremely influential compared to just 73 percent of influencers In 2010 these results flipped with 81 percent of influencers finding podcasts moderately to extremely influential compared to 76 percent of decision makers (Figure 15) Decision makers were still more likely to find podcasts very or extremely influential however
0
5
10
15
20
25
30
35
Not influentialat all
Somewhatinfluential
Moderatelyinfluential
Veryinfluential
Extremelyinfluential
12
3234
21
1
Figure 14 How influential were podcastsaudio files in making a final purchasing decision
0
10
20
30
40
50
60
70
Audio testimonialVideo testimonialWrtitten case study
64
33
65
35
30
Influencers Decision makers
Figure 13 In which format would you find a customer testimonial to be most influential (decision maker versus influencer)
13
In those cases when respondents indicated they had listened to a podcast we asked what type of podcast it had been By far the most common type of podcast consumed was one covering technology trends (78 percent) followed by business trends (55 percent) Forty-five percent listened to information on vendor products andor solutions with the smallest but still significant percentage (39 percent) listening to customer testimonials in that format (Figure 16)
Video Continued Growth in Consumption Our 2010 survey respondents indicated that their use of video when considering technology purchase continues to increase The percentage of respondents who watched a video in the past six months increased eight points to 59 percent This result continues a trend seen in the 2009 survey results when use of video increased from 28 percent in 2008 to 49 percent in 2009 (Figure 17)
Figure 16 What types of podcastaudio files have you listened to in order to evaluate a technology purchase Check all that apply
0
20
40
60
80
OtherInformationon vendor
productssolutions
Businesstrends
Technologytrends
Customertestimonial
1
39
78
55
45
0
10
20
30
40
50
Not influentialat all
Somewhatinfluential
Moderatelyinfluential
Veryinfluential
Extremelyinfluential
28
15
7
35
46
26
17
24
02
Influencers Decision makers
Figure 15 How influential were podcastsaudio files in making a final purchasing decision
14
In 2008 video was ranked fifth in influence when compared to other types of collateral In 2009 it moved into fourth place surpassing podcasts in influence In 2010 it held on to that position (Figure 9 on page 9) When asked how influential the video was on a technology purchase 26 percent of respondents indicated they found videos to be moderately to extremely influential (Figure 18)
We further inquired as to the type of video respondents consumed during a technology purchase Respondents watched more product tutorialsdemos by a wide margin over other types of video collateral (76 percent) Vendor marketing videos were the next most commonly viewed type of video (61 percent) followed by customer testimonials (37 percent) and on-demand webinars (33 percent) as seen in Figure 19
Figure 18 How influential were the videos in making a final purchasing decision
0
10
20
30
40
Not influentialat all
Somewhatinfluential
Moderatelyinfluential
Veryinfluential
Extremelyinfluential
9
39
31
19
2
Figure 17 Have you viewed any videos in the past six months to evaluate a technology purchase
0
20
40
60
80
NoYes
201020092008
28
49 50
72
51 50
15
Brochures and Data Sheets Consumed Most Frequently In 2009 brochures and data sheets were the most frequently consumed of all collateralmdashwith 78 percent of respondents using them to make a purchasing decision over the past six months In 2010 83 percent of respondents consumed these types of collateral But although 79 percent of respondents rated them as moderately to extremely influential when making a technology purchase (Figure 20) they still tend to rank behind white papers and case studies when compared with other collateral types (see Figure 9 on page 9)
As with many other types of collateral large enterprises were more likely to consume brochures than small companies (less than 100 employees) with mid-sized companies falling in between
This year we continue to recommend that brochures and data sheets be a part of every marketerrsquos collateral toolbox precisely because they are so frequently
Figure 20 How influential were brochuresdata sheets in making a final purchasing decision
0
10
20
30
40
50
Not influentialat all
Somewhatinfluential
Moderatelyinfluential
Veryinfluential
Extremelyinfluential
8
31
40
18
3
0
10
20
30
40
50
60
70
80
OtherProducttutorials demos
On-demandwebinars
Vendormarketing
videos
Customertestimonials
37
61
2
76
33
Figure 19 What types of video files have you listened to in order to evaluate a technology purchase
16
consumed We also reiterate our advice that it might not be strategically wise to rely solely on this type of collateral given that their perceived influence is lower than some other collateral types Rather brochures and data sheets should be ldquomust-haverdquo assets in a well-rounded collateral portfolio that includes a broad variety of other content types
How Technology Purchasers Consume ContentAs in previous years we devoted significant time to analyzing how technology purchasers consume and use collateral In this section we share our results plus our insight into what respondents believe makes ldquogoodrdquo collateral
Most Collateral Still Consumed Digitally One surprise in this yearrsquos survey results was that although respondents still have an overwhelming preference for consuming written content on the desktop rather than printing it out that number actually declined across all types of written collateral (Figure 21) For example in 2009 a full three-fourths (76 percent) of respondents read white papers digitally a similar percentage (77 percent) did the same with brochuresdata sheets and even more (84 percent) consumed case studies in this form Yet in 2010 these numbers declined The percentage that read white papers digitally dropped 15 full percentage points to 61 percent The percent of respondents who indicated that they preferred to consume brochuressdata sheets in digital form declined only slightly but just 71 percent of respondents said they preferred to consume case studies in digital formmdash10 percentage points less than in 2009
We also found significant changes in whether respondents downloaded audio files onto their desktops or mobile devices or listened to audio streams from Web sites In 2009 62 percent preferred to download audio files onto their desktop or mobile devices versus 38 percent that preferred to stream directly from a Web site Yet in
Figure 21 Did you view this collateral online or did you downloadprint before reading (2009 vs 2010)
0
20
40
60
80
100
Brochuresdata sheetsCase studiessuccess storiesWhite paper
Downloaded printed 2010
Downloaded printed 2009
Viewedonline 2010
Viewedonline 2009
76
61
24
39
84
74
16
26
77
71
23
29
17
2010 these numbers shifted substantially toward a preference for streaming this year 57 percent of respondents preferred streaming versus 43 percent that favored downloading these types of files
This brings the method of consumption of audio files more in line with respondentsrsquo preferences for streaming video Sixty-four percent of 2010 respondents preferred to watch video streamed live from the source versus 36 percent that preferred to download it to a desktop or mobile device (Figure 22)
However whether streamed or downloaded 92 percent of podcast listeners and 96 percent of video viewers still consumed content on the desktop This is a critical finding that has remained consistent from year to year given that the desktop is the platform of choice for consuming all types of content marketers should ensure that all written content leverages links to other files and other communication channels as much as possible giving technology purchasers the option of drilling down to more details as desired
All Collateral Has Viral PotentialWe continue to be interested in the fact that all collateral is highly viral Technology purchasers routinely share collateral with the vast majority of 2010 respondents (89 percent) sharing the white papers they read with others as seen in Figure 23 Nearly as many (87 percent) share case studies followed by podcasts (84 percent) and then brochuresdata sheets and video (80 percent each)
White papers are still the most viral with 34 percent of respondents sharing them with three or more people Thirty-two percent of respondents shared podcasts with three or more people and 28 percent shared case studies with as many Lagging slightly behind were video (25 percent) and brochuresdata sheets (23 percent)
0
20
40
60
80
Downloaded tomobile device
then listented toviewed
Downloaded todesktop
then listened
Streamed fromlive source
5764
35 32
84
Podcasts Videos
Figure 22 Did you consume this content online or did you download before viewinglistening
18
Another interesting development although all collateral is shared primarily in digital form more 2010 respondents say that they share written collateralmdashwhite papers case studies and brochuresdata sheetsmdashin both digital and printed forms (Figure 24) than did respondents to the 2009 survey For example whereas the percentage of respondents who shared digitalelectronic versions of white papers actually declined in the past yearmdashfrom 60 percent to 51 percentmdashthe percentage of respondents who shared white papers in both digital and printed form increased from 30 percent to 37 percent We therefore caution marketers not to discount the viral nature of hard copy content as it clearly still is considered useful by a significant percentage of respondents
In 2009 influencers were more likely to share only digital copy and decision makers were more likely to share both printed and digital content However in 2010 this is no longer the case and these two respondent types are now in parity on this issue
0
5
10
15
20
25
30
35
White papers Case studies Podcasts Videos Brochures
5 or more
43210
11
13
16
20 20
23
28
25 25
30
33
31
27
30
19
14
17
12
6 6
9
7
5
8 8
6 6 6
12
27
Figure 23 On average how many other decision makers or influencers in your organization did you share each piece of collateral with
19
Preferences For Length Are ChangingEccolo Media has established best practices for serving up marketing collateral in small well-written packages Our survey results over the past three years have reinforced our belief that this serves marketers best However this year we observed subtleties in the survey results that indicated respondents may be adjusting their preferences for longer collateral length
White papersWersquove stated repeatedly that white papers are a highly influential collateral consumed at a high frequency by both decision makers and influencers But marketing communications professionals continue to debate the ideal length of a white paper how do they give the right amount of informationmdashnot too much and not too little As Figure 25 shows the majority of respondents (55 percent) felt six pages or less to be the ideal number However this percentage is 10 points less than last yearrsquos 65 percent
Figure 25 What do you feel is the ideal length for a white paper in number of pages
0
10
20
30
40
50
More than10 pages
10 pages8 pages6 pages4 pages
21
34
27
13
5
Figure 24 In what format did you share collateral
0
10
20
30
40
50
60
70
BrochuresCasestudies
Whitepapers
51
37
52
12
35
12
49
19
32
Digitalelectronic version Hard copy Both
20
Simultaneously the percentage of respondents who preferred white papers of just four pages dropped from 24 percent down to 21 percent and the percentage of respondents who leaned toward eight pages increased from 21 percent to 27 percent This indicates that the ldquoideal lengthrdquo is shifting toward longer rather than shorter white papers
There were no general differences in length preferences between decision makers and influencers but technology purchasers from small companies tend to prefer shorter white papers with 31 percent preferring four pages or less compared to 19 percent of enterprise and 18 percent of mid-market companies that said the same
Case StudiesIn 2008 most respondents reported the ideal length of a case study to be two pages or approximately 800 to 1000 words Yet in 2009 we received different responses That year the largest proportion of respondents (39 percent) indicated that four is the ideal number of pages for a written case study This yearrsquos 2010 survey backed up last yearrsquos numbers with 37 percent preferring four pages and virtually identical percentages of respondents preferring two pages or less (35 percent) or six pages or more (28 percent) as seen in Figure 26
In general the larger the company the longer they prefer their case studies to be with the largest percentage of respondents from small companies (33 percent) preferring two-page case studies the largest percentage from middle-market firms (40 percent) and large enterprises (39 percent) preferring four-page case studies
Figure 26 What do you feel is the ideal number of pages for a case studysuccess story
0
10
20
30
40
50
More than6 pages
6 pages4 pages2 pages1 page
8
27
37
19
9
21
Podcasts The ideal length of a podcast decreased in 2010 Figure 27 shows that the greatest number of respondents (36 percent) selected five to seven minutes as the ideal length Most respondents (81 percent) prefer podcasts that are 10 minutes or less in length and in general the smaller the company the shorter they prefer their podcasts to be
Video The majority of 2010 respondents (38 percent) indicated that the ideal length of video content is five to seven minutes while 24 percent preferred videos of eight to 10 minutes (Figure 28) These results indicate a slight trending to shorter videos over the 2009 respondentrsquos preferences for length where 31 percent preferred five to seven minutes and 28 percent preferred eight to 10 minutes
Figure 28 What do you feel is the ideal length of a video in number of minutes
0
10
20
30
40
More than15 minutes
11 to 15minutes
8 to 10minutes
5 to 7minutes
2 to 4minutes
Less than2 minutes
6 5
19
38
24
8
Figure 27 What do you feel is the ideal length of a podcastaudio file in number of minutes
0
10
20
30
40
More than15 minutes
11 to 15minutes
8 to 10minutes
5 to 7minutes
2 to 4minutes
Less than2 minutes
4
15
36
26
13
6
22
The Emergence of Embedded Audio and Video in Written Collateral Over the past 12 months Eccolo has participated in an emerging trend in marketing collateral embedding audio and video files into digital versions of written documents such as white papers and case studies We therefore asked respondents if they had consumed any written collateral that contained embedded audio andor video files A significant proportion of themmdash45 percentmdashsaid they had done so
Respondents were most likely to encounter embedded files in case studies (66 percent) followed by white papers (55 percent) and brochures (48 percent) (Figure 29)
Perhaps the most dramatic of our findings in this part of the survey was the overwhelming percentage of respondents who clicked through to these embedded files 93 percent Twenty-five percent clicked through to video files six percent clicked through to audio files and 62 percent clicked through to both audio and video (Figure 30)
And most importantly when respondents were asked whether the inclusion of audio or video files positively or negatively affected the overall influence of the written collateral 80 percent indicated that they viewed it either ldquovery positivelyrdquo or ldquopositivelyrdquo (Figure 31)
0
10
20
30
40
50
60
70
80
OtherBrochuresCase studiesWhite paper
55
66
48
1
Figure 29 Which types of written collateral have you consumed that included embedded audio or video
23
In particular decision makers felt this trend was positive 83 percent ranked it as very positively or positively affecting the overall influence of the written collateral compared to 74 percent of influencers (Figure 32)
The size of company also mattered when it came to the perceived influence of embedded files with enterprises more likely to indicate that it was very positive (26 percent) compared to middle-market (14 percent) or small firms (15 percent) On a related note small businesses were more likely to say that embedded files had no influence at allmdash33 percent versus 15 percent of middle-market and 15 percent of enterprise firms (Figure 33)
0
10
20
30
40
50
60
70
80
NeitherBoth audiovideoAudio onlyVideo only
25
6
62
7
Figure 30 Did you click through or open any of the video or audio files embedded in the collateral
0
10
20
30
40
50
60
70
Very negativelyNegativelyNo influencePositivelyVery positively
18
62
18
1 1
Figure 31 How did the inclusion of embedded audio and video files affect the overall influence of the written collateral
24
These results support Eccolorsquos belief that interactivity is becoming ldquotable stakesrdquo for written marketing communications collateral Given the preference that purchasers have already expressed for consuming collateral at their desktop (see Figure 22) marketers that donrsquot experiment with embedded ausio video and other multimedia formats as well as links off to other communications and social media channels risk delivering assets that seem obsolete and old-fashioned
Figure 32 How did the inclusion of embedded audio and video files affect the overall influence of the written collateral
(decision makers versus influencers)
0
20
40
60
80
Very NegativelyNegativelyNo InfluencePositivelyVery Positively
24
59
66
15
26
1 0 018
Decision maker Influencer
0
10
20
30
40
50
60
70
80
Very negativelyNegativelyNo influencePositivelyVery positively
15 14
26
52
69
59
33
15 15
0 1 0 0 1 0
Small business Mid-market Enterprise
Figure 33 How did the inclusion of embedded audio and video files affect the overall influence of the written collateral
(small business vs mid-market vs enterprise)
25
The Channel EffectLast year we added a section to our annual survey that investigated how channel affects the perceived influence of collateral We defined channel as the specific avenue through which the respondent receives contentmdashwhether from a personal contact from a corporate Web site or from a sales representative for example
One fact immediately stood out in 2009 most respondents receive written collateral through the corporate Web site (Figure 34) This did not change in 2010 with 71 percent of respondents finding white papers through such sites 65 percent getting brochuresdata sheets through that channel and 56 percent acquiring case studies in that way
The next most frequently used channel for receiving a white paper in 2010 was a download from a direct response campaign (59 percent) which implies that this should be considered an important means of distribution for marketers This was followed by forwarded by a sales repcompany contact (54 percent) obtained from a personal contact (52 percent) accessed via social media (39 percent) and absorbed through webinars (34 percent) In 2009 podcasts and video collateral differed from written content when it came to how respondents ldquofoundrdquo them but that difference
0
10
20
30
40
50
60
70
80
Mentioned ina webinar
Linked to ordiscussed in
onlinesocial media
Linked in toan RSS feed
Forwarded bysales rep
company contact
BrowsingcorporateWeb site
Downloadedfrom
direct responsecampaign
Forwardedfrom
personalcontact
White papers Case studies Podcasts Videos Brochures
5253
46
34
37
59
71
5655
6665
54
4241
38
27
23
31
39
31
39
29
23
34
20
23
20
12
21
15
44
38
45
34 34
Figure 34 Through which channels have you received collateral
26
has vanished Last year podcasts were almost equally acquired from a personal contact or from a corporate Web site (48 percent and 49 percent respectively) However this year the corporate Web site trumped the personal contact channel (55 percent to 46 percent) And this was even more dramatically the case for video with only 34 percent of respondents indicating they had been forwarded a video by a personal contact while 66 percent found video on corporate Web sites This trend underscores the importance of the corporate Web site across all collateral types
When we examined the comparative influence of these various channels another interesting fact emerged although a piece of collateral referred to or forwarded by a personal contact was most frequently cited as the most influential channel for all types of collateral browsing the corporate Web site was the second most frequently cited answer (Figure 35) When you consider that the corporate Web site is clearly the most frequently used channel for collateral delivery coupled with its high perceived influence you understand why we recommend that you make investing in and frequently refreshing your Web site a priority
0
10
20
30
40
50
60
70
80
Mentioned ina webinar
Linked to ordiscussed in
onlinesocial media
Linked in toan RSS feed
Forwarded bysales rep
company contact
BrowsingcorporateWeb site
Downloadedfrom
direct responsecampaign
Forwardedfrom
personalcontact
White papers Case studies Podcasts Videos Brochures
73
79
767677
41
38
424343
6060
53
61
69
37
33
28
39
46
2220
31
1716
35
42
3836
31 31
27
33
29
19
Figure 35 Positive influence by channel
27
Marketing Collateral in the Sales CycleThe relationship between collateral and actual sales is an important one How do the various types of collateralmdashwhite papers case studies brochuresmdashimpact sales When should you deliver a white paper case study podcast or video to drive potential purchasers to the next step in the sales cycle Is there a way to time delivery of specific collateral types to nurture leads more effectively
For the purposes of this survey we defined the various stages of the technology evaluation and purchase process as
bull Pre-salemdashConsidering solutions and vendors
bull Initial salemdashReviewing vendor qualifications capabilities and RFP responses
bull Mid-salemdashReviewing details of the solution with one vendor
bull Final salemdashCustomization negotiation and procurement
In our 2008 survey results we saw that respondents most frequently consumed each collateral type for the first time in the pre-sale process by a significant margin that is before they send out RFPs or initiate discussions with specific vendors In that first Eccolo B2B survey white papers were read by 61 percent of respondents during this phase case studies by 48 percent podcasts by 53 percent video by 51 percent and brochuresdata sheets by 62 percent
0
10
20
30
40
50
60
70
Final sales processMid-sales processInitial sales processPre-sales process
White papers Case studies Podcasts Videos Brochures
53
49
41
49
31
3435
30
25
13
21
2018
11
4 3 4 3 4
60
Figure 36 In which phase of the purchasing cycle did you FIRST consume each type of collateral
28
Our 2010 survey indicates that these habits are shifting While the majority of respondents still consume most collateral for the first time in the pre-sales phase more respondents now indicate they first consumed collateral in either the initial sales or mid-sales phases than they did in 2008 For example the percentage of respondents who first consumed a white paper during the pre-sales process dropped to 53 percent the percentage that listened to a podcast dropped down to 41 percent (Figure 36) In both cases respondents appeared to move their first consumption of those types of collateral down to the next two stages of the sales process
When we further segmented the 2010 data to compare the habits of influencers to decision makers we observed some additional interesting trends across the board influencers tend to consume content earlier in the sales cycle than decision makers (Figure 37)
0 10 20 30 40 50 60 70 80
Final salesprocess
Mid-salesprocess
Initial salesprocess
Pre-salesprocess
Final salesprocess
Mid-salesprocess
Initial salesprocess
Pre-salesprocess
White papers Case studies Podcasts Videos Brochures
63
58
41
6458
4752
65
2526
3830
23
915
1417
9
2111
2
4542
3647
56
3339
3430
27
1614
2319
12
65
74
5
25
26
35
20
4
Infl
uen
cers
Deci
sio
n M
akers
Figure 37 In which phase of the purchasing cycle did you FIRST consume each type of collateral (influencers vs decision makers)
29
Likewise respondents from small businesses consume collateral for the first time during the pre-sales stage at much higher rates than respondents from middle-market or large companies For example 70 percent of small businesses consume white papers for the first time during this stage compared to just 40 percent of middle-market firms and 56 percent of large enterprises (Figure 38)
Small Business Mid-market Enterprise
0
10
20
30
40
50
60
70
80
Final sales processMid-sales processInitial Sales ProcessPre-sales Process
70
40
56
16
38
29
9
17
12
5 53
Figure 38 In which phase of the purchasing cycle did you FIRST consume white papers in 2010
As in previous years we find the data around use of collateral in the sales cycle interesting in the way it potentially sheds light on the relationship between influencers and decion makers We believe we are seeing the influencerrsquos role in terms of considering potential technology purchases and the subsequent sharing of that collatera and other information with decision makers a bit later in the cycle
30
BEST PRACTICES FOR THE REAL WORLD
As in previous years we conclude our delivery of the survey results by providing what we consider to be actionable advice that marketing professionals can apply right now to improve the quality and impact of their communications assets
1 Create white papers This is a repeating theme but one that is definitely worth saying once again white papers are frequently consumed and considered highly influential over the technology purchase Take advantage by creating a few well-written papers that clearly outline strategic advancements your solutions and products are aligned with Leverage your work by chunking up the main points into best practice documents blog posts ldquohow tordquo guides and other materials to support your broader campaign needs
2 Embed multimedia files Start with short video or audio clips to keep overall file sizes low but jump on this trend Once you get your feet under you you can advance to interactive charts and graphs Flash elements and other media types Donrsquot ignore the opportunity to be among the first to take advantage of this evolving practice
3 Consider all content to be social content We know that tech purchasers share content and that they consider materials forwarded from a personal contact to be very influential Plan all content and collateral assets from the perspective of stimulating discussion and sharing Think about interactivity links to discussion boards and user groups and point to blog posts and other communications channels in all materials
4 Deliver all content assets digitally and be prepared to have end users print them While the majority of respondents view collateral assets on the desktop a respectable number still enjoy printing out the materials they download and will further share print materials with others Avoid cross-page spreads and column designs that are hard to read digitally and remember to provide clear URLs for any links away from the materials for those reading print versions
5 Merchandise content on the Web Your company Web site is the most frequent location for obtaining content and it ranks second only to personal contacts in terms of influence Make the most of this channel by merchandising featured content and assets on landing pages and microsites that extend the thought leadership and discussion begun in your collateral Remember potential purchasers interact with your content before they interact with you so ensure viewers can easily see all the other channels through which they can engage with you all in one fun-filled information portal
31
CONCLUSIONAs we wrap up this yearrsquos annual survey report we find ourselves coming back to some basic advice that has been a theme of this section in each previous report plan
Eccolo believes that the requirement of content strategymdashidentifying communication topics and thoughtfully planning the assets required to achieve goalsmdashis relevant at every level of the marketing organization The proliferation of online channels and ever more sophisticated lead generation systems require a steady stream of fresh relevant content to successfully engage purchasers Itrsquos very easy to be distracted by looming deadlines and shifting priorities but creating a content strategy and identifying a clear development roadmap that describes topic format and channel is essential if you truly want to improve results
And the opportunity to improve results is significant Well-planned development cycles can shorten time to market reduce costs and ensure a consistent message across all external assets Further organizations that show a healthy respect for content planning and development from the top down will experience the entire enterprise shifting to a more responsive stance These companies are tuned toward deeper customer conversations that align with the end userrsquos preferences for sales and marketing information and by the very style of their collateral assets signal a positive experience for the potential buyer
Engage With UsEccolo Media welcomes your feedback on this report Email us at infoeccolomediacom with specific feedback or visit our blog at httpeccolomediatypepadcom to join in our ongoing discussion of best practices in content strategy
ACKNOWLEDGEMENTSWe would like to acknowledge the participation of the following team members for their efforts in bringing the Eccolo Media 2010 B2B Technology Collateral Survey Report to life Maite Figueroa Alice LaPlante Lorie Loe Courtney Love and Michael Sudol
32
ABOUT ECCOLO MEDIAEccolo Media specializes in strategic marketing insight and content development for some of the worldrsquos best-known technology companies An agency of exceptional writers Eccolo combines deep experience with ongoing research to identify and apply best practices for producing remarkable content The agency helps align clientsrsquo marketing needs with their key business goals by bringing a proactive innovative approach to the planning and execution of collateral in both traditional and new media channels Founded in 2007 Eccolo Media is headquartered in San Francisco California and fulfills a wide range of project needs throughout the Americas and EMEA Visit our Web site at wwweccolomediacom
ABOUT EMEDIA - Our Marketing Sponsoremedia has specialized in generating B2B sales leads and building demand since 1999 We reach more than 35 million decision makers across over 80 niche-oriented audiences within the following B2B areasInformation Technology ElectronicsSupply ChainLogistics Occupational HealthCorporate Finance Environmental ManagementHuman Resources Project ManagementMarketingSales PackagingConvertingB2B Events Construction amp ArchitectsManufacturing Professional DevelopmentSmall Business Design EngineersProcurement Control EngineersHospitality Management PrintingHealthcare Tech
emediarsquos expertise and personal service permit effective implementation of Guaranteed Cost-per-Lead programs for our clientsrsquo offers and collateral Or we can drive highly targeted traffic to clientsrsquo web pages
Contact emedia at 800-782-6167 630-288-8480 or inquiriesemediausacom
ACCELERATED B2B LEAD GENERATION mdash ON DEMAND
wwwemediausacom

6
mobile device Topics vary but can include product overviews discussions by or interviews with subject matter experts or customer testimonials
bull Video This increasingly important form of collateral is being used for a broad range of marketing communications from customer success stories to product demonstrations to analyst or internal expert interviews
bull Product brochuresdata sheets These documents contain specific productservice or company information
In previous years survey questions were designed to determine respondent preferences for each collateral type What collateral did they find to be most influential Through what channel did they receive the collateral and did this affect the perceived influence of the collateral When in the purchasing cycle did they tend to view specific collateral types
These questions and more were then analyzed for useful data points
Presentation of Data and DiscussionFor our 2010 Survey Report we chose to organize our key findings into the following sections
bull The perceived influence of each type of collateral on the purchasing decision
bull What our respondents think makes ldquogoodrdquo (ie influential) content and collateral
bull The emerging practice of embedding audio and video files within written collateral and the perceived influence of this practice
bull The manner in which respondents received collateral (ie the channel)
bull How collateral is used in the sales cycle
As in previous years we used the results of our analysis to create a series of best practices that marketers can apply to optimize their content development processes and maximize the impact of their collateral assets Yoursquoll find this in the last section of our report
Respondents from larger companies are much more likely to consume contentWe found a marked difference in content consumption across all collateral types when looking at the size of the organization Both decision makers and influencers from both middle-market and enterprise companies were more likely to consume collateral than those from small companies
7
KEY FINDINGS
The Sphere of InfluenceOver the past three years we have probed to discover what types of collateral respondents consume and the degree to which each collateral type influences their purchasing decisions
As in previous years we found that both decision makers and influencers consume a wide range of collateral types when making technology purchases from product brochures to videos to podcasts case studies and white papers (Figure 5)
As we found in every past survey the most frequently consumed types of collateral are product brochures amp data sheets In fact respondents have only increased their use of this type of content over the years from 70 percent in 2008 to 78 percent in 2009 to this yearrsquos finding of 83 percent Case studies and white papers after making significant leaps in consumption rates between 2008 and 2009 remained relatively flat between 2009 and 2010 The biggest changes were in the frequency in which respondents consumed videos and podcasts amp audio files In 2008 only 28 percent of respondents had consumed these types of collateral In 2009 podcasts made a moderate gain up to 32 percent Video consumption increased more generously from 28 percent in 2008 to 51 percent in 2009
This year that trend continued Consumption of audio content increased 8 percentage points to 40 percent Video collateral consumption increased 8 points to 59 percentmdashthe same consumption levels that case studies were at in 2008
White Papers Remain Most InfluentialAlthough the number of respondents who had read a white paper in the past six months to evaluate a purchasing decision remained flat over the past 12 months (77 percent in 2009 and 76 percent in 2010) the vast majority of respondents
0 20 40 60 80 100
White papers
Case studiessuccess stories
Podcastsaudio files
Videos
Product brochuresdata sheets
83
59
40
67
76
Figure 5 Which of the following collateral types have you consumed in the last six months to evaluate a technology purchase
8
(83 percent) felt that white papers were moderately to extremely influential in helping them make their final purchase decisions Only one percent thought that white papers werenrsquot influential at all and 41 percent thought they were very to extremely influential (Figure 6)
In 2009 we identified a significant gap (22 percent) between decision makers and influencers in how influential they found white papersmdashwith 51 percent of decision makers finding white papers ldquovery to extremely influentialrdquo compared to just 29 percent of influencers who agreed with that statement That gap narrowed in 2010 and we now see a 13 percent difference between the two groups (Figure 7)
Organizational size also seems to make a considerable difference in how respondents view white papers Both decision makers and influencers from enterprise and mid-market companies are more likely to consume a white paper than their small business counterparts as seen in Figure 8
Figure 6 How influential are white papers in your purchasing decisions in 2010
0
10
20
30
40
50
Not influentialat all
Somewhatinfluential
Moderatelyinfluential
Veryinfluential
Extremelyinfluential
12
29
42
16
1
Figure 7 How influential are white papers in your purchasing decision (influencers versus decision makers)
0
10
20
30
40
50
Not influentialat all
Somewhatinfluential
Moderatelyinfluential
Very to extremelyinfluential
34
47 48
38
1714
1 1
Influencer Decision maker
9
Finally we asked respondents to rank all collateral types from most influential to least influential (Figure 9 on page 9) As in our previous surveys white papers were most frequently given as the most influential collateral type Statistically there was no difference between decision makers and influencers in this regard These findings continue to reinforce our position that the high usage rate of white papers coupled with their high perceived influence make them a very valuable asset in the marketing communications toolkit
0
20
40
60
80
100
EnterpriseMid-marketSmall business
Influencers Decision makers
7074
82
62
9085
Figure 8 Have you read any white papers in the past six months to evaluate a technology purchase
0
10
20
30
40
50
60
White papers Case studies Podcasts Videos Brochures
5Least influential
4321Most influential
Figure 11 Please rank the following collateral in order of influence in making purchasing decisions with 1 being most influential and 5 being least influential
39
18
5
10
2827
34
7
16 1617
27
1816
22
7
13
26
38
44
16
108
2018
Figure 9 Please rank the following collateral in order of influence in making purchasing decisions with 1 being most influential and 5 being least influential
10
When White Papers DisappointWhile other types of collateral such as case studies and brochures are fairly standard from company to company white papers can vary widely in terms of their format content and organization To better understand what makes for a ldquogoodrdquo white papermdashwhat increases influencemdashwe asked the 2010 respondents the reverse question what would most disappoint them when reading a white paper What would decrease its influence1
Poorly written content was most frequently ranked as the number one reason for respondents expressing disappointment in a white paper as seen in Figure 10 However other results surprised us For example contrary to what Eccolo has long believed white papers that donrsquot possess best practice recommendations do not disappoint implying that key take-aways or next steps are not particularly persuasive Neither do white papers that are too technical Instead white papers that donrsquot contain enough technical information are more likely to disappoint than those that possess too much
Case Studies Remain Valuable Collateral The frequency with which case studies were used to make technology purchases in 2010 remained statistically unchanged from 2009 (67 percent) When asked how influential they felt case studies were in making purchasing decisions (Figure 11) the answers were again statistically similar to 2009 79 percent of respondents in the 2010 survey felt that case studies were moderately to extremely influential Nineteen percent found them somewhat influential and only two percent found them not to be influential at all As in 2009 when compared to the influence of other collateral types 2010 respondents ranked them as the second-most influential after white papers (see Figure 9 on page 9)
Figure 10 When reading white papers what is most likely to disappoint you
Poorly written
Not technical enough
No real-life cases
Too much productvendor info
Poorly designed
No new industry developments
Not enough productvendor info
No best practicesguidelines
Too technical
MOST DISAPPOINTING
LEAST DISAPPOINTING
1 In previous surveys we attempted to answer this question by plainly asking respondents what increased the influence of white papers The resulting data sets however were flat with no real critical element for positive influence standing out Hence our decision to pose the question from the negative
11
As in 2009 we asked respondents if case study content would be more or less influential if offered in a different formatmdashfor example if delivered in non-written forms such as audio or video
There was virtually no change in the response to this query between 2009 and 2010 Written case studies were still most frequently tapped as the most influential of all case study formats (Figure 12)
When we compared the attitudes of decision makers and influencers toward case study format however we did find a statistically significant change in the 2010 survey results In the 2009 survey influencers were much more likely to find written case studies the most influential (76 percent) than decision makers (59 percent) In 2010 the difference in attitudes was just a single percentage point 65 percent of influencers found written case studies to be the most influential form of customer testimonial compared to 64 percent of decision makers who indicated the same thing The gap also closed in respondentsrsquo attitudes toward video testimonials In 2009 40 percent of decision makers specified video as the most influential format for customer testimonials compared to 23 percent of influencers In 2010 this gap narrowed to just three percentage points (35 percent and 33 percent respectively) (Figure 13)
65 33
2
Video testimonial
Audio testimonial
Written case study
Figure 16 In which format would youfind a customer testimonial
to be most influential
Figure 12 In which format would you find a customer testimonial to be most influential
0
5
10
15
20
25
30
35
40
Not influentialat all
Somewhatinfluential
Moderatelyinfluential
Veryinfluential
Extremelyinfluential
10
29
40
19
2
Figure 12 How influential are case studies in your purchasing decisionsFigure 11 How influential are case studies in your purchasing decisions
12
Podcasts More Frequently Consumed But Less Influential Podcasts continued to play a role in the technology purchasing cycle in 2010 The percentage of survey respondents who listened to a podcast in the past six months rose to 36 percent up from from 32 percent in 2009 (Figure 5) However the percentage of respondents who found them to be moderately to extremely influential dropped to 78 percent (see Figure 14) compared to 82 percent in 2009 As in 2009 podcasts are ranked the fifth-most influential type of collateral when compared to other surveyed collateral types (see Figure 9 on page 9)
One interesting change identified in this yearrsquos results in 2009 decision makers found podcasts more influential than influencers didmdashwith 87 percent finding them moderately to extremely influential compared to just 73 percent of influencers In 2010 these results flipped with 81 percent of influencers finding podcasts moderately to extremely influential compared to 76 percent of decision makers (Figure 15) Decision makers were still more likely to find podcasts very or extremely influential however
0
5
10
15
20
25
30
35
Not influentialat all
Somewhatinfluential
Moderatelyinfluential
Veryinfluential
Extremelyinfluential
12
3234
21
1
Figure 14 How influential were podcastsaudio files in making a final purchasing decision
0
10
20
30
40
50
60
70
Audio testimonialVideo testimonialWrtitten case study
64
33
65
35
30
Influencers Decision makers
Figure 13 In which format would you find a customer testimonial to be most influential (decision maker versus influencer)
13
In those cases when respondents indicated they had listened to a podcast we asked what type of podcast it had been By far the most common type of podcast consumed was one covering technology trends (78 percent) followed by business trends (55 percent) Forty-five percent listened to information on vendor products andor solutions with the smallest but still significant percentage (39 percent) listening to customer testimonials in that format (Figure 16)
Video Continued Growth in Consumption Our 2010 survey respondents indicated that their use of video when considering technology purchase continues to increase The percentage of respondents who watched a video in the past six months increased eight points to 59 percent This result continues a trend seen in the 2009 survey results when use of video increased from 28 percent in 2008 to 49 percent in 2009 (Figure 17)
Figure 16 What types of podcastaudio files have you listened to in order to evaluate a technology purchase Check all that apply
0
20
40
60
80
OtherInformationon vendor
productssolutions
Businesstrends
Technologytrends
Customertestimonial
1
39
78
55
45
0
10
20
30
40
50
Not influentialat all
Somewhatinfluential
Moderatelyinfluential
Veryinfluential
Extremelyinfluential
28
15
7
35
46
26
17
24
02
Influencers Decision makers
Figure 15 How influential were podcastsaudio files in making a final purchasing decision
14
In 2008 video was ranked fifth in influence when compared to other types of collateral In 2009 it moved into fourth place surpassing podcasts in influence In 2010 it held on to that position (Figure 9 on page 9) When asked how influential the video was on a technology purchase 26 percent of respondents indicated they found videos to be moderately to extremely influential (Figure 18)
We further inquired as to the type of video respondents consumed during a technology purchase Respondents watched more product tutorialsdemos by a wide margin over other types of video collateral (76 percent) Vendor marketing videos were the next most commonly viewed type of video (61 percent) followed by customer testimonials (37 percent) and on-demand webinars (33 percent) as seen in Figure 19
Figure 18 How influential were the videos in making a final purchasing decision
0
10
20
30
40
Not influentialat all
Somewhatinfluential
Moderatelyinfluential
Veryinfluential
Extremelyinfluential
9
39
31
19
2
Figure 17 Have you viewed any videos in the past six months to evaluate a technology purchase
0
20
40
60
80
NoYes
201020092008
28
49 50
72
51 50
15
Brochures and Data Sheets Consumed Most Frequently In 2009 brochures and data sheets were the most frequently consumed of all collateralmdashwith 78 percent of respondents using them to make a purchasing decision over the past six months In 2010 83 percent of respondents consumed these types of collateral But although 79 percent of respondents rated them as moderately to extremely influential when making a technology purchase (Figure 20) they still tend to rank behind white papers and case studies when compared with other collateral types (see Figure 9 on page 9)
As with many other types of collateral large enterprises were more likely to consume brochures than small companies (less than 100 employees) with mid-sized companies falling in between
This year we continue to recommend that brochures and data sheets be a part of every marketerrsquos collateral toolbox precisely because they are so frequently
Figure 20 How influential were brochuresdata sheets in making a final purchasing decision
0
10
20
30
40
50
Not influentialat all
Somewhatinfluential
Moderatelyinfluential
Veryinfluential
Extremelyinfluential
8
31
40
18
3
0
10
20
30
40
50
60
70
80
OtherProducttutorials demos
On-demandwebinars
Vendormarketing
videos
Customertestimonials
37
61
2
76
33
Figure 19 What types of video files have you listened to in order to evaluate a technology purchase
16
consumed We also reiterate our advice that it might not be strategically wise to rely solely on this type of collateral given that their perceived influence is lower than some other collateral types Rather brochures and data sheets should be ldquomust-haverdquo assets in a well-rounded collateral portfolio that includes a broad variety of other content types
How Technology Purchasers Consume ContentAs in previous years we devoted significant time to analyzing how technology purchasers consume and use collateral In this section we share our results plus our insight into what respondents believe makes ldquogoodrdquo collateral
Most Collateral Still Consumed Digitally One surprise in this yearrsquos survey results was that although respondents still have an overwhelming preference for consuming written content on the desktop rather than printing it out that number actually declined across all types of written collateral (Figure 21) For example in 2009 a full three-fourths (76 percent) of respondents read white papers digitally a similar percentage (77 percent) did the same with brochuresdata sheets and even more (84 percent) consumed case studies in this form Yet in 2010 these numbers declined The percentage that read white papers digitally dropped 15 full percentage points to 61 percent The percent of respondents who indicated that they preferred to consume brochuressdata sheets in digital form declined only slightly but just 71 percent of respondents said they preferred to consume case studies in digital formmdash10 percentage points less than in 2009
We also found significant changes in whether respondents downloaded audio files onto their desktops or mobile devices or listened to audio streams from Web sites In 2009 62 percent preferred to download audio files onto their desktop or mobile devices versus 38 percent that preferred to stream directly from a Web site Yet in
Figure 21 Did you view this collateral online or did you downloadprint before reading (2009 vs 2010)
0
20
40
60
80
100
Brochuresdata sheetsCase studiessuccess storiesWhite paper
Downloaded printed 2010
Downloaded printed 2009
Viewedonline 2010
Viewedonline 2009
76
61
24
39
84
74
16
26
77
71
23
29
17
2010 these numbers shifted substantially toward a preference for streaming this year 57 percent of respondents preferred streaming versus 43 percent that favored downloading these types of files
This brings the method of consumption of audio files more in line with respondentsrsquo preferences for streaming video Sixty-four percent of 2010 respondents preferred to watch video streamed live from the source versus 36 percent that preferred to download it to a desktop or mobile device (Figure 22)
However whether streamed or downloaded 92 percent of podcast listeners and 96 percent of video viewers still consumed content on the desktop This is a critical finding that has remained consistent from year to year given that the desktop is the platform of choice for consuming all types of content marketers should ensure that all written content leverages links to other files and other communication channels as much as possible giving technology purchasers the option of drilling down to more details as desired
All Collateral Has Viral PotentialWe continue to be interested in the fact that all collateral is highly viral Technology purchasers routinely share collateral with the vast majority of 2010 respondents (89 percent) sharing the white papers they read with others as seen in Figure 23 Nearly as many (87 percent) share case studies followed by podcasts (84 percent) and then brochuresdata sheets and video (80 percent each)
White papers are still the most viral with 34 percent of respondents sharing them with three or more people Thirty-two percent of respondents shared podcasts with three or more people and 28 percent shared case studies with as many Lagging slightly behind were video (25 percent) and brochuresdata sheets (23 percent)
0
20
40
60
80
Downloaded tomobile device
then listented toviewed
Downloaded todesktop
then listened
Streamed fromlive source
5764
35 32
84
Podcasts Videos
Figure 22 Did you consume this content online or did you download before viewinglistening
18
Another interesting development although all collateral is shared primarily in digital form more 2010 respondents say that they share written collateralmdashwhite papers case studies and brochuresdata sheetsmdashin both digital and printed forms (Figure 24) than did respondents to the 2009 survey For example whereas the percentage of respondents who shared digitalelectronic versions of white papers actually declined in the past yearmdashfrom 60 percent to 51 percentmdashthe percentage of respondents who shared white papers in both digital and printed form increased from 30 percent to 37 percent We therefore caution marketers not to discount the viral nature of hard copy content as it clearly still is considered useful by a significant percentage of respondents
In 2009 influencers were more likely to share only digital copy and decision makers were more likely to share both printed and digital content However in 2010 this is no longer the case and these two respondent types are now in parity on this issue
0
5
10
15
20
25
30
35
White papers Case studies Podcasts Videos Brochures
5 or more
43210
11
13
16
20 20
23
28
25 25
30
33
31
27
30
19
14
17
12
6 6
9
7
5
8 8
6 6 6
12
27
Figure 23 On average how many other decision makers or influencers in your organization did you share each piece of collateral with
19
Preferences For Length Are ChangingEccolo Media has established best practices for serving up marketing collateral in small well-written packages Our survey results over the past three years have reinforced our belief that this serves marketers best However this year we observed subtleties in the survey results that indicated respondents may be adjusting their preferences for longer collateral length
White papersWersquove stated repeatedly that white papers are a highly influential collateral consumed at a high frequency by both decision makers and influencers But marketing communications professionals continue to debate the ideal length of a white paper how do they give the right amount of informationmdashnot too much and not too little As Figure 25 shows the majority of respondents (55 percent) felt six pages or less to be the ideal number However this percentage is 10 points less than last yearrsquos 65 percent
Figure 25 What do you feel is the ideal length for a white paper in number of pages
0
10
20
30
40
50
More than10 pages
10 pages8 pages6 pages4 pages
21
34
27
13
5
Figure 24 In what format did you share collateral
0
10
20
30
40
50
60
70
BrochuresCasestudies
Whitepapers
51
37
52
12
35
12
49
19
32
Digitalelectronic version Hard copy Both
20
Simultaneously the percentage of respondents who preferred white papers of just four pages dropped from 24 percent down to 21 percent and the percentage of respondents who leaned toward eight pages increased from 21 percent to 27 percent This indicates that the ldquoideal lengthrdquo is shifting toward longer rather than shorter white papers
There were no general differences in length preferences between decision makers and influencers but technology purchasers from small companies tend to prefer shorter white papers with 31 percent preferring four pages or less compared to 19 percent of enterprise and 18 percent of mid-market companies that said the same
Case StudiesIn 2008 most respondents reported the ideal length of a case study to be two pages or approximately 800 to 1000 words Yet in 2009 we received different responses That year the largest proportion of respondents (39 percent) indicated that four is the ideal number of pages for a written case study This yearrsquos 2010 survey backed up last yearrsquos numbers with 37 percent preferring four pages and virtually identical percentages of respondents preferring two pages or less (35 percent) or six pages or more (28 percent) as seen in Figure 26
In general the larger the company the longer they prefer their case studies to be with the largest percentage of respondents from small companies (33 percent) preferring two-page case studies the largest percentage from middle-market firms (40 percent) and large enterprises (39 percent) preferring four-page case studies
Figure 26 What do you feel is the ideal number of pages for a case studysuccess story
0
10
20
30
40
50
More than6 pages
6 pages4 pages2 pages1 page
8
27
37
19
9
21
Podcasts The ideal length of a podcast decreased in 2010 Figure 27 shows that the greatest number of respondents (36 percent) selected five to seven minutes as the ideal length Most respondents (81 percent) prefer podcasts that are 10 minutes or less in length and in general the smaller the company the shorter they prefer their podcasts to be
Video The majority of 2010 respondents (38 percent) indicated that the ideal length of video content is five to seven minutes while 24 percent preferred videos of eight to 10 minutes (Figure 28) These results indicate a slight trending to shorter videos over the 2009 respondentrsquos preferences for length where 31 percent preferred five to seven minutes and 28 percent preferred eight to 10 minutes
Figure 28 What do you feel is the ideal length of a video in number of minutes
0
10
20
30
40
More than15 minutes
11 to 15minutes
8 to 10minutes
5 to 7minutes
2 to 4minutes
Less than2 minutes
6 5
19
38
24
8
Figure 27 What do you feel is the ideal length of a podcastaudio file in number of minutes
0
10
20
30
40
More than15 minutes
11 to 15minutes
8 to 10minutes
5 to 7minutes
2 to 4minutes
Less than2 minutes
4
15
36
26
13
6
22
The Emergence of Embedded Audio and Video in Written Collateral Over the past 12 months Eccolo has participated in an emerging trend in marketing collateral embedding audio and video files into digital versions of written documents such as white papers and case studies We therefore asked respondents if they had consumed any written collateral that contained embedded audio andor video files A significant proportion of themmdash45 percentmdashsaid they had done so
Respondents were most likely to encounter embedded files in case studies (66 percent) followed by white papers (55 percent) and brochures (48 percent) (Figure 29)
Perhaps the most dramatic of our findings in this part of the survey was the overwhelming percentage of respondents who clicked through to these embedded files 93 percent Twenty-five percent clicked through to video files six percent clicked through to audio files and 62 percent clicked through to both audio and video (Figure 30)
And most importantly when respondents were asked whether the inclusion of audio or video files positively or negatively affected the overall influence of the written collateral 80 percent indicated that they viewed it either ldquovery positivelyrdquo or ldquopositivelyrdquo (Figure 31)
0
10
20
30
40
50
60
70
80
OtherBrochuresCase studiesWhite paper
55
66
48
1
Figure 29 Which types of written collateral have you consumed that included embedded audio or video
23
In particular decision makers felt this trend was positive 83 percent ranked it as very positively or positively affecting the overall influence of the written collateral compared to 74 percent of influencers (Figure 32)
The size of company also mattered when it came to the perceived influence of embedded files with enterprises more likely to indicate that it was very positive (26 percent) compared to middle-market (14 percent) or small firms (15 percent) On a related note small businesses were more likely to say that embedded files had no influence at allmdash33 percent versus 15 percent of middle-market and 15 percent of enterprise firms (Figure 33)
0
10
20
30
40
50
60
70
80
NeitherBoth audiovideoAudio onlyVideo only
25
6
62
7
Figure 30 Did you click through or open any of the video or audio files embedded in the collateral
0
10
20
30
40
50
60
70
Very negativelyNegativelyNo influencePositivelyVery positively
18
62
18
1 1
Figure 31 How did the inclusion of embedded audio and video files affect the overall influence of the written collateral
24
These results support Eccolorsquos belief that interactivity is becoming ldquotable stakesrdquo for written marketing communications collateral Given the preference that purchasers have already expressed for consuming collateral at their desktop (see Figure 22) marketers that donrsquot experiment with embedded ausio video and other multimedia formats as well as links off to other communications and social media channels risk delivering assets that seem obsolete and old-fashioned
Figure 32 How did the inclusion of embedded audio and video files affect the overall influence of the written collateral
(decision makers versus influencers)
0
20
40
60
80
Very NegativelyNegativelyNo InfluencePositivelyVery Positively
24
59
66
15
26
1 0 018
Decision maker Influencer
0
10
20
30
40
50
60
70
80
Very negativelyNegativelyNo influencePositivelyVery positively
15 14
26
52
69
59
33
15 15
0 1 0 0 1 0
Small business Mid-market Enterprise
Figure 33 How did the inclusion of embedded audio and video files affect the overall influence of the written collateral
(small business vs mid-market vs enterprise)
25
The Channel EffectLast year we added a section to our annual survey that investigated how channel affects the perceived influence of collateral We defined channel as the specific avenue through which the respondent receives contentmdashwhether from a personal contact from a corporate Web site or from a sales representative for example
One fact immediately stood out in 2009 most respondents receive written collateral through the corporate Web site (Figure 34) This did not change in 2010 with 71 percent of respondents finding white papers through such sites 65 percent getting brochuresdata sheets through that channel and 56 percent acquiring case studies in that way
The next most frequently used channel for receiving a white paper in 2010 was a download from a direct response campaign (59 percent) which implies that this should be considered an important means of distribution for marketers This was followed by forwarded by a sales repcompany contact (54 percent) obtained from a personal contact (52 percent) accessed via social media (39 percent) and absorbed through webinars (34 percent) In 2009 podcasts and video collateral differed from written content when it came to how respondents ldquofoundrdquo them but that difference
0
10
20
30
40
50
60
70
80
Mentioned ina webinar
Linked to ordiscussed in
onlinesocial media
Linked in toan RSS feed
Forwarded bysales rep
company contact
BrowsingcorporateWeb site
Downloadedfrom
direct responsecampaign
Forwardedfrom
personalcontact
White papers Case studies Podcasts Videos Brochures
5253
46
34
37
59
71
5655
6665
54
4241
38
27
23
31
39
31
39
29
23
34
20
23
20
12
21
15
44
38
45
34 34
Figure 34 Through which channels have you received collateral
26
has vanished Last year podcasts were almost equally acquired from a personal contact or from a corporate Web site (48 percent and 49 percent respectively) However this year the corporate Web site trumped the personal contact channel (55 percent to 46 percent) And this was even more dramatically the case for video with only 34 percent of respondents indicating they had been forwarded a video by a personal contact while 66 percent found video on corporate Web sites This trend underscores the importance of the corporate Web site across all collateral types
When we examined the comparative influence of these various channels another interesting fact emerged although a piece of collateral referred to or forwarded by a personal contact was most frequently cited as the most influential channel for all types of collateral browsing the corporate Web site was the second most frequently cited answer (Figure 35) When you consider that the corporate Web site is clearly the most frequently used channel for collateral delivery coupled with its high perceived influence you understand why we recommend that you make investing in and frequently refreshing your Web site a priority
0
10
20
30
40
50
60
70
80
Mentioned ina webinar
Linked to ordiscussed in
onlinesocial media
Linked in toan RSS feed
Forwarded bysales rep
company contact
BrowsingcorporateWeb site
Downloadedfrom
direct responsecampaign
Forwardedfrom
personalcontact
White papers Case studies Podcasts Videos Brochures
73
79
767677
41
38
424343
6060
53
61
69
37
33
28
39
46
2220
31
1716
35
42
3836
31 31
27
33
29
19
Figure 35 Positive influence by channel
27
Marketing Collateral in the Sales CycleThe relationship between collateral and actual sales is an important one How do the various types of collateralmdashwhite papers case studies brochuresmdashimpact sales When should you deliver a white paper case study podcast or video to drive potential purchasers to the next step in the sales cycle Is there a way to time delivery of specific collateral types to nurture leads more effectively
For the purposes of this survey we defined the various stages of the technology evaluation and purchase process as
bull Pre-salemdashConsidering solutions and vendors
bull Initial salemdashReviewing vendor qualifications capabilities and RFP responses
bull Mid-salemdashReviewing details of the solution with one vendor
bull Final salemdashCustomization negotiation and procurement
In our 2008 survey results we saw that respondents most frequently consumed each collateral type for the first time in the pre-sale process by a significant margin that is before they send out RFPs or initiate discussions with specific vendors In that first Eccolo B2B survey white papers were read by 61 percent of respondents during this phase case studies by 48 percent podcasts by 53 percent video by 51 percent and brochuresdata sheets by 62 percent
0
10
20
30
40
50
60
70
Final sales processMid-sales processInitial sales processPre-sales process
White papers Case studies Podcasts Videos Brochures
53
49
41
49
31
3435
30
25
13
21
2018
11
4 3 4 3 4
60
Figure 36 In which phase of the purchasing cycle did you FIRST consume each type of collateral
28
Our 2010 survey indicates that these habits are shifting While the majority of respondents still consume most collateral for the first time in the pre-sales phase more respondents now indicate they first consumed collateral in either the initial sales or mid-sales phases than they did in 2008 For example the percentage of respondents who first consumed a white paper during the pre-sales process dropped to 53 percent the percentage that listened to a podcast dropped down to 41 percent (Figure 36) In both cases respondents appeared to move their first consumption of those types of collateral down to the next two stages of the sales process
When we further segmented the 2010 data to compare the habits of influencers to decision makers we observed some additional interesting trends across the board influencers tend to consume content earlier in the sales cycle than decision makers (Figure 37)
0 10 20 30 40 50 60 70 80
Final salesprocess
Mid-salesprocess
Initial salesprocess
Pre-salesprocess
Final salesprocess
Mid-salesprocess
Initial salesprocess
Pre-salesprocess
White papers Case studies Podcasts Videos Brochures
63
58
41
6458
4752
65
2526
3830
23
915
1417
9
2111
2
4542
3647
56
3339
3430
27
1614
2319
12
65
74
5
25
26
35
20
4
Infl
uen
cers
Deci
sio
n M
akers
Figure 37 In which phase of the purchasing cycle did you FIRST consume each type of collateral (influencers vs decision makers)
29
Likewise respondents from small businesses consume collateral for the first time during the pre-sales stage at much higher rates than respondents from middle-market or large companies For example 70 percent of small businesses consume white papers for the first time during this stage compared to just 40 percent of middle-market firms and 56 percent of large enterprises (Figure 38)
Small Business Mid-market Enterprise
0
10
20
30
40
50
60
70
80
Final sales processMid-sales processInitial Sales ProcessPre-sales Process
70
40
56
16
38
29
9
17
12
5 53
Figure 38 In which phase of the purchasing cycle did you FIRST consume white papers in 2010
As in previous years we find the data around use of collateral in the sales cycle interesting in the way it potentially sheds light on the relationship between influencers and decion makers We believe we are seeing the influencerrsquos role in terms of considering potential technology purchases and the subsequent sharing of that collatera and other information with decision makers a bit later in the cycle
30
BEST PRACTICES FOR THE REAL WORLD
As in previous years we conclude our delivery of the survey results by providing what we consider to be actionable advice that marketing professionals can apply right now to improve the quality and impact of their communications assets
1 Create white papers This is a repeating theme but one that is definitely worth saying once again white papers are frequently consumed and considered highly influential over the technology purchase Take advantage by creating a few well-written papers that clearly outline strategic advancements your solutions and products are aligned with Leverage your work by chunking up the main points into best practice documents blog posts ldquohow tordquo guides and other materials to support your broader campaign needs
2 Embed multimedia files Start with short video or audio clips to keep overall file sizes low but jump on this trend Once you get your feet under you you can advance to interactive charts and graphs Flash elements and other media types Donrsquot ignore the opportunity to be among the first to take advantage of this evolving practice
3 Consider all content to be social content We know that tech purchasers share content and that they consider materials forwarded from a personal contact to be very influential Plan all content and collateral assets from the perspective of stimulating discussion and sharing Think about interactivity links to discussion boards and user groups and point to blog posts and other communications channels in all materials
4 Deliver all content assets digitally and be prepared to have end users print them While the majority of respondents view collateral assets on the desktop a respectable number still enjoy printing out the materials they download and will further share print materials with others Avoid cross-page spreads and column designs that are hard to read digitally and remember to provide clear URLs for any links away from the materials for those reading print versions
5 Merchandise content on the Web Your company Web site is the most frequent location for obtaining content and it ranks second only to personal contacts in terms of influence Make the most of this channel by merchandising featured content and assets on landing pages and microsites that extend the thought leadership and discussion begun in your collateral Remember potential purchasers interact with your content before they interact with you so ensure viewers can easily see all the other channels through which they can engage with you all in one fun-filled information portal
31
CONCLUSIONAs we wrap up this yearrsquos annual survey report we find ourselves coming back to some basic advice that has been a theme of this section in each previous report plan
Eccolo believes that the requirement of content strategymdashidentifying communication topics and thoughtfully planning the assets required to achieve goalsmdashis relevant at every level of the marketing organization The proliferation of online channels and ever more sophisticated lead generation systems require a steady stream of fresh relevant content to successfully engage purchasers Itrsquos very easy to be distracted by looming deadlines and shifting priorities but creating a content strategy and identifying a clear development roadmap that describes topic format and channel is essential if you truly want to improve results
And the opportunity to improve results is significant Well-planned development cycles can shorten time to market reduce costs and ensure a consistent message across all external assets Further organizations that show a healthy respect for content planning and development from the top down will experience the entire enterprise shifting to a more responsive stance These companies are tuned toward deeper customer conversations that align with the end userrsquos preferences for sales and marketing information and by the very style of their collateral assets signal a positive experience for the potential buyer
Engage With UsEccolo Media welcomes your feedback on this report Email us at infoeccolomediacom with specific feedback or visit our blog at httpeccolomediatypepadcom to join in our ongoing discussion of best practices in content strategy
ACKNOWLEDGEMENTSWe would like to acknowledge the participation of the following team members for their efforts in bringing the Eccolo Media 2010 B2B Technology Collateral Survey Report to life Maite Figueroa Alice LaPlante Lorie Loe Courtney Love and Michael Sudol
32
ABOUT ECCOLO MEDIAEccolo Media specializes in strategic marketing insight and content development for some of the worldrsquos best-known technology companies An agency of exceptional writers Eccolo combines deep experience with ongoing research to identify and apply best practices for producing remarkable content The agency helps align clientsrsquo marketing needs with their key business goals by bringing a proactive innovative approach to the planning and execution of collateral in both traditional and new media channels Founded in 2007 Eccolo Media is headquartered in San Francisco California and fulfills a wide range of project needs throughout the Americas and EMEA Visit our Web site at wwweccolomediacom
ABOUT EMEDIA - Our Marketing Sponsoremedia has specialized in generating B2B sales leads and building demand since 1999 We reach more than 35 million decision makers across over 80 niche-oriented audiences within the following B2B areasInformation Technology ElectronicsSupply ChainLogistics Occupational HealthCorporate Finance Environmental ManagementHuman Resources Project ManagementMarketingSales PackagingConvertingB2B Events Construction amp ArchitectsManufacturing Professional DevelopmentSmall Business Design EngineersProcurement Control EngineersHospitality Management PrintingHealthcare Tech
emediarsquos expertise and personal service permit effective implementation of Guaranteed Cost-per-Lead programs for our clientsrsquo offers and collateral Or we can drive highly targeted traffic to clientsrsquo web pages
Contact emedia at 800-782-6167 630-288-8480 or inquiriesemediausacom
ACCELERATED B2B LEAD GENERATION mdash ON DEMAND
wwwemediausacom

7
KEY FINDINGS
The Sphere of InfluenceOver the past three years we have probed to discover what types of collateral respondents consume and the degree to which each collateral type influences their purchasing decisions
As in previous years we found that both decision makers and influencers consume a wide range of collateral types when making technology purchases from product brochures to videos to podcasts case studies and white papers (Figure 5)
As we found in every past survey the most frequently consumed types of collateral are product brochures amp data sheets In fact respondents have only increased their use of this type of content over the years from 70 percent in 2008 to 78 percent in 2009 to this yearrsquos finding of 83 percent Case studies and white papers after making significant leaps in consumption rates between 2008 and 2009 remained relatively flat between 2009 and 2010 The biggest changes were in the frequency in which respondents consumed videos and podcasts amp audio files In 2008 only 28 percent of respondents had consumed these types of collateral In 2009 podcasts made a moderate gain up to 32 percent Video consumption increased more generously from 28 percent in 2008 to 51 percent in 2009
This year that trend continued Consumption of audio content increased 8 percentage points to 40 percent Video collateral consumption increased 8 points to 59 percentmdashthe same consumption levels that case studies were at in 2008
White Papers Remain Most InfluentialAlthough the number of respondents who had read a white paper in the past six months to evaluate a purchasing decision remained flat over the past 12 months (77 percent in 2009 and 76 percent in 2010) the vast majority of respondents
0 20 40 60 80 100
White papers
Case studiessuccess stories
Podcastsaudio files
Videos
Product brochuresdata sheets
83
59
40
67
76
Figure 5 Which of the following collateral types have you consumed in the last six months to evaluate a technology purchase
8
(83 percent) felt that white papers were moderately to extremely influential in helping them make their final purchase decisions Only one percent thought that white papers werenrsquot influential at all and 41 percent thought they were very to extremely influential (Figure 6)
In 2009 we identified a significant gap (22 percent) between decision makers and influencers in how influential they found white papersmdashwith 51 percent of decision makers finding white papers ldquovery to extremely influentialrdquo compared to just 29 percent of influencers who agreed with that statement That gap narrowed in 2010 and we now see a 13 percent difference between the two groups (Figure 7)
Organizational size also seems to make a considerable difference in how respondents view white papers Both decision makers and influencers from enterprise and mid-market companies are more likely to consume a white paper than their small business counterparts as seen in Figure 8
Figure 6 How influential are white papers in your purchasing decisions in 2010
0
10
20
30
40
50
Not influentialat all
Somewhatinfluential
Moderatelyinfluential
Veryinfluential
Extremelyinfluential
12
29
42
16
1
Figure 7 How influential are white papers in your purchasing decision (influencers versus decision makers)
0
10
20
30
40
50
Not influentialat all
Somewhatinfluential
Moderatelyinfluential
Very to extremelyinfluential
34
47 48
38
1714
1 1
Influencer Decision maker
9
Finally we asked respondents to rank all collateral types from most influential to least influential (Figure 9 on page 9) As in our previous surveys white papers were most frequently given as the most influential collateral type Statistically there was no difference between decision makers and influencers in this regard These findings continue to reinforce our position that the high usage rate of white papers coupled with their high perceived influence make them a very valuable asset in the marketing communications toolkit
0
20
40
60
80
100
EnterpriseMid-marketSmall business
Influencers Decision makers
7074
82
62
9085
Figure 8 Have you read any white papers in the past six months to evaluate a technology purchase
0
10
20
30
40
50
60
White papers Case studies Podcasts Videos Brochures
5Least influential
4321Most influential
Figure 11 Please rank the following collateral in order of influence in making purchasing decisions with 1 being most influential and 5 being least influential
39
18
5
10
2827
34
7
16 1617
27
1816
22
7
13
26
38
44
16
108
2018
Figure 9 Please rank the following collateral in order of influence in making purchasing decisions with 1 being most influential and 5 being least influential
10
When White Papers DisappointWhile other types of collateral such as case studies and brochures are fairly standard from company to company white papers can vary widely in terms of their format content and organization To better understand what makes for a ldquogoodrdquo white papermdashwhat increases influencemdashwe asked the 2010 respondents the reverse question what would most disappoint them when reading a white paper What would decrease its influence1
Poorly written content was most frequently ranked as the number one reason for respondents expressing disappointment in a white paper as seen in Figure 10 However other results surprised us For example contrary to what Eccolo has long believed white papers that donrsquot possess best practice recommendations do not disappoint implying that key take-aways or next steps are not particularly persuasive Neither do white papers that are too technical Instead white papers that donrsquot contain enough technical information are more likely to disappoint than those that possess too much
Case Studies Remain Valuable Collateral The frequency with which case studies were used to make technology purchases in 2010 remained statistically unchanged from 2009 (67 percent) When asked how influential they felt case studies were in making purchasing decisions (Figure 11) the answers were again statistically similar to 2009 79 percent of respondents in the 2010 survey felt that case studies were moderately to extremely influential Nineteen percent found them somewhat influential and only two percent found them not to be influential at all As in 2009 when compared to the influence of other collateral types 2010 respondents ranked them as the second-most influential after white papers (see Figure 9 on page 9)
Figure 10 When reading white papers what is most likely to disappoint you
Poorly written
Not technical enough
No real-life cases
Too much productvendor info
Poorly designed
No new industry developments
Not enough productvendor info
No best practicesguidelines
Too technical
MOST DISAPPOINTING
LEAST DISAPPOINTING
1 In previous surveys we attempted to answer this question by plainly asking respondents what increased the influence of white papers The resulting data sets however were flat with no real critical element for positive influence standing out Hence our decision to pose the question from the negative
11
As in 2009 we asked respondents if case study content would be more or less influential if offered in a different formatmdashfor example if delivered in non-written forms such as audio or video
There was virtually no change in the response to this query between 2009 and 2010 Written case studies were still most frequently tapped as the most influential of all case study formats (Figure 12)
When we compared the attitudes of decision makers and influencers toward case study format however we did find a statistically significant change in the 2010 survey results In the 2009 survey influencers were much more likely to find written case studies the most influential (76 percent) than decision makers (59 percent) In 2010 the difference in attitudes was just a single percentage point 65 percent of influencers found written case studies to be the most influential form of customer testimonial compared to 64 percent of decision makers who indicated the same thing The gap also closed in respondentsrsquo attitudes toward video testimonials In 2009 40 percent of decision makers specified video as the most influential format for customer testimonials compared to 23 percent of influencers In 2010 this gap narrowed to just three percentage points (35 percent and 33 percent respectively) (Figure 13)
65 33
2
Video testimonial
Audio testimonial
Written case study
Figure 16 In which format would youfind a customer testimonial
to be most influential
Figure 12 In which format would you find a customer testimonial to be most influential
0
5
10
15
20
25
30
35
40
Not influentialat all
Somewhatinfluential
Moderatelyinfluential
Veryinfluential
Extremelyinfluential
10
29
40
19
2
Figure 12 How influential are case studies in your purchasing decisionsFigure 11 How influential are case studies in your purchasing decisions
12
Podcasts More Frequently Consumed But Less Influential Podcasts continued to play a role in the technology purchasing cycle in 2010 The percentage of survey respondents who listened to a podcast in the past six months rose to 36 percent up from from 32 percent in 2009 (Figure 5) However the percentage of respondents who found them to be moderately to extremely influential dropped to 78 percent (see Figure 14) compared to 82 percent in 2009 As in 2009 podcasts are ranked the fifth-most influential type of collateral when compared to other surveyed collateral types (see Figure 9 on page 9)
One interesting change identified in this yearrsquos results in 2009 decision makers found podcasts more influential than influencers didmdashwith 87 percent finding them moderately to extremely influential compared to just 73 percent of influencers In 2010 these results flipped with 81 percent of influencers finding podcasts moderately to extremely influential compared to 76 percent of decision makers (Figure 15) Decision makers were still more likely to find podcasts very or extremely influential however
0
5
10
15
20
25
30
35
Not influentialat all
Somewhatinfluential
Moderatelyinfluential
Veryinfluential
Extremelyinfluential
12
3234
21
1
Figure 14 How influential were podcastsaudio files in making a final purchasing decision
0
10
20
30
40
50
60
70
Audio testimonialVideo testimonialWrtitten case study
64
33
65
35
30
Influencers Decision makers
Figure 13 In which format would you find a customer testimonial to be most influential (decision maker versus influencer)
13
In those cases when respondents indicated they had listened to a podcast we asked what type of podcast it had been By far the most common type of podcast consumed was one covering technology trends (78 percent) followed by business trends (55 percent) Forty-five percent listened to information on vendor products andor solutions with the smallest but still significant percentage (39 percent) listening to customer testimonials in that format (Figure 16)
Video Continued Growth in Consumption Our 2010 survey respondents indicated that their use of video when considering technology purchase continues to increase The percentage of respondents who watched a video in the past six months increased eight points to 59 percent This result continues a trend seen in the 2009 survey results when use of video increased from 28 percent in 2008 to 49 percent in 2009 (Figure 17)
Figure 16 What types of podcastaudio files have you listened to in order to evaluate a technology purchase Check all that apply
0
20
40
60
80
OtherInformationon vendor
productssolutions
Businesstrends
Technologytrends
Customertestimonial
1
39
78
55
45
0
10
20
30
40
50
Not influentialat all
Somewhatinfluential
Moderatelyinfluential
Veryinfluential
Extremelyinfluential
28
15
7
35
46
26
17
24
02
Influencers Decision makers
Figure 15 How influential were podcastsaudio files in making a final purchasing decision
14
In 2008 video was ranked fifth in influence when compared to other types of collateral In 2009 it moved into fourth place surpassing podcasts in influence In 2010 it held on to that position (Figure 9 on page 9) When asked how influential the video was on a technology purchase 26 percent of respondents indicated they found videos to be moderately to extremely influential (Figure 18)
We further inquired as to the type of video respondents consumed during a technology purchase Respondents watched more product tutorialsdemos by a wide margin over other types of video collateral (76 percent) Vendor marketing videos were the next most commonly viewed type of video (61 percent) followed by customer testimonials (37 percent) and on-demand webinars (33 percent) as seen in Figure 19
Figure 18 How influential were the videos in making a final purchasing decision
0
10
20
30
40
Not influentialat all
Somewhatinfluential
Moderatelyinfluential
Veryinfluential
Extremelyinfluential
9
39
31
19
2
Figure 17 Have you viewed any videos in the past six months to evaluate a technology purchase
0
20
40
60
80
NoYes
201020092008
28
49 50
72
51 50
15
Brochures and Data Sheets Consumed Most Frequently In 2009 brochures and data sheets were the most frequently consumed of all collateralmdashwith 78 percent of respondents using them to make a purchasing decision over the past six months In 2010 83 percent of respondents consumed these types of collateral But although 79 percent of respondents rated them as moderately to extremely influential when making a technology purchase (Figure 20) they still tend to rank behind white papers and case studies when compared with other collateral types (see Figure 9 on page 9)
As with many other types of collateral large enterprises were more likely to consume brochures than small companies (less than 100 employees) with mid-sized companies falling in between
This year we continue to recommend that brochures and data sheets be a part of every marketerrsquos collateral toolbox precisely because they are so frequently
Figure 20 How influential were brochuresdata sheets in making a final purchasing decision
0
10
20
30
40
50
Not influentialat all
Somewhatinfluential
Moderatelyinfluential
Veryinfluential
Extremelyinfluential
8
31
40
18
3
0
10
20
30
40
50
60
70
80
OtherProducttutorials demos
On-demandwebinars
Vendormarketing
videos
Customertestimonials
37
61
2
76
33
Figure 19 What types of video files have you listened to in order to evaluate a technology purchase
16
consumed We also reiterate our advice that it might not be strategically wise to rely solely on this type of collateral given that their perceived influence is lower than some other collateral types Rather brochures and data sheets should be ldquomust-haverdquo assets in a well-rounded collateral portfolio that includes a broad variety of other content types
How Technology Purchasers Consume ContentAs in previous years we devoted significant time to analyzing how technology purchasers consume and use collateral In this section we share our results plus our insight into what respondents believe makes ldquogoodrdquo collateral
Most Collateral Still Consumed Digitally One surprise in this yearrsquos survey results was that although respondents still have an overwhelming preference for consuming written content on the desktop rather than printing it out that number actually declined across all types of written collateral (Figure 21) For example in 2009 a full three-fourths (76 percent) of respondents read white papers digitally a similar percentage (77 percent) did the same with brochuresdata sheets and even more (84 percent) consumed case studies in this form Yet in 2010 these numbers declined The percentage that read white papers digitally dropped 15 full percentage points to 61 percent The percent of respondents who indicated that they preferred to consume brochuressdata sheets in digital form declined only slightly but just 71 percent of respondents said they preferred to consume case studies in digital formmdash10 percentage points less than in 2009
We also found significant changes in whether respondents downloaded audio files onto their desktops or mobile devices or listened to audio streams from Web sites In 2009 62 percent preferred to download audio files onto their desktop or mobile devices versus 38 percent that preferred to stream directly from a Web site Yet in
Figure 21 Did you view this collateral online or did you downloadprint before reading (2009 vs 2010)
0
20
40
60
80
100
Brochuresdata sheetsCase studiessuccess storiesWhite paper
Downloaded printed 2010
Downloaded printed 2009
Viewedonline 2010
Viewedonline 2009
76
61
24
39
84
74
16
26
77
71
23
29
17
2010 these numbers shifted substantially toward a preference for streaming this year 57 percent of respondents preferred streaming versus 43 percent that favored downloading these types of files
This brings the method of consumption of audio files more in line with respondentsrsquo preferences for streaming video Sixty-four percent of 2010 respondents preferred to watch video streamed live from the source versus 36 percent that preferred to download it to a desktop or mobile device (Figure 22)
However whether streamed or downloaded 92 percent of podcast listeners and 96 percent of video viewers still consumed content on the desktop This is a critical finding that has remained consistent from year to year given that the desktop is the platform of choice for consuming all types of content marketers should ensure that all written content leverages links to other files and other communication channels as much as possible giving technology purchasers the option of drilling down to more details as desired
All Collateral Has Viral PotentialWe continue to be interested in the fact that all collateral is highly viral Technology purchasers routinely share collateral with the vast majority of 2010 respondents (89 percent) sharing the white papers they read with others as seen in Figure 23 Nearly as many (87 percent) share case studies followed by podcasts (84 percent) and then brochuresdata sheets and video (80 percent each)
White papers are still the most viral with 34 percent of respondents sharing them with three or more people Thirty-two percent of respondents shared podcasts with three or more people and 28 percent shared case studies with as many Lagging slightly behind were video (25 percent) and brochuresdata sheets (23 percent)
0
20
40
60
80
Downloaded tomobile device
then listented toviewed
Downloaded todesktop
then listened
Streamed fromlive source
5764
35 32
84
Podcasts Videos
Figure 22 Did you consume this content online or did you download before viewinglistening
18
Another interesting development although all collateral is shared primarily in digital form more 2010 respondents say that they share written collateralmdashwhite papers case studies and brochuresdata sheetsmdashin both digital and printed forms (Figure 24) than did respondents to the 2009 survey For example whereas the percentage of respondents who shared digitalelectronic versions of white papers actually declined in the past yearmdashfrom 60 percent to 51 percentmdashthe percentage of respondents who shared white papers in both digital and printed form increased from 30 percent to 37 percent We therefore caution marketers not to discount the viral nature of hard copy content as it clearly still is considered useful by a significant percentage of respondents
In 2009 influencers were more likely to share only digital copy and decision makers were more likely to share both printed and digital content However in 2010 this is no longer the case and these two respondent types are now in parity on this issue
0
5
10
15
20
25
30
35
White papers Case studies Podcasts Videos Brochures
5 or more
43210
11
13
16
20 20
23
28
25 25
30
33
31
27
30
19
14
17
12
6 6
9
7
5
8 8
6 6 6
12
27
Figure 23 On average how many other decision makers or influencers in your organization did you share each piece of collateral with
19
Preferences For Length Are ChangingEccolo Media has established best practices for serving up marketing collateral in small well-written packages Our survey results over the past three years have reinforced our belief that this serves marketers best However this year we observed subtleties in the survey results that indicated respondents may be adjusting their preferences for longer collateral length
White papersWersquove stated repeatedly that white papers are a highly influential collateral consumed at a high frequency by both decision makers and influencers But marketing communications professionals continue to debate the ideal length of a white paper how do they give the right amount of informationmdashnot too much and not too little As Figure 25 shows the majority of respondents (55 percent) felt six pages or less to be the ideal number However this percentage is 10 points less than last yearrsquos 65 percent
Figure 25 What do you feel is the ideal length for a white paper in number of pages
0
10
20
30
40
50
More than10 pages
10 pages8 pages6 pages4 pages
21
34
27
13
5
Figure 24 In what format did you share collateral
0
10
20
30
40
50
60
70
BrochuresCasestudies
Whitepapers
51
37
52
12
35
12
49
19
32
Digitalelectronic version Hard copy Both
20
Simultaneously the percentage of respondents who preferred white papers of just four pages dropped from 24 percent down to 21 percent and the percentage of respondents who leaned toward eight pages increased from 21 percent to 27 percent This indicates that the ldquoideal lengthrdquo is shifting toward longer rather than shorter white papers
There were no general differences in length preferences between decision makers and influencers but technology purchasers from small companies tend to prefer shorter white papers with 31 percent preferring four pages or less compared to 19 percent of enterprise and 18 percent of mid-market companies that said the same
Case StudiesIn 2008 most respondents reported the ideal length of a case study to be two pages or approximately 800 to 1000 words Yet in 2009 we received different responses That year the largest proportion of respondents (39 percent) indicated that four is the ideal number of pages for a written case study This yearrsquos 2010 survey backed up last yearrsquos numbers with 37 percent preferring four pages and virtually identical percentages of respondents preferring two pages or less (35 percent) or six pages or more (28 percent) as seen in Figure 26
In general the larger the company the longer they prefer their case studies to be with the largest percentage of respondents from small companies (33 percent) preferring two-page case studies the largest percentage from middle-market firms (40 percent) and large enterprises (39 percent) preferring four-page case studies
Figure 26 What do you feel is the ideal number of pages for a case studysuccess story
0
10
20
30
40
50
More than6 pages
6 pages4 pages2 pages1 page
8
27
37
19
9
21
Podcasts The ideal length of a podcast decreased in 2010 Figure 27 shows that the greatest number of respondents (36 percent) selected five to seven minutes as the ideal length Most respondents (81 percent) prefer podcasts that are 10 minutes or less in length and in general the smaller the company the shorter they prefer their podcasts to be
Video The majority of 2010 respondents (38 percent) indicated that the ideal length of video content is five to seven minutes while 24 percent preferred videos of eight to 10 minutes (Figure 28) These results indicate a slight trending to shorter videos over the 2009 respondentrsquos preferences for length where 31 percent preferred five to seven minutes and 28 percent preferred eight to 10 minutes
Figure 28 What do you feel is the ideal length of a video in number of minutes
0
10
20
30
40
More than15 minutes
11 to 15minutes
8 to 10minutes
5 to 7minutes
2 to 4minutes
Less than2 minutes
6 5
19
38
24
8
Figure 27 What do you feel is the ideal length of a podcastaudio file in number of minutes
0
10
20
30
40
More than15 minutes
11 to 15minutes
8 to 10minutes
5 to 7minutes
2 to 4minutes
Less than2 minutes
4
15
36
26
13
6
22
The Emergence of Embedded Audio and Video in Written Collateral Over the past 12 months Eccolo has participated in an emerging trend in marketing collateral embedding audio and video files into digital versions of written documents such as white papers and case studies We therefore asked respondents if they had consumed any written collateral that contained embedded audio andor video files A significant proportion of themmdash45 percentmdashsaid they had done so
Respondents were most likely to encounter embedded files in case studies (66 percent) followed by white papers (55 percent) and brochures (48 percent) (Figure 29)
Perhaps the most dramatic of our findings in this part of the survey was the overwhelming percentage of respondents who clicked through to these embedded files 93 percent Twenty-five percent clicked through to video files six percent clicked through to audio files and 62 percent clicked through to both audio and video (Figure 30)
And most importantly when respondents were asked whether the inclusion of audio or video files positively or negatively affected the overall influence of the written collateral 80 percent indicated that they viewed it either ldquovery positivelyrdquo or ldquopositivelyrdquo (Figure 31)
0
10
20
30
40
50
60
70
80
OtherBrochuresCase studiesWhite paper
55
66
48
1
Figure 29 Which types of written collateral have you consumed that included embedded audio or video
23
In particular decision makers felt this trend was positive 83 percent ranked it as very positively or positively affecting the overall influence of the written collateral compared to 74 percent of influencers (Figure 32)
The size of company also mattered when it came to the perceived influence of embedded files with enterprises more likely to indicate that it was very positive (26 percent) compared to middle-market (14 percent) or small firms (15 percent) On a related note small businesses were more likely to say that embedded files had no influence at allmdash33 percent versus 15 percent of middle-market and 15 percent of enterprise firms (Figure 33)
0
10
20
30
40
50
60
70
80
NeitherBoth audiovideoAudio onlyVideo only
25
6
62
7
Figure 30 Did you click through or open any of the video or audio files embedded in the collateral
0
10
20
30
40
50
60
70
Very negativelyNegativelyNo influencePositivelyVery positively
18
62
18
1 1
Figure 31 How did the inclusion of embedded audio and video files affect the overall influence of the written collateral
24
These results support Eccolorsquos belief that interactivity is becoming ldquotable stakesrdquo for written marketing communications collateral Given the preference that purchasers have already expressed for consuming collateral at their desktop (see Figure 22) marketers that donrsquot experiment with embedded ausio video and other multimedia formats as well as links off to other communications and social media channels risk delivering assets that seem obsolete and old-fashioned
Figure 32 How did the inclusion of embedded audio and video files affect the overall influence of the written collateral
(decision makers versus influencers)
0
20
40
60
80
Very NegativelyNegativelyNo InfluencePositivelyVery Positively
24
59
66
15
26
1 0 018
Decision maker Influencer
0
10
20
30
40
50
60
70
80
Very negativelyNegativelyNo influencePositivelyVery positively
15 14
26
52
69
59
33
15 15
0 1 0 0 1 0
Small business Mid-market Enterprise
Figure 33 How did the inclusion of embedded audio and video files affect the overall influence of the written collateral
(small business vs mid-market vs enterprise)
25
The Channel EffectLast year we added a section to our annual survey that investigated how channel affects the perceived influence of collateral We defined channel as the specific avenue through which the respondent receives contentmdashwhether from a personal contact from a corporate Web site or from a sales representative for example
One fact immediately stood out in 2009 most respondents receive written collateral through the corporate Web site (Figure 34) This did not change in 2010 with 71 percent of respondents finding white papers through such sites 65 percent getting brochuresdata sheets through that channel and 56 percent acquiring case studies in that way
The next most frequently used channel for receiving a white paper in 2010 was a download from a direct response campaign (59 percent) which implies that this should be considered an important means of distribution for marketers This was followed by forwarded by a sales repcompany contact (54 percent) obtained from a personal contact (52 percent) accessed via social media (39 percent) and absorbed through webinars (34 percent) In 2009 podcasts and video collateral differed from written content when it came to how respondents ldquofoundrdquo them but that difference
0
10
20
30
40
50
60
70
80
Mentioned ina webinar
Linked to ordiscussed in
onlinesocial media
Linked in toan RSS feed
Forwarded bysales rep
company contact
BrowsingcorporateWeb site
Downloadedfrom
direct responsecampaign
Forwardedfrom
personalcontact
White papers Case studies Podcasts Videos Brochures
5253
46
34
37
59
71
5655
6665
54
4241
38
27
23
31
39
31
39
29
23
34
20
23
20
12
21
15
44
38
45
34 34
Figure 34 Through which channels have you received collateral
26
has vanished Last year podcasts were almost equally acquired from a personal contact or from a corporate Web site (48 percent and 49 percent respectively) However this year the corporate Web site trumped the personal contact channel (55 percent to 46 percent) And this was even more dramatically the case for video with only 34 percent of respondents indicating they had been forwarded a video by a personal contact while 66 percent found video on corporate Web sites This trend underscores the importance of the corporate Web site across all collateral types
When we examined the comparative influence of these various channels another interesting fact emerged although a piece of collateral referred to or forwarded by a personal contact was most frequently cited as the most influential channel for all types of collateral browsing the corporate Web site was the second most frequently cited answer (Figure 35) When you consider that the corporate Web site is clearly the most frequently used channel for collateral delivery coupled with its high perceived influence you understand why we recommend that you make investing in and frequently refreshing your Web site a priority
0
10
20
30
40
50
60
70
80
Mentioned ina webinar
Linked to ordiscussed in
onlinesocial media
Linked in toan RSS feed
Forwarded bysales rep
company contact
BrowsingcorporateWeb site
Downloadedfrom
direct responsecampaign
Forwardedfrom
personalcontact
White papers Case studies Podcasts Videos Brochures
73
79
767677
41
38
424343
6060
53
61
69
37
33
28
39
46
2220
31
1716
35
42
3836
31 31
27
33
29
19
Figure 35 Positive influence by channel
27
Marketing Collateral in the Sales CycleThe relationship between collateral and actual sales is an important one How do the various types of collateralmdashwhite papers case studies brochuresmdashimpact sales When should you deliver a white paper case study podcast or video to drive potential purchasers to the next step in the sales cycle Is there a way to time delivery of specific collateral types to nurture leads more effectively
For the purposes of this survey we defined the various stages of the technology evaluation and purchase process as
bull Pre-salemdashConsidering solutions and vendors
bull Initial salemdashReviewing vendor qualifications capabilities and RFP responses
bull Mid-salemdashReviewing details of the solution with one vendor
bull Final salemdashCustomization negotiation and procurement
In our 2008 survey results we saw that respondents most frequently consumed each collateral type for the first time in the pre-sale process by a significant margin that is before they send out RFPs or initiate discussions with specific vendors In that first Eccolo B2B survey white papers were read by 61 percent of respondents during this phase case studies by 48 percent podcasts by 53 percent video by 51 percent and brochuresdata sheets by 62 percent
0
10
20
30
40
50
60
70
Final sales processMid-sales processInitial sales processPre-sales process
White papers Case studies Podcasts Videos Brochures
53
49
41
49
31
3435
30
25
13
21
2018
11
4 3 4 3 4
60
Figure 36 In which phase of the purchasing cycle did you FIRST consume each type of collateral
28
Our 2010 survey indicates that these habits are shifting While the majority of respondents still consume most collateral for the first time in the pre-sales phase more respondents now indicate they first consumed collateral in either the initial sales or mid-sales phases than they did in 2008 For example the percentage of respondents who first consumed a white paper during the pre-sales process dropped to 53 percent the percentage that listened to a podcast dropped down to 41 percent (Figure 36) In both cases respondents appeared to move their first consumption of those types of collateral down to the next two stages of the sales process
When we further segmented the 2010 data to compare the habits of influencers to decision makers we observed some additional interesting trends across the board influencers tend to consume content earlier in the sales cycle than decision makers (Figure 37)
0 10 20 30 40 50 60 70 80
Final salesprocess
Mid-salesprocess
Initial salesprocess
Pre-salesprocess
Final salesprocess
Mid-salesprocess
Initial salesprocess
Pre-salesprocess
White papers Case studies Podcasts Videos Brochures
63
58
41
6458
4752
65
2526
3830
23
915
1417
9
2111
2
4542
3647
56
3339
3430
27
1614
2319
12
65
74
5
25
26
35
20
4
Infl
uen
cers
Deci
sio
n M
akers
Figure 37 In which phase of the purchasing cycle did you FIRST consume each type of collateral (influencers vs decision makers)
29
Likewise respondents from small businesses consume collateral for the first time during the pre-sales stage at much higher rates than respondents from middle-market or large companies For example 70 percent of small businesses consume white papers for the first time during this stage compared to just 40 percent of middle-market firms and 56 percent of large enterprises (Figure 38)
Small Business Mid-market Enterprise
0
10
20
30
40
50
60
70
80
Final sales processMid-sales processInitial Sales ProcessPre-sales Process
70
40
56
16
38
29
9
17
12
5 53
Figure 38 In which phase of the purchasing cycle did you FIRST consume white papers in 2010
As in previous years we find the data around use of collateral in the sales cycle interesting in the way it potentially sheds light on the relationship between influencers and decion makers We believe we are seeing the influencerrsquos role in terms of considering potential technology purchases and the subsequent sharing of that collatera and other information with decision makers a bit later in the cycle
30
BEST PRACTICES FOR THE REAL WORLD
As in previous years we conclude our delivery of the survey results by providing what we consider to be actionable advice that marketing professionals can apply right now to improve the quality and impact of their communications assets
1 Create white papers This is a repeating theme but one that is definitely worth saying once again white papers are frequently consumed and considered highly influential over the technology purchase Take advantage by creating a few well-written papers that clearly outline strategic advancements your solutions and products are aligned with Leverage your work by chunking up the main points into best practice documents blog posts ldquohow tordquo guides and other materials to support your broader campaign needs
2 Embed multimedia files Start with short video or audio clips to keep overall file sizes low but jump on this trend Once you get your feet under you you can advance to interactive charts and graphs Flash elements and other media types Donrsquot ignore the opportunity to be among the first to take advantage of this evolving practice
3 Consider all content to be social content We know that tech purchasers share content and that they consider materials forwarded from a personal contact to be very influential Plan all content and collateral assets from the perspective of stimulating discussion and sharing Think about interactivity links to discussion boards and user groups and point to blog posts and other communications channels in all materials
4 Deliver all content assets digitally and be prepared to have end users print them While the majority of respondents view collateral assets on the desktop a respectable number still enjoy printing out the materials they download and will further share print materials with others Avoid cross-page spreads and column designs that are hard to read digitally and remember to provide clear URLs for any links away from the materials for those reading print versions
5 Merchandise content on the Web Your company Web site is the most frequent location for obtaining content and it ranks second only to personal contacts in terms of influence Make the most of this channel by merchandising featured content and assets on landing pages and microsites that extend the thought leadership and discussion begun in your collateral Remember potential purchasers interact with your content before they interact with you so ensure viewers can easily see all the other channels through which they can engage with you all in one fun-filled information portal
31
CONCLUSIONAs we wrap up this yearrsquos annual survey report we find ourselves coming back to some basic advice that has been a theme of this section in each previous report plan
Eccolo believes that the requirement of content strategymdashidentifying communication topics and thoughtfully planning the assets required to achieve goalsmdashis relevant at every level of the marketing organization The proliferation of online channels and ever more sophisticated lead generation systems require a steady stream of fresh relevant content to successfully engage purchasers Itrsquos very easy to be distracted by looming deadlines and shifting priorities but creating a content strategy and identifying a clear development roadmap that describes topic format and channel is essential if you truly want to improve results
And the opportunity to improve results is significant Well-planned development cycles can shorten time to market reduce costs and ensure a consistent message across all external assets Further organizations that show a healthy respect for content planning and development from the top down will experience the entire enterprise shifting to a more responsive stance These companies are tuned toward deeper customer conversations that align with the end userrsquos preferences for sales and marketing information and by the very style of their collateral assets signal a positive experience for the potential buyer
Engage With UsEccolo Media welcomes your feedback on this report Email us at infoeccolomediacom with specific feedback or visit our blog at httpeccolomediatypepadcom to join in our ongoing discussion of best practices in content strategy
ACKNOWLEDGEMENTSWe would like to acknowledge the participation of the following team members for their efforts in bringing the Eccolo Media 2010 B2B Technology Collateral Survey Report to life Maite Figueroa Alice LaPlante Lorie Loe Courtney Love and Michael Sudol
32
ABOUT ECCOLO MEDIAEccolo Media specializes in strategic marketing insight and content development for some of the worldrsquos best-known technology companies An agency of exceptional writers Eccolo combines deep experience with ongoing research to identify and apply best practices for producing remarkable content The agency helps align clientsrsquo marketing needs with their key business goals by bringing a proactive innovative approach to the planning and execution of collateral in both traditional and new media channels Founded in 2007 Eccolo Media is headquartered in San Francisco California and fulfills a wide range of project needs throughout the Americas and EMEA Visit our Web site at wwweccolomediacom
ABOUT EMEDIA - Our Marketing Sponsoremedia has specialized in generating B2B sales leads and building demand since 1999 We reach more than 35 million decision makers across over 80 niche-oriented audiences within the following B2B areasInformation Technology ElectronicsSupply ChainLogistics Occupational HealthCorporate Finance Environmental ManagementHuman Resources Project ManagementMarketingSales PackagingConvertingB2B Events Construction amp ArchitectsManufacturing Professional DevelopmentSmall Business Design EngineersProcurement Control EngineersHospitality Management PrintingHealthcare Tech
emediarsquos expertise and personal service permit effective implementation of Guaranteed Cost-per-Lead programs for our clientsrsquo offers and collateral Or we can drive highly targeted traffic to clientsrsquo web pages
Contact emedia at 800-782-6167 630-288-8480 or inquiriesemediausacom
ACCELERATED B2B LEAD GENERATION mdash ON DEMAND
wwwemediausacom

8
(83 percent) felt that white papers were moderately to extremely influential in helping them make their final purchase decisions Only one percent thought that white papers werenrsquot influential at all and 41 percent thought they were very to extremely influential (Figure 6)
In 2009 we identified a significant gap (22 percent) between decision makers and influencers in how influential they found white papersmdashwith 51 percent of decision makers finding white papers ldquovery to extremely influentialrdquo compared to just 29 percent of influencers who agreed with that statement That gap narrowed in 2010 and we now see a 13 percent difference between the two groups (Figure 7)
Organizational size also seems to make a considerable difference in how respondents view white papers Both decision makers and influencers from enterprise and mid-market companies are more likely to consume a white paper than their small business counterparts as seen in Figure 8
Figure 6 How influential are white papers in your purchasing decisions in 2010
0
10
20
30
40
50
Not influentialat all
Somewhatinfluential
Moderatelyinfluential
Veryinfluential
Extremelyinfluential
12
29
42
16
1
Figure 7 How influential are white papers in your purchasing decision (influencers versus decision makers)
0
10
20
30
40
50
Not influentialat all
Somewhatinfluential
Moderatelyinfluential
Very to extremelyinfluential
34
47 48
38
1714
1 1
Influencer Decision maker
9
Finally we asked respondents to rank all collateral types from most influential to least influential (Figure 9 on page 9) As in our previous surveys white papers were most frequently given as the most influential collateral type Statistically there was no difference between decision makers and influencers in this regard These findings continue to reinforce our position that the high usage rate of white papers coupled with their high perceived influence make them a very valuable asset in the marketing communications toolkit
0
20
40
60
80
100
EnterpriseMid-marketSmall business
Influencers Decision makers
7074
82
62
9085
Figure 8 Have you read any white papers in the past six months to evaluate a technology purchase
0
10
20
30
40
50
60
White papers Case studies Podcasts Videos Brochures
5Least influential
4321Most influential
Figure 11 Please rank the following collateral in order of influence in making purchasing decisions with 1 being most influential and 5 being least influential
39
18
5
10
2827
34
7
16 1617
27
1816
22
7
13
26
38
44
16
108
2018
Figure 9 Please rank the following collateral in order of influence in making purchasing decisions with 1 being most influential and 5 being least influential
10
When White Papers DisappointWhile other types of collateral such as case studies and brochures are fairly standard from company to company white papers can vary widely in terms of their format content and organization To better understand what makes for a ldquogoodrdquo white papermdashwhat increases influencemdashwe asked the 2010 respondents the reverse question what would most disappoint them when reading a white paper What would decrease its influence1
Poorly written content was most frequently ranked as the number one reason for respondents expressing disappointment in a white paper as seen in Figure 10 However other results surprised us For example contrary to what Eccolo has long believed white papers that donrsquot possess best practice recommendations do not disappoint implying that key take-aways or next steps are not particularly persuasive Neither do white papers that are too technical Instead white papers that donrsquot contain enough technical information are more likely to disappoint than those that possess too much
Case Studies Remain Valuable Collateral The frequency with which case studies were used to make technology purchases in 2010 remained statistically unchanged from 2009 (67 percent) When asked how influential they felt case studies were in making purchasing decisions (Figure 11) the answers were again statistically similar to 2009 79 percent of respondents in the 2010 survey felt that case studies were moderately to extremely influential Nineteen percent found them somewhat influential and only two percent found them not to be influential at all As in 2009 when compared to the influence of other collateral types 2010 respondents ranked them as the second-most influential after white papers (see Figure 9 on page 9)
Figure 10 When reading white papers what is most likely to disappoint you
Poorly written
Not technical enough
No real-life cases
Too much productvendor info
Poorly designed
No new industry developments
Not enough productvendor info
No best practicesguidelines
Too technical
MOST DISAPPOINTING
LEAST DISAPPOINTING
1 In previous surveys we attempted to answer this question by plainly asking respondents what increased the influence of white papers The resulting data sets however were flat with no real critical element for positive influence standing out Hence our decision to pose the question from the negative
11
As in 2009 we asked respondents if case study content would be more or less influential if offered in a different formatmdashfor example if delivered in non-written forms such as audio or video
There was virtually no change in the response to this query between 2009 and 2010 Written case studies were still most frequently tapped as the most influential of all case study formats (Figure 12)
When we compared the attitudes of decision makers and influencers toward case study format however we did find a statistically significant change in the 2010 survey results In the 2009 survey influencers were much more likely to find written case studies the most influential (76 percent) than decision makers (59 percent) In 2010 the difference in attitudes was just a single percentage point 65 percent of influencers found written case studies to be the most influential form of customer testimonial compared to 64 percent of decision makers who indicated the same thing The gap also closed in respondentsrsquo attitudes toward video testimonials In 2009 40 percent of decision makers specified video as the most influential format for customer testimonials compared to 23 percent of influencers In 2010 this gap narrowed to just three percentage points (35 percent and 33 percent respectively) (Figure 13)
65 33
2
Video testimonial
Audio testimonial
Written case study
Figure 16 In which format would youfind a customer testimonial
to be most influential
Figure 12 In which format would you find a customer testimonial to be most influential
0
5
10
15
20
25
30
35
40
Not influentialat all
Somewhatinfluential
Moderatelyinfluential
Veryinfluential
Extremelyinfluential
10
29
40
19
2
Figure 12 How influential are case studies in your purchasing decisionsFigure 11 How influential are case studies in your purchasing decisions
12
Podcasts More Frequently Consumed But Less Influential Podcasts continued to play a role in the technology purchasing cycle in 2010 The percentage of survey respondents who listened to a podcast in the past six months rose to 36 percent up from from 32 percent in 2009 (Figure 5) However the percentage of respondents who found them to be moderately to extremely influential dropped to 78 percent (see Figure 14) compared to 82 percent in 2009 As in 2009 podcasts are ranked the fifth-most influential type of collateral when compared to other surveyed collateral types (see Figure 9 on page 9)
One interesting change identified in this yearrsquos results in 2009 decision makers found podcasts more influential than influencers didmdashwith 87 percent finding them moderately to extremely influential compared to just 73 percent of influencers In 2010 these results flipped with 81 percent of influencers finding podcasts moderately to extremely influential compared to 76 percent of decision makers (Figure 15) Decision makers were still more likely to find podcasts very or extremely influential however
0
5
10
15
20
25
30
35
Not influentialat all
Somewhatinfluential
Moderatelyinfluential
Veryinfluential
Extremelyinfluential
12
3234
21
1
Figure 14 How influential were podcastsaudio files in making a final purchasing decision
0
10
20
30
40
50
60
70
Audio testimonialVideo testimonialWrtitten case study
64
33
65
35
30
Influencers Decision makers
Figure 13 In which format would you find a customer testimonial to be most influential (decision maker versus influencer)
13
In those cases when respondents indicated they had listened to a podcast we asked what type of podcast it had been By far the most common type of podcast consumed was one covering technology trends (78 percent) followed by business trends (55 percent) Forty-five percent listened to information on vendor products andor solutions with the smallest but still significant percentage (39 percent) listening to customer testimonials in that format (Figure 16)
Video Continued Growth in Consumption Our 2010 survey respondents indicated that their use of video when considering technology purchase continues to increase The percentage of respondents who watched a video in the past six months increased eight points to 59 percent This result continues a trend seen in the 2009 survey results when use of video increased from 28 percent in 2008 to 49 percent in 2009 (Figure 17)
Figure 16 What types of podcastaudio files have you listened to in order to evaluate a technology purchase Check all that apply
0
20
40
60
80
OtherInformationon vendor
productssolutions
Businesstrends
Technologytrends
Customertestimonial
1
39
78
55
45
0
10
20
30
40
50
Not influentialat all
Somewhatinfluential
Moderatelyinfluential
Veryinfluential
Extremelyinfluential
28
15
7
35
46
26
17
24
02
Influencers Decision makers
Figure 15 How influential were podcastsaudio files in making a final purchasing decision
14
In 2008 video was ranked fifth in influence when compared to other types of collateral In 2009 it moved into fourth place surpassing podcasts in influence In 2010 it held on to that position (Figure 9 on page 9) When asked how influential the video was on a technology purchase 26 percent of respondents indicated they found videos to be moderately to extremely influential (Figure 18)
We further inquired as to the type of video respondents consumed during a technology purchase Respondents watched more product tutorialsdemos by a wide margin over other types of video collateral (76 percent) Vendor marketing videos were the next most commonly viewed type of video (61 percent) followed by customer testimonials (37 percent) and on-demand webinars (33 percent) as seen in Figure 19
Figure 18 How influential were the videos in making a final purchasing decision
0
10
20
30
40
Not influentialat all
Somewhatinfluential
Moderatelyinfluential
Veryinfluential
Extremelyinfluential
9
39
31
19
2
Figure 17 Have you viewed any videos in the past six months to evaluate a technology purchase
0
20
40
60
80
NoYes
201020092008
28
49 50
72
51 50
15
Brochures and Data Sheets Consumed Most Frequently In 2009 brochures and data sheets were the most frequently consumed of all collateralmdashwith 78 percent of respondents using them to make a purchasing decision over the past six months In 2010 83 percent of respondents consumed these types of collateral But although 79 percent of respondents rated them as moderately to extremely influential when making a technology purchase (Figure 20) they still tend to rank behind white papers and case studies when compared with other collateral types (see Figure 9 on page 9)
As with many other types of collateral large enterprises were more likely to consume brochures than small companies (less than 100 employees) with mid-sized companies falling in between
This year we continue to recommend that brochures and data sheets be a part of every marketerrsquos collateral toolbox precisely because they are so frequently
Figure 20 How influential were brochuresdata sheets in making a final purchasing decision
0
10
20
30
40
50
Not influentialat all
Somewhatinfluential
Moderatelyinfluential
Veryinfluential
Extremelyinfluential
8
31
40
18
3
0
10
20
30
40
50
60
70
80
OtherProducttutorials demos
On-demandwebinars
Vendormarketing
videos
Customertestimonials
37
61
2
76
33
Figure 19 What types of video files have you listened to in order to evaluate a technology purchase
16
consumed We also reiterate our advice that it might not be strategically wise to rely solely on this type of collateral given that their perceived influence is lower than some other collateral types Rather brochures and data sheets should be ldquomust-haverdquo assets in a well-rounded collateral portfolio that includes a broad variety of other content types
How Technology Purchasers Consume ContentAs in previous years we devoted significant time to analyzing how technology purchasers consume and use collateral In this section we share our results plus our insight into what respondents believe makes ldquogoodrdquo collateral
Most Collateral Still Consumed Digitally One surprise in this yearrsquos survey results was that although respondents still have an overwhelming preference for consuming written content on the desktop rather than printing it out that number actually declined across all types of written collateral (Figure 21) For example in 2009 a full three-fourths (76 percent) of respondents read white papers digitally a similar percentage (77 percent) did the same with brochuresdata sheets and even more (84 percent) consumed case studies in this form Yet in 2010 these numbers declined The percentage that read white papers digitally dropped 15 full percentage points to 61 percent The percent of respondents who indicated that they preferred to consume brochuressdata sheets in digital form declined only slightly but just 71 percent of respondents said they preferred to consume case studies in digital formmdash10 percentage points less than in 2009
We also found significant changes in whether respondents downloaded audio files onto their desktops or mobile devices or listened to audio streams from Web sites In 2009 62 percent preferred to download audio files onto their desktop or mobile devices versus 38 percent that preferred to stream directly from a Web site Yet in
Figure 21 Did you view this collateral online or did you downloadprint before reading (2009 vs 2010)
0
20
40
60
80
100
Brochuresdata sheetsCase studiessuccess storiesWhite paper
Downloaded printed 2010
Downloaded printed 2009
Viewedonline 2010
Viewedonline 2009
76
61
24
39
84
74
16
26
77
71
23
29
17
2010 these numbers shifted substantially toward a preference for streaming this year 57 percent of respondents preferred streaming versus 43 percent that favored downloading these types of files
This brings the method of consumption of audio files more in line with respondentsrsquo preferences for streaming video Sixty-four percent of 2010 respondents preferred to watch video streamed live from the source versus 36 percent that preferred to download it to a desktop or mobile device (Figure 22)
However whether streamed or downloaded 92 percent of podcast listeners and 96 percent of video viewers still consumed content on the desktop This is a critical finding that has remained consistent from year to year given that the desktop is the platform of choice for consuming all types of content marketers should ensure that all written content leverages links to other files and other communication channels as much as possible giving technology purchasers the option of drilling down to more details as desired
All Collateral Has Viral PotentialWe continue to be interested in the fact that all collateral is highly viral Technology purchasers routinely share collateral with the vast majority of 2010 respondents (89 percent) sharing the white papers they read with others as seen in Figure 23 Nearly as many (87 percent) share case studies followed by podcasts (84 percent) and then brochuresdata sheets and video (80 percent each)
White papers are still the most viral with 34 percent of respondents sharing them with three or more people Thirty-two percent of respondents shared podcasts with three or more people and 28 percent shared case studies with as many Lagging slightly behind were video (25 percent) and brochuresdata sheets (23 percent)
0
20
40
60
80
Downloaded tomobile device
then listented toviewed
Downloaded todesktop
then listened
Streamed fromlive source
5764
35 32
84
Podcasts Videos
Figure 22 Did you consume this content online or did you download before viewinglistening
18
Another interesting development although all collateral is shared primarily in digital form more 2010 respondents say that they share written collateralmdashwhite papers case studies and brochuresdata sheetsmdashin both digital and printed forms (Figure 24) than did respondents to the 2009 survey For example whereas the percentage of respondents who shared digitalelectronic versions of white papers actually declined in the past yearmdashfrom 60 percent to 51 percentmdashthe percentage of respondents who shared white papers in both digital and printed form increased from 30 percent to 37 percent We therefore caution marketers not to discount the viral nature of hard copy content as it clearly still is considered useful by a significant percentage of respondents
In 2009 influencers were more likely to share only digital copy and decision makers were more likely to share both printed and digital content However in 2010 this is no longer the case and these two respondent types are now in parity on this issue
0
5
10
15
20
25
30
35
White papers Case studies Podcasts Videos Brochures
5 or more
43210
11
13
16
20 20
23
28
25 25
30
33
31
27
30
19
14
17
12
6 6
9
7
5
8 8
6 6 6
12
27
Figure 23 On average how many other decision makers or influencers in your organization did you share each piece of collateral with
19
Preferences For Length Are ChangingEccolo Media has established best practices for serving up marketing collateral in small well-written packages Our survey results over the past three years have reinforced our belief that this serves marketers best However this year we observed subtleties in the survey results that indicated respondents may be adjusting their preferences for longer collateral length
White papersWersquove stated repeatedly that white papers are a highly influential collateral consumed at a high frequency by both decision makers and influencers But marketing communications professionals continue to debate the ideal length of a white paper how do they give the right amount of informationmdashnot too much and not too little As Figure 25 shows the majority of respondents (55 percent) felt six pages or less to be the ideal number However this percentage is 10 points less than last yearrsquos 65 percent
Figure 25 What do you feel is the ideal length for a white paper in number of pages
0
10
20
30
40
50
More than10 pages
10 pages8 pages6 pages4 pages
21
34
27
13
5
Figure 24 In what format did you share collateral
0
10
20
30
40
50
60
70
BrochuresCasestudies
Whitepapers
51
37
52
12
35
12
49
19
32
Digitalelectronic version Hard copy Both
20
Simultaneously the percentage of respondents who preferred white papers of just four pages dropped from 24 percent down to 21 percent and the percentage of respondents who leaned toward eight pages increased from 21 percent to 27 percent This indicates that the ldquoideal lengthrdquo is shifting toward longer rather than shorter white papers
There were no general differences in length preferences between decision makers and influencers but technology purchasers from small companies tend to prefer shorter white papers with 31 percent preferring four pages or less compared to 19 percent of enterprise and 18 percent of mid-market companies that said the same
Case StudiesIn 2008 most respondents reported the ideal length of a case study to be two pages or approximately 800 to 1000 words Yet in 2009 we received different responses That year the largest proportion of respondents (39 percent) indicated that four is the ideal number of pages for a written case study This yearrsquos 2010 survey backed up last yearrsquos numbers with 37 percent preferring four pages and virtually identical percentages of respondents preferring two pages or less (35 percent) or six pages or more (28 percent) as seen in Figure 26
In general the larger the company the longer they prefer their case studies to be with the largest percentage of respondents from small companies (33 percent) preferring two-page case studies the largest percentage from middle-market firms (40 percent) and large enterprises (39 percent) preferring four-page case studies
Figure 26 What do you feel is the ideal number of pages for a case studysuccess story
0
10
20
30
40
50
More than6 pages
6 pages4 pages2 pages1 page
8
27
37
19
9
21
Podcasts The ideal length of a podcast decreased in 2010 Figure 27 shows that the greatest number of respondents (36 percent) selected five to seven minutes as the ideal length Most respondents (81 percent) prefer podcasts that are 10 minutes or less in length and in general the smaller the company the shorter they prefer their podcasts to be
Video The majority of 2010 respondents (38 percent) indicated that the ideal length of video content is five to seven minutes while 24 percent preferred videos of eight to 10 minutes (Figure 28) These results indicate a slight trending to shorter videos over the 2009 respondentrsquos preferences for length where 31 percent preferred five to seven minutes and 28 percent preferred eight to 10 minutes
Figure 28 What do you feel is the ideal length of a video in number of minutes
0
10
20
30
40
More than15 minutes
11 to 15minutes
8 to 10minutes
5 to 7minutes
2 to 4minutes
Less than2 minutes
6 5
19
38
24
8
Figure 27 What do you feel is the ideal length of a podcastaudio file in number of minutes
0
10
20
30
40
More than15 minutes
11 to 15minutes
8 to 10minutes
5 to 7minutes
2 to 4minutes
Less than2 minutes
4
15
36
26
13
6
22
The Emergence of Embedded Audio and Video in Written Collateral Over the past 12 months Eccolo has participated in an emerging trend in marketing collateral embedding audio and video files into digital versions of written documents such as white papers and case studies We therefore asked respondents if they had consumed any written collateral that contained embedded audio andor video files A significant proportion of themmdash45 percentmdashsaid they had done so
Respondents were most likely to encounter embedded files in case studies (66 percent) followed by white papers (55 percent) and brochures (48 percent) (Figure 29)
Perhaps the most dramatic of our findings in this part of the survey was the overwhelming percentage of respondents who clicked through to these embedded files 93 percent Twenty-five percent clicked through to video files six percent clicked through to audio files and 62 percent clicked through to both audio and video (Figure 30)
And most importantly when respondents were asked whether the inclusion of audio or video files positively or negatively affected the overall influence of the written collateral 80 percent indicated that they viewed it either ldquovery positivelyrdquo or ldquopositivelyrdquo (Figure 31)
0
10
20
30
40
50
60
70
80
OtherBrochuresCase studiesWhite paper
55
66
48
1
Figure 29 Which types of written collateral have you consumed that included embedded audio or video
23
In particular decision makers felt this trend was positive 83 percent ranked it as very positively or positively affecting the overall influence of the written collateral compared to 74 percent of influencers (Figure 32)
The size of company also mattered when it came to the perceived influence of embedded files with enterprises more likely to indicate that it was very positive (26 percent) compared to middle-market (14 percent) or small firms (15 percent) On a related note small businesses were more likely to say that embedded files had no influence at allmdash33 percent versus 15 percent of middle-market and 15 percent of enterprise firms (Figure 33)
0
10
20
30
40
50
60
70
80
NeitherBoth audiovideoAudio onlyVideo only
25
6
62
7
Figure 30 Did you click through or open any of the video or audio files embedded in the collateral
0
10
20
30
40
50
60
70
Very negativelyNegativelyNo influencePositivelyVery positively
18
62
18
1 1
Figure 31 How did the inclusion of embedded audio and video files affect the overall influence of the written collateral
24
These results support Eccolorsquos belief that interactivity is becoming ldquotable stakesrdquo for written marketing communications collateral Given the preference that purchasers have already expressed for consuming collateral at their desktop (see Figure 22) marketers that donrsquot experiment with embedded ausio video and other multimedia formats as well as links off to other communications and social media channels risk delivering assets that seem obsolete and old-fashioned
Figure 32 How did the inclusion of embedded audio and video files affect the overall influence of the written collateral
(decision makers versus influencers)
0
20
40
60
80
Very NegativelyNegativelyNo InfluencePositivelyVery Positively
24
59
66
15
26
1 0 018
Decision maker Influencer
0
10
20
30
40
50
60
70
80
Very negativelyNegativelyNo influencePositivelyVery positively
15 14
26
52
69
59
33
15 15
0 1 0 0 1 0
Small business Mid-market Enterprise
Figure 33 How did the inclusion of embedded audio and video files affect the overall influence of the written collateral
(small business vs mid-market vs enterprise)
25
The Channel EffectLast year we added a section to our annual survey that investigated how channel affects the perceived influence of collateral We defined channel as the specific avenue through which the respondent receives contentmdashwhether from a personal contact from a corporate Web site or from a sales representative for example
One fact immediately stood out in 2009 most respondents receive written collateral through the corporate Web site (Figure 34) This did not change in 2010 with 71 percent of respondents finding white papers through such sites 65 percent getting brochuresdata sheets through that channel and 56 percent acquiring case studies in that way
The next most frequently used channel for receiving a white paper in 2010 was a download from a direct response campaign (59 percent) which implies that this should be considered an important means of distribution for marketers This was followed by forwarded by a sales repcompany contact (54 percent) obtained from a personal contact (52 percent) accessed via social media (39 percent) and absorbed through webinars (34 percent) In 2009 podcasts and video collateral differed from written content when it came to how respondents ldquofoundrdquo them but that difference
0
10
20
30
40
50
60
70
80
Mentioned ina webinar
Linked to ordiscussed in
onlinesocial media
Linked in toan RSS feed
Forwarded bysales rep
company contact
BrowsingcorporateWeb site
Downloadedfrom
direct responsecampaign
Forwardedfrom
personalcontact
White papers Case studies Podcasts Videos Brochures
5253
46
34
37
59
71
5655
6665
54
4241
38
27
23
31
39
31
39
29
23
34
20
23
20
12
21
15
44
38
45
34 34
Figure 34 Through which channels have you received collateral
26
has vanished Last year podcasts were almost equally acquired from a personal contact or from a corporate Web site (48 percent and 49 percent respectively) However this year the corporate Web site trumped the personal contact channel (55 percent to 46 percent) And this was even more dramatically the case for video with only 34 percent of respondents indicating they had been forwarded a video by a personal contact while 66 percent found video on corporate Web sites This trend underscores the importance of the corporate Web site across all collateral types
When we examined the comparative influence of these various channels another interesting fact emerged although a piece of collateral referred to or forwarded by a personal contact was most frequently cited as the most influential channel for all types of collateral browsing the corporate Web site was the second most frequently cited answer (Figure 35) When you consider that the corporate Web site is clearly the most frequently used channel for collateral delivery coupled with its high perceived influence you understand why we recommend that you make investing in and frequently refreshing your Web site a priority
0
10
20
30
40
50
60
70
80
Mentioned ina webinar
Linked to ordiscussed in
onlinesocial media
Linked in toan RSS feed
Forwarded bysales rep
company contact
BrowsingcorporateWeb site
Downloadedfrom
direct responsecampaign
Forwardedfrom
personalcontact
White papers Case studies Podcasts Videos Brochures
73
79
767677
41
38
424343
6060
53
61
69
37
33
28
39
46
2220
31
1716
35
42
3836
31 31
27
33
29
19
Figure 35 Positive influence by channel
27
Marketing Collateral in the Sales CycleThe relationship between collateral and actual sales is an important one How do the various types of collateralmdashwhite papers case studies brochuresmdashimpact sales When should you deliver a white paper case study podcast or video to drive potential purchasers to the next step in the sales cycle Is there a way to time delivery of specific collateral types to nurture leads more effectively
For the purposes of this survey we defined the various stages of the technology evaluation and purchase process as
bull Pre-salemdashConsidering solutions and vendors
bull Initial salemdashReviewing vendor qualifications capabilities and RFP responses
bull Mid-salemdashReviewing details of the solution with one vendor
bull Final salemdashCustomization negotiation and procurement
In our 2008 survey results we saw that respondents most frequently consumed each collateral type for the first time in the pre-sale process by a significant margin that is before they send out RFPs or initiate discussions with specific vendors In that first Eccolo B2B survey white papers were read by 61 percent of respondents during this phase case studies by 48 percent podcasts by 53 percent video by 51 percent and brochuresdata sheets by 62 percent
0
10
20
30
40
50
60
70
Final sales processMid-sales processInitial sales processPre-sales process
White papers Case studies Podcasts Videos Brochures
53
49
41
49
31
3435
30
25
13
21
2018
11
4 3 4 3 4
60
Figure 36 In which phase of the purchasing cycle did you FIRST consume each type of collateral
28
Our 2010 survey indicates that these habits are shifting While the majority of respondents still consume most collateral for the first time in the pre-sales phase more respondents now indicate they first consumed collateral in either the initial sales or mid-sales phases than they did in 2008 For example the percentage of respondents who first consumed a white paper during the pre-sales process dropped to 53 percent the percentage that listened to a podcast dropped down to 41 percent (Figure 36) In both cases respondents appeared to move their first consumption of those types of collateral down to the next two stages of the sales process
When we further segmented the 2010 data to compare the habits of influencers to decision makers we observed some additional interesting trends across the board influencers tend to consume content earlier in the sales cycle than decision makers (Figure 37)
0 10 20 30 40 50 60 70 80
Final salesprocess
Mid-salesprocess
Initial salesprocess
Pre-salesprocess
Final salesprocess
Mid-salesprocess
Initial salesprocess
Pre-salesprocess
White papers Case studies Podcasts Videos Brochures
63
58
41
6458
4752
65
2526
3830
23
915
1417
9
2111
2
4542
3647
56
3339
3430
27
1614
2319
12
65
74
5
25
26
35
20
4
Infl
uen
cers
Deci
sio
n M
akers
Figure 37 In which phase of the purchasing cycle did you FIRST consume each type of collateral (influencers vs decision makers)
29
Likewise respondents from small businesses consume collateral for the first time during the pre-sales stage at much higher rates than respondents from middle-market or large companies For example 70 percent of small businesses consume white papers for the first time during this stage compared to just 40 percent of middle-market firms and 56 percent of large enterprises (Figure 38)
Small Business Mid-market Enterprise
0
10
20
30
40
50
60
70
80
Final sales processMid-sales processInitial Sales ProcessPre-sales Process
70
40
56
16
38
29
9
17
12
5 53
Figure 38 In which phase of the purchasing cycle did you FIRST consume white papers in 2010
As in previous years we find the data around use of collateral in the sales cycle interesting in the way it potentially sheds light on the relationship between influencers and decion makers We believe we are seeing the influencerrsquos role in terms of considering potential technology purchases and the subsequent sharing of that collatera and other information with decision makers a bit later in the cycle
30
BEST PRACTICES FOR THE REAL WORLD
As in previous years we conclude our delivery of the survey results by providing what we consider to be actionable advice that marketing professionals can apply right now to improve the quality and impact of their communications assets
1 Create white papers This is a repeating theme but one that is definitely worth saying once again white papers are frequently consumed and considered highly influential over the technology purchase Take advantage by creating a few well-written papers that clearly outline strategic advancements your solutions and products are aligned with Leverage your work by chunking up the main points into best practice documents blog posts ldquohow tordquo guides and other materials to support your broader campaign needs
2 Embed multimedia files Start with short video or audio clips to keep overall file sizes low but jump on this trend Once you get your feet under you you can advance to interactive charts and graphs Flash elements and other media types Donrsquot ignore the opportunity to be among the first to take advantage of this evolving practice
3 Consider all content to be social content We know that tech purchasers share content and that they consider materials forwarded from a personal contact to be very influential Plan all content and collateral assets from the perspective of stimulating discussion and sharing Think about interactivity links to discussion boards and user groups and point to blog posts and other communications channels in all materials
4 Deliver all content assets digitally and be prepared to have end users print them While the majority of respondents view collateral assets on the desktop a respectable number still enjoy printing out the materials they download and will further share print materials with others Avoid cross-page spreads and column designs that are hard to read digitally and remember to provide clear URLs for any links away from the materials for those reading print versions
5 Merchandise content on the Web Your company Web site is the most frequent location for obtaining content and it ranks second only to personal contacts in terms of influence Make the most of this channel by merchandising featured content and assets on landing pages and microsites that extend the thought leadership and discussion begun in your collateral Remember potential purchasers interact with your content before they interact with you so ensure viewers can easily see all the other channels through which they can engage with you all in one fun-filled information portal
31
CONCLUSIONAs we wrap up this yearrsquos annual survey report we find ourselves coming back to some basic advice that has been a theme of this section in each previous report plan
Eccolo believes that the requirement of content strategymdashidentifying communication topics and thoughtfully planning the assets required to achieve goalsmdashis relevant at every level of the marketing organization The proliferation of online channels and ever more sophisticated lead generation systems require a steady stream of fresh relevant content to successfully engage purchasers Itrsquos very easy to be distracted by looming deadlines and shifting priorities but creating a content strategy and identifying a clear development roadmap that describes topic format and channel is essential if you truly want to improve results
And the opportunity to improve results is significant Well-planned development cycles can shorten time to market reduce costs and ensure a consistent message across all external assets Further organizations that show a healthy respect for content planning and development from the top down will experience the entire enterprise shifting to a more responsive stance These companies are tuned toward deeper customer conversations that align with the end userrsquos preferences for sales and marketing information and by the very style of their collateral assets signal a positive experience for the potential buyer
Engage With UsEccolo Media welcomes your feedback on this report Email us at infoeccolomediacom with specific feedback or visit our blog at httpeccolomediatypepadcom to join in our ongoing discussion of best practices in content strategy
ACKNOWLEDGEMENTSWe would like to acknowledge the participation of the following team members for their efforts in bringing the Eccolo Media 2010 B2B Technology Collateral Survey Report to life Maite Figueroa Alice LaPlante Lorie Loe Courtney Love and Michael Sudol
32
ABOUT ECCOLO MEDIAEccolo Media specializes in strategic marketing insight and content development for some of the worldrsquos best-known technology companies An agency of exceptional writers Eccolo combines deep experience with ongoing research to identify and apply best practices for producing remarkable content The agency helps align clientsrsquo marketing needs with their key business goals by bringing a proactive innovative approach to the planning and execution of collateral in both traditional and new media channels Founded in 2007 Eccolo Media is headquartered in San Francisco California and fulfills a wide range of project needs throughout the Americas and EMEA Visit our Web site at wwweccolomediacom
ABOUT EMEDIA - Our Marketing Sponsoremedia has specialized in generating B2B sales leads and building demand since 1999 We reach more than 35 million decision makers across over 80 niche-oriented audiences within the following B2B areasInformation Technology ElectronicsSupply ChainLogistics Occupational HealthCorporate Finance Environmental ManagementHuman Resources Project ManagementMarketingSales PackagingConvertingB2B Events Construction amp ArchitectsManufacturing Professional DevelopmentSmall Business Design EngineersProcurement Control EngineersHospitality Management PrintingHealthcare Tech
emediarsquos expertise and personal service permit effective implementation of Guaranteed Cost-per-Lead programs for our clientsrsquo offers and collateral Or we can drive highly targeted traffic to clientsrsquo web pages
Contact emedia at 800-782-6167 630-288-8480 or inquiriesemediausacom
ACCELERATED B2B LEAD GENERATION mdash ON DEMAND
wwwemediausacom

9
Finally we asked respondents to rank all collateral types from most influential to least influential (Figure 9 on page 9) As in our previous surveys white papers were most frequently given as the most influential collateral type Statistically there was no difference between decision makers and influencers in this regard These findings continue to reinforce our position that the high usage rate of white papers coupled with their high perceived influence make them a very valuable asset in the marketing communications toolkit
0
20
40
60
80
100
EnterpriseMid-marketSmall business
Influencers Decision makers
7074
82
62
9085
Figure 8 Have you read any white papers in the past six months to evaluate a technology purchase
0
10
20
30
40
50
60
White papers Case studies Podcasts Videos Brochures
5Least influential
4321Most influential
Figure 11 Please rank the following collateral in order of influence in making purchasing decisions with 1 being most influential and 5 being least influential
39
18
5
10
2827
34
7
16 1617
27
1816
22
7
13
26
38
44
16
108
2018
Figure 9 Please rank the following collateral in order of influence in making purchasing decisions with 1 being most influential and 5 being least influential
10
When White Papers DisappointWhile other types of collateral such as case studies and brochures are fairly standard from company to company white papers can vary widely in terms of their format content and organization To better understand what makes for a ldquogoodrdquo white papermdashwhat increases influencemdashwe asked the 2010 respondents the reverse question what would most disappoint them when reading a white paper What would decrease its influence1
Poorly written content was most frequently ranked as the number one reason for respondents expressing disappointment in a white paper as seen in Figure 10 However other results surprised us For example contrary to what Eccolo has long believed white papers that donrsquot possess best practice recommendations do not disappoint implying that key take-aways or next steps are not particularly persuasive Neither do white papers that are too technical Instead white papers that donrsquot contain enough technical information are more likely to disappoint than those that possess too much
Case Studies Remain Valuable Collateral The frequency with which case studies were used to make technology purchases in 2010 remained statistically unchanged from 2009 (67 percent) When asked how influential they felt case studies were in making purchasing decisions (Figure 11) the answers were again statistically similar to 2009 79 percent of respondents in the 2010 survey felt that case studies were moderately to extremely influential Nineteen percent found them somewhat influential and only two percent found them not to be influential at all As in 2009 when compared to the influence of other collateral types 2010 respondents ranked them as the second-most influential after white papers (see Figure 9 on page 9)
Figure 10 When reading white papers what is most likely to disappoint you
Poorly written
Not technical enough
No real-life cases
Too much productvendor info
Poorly designed
No new industry developments
Not enough productvendor info
No best practicesguidelines
Too technical
MOST DISAPPOINTING
LEAST DISAPPOINTING
1 In previous surveys we attempted to answer this question by plainly asking respondents what increased the influence of white papers The resulting data sets however were flat with no real critical element for positive influence standing out Hence our decision to pose the question from the negative
11
As in 2009 we asked respondents if case study content would be more or less influential if offered in a different formatmdashfor example if delivered in non-written forms such as audio or video
There was virtually no change in the response to this query between 2009 and 2010 Written case studies were still most frequently tapped as the most influential of all case study formats (Figure 12)
When we compared the attitudes of decision makers and influencers toward case study format however we did find a statistically significant change in the 2010 survey results In the 2009 survey influencers were much more likely to find written case studies the most influential (76 percent) than decision makers (59 percent) In 2010 the difference in attitudes was just a single percentage point 65 percent of influencers found written case studies to be the most influential form of customer testimonial compared to 64 percent of decision makers who indicated the same thing The gap also closed in respondentsrsquo attitudes toward video testimonials In 2009 40 percent of decision makers specified video as the most influential format for customer testimonials compared to 23 percent of influencers In 2010 this gap narrowed to just three percentage points (35 percent and 33 percent respectively) (Figure 13)
65 33
2
Video testimonial
Audio testimonial
Written case study
Figure 16 In which format would youfind a customer testimonial
to be most influential
Figure 12 In which format would you find a customer testimonial to be most influential
0
5
10
15
20
25
30
35
40
Not influentialat all
Somewhatinfluential
Moderatelyinfluential
Veryinfluential
Extremelyinfluential
10
29
40
19
2
Figure 12 How influential are case studies in your purchasing decisionsFigure 11 How influential are case studies in your purchasing decisions
12
Podcasts More Frequently Consumed But Less Influential Podcasts continued to play a role in the technology purchasing cycle in 2010 The percentage of survey respondents who listened to a podcast in the past six months rose to 36 percent up from from 32 percent in 2009 (Figure 5) However the percentage of respondents who found them to be moderately to extremely influential dropped to 78 percent (see Figure 14) compared to 82 percent in 2009 As in 2009 podcasts are ranked the fifth-most influential type of collateral when compared to other surveyed collateral types (see Figure 9 on page 9)
One interesting change identified in this yearrsquos results in 2009 decision makers found podcasts more influential than influencers didmdashwith 87 percent finding them moderately to extremely influential compared to just 73 percent of influencers In 2010 these results flipped with 81 percent of influencers finding podcasts moderately to extremely influential compared to 76 percent of decision makers (Figure 15) Decision makers were still more likely to find podcasts very or extremely influential however
0
5
10
15
20
25
30
35
Not influentialat all
Somewhatinfluential
Moderatelyinfluential
Veryinfluential
Extremelyinfluential
12
3234
21
1
Figure 14 How influential were podcastsaudio files in making a final purchasing decision
0
10
20
30
40
50
60
70
Audio testimonialVideo testimonialWrtitten case study
64
33
65
35
30
Influencers Decision makers
Figure 13 In which format would you find a customer testimonial to be most influential (decision maker versus influencer)
13
In those cases when respondents indicated they had listened to a podcast we asked what type of podcast it had been By far the most common type of podcast consumed was one covering technology trends (78 percent) followed by business trends (55 percent) Forty-five percent listened to information on vendor products andor solutions with the smallest but still significant percentage (39 percent) listening to customer testimonials in that format (Figure 16)
Video Continued Growth in Consumption Our 2010 survey respondents indicated that their use of video when considering technology purchase continues to increase The percentage of respondents who watched a video in the past six months increased eight points to 59 percent This result continues a trend seen in the 2009 survey results when use of video increased from 28 percent in 2008 to 49 percent in 2009 (Figure 17)
Figure 16 What types of podcastaudio files have you listened to in order to evaluate a technology purchase Check all that apply
0
20
40
60
80
OtherInformationon vendor
productssolutions
Businesstrends
Technologytrends
Customertestimonial
1
39
78
55
45
0
10
20
30
40
50
Not influentialat all
Somewhatinfluential
Moderatelyinfluential
Veryinfluential
Extremelyinfluential
28
15
7
35
46
26
17
24
02
Influencers Decision makers
Figure 15 How influential were podcastsaudio files in making a final purchasing decision
14
In 2008 video was ranked fifth in influence when compared to other types of collateral In 2009 it moved into fourth place surpassing podcasts in influence In 2010 it held on to that position (Figure 9 on page 9) When asked how influential the video was on a technology purchase 26 percent of respondents indicated they found videos to be moderately to extremely influential (Figure 18)
We further inquired as to the type of video respondents consumed during a technology purchase Respondents watched more product tutorialsdemos by a wide margin over other types of video collateral (76 percent) Vendor marketing videos were the next most commonly viewed type of video (61 percent) followed by customer testimonials (37 percent) and on-demand webinars (33 percent) as seen in Figure 19
Figure 18 How influential were the videos in making a final purchasing decision
0
10
20
30
40
Not influentialat all
Somewhatinfluential
Moderatelyinfluential
Veryinfluential
Extremelyinfluential
9
39
31
19
2
Figure 17 Have you viewed any videos in the past six months to evaluate a technology purchase
0
20
40
60
80
NoYes
201020092008
28
49 50
72
51 50
15
Brochures and Data Sheets Consumed Most Frequently In 2009 brochures and data sheets were the most frequently consumed of all collateralmdashwith 78 percent of respondents using them to make a purchasing decision over the past six months In 2010 83 percent of respondents consumed these types of collateral But although 79 percent of respondents rated them as moderately to extremely influential when making a technology purchase (Figure 20) they still tend to rank behind white papers and case studies when compared with other collateral types (see Figure 9 on page 9)
As with many other types of collateral large enterprises were more likely to consume brochures than small companies (less than 100 employees) with mid-sized companies falling in between
This year we continue to recommend that brochures and data sheets be a part of every marketerrsquos collateral toolbox precisely because they are so frequently
Figure 20 How influential were brochuresdata sheets in making a final purchasing decision
0
10
20
30
40
50
Not influentialat all
Somewhatinfluential
Moderatelyinfluential
Veryinfluential
Extremelyinfluential
8
31
40
18
3
0
10
20
30
40
50
60
70
80
OtherProducttutorials demos
On-demandwebinars
Vendormarketing
videos
Customertestimonials
37
61
2
76
33
Figure 19 What types of video files have you listened to in order to evaluate a technology purchase
16
consumed We also reiterate our advice that it might not be strategically wise to rely solely on this type of collateral given that their perceived influence is lower than some other collateral types Rather brochures and data sheets should be ldquomust-haverdquo assets in a well-rounded collateral portfolio that includes a broad variety of other content types
How Technology Purchasers Consume ContentAs in previous years we devoted significant time to analyzing how technology purchasers consume and use collateral In this section we share our results plus our insight into what respondents believe makes ldquogoodrdquo collateral
Most Collateral Still Consumed Digitally One surprise in this yearrsquos survey results was that although respondents still have an overwhelming preference for consuming written content on the desktop rather than printing it out that number actually declined across all types of written collateral (Figure 21) For example in 2009 a full three-fourths (76 percent) of respondents read white papers digitally a similar percentage (77 percent) did the same with brochuresdata sheets and even more (84 percent) consumed case studies in this form Yet in 2010 these numbers declined The percentage that read white papers digitally dropped 15 full percentage points to 61 percent The percent of respondents who indicated that they preferred to consume brochuressdata sheets in digital form declined only slightly but just 71 percent of respondents said they preferred to consume case studies in digital formmdash10 percentage points less than in 2009
We also found significant changes in whether respondents downloaded audio files onto their desktops or mobile devices or listened to audio streams from Web sites In 2009 62 percent preferred to download audio files onto their desktop or mobile devices versus 38 percent that preferred to stream directly from a Web site Yet in
Figure 21 Did you view this collateral online or did you downloadprint before reading (2009 vs 2010)
0
20
40
60
80
100
Brochuresdata sheetsCase studiessuccess storiesWhite paper
Downloaded printed 2010
Downloaded printed 2009
Viewedonline 2010
Viewedonline 2009
76
61
24
39
84
74
16
26
77
71
23
29
17
2010 these numbers shifted substantially toward a preference for streaming this year 57 percent of respondents preferred streaming versus 43 percent that favored downloading these types of files
This brings the method of consumption of audio files more in line with respondentsrsquo preferences for streaming video Sixty-four percent of 2010 respondents preferred to watch video streamed live from the source versus 36 percent that preferred to download it to a desktop or mobile device (Figure 22)
However whether streamed or downloaded 92 percent of podcast listeners and 96 percent of video viewers still consumed content on the desktop This is a critical finding that has remained consistent from year to year given that the desktop is the platform of choice for consuming all types of content marketers should ensure that all written content leverages links to other files and other communication channels as much as possible giving technology purchasers the option of drilling down to more details as desired
All Collateral Has Viral PotentialWe continue to be interested in the fact that all collateral is highly viral Technology purchasers routinely share collateral with the vast majority of 2010 respondents (89 percent) sharing the white papers they read with others as seen in Figure 23 Nearly as many (87 percent) share case studies followed by podcasts (84 percent) and then brochuresdata sheets and video (80 percent each)
White papers are still the most viral with 34 percent of respondents sharing them with three or more people Thirty-two percent of respondents shared podcasts with three or more people and 28 percent shared case studies with as many Lagging slightly behind were video (25 percent) and brochuresdata sheets (23 percent)
0
20
40
60
80
Downloaded tomobile device
then listented toviewed
Downloaded todesktop
then listened
Streamed fromlive source
5764
35 32
84
Podcasts Videos
Figure 22 Did you consume this content online or did you download before viewinglistening
18
Another interesting development although all collateral is shared primarily in digital form more 2010 respondents say that they share written collateralmdashwhite papers case studies and brochuresdata sheetsmdashin both digital and printed forms (Figure 24) than did respondents to the 2009 survey For example whereas the percentage of respondents who shared digitalelectronic versions of white papers actually declined in the past yearmdashfrom 60 percent to 51 percentmdashthe percentage of respondents who shared white papers in both digital and printed form increased from 30 percent to 37 percent We therefore caution marketers not to discount the viral nature of hard copy content as it clearly still is considered useful by a significant percentage of respondents
In 2009 influencers were more likely to share only digital copy and decision makers were more likely to share both printed and digital content However in 2010 this is no longer the case and these two respondent types are now in parity on this issue
0
5
10
15
20
25
30
35
White papers Case studies Podcasts Videos Brochures
5 or more
43210
11
13
16
20 20
23
28
25 25
30
33
31
27
30
19
14
17
12
6 6
9
7
5
8 8
6 6 6
12
27
Figure 23 On average how many other decision makers or influencers in your organization did you share each piece of collateral with
19
Preferences For Length Are ChangingEccolo Media has established best practices for serving up marketing collateral in small well-written packages Our survey results over the past three years have reinforced our belief that this serves marketers best However this year we observed subtleties in the survey results that indicated respondents may be adjusting their preferences for longer collateral length
White papersWersquove stated repeatedly that white papers are a highly influential collateral consumed at a high frequency by both decision makers and influencers But marketing communications professionals continue to debate the ideal length of a white paper how do they give the right amount of informationmdashnot too much and not too little As Figure 25 shows the majority of respondents (55 percent) felt six pages or less to be the ideal number However this percentage is 10 points less than last yearrsquos 65 percent
Figure 25 What do you feel is the ideal length for a white paper in number of pages
0
10
20
30
40
50
More than10 pages
10 pages8 pages6 pages4 pages
21
34
27
13
5
Figure 24 In what format did you share collateral
0
10
20
30
40
50
60
70
BrochuresCasestudies
Whitepapers
51
37
52
12
35
12
49
19
32
Digitalelectronic version Hard copy Both
20
Simultaneously the percentage of respondents who preferred white papers of just four pages dropped from 24 percent down to 21 percent and the percentage of respondents who leaned toward eight pages increased from 21 percent to 27 percent This indicates that the ldquoideal lengthrdquo is shifting toward longer rather than shorter white papers
There were no general differences in length preferences between decision makers and influencers but technology purchasers from small companies tend to prefer shorter white papers with 31 percent preferring four pages or less compared to 19 percent of enterprise and 18 percent of mid-market companies that said the same
Case StudiesIn 2008 most respondents reported the ideal length of a case study to be two pages or approximately 800 to 1000 words Yet in 2009 we received different responses That year the largest proportion of respondents (39 percent) indicated that four is the ideal number of pages for a written case study This yearrsquos 2010 survey backed up last yearrsquos numbers with 37 percent preferring four pages and virtually identical percentages of respondents preferring two pages or less (35 percent) or six pages or more (28 percent) as seen in Figure 26
In general the larger the company the longer they prefer their case studies to be with the largest percentage of respondents from small companies (33 percent) preferring two-page case studies the largest percentage from middle-market firms (40 percent) and large enterprises (39 percent) preferring four-page case studies
Figure 26 What do you feel is the ideal number of pages for a case studysuccess story
0
10
20
30
40
50
More than6 pages
6 pages4 pages2 pages1 page
8
27
37
19
9
21
Podcasts The ideal length of a podcast decreased in 2010 Figure 27 shows that the greatest number of respondents (36 percent) selected five to seven minutes as the ideal length Most respondents (81 percent) prefer podcasts that are 10 minutes or less in length and in general the smaller the company the shorter they prefer their podcasts to be
Video The majority of 2010 respondents (38 percent) indicated that the ideal length of video content is five to seven minutes while 24 percent preferred videos of eight to 10 minutes (Figure 28) These results indicate a slight trending to shorter videos over the 2009 respondentrsquos preferences for length where 31 percent preferred five to seven minutes and 28 percent preferred eight to 10 minutes
Figure 28 What do you feel is the ideal length of a video in number of minutes
0
10
20
30
40
More than15 minutes
11 to 15minutes
8 to 10minutes
5 to 7minutes
2 to 4minutes
Less than2 minutes
6 5
19
38
24
8
Figure 27 What do you feel is the ideal length of a podcastaudio file in number of minutes
0
10
20
30
40
More than15 minutes
11 to 15minutes
8 to 10minutes
5 to 7minutes
2 to 4minutes
Less than2 minutes
4
15
36
26
13
6
22
The Emergence of Embedded Audio and Video in Written Collateral Over the past 12 months Eccolo has participated in an emerging trend in marketing collateral embedding audio and video files into digital versions of written documents such as white papers and case studies We therefore asked respondents if they had consumed any written collateral that contained embedded audio andor video files A significant proportion of themmdash45 percentmdashsaid they had done so
Respondents were most likely to encounter embedded files in case studies (66 percent) followed by white papers (55 percent) and brochures (48 percent) (Figure 29)
Perhaps the most dramatic of our findings in this part of the survey was the overwhelming percentage of respondents who clicked through to these embedded files 93 percent Twenty-five percent clicked through to video files six percent clicked through to audio files and 62 percent clicked through to both audio and video (Figure 30)
And most importantly when respondents were asked whether the inclusion of audio or video files positively or negatively affected the overall influence of the written collateral 80 percent indicated that they viewed it either ldquovery positivelyrdquo or ldquopositivelyrdquo (Figure 31)
0
10
20
30
40
50
60
70
80
OtherBrochuresCase studiesWhite paper
55
66
48
1
Figure 29 Which types of written collateral have you consumed that included embedded audio or video
23
In particular decision makers felt this trend was positive 83 percent ranked it as very positively or positively affecting the overall influence of the written collateral compared to 74 percent of influencers (Figure 32)
The size of company also mattered when it came to the perceived influence of embedded files with enterprises more likely to indicate that it was very positive (26 percent) compared to middle-market (14 percent) or small firms (15 percent) On a related note small businesses were more likely to say that embedded files had no influence at allmdash33 percent versus 15 percent of middle-market and 15 percent of enterprise firms (Figure 33)
0
10
20
30
40
50
60
70
80
NeitherBoth audiovideoAudio onlyVideo only
25
6
62
7
Figure 30 Did you click through or open any of the video or audio files embedded in the collateral
0
10
20
30
40
50
60
70
Very negativelyNegativelyNo influencePositivelyVery positively
18
62
18
1 1
Figure 31 How did the inclusion of embedded audio and video files affect the overall influence of the written collateral
24
These results support Eccolorsquos belief that interactivity is becoming ldquotable stakesrdquo for written marketing communications collateral Given the preference that purchasers have already expressed for consuming collateral at their desktop (see Figure 22) marketers that donrsquot experiment with embedded ausio video and other multimedia formats as well as links off to other communications and social media channels risk delivering assets that seem obsolete and old-fashioned
Figure 32 How did the inclusion of embedded audio and video files affect the overall influence of the written collateral
(decision makers versus influencers)
0
20
40
60
80
Very NegativelyNegativelyNo InfluencePositivelyVery Positively
24
59
66
15
26
1 0 018
Decision maker Influencer
0
10
20
30
40
50
60
70
80
Very negativelyNegativelyNo influencePositivelyVery positively
15 14
26
52
69
59
33
15 15
0 1 0 0 1 0
Small business Mid-market Enterprise
Figure 33 How did the inclusion of embedded audio and video files affect the overall influence of the written collateral
(small business vs mid-market vs enterprise)
25
The Channel EffectLast year we added a section to our annual survey that investigated how channel affects the perceived influence of collateral We defined channel as the specific avenue through which the respondent receives contentmdashwhether from a personal contact from a corporate Web site or from a sales representative for example
One fact immediately stood out in 2009 most respondents receive written collateral through the corporate Web site (Figure 34) This did not change in 2010 with 71 percent of respondents finding white papers through such sites 65 percent getting brochuresdata sheets through that channel and 56 percent acquiring case studies in that way
The next most frequently used channel for receiving a white paper in 2010 was a download from a direct response campaign (59 percent) which implies that this should be considered an important means of distribution for marketers This was followed by forwarded by a sales repcompany contact (54 percent) obtained from a personal contact (52 percent) accessed via social media (39 percent) and absorbed through webinars (34 percent) In 2009 podcasts and video collateral differed from written content when it came to how respondents ldquofoundrdquo them but that difference
0
10
20
30
40
50
60
70
80
Mentioned ina webinar
Linked to ordiscussed in
onlinesocial media
Linked in toan RSS feed
Forwarded bysales rep
company contact
BrowsingcorporateWeb site
Downloadedfrom
direct responsecampaign
Forwardedfrom
personalcontact
White papers Case studies Podcasts Videos Brochures
5253
46
34
37
59
71
5655
6665
54
4241
38
27
23
31
39
31
39
29
23
34
20
23
20
12
21
15
44
38
45
34 34
Figure 34 Through which channels have you received collateral
26
has vanished Last year podcasts were almost equally acquired from a personal contact or from a corporate Web site (48 percent and 49 percent respectively) However this year the corporate Web site trumped the personal contact channel (55 percent to 46 percent) And this was even more dramatically the case for video with only 34 percent of respondents indicating they had been forwarded a video by a personal contact while 66 percent found video on corporate Web sites This trend underscores the importance of the corporate Web site across all collateral types
When we examined the comparative influence of these various channels another interesting fact emerged although a piece of collateral referred to or forwarded by a personal contact was most frequently cited as the most influential channel for all types of collateral browsing the corporate Web site was the second most frequently cited answer (Figure 35) When you consider that the corporate Web site is clearly the most frequently used channel for collateral delivery coupled with its high perceived influence you understand why we recommend that you make investing in and frequently refreshing your Web site a priority
0
10
20
30
40
50
60
70
80
Mentioned ina webinar
Linked to ordiscussed in
onlinesocial media
Linked in toan RSS feed
Forwarded bysales rep
company contact
BrowsingcorporateWeb site
Downloadedfrom
direct responsecampaign
Forwardedfrom
personalcontact
White papers Case studies Podcasts Videos Brochures
73
79
767677
41
38
424343
6060
53
61
69
37
33
28
39
46
2220
31
1716
35
42
3836
31 31
27
33
29
19
Figure 35 Positive influence by channel
27
Marketing Collateral in the Sales CycleThe relationship between collateral and actual sales is an important one How do the various types of collateralmdashwhite papers case studies brochuresmdashimpact sales When should you deliver a white paper case study podcast or video to drive potential purchasers to the next step in the sales cycle Is there a way to time delivery of specific collateral types to nurture leads more effectively
For the purposes of this survey we defined the various stages of the technology evaluation and purchase process as
bull Pre-salemdashConsidering solutions and vendors
bull Initial salemdashReviewing vendor qualifications capabilities and RFP responses
bull Mid-salemdashReviewing details of the solution with one vendor
bull Final salemdashCustomization negotiation and procurement
In our 2008 survey results we saw that respondents most frequently consumed each collateral type for the first time in the pre-sale process by a significant margin that is before they send out RFPs or initiate discussions with specific vendors In that first Eccolo B2B survey white papers were read by 61 percent of respondents during this phase case studies by 48 percent podcasts by 53 percent video by 51 percent and brochuresdata sheets by 62 percent
0
10
20
30
40
50
60
70
Final sales processMid-sales processInitial sales processPre-sales process
White papers Case studies Podcasts Videos Brochures
53
49
41
49
31
3435
30
25
13
21
2018
11
4 3 4 3 4
60
Figure 36 In which phase of the purchasing cycle did you FIRST consume each type of collateral
28
Our 2010 survey indicates that these habits are shifting While the majority of respondents still consume most collateral for the first time in the pre-sales phase more respondents now indicate they first consumed collateral in either the initial sales or mid-sales phases than they did in 2008 For example the percentage of respondents who first consumed a white paper during the pre-sales process dropped to 53 percent the percentage that listened to a podcast dropped down to 41 percent (Figure 36) In both cases respondents appeared to move their first consumption of those types of collateral down to the next two stages of the sales process
When we further segmented the 2010 data to compare the habits of influencers to decision makers we observed some additional interesting trends across the board influencers tend to consume content earlier in the sales cycle than decision makers (Figure 37)
0 10 20 30 40 50 60 70 80
Final salesprocess
Mid-salesprocess
Initial salesprocess
Pre-salesprocess
Final salesprocess
Mid-salesprocess
Initial salesprocess
Pre-salesprocess
White papers Case studies Podcasts Videos Brochures
63
58
41
6458
4752
65
2526
3830
23
915
1417
9
2111
2
4542
3647
56
3339
3430
27
1614
2319
12
65
74
5
25
26
35
20
4
Infl
uen
cers
Deci
sio
n M
akers
Figure 37 In which phase of the purchasing cycle did you FIRST consume each type of collateral (influencers vs decision makers)
29
Likewise respondents from small businesses consume collateral for the first time during the pre-sales stage at much higher rates than respondents from middle-market or large companies For example 70 percent of small businesses consume white papers for the first time during this stage compared to just 40 percent of middle-market firms and 56 percent of large enterprises (Figure 38)
Small Business Mid-market Enterprise
0
10
20
30
40
50
60
70
80
Final sales processMid-sales processInitial Sales ProcessPre-sales Process
70
40
56
16
38
29
9
17
12
5 53
Figure 38 In which phase of the purchasing cycle did you FIRST consume white papers in 2010
As in previous years we find the data around use of collateral in the sales cycle interesting in the way it potentially sheds light on the relationship between influencers and decion makers We believe we are seeing the influencerrsquos role in terms of considering potential technology purchases and the subsequent sharing of that collatera and other information with decision makers a bit later in the cycle
30
BEST PRACTICES FOR THE REAL WORLD
As in previous years we conclude our delivery of the survey results by providing what we consider to be actionable advice that marketing professionals can apply right now to improve the quality and impact of their communications assets
1 Create white papers This is a repeating theme but one that is definitely worth saying once again white papers are frequently consumed and considered highly influential over the technology purchase Take advantage by creating a few well-written papers that clearly outline strategic advancements your solutions and products are aligned with Leverage your work by chunking up the main points into best practice documents blog posts ldquohow tordquo guides and other materials to support your broader campaign needs
2 Embed multimedia files Start with short video or audio clips to keep overall file sizes low but jump on this trend Once you get your feet under you you can advance to interactive charts and graphs Flash elements and other media types Donrsquot ignore the opportunity to be among the first to take advantage of this evolving practice
3 Consider all content to be social content We know that tech purchasers share content and that they consider materials forwarded from a personal contact to be very influential Plan all content and collateral assets from the perspective of stimulating discussion and sharing Think about interactivity links to discussion boards and user groups and point to blog posts and other communications channels in all materials
4 Deliver all content assets digitally and be prepared to have end users print them While the majority of respondents view collateral assets on the desktop a respectable number still enjoy printing out the materials they download and will further share print materials with others Avoid cross-page spreads and column designs that are hard to read digitally and remember to provide clear URLs for any links away from the materials for those reading print versions
5 Merchandise content on the Web Your company Web site is the most frequent location for obtaining content and it ranks second only to personal contacts in terms of influence Make the most of this channel by merchandising featured content and assets on landing pages and microsites that extend the thought leadership and discussion begun in your collateral Remember potential purchasers interact with your content before they interact with you so ensure viewers can easily see all the other channels through which they can engage with you all in one fun-filled information portal
31
CONCLUSIONAs we wrap up this yearrsquos annual survey report we find ourselves coming back to some basic advice that has been a theme of this section in each previous report plan
Eccolo believes that the requirement of content strategymdashidentifying communication topics and thoughtfully planning the assets required to achieve goalsmdashis relevant at every level of the marketing organization The proliferation of online channels and ever more sophisticated lead generation systems require a steady stream of fresh relevant content to successfully engage purchasers Itrsquos very easy to be distracted by looming deadlines and shifting priorities but creating a content strategy and identifying a clear development roadmap that describes topic format and channel is essential if you truly want to improve results
And the opportunity to improve results is significant Well-planned development cycles can shorten time to market reduce costs and ensure a consistent message across all external assets Further organizations that show a healthy respect for content planning and development from the top down will experience the entire enterprise shifting to a more responsive stance These companies are tuned toward deeper customer conversations that align with the end userrsquos preferences for sales and marketing information and by the very style of their collateral assets signal a positive experience for the potential buyer
Engage With UsEccolo Media welcomes your feedback on this report Email us at infoeccolomediacom with specific feedback or visit our blog at httpeccolomediatypepadcom to join in our ongoing discussion of best practices in content strategy
ACKNOWLEDGEMENTSWe would like to acknowledge the participation of the following team members for their efforts in bringing the Eccolo Media 2010 B2B Technology Collateral Survey Report to life Maite Figueroa Alice LaPlante Lorie Loe Courtney Love and Michael Sudol
32
ABOUT ECCOLO MEDIAEccolo Media specializes in strategic marketing insight and content development for some of the worldrsquos best-known technology companies An agency of exceptional writers Eccolo combines deep experience with ongoing research to identify and apply best practices for producing remarkable content The agency helps align clientsrsquo marketing needs with their key business goals by bringing a proactive innovative approach to the planning and execution of collateral in both traditional and new media channels Founded in 2007 Eccolo Media is headquartered in San Francisco California and fulfills a wide range of project needs throughout the Americas and EMEA Visit our Web site at wwweccolomediacom
ABOUT EMEDIA - Our Marketing Sponsoremedia has specialized in generating B2B sales leads and building demand since 1999 We reach more than 35 million decision makers across over 80 niche-oriented audiences within the following B2B areasInformation Technology ElectronicsSupply ChainLogistics Occupational HealthCorporate Finance Environmental ManagementHuman Resources Project ManagementMarketingSales PackagingConvertingB2B Events Construction amp ArchitectsManufacturing Professional DevelopmentSmall Business Design EngineersProcurement Control EngineersHospitality Management PrintingHealthcare Tech
emediarsquos expertise and personal service permit effective implementation of Guaranteed Cost-per-Lead programs for our clientsrsquo offers and collateral Or we can drive highly targeted traffic to clientsrsquo web pages
Contact emedia at 800-782-6167 630-288-8480 or inquiriesemediausacom
ACCELERATED B2B LEAD GENERATION mdash ON DEMAND
wwwemediausacom

10
When White Papers DisappointWhile other types of collateral such as case studies and brochures are fairly standard from company to company white papers can vary widely in terms of their format content and organization To better understand what makes for a ldquogoodrdquo white papermdashwhat increases influencemdashwe asked the 2010 respondents the reverse question what would most disappoint them when reading a white paper What would decrease its influence1
Poorly written content was most frequently ranked as the number one reason for respondents expressing disappointment in a white paper as seen in Figure 10 However other results surprised us For example contrary to what Eccolo has long believed white papers that donrsquot possess best practice recommendations do not disappoint implying that key take-aways or next steps are not particularly persuasive Neither do white papers that are too technical Instead white papers that donrsquot contain enough technical information are more likely to disappoint than those that possess too much
Case Studies Remain Valuable Collateral The frequency with which case studies were used to make technology purchases in 2010 remained statistically unchanged from 2009 (67 percent) When asked how influential they felt case studies were in making purchasing decisions (Figure 11) the answers were again statistically similar to 2009 79 percent of respondents in the 2010 survey felt that case studies were moderately to extremely influential Nineteen percent found them somewhat influential and only two percent found them not to be influential at all As in 2009 when compared to the influence of other collateral types 2010 respondents ranked them as the second-most influential after white papers (see Figure 9 on page 9)
Figure 10 When reading white papers what is most likely to disappoint you
Poorly written
Not technical enough
No real-life cases
Too much productvendor info
Poorly designed
No new industry developments
Not enough productvendor info
No best practicesguidelines
Too technical
MOST DISAPPOINTING
LEAST DISAPPOINTING
1 In previous surveys we attempted to answer this question by plainly asking respondents what increased the influence of white papers The resulting data sets however were flat with no real critical element for positive influence standing out Hence our decision to pose the question from the negative
11
As in 2009 we asked respondents if case study content would be more or less influential if offered in a different formatmdashfor example if delivered in non-written forms such as audio or video
There was virtually no change in the response to this query between 2009 and 2010 Written case studies were still most frequently tapped as the most influential of all case study formats (Figure 12)
When we compared the attitudes of decision makers and influencers toward case study format however we did find a statistically significant change in the 2010 survey results In the 2009 survey influencers were much more likely to find written case studies the most influential (76 percent) than decision makers (59 percent) In 2010 the difference in attitudes was just a single percentage point 65 percent of influencers found written case studies to be the most influential form of customer testimonial compared to 64 percent of decision makers who indicated the same thing The gap also closed in respondentsrsquo attitudes toward video testimonials In 2009 40 percent of decision makers specified video as the most influential format for customer testimonials compared to 23 percent of influencers In 2010 this gap narrowed to just three percentage points (35 percent and 33 percent respectively) (Figure 13)
65 33
2
Video testimonial
Audio testimonial
Written case study
Figure 16 In which format would youfind a customer testimonial
to be most influential
Figure 12 In which format would you find a customer testimonial to be most influential
0
5
10
15
20
25
30
35
40
Not influentialat all
Somewhatinfluential
Moderatelyinfluential
Veryinfluential
Extremelyinfluential
10
29
40
19
2
Figure 12 How influential are case studies in your purchasing decisionsFigure 11 How influential are case studies in your purchasing decisions
12
Podcasts More Frequently Consumed But Less Influential Podcasts continued to play a role in the technology purchasing cycle in 2010 The percentage of survey respondents who listened to a podcast in the past six months rose to 36 percent up from from 32 percent in 2009 (Figure 5) However the percentage of respondents who found them to be moderately to extremely influential dropped to 78 percent (see Figure 14) compared to 82 percent in 2009 As in 2009 podcasts are ranked the fifth-most influential type of collateral when compared to other surveyed collateral types (see Figure 9 on page 9)
One interesting change identified in this yearrsquos results in 2009 decision makers found podcasts more influential than influencers didmdashwith 87 percent finding them moderately to extremely influential compared to just 73 percent of influencers In 2010 these results flipped with 81 percent of influencers finding podcasts moderately to extremely influential compared to 76 percent of decision makers (Figure 15) Decision makers were still more likely to find podcasts very or extremely influential however
0
5
10
15
20
25
30
35
Not influentialat all
Somewhatinfluential
Moderatelyinfluential
Veryinfluential
Extremelyinfluential
12
3234
21
1
Figure 14 How influential were podcastsaudio files in making a final purchasing decision
0
10
20
30
40
50
60
70
Audio testimonialVideo testimonialWrtitten case study
64
33
65
35
30
Influencers Decision makers
Figure 13 In which format would you find a customer testimonial to be most influential (decision maker versus influencer)
13
In those cases when respondents indicated they had listened to a podcast we asked what type of podcast it had been By far the most common type of podcast consumed was one covering technology trends (78 percent) followed by business trends (55 percent) Forty-five percent listened to information on vendor products andor solutions with the smallest but still significant percentage (39 percent) listening to customer testimonials in that format (Figure 16)
Video Continued Growth in Consumption Our 2010 survey respondents indicated that their use of video when considering technology purchase continues to increase The percentage of respondents who watched a video in the past six months increased eight points to 59 percent This result continues a trend seen in the 2009 survey results when use of video increased from 28 percent in 2008 to 49 percent in 2009 (Figure 17)
Figure 16 What types of podcastaudio files have you listened to in order to evaluate a technology purchase Check all that apply
0
20
40
60
80
OtherInformationon vendor
productssolutions
Businesstrends
Technologytrends
Customertestimonial
1
39
78
55
45
0
10
20
30
40
50
Not influentialat all
Somewhatinfluential
Moderatelyinfluential
Veryinfluential
Extremelyinfluential
28
15
7
35
46
26
17
24
02
Influencers Decision makers
Figure 15 How influential were podcastsaudio files in making a final purchasing decision
14
In 2008 video was ranked fifth in influence when compared to other types of collateral In 2009 it moved into fourth place surpassing podcasts in influence In 2010 it held on to that position (Figure 9 on page 9) When asked how influential the video was on a technology purchase 26 percent of respondents indicated they found videos to be moderately to extremely influential (Figure 18)
We further inquired as to the type of video respondents consumed during a technology purchase Respondents watched more product tutorialsdemos by a wide margin over other types of video collateral (76 percent) Vendor marketing videos were the next most commonly viewed type of video (61 percent) followed by customer testimonials (37 percent) and on-demand webinars (33 percent) as seen in Figure 19
Figure 18 How influential were the videos in making a final purchasing decision
0
10
20
30
40
Not influentialat all
Somewhatinfluential
Moderatelyinfluential
Veryinfluential
Extremelyinfluential
9
39
31
19
2
Figure 17 Have you viewed any videos in the past six months to evaluate a technology purchase
0
20
40
60
80
NoYes
201020092008
28
49 50
72
51 50
15
Brochures and Data Sheets Consumed Most Frequently In 2009 brochures and data sheets were the most frequently consumed of all collateralmdashwith 78 percent of respondents using them to make a purchasing decision over the past six months In 2010 83 percent of respondents consumed these types of collateral But although 79 percent of respondents rated them as moderately to extremely influential when making a technology purchase (Figure 20) they still tend to rank behind white papers and case studies when compared with other collateral types (see Figure 9 on page 9)
As with many other types of collateral large enterprises were more likely to consume brochures than small companies (less than 100 employees) with mid-sized companies falling in between
This year we continue to recommend that brochures and data sheets be a part of every marketerrsquos collateral toolbox precisely because they are so frequently
Figure 20 How influential were brochuresdata sheets in making a final purchasing decision
0
10
20
30
40
50
Not influentialat all
Somewhatinfluential
Moderatelyinfluential
Veryinfluential
Extremelyinfluential
8
31
40
18
3
0
10
20
30
40
50
60
70
80
OtherProducttutorials demos
On-demandwebinars
Vendormarketing
videos
Customertestimonials
37
61
2
76
33
Figure 19 What types of video files have you listened to in order to evaluate a technology purchase
16
consumed We also reiterate our advice that it might not be strategically wise to rely solely on this type of collateral given that their perceived influence is lower than some other collateral types Rather brochures and data sheets should be ldquomust-haverdquo assets in a well-rounded collateral portfolio that includes a broad variety of other content types
How Technology Purchasers Consume ContentAs in previous years we devoted significant time to analyzing how technology purchasers consume and use collateral In this section we share our results plus our insight into what respondents believe makes ldquogoodrdquo collateral
Most Collateral Still Consumed Digitally One surprise in this yearrsquos survey results was that although respondents still have an overwhelming preference for consuming written content on the desktop rather than printing it out that number actually declined across all types of written collateral (Figure 21) For example in 2009 a full three-fourths (76 percent) of respondents read white papers digitally a similar percentage (77 percent) did the same with brochuresdata sheets and even more (84 percent) consumed case studies in this form Yet in 2010 these numbers declined The percentage that read white papers digitally dropped 15 full percentage points to 61 percent The percent of respondents who indicated that they preferred to consume brochuressdata sheets in digital form declined only slightly but just 71 percent of respondents said they preferred to consume case studies in digital formmdash10 percentage points less than in 2009
We also found significant changes in whether respondents downloaded audio files onto their desktops or mobile devices or listened to audio streams from Web sites In 2009 62 percent preferred to download audio files onto their desktop or mobile devices versus 38 percent that preferred to stream directly from a Web site Yet in
Figure 21 Did you view this collateral online or did you downloadprint before reading (2009 vs 2010)
0
20
40
60
80
100
Brochuresdata sheetsCase studiessuccess storiesWhite paper
Downloaded printed 2010
Downloaded printed 2009
Viewedonline 2010
Viewedonline 2009
76
61
24
39
84
74
16
26
77
71
23
29
17
2010 these numbers shifted substantially toward a preference for streaming this year 57 percent of respondents preferred streaming versus 43 percent that favored downloading these types of files
This brings the method of consumption of audio files more in line with respondentsrsquo preferences for streaming video Sixty-four percent of 2010 respondents preferred to watch video streamed live from the source versus 36 percent that preferred to download it to a desktop or mobile device (Figure 22)
However whether streamed or downloaded 92 percent of podcast listeners and 96 percent of video viewers still consumed content on the desktop This is a critical finding that has remained consistent from year to year given that the desktop is the platform of choice for consuming all types of content marketers should ensure that all written content leverages links to other files and other communication channels as much as possible giving technology purchasers the option of drilling down to more details as desired
All Collateral Has Viral PotentialWe continue to be interested in the fact that all collateral is highly viral Technology purchasers routinely share collateral with the vast majority of 2010 respondents (89 percent) sharing the white papers they read with others as seen in Figure 23 Nearly as many (87 percent) share case studies followed by podcasts (84 percent) and then brochuresdata sheets and video (80 percent each)
White papers are still the most viral with 34 percent of respondents sharing them with three or more people Thirty-two percent of respondents shared podcasts with three or more people and 28 percent shared case studies with as many Lagging slightly behind were video (25 percent) and brochuresdata sheets (23 percent)
0
20
40
60
80
Downloaded tomobile device
then listented toviewed
Downloaded todesktop
then listened
Streamed fromlive source
5764
35 32
84
Podcasts Videos
Figure 22 Did you consume this content online or did you download before viewinglistening
18
Another interesting development although all collateral is shared primarily in digital form more 2010 respondents say that they share written collateralmdashwhite papers case studies and brochuresdata sheetsmdashin both digital and printed forms (Figure 24) than did respondents to the 2009 survey For example whereas the percentage of respondents who shared digitalelectronic versions of white papers actually declined in the past yearmdashfrom 60 percent to 51 percentmdashthe percentage of respondents who shared white papers in both digital and printed form increased from 30 percent to 37 percent We therefore caution marketers not to discount the viral nature of hard copy content as it clearly still is considered useful by a significant percentage of respondents
In 2009 influencers were more likely to share only digital copy and decision makers were more likely to share both printed and digital content However in 2010 this is no longer the case and these two respondent types are now in parity on this issue
0
5
10
15
20
25
30
35
White papers Case studies Podcasts Videos Brochures
5 or more
43210
11
13
16
20 20
23
28
25 25
30
33
31
27
30
19
14
17
12
6 6
9
7
5
8 8
6 6 6
12
27
Figure 23 On average how many other decision makers or influencers in your organization did you share each piece of collateral with
19
Preferences For Length Are ChangingEccolo Media has established best practices for serving up marketing collateral in small well-written packages Our survey results over the past three years have reinforced our belief that this serves marketers best However this year we observed subtleties in the survey results that indicated respondents may be adjusting their preferences for longer collateral length
White papersWersquove stated repeatedly that white papers are a highly influential collateral consumed at a high frequency by both decision makers and influencers But marketing communications professionals continue to debate the ideal length of a white paper how do they give the right amount of informationmdashnot too much and not too little As Figure 25 shows the majority of respondents (55 percent) felt six pages or less to be the ideal number However this percentage is 10 points less than last yearrsquos 65 percent
Figure 25 What do you feel is the ideal length for a white paper in number of pages
0
10
20
30
40
50
More than10 pages
10 pages8 pages6 pages4 pages
21
34
27
13
5
Figure 24 In what format did you share collateral
0
10
20
30
40
50
60
70
BrochuresCasestudies
Whitepapers
51
37
52
12
35
12
49
19
32
Digitalelectronic version Hard copy Both
20
Simultaneously the percentage of respondents who preferred white papers of just four pages dropped from 24 percent down to 21 percent and the percentage of respondents who leaned toward eight pages increased from 21 percent to 27 percent This indicates that the ldquoideal lengthrdquo is shifting toward longer rather than shorter white papers
There were no general differences in length preferences between decision makers and influencers but technology purchasers from small companies tend to prefer shorter white papers with 31 percent preferring four pages or less compared to 19 percent of enterprise and 18 percent of mid-market companies that said the same
Case StudiesIn 2008 most respondents reported the ideal length of a case study to be two pages or approximately 800 to 1000 words Yet in 2009 we received different responses That year the largest proportion of respondents (39 percent) indicated that four is the ideal number of pages for a written case study This yearrsquos 2010 survey backed up last yearrsquos numbers with 37 percent preferring four pages and virtually identical percentages of respondents preferring two pages or less (35 percent) or six pages or more (28 percent) as seen in Figure 26
In general the larger the company the longer they prefer their case studies to be with the largest percentage of respondents from small companies (33 percent) preferring two-page case studies the largest percentage from middle-market firms (40 percent) and large enterprises (39 percent) preferring four-page case studies
Figure 26 What do you feel is the ideal number of pages for a case studysuccess story
0
10
20
30
40
50
More than6 pages
6 pages4 pages2 pages1 page
8
27
37
19
9
21
Podcasts The ideal length of a podcast decreased in 2010 Figure 27 shows that the greatest number of respondents (36 percent) selected five to seven minutes as the ideal length Most respondents (81 percent) prefer podcasts that are 10 minutes or less in length and in general the smaller the company the shorter they prefer their podcasts to be
Video The majority of 2010 respondents (38 percent) indicated that the ideal length of video content is five to seven minutes while 24 percent preferred videos of eight to 10 minutes (Figure 28) These results indicate a slight trending to shorter videos over the 2009 respondentrsquos preferences for length where 31 percent preferred five to seven minutes and 28 percent preferred eight to 10 minutes
Figure 28 What do you feel is the ideal length of a video in number of minutes
0
10
20
30
40
More than15 minutes
11 to 15minutes
8 to 10minutes
5 to 7minutes
2 to 4minutes
Less than2 minutes
6 5
19
38
24
8
Figure 27 What do you feel is the ideal length of a podcastaudio file in number of minutes
0
10
20
30
40
More than15 minutes
11 to 15minutes
8 to 10minutes
5 to 7minutes
2 to 4minutes
Less than2 minutes
4
15
36
26
13
6
22
The Emergence of Embedded Audio and Video in Written Collateral Over the past 12 months Eccolo has participated in an emerging trend in marketing collateral embedding audio and video files into digital versions of written documents such as white papers and case studies We therefore asked respondents if they had consumed any written collateral that contained embedded audio andor video files A significant proportion of themmdash45 percentmdashsaid they had done so
Respondents were most likely to encounter embedded files in case studies (66 percent) followed by white papers (55 percent) and brochures (48 percent) (Figure 29)
Perhaps the most dramatic of our findings in this part of the survey was the overwhelming percentage of respondents who clicked through to these embedded files 93 percent Twenty-five percent clicked through to video files six percent clicked through to audio files and 62 percent clicked through to both audio and video (Figure 30)
And most importantly when respondents were asked whether the inclusion of audio or video files positively or negatively affected the overall influence of the written collateral 80 percent indicated that they viewed it either ldquovery positivelyrdquo or ldquopositivelyrdquo (Figure 31)
0
10
20
30
40
50
60
70
80
OtherBrochuresCase studiesWhite paper
55
66
48
1
Figure 29 Which types of written collateral have you consumed that included embedded audio or video
23
In particular decision makers felt this trend was positive 83 percent ranked it as very positively or positively affecting the overall influence of the written collateral compared to 74 percent of influencers (Figure 32)
The size of company also mattered when it came to the perceived influence of embedded files with enterprises more likely to indicate that it was very positive (26 percent) compared to middle-market (14 percent) or small firms (15 percent) On a related note small businesses were more likely to say that embedded files had no influence at allmdash33 percent versus 15 percent of middle-market and 15 percent of enterprise firms (Figure 33)
0
10
20
30
40
50
60
70
80
NeitherBoth audiovideoAudio onlyVideo only
25
6
62
7
Figure 30 Did you click through or open any of the video or audio files embedded in the collateral
0
10
20
30
40
50
60
70
Very negativelyNegativelyNo influencePositivelyVery positively
18
62
18
1 1
Figure 31 How did the inclusion of embedded audio and video files affect the overall influence of the written collateral
24
These results support Eccolorsquos belief that interactivity is becoming ldquotable stakesrdquo for written marketing communications collateral Given the preference that purchasers have already expressed for consuming collateral at their desktop (see Figure 22) marketers that donrsquot experiment with embedded ausio video and other multimedia formats as well as links off to other communications and social media channels risk delivering assets that seem obsolete and old-fashioned
Figure 32 How did the inclusion of embedded audio and video files affect the overall influence of the written collateral
(decision makers versus influencers)
0
20
40
60
80
Very NegativelyNegativelyNo InfluencePositivelyVery Positively
24
59
66
15
26
1 0 018
Decision maker Influencer
0
10
20
30
40
50
60
70
80
Very negativelyNegativelyNo influencePositivelyVery positively
15 14
26
52
69
59
33
15 15
0 1 0 0 1 0
Small business Mid-market Enterprise
Figure 33 How did the inclusion of embedded audio and video files affect the overall influence of the written collateral
(small business vs mid-market vs enterprise)
25
The Channel EffectLast year we added a section to our annual survey that investigated how channel affects the perceived influence of collateral We defined channel as the specific avenue through which the respondent receives contentmdashwhether from a personal contact from a corporate Web site or from a sales representative for example
One fact immediately stood out in 2009 most respondents receive written collateral through the corporate Web site (Figure 34) This did not change in 2010 with 71 percent of respondents finding white papers through such sites 65 percent getting brochuresdata sheets through that channel and 56 percent acquiring case studies in that way
The next most frequently used channel for receiving a white paper in 2010 was a download from a direct response campaign (59 percent) which implies that this should be considered an important means of distribution for marketers This was followed by forwarded by a sales repcompany contact (54 percent) obtained from a personal contact (52 percent) accessed via social media (39 percent) and absorbed through webinars (34 percent) In 2009 podcasts and video collateral differed from written content when it came to how respondents ldquofoundrdquo them but that difference
0
10
20
30
40
50
60
70
80
Mentioned ina webinar
Linked to ordiscussed in
onlinesocial media
Linked in toan RSS feed
Forwarded bysales rep
company contact
BrowsingcorporateWeb site
Downloadedfrom
direct responsecampaign
Forwardedfrom
personalcontact
White papers Case studies Podcasts Videos Brochures
5253
46
34
37
59
71
5655
6665
54
4241
38
27
23
31
39
31
39
29
23
34
20
23
20
12
21
15
44
38
45
34 34
Figure 34 Through which channels have you received collateral
26
has vanished Last year podcasts were almost equally acquired from a personal contact or from a corporate Web site (48 percent and 49 percent respectively) However this year the corporate Web site trumped the personal contact channel (55 percent to 46 percent) And this was even more dramatically the case for video with only 34 percent of respondents indicating they had been forwarded a video by a personal contact while 66 percent found video on corporate Web sites This trend underscores the importance of the corporate Web site across all collateral types
When we examined the comparative influence of these various channels another interesting fact emerged although a piece of collateral referred to or forwarded by a personal contact was most frequently cited as the most influential channel for all types of collateral browsing the corporate Web site was the second most frequently cited answer (Figure 35) When you consider that the corporate Web site is clearly the most frequently used channel for collateral delivery coupled with its high perceived influence you understand why we recommend that you make investing in and frequently refreshing your Web site a priority
0
10
20
30
40
50
60
70
80
Mentioned ina webinar
Linked to ordiscussed in
onlinesocial media
Linked in toan RSS feed
Forwarded bysales rep
company contact
BrowsingcorporateWeb site
Downloadedfrom
direct responsecampaign
Forwardedfrom
personalcontact
White papers Case studies Podcasts Videos Brochures
73
79
767677
41
38
424343
6060
53
61
69
37
33
28
39
46
2220
31
1716
35
42
3836
31 31
27
33
29
19
Figure 35 Positive influence by channel
27
Marketing Collateral in the Sales CycleThe relationship between collateral and actual sales is an important one How do the various types of collateralmdashwhite papers case studies brochuresmdashimpact sales When should you deliver a white paper case study podcast or video to drive potential purchasers to the next step in the sales cycle Is there a way to time delivery of specific collateral types to nurture leads more effectively
For the purposes of this survey we defined the various stages of the technology evaluation and purchase process as
bull Pre-salemdashConsidering solutions and vendors
bull Initial salemdashReviewing vendor qualifications capabilities and RFP responses
bull Mid-salemdashReviewing details of the solution with one vendor
bull Final salemdashCustomization negotiation and procurement
In our 2008 survey results we saw that respondents most frequently consumed each collateral type for the first time in the pre-sale process by a significant margin that is before they send out RFPs or initiate discussions with specific vendors In that first Eccolo B2B survey white papers were read by 61 percent of respondents during this phase case studies by 48 percent podcasts by 53 percent video by 51 percent and brochuresdata sheets by 62 percent
0
10
20
30
40
50
60
70
Final sales processMid-sales processInitial sales processPre-sales process
White papers Case studies Podcasts Videos Brochures
53
49
41
49
31
3435
30
25
13
21
2018
11
4 3 4 3 4
60
Figure 36 In which phase of the purchasing cycle did you FIRST consume each type of collateral
28
Our 2010 survey indicates that these habits are shifting While the majority of respondents still consume most collateral for the first time in the pre-sales phase more respondents now indicate they first consumed collateral in either the initial sales or mid-sales phases than they did in 2008 For example the percentage of respondents who first consumed a white paper during the pre-sales process dropped to 53 percent the percentage that listened to a podcast dropped down to 41 percent (Figure 36) In both cases respondents appeared to move their first consumption of those types of collateral down to the next two stages of the sales process
When we further segmented the 2010 data to compare the habits of influencers to decision makers we observed some additional interesting trends across the board influencers tend to consume content earlier in the sales cycle than decision makers (Figure 37)
0 10 20 30 40 50 60 70 80
Final salesprocess
Mid-salesprocess
Initial salesprocess
Pre-salesprocess
Final salesprocess
Mid-salesprocess
Initial salesprocess
Pre-salesprocess
White papers Case studies Podcasts Videos Brochures
63
58
41
6458
4752
65
2526
3830
23
915
1417
9
2111
2
4542
3647
56
3339
3430
27
1614
2319
12
65
74
5
25
26
35
20
4
Infl
uen
cers
Deci
sio
n M
akers
Figure 37 In which phase of the purchasing cycle did you FIRST consume each type of collateral (influencers vs decision makers)
29
Likewise respondents from small businesses consume collateral for the first time during the pre-sales stage at much higher rates than respondents from middle-market or large companies For example 70 percent of small businesses consume white papers for the first time during this stage compared to just 40 percent of middle-market firms and 56 percent of large enterprises (Figure 38)
Small Business Mid-market Enterprise
0
10
20
30
40
50
60
70
80
Final sales processMid-sales processInitial Sales ProcessPre-sales Process
70
40
56
16
38
29
9
17
12
5 53
Figure 38 In which phase of the purchasing cycle did you FIRST consume white papers in 2010
As in previous years we find the data around use of collateral in the sales cycle interesting in the way it potentially sheds light on the relationship between influencers and decion makers We believe we are seeing the influencerrsquos role in terms of considering potential technology purchases and the subsequent sharing of that collatera and other information with decision makers a bit later in the cycle
30
BEST PRACTICES FOR THE REAL WORLD
As in previous years we conclude our delivery of the survey results by providing what we consider to be actionable advice that marketing professionals can apply right now to improve the quality and impact of their communications assets
1 Create white papers This is a repeating theme but one that is definitely worth saying once again white papers are frequently consumed and considered highly influential over the technology purchase Take advantage by creating a few well-written papers that clearly outline strategic advancements your solutions and products are aligned with Leverage your work by chunking up the main points into best practice documents blog posts ldquohow tordquo guides and other materials to support your broader campaign needs
2 Embed multimedia files Start with short video or audio clips to keep overall file sizes low but jump on this trend Once you get your feet under you you can advance to interactive charts and graphs Flash elements and other media types Donrsquot ignore the opportunity to be among the first to take advantage of this evolving practice
3 Consider all content to be social content We know that tech purchasers share content and that they consider materials forwarded from a personal contact to be very influential Plan all content and collateral assets from the perspective of stimulating discussion and sharing Think about interactivity links to discussion boards and user groups and point to blog posts and other communications channels in all materials
4 Deliver all content assets digitally and be prepared to have end users print them While the majority of respondents view collateral assets on the desktop a respectable number still enjoy printing out the materials they download and will further share print materials with others Avoid cross-page spreads and column designs that are hard to read digitally and remember to provide clear URLs for any links away from the materials for those reading print versions
5 Merchandise content on the Web Your company Web site is the most frequent location for obtaining content and it ranks second only to personal contacts in terms of influence Make the most of this channel by merchandising featured content and assets on landing pages and microsites that extend the thought leadership and discussion begun in your collateral Remember potential purchasers interact with your content before they interact with you so ensure viewers can easily see all the other channels through which they can engage with you all in one fun-filled information portal
31
CONCLUSIONAs we wrap up this yearrsquos annual survey report we find ourselves coming back to some basic advice that has been a theme of this section in each previous report plan
Eccolo believes that the requirement of content strategymdashidentifying communication topics and thoughtfully planning the assets required to achieve goalsmdashis relevant at every level of the marketing organization The proliferation of online channels and ever more sophisticated lead generation systems require a steady stream of fresh relevant content to successfully engage purchasers Itrsquos very easy to be distracted by looming deadlines and shifting priorities but creating a content strategy and identifying a clear development roadmap that describes topic format and channel is essential if you truly want to improve results
And the opportunity to improve results is significant Well-planned development cycles can shorten time to market reduce costs and ensure a consistent message across all external assets Further organizations that show a healthy respect for content planning and development from the top down will experience the entire enterprise shifting to a more responsive stance These companies are tuned toward deeper customer conversations that align with the end userrsquos preferences for sales and marketing information and by the very style of their collateral assets signal a positive experience for the potential buyer
Engage With UsEccolo Media welcomes your feedback on this report Email us at infoeccolomediacom with specific feedback or visit our blog at httpeccolomediatypepadcom to join in our ongoing discussion of best practices in content strategy
ACKNOWLEDGEMENTSWe would like to acknowledge the participation of the following team members for their efforts in bringing the Eccolo Media 2010 B2B Technology Collateral Survey Report to life Maite Figueroa Alice LaPlante Lorie Loe Courtney Love and Michael Sudol
32
ABOUT ECCOLO MEDIAEccolo Media specializes in strategic marketing insight and content development for some of the worldrsquos best-known technology companies An agency of exceptional writers Eccolo combines deep experience with ongoing research to identify and apply best practices for producing remarkable content The agency helps align clientsrsquo marketing needs with their key business goals by bringing a proactive innovative approach to the planning and execution of collateral in both traditional and new media channels Founded in 2007 Eccolo Media is headquartered in San Francisco California and fulfills a wide range of project needs throughout the Americas and EMEA Visit our Web site at wwweccolomediacom
ABOUT EMEDIA - Our Marketing Sponsoremedia has specialized in generating B2B sales leads and building demand since 1999 We reach more than 35 million decision makers across over 80 niche-oriented audiences within the following B2B areasInformation Technology ElectronicsSupply ChainLogistics Occupational HealthCorporate Finance Environmental ManagementHuman Resources Project ManagementMarketingSales PackagingConvertingB2B Events Construction amp ArchitectsManufacturing Professional DevelopmentSmall Business Design EngineersProcurement Control EngineersHospitality Management PrintingHealthcare Tech
emediarsquos expertise and personal service permit effective implementation of Guaranteed Cost-per-Lead programs for our clientsrsquo offers and collateral Or we can drive highly targeted traffic to clientsrsquo web pages
Contact emedia at 800-782-6167 630-288-8480 or inquiriesemediausacom
ACCELERATED B2B LEAD GENERATION mdash ON DEMAND
wwwemediausacom

11
As in 2009 we asked respondents if case study content would be more or less influential if offered in a different formatmdashfor example if delivered in non-written forms such as audio or video
There was virtually no change in the response to this query between 2009 and 2010 Written case studies were still most frequently tapped as the most influential of all case study formats (Figure 12)
When we compared the attitudes of decision makers and influencers toward case study format however we did find a statistically significant change in the 2010 survey results In the 2009 survey influencers were much more likely to find written case studies the most influential (76 percent) than decision makers (59 percent) In 2010 the difference in attitudes was just a single percentage point 65 percent of influencers found written case studies to be the most influential form of customer testimonial compared to 64 percent of decision makers who indicated the same thing The gap also closed in respondentsrsquo attitudes toward video testimonials In 2009 40 percent of decision makers specified video as the most influential format for customer testimonials compared to 23 percent of influencers In 2010 this gap narrowed to just three percentage points (35 percent and 33 percent respectively) (Figure 13)
65 33
2
Video testimonial
Audio testimonial
Written case study
Figure 16 In which format would youfind a customer testimonial
to be most influential
Figure 12 In which format would you find a customer testimonial to be most influential
0
5
10
15
20
25
30
35
40
Not influentialat all
Somewhatinfluential
Moderatelyinfluential
Veryinfluential
Extremelyinfluential
10
29
40
19
2
Figure 12 How influential are case studies in your purchasing decisionsFigure 11 How influential are case studies in your purchasing decisions
12
Podcasts More Frequently Consumed But Less Influential Podcasts continued to play a role in the technology purchasing cycle in 2010 The percentage of survey respondents who listened to a podcast in the past six months rose to 36 percent up from from 32 percent in 2009 (Figure 5) However the percentage of respondents who found them to be moderately to extremely influential dropped to 78 percent (see Figure 14) compared to 82 percent in 2009 As in 2009 podcasts are ranked the fifth-most influential type of collateral when compared to other surveyed collateral types (see Figure 9 on page 9)
One interesting change identified in this yearrsquos results in 2009 decision makers found podcasts more influential than influencers didmdashwith 87 percent finding them moderately to extremely influential compared to just 73 percent of influencers In 2010 these results flipped with 81 percent of influencers finding podcasts moderately to extremely influential compared to 76 percent of decision makers (Figure 15) Decision makers were still more likely to find podcasts very or extremely influential however
0
5
10
15
20
25
30
35
Not influentialat all
Somewhatinfluential
Moderatelyinfluential
Veryinfluential
Extremelyinfluential
12
3234
21
1
Figure 14 How influential were podcastsaudio files in making a final purchasing decision
0
10
20
30
40
50
60
70
Audio testimonialVideo testimonialWrtitten case study
64
33
65
35
30
Influencers Decision makers
Figure 13 In which format would you find a customer testimonial to be most influential (decision maker versus influencer)
13
In those cases when respondents indicated they had listened to a podcast we asked what type of podcast it had been By far the most common type of podcast consumed was one covering technology trends (78 percent) followed by business trends (55 percent) Forty-five percent listened to information on vendor products andor solutions with the smallest but still significant percentage (39 percent) listening to customer testimonials in that format (Figure 16)
Video Continued Growth in Consumption Our 2010 survey respondents indicated that their use of video when considering technology purchase continues to increase The percentage of respondents who watched a video in the past six months increased eight points to 59 percent This result continues a trend seen in the 2009 survey results when use of video increased from 28 percent in 2008 to 49 percent in 2009 (Figure 17)
Figure 16 What types of podcastaudio files have you listened to in order to evaluate a technology purchase Check all that apply
0
20
40
60
80
OtherInformationon vendor
productssolutions
Businesstrends
Technologytrends
Customertestimonial
1
39
78
55
45
0
10
20
30
40
50
Not influentialat all
Somewhatinfluential
Moderatelyinfluential
Veryinfluential
Extremelyinfluential
28
15
7
35
46
26
17
24
02
Influencers Decision makers
Figure 15 How influential were podcastsaudio files in making a final purchasing decision
14
In 2008 video was ranked fifth in influence when compared to other types of collateral In 2009 it moved into fourth place surpassing podcasts in influence In 2010 it held on to that position (Figure 9 on page 9) When asked how influential the video was on a technology purchase 26 percent of respondents indicated they found videos to be moderately to extremely influential (Figure 18)
We further inquired as to the type of video respondents consumed during a technology purchase Respondents watched more product tutorialsdemos by a wide margin over other types of video collateral (76 percent) Vendor marketing videos were the next most commonly viewed type of video (61 percent) followed by customer testimonials (37 percent) and on-demand webinars (33 percent) as seen in Figure 19
Figure 18 How influential were the videos in making a final purchasing decision
0
10
20
30
40
Not influentialat all
Somewhatinfluential
Moderatelyinfluential
Veryinfluential
Extremelyinfluential
9
39
31
19
2
Figure 17 Have you viewed any videos in the past six months to evaluate a technology purchase
0
20
40
60
80
NoYes
201020092008
28
49 50
72
51 50
15
Brochures and Data Sheets Consumed Most Frequently In 2009 brochures and data sheets were the most frequently consumed of all collateralmdashwith 78 percent of respondents using them to make a purchasing decision over the past six months In 2010 83 percent of respondents consumed these types of collateral But although 79 percent of respondents rated them as moderately to extremely influential when making a technology purchase (Figure 20) they still tend to rank behind white papers and case studies when compared with other collateral types (see Figure 9 on page 9)
As with many other types of collateral large enterprises were more likely to consume brochures than small companies (less than 100 employees) with mid-sized companies falling in between
This year we continue to recommend that brochures and data sheets be a part of every marketerrsquos collateral toolbox precisely because they are so frequently
Figure 20 How influential were brochuresdata sheets in making a final purchasing decision
0
10
20
30
40
50
Not influentialat all
Somewhatinfluential
Moderatelyinfluential
Veryinfluential
Extremelyinfluential
8
31
40
18
3
0
10
20
30
40
50
60
70
80
OtherProducttutorials demos
On-demandwebinars
Vendormarketing
videos
Customertestimonials
37
61
2
76
33
Figure 19 What types of video files have you listened to in order to evaluate a technology purchase
16
consumed We also reiterate our advice that it might not be strategically wise to rely solely on this type of collateral given that their perceived influence is lower than some other collateral types Rather brochures and data sheets should be ldquomust-haverdquo assets in a well-rounded collateral portfolio that includes a broad variety of other content types
How Technology Purchasers Consume ContentAs in previous years we devoted significant time to analyzing how technology purchasers consume and use collateral In this section we share our results plus our insight into what respondents believe makes ldquogoodrdquo collateral
Most Collateral Still Consumed Digitally One surprise in this yearrsquos survey results was that although respondents still have an overwhelming preference for consuming written content on the desktop rather than printing it out that number actually declined across all types of written collateral (Figure 21) For example in 2009 a full three-fourths (76 percent) of respondents read white papers digitally a similar percentage (77 percent) did the same with brochuresdata sheets and even more (84 percent) consumed case studies in this form Yet in 2010 these numbers declined The percentage that read white papers digitally dropped 15 full percentage points to 61 percent The percent of respondents who indicated that they preferred to consume brochuressdata sheets in digital form declined only slightly but just 71 percent of respondents said they preferred to consume case studies in digital formmdash10 percentage points less than in 2009
We also found significant changes in whether respondents downloaded audio files onto their desktops or mobile devices or listened to audio streams from Web sites In 2009 62 percent preferred to download audio files onto their desktop or mobile devices versus 38 percent that preferred to stream directly from a Web site Yet in
Figure 21 Did you view this collateral online or did you downloadprint before reading (2009 vs 2010)
0
20
40
60
80
100
Brochuresdata sheetsCase studiessuccess storiesWhite paper
Downloaded printed 2010
Downloaded printed 2009
Viewedonline 2010
Viewedonline 2009
76
61
24
39
84
74
16
26
77
71
23
29
17
2010 these numbers shifted substantially toward a preference for streaming this year 57 percent of respondents preferred streaming versus 43 percent that favored downloading these types of files
This brings the method of consumption of audio files more in line with respondentsrsquo preferences for streaming video Sixty-four percent of 2010 respondents preferred to watch video streamed live from the source versus 36 percent that preferred to download it to a desktop or mobile device (Figure 22)
However whether streamed or downloaded 92 percent of podcast listeners and 96 percent of video viewers still consumed content on the desktop This is a critical finding that has remained consistent from year to year given that the desktop is the platform of choice for consuming all types of content marketers should ensure that all written content leverages links to other files and other communication channels as much as possible giving technology purchasers the option of drilling down to more details as desired
All Collateral Has Viral PotentialWe continue to be interested in the fact that all collateral is highly viral Technology purchasers routinely share collateral with the vast majority of 2010 respondents (89 percent) sharing the white papers they read with others as seen in Figure 23 Nearly as many (87 percent) share case studies followed by podcasts (84 percent) and then brochuresdata sheets and video (80 percent each)
White papers are still the most viral with 34 percent of respondents sharing them with three or more people Thirty-two percent of respondents shared podcasts with three or more people and 28 percent shared case studies with as many Lagging slightly behind were video (25 percent) and brochuresdata sheets (23 percent)
0
20
40
60
80
Downloaded tomobile device
then listented toviewed
Downloaded todesktop
then listened
Streamed fromlive source
5764
35 32
84
Podcasts Videos
Figure 22 Did you consume this content online or did you download before viewinglistening
18
Another interesting development although all collateral is shared primarily in digital form more 2010 respondents say that they share written collateralmdashwhite papers case studies and brochuresdata sheetsmdashin both digital and printed forms (Figure 24) than did respondents to the 2009 survey For example whereas the percentage of respondents who shared digitalelectronic versions of white papers actually declined in the past yearmdashfrom 60 percent to 51 percentmdashthe percentage of respondents who shared white papers in both digital and printed form increased from 30 percent to 37 percent We therefore caution marketers not to discount the viral nature of hard copy content as it clearly still is considered useful by a significant percentage of respondents
In 2009 influencers were more likely to share only digital copy and decision makers were more likely to share both printed and digital content However in 2010 this is no longer the case and these two respondent types are now in parity on this issue
0
5
10
15
20
25
30
35
White papers Case studies Podcasts Videos Brochures
5 or more
43210
11
13
16
20 20
23
28
25 25
30
33
31
27
30
19
14
17
12
6 6
9
7
5
8 8
6 6 6
12
27
Figure 23 On average how many other decision makers or influencers in your organization did you share each piece of collateral with
19
Preferences For Length Are ChangingEccolo Media has established best practices for serving up marketing collateral in small well-written packages Our survey results over the past three years have reinforced our belief that this serves marketers best However this year we observed subtleties in the survey results that indicated respondents may be adjusting their preferences for longer collateral length
White papersWersquove stated repeatedly that white papers are a highly influential collateral consumed at a high frequency by both decision makers and influencers But marketing communications professionals continue to debate the ideal length of a white paper how do they give the right amount of informationmdashnot too much and not too little As Figure 25 shows the majority of respondents (55 percent) felt six pages or less to be the ideal number However this percentage is 10 points less than last yearrsquos 65 percent
Figure 25 What do you feel is the ideal length for a white paper in number of pages
0
10
20
30
40
50
More than10 pages
10 pages8 pages6 pages4 pages
21
34
27
13
5
Figure 24 In what format did you share collateral
0
10
20
30
40
50
60
70
BrochuresCasestudies
Whitepapers
51
37
52
12
35
12
49
19
32
Digitalelectronic version Hard copy Both
20
Simultaneously the percentage of respondents who preferred white papers of just four pages dropped from 24 percent down to 21 percent and the percentage of respondents who leaned toward eight pages increased from 21 percent to 27 percent This indicates that the ldquoideal lengthrdquo is shifting toward longer rather than shorter white papers
There were no general differences in length preferences between decision makers and influencers but technology purchasers from small companies tend to prefer shorter white papers with 31 percent preferring four pages or less compared to 19 percent of enterprise and 18 percent of mid-market companies that said the same
Case StudiesIn 2008 most respondents reported the ideal length of a case study to be two pages or approximately 800 to 1000 words Yet in 2009 we received different responses That year the largest proportion of respondents (39 percent) indicated that four is the ideal number of pages for a written case study This yearrsquos 2010 survey backed up last yearrsquos numbers with 37 percent preferring four pages and virtually identical percentages of respondents preferring two pages or less (35 percent) or six pages or more (28 percent) as seen in Figure 26
In general the larger the company the longer they prefer their case studies to be with the largest percentage of respondents from small companies (33 percent) preferring two-page case studies the largest percentage from middle-market firms (40 percent) and large enterprises (39 percent) preferring four-page case studies
Figure 26 What do you feel is the ideal number of pages for a case studysuccess story
0
10
20
30
40
50
More than6 pages
6 pages4 pages2 pages1 page
8
27
37
19
9
21
Podcasts The ideal length of a podcast decreased in 2010 Figure 27 shows that the greatest number of respondents (36 percent) selected five to seven minutes as the ideal length Most respondents (81 percent) prefer podcasts that are 10 minutes or less in length and in general the smaller the company the shorter they prefer their podcasts to be
Video The majority of 2010 respondents (38 percent) indicated that the ideal length of video content is five to seven minutes while 24 percent preferred videos of eight to 10 minutes (Figure 28) These results indicate a slight trending to shorter videos over the 2009 respondentrsquos preferences for length where 31 percent preferred five to seven minutes and 28 percent preferred eight to 10 minutes
Figure 28 What do you feel is the ideal length of a video in number of minutes
0
10
20
30
40
More than15 minutes
11 to 15minutes
8 to 10minutes
5 to 7minutes
2 to 4minutes
Less than2 minutes
6 5
19
38
24
8
Figure 27 What do you feel is the ideal length of a podcastaudio file in number of minutes
0
10
20
30
40
More than15 minutes
11 to 15minutes
8 to 10minutes
5 to 7minutes
2 to 4minutes
Less than2 minutes
4
15
36
26
13
6
22
The Emergence of Embedded Audio and Video in Written Collateral Over the past 12 months Eccolo has participated in an emerging trend in marketing collateral embedding audio and video files into digital versions of written documents such as white papers and case studies We therefore asked respondents if they had consumed any written collateral that contained embedded audio andor video files A significant proportion of themmdash45 percentmdashsaid they had done so
Respondents were most likely to encounter embedded files in case studies (66 percent) followed by white papers (55 percent) and brochures (48 percent) (Figure 29)
Perhaps the most dramatic of our findings in this part of the survey was the overwhelming percentage of respondents who clicked through to these embedded files 93 percent Twenty-five percent clicked through to video files six percent clicked through to audio files and 62 percent clicked through to both audio and video (Figure 30)
And most importantly when respondents were asked whether the inclusion of audio or video files positively or negatively affected the overall influence of the written collateral 80 percent indicated that they viewed it either ldquovery positivelyrdquo or ldquopositivelyrdquo (Figure 31)
0
10
20
30
40
50
60
70
80
OtherBrochuresCase studiesWhite paper
55
66
48
1
Figure 29 Which types of written collateral have you consumed that included embedded audio or video
23
In particular decision makers felt this trend was positive 83 percent ranked it as very positively or positively affecting the overall influence of the written collateral compared to 74 percent of influencers (Figure 32)
The size of company also mattered when it came to the perceived influence of embedded files with enterprises more likely to indicate that it was very positive (26 percent) compared to middle-market (14 percent) or small firms (15 percent) On a related note small businesses were more likely to say that embedded files had no influence at allmdash33 percent versus 15 percent of middle-market and 15 percent of enterprise firms (Figure 33)
0
10
20
30
40
50
60
70
80
NeitherBoth audiovideoAudio onlyVideo only
25
6
62
7
Figure 30 Did you click through or open any of the video or audio files embedded in the collateral
0
10
20
30
40
50
60
70
Very negativelyNegativelyNo influencePositivelyVery positively
18
62
18
1 1
Figure 31 How did the inclusion of embedded audio and video files affect the overall influence of the written collateral
24
These results support Eccolorsquos belief that interactivity is becoming ldquotable stakesrdquo for written marketing communications collateral Given the preference that purchasers have already expressed for consuming collateral at their desktop (see Figure 22) marketers that donrsquot experiment with embedded ausio video and other multimedia formats as well as links off to other communications and social media channels risk delivering assets that seem obsolete and old-fashioned
Figure 32 How did the inclusion of embedded audio and video files affect the overall influence of the written collateral
(decision makers versus influencers)
0
20
40
60
80
Very NegativelyNegativelyNo InfluencePositivelyVery Positively
24
59
66
15
26
1 0 018
Decision maker Influencer
0
10
20
30
40
50
60
70
80
Very negativelyNegativelyNo influencePositivelyVery positively
15 14
26
52
69
59
33
15 15
0 1 0 0 1 0
Small business Mid-market Enterprise
Figure 33 How did the inclusion of embedded audio and video files affect the overall influence of the written collateral
(small business vs mid-market vs enterprise)
25
The Channel EffectLast year we added a section to our annual survey that investigated how channel affects the perceived influence of collateral We defined channel as the specific avenue through which the respondent receives contentmdashwhether from a personal contact from a corporate Web site or from a sales representative for example
One fact immediately stood out in 2009 most respondents receive written collateral through the corporate Web site (Figure 34) This did not change in 2010 with 71 percent of respondents finding white papers through such sites 65 percent getting brochuresdata sheets through that channel and 56 percent acquiring case studies in that way
The next most frequently used channel for receiving a white paper in 2010 was a download from a direct response campaign (59 percent) which implies that this should be considered an important means of distribution for marketers This was followed by forwarded by a sales repcompany contact (54 percent) obtained from a personal contact (52 percent) accessed via social media (39 percent) and absorbed through webinars (34 percent) In 2009 podcasts and video collateral differed from written content when it came to how respondents ldquofoundrdquo them but that difference
0
10
20
30
40
50
60
70
80
Mentioned ina webinar
Linked to ordiscussed in
onlinesocial media
Linked in toan RSS feed
Forwarded bysales rep
company contact
BrowsingcorporateWeb site
Downloadedfrom
direct responsecampaign
Forwardedfrom
personalcontact
White papers Case studies Podcasts Videos Brochures
5253
46
34
37
59
71
5655
6665
54
4241
38
27
23
31
39
31
39
29
23
34
20
23
20
12
21
15
44
38
45
34 34
Figure 34 Through which channels have you received collateral
26
has vanished Last year podcasts were almost equally acquired from a personal contact or from a corporate Web site (48 percent and 49 percent respectively) However this year the corporate Web site trumped the personal contact channel (55 percent to 46 percent) And this was even more dramatically the case for video with only 34 percent of respondents indicating they had been forwarded a video by a personal contact while 66 percent found video on corporate Web sites This trend underscores the importance of the corporate Web site across all collateral types
When we examined the comparative influence of these various channels another interesting fact emerged although a piece of collateral referred to or forwarded by a personal contact was most frequently cited as the most influential channel for all types of collateral browsing the corporate Web site was the second most frequently cited answer (Figure 35) When you consider that the corporate Web site is clearly the most frequently used channel for collateral delivery coupled with its high perceived influence you understand why we recommend that you make investing in and frequently refreshing your Web site a priority
0
10
20
30
40
50
60
70
80
Mentioned ina webinar
Linked to ordiscussed in
onlinesocial media
Linked in toan RSS feed
Forwarded bysales rep
company contact
BrowsingcorporateWeb site
Downloadedfrom
direct responsecampaign
Forwardedfrom
personalcontact
White papers Case studies Podcasts Videos Brochures
73
79
767677
41
38
424343
6060
53
61
69
37
33
28
39
46
2220
31
1716
35
42
3836
31 31
27
33
29
19
Figure 35 Positive influence by channel
27
Marketing Collateral in the Sales CycleThe relationship between collateral and actual sales is an important one How do the various types of collateralmdashwhite papers case studies brochuresmdashimpact sales When should you deliver a white paper case study podcast or video to drive potential purchasers to the next step in the sales cycle Is there a way to time delivery of specific collateral types to nurture leads more effectively
For the purposes of this survey we defined the various stages of the technology evaluation and purchase process as
bull Pre-salemdashConsidering solutions and vendors
bull Initial salemdashReviewing vendor qualifications capabilities and RFP responses
bull Mid-salemdashReviewing details of the solution with one vendor
bull Final salemdashCustomization negotiation and procurement
In our 2008 survey results we saw that respondents most frequently consumed each collateral type for the first time in the pre-sale process by a significant margin that is before they send out RFPs or initiate discussions with specific vendors In that first Eccolo B2B survey white papers were read by 61 percent of respondents during this phase case studies by 48 percent podcasts by 53 percent video by 51 percent and brochuresdata sheets by 62 percent
0
10
20
30
40
50
60
70
Final sales processMid-sales processInitial sales processPre-sales process
White papers Case studies Podcasts Videos Brochures
53
49
41
49
31
3435
30
25
13
21
2018
11
4 3 4 3 4
60
Figure 36 In which phase of the purchasing cycle did you FIRST consume each type of collateral
28
Our 2010 survey indicates that these habits are shifting While the majority of respondents still consume most collateral for the first time in the pre-sales phase more respondents now indicate they first consumed collateral in either the initial sales or mid-sales phases than they did in 2008 For example the percentage of respondents who first consumed a white paper during the pre-sales process dropped to 53 percent the percentage that listened to a podcast dropped down to 41 percent (Figure 36) In both cases respondents appeared to move their first consumption of those types of collateral down to the next two stages of the sales process
When we further segmented the 2010 data to compare the habits of influencers to decision makers we observed some additional interesting trends across the board influencers tend to consume content earlier in the sales cycle than decision makers (Figure 37)
0 10 20 30 40 50 60 70 80
Final salesprocess
Mid-salesprocess
Initial salesprocess
Pre-salesprocess
Final salesprocess
Mid-salesprocess
Initial salesprocess
Pre-salesprocess
White papers Case studies Podcasts Videos Brochures
63
58
41
6458
4752
65
2526
3830
23
915
1417
9
2111
2
4542
3647
56
3339
3430
27
1614
2319
12
65
74
5
25
26
35
20
4
Infl
uen
cers
Deci
sio
n M
akers
Figure 37 In which phase of the purchasing cycle did you FIRST consume each type of collateral (influencers vs decision makers)
29
Likewise respondents from small businesses consume collateral for the first time during the pre-sales stage at much higher rates than respondents from middle-market or large companies For example 70 percent of small businesses consume white papers for the first time during this stage compared to just 40 percent of middle-market firms and 56 percent of large enterprises (Figure 38)
Small Business Mid-market Enterprise
0
10
20
30
40
50
60
70
80
Final sales processMid-sales processInitial Sales ProcessPre-sales Process
70
40
56
16
38
29
9
17
12
5 53
Figure 38 In which phase of the purchasing cycle did you FIRST consume white papers in 2010
As in previous years we find the data around use of collateral in the sales cycle interesting in the way it potentially sheds light on the relationship between influencers and decion makers We believe we are seeing the influencerrsquos role in terms of considering potential technology purchases and the subsequent sharing of that collatera and other information with decision makers a bit later in the cycle
30
BEST PRACTICES FOR THE REAL WORLD
As in previous years we conclude our delivery of the survey results by providing what we consider to be actionable advice that marketing professionals can apply right now to improve the quality and impact of their communications assets
1 Create white papers This is a repeating theme but one that is definitely worth saying once again white papers are frequently consumed and considered highly influential over the technology purchase Take advantage by creating a few well-written papers that clearly outline strategic advancements your solutions and products are aligned with Leverage your work by chunking up the main points into best practice documents blog posts ldquohow tordquo guides and other materials to support your broader campaign needs
2 Embed multimedia files Start with short video or audio clips to keep overall file sizes low but jump on this trend Once you get your feet under you you can advance to interactive charts and graphs Flash elements and other media types Donrsquot ignore the opportunity to be among the first to take advantage of this evolving practice
3 Consider all content to be social content We know that tech purchasers share content and that they consider materials forwarded from a personal contact to be very influential Plan all content and collateral assets from the perspective of stimulating discussion and sharing Think about interactivity links to discussion boards and user groups and point to blog posts and other communications channels in all materials
4 Deliver all content assets digitally and be prepared to have end users print them While the majority of respondents view collateral assets on the desktop a respectable number still enjoy printing out the materials they download and will further share print materials with others Avoid cross-page spreads and column designs that are hard to read digitally and remember to provide clear URLs for any links away from the materials for those reading print versions
5 Merchandise content on the Web Your company Web site is the most frequent location for obtaining content and it ranks second only to personal contacts in terms of influence Make the most of this channel by merchandising featured content and assets on landing pages and microsites that extend the thought leadership and discussion begun in your collateral Remember potential purchasers interact with your content before they interact with you so ensure viewers can easily see all the other channels through which they can engage with you all in one fun-filled information portal
31
CONCLUSIONAs we wrap up this yearrsquos annual survey report we find ourselves coming back to some basic advice that has been a theme of this section in each previous report plan
Eccolo believes that the requirement of content strategymdashidentifying communication topics and thoughtfully planning the assets required to achieve goalsmdashis relevant at every level of the marketing organization The proliferation of online channels and ever more sophisticated lead generation systems require a steady stream of fresh relevant content to successfully engage purchasers Itrsquos very easy to be distracted by looming deadlines and shifting priorities but creating a content strategy and identifying a clear development roadmap that describes topic format and channel is essential if you truly want to improve results
And the opportunity to improve results is significant Well-planned development cycles can shorten time to market reduce costs and ensure a consistent message across all external assets Further organizations that show a healthy respect for content planning and development from the top down will experience the entire enterprise shifting to a more responsive stance These companies are tuned toward deeper customer conversations that align with the end userrsquos preferences for sales and marketing information and by the very style of their collateral assets signal a positive experience for the potential buyer
Engage With UsEccolo Media welcomes your feedback on this report Email us at infoeccolomediacom with specific feedback or visit our blog at httpeccolomediatypepadcom to join in our ongoing discussion of best practices in content strategy
ACKNOWLEDGEMENTSWe would like to acknowledge the participation of the following team members for their efforts in bringing the Eccolo Media 2010 B2B Technology Collateral Survey Report to life Maite Figueroa Alice LaPlante Lorie Loe Courtney Love and Michael Sudol
32
ABOUT ECCOLO MEDIAEccolo Media specializes in strategic marketing insight and content development for some of the worldrsquos best-known technology companies An agency of exceptional writers Eccolo combines deep experience with ongoing research to identify and apply best practices for producing remarkable content The agency helps align clientsrsquo marketing needs with their key business goals by bringing a proactive innovative approach to the planning and execution of collateral in both traditional and new media channels Founded in 2007 Eccolo Media is headquartered in San Francisco California and fulfills a wide range of project needs throughout the Americas and EMEA Visit our Web site at wwweccolomediacom
ABOUT EMEDIA - Our Marketing Sponsoremedia has specialized in generating B2B sales leads and building demand since 1999 We reach more than 35 million decision makers across over 80 niche-oriented audiences within the following B2B areasInformation Technology ElectronicsSupply ChainLogistics Occupational HealthCorporate Finance Environmental ManagementHuman Resources Project ManagementMarketingSales PackagingConvertingB2B Events Construction amp ArchitectsManufacturing Professional DevelopmentSmall Business Design EngineersProcurement Control EngineersHospitality Management PrintingHealthcare Tech
emediarsquos expertise and personal service permit effective implementation of Guaranteed Cost-per-Lead programs for our clientsrsquo offers and collateral Or we can drive highly targeted traffic to clientsrsquo web pages
Contact emedia at 800-782-6167 630-288-8480 or inquiriesemediausacom
ACCELERATED B2B LEAD GENERATION mdash ON DEMAND
wwwemediausacom
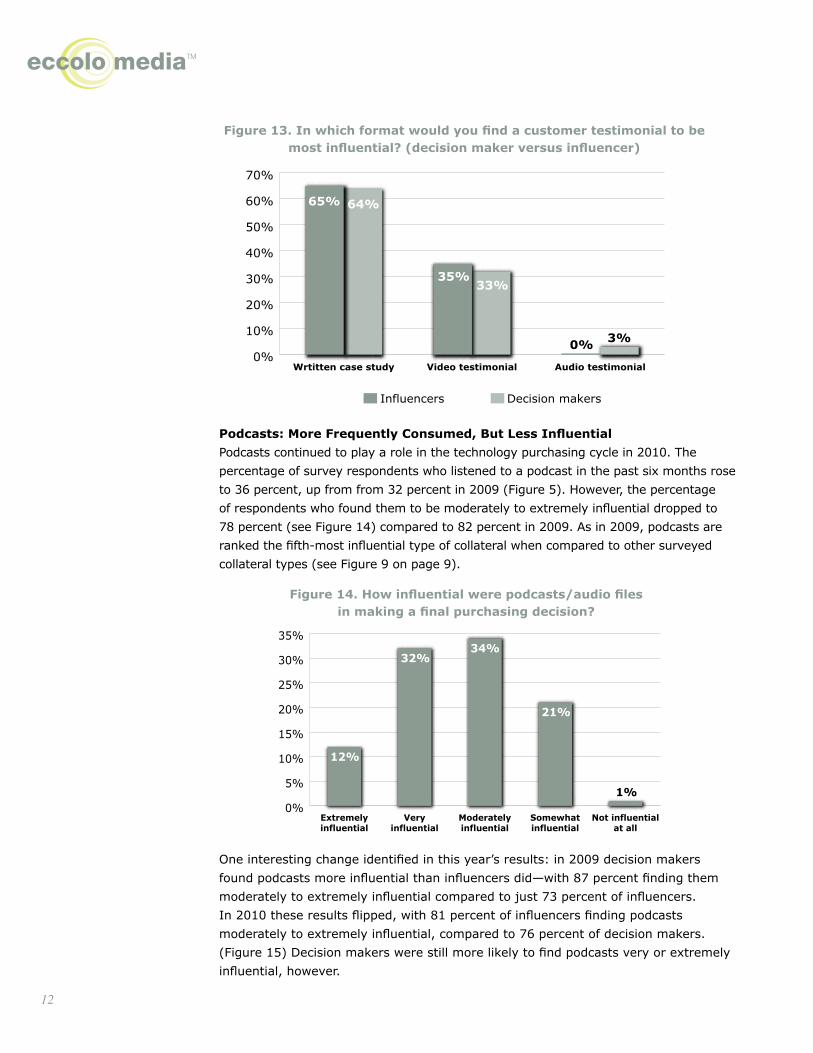
12
Podcasts More Frequently Consumed But Less Influential Podcasts continued to play a role in the technology purchasing cycle in 2010 The percentage of survey respondents who listened to a podcast in the past six months rose to 36 percent up from from 32 percent in 2009 (Figure 5) However the percentage of respondents who found them to be moderately to extremely influential dropped to 78 percent (see Figure 14) compared to 82 percent in 2009 As in 2009 podcasts are ranked the fifth-most influential type of collateral when compared to other surveyed collateral types (see Figure 9 on page 9)
One interesting change identified in this yearrsquos results in 2009 decision makers found podcasts more influential than influencers didmdashwith 87 percent finding them moderately to extremely influential compared to just 73 percent of influencers In 2010 these results flipped with 81 percent of influencers finding podcasts moderately to extremely influential compared to 76 percent of decision makers (Figure 15) Decision makers were still more likely to find podcasts very or extremely influential however
0
5
10
15
20
25
30
35
Not influentialat all
Somewhatinfluential
Moderatelyinfluential
Veryinfluential
Extremelyinfluential
12
3234
21
1
Figure 14 How influential were podcastsaudio files in making a final purchasing decision
0
10
20
30
40
50
60
70
Audio testimonialVideo testimonialWrtitten case study
64
33
65
35
30
Influencers Decision makers
Figure 13 In which format would you find a customer testimonial to be most influential (decision maker versus influencer)
13
In those cases when respondents indicated they had listened to a podcast we asked what type of podcast it had been By far the most common type of podcast consumed was one covering technology trends (78 percent) followed by business trends (55 percent) Forty-five percent listened to information on vendor products andor solutions with the smallest but still significant percentage (39 percent) listening to customer testimonials in that format (Figure 16)
Video Continued Growth in Consumption Our 2010 survey respondents indicated that their use of video when considering technology purchase continues to increase The percentage of respondents who watched a video in the past six months increased eight points to 59 percent This result continues a trend seen in the 2009 survey results when use of video increased from 28 percent in 2008 to 49 percent in 2009 (Figure 17)
Figure 16 What types of podcastaudio files have you listened to in order to evaluate a technology purchase Check all that apply
0
20
40
60
80
OtherInformationon vendor
productssolutions
Businesstrends
Technologytrends
Customertestimonial
1
39
78
55
45
0
10
20
30
40
50
Not influentialat all
Somewhatinfluential
Moderatelyinfluential
Veryinfluential
Extremelyinfluential
28
15
7
35
46
26
17
24
02
Influencers Decision makers
Figure 15 How influential were podcastsaudio files in making a final purchasing decision
14
In 2008 video was ranked fifth in influence when compared to other types of collateral In 2009 it moved into fourth place surpassing podcasts in influence In 2010 it held on to that position (Figure 9 on page 9) When asked how influential the video was on a technology purchase 26 percent of respondents indicated they found videos to be moderately to extremely influential (Figure 18)
We further inquired as to the type of video respondents consumed during a technology purchase Respondents watched more product tutorialsdemos by a wide margin over other types of video collateral (76 percent) Vendor marketing videos were the next most commonly viewed type of video (61 percent) followed by customer testimonials (37 percent) and on-demand webinars (33 percent) as seen in Figure 19
Figure 18 How influential were the videos in making a final purchasing decision
0
10
20
30
40
Not influentialat all
Somewhatinfluential
Moderatelyinfluential
Veryinfluential
Extremelyinfluential
9
39
31
19
2
Figure 17 Have you viewed any videos in the past six months to evaluate a technology purchase
0
20
40
60
80
NoYes
201020092008
28
49 50
72
51 50
15
Brochures and Data Sheets Consumed Most Frequently In 2009 brochures and data sheets were the most frequently consumed of all collateralmdashwith 78 percent of respondents using them to make a purchasing decision over the past six months In 2010 83 percent of respondents consumed these types of collateral But although 79 percent of respondents rated them as moderately to extremely influential when making a technology purchase (Figure 20) they still tend to rank behind white papers and case studies when compared with other collateral types (see Figure 9 on page 9)
As with many other types of collateral large enterprises were more likely to consume brochures than small companies (less than 100 employees) with mid-sized companies falling in between
This year we continue to recommend that brochures and data sheets be a part of every marketerrsquos collateral toolbox precisely because they are so frequently
Figure 20 How influential were brochuresdata sheets in making a final purchasing decision
0
10
20
30
40
50
Not influentialat all
Somewhatinfluential
Moderatelyinfluential
Veryinfluential
Extremelyinfluential
8
31
40
18
3
0
10
20
30
40
50
60
70
80
OtherProducttutorials demos
On-demandwebinars
Vendormarketing
videos
Customertestimonials
37
61
2
76
33
Figure 19 What types of video files have you listened to in order to evaluate a technology purchase
16
consumed We also reiterate our advice that it might not be strategically wise to rely solely on this type of collateral given that their perceived influence is lower than some other collateral types Rather brochures and data sheets should be ldquomust-haverdquo assets in a well-rounded collateral portfolio that includes a broad variety of other content types
How Technology Purchasers Consume ContentAs in previous years we devoted significant time to analyzing how technology purchasers consume and use collateral In this section we share our results plus our insight into what respondents believe makes ldquogoodrdquo collateral
Most Collateral Still Consumed Digitally One surprise in this yearrsquos survey results was that although respondents still have an overwhelming preference for consuming written content on the desktop rather than printing it out that number actually declined across all types of written collateral (Figure 21) For example in 2009 a full three-fourths (76 percent) of respondents read white papers digitally a similar percentage (77 percent) did the same with brochuresdata sheets and even more (84 percent) consumed case studies in this form Yet in 2010 these numbers declined The percentage that read white papers digitally dropped 15 full percentage points to 61 percent The percent of respondents who indicated that they preferred to consume brochuressdata sheets in digital form declined only slightly but just 71 percent of respondents said they preferred to consume case studies in digital formmdash10 percentage points less than in 2009
We also found significant changes in whether respondents downloaded audio files onto their desktops or mobile devices or listened to audio streams from Web sites In 2009 62 percent preferred to download audio files onto their desktop or mobile devices versus 38 percent that preferred to stream directly from a Web site Yet in
Figure 21 Did you view this collateral online or did you downloadprint before reading (2009 vs 2010)
0
20
40
60
80
100
Brochuresdata sheetsCase studiessuccess storiesWhite paper
Downloaded printed 2010
Downloaded printed 2009
Viewedonline 2010
Viewedonline 2009
76
61
24
39
84
74
16
26
77
71
23
29
17
2010 these numbers shifted substantially toward a preference for streaming this year 57 percent of respondents preferred streaming versus 43 percent that favored downloading these types of files
This brings the method of consumption of audio files more in line with respondentsrsquo preferences for streaming video Sixty-four percent of 2010 respondents preferred to watch video streamed live from the source versus 36 percent that preferred to download it to a desktop or mobile device (Figure 22)
However whether streamed or downloaded 92 percent of podcast listeners and 96 percent of video viewers still consumed content on the desktop This is a critical finding that has remained consistent from year to year given that the desktop is the platform of choice for consuming all types of content marketers should ensure that all written content leverages links to other files and other communication channels as much as possible giving technology purchasers the option of drilling down to more details as desired
All Collateral Has Viral PotentialWe continue to be interested in the fact that all collateral is highly viral Technology purchasers routinely share collateral with the vast majority of 2010 respondents (89 percent) sharing the white papers they read with others as seen in Figure 23 Nearly as many (87 percent) share case studies followed by podcasts (84 percent) and then brochuresdata sheets and video (80 percent each)
White papers are still the most viral with 34 percent of respondents sharing them with three or more people Thirty-two percent of respondents shared podcasts with three or more people and 28 percent shared case studies with as many Lagging slightly behind were video (25 percent) and brochuresdata sheets (23 percent)
0
20
40
60
80
Downloaded tomobile device
then listented toviewed
Downloaded todesktop
then listened
Streamed fromlive source
5764
35 32
84
Podcasts Videos
Figure 22 Did you consume this content online or did you download before viewinglistening
18
Another interesting development although all collateral is shared primarily in digital form more 2010 respondents say that they share written collateralmdashwhite papers case studies and brochuresdata sheetsmdashin both digital and printed forms (Figure 24) than did respondents to the 2009 survey For example whereas the percentage of respondents who shared digitalelectronic versions of white papers actually declined in the past yearmdashfrom 60 percent to 51 percentmdashthe percentage of respondents who shared white papers in both digital and printed form increased from 30 percent to 37 percent We therefore caution marketers not to discount the viral nature of hard copy content as it clearly still is considered useful by a significant percentage of respondents
In 2009 influencers were more likely to share only digital copy and decision makers were more likely to share both printed and digital content However in 2010 this is no longer the case and these two respondent types are now in parity on this issue
0
5
10
15
20
25
30
35
White papers Case studies Podcasts Videos Brochures
5 or more
43210
11
13
16
20 20
23
28
25 25
30
33
31
27
30
19
14
17
12
6 6
9
7
5
8 8
6 6 6
12
27
Figure 23 On average how many other decision makers or influencers in your organization did you share each piece of collateral with
19
Preferences For Length Are ChangingEccolo Media has established best practices for serving up marketing collateral in small well-written packages Our survey results over the past three years have reinforced our belief that this serves marketers best However this year we observed subtleties in the survey results that indicated respondents may be adjusting their preferences for longer collateral length
White papersWersquove stated repeatedly that white papers are a highly influential collateral consumed at a high frequency by both decision makers and influencers But marketing communications professionals continue to debate the ideal length of a white paper how do they give the right amount of informationmdashnot too much and not too little As Figure 25 shows the majority of respondents (55 percent) felt six pages or less to be the ideal number However this percentage is 10 points less than last yearrsquos 65 percent
Figure 25 What do you feel is the ideal length for a white paper in number of pages
0
10
20
30
40
50
More than10 pages
10 pages8 pages6 pages4 pages
21
34
27
13
5
Figure 24 In what format did you share collateral
0
10
20
30
40
50
60
70
BrochuresCasestudies
Whitepapers
51
37
52
12
35
12
49
19
32
Digitalelectronic version Hard copy Both
20
Simultaneously the percentage of respondents who preferred white papers of just four pages dropped from 24 percent down to 21 percent and the percentage of respondents who leaned toward eight pages increased from 21 percent to 27 percent This indicates that the ldquoideal lengthrdquo is shifting toward longer rather than shorter white papers
There were no general differences in length preferences between decision makers and influencers but technology purchasers from small companies tend to prefer shorter white papers with 31 percent preferring four pages or less compared to 19 percent of enterprise and 18 percent of mid-market companies that said the same
Case StudiesIn 2008 most respondents reported the ideal length of a case study to be two pages or approximately 800 to 1000 words Yet in 2009 we received different responses That year the largest proportion of respondents (39 percent) indicated that four is the ideal number of pages for a written case study This yearrsquos 2010 survey backed up last yearrsquos numbers with 37 percent preferring four pages and virtually identical percentages of respondents preferring two pages or less (35 percent) or six pages or more (28 percent) as seen in Figure 26
In general the larger the company the longer they prefer their case studies to be with the largest percentage of respondents from small companies (33 percent) preferring two-page case studies the largest percentage from middle-market firms (40 percent) and large enterprises (39 percent) preferring four-page case studies
Figure 26 What do you feel is the ideal number of pages for a case studysuccess story
0
10
20
30
40
50
More than6 pages
6 pages4 pages2 pages1 page
8
27
37
19
9
21
Podcasts The ideal length of a podcast decreased in 2010 Figure 27 shows that the greatest number of respondents (36 percent) selected five to seven minutes as the ideal length Most respondents (81 percent) prefer podcasts that are 10 minutes or less in length and in general the smaller the company the shorter they prefer their podcasts to be
Video The majority of 2010 respondents (38 percent) indicated that the ideal length of video content is five to seven minutes while 24 percent preferred videos of eight to 10 minutes (Figure 28) These results indicate a slight trending to shorter videos over the 2009 respondentrsquos preferences for length where 31 percent preferred five to seven minutes and 28 percent preferred eight to 10 minutes
Figure 28 What do you feel is the ideal length of a video in number of minutes
0
10
20
30
40
More than15 minutes
11 to 15minutes
8 to 10minutes
5 to 7minutes
2 to 4minutes
Less than2 minutes
6 5
19
38
24
8
Figure 27 What do you feel is the ideal length of a podcastaudio file in number of minutes
0
10
20
30
40
More than15 minutes
11 to 15minutes
8 to 10minutes
5 to 7minutes
2 to 4minutes
Less than2 minutes
4
15
36
26
13
6
22
The Emergence of Embedded Audio and Video in Written Collateral Over the past 12 months Eccolo has participated in an emerging trend in marketing collateral embedding audio and video files into digital versions of written documents such as white papers and case studies We therefore asked respondents if they had consumed any written collateral that contained embedded audio andor video files A significant proportion of themmdash45 percentmdashsaid they had done so
Respondents were most likely to encounter embedded files in case studies (66 percent) followed by white papers (55 percent) and brochures (48 percent) (Figure 29)
Perhaps the most dramatic of our findings in this part of the survey was the overwhelming percentage of respondents who clicked through to these embedded files 93 percent Twenty-five percent clicked through to video files six percent clicked through to audio files and 62 percent clicked through to both audio and video (Figure 30)
And most importantly when respondents were asked whether the inclusion of audio or video files positively or negatively affected the overall influence of the written collateral 80 percent indicated that they viewed it either ldquovery positivelyrdquo or ldquopositivelyrdquo (Figure 31)
0
10
20
30
40
50
60
70
80
OtherBrochuresCase studiesWhite paper
55
66
48
1
Figure 29 Which types of written collateral have you consumed that included embedded audio or video
23
In particular decision makers felt this trend was positive 83 percent ranked it as very positively or positively affecting the overall influence of the written collateral compared to 74 percent of influencers (Figure 32)
The size of company also mattered when it came to the perceived influence of embedded files with enterprises more likely to indicate that it was very positive (26 percent) compared to middle-market (14 percent) or small firms (15 percent) On a related note small businesses were more likely to say that embedded files had no influence at allmdash33 percent versus 15 percent of middle-market and 15 percent of enterprise firms (Figure 33)
0
10
20
30
40
50
60
70
80
NeitherBoth audiovideoAudio onlyVideo only
25
6
62
7
Figure 30 Did you click through or open any of the video or audio files embedded in the collateral
0
10
20
30
40
50
60
70
Very negativelyNegativelyNo influencePositivelyVery positively
18
62
18
1 1
Figure 31 How did the inclusion of embedded audio and video files affect the overall influence of the written collateral
24
These results support Eccolorsquos belief that interactivity is becoming ldquotable stakesrdquo for written marketing communications collateral Given the preference that purchasers have already expressed for consuming collateral at their desktop (see Figure 22) marketers that donrsquot experiment with embedded ausio video and other multimedia formats as well as links off to other communications and social media channels risk delivering assets that seem obsolete and old-fashioned
Figure 32 How did the inclusion of embedded audio and video files affect the overall influence of the written collateral
(decision makers versus influencers)
0
20
40
60
80
Very NegativelyNegativelyNo InfluencePositivelyVery Positively
24
59
66
15
26
1 0 018
Decision maker Influencer
0
10
20
30
40
50
60
70
80
Very negativelyNegativelyNo influencePositivelyVery positively
15 14
26
52
69
59
33
15 15
0 1 0 0 1 0
Small business Mid-market Enterprise
Figure 33 How did the inclusion of embedded audio and video files affect the overall influence of the written collateral
(small business vs mid-market vs enterprise)
25
The Channel EffectLast year we added a section to our annual survey that investigated how channel affects the perceived influence of collateral We defined channel as the specific avenue through which the respondent receives contentmdashwhether from a personal contact from a corporate Web site or from a sales representative for example
One fact immediately stood out in 2009 most respondents receive written collateral through the corporate Web site (Figure 34) This did not change in 2010 with 71 percent of respondents finding white papers through such sites 65 percent getting brochuresdata sheets through that channel and 56 percent acquiring case studies in that way
The next most frequently used channel for receiving a white paper in 2010 was a download from a direct response campaign (59 percent) which implies that this should be considered an important means of distribution for marketers This was followed by forwarded by a sales repcompany contact (54 percent) obtained from a personal contact (52 percent) accessed via social media (39 percent) and absorbed through webinars (34 percent) In 2009 podcasts and video collateral differed from written content when it came to how respondents ldquofoundrdquo them but that difference
0
10
20
30
40
50
60
70
80
Mentioned ina webinar
Linked to ordiscussed in
onlinesocial media
Linked in toan RSS feed
Forwarded bysales rep
company contact
BrowsingcorporateWeb site
Downloadedfrom
direct responsecampaign
Forwardedfrom
personalcontact
White papers Case studies Podcasts Videos Brochures
5253
46
34
37
59
71
5655
6665
54
4241
38
27
23
31
39
31
39
29
23
34
20
23
20
12
21
15
44
38
45
34 34
Figure 34 Through which channels have you received collateral
26
has vanished Last year podcasts were almost equally acquired from a personal contact or from a corporate Web site (48 percent and 49 percent respectively) However this year the corporate Web site trumped the personal contact channel (55 percent to 46 percent) And this was even more dramatically the case for video with only 34 percent of respondents indicating they had been forwarded a video by a personal contact while 66 percent found video on corporate Web sites This trend underscores the importance of the corporate Web site across all collateral types
When we examined the comparative influence of these various channels another interesting fact emerged although a piece of collateral referred to or forwarded by a personal contact was most frequently cited as the most influential channel for all types of collateral browsing the corporate Web site was the second most frequently cited answer (Figure 35) When you consider that the corporate Web site is clearly the most frequently used channel for collateral delivery coupled with its high perceived influence you understand why we recommend that you make investing in and frequently refreshing your Web site a priority
0
10
20
30
40
50
60
70
80
Mentioned ina webinar
Linked to ordiscussed in
onlinesocial media
Linked in toan RSS feed
Forwarded bysales rep
company contact
BrowsingcorporateWeb site
Downloadedfrom
direct responsecampaign
Forwardedfrom
personalcontact
White papers Case studies Podcasts Videos Brochures
73
79
767677
41
38
424343
6060
53
61
69
37
33
28
39
46
2220
31
1716
35
42
3836
31 31
27
33
29
19
Figure 35 Positive influence by channel
27
Marketing Collateral in the Sales CycleThe relationship between collateral and actual sales is an important one How do the various types of collateralmdashwhite papers case studies brochuresmdashimpact sales When should you deliver a white paper case study podcast or video to drive potential purchasers to the next step in the sales cycle Is there a way to time delivery of specific collateral types to nurture leads more effectively
For the purposes of this survey we defined the various stages of the technology evaluation and purchase process as
bull Pre-salemdashConsidering solutions and vendors
bull Initial salemdashReviewing vendor qualifications capabilities and RFP responses
bull Mid-salemdashReviewing details of the solution with one vendor
bull Final salemdashCustomization negotiation and procurement
In our 2008 survey results we saw that respondents most frequently consumed each collateral type for the first time in the pre-sale process by a significant margin that is before they send out RFPs or initiate discussions with specific vendors In that first Eccolo B2B survey white papers were read by 61 percent of respondents during this phase case studies by 48 percent podcasts by 53 percent video by 51 percent and brochuresdata sheets by 62 percent
0
10
20
30
40
50
60
70
Final sales processMid-sales processInitial sales processPre-sales process
White papers Case studies Podcasts Videos Brochures
53
49
41
49
31
3435
30
25
13
21
2018
11
4 3 4 3 4
60
Figure 36 In which phase of the purchasing cycle did you FIRST consume each type of collateral
28
Our 2010 survey indicates that these habits are shifting While the majority of respondents still consume most collateral for the first time in the pre-sales phase more respondents now indicate they first consumed collateral in either the initial sales or mid-sales phases than they did in 2008 For example the percentage of respondents who first consumed a white paper during the pre-sales process dropped to 53 percent the percentage that listened to a podcast dropped down to 41 percent (Figure 36) In both cases respondents appeared to move their first consumption of those types of collateral down to the next two stages of the sales process
When we further segmented the 2010 data to compare the habits of influencers to decision makers we observed some additional interesting trends across the board influencers tend to consume content earlier in the sales cycle than decision makers (Figure 37)
0 10 20 30 40 50 60 70 80
Final salesprocess
Mid-salesprocess
Initial salesprocess
Pre-salesprocess
Final salesprocess
Mid-salesprocess
Initial salesprocess
Pre-salesprocess
White papers Case studies Podcasts Videos Brochures
63
58
41
6458
4752
65
2526
3830
23
915
1417
9
2111
2
4542
3647
56
3339
3430
27
1614
2319
12
65
74
5
25
26
35
20
4
Infl
uen
cers
Deci
sio
n M
akers
Figure 37 In which phase of the purchasing cycle did you FIRST consume each type of collateral (influencers vs decision makers)
29
Likewise respondents from small businesses consume collateral for the first time during the pre-sales stage at much higher rates than respondents from middle-market or large companies For example 70 percent of small businesses consume white papers for the first time during this stage compared to just 40 percent of middle-market firms and 56 percent of large enterprises (Figure 38)
Small Business Mid-market Enterprise
0
10
20
30
40
50
60
70
80
Final sales processMid-sales processInitial Sales ProcessPre-sales Process
70
40
56
16
38
29
9
17
12
5 53
Figure 38 In which phase of the purchasing cycle did you FIRST consume white papers in 2010
As in previous years we find the data around use of collateral in the sales cycle interesting in the way it potentially sheds light on the relationship between influencers and decion makers We believe we are seeing the influencerrsquos role in terms of considering potential technology purchases and the subsequent sharing of that collatera and other information with decision makers a bit later in the cycle
30
BEST PRACTICES FOR THE REAL WORLD
As in previous years we conclude our delivery of the survey results by providing what we consider to be actionable advice that marketing professionals can apply right now to improve the quality and impact of their communications assets
1 Create white papers This is a repeating theme but one that is definitely worth saying once again white papers are frequently consumed and considered highly influential over the technology purchase Take advantage by creating a few well-written papers that clearly outline strategic advancements your solutions and products are aligned with Leverage your work by chunking up the main points into best practice documents blog posts ldquohow tordquo guides and other materials to support your broader campaign needs
2 Embed multimedia files Start with short video or audio clips to keep overall file sizes low but jump on this trend Once you get your feet under you you can advance to interactive charts and graphs Flash elements and other media types Donrsquot ignore the opportunity to be among the first to take advantage of this evolving practice
3 Consider all content to be social content We know that tech purchasers share content and that they consider materials forwarded from a personal contact to be very influential Plan all content and collateral assets from the perspective of stimulating discussion and sharing Think about interactivity links to discussion boards and user groups and point to blog posts and other communications channels in all materials
4 Deliver all content assets digitally and be prepared to have end users print them While the majority of respondents view collateral assets on the desktop a respectable number still enjoy printing out the materials they download and will further share print materials with others Avoid cross-page spreads and column designs that are hard to read digitally and remember to provide clear URLs for any links away from the materials for those reading print versions
5 Merchandise content on the Web Your company Web site is the most frequent location for obtaining content and it ranks second only to personal contacts in terms of influence Make the most of this channel by merchandising featured content and assets on landing pages and microsites that extend the thought leadership and discussion begun in your collateral Remember potential purchasers interact with your content before they interact with you so ensure viewers can easily see all the other channels through which they can engage with you all in one fun-filled information portal
31
CONCLUSIONAs we wrap up this yearrsquos annual survey report we find ourselves coming back to some basic advice that has been a theme of this section in each previous report plan
Eccolo believes that the requirement of content strategymdashidentifying communication topics and thoughtfully planning the assets required to achieve goalsmdashis relevant at every level of the marketing organization The proliferation of online channels and ever more sophisticated lead generation systems require a steady stream of fresh relevant content to successfully engage purchasers Itrsquos very easy to be distracted by looming deadlines and shifting priorities but creating a content strategy and identifying a clear development roadmap that describes topic format and channel is essential if you truly want to improve results
And the opportunity to improve results is significant Well-planned development cycles can shorten time to market reduce costs and ensure a consistent message across all external assets Further organizations that show a healthy respect for content planning and development from the top down will experience the entire enterprise shifting to a more responsive stance These companies are tuned toward deeper customer conversations that align with the end userrsquos preferences for sales and marketing information and by the very style of their collateral assets signal a positive experience for the potential buyer
Engage With UsEccolo Media welcomes your feedback on this report Email us at infoeccolomediacom with specific feedback or visit our blog at httpeccolomediatypepadcom to join in our ongoing discussion of best practices in content strategy
ACKNOWLEDGEMENTSWe would like to acknowledge the participation of the following team members for their efforts in bringing the Eccolo Media 2010 B2B Technology Collateral Survey Report to life Maite Figueroa Alice LaPlante Lorie Loe Courtney Love and Michael Sudol
32
ABOUT ECCOLO MEDIAEccolo Media specializes in strategic marketing insight and content development for some of the worldrsquos best-known technology companies An agency of exceptional writers Eccolo combines deep experience with ongoing research to identify and apply best practices for producing remarkable content The agency helps align clientsrsquo marketing needs with their key business goals by bringing a proactive innovative approach to the planning and execution of collateral in both traditional and new media channels Founded in 2007 Eccolo Media is headquartered in San Francisco California and fulfills a wide range of project needs throughout the Americas and EMEA Visit our Web site at wwweccolomediacom
ABOUT EMEDIA - Our Marketing Sponsoremedia has specialized in generating B2B sales leads and building demand since 1999 We reach more than 35 million decision makers across over 80 niche-oriented audiences within the following B2B areasInformation Technology ElectronicsSupply ChainLogistics Occupational HealthCorporate Finance Environmental ManagementHuman Resources Project ManagementMarketingSales PackagingConvertingB2B Events Construction amp ArchitectsManufacturing Professional DevelopmentSmall Business Design EngineersProcurement Control EngineersHospitality Management PrintingHealthcare Tech
emediarsquos expertise and personal service permit effective implementation of Guaranteed Cost-per-Lead programs for our clientsrsquo offers and collateral Or we can drive highly targeted traffic to clientsrsquo web pages
Contact emedia at 800-782-6167 630-288-8480 or inquiriesemediausacom
ACCELERATED B2B LEAD GENERATION mdash ON DEMAND
wwwemediausacom

13
In those cases when respondents indicated they had listened to a podcast we asked what type of podcast it had been By far the most common type of podcast consumed was one covering technology trends (78 percent) followed by business trends (55 percent) Forty-five percent listened to information on vendor products andor solutions with the smallest but still significant percentage (39 percent) listening to customer testimonials in that format (Figure 16)
Video Continued Growth in Consumption Our 2010 survey respondents indicated that their use of video when considering technology purchase continues to increase The percentage of respondents who watched a video in the past six months increased eight points to 59 percent This result continues a trend seen in the 2009 survey results when use of video increased from 28 percent in 2008 to 49 percent in 2009 (Figure 17)
Figure 16 What types of podcastaudio files have you listened to in order to evaluate a technology purchase Check all that apply
0
20
40
60
80
OtherInformationon vendor
productssolutions
Businesstrends
Technologytrends
Customertestimonial
1
39
78
55
45
0
10
20
30
40
50
Not influentialat all
Somewhatinfluential
Moderatelyinfluential
Veryinfluential
Extremelyinfluential
28
15
7
35
46
26
17
24
02
Influencers Decision makers
Figure 15 How influential were podcastsaudio files in making a final purchasing decision
14
In 2008 video was ranked fifth in influence when compared to other types of collateral In 2009 it moved into fourth place surpassing podcasts in influence In 2010 it held on to that position (Figure 9 on page 9) When asked how influential the video was on a technology purchase 26 percent of respondents indicated they found videos to be moderately to extremely influential (Figure 18)
We further inquired as to the type of video respondents consumed during a technology purchase Respondents watched more product tutorialsdemos by a wide margin over other types of video collateral (76 percent) Vendor marketing videos were the next most commonly viewed type of video (61 percent) followed by customer testimonials (37 percent) and on-demand webinars (33 percent) as seen in Figure 19
Figure 18 How influential were the videos in making a final purchasing decision
0
10
20
30
40
Not influentialat all
Somewhatinfluential
Moderatelyinfluential
Veryinfluential
Extremelyinfluential
9
39
31
19
2
Figure 17 Have you viewed any videos in the past six months to evaluate a technology purchase
0
20
40
60
80
NoYes
201020092008
28
49 50
72
51 50
15
Brochures and Data Sheets Consumed Most Frequently In 2009 brochures and data sheets were the most frequently consumed of all collateralmdashwith 78 percent of respondents using them to make a purchasing decision over the past six months In 2010 83 percent of respondents consumed these types of collateral But although 79 percent of respondents rated them as moderately to extremely influential when making a technology purchase (Figure 20) they still tend to rank behind white papers and case studies when compared with other collateral types (see Figure 9 on page 9)
As with many other types of collateral large enterprises were more likely to consume brochures than small companies (less than 100 employees) with mid-sized companies falling in between
This year we continue to recommend that brochures and data sheets be a part of every marketerrsquos collateral toolbox precisely because they are so frequently
Figure 20 How influential were brochuresdata sheets in making a final purchasing decision
0
10
20
30
40
50
Not influentialat all
Somewhatinfluential
Moderatelyinfluential
Veryinfluential
Extremelyinfluential
8
31
40
18
3
0
10
20
30
40
50
60
70
80
OtherProducttutorials demos
On-demandwebinars
Vendormarketing
videos
Customertestimonials
37
61
2
76
33
Figure 19 What types of video files have you listened to in order to evaluate a technology purchase
16
consumed We also reiterate our advice that it might not be strategically wise to rely solely on this type of collateral given that their perceived influence is lower than some other collateral types Rather brochures and data sheets should be ldquomust-haverdquo assets in a well-rounded collateral portfolio that includes a broad variety of other content types
How Technology Purchasers Consume ContentAs in previous years we devoted significant time to analyzing how technology purchasers consume and use collateral In this section we share our results plus our insight into what respondents believe makes ldquogoodrdquo collateral
Most Collateral Still Consumed Digitally One surprise in this yearrsquos survey results was that although respondents still have an overwhelming preference for consuming written content on the desktop rather than printing it out that number actually declined across all types of written collateral (Figure 21) For example in 2009 a full three-fourths (76 percent) of respondents read white papers digitally a similar percentage (77 percent) did the same with brochuresdata sheets and even more (84 percent) consumed case studies in this form Yet in 2010 these numbers declined The percentage that read white papers digitally dropped 15 full percentage points to 61 percent The percent of respondents who indicated that they preferred to consume brochuressdata sheets in digital form declined only slightly but just 71 percent of respondents said they preferred to consume case studies in digital formmdash10 percentage points less than in 2009
We also found significant changes in whether respondents downloaded audio files onto their desktops or mobile devices or listened to audio streams from Web sites In 2009 62 percent preferred to download audio files onto their desktop or mobile devices versus 38 percent that preferred to stream directly from a Web site Yet in
Figure 21 Did you view this collateral online or did you downloadprint before reading (2009 vs 2010)
0
20
40
60
80
100
Brochuresdata sheetsCase studiessuccess storiesWhite paper
Downloaded printed 2010
Downloaded printed 2009
Viewedonline 2010
Viewedonline 2009
76
61
24
39
84
74
16
26
77
71
23
29
17
2010 these numbers shifted substantially toward a preference for streaming this year 57 percent of respondents preferred streaming versus 43 percent that favored downloading these types of files
This brings the method of consumption of audio files more in line with respondentsrsquo preferences for streaming video Sixty-four percent of 2010 respondents preferred to watch video streamed live from the source versus 36 percent that preferred to download it to a desktop or mobile device (Figure 22)
However whether streamed or downloaded 92 percent of podcast listeners and 96 percent of video viewers still consumed content on the desktop This is a critical finding that has remained consistent from year to year given that the desktop is the platform of choice for consuming all types of content marketers should ensure that all written content leverages links to other files and other communication channels as much as possible giving technology purchasers the option of drilling down to more details as desired
All Collateral Has Viral PotentialWe continue to be interested in the fact that all collateral is highly viral Technology purchasers routinely share collateral with the vast majority of 2010 respondents (89 percent) sharing the white papers they read with others as seen in Figure 23 Nearly as many (87 percent) share case studies followed by podcasts (84 percent) and then brochuresdata sheets and video (80 percent each)
White papers are still the most viral with 34 percent of respondents sharing them with three or more people Thirty-two percent of respondents shared podcasts with three or more people and 28 percent shared case studies with as many Lagging slightly behind were video (25 percent) and brochuresdata sheets (23 percent)
0
20
40
60
80
Downloaded tomobile device
then listented toviewed
Downloaded todesktop
then listened
Streamed fromlive source
5764
35 32
84
Podcasts Videos
Figure 22 Did you consume this content online or did you download before viewinglistening
18
Another interesting development although all collateral is shared primarily in digital form more 2010 respondents say that they share written collateralmdashwhite papers case studies and brochuresdata sheetsmdashin both digital and printed forms (Figure 24) than did respondents to the 2009 survey For example whereas the percentage of respondents who shared digitalelectronic versions of white papers actually declined in the past yearmdashfrom 60 percent to 51 percentmdashthe percentage of respondents who shared white papers in both digital and printed form increased from 30 percent to 37 percent We therefore caution marketers not to discount the viral nature of hard copy content as it clearly still is considered useful by a significant percentage of respondents
In 2009 influencers were more likely to share only digital copy and decision makers were more likely to share both printed and digital content However in 2010 this is no longer the case and these two respondent types are now in parity on this issue
0
5
10
15
20
25
30
35
White papers Case studies Podcasts Videos Brochures
5 or more
43210
11
13
16
20 20
23
28
25 25
30
33
31
27
30
19
14
17
12
6 6
9
7
5
8 8
6 6 6
12
27
Figure 23 On average how many other decision makers or influencers in your organization did you share each piece of collateral with
19
Preferences For Length Are ChangingEccolo Media has established best practices for serving up marketing collateral in small well-written packages Our survey results over the past three years have reinforced our belief that this serves marketers best However this year we observed subtleties in the survey results that indicated respondents may be adjusting their preferences for longer collateral length
White papersWersquove stated repeatedly that white papers are a highly influential collateral consumed at a high frequency by both decision makers and influencers But marketing communications professionals continue to debate the ideal length of a white paper how do they give the right amount of informationmdashnot too much and not too little As Figure 25 shows the majority of respondents (55 percent) felt six pages or less to be the ideal number However this percentage is 10 points less than last yearrsquos 65 percent
Figure 25 What do you feel is the ideal length for a white paper in number of pages
0
10
20
30
40
50
More than10 pages
10 pages8 pages6 pages4 pages
21
34
27
13
5
Figure 24 In what format did you share collateral
0
10
20
30
40
50
60
70
BrochuresCasestudies
Whitepapers
51
37
52
12
35
12
49
19
32
Digitalelectronic version Hard copy Both
20
Simultaneously the percentage of respondents who preferred white papers of just four pages dropped from 24 percent down to 21 percent and the percentage of respondents who leaned toward eight pages increased from 21 percent to 27 percent This indicates that the ldquoideal lengthrdquo is shifting toward longer rather than shorter white papers
There were no general differences in length preferences between decision makers and influencers but technology purchasers from small companies tend to prefer shorter white papers with 31 percent preferring four pages or less compared to 19 percent of enterprise and 18 percent of mid-market companies that said the same
Case StudiesIn 2008 most respondents reported the ideal length of a case study to be two pages or approximately 800 to 1000 words Yet in 2009 we received different responses That year the largest proportion of respondents (39 percent) indicated that four is the ideal number of pages for a written case study This yearrsquos 2010 survey backed up last yearrsquos numbers with 37 percent preferring four pages and virtually identical percentages of respondents preferring two pages or less (35 percent) or six pages or more (28 percent) as seen in Figure 26
In general the larger the company the longer they prefer their case studies to be with the largest percentage of respondents from small companies (33 percent) preferring two-page case studies the largest percentage from middle-market firms (40 percent) and large enterprises (39 percent) preferring four-page case studies
Figure 26 What do you feel is the ideal number of pages for a case studysuccess story
0
10
20
30
40
50
More than6 pages
6 pages4 pages2 pages1 page
8
27
37
19
9
21
Podcasts The ideal length of a podcast decreased in 2010 Figure 27 shows that the greatest number of respondents (36 percent) selected five to seven minutes as the ideal length Most respondents (81 percent) prefer podcasts that are 10 minutes or less in length and in general the smaller the company the shorter they prefer their podcasts to be
Video The majority of 2010 respondents (38 percent) indicated that the ideal length of video content is five to seven minutes while 24 percent preferred videos of eight to 10 minutes (Figure 28) These results indicate a slight trending to shorter videos over the 2009 respondentrsquos preferences for length where 31 percent preferred five to seven minutes and 28 percent preferred eight to 10 minutes
Figure 28 What do you feel is the ideal length of a video in number of minutes
0
10
20
30
40
More than15 minutes
11 to 15minutes
8 to 10minutes
5 to 7minutes
2 to 4minutes
Less than2 minutes
6 5
19
38
24
8
Figure 27 What do you feel is the ideal length of a podcastaudio file in number of minutes
0
10
20
30
40
More than15 minutes
11 to 15minutes
8 to 10minutes
5 to 7minutes
2 to 4minutes
Less than2 minutes
4
15
36
26
13
6
22
The Emergence of Embedded Audio and Video in Written Collateral Over the past 12 months Eccolo has participated in an emerging trend in marketing collateral embedding audio and video files into digital versions of written documents such as white papers and case studies We therefore asked respondents if they had consumed any written collateral that contained embedded audio andor video files A significant proportion of themmdash45 percentmdashsaid they had done so
Respondents were most likely to encounter embedded files in case studies (66 percent) followed by white papers (55 percent) and brochures (48 percent) (Figure 29)
Perhaps the most dramatic of our findings in this part of the survey was the overwhelming percentage of respondents who clicked through to these embedded files 93 percent Twenty-five percent clicked through to video files six percent clicked through to audio files and 62 percent clicked through to both audio and video (Figure 30)
And most importantly when respondents were asked whether the inclusion of audio or video files positively or negatively affected the overall influence of the written collateral 80 percent indicated that they viewed it either ldquovery positivelyrdquo or ldquopositivelyrdquo (Figure 31)
0
10
20
30
40
50
60
70
80
OtherBrochuresCase studiesWhite paper
55
66
48
1
Figure 29 Which types of written collateral have you consumed that included embedded audio or video
23
In particular decision makers felt this trend was positive 83 percent ranked it as very positively or positively affecting the overall influence of the written collateral compared to 74 percent of influencers (Figure 32)
The size of company also mattered when it came to the perceived influence of embedded files with enterprises more likely to indicate that it was very positive (26 percent) compared to middle-market (14 percent) or small firms (15 percent) On a related note small businesses were more likely to say that embedded files had no influence at allmdash33 percent versus 15 percent of middle-market and 15 percent of enterprise firms (Figure 33)
0
10
20
30
40
50
60
70
80
NeitherBoth audiovideoAudio onlyVideo only
25
6
62
7
Figure 30 Did you click through or open any of the video or audio files embedded in the collateral
0
10
20
30
40
50
60
70
Very negativelyNegativelyNo influencePositivelyVery positively
18
62
18
1 1
Figure 31 How did the inclusion of embedded audio and video files affect the overall influence of the written collateral
24
These results support Eccolorsquos belief that interactivity is becoming ldquotable stakesrdquo for written marketing communications collateral Given the preference that purchasers have already expressed for consuming collateral at their desktop (see Figure 22) marketers that donrsquot experiment with embedded ausio video and other multimedia formats as well as links off to other communications and social media channels risk delivering assets that seem obsolete and old-fashioned
Figure 32 How did the inclusion of embedded audio and video files affect the overall influence of the written collateral
(decision makers versus influencers)
0
20
40
60
80
Very NegativelyNegativelyNo InfluencePositivelyVery Positively
24
59
66
15
26
1 0 018
Decision maker Influencer
0
10
20
30
40
50
60
70
80
Very negativelyNegativelyNo influencePositivelyVery positively
15 14
26
52
69
59
33
15 15
0 1 0 0 1 0
Small business Mid-market Enterprise
Figure 33 How did the inclusion of embedded audio and video files affect the overall influence of the written collateral
(small business vs mid-market vs enterprise)
25
The Channel EffectLast year we added a section to our annual survey that investigated how channel affects the perceived influence of collateral We defined channel as the specific avenue through which the respondent receives contentmdashwhether from a personal contact from a corporate Web site or from a sales representative for example
One fact immediately stood out in 2009 most respondents receive written collateral through the corporate Web site (Figure 34) This did not change in 2010 with 71 percent of respondents finding white papers through such sites 65 percent getting brochuresdata sheets through that channel and 56 percent acquiring case studies in that way
The next most frequently used channel for receiving a white paper in 2010 was a download from a direct response campaign (59 percent) which implies that this should be considered an important means of distribution for marketers This was followed by forwarded by a sales repcompany contact (54 percent) obtained from a personal contact (52 percent) accessed via social media (39 percent) and absorbed through webinars (34 percent) In 2009 podcasts and video collateral differed from written content when it came to how respondents ldquofoundrdquo them but that difference
0
10
20
30
40
50
60
70
80
Mentioned ina webinar
Linked to ordiscussed in
onlinesocial media
Linked in toan RSS feed
Forwarded bysales rep
company contact
BrowsingcorporateWeb site
Downloadedfrom
direct responsecampaign
Forwardedfrom
personalcontact
White papers Case studies Podcasts Videos Brochures
5253
46
34
37
59
71
5655
6665
54
4241
38
27
23
31
39
31
39
29
23
34
20
23
20
12
21
15
44
38
45
34 34
Figure 34 Through which channels have you received collateral
26
has vanished Last year podcasts were almost equally acquired from a personal contact or from a corporate Web site (48 percent and 49 percent respectively) However this year the corporate Web site trumped the personal contact channel (55 percent to 46 percent) And this was even more dramatically the case for video with only 34 percent of respondents indicating they had been forwarded a video by a personal contact while 66 percent found video on corporate Web sites This trend underscores the importance of the corporate Web site across all collateral types
When we examined the comparative influence of these various channels another interesting fact emerged although a piece of collateral referred to or forwarded by a personal contact was most frequently cited as the most influential channel for all types of collateral browsing the corporate Web site was the second most frequently cited answer (Figure 35) When you consider that the corporate Web site is clearly the most frequently used channel for collateral delivery coupled with its high perceived influence you understand why we recommend that you make investing in and frequently refreshing your Web site a priority
0
10
20
30
40
50
60
70
80
Mentioned ina webinar
Linked to ordiscussed in
onlinesocial media
Linked in toan RSS feed
Forwarded bysales rep
company contact
BrowsingcorporateWeb site
Downloadedfrom
direct responsecampaign
Forwardedfrom
personalcontact
White papers Case studies Podcasts Videos Brochures
73
79
767677
41
38
424343
6060
53
61
69
37
33
28
39
46
2220
31
1716
35
42
3836
31 31
27
33
29
19
Figure 35 Positive influence by channel
27
Marketing Collateral in the Sales CycleThe relationship between collateral and actual sales is an important one How do the various types of collateralmdashwhite papers case studies brochuresmdashimpact sales When should you deliver a white paper case study podcast or video to drive potential purchasers to the next step in the sales cycle Is there a way to time delivery of specific collateral types to nurture leads more effectively
For the purposes of this survey we defined the various stages of the technology evaluation and purchase process as
bull Pre-salemdashConsidering solutions and vendors
bull Initial salemdashReviewing vendor qualifications capabilities and RFP responses
bull Mid-salemdashReviewing details of the solution with one vendor
bull Final salemdashCustomization negotiation and procurement
In our 2008 survey results we saw that respondents most frequently consumed each collateral type for the first time in the pre-sale process by a significant margin that is before they send out RFPs or initiate discussions with specific vendors In that first Eccolo B2B survey white papers were read by 61 percent of respondents during this phase case studies by 48 percent podcasts by 53 percent video by 51 percent and brochuresdata sheets by 62 percent
0
10
20
30
40
50
60
70
Final sales processMid-sales processInitial sales processPre-sales process
White papers Case studies Podcasts Videos Brochures
53
49
41
49
31
3435
30
25
13
21
2018
11
4 3 4 3 4
60
Figure 36 In which phase of the purchasing cycle did you FIRST consume each type of collateral
28
Our 2010 survey indicates that these habits are shifting While the majority of respondents still consume most collateral for the first time in the pre-sales phase more respondents now indicate they first consumed collateral in either the initial sales or mid-sales phases than they did in 2008 For example the percentage of respondents who first consumed a white paper during the pre-sales process dropped to 53 percent the percentage that listened to a podcast dropped down to 41 percent (Figure 36) In both cases respondents appeared to move their first consumption of those types of collateral down to the next two stages of the sales process
When we further segmented the 2010 data to compare the habits of influencers to decision makers we observed some additional interesting trends across the board influencers tend to consume content earlier in the sales cycle than decision makers (Figure 37)
0 10 20 30 40 50 60 70 80
Final salesprocess
Mid-salesprocess
Initial salesprocess
Pre-salesprocess
Final salesprocess
Mid-salesprocess
Initial salesprocess
Pre-salesprocess
White papers Case studies Podcasts Videos Brochures
63
58
41
6458
4752
65
2526
3830
23
915
1417
9
2111
2
4542
3647
56
3339
3430
27
1614
2319
12
65
74
5
25
26
35
20
4
Infl
uen
cers
Deci
sio
n M
akers
Figure 37 In which phase of the purchasing cycle did you FIRST consume each type of collateral (influencers vs decision makers)
29
Likewise respondents from small businesses consume collateral for the first time during the pre-sales stage at much higher rates than respondents from middle-market or large companies For example 70 percent of small businesses consume white papers for the first time during this stage compared to just 40 percent of middle-market firms and 56 percent of large enterprises (Figure 38)
Small Business Mid-market Enterprise
0
10
20
30
40
50
60
70
80
Final sales processMid-sales processInitial Sales ProcessPre-sales Process
70
40
56
16
38
29
9
17
12
5 53
Figure 38 In which phase of the purchasing cycle did you FIRST consume white papers in 2010
As in previous years we find the data around use of collateral in the sales cycle interesting in the way it potentially sheds light on the relationship between influencers and decion makers We believe we are seeing the influencerrsquos role in terms of considering potential technology purchases and the subsequent sharing of that collatera and other information with decision makers a bit later in the cycle
30
BEST PRACTICES FOR THE REAL WORLD
As in previous years we conclude our delivery of the survey results by providing what we consider to be actionable advice that marketing professionals can apply right now to improve the quality and impact of their communications assets
1 Create white papers This is a repeating theme but one that is definitely worth saying once again white papers are frequently consumed and considered highly influential over the technology purchase Take advantage by creating a few well-written papers that clearly outline strategic advancements your solutions and products are aligned with Leverage your work by chunking up the main points into best practice documents blog posts ldquohow tordquo guides and other materials to support your broader campaign needs
2 Embed multimedia files Start with short video or audio clips to keep overall file sizes low but jump on this trend Once you get your feet under you you can advance to interactive charts and graphs Flash elements and other media types Donrsquot ignore the opportunity to be among the first to take advantage of this evolving practice
3 Consider all content to be social content We know that tech purchasers share content and that they consider materials forwarded from a personal contact to be very influential Plan all content and collateral assets from the perspective of stimulating discussion and sharing Think about interactivity links to discussion boards and user groups and point to blog posts and other communications channels in all materials
4 Deliver all content assets digitally and be prepared to have end users print them While the majority of respondents view collateral assets on the desktop a respectable number still enjoy printing out the materials they download and will further share print materials with others Avoid cross-page spreads and column designs that are hard to read digitally and remember to provide clear URLs for any links away from the materials for those reading print versions
5 Merchandise content on the Web Your company Web site is the most frequent location for obtaining content and it ranks second only to personal contacts in terms of influence Make the most of this channel by merchandising featured content and assets on landing pages and microsites that extend the thought leadership and discussion begun in your collateral Remember potential purchasers interact with your content before they interact with you so ensure viewers can easily see all the other channels through which they can engage with you all in one fun-filled information portal
31
CONCLUSIONAs we wrap up this yearrsquos annual survey report we find ourselves coming back to some basic advice that has been a theme of this section in each previous report plan
Eccolo believes that the requirement of content strategymdashidentifying communication topics and thoughtfully planning the assets required to achieve goalsmdashis relevant at every level of the marketing organization The proliferation of online channels and ever more sophisticated lead generation systems require a steady stream of fresh relevant content to successfully engage purchasers Itrsquos very easy to be distracted by looming deadlines and shifting priorities but creating a content strategy and identifying a clear development roadmap that describes topic format and channel is essential if you truly want to improve results
And the opportunity to improve results is significant Well-planned development cycles can shorten time to market reduce costs and ensure a consistent message across all external assets Further organizations that show a healthy respect for content planning and development from the top down will experience the entire enterprise shifting to a more responsive stance These companies are tuned toward deeper customer conversations that align with the end userrsquos preferences for sales and marketing information and by the very style of their collateral assets signal a positive experience for the potential buyer
Engage With UsEccolo Media welcomes your feedback on this report Email us at infoeccolomediacom with specific feedback or visit our blog at httpeccolomediatypepadcom to join in our ongoing discussion of best practices in content strategy
ACKNOWLEDGEMENTSWe would like to acknowledge the participation of the following team members for their efforts in bringing the Eccolo Media 2010 B2B Technology Collateral Survey Report to life Maite Figueroa Alice LaPlante Lorie Loe Courtney Love and Michael Sudol
32
ABOUT ECCOLO MEDIAEccolo Media specializes in strategic marketing insight and content development for some of the worldrsquos best-known technology companies An agency of exceptional writers Eccolo combines deep experience with ongoing research to identify and apply best practices for producing remarkable content The agency helps align clientsrsquo marketing needs with their key business goals by bringing a proactive innovative approach to the planning and execution of collateral in both traditional and new media channels Founded in 2007 Eccolo Media is headquartered in San Francisco California and fulfills a wide range of project needs throughout the Americas and EMEA Visit our Web site at wwweccolomediacom
ABOUT EMEDIA - Our Marketing Sponsoremedia has specialized in generating B2B sales leads and building demand since 1999 We reach more than 35 million decision makers across over 80 niche-oriented audiences within the following B2B areasInformation Technology ElectronicsSupply ChainLogistics Occupational HealthCorporate Finance Environmental ManagementHuman Resources Project ManagementMarketingSales PackagingConvertingB2B Events Construction amp ArchitectsManufacturing Professional DevelopmentSmall Business Design EngineersProcurement Control EngineersHospitality Management PrintingHealthcare Tech
emediarsquos expertise and personal service permit effective implementation of Guaranteed Cost-per-Lead programs for our clientsrsquo offers and collateral Or we can drive highly targeted traffic to clientsrsquo web pages
Contact emedia at 800-782-6167 630-288-8480 or inquiriesemediausacom
ACCELERATED B2B LEAD GENERATION mdash ON DEMAND
wwwemediausacom

14
In 2008 video was ranked fifth in influence when compared to other types of collateral In 2009 it moved into fourth place surpassing podcasts in influence In 2010 it held on to that position (Figure 9 on page 9) When asked how influential the video was on a technology purchase 26 percent of respondents indicated they found videos to be moderately to extremely influential (Figure 18)
We further inquired as to the type of video respondents consumed during a technology purchase Respondents watched more product tutorialsdemos by a wide margin over other types of video collateral (76 percent) Vendor marketing videos were the next most commonly viewed type of video (61 percent) followed by customer testimonials (37 percent) and on-demand webinars (33 percent) as seen in Figure 19
Figure 18 How influential were the videos in making a final purchasing decision
0
10
20
30
40
Not influentialat all
Somewhatinfluential
Moderatelyinfluential
Veryinfluential
Extremelyinfluential
9
39
31
19
2
Figure 17 Have you viewed any videos in the past six months to evaluate a technology purchase
0
20
40
60
80
NoYes
201020092008
28
49 50
72
51 50
15
Brochures and Data Sheets Consumed Most Frequently In 2009 brochures and data sheets were the most frequently consumed of all collateralmdashwith 78 percent of respondents using them to make a purchasing decision over the past six months In 2010 83 percent of respondents consumed these types of collateral But although 79 percent of respondents rated them as moderately to extremely influential when making a technology purchase (Figure 20) they still tend to rank behind white papers and case studies when compared with other collateral types (see Figure 9 on page 9)
As with many other types of collateral large enterprises were more likely to consume brochures than small companies (less than 100 employees) with mid-sized companies falling in between
This year we continue to recommend that brochures and data sheets be a part of every marketerrsquos collateral toolbox precisely because they are so frequently
Figure 20 How influential were brochuresdata sheets in making a final purchasing decision
0
10
20
30
40
50
Not influentialat all
Somewhatinfluential
Moderatelyinfluential
Veryinfluential
Extremelyinfluential
8
31
40
18
3
0
10
20
30
40
50
60
70
80
OtherProducttutorials demos
On-demandwebinars
Vendormarketing
videos
Customertestimonials
37
61
2
76
33
Figure 19 What types of video files have you listened to in order to evaluate a technology purchase
16
consumed We also reiterate our advice that it might not be strategically wise to rely solely on this type of collateral given that their perceived influence is lower than some other collateral types Rather brochures and data sheets should be ldquomust-haverdquo assets in a well-rounded collateral portfolio that includes a broad variety of other content types
How Technology Purchasers Consume ContentAs in previous years we devoted significant time to analyzing how technology purchasers consume and use collateral In this section we share our results plus our insight into what respondents believe makes ldquogoodrdquo collateral
Most Collateral Still Consumed Digitally One surprise in this yearrsquos survey results was that although respondents still have an overwhelming preference for consuming written content on the desktop rather than printing it out that number actually declined across all types of written collateral (Figure 21) For example in 2009 a full three-fourths (76 percent) of respondents read white papers digitally a similar percentage (77 percent) did the same with brochuresdata sheets and even more (84 percent) consumed case studies in this form Yet in 2010 these numbers declined The percentage that read white papers digitally dropped 15 full percentage points to 61 percent The percent of respondents who indicated that they preferred to consume brochuressdata sheets in digital form declined only slightly but just 71 percent of respondents said they preferred to consume case studies in digital formmdash10 percentage points less than in 2009
We also found significant changes in whether respondents downloaded audio files onto their desktops or mobile devices or listened to audio streams from Web sites In 2009 62 percent preferred to download audio files onto their desktop or mobile devices versus 38 percent that preferred to stream directly from a Web site Yet in
Figure 21 Did you view this collateral online or did you downloadprint before reading (2009 vs 2010)
0
20
40
60
80
100
Brochuresdata sheetsCase studiessuccess storiesWhite paper
Downloaded printed 2010
Downloaded printed 2009
Viewedonline 2010
Viewedonline 2009
76
61
24
39
84
74
16
26
77
71
23
29
17
2010 these numbers shifted substantially toward a preference for streaming this year 57 percent of respondents preferred streaming versus 43 percent that favored downloading these types of files
This brings the method of consumption of audio files more in line with respondentsrsquo preferences for streaming video Sixty-four percent of 2010 respondents preferred to watch video streamed live from the source versus 36 percent that preferred to download it to a desktop or mobile device (Figure 22)
However whether streamed or downloaded 92 percent of podcast listeners and 96 percent of video viewers still consumed content on the desktop This is a critical finding that has remained consistent from year to year given that the desktop is the platform of choice for consuming all types of content marketers should ensure that all written content leverages links to other files and other communication channels as much as possible giving technology purchasers the option of drilling down to more details as desired
All Collateral Has Viral PotentialWe continue to be interested in the fact that all collateral is highly viral Technology purchasers routinely share collateral with the vast majority of 2010 respondents (89 percent) sharing the white papers they read with others as seen in Figure 23 Nearly as many (87 percent) share case studies followed by podcasts (84 percent) and then brochuresdata sheets and video (80 percent each)
White papers are still the most viral with 34 percent of respondents sharing them with three or more people Thirty-two percent of respondents shared podcasts with three or more people and 28 percent shared case studies with as many Lagging slightly behind were video (25 percent) and brochuresdata sheets (23 percent)
0
20
40
60
80
Downloaded tomobile device
then listented toviewed
Downloaded todesktop
then listened
Streamed fromlive source
5764
35 32
84
Podcasts Videos
Figure 22 Did you consume this content online or did you download before viewinglistening
18
Another interesting development although all collateral is shared primarily in digital form more 2010 respondents say that they share written collateralmdashwhite papers case studies and brochuresdata sheetsmdashin both digital and printed forms (Figure 24) than did respondents to the 2009 survey For example whereas the percentage of respondents who shared digitalelectronic versions of white papers actually declined in the past yearmdashfrom 60 percent to 51 percentmdashthe percentage of respondents who shared white papers in both digital and printed form increased from 30 percent to 37 percent We therefore caution marketers not to discount the viral nature of hard copy content as it clearly still is considered useful by a significant percentage of respondents
In 2009 influencers were more likely to share only digital copy and decision makers were more likely to share both printed and digital content However in 2010 this is no longer the case and these two respondent types are now in parity on this issue
0
5
10
15
20
25
30
35
White papers Case studies Podcasts Videos Brochures
5 or more
43210
11
13
16
20 20
23
28
25 25
30
33
31
27
30
19
14
17
12
6 6
9
7
5
8 8
6 6 6
12
27
Figure 23 On average how many other decision makers or influencers in your organization did you share each piece of collateral with
19
Preferences For Length Are ChangingEccolo Media has established best practices for serving up marketing collateral in small well-written packages Our survey results over the past three years have reinforced our belief that this serves marketers best However this year we observed subtleties in the survey results that indicated respondents may be adjusting their preferences for longer collateral length
White papersWersquove stated repeatedly that white papers are a highly influential collateral consumed at a high frequency by both decision makers and influencers But marketing communications professionals continue to debate the ideal length of a white paper how do they give the right amount of informationmdashnot too much and not too little As Figure 25 shows the majority of respondents (55 percent) felt six pages or less to be the ideal number However this percentage is 10 points less than last yearrsquos 65 percent
Figure 25 What do you feel is the ideal length for a white paper in number of pages
0
10
20
30
40
50
More than10 pages
10 pages8 pages6 pages4 pages
21
34
27
13
5
Figure 24 In what format did you share collateral
0
10
20
30
40
50
60
70
BrochuresCasestudies
Whitepapers
51
37
52
12
35
12
49
19
32
Digitalelectronic version Hard copy Both
20
Simultaneously the percentage of respondents who preferred white papers of just four pages dropped from 24 percent down to 21 percent and the percentage of respondents who leaned toward eight pages increased from 21 percent to 27 percent This indicates that the ldquoideal lengthrdquo is shifting toward longer rather than shorter white papers
There were no general differences in length preferences between decision makers and influencers but technology purchasers from small companies tend to prefer shorter white papers with 31 percent preferring four pages or less compared to 19 percent of enterprise and 18 percent of mid-market companies that said the same
Case StudiesIn 2008 most respondents reported the ideal length of a case study to be two pages or approximately 800 to 1000 words Yet in 2009 we received different responses That year the largest proportion of respondents (39 percent) indicated that four is the ideal number of pages for a written case study This yearrsquos 2010 survey backed up last yearrsquos numbers with 37 percent preferring four pages and virtually identical percentages of respondents preferring two pages or less (35 percent) or six pages or more (28 percent) as seen in Figure 26
In general the larger the company the longer they prefer their case studies to be with the largest percentage of respondents from small companies (33 percent) preferring two-page case studies the largest percentage from middle-market firms (40 percent) and large enterprises (39 percent) preferring four-page case studies
Figure 26 What do you feel is the ideal number of pages for a case studysuccess story
0
10
20
30
40
50
More than6 pages
6 pages4 pages2 pages1 page
8
27
37
19
9
21
Podcasts The ideal length of a podcast decreased in 2010 Figure 27 shows that the greatest number of respondents (36 percent) selected five to seven minutes as the ideal length Most respondents (81 percent) prefer podcasts that are 10 minutes or less in length and in general the smaller the company the shorter they prefer their podcasts to be
Video The majority of 2010 respondents (38 percent) indicated that the ideal length of video content is five to seven minutes while 24 percent preferred videos of eight to 10 minutes (Figure 28) These results indicate a slight trending to shorter videos over the 2009 respondentrsquos preferences for length where 31 percent preferred five to seven minutes and 28 percent preferred eight to 10 minutes
Figure 28 What do you feel is the ideal length of a video in number of minutes
0
10
20
30
40
More than15 minutes
11 to 15minutes
8 to 10minutes
5 to 7minutes
2 to 4minutes
Less than2 minutes
6 5
19
38
24
8
Figure 27 What do you feel is the ideal length of a podcastaudio file in number of minutes
0
10
20
30
40
More than15 minutes
11 to 15minutes
8 to 10minutes
5 to 7minutes
2 to 4minutes
Less than2 minutes
4
15
36
26
13
6
22
The Emergence of Embedded Audio and Video in Written Collateral Over the past 12 months Eccolo has participated in an emerging trend in marketing collateral embedding audio and video files into digital versions of written documents such as white papers and case studies We therefore asked respondents if they had consumed any written collateral that contained embedded audio andor video files A significant proportion of themmdash45 percentmdashsaid they had done so
Respondents were most likely to encounter embedded files in case studies (66 percent) followed by white papers (55 percent) and brochures (48 percent) (Figure 29)
Perhaps the most dramatic of our findings in this part of the survey was the overwhelming percentage of respondents who clicked through to these embedded files 93 percent Twenty-five percent clicked through to video files six percent clicked through to audio files and 62 percent clicked through to both audio and video (Figure 30)
And most importantly when respondents were asked whether the inclusion of audio or video files positively or negatively affected the overall influence of the written collateral 80 percent indicated that they viewed it either ldquovery positivelyrdquo or ldquopositivelyrdquo (Figure 31)
0
10
20
30
40
50
60
70
80
OtherBrochuresCase studiesWhite paper
55
66
48
1
Figure 29 Which types of written collateral have you consumed that included embedded audio or video
23
In particular decision makers felt this trend was positive 83 percent ranked it as very positively or positively affecting the overall influence of the written collateral compared to 74 percent of influencers (Figure 32)
The size of company also mattered when it came to the perceived influence of embedded files with enterprises more likely to indicate that it was very positive (26 percent) compared to middle-market (14 percent) or small firms (15 percent) On a related note small businesses were more likely to say that embedded files had no influence at allmdash33 percent versus 15 percent of middle-market and 15 percent of enterprise firms (Figure 33)
0
10
20
30
40
50
60
70
80
NeitherBoth audiovideoAudio onlyVideo only
25
6
62
7
Figure 30 Did you click through or open any of the video or audio files embedded in the collateral
0
10
20
30
40
50
60
70
Very negativelyNegativelyNo influencePositivelyVery positively
18
62
18
1 1
Figure 31 How did the inclusion of embedded audio and video files affect the overall influence of the written collateral
24
These results support Eccolorsquos belief that interactivity is becoming ldquotable stakesrdquo for written marketing communications collateral Given the preference that purchasers have already expressed for consuming collateral at their desktop (see Figure 22) marketers that donrsquot experiment with embedded ausio video and other multimedia formats as well as links off to other communications and social media channels risk delivering assets that seem obsolete and old-fashioned
Figure 32 How did the inclusion of embedded audio and video files affect the overall influence of the written collateral
(decision makers versus influencers)
0
20
40
60
80
Very NegativelyNegativelyNo InfluencePositivelyVery Positively
24
59
66
15
26
1 0 018
Decision maker Influencer
0
10
20
30
40
50
60
70
80
Very negativelyNegativelyNo influencePositivelyVery positively
15 14
26
52
69
59
33
15 15
0 1 0 0 1 0
Small business Mid-market Enterprise
Figure 33 How did the inclusion of embedded audio and video files affect the overall influence of the written collateral
(small business vs mid-market vs enterprise)
25
The Channel EffectLast year we added a section to our annual survey that investigated how channel affects the perceived influence of collateral We defined channel as the specific avenue through which the respondent receives contentmdashwhether from a personal contact from a corporate Web site or from a sales representative for example
One fact immediately stood out in 2009 most respondents receive written collateral through the corporate Web site (Figure 34) This did not change in 2010 with 71 percent of respondents finding white papers through such sites 65 percent getting brochuresdata sheets through that channel and 56 percent acquiring case studies in that way
The next most frequently used channel for receiving a white paper in 2010 was a download from a direct response campaign (59 percent) which implies that this should be considered an important means of distribution for marketers This was followed by forwarded by a sales repcompany contact (54 percent) obtained from a personal contact (52 percent) accessed via social media (39 percent) and absorbed through webinars (34 percent) In 2009 podcasts and video collateral differed from written content when it came to how respondents ldquofoundrdquo them but that difference
0
10
20
30
40
50
60
70
80
Mentioned ina webinar
Linked to ordiscussed in
onlinesocial media
Linked in toan RSS feed
Forwarded bysales rep
company contact
BrowsingcorporateWeb site
Downloadedfrom
direct responsecampaign
Forwardedfrom
personalcontact
White papers Case studies Podcasts Videos Brochures
5253
46
34
37
59
71
5655
6665
54
4241
38
27
23
31
39
31
39
29
23
34
20
23
20
12
21
15
44
38
45
34 34
Figure 34 Through which channels have you received collateral
26
has vanished Last year podcasts were almost equally acquired from a personal contact or from a corporate Web site (48 percent and 49 percent respectively) However this year the corporate Web site trumped the personal contact channel (55 percent to 46 percent) And this was even more dramatically the case for video with only 34 percent of respondents indicating they had been forwarded a video by a personal contact while 66 percent found video on corporate Web sites This trend underscores the importance of the corporate Web site across all collateral types
When we examined the comparative influence of these various channels another interesting fact emerged although a piece of collateral referred to or forwarded by a personal contact was most frequently cited as the most influential channel for all types of collateral browsing the corporate Web site was the second most frequently cited answer (Figure 35) When you consider that the corporate Web site is clearly the most frequently used channel for collateral delivery coupled with its high perceived influence you understand why we recommend that you make investing in and frequently refreshing your Web site a priority
0
10
20
30
40
50
60
70
80
Mentioned ina webinar
Linked to ordiscussed in
onlinesocial media
Linked in toan RSS feed
Forwarded bysales rep
company contact
BrowsingcorporateWeb site
Downloadedfrom
direct responsecampaign
Forwardedfrom
personalcontact
White papers Case studies Podcasts Videos Brochures
73
79
767677
41
38
424343
6060
53
61
69
37
33
28
39
46
2220
31
1716
35
42
3836
31 31
27
33
29
19
Figure 35 Positive influence by channel
27
Marketing Collateral in the Sales CycleThe relationship between collateral and actual sales is an important one How do the various types of collateralmdashwhite papers case studies brochuresmdashimpact sales When should you deliver a white paper case study podcast or video to drive potential purchasers to the next step in the sales cycle Is there a way to time delivery of specific collateral types to nurture leads more effectively
For the purposes of this survey we defined the various stages of the technology evaluation and purchase process as
bull Pre-salemdashConsidering solutions and vendors
bull Initial salemdashReviewing vendor qualifications capabilities and RFP responses
bull Mid-salemdashReviewing details of the solution with one vendor
bull Final salemdashCustomization negotiation and procurement
In our 2008 survey results we saw that respondents most frequently consumed each collateral type for the first time in the pre-sale process by a significant margin that is before they send out RFPs or initiate discussions with specific vendors In that first Eccolo B2B survey white papers were read by 61 percent of respondents during this phase case studies by 48 percent podcasts by 53 percent video by 51 percent and brochuresdata sheets by 62 percent
0
10
20
30
40
50
60
70
Final sales processMid-sales processInitial sales processPre-sales process
White papers Case studies Podcasts Videos Brochures
53
49
41
49
31
3435
30
25
13
21
2018
11
4 3 4 3 4
60
Figure 36 In which phase of the purchasing cycle did you FIRST consume each type of collateral
28
Our 2010 survey indicates that these habits are shifting While the majority of respondents still consume most collateral for the first time in the pre-sales phase more respondents now indicate they first consumed collateral in either the initial sales or mid-sales phases than they did in 2008 For example the percentage of respondents who first consumed a white paper during the pre-sales process dropped to 53 percent the percentage that listened to a podcast dropped down to 41 percent (Figure 36) In both cases respondents appeared to move their first consumption of those types of collateral down to the next two stages of the sales process
When we further segmented the 2010 data to compare the habits of influencers to decision makers we observed some additional interesting trends across the board influencers tend to consume content earlier in the sales cycle than decision makers (Figure 37)
0 10 20 30 40 50 60 70 80
Final salesprocess
Mid-salesprocess
Initial salesprocess
Pre-salesprocess
Final salesprocess
Mid-salesprocess
Initial salesprocess
Pre-salesprocess
White papers Case studies Podcasts Videos Brochures
63
58
41
6458
4752
65
2526
3830
23
915
1417
9
2111
2
4542
3647
56
3339
3430
27
1614
2319
12
65
74
5
25
26
35
20
4
Infl
uen
cers
Deci
sio
n M
akers
Figure 37 In which phase of the purchasing cycle did you FIRST consume each type of collateral (influencers vs decision makers)
29
Likewise respondents from small businesses consume collateral for the first time during the pre-sales stage at much higher rates than respondents from middle-market or large companies For example 70 percent of small businesses consume white papers for the first time during this stage compared to just 40 percent of middle-market firms and 56 percent of large enterprises (Figure 38)
Small Business Mid-market Enterprise
0
10
20
30
40
50
60
70
80
Final sales processMid-sales processInitial Sales ProcessPre-sales Process
70
40
56
16
38
29
9
17
12
5 53
Figure 38 In which phase of the purchasing cycle did you FIRST consume white papers in 2010
As in previous years we find the data around use of collateral in the sales cycle interesting in the way it potentially sheds light on the relationship between influencers and decion makers We believe we are seeing the influencerrsquos role in terms of considering potential technology purchases and the subsequent sharing of that collatera and other information with decision makers a bit later in the cycle
30
BEST PRACTICES FOR THE REAL WORLD
As in previous years we conclude our delivery of the survey results by providing what we consider to be actionable advice that marketing professionals can apply right now to improve the quality and impact of their communications assets
1 Create white papers This is a repeating theme but one that is definitely worth saying once again white papers are frequently consumed and considered highly influential over the technology purchase Take advantage by creating a few well-written papers that clearly outline strategic advancements your solutions and products are aligned with Leverage your work by chunking up the main points into best practice documents blog posts ldquohow tordquo guides and other materials to support your broader campaign needs
2 Embed multimedia files Start with short video or audio clips to keep overall file sizes low but jump on this trend Once you get your feet under you you can advance to interactive charts and graphs Flash elements and other media types Donrsquot ignore the opportunity to be among the first to take advantage of this evolving practice
3 Consider all content to be social content We know that tech purchasers share content and that they consider materials forwarded from a personal contact to be very influential Plan all content and collateral assets from the perspective of stimulating discussion and sharing Think about interactivity links to discussion boards and user groups and point to blog posts and other communications channels in all materials
4 Deliver all content assets digitally and be prepared to have end users print them While the majority of respondents view collateral assets on the desktop a respectable number still enjoy printing out the materials they download and will further share print materials with others Avoid cross-page spreads and column designs that are hard to read digitally and remember to provide clear URLs for any links away from the materials for those reading print versions
5 Merchandise content on the Web Your company Web site is the most frequent location for obtaining content and it ranks second only to personal contacts in terms of influence Make the most of this channel by merchandising featured content and assets on landing pages and microsites that extend the thought leadership and discussion begun in your collateral Remember potential purchasers interact with your content before they interact with you so ensure viewers can easily see all the other channels through which they can engage with you all in one fun-filled information portal
31
CONCLUSIONAs we wrap up this yearrsquos annual survey report we find ourselves coming back to some basic advice that has been a theme of this section in each previous report plan
Eccolo believes that the requirement of content strategymdashidentifying communication topics and thoughtfully planning the assets required to achieve goalsmdashis relevant at every level of the marketing organization The proliferation of online channels and ever more sophisticated lead generation systems require a steady stream of fresh relevant content to successfully engage purchasers Itrsquos very easy to be distracted by looming deadlines and shifting priorities but creating a content strategy and identifying a clear development roadmap that describes topic format and channel is essential if you truly want to improve results
And the opportunity to improve results is significant Well-planned development cycles can shorten time to market reduce costs and ensure a consistent message across all external assets Further organizations that show a healthy respect for content planning and development from the top down will experience the entire enterprise shifting to a more responsive stance These companies are tuned toward deeper customer conversations that align with the end userrsquos preferences for sales and marketing information and by the very style of their collateral assets signal a positive experience for the potential buyer
Engage With UsEccolo Media welcomes your feedback on this report Email us at infoeccolomediacom with specific feedback or visit our blog at httpeccolomediatypepadcom to join in our ongoing discussion of best practices in content strategy
ACKNOWLEDGEMENTSWe would like to acknowledge the participation of the following team members for their efforts in bringing the Eccolo Media 2010 B2B Technology Collateral Survey Report to life Maite Figueroa Alice LaPlante Lorie Loe Courtney Love and Michael Sudol
32
ABOUT ECCOLO MEDIAEccolo Media specializes in strategic marketing insight and content development for some of the worldrsquos best-known technology companies An agency of exceptional writers Eccolo combines deep experience with ongoing research to identify and apply best practices for producing remarkable content The agency helps align clientsrsquo marketing needs with their key business goals by bringing a proactive innovative approach to the planning and execution of collateral in both traditional and new media channels Founded in 2007 Eccolo Media is headquartered in San Francisco California and fulfills a wide range of project needs throughout the Americas and EMEA Visit our Web site at wwweccolomediacom
ABOUT EMEDIA - Our Marketing Sponsoremedia has specialized in generating B2B sales leads and building demand since 1999 We reach more than 35 million decision makers across over 80 niche-oriented audiences within the following B2B areasInformation Technology ElectronicsSupply ChainLogistics Occupational HealthCorporate Finance Environmental ManagementHuman Resources Project ManagementMarketingSales PackagingConvertingB2B Events Construction amp ArchitectsManufacturing Professional DevelopmentSmall Business Design EngineersProcurement Control EngineersHospitality Management PrintingHealthcare Tech
emediarsquos expertise and personal service permit effective implementation of Guaranteed Cost-per-Lead programs for our clientsrsquo offers and collateral Or we can drive highly targeted traffic to clientsrsquo web pages
Contact emedia at 800-782-6167 630-288-8480 or inquiriesemediausacom
ACCELERATED B2B LEAD GENERATION mdash ON DEMAND
wwwemediausacom

15
Brochures and Data Sheets Consumed Most Frequently In 2009 brochures and data sheets were the most frequently consumed of all collateralmdashwith 78 percent of respondents using them to make a purchasing decision over the past six months In 2010 83 percent of respondents consumed these types of collateral But although 79 percent of respondents rated them as moderately to extremely influential when making a technology purchase (Figure 20) they still tend to rank behind white papers and case studies when compared with other collateral types (see Figure 9 on page 9)
As with many other types of collateral large enterprises were more likely to consume brochures than small companies (less than 100 employees) with mid-sized companies falling in between
This year we continue to recommend that brochures and data sheets be a part of every marketerrsquos collateral toolbox precisely because they are so frequently
Figure 20 How influential were brochuresdata sheets in making a final purchasing decision
0
10
20
30
40
50
Not influentialat all
Somewhatinfluential
Moderatelyinfluential
Veryinfluential
Extremelyinfluential
8
31
40
18
3
0
10
20
30
40
50
60
70
80
OtherProducttutorials demos
On-demandwebinars
Vendormarketing
videos
Customertestimonials
37
61
2
76
33
Figure 19 What types of video files have you listened to in order to evaluate a technology purchase
16
consumed We also reiterate our advice that it might not be strategically wise to rely solely on this type of collateral given that their perceived influence is lower than some other collateral types Rather brochures and data sheets should be ldquomust-haverdquo assets in a well-rounded collateral portfolio that includes a broad variety of other content types
How Technology Purchasers Consume ContentAs in previous years we devoted significant time to analyzing how technology purchasers consume and use collateral In this section we share our results plus our insight into what respondents believe makes ldquogoodrdquo collateral
Most Collateral Still Consumed Digitally One surprise in this yearrsquos survey results was that although respondents still have an overwhelming preference for consuming written content on the desktop rather than printing it out that number actually declined across all types of written collateral (Figure 21) For example in 2009 a full three-fourths (76 percent) of respondents read white papers digitally a similar percentage (77 percent) did the same with brochuresdata sheets and even more (84 percent) consumed case studies in this form Yet in 2010 these numbers declined The percentage that read white papers digitally dropped 15 full percentage points to 61 percent The percent of respondents who indicated that they preferred to consume brochuressdata sheets in digital form declined only slightly but just 71 percent of respondents said they preferred to consume case studies in digital formmdash10 percentage points less than in 2009
We also found significant changes in whether respondents downloaded audio files onto their desktops or mobile devices or listened to audio streams from Web sites In 2009 62 percent preferred to download audio files onto their desktop or mobile devices versus 38 percent that preferred to stream directly from a Web site Yet in
Figure 21 Did you view this collateral online or did you downloadprint before reading (2009 vs 2010)
0
20
40
60
80
100
Brochuresdata sheetsCase studiessuccess storiesWhite paper
Downloaded printed 2010
Downloaded printed 2009
Viewedonline 2010
Viewedonline 2009
76
61
24
39
84
74
16
26
77
71
23
29
17
2010 these numbers shifted substantially toward a preference for streaming this year 57 percent of respondents preferred streaming versus 43 percent that favored downloading these types of files
This brings the method of consumption of audio files more in line with respondentsrsquo preferences for streaming video Sixty-four percent of 2010 respondents preferred to watch video streamed live from the source versus 36 percent that preferred to download it to a desktop or mobile device (Figure 22)
However whether streamed or downloaded 92 percent of podcast listeners and 96 percent of video viewers still consumed content on the desktop This is a critical finding that has remained consistent from year to year given that the desktop is the platform of choice for consuming all types of content marketers should ensure that all written content leverages links to other files and other communication channels as much as possible giving technology purchasers the option of drilling down to more details as desired
All Collateral Has Viral PotentialWe continue to be interested in the fact that all collateral is highly viral Technology purchasers routinely share collateral with the vast majority of 2010 respondents (89 percent) sharing the white papers they read with others as seen in Figure 23 Nearly as many (87 percent) share case studies followed by podcasts (84 percent) and then brochuresdata sheets and video (80 percent each)
White papers are still the most viral with 34 percent of respondents sharing them with three or more people Thirty-two percent of respondents shared podcasts with three or more people and 28 percent shared case studies with as many Lagging slightly behind were video (25 percent) and brochuresdata sheets (23 percent)
0
20
40
60
80
Downloaded tomobile device
then listented toviewed
Downloaded todesktop
then listened
Streamed fromlive source
5764
35 32
84
Podcasts Videos
Figure 22 Did you consume this content online or did you download before viewinglistening
18
Another interesting development although all collateral is shared primarily in digital form more 2010 respondents say that they share written collateralmdashwhite papers case studies and brochuresdata sheetsmdashin both digital and printed forms (Figure 24) than did respondents to the 2009 survey For example whereas the percentage of respondents who shared digitalelectronic versions of white papers actually declined in the past yearmdashfrom 60 percent to 51 percentmdashthe percentage of respondents who shared white papers in both digital and printed form increased from 30 percent to 37 percent We therefore caution marketers not to discount the viral nature of hard copy content as it clearly still is considered useful by a significant percentage of respondents
In 2009 influencers were more likely to share only digital copy and decision makers were more likely to share both printed and digital content However in 2010 this is no longer the case and these two respondent types are now in parity on this issue
0
5
10
15
20
25
30
35
White papers Case studies Podcasts Videos Brochures
5 or more
43210
11
13
16
20 20
23
28
25 25
30
33
31
27
30
19
14
17
12
6 6
9
7
5
8 8
6 6 6
12
27
Figure 23 On average how many other decision makers or influencers in your organization did you share each piece of collateral with
19
Preferences For Length Are ChangingEccolo Media has established best practices for serving up marketing collateral in small well-written packages Our survey results over the past three years have reinforced our belief that this serves marketers best However this year we observed subtleties in the survey results that indicated respondents may be adjusting their preferences for longer collateral length
White papersWersquove stated repeatedly that white papers are a highly influential collateral consumed at a high frequency by both decision makers and influencers But marketing communications professionals continue to debate the ideal length of a white paper how do they give the right amount of informationmdashnot too much and not too little As Figure 25 shows the majority of respondents (55 percent) felt six pages or less to be the ideal number However this percentage is 10 points less than last yearrsquos 65 percent
Figure 25 What do you feel is the ideal length for a white paper in number of pages
0
10
20
30
40
50
More than10 pages
10 pages8 pages6 pages4 pages
21
34
27
13
5
Figure 24 In what format did you share collateral
0
10
20
30
40
50
60
70
BrochuresCasestudies
Whitepapers
51
37
52
12
35
12
49
19
32
Digitalelectronic version Hard copy Both
20
Simultaneously the percentage of respondents who preferred white papers of just four pages dropped from 24 percent down to 21 percent and the percentage of respondents who leaned toward eight pages increased from 21 percent to 27 percent This indicates that the ldquoideal lengthrdquo is shifting toward longer rather than shorter white papers
There were no general differences in length preferences between decision makers and influencers but technology purchasers from small companies tend to prefer shorter white papers with 31 percent preferring four pages or less compared to 19 percent of enterprise and 18 percent of mid-market companies that said the same
Case StudiesIn 2008 most respondents reported the ideal length of a case study to be two pages or approximately 800 to 1000 words Yet in 2009 we received different responses That year the largest proportion of respondents (39 percent) indicated that four is the ideal number of pages for a written case study This yearrsquos 2010 survey backed up last yearrsquos numbers with 37 percent preferring four pages and virtually identical percentages of respondents preferring two pages or less (35 percent) or six pages or more (28 percent) as seen in Figure 26
In general the larger the company the longer they prefer their case studies to be with the largest percentage of respondents from small companies (33 percent) preferring two-page case studies the largest percentage from middle-market firms (40 percent) and large enterprises (39 percent) preferring four-page case studies
Figure 26 What do you feel is the ideal number of pages for a case studysuccess story
0
10
20
30
40
50
More than6 pages
6 pages4 pages2 pages1 page
8
27
37
19
9
21
Podcasts The ideal length of a podcast decreased in 2010 Figure 27 shows that the greatest number of respondents (36 percent) selected five to seven minutes as the ideal length Most respondents (81 percent) prefer podcasts that are 10 minutes or less in length and in general the smaller the company the shorter they prefer their podcasts to be
Video The majority of 2010 respondents (38 percent) indicated that the ideal length of video content is five to seven minutes while 24 percent preferred videos of eight to 10 minutes (Figure 28) These results indicate a slight trending to shorter videos over the 2009 respondentrsquos preferences for length where 31 percent preferred five to seven minutes and 28 percent preferred eight to 10 minutes
Figure 28 What do you feel is the ideal length of a video in number of minutes
0
10
20
30
40
More than15 minutes
11 to 15minutes
8 to 10minutes
5 to 7minutes
2 to 4minutes
Less than2 minutes
6 5
19
38
24
8
Figure 27 What do you feel is the ideal length of a podcastaudio file in number of minutes
0
10
20
30
40
More than15 minutes
11 to 15minutes
8 to 10minutes
5 to 7minutes
2 to 4minutes
Less than2 minutes
4
15
36
26
13
6
22
The Emergence of Embedded Audio and Video in Written Collateral Over the past 12 months Eccolo has participated in an emerging trend in marketing collateral embedding audio and video files into digital versions of written documents such as white papers and case studies We therefore asked respondents if they had consumed any written collateral that contained embedded audio andor video files A significant proportion of themmdash45 percentmdashsaid they had done so
Respondents were most likely to encounter embedded files in case studies (66 percent) followed by white papers (55 percent) and brochures (48 percent) (Figure 29)
Perhaps the most dramatic of our findings in this part of the survey was the overwhelming percentage of respondents who clicked through to these embedded files 93 percent Twenty-five percent clicked through to video files six percent clicked through to audio files and 62 percent clicked through to both audio and video (Figure 30)
And most importantly when respondents were asked whether the inclusion of audio or video files positively or negatively affected the overall influence of the written collateral 80 percent indicated that they viewed it either ldquovery positivelyrdquo or ldquopositivelyrdquo (Figure 31)
0
10
20
30
40
50
60
70
80
OtherBrochuresCase studiesWhite paper
55
66
48
1
Figure 29 Which types of written collateral have you consumed that included embedded audio or video
23
In particular decision makers felt this trend was positive 83 percent ranked it as very positively or positively affecting the overall influence of the written collateral compared to 74 percent of influencers (Figure 32)
The size of company also mattered when it came to the perceived influence of embedded files with enterprises more likely to indicate that it was very positive (26 percent) compared to middle-market (14 percent) or small firms (15 percent) On a related note small businesses were more likely to say that embedded files had no influence at allmdash33 percent versus 15 percent of middle-market and 15 percent of enterprise firms (Figure 33)
0
10
20
30
40
50
60
70
80
NeitherBoth audiovideoAudio onlyVideo only
25
6
62
7
Figure 30 Did you click through or open any of the video or audio files embedded in the collateral
0
10
20
30
40
50
60
70
Very negativelyNegativelyNo influencePositivelyVery positively
18
62
18
1 1
Figure 31 How did the inclusion of embedded audio and video files affect the overall influence of the written collateral
24
These results support Eccolorsquos belief that interactivity is becoming ldquotable stakesrdquo for written marketing communications collateral Given the preference that purchasers have already expressed for consuming collateral at their desktop (see Figure 22) marketers that donrsquot experiment with embedded ausio video and other multimedia formats as well as links off to other communications and social media channels risk delivering assets that seem obsolete and old-fashioned
Figure 32 How did the inclusion of embedded audio and video files affect the overall influence of the written collateral
(decision makers versus influencers)
0
20
40
60
80
Very NegativelyNegativelyNo InfluencePositivelyVery Positively
24
59
66
15
26
1 0 018
Decision maker Influencer
0
10
20
30
40
50
60
70
80
Very negativelyNegativelyNo influencePositivelyVery positively
15 14
26
52
69
59
33
15 15
0 1 0 0 1 0
Small business Mid-market Enterprise
Figure 33 How did the inclusion of embedded audio and video files affect the overall influence of the written collateral
(small business vs mid-market vs enterprise)
25
The Channel EffectLast year we added a section to our annual survey that investigated how channel affects the perceived influence of collateral We defined channel as the specific avenue through which the respondent receives contentmdashwhether from a personal contact from a corporate Web site or from a sales representative for example
One fact immediately stood out in 2009 most respondents receive written collateral through the corporate Web site (Figure 34) This did not change in 2010 with 71 percent of respondents finding white papers through such sites 65 percent getting brochuresdata sheets through that channel and 56 percent acquiring case studies in that way
The next most frequently used channel for receiving a white paper in 2010 was a download from a direct response campaign (59 percent) which implies that this should be considered an important means of distribution for marketers This was followed by forwarded by a sales repcompany contact (54 percent) obtained from a personal contact (52 percent) accessed via social media (39 percent) and absorbed through webinars (34 percent) In 2009 podcasts and video collateral differed from written content when it came to how respondents ldquofoundrdquo them but that difference
0
10
20
30
40
50
60
70
80
Mentioned ina webinar
Linked to ordiscussed in
onlinesocial media
Linked in toan RSS feed
Forwarded bysales rep
company contact
BrowsingcorporateWeb site
Downloadedfrom
direct responsecampaign
Forwardedfrom
personalcontact
White papers Case studies Podcasts Videos Brochures
5253
46
34
37
59
71
5655
6665
54
4241
38
27
23
31
39
31
39
29
23
34
20
23
20
12
21
15
44
38
45
34 34
Figure 34 Through which channels have you received collateral
26
has vanished Last year podcasts were almost equally acquired from a personal contact or from a corporate Web site (48 percent and 49 percent respectively) However this year the corporate Web site trumped the personal contact channel (55 percent to 46 percent) And this was even more dramatically the case for video with only 34 percent of respondents indicating they had been forwarded a video by a personal contact while 66 percent found video on corporate Web sites This trend underscores the importance of the corporate Web site across all collateral types
When we examined the comparative influence of these various channels another interesting fact emerged although a piece of collateral referred to or forwarded by a personal contact was most frequently cited as the most influential channel for all types of collateral browsing the corporate Web site was the second most frequently cited answer (Figure 35) When you consider that the corporate Web site is clearly the most frequently used channel for collateral delivery coupled with its high perceived influence you understand why we recommend that you make investing in and frequently refreshing your Web site a priority
0
10
20
30
40
50
60
70
80
Mentioned ina webinar
Linked to ordiscussed in
onlinesocial media
Linked in toan RSS feed
Forwarded bysales rep
company contact
BrowsingcorporateWeb site
Downloadedfrom
direct responsecampaign
Forwardedfrom
personalcontact
White papers Case studies Podcasts Videos Brochures
73
79
767677
41
38
424343
6060
53
61
69
37
33
28
39
46
2220
31
1716
35
42
3836
31 31
27
33
29
19
Figure 35 Positive influence by channel
27
Marketing Collateral in the Sales CycleThe relationship between collateral and actual sales is an important one How do the various types of collateralmdashwhite papers case studies brochuresmdashimpact sales When should you deliver a white paper case study podcast or video to drive potential purchasers to the next step in the sales cycle Is there a way to time delivery of specific collateral types to nurture leads more effectively
For the purposes of this survey we defined the various stages of the technology evaluation and purchase process as
bull Pre-salemdashConsidering solutions and vendors
bull Initial salemdashReviewing vendor qualifications capabilities and RFP responses
bull Mid-salemdashReviewing details of the solution with one vendor
bull Final salemdashCustomization negotiation and procurement
In our 2008 survey results we saw that respondents most frequently consumed each collateral type for the first time in the pre-sale process by a significant margin that is before they send out RFPs or initiate discussions with specific vendors In that first Eccolo B2B survey white papers were read by 61 percent of respondents during this phase case studies by 48 percent podcasts by 53 percent video by 51 percent and brochuresdata sheets by 62 percent
0
10
20
30
40
50
60
70
Final sales processMid-sales processInitial sales processPre-sales process
White papers Case studies Podcasts Videos Brochures
53
49
41
49
31
3435
30
25
13
21
2018
11
4 3 4 3 4
60
Figure 36 In which phase of the purchasing cycle did you FIRST consume each type of collateral
28
Our 2010 survey indicates that these habits are shifting While the majority of respondents still consume most collateral for the first time in the pre-sales phase more respondents now indicate they first consumed collateral in either the initial sales or mid-sales phases than they did in 2008 For example the percentage of respondents who first consumed a white paper during the pre-sales process dropped to 53 percent the percentage that listened to a podcast dropped down to 41 percent (Figure 36) In both cases respondents appeared to move their first consumption of those types of collateral down to the next two stages of the sales process
When we further segmented the 2010 data to compare the habits of influencers to decision makers we observed some additional interesting trends across the board influencers tend to consume content earlier in the sales cycle than decision makers (Figure 37)
0 10 20 30 40 50 60 70 80
Final salesprocess
Mid-salesprocess
Initial salesprocess
Pre-salesprocess
Final salesprocess
Mid-salesprocess
Initial salesprocess
Pre-salesprocess
White papers Case studies Podcasts Videos Brochures
63
58
41
6458
4752
65
2526
3830
23
915
1417
9
2111
2
4542
3647
56
3339
3430
27
1614
2319
12
65
74
5
25
26
35
20
4
Infl
uen
cers
Deci
sio
n M
akers
Figure 37 In which phase of the purchasing cycle did you FIRST consume each type of collateral (influencers vs decision makers)
29
Likewise respondents from small businesses consume collateral for the first time during the pre-sales stage at much higher rates than respondents from middle-market or large companies For example 70 percent of small businesses consume white papers for the first time during this stage compared to just 40 percent of middle-market firms and 56 percent of large enterprises (Figure 38)
Small Business Mid-market Enterprise
0
10
20
30
40
50
60
70
80
Final sales processMid-sales processInitial Sales ProcessPre-sales Process
70
40
56
16
38
29
9
17
12
5 53
Figure 38 In which phase of the purchasing cycle did you FIRST consume white papers in 2010
As in previous years we find the data around use of collateral in the sales cycle interesting in the way it potentially sheds light on the relationship between influencers and decion makers We believe we are seeing the influencerrsquos role in terms of considering potential technology purchases and the subsequent sharing of that collatera and other information with decision makers a bit later in the cycle
30
BEST PRACTICES FOR THE REAL WORLD
As in previous years we conclude our delivery of the survey results by providing what we consider to be actionable advice that marketing professionals can apply right now to improve the quality and impact of their communications assets
1 Create white papers This is a repeating theme but one that is definitely worth saying once again white papers are frequently consumed and considered highly influential over the technology purchase Take advantage by creating a few well-written papers that clearly outline strategic advancements your solutions and products are aligned with Leverage your work by chunking up the main points into best practice documents blog posts ldquohow tordquo guides and other materials to support your broader campaign needs
2 Embed multimedia files Start with short video or audio clips to keep overall file sizes low but jump on this trend Once you get your feet under you you can advance to interactive charts and graphs Flash elements and other media types Donrsquot ignore the opportunity to be among the first to take advantage of this evolving practice
3 Consider all content to be social content We know that tech purchasers share content and that they consider materials forwarded from a personal contact to be very influential Plan all content and collateral assets from the perspective of stimulating discussion and sharing Think about interactivity links to discussion boards and user groups and point to blog posts and other communications channels in all materials
4 Deliver all content assets digitally and be prepared to have end users print them While the majority of respondents view collateral assets on the desktop a respectable number still enjoy printing out the materials they download and will further share print materials with others Avoid cross-page spreads and column designs that are hard to read digitally and remember to provide clear URLs for any links away from the materials for those reading print versions
5 Merchandise content on the Web Your company Web site is the most frequent location for obtaining content and it ranks second only to personal contacts in terms of influence Make the most of this channel by merchandising featured content and assets on landing pages and microsites that extend the thought leadership and discussion begun in your collateral Remember potential purchasers interact with your content before they interact with you so ensure viewers can easily see all the other channels through which they can engage with you all in one fun-filled information portal
31
CONCLUSIONAs we wrap up this yearrsquos annual survey report we find ourselves coming back to some basic advice that has been a theme of this section in each previous report plan
Eccolo believes that the requirement of content strategymdashidentifying communication topics and thoughtfully planning the assets required to achieve goalsmdashis relevant at every level of the marketing organization The proliferation of online channels and ever more sophisticated lead generation systems require a steady stream of fresh relevant content to successfully engage purchasers Itrsquos very easy to be distracted by looming deadlines and shifting priorities but creating a content strategy and identifying a clear development roadmap that describes topic format and channel is essential if you truly want to improve results
And the opportunity to improve results is significant Well-planned development cycles can shorten time to market reduce costs and ensure a consistent message across all external assets Further organizations that show a healthy respect for content planning and development from the top down will experience the entire enterprise shifting to a more responsive stance These companies are tuned toward deeper customer conversations that align with the end userrsquos preferences for sales and marketing information and by the very style of their collateral assets signal a positive experience for the potential buyer
Engage With UsEccolo Media welcomes your feedback on this report Email us at infoeccolomediacom with specific feedback or visit our blog at httpeccolomediatypepadcom to join in our ongoing discussion of best practices in content strategy
ACKNOWLEDGEMENTSWe would like to acknowledge the participation of the following team members for their efforts in bringing the Eccolo Media 2010 B2B Technology Collateral Survey Report to life Maite Figueroa Alice LaPlante Lorie Loe Courtney Love and Michael Sudol
32
ABOUT ECCOLO MEDIAEccolo Media specializes in strategic marketing insight and content development for some of the worldrsquos best-known technology companies An agency of exceptional writers Eccolo combines deep experience with ongoing research to identify and apply best practices for producing remarkable content The agency helps align clientsrsquo marketing needs with their key business goals by bringing a proactive innovative approach to the planning and execution of collateral in both traditional and new media channels Founded in 2007 Eccolo Media is headquartered in San Francisco California and fulfills a wide range of project needs throughout the Americas and EMEA Visit our Web site at wwweccolomediacom
ABOUT EMEDIA - Our Marketing Sponsoremedia has specialized in generating B2B sales leads and building demand since 1999 We reach more than 35 million decision makers across over 80 niche-oriented audiences within the following B2B areasInformation Technology ElectronicsSupply ChainLogistics Occupational HealthCorporate Finance Environmental ManagementHuman Resources Project ManagementMarketingSales PackagingConvertingB2B Events Construction amp ArchitectsManufacturing Professional DevelopmentSmall Business Design EngineersProcurement Control EngineersHospitality Management PrintingHealthcare Tech
emediarsquos expertise and personal service permit effective implementation of Guaranteed Cost-per-Lead programs for our clientsrsquo offers and collateral Or we can drive highly targeted traffic to clientsrsquo web pages
Contact emedia at 800-782-6167 630-288-8480 or inquiriesemediausacom
ACCELERATED B2B LEAD GENERATION mdash ON DEMAND
wwwemediausacom

16
consumed We also reiterate our advice that it might not be strategically wise to rely solely on this type of collateral given that their perceived influence is lower than some other collateral types Rather brochures and data sheets should be ldquomust-haverdquo assets in a well-rounded collateral portfolio that includes a broad variety of other content types
How Technology Purchasers Consume ContentAs in previous years we devoted significant time to analyzing how technology purchasers consume and use collateral In this section we share our results plus our insight into what respondents believe makes ldquogoodrdquo collateral
Most Collateral Still Consumed Digitally One surprise in this yearrsquos survey results was that although respondents still have an overwhelming preference for consuming written content on the desktop rather than printing it out that number actually declined across all types of written collateral (Figure 21) For example in 2009 a full three-fourths (76 percent) of respondents read white papers digitally a similar percentage (77 percent) did the same with brochuresdata sheets and even more (84 percent) consumed case studies in this form Yet in 2010 these numbers declined The percentage that read white papers digitally dropped 15 full percentage points to 61 percent The percent of respondents who indicated that they preferred to consume brochuressdata sheets in digital form declined only slightly but just 71 percent of respondents said they preferred to consume case studies in digital formmdash10 percentage points less than in 2009
We also found significant changes in whether respondents downloaded audio files onto their desktops or mobile devices or listened to audio streams from Web sites In 2009 62 percent preferred to download audio files onto their desktop or mobile devices versus 38 percent that preferred to stream directly from a Web site Yet in
Figure 21 Did you view this collateral online or did you downloadprint before reading (2009 vs 2010)
0
20
40
60
80
100
Brochuresdata sheetsCase studiessuccess storiesWhite paper
Downloaded printed 2010
Downloaded printed 2009
Viewedonline 2010
Viewedonline 2009
76
61
24
39
84
74
16
26
77
71
23
29
17
2010 these numbers shifted substantially toward a preference for streaming this year 57 percent of respondents preferred streaming versus 43 percent that favored downloading these types of files
This brings the method of consumption of audio files more in line with respondentsrsquo preferences for streaming video Sixty-four percent of 2010 respondents preferred to watch video streamed live from the source versus 36 percent that preferred to download it to a desktop or mobile device (Figure 22)
However whether streamed or downloaded 92 percent of podcast listeners and 96 percent of video viewers still consumed content on the desktop This is a critical finding that has remained consistent from year to year given that the desktop is the platform of choice for consuming all types of content marketers should ensure that all written content leverages links to other files and other communication channels as much as possible giving technology purchasers the option of drilling down to more details as desired
All Collateral Has Viral PotentialWe continue to be interested in the fact that all collateral is highly viral Technology purchasers routinely share collateral with the vast majority of 2010 respondents (89 percent) sharing the white papers they read with others as seen in Figure 23 Nearly as many (87 percent) share case studies followed by podcasts (84 percent) and then brochuresdata sheets and video (80 percent each)
White papers are still the most viral with 34 percent of respondents sharing them with three or more people Thirty-two percent of respondents shared podcasts with three or more people and 28 percent shared case studies with as many Lagging slightly behind were video (25 percent) and brochuresdata sheets (23 percent)
0
20
40
60
80
Downloaded tomobile device
then listented toviewed
Downloaded todesktop
then listened
Streamed fromlive source
5764
35 32
84
Podcasts Videos
Figure 22 Did you consume this content online or did you download before viewinglistening
18
Another interesting development although all collateral is shared primarily in digital form more 2010 respondents say that they share written collateralmdashwhite papers case studies and brochuresdata sheetsmdashin both digital and printed forms (Figure 24) than did respondents to the 2009 survey For example whereas the percentage of respondents who shared digitalelectronic versions of white papers actually declined in the past yearmdashfrom 60 percent to 51 percentmdashthe percentage of respondents who shared white papers in both digital and printed form increased from 30 percent to 37 percent We therefore caution marketers not to discount the viral nature of hard copy content as it clearly still is considered useful by a significant percentage of respondents
In 2009 influencers were more likely to share only digital copy and decision makers were more likely to share both printed and digital content However in 2010 this is no longer the case and these two respondent types are now in parity on this issue
0
5
10
15
20
25
30
35
White papers Case studies Podcasts Videos Brochures
5 or more
43210
11
13
16
20 20
23
28
25 25
30
33
31
27
30
19
14
17
12
6 6
9
7
5
8 8
6 6 6
12
27
Figure 23 On average how many other decision makers or influencers in your organization did you share each piece of collateral with
19
Preferences For Length Are ChangingEccolo Media has established best practices for serving up marketing collateral in small well-written packages Our survey results over the past three years have reinforced our belief that this serves marketers best However this year we observed subtleties in the survey results that indicated respondents may be adjusting their preferences for longer collateral length
White papersWersquove stated repeatedly that white papers are a highly influential collateral consumed at a high frequency by both decision makers and influencers But marketing communications professionals continue to debate the ideal length of a white paper how do they give the right amount of informationmdashnot too much and not too little As Figure 25 shows the majority of respondents (55 percent) felt six pages or less to be the ideal number However this percentage is 10 points less than last yearrsquos 65 percent
Figure 25 What do you feel is the ideal length for a white paper in number of pages
0
10
20
30
40
50
More than10 pages
10 pages8 pages6 pages4 pages
21
34
27
13
5
Figure 24 In what format did you share collateral
0
10
20
30
40
50
60
70
BrochuresCasestudies
Whitepapers
51
37
52
12
35
12
49
19
32
Digitalelectronic version Hard copy Both
20
Simultaneously the percentage of respondents who preferred white papers of just four pages dropped from 24 percent down to 21 percent and the percentage of respondents who leaned toward eight pages increased from 21 percent to 27 percent This indicates that the ldquoideal lengthrdquo is shifting toward longer rather than shorter white papers
There were no general differences in length preferences between decision makers and influencers but technology purchasers from small companies tend to prefer shorter white papers with 31 percent preferring four pages or less compared to 19 percent of enterprise and 18 percent of mid-market companies that said the same
Case StudiesIn 2008 most respondents reported the ideal length of a case study to be two pages or approximately 800 to 1000 words Yet in 2009 we received different responses That year the largest proportion of respondents (39 percent) indicated that four is the ideal number of pages for a written case study This yearrsquos 2010 survey backed up last yearrsquos numbers with 37 percent preferring four pages and virtually identical percentages of respondents preferring two pages or less (35 percent) or six pages or more (28 percent) as seen in Figure 26
In general the larger the company the longer they prefer their case studies to be with the largest percentage of respondents from small companies (33 percent) preferring two-page case studies the largest percentage from middle-market firms (40 percent) and large enterprises (39 percent) preferring four-page case studies
Figure 26 What do you feel is the ideal number of pages for a case studysuccess story
0
10
20
30
40
50
More than6 pages
6 pages4 pages2 pages1 page
8
27
37
19
9
21
Podcasts The ideal length of a podcast decreased in 2010 Figure 27 shows that the greatest number of respondents (36 percent) selected five to seven minutes as the ideal length Most respondents (81 percent) prefer podcasts that are 10 minutes or less in length and in general the smaller the company the shorter they prefer their podcasts to be
Video The majority of 2010 respondents (38 percent) indicated that the ideal length of video content is five to seven minutes while 24 percent preferred videos of eight to 10 minutes (Figure 28) These results indicate a slight trending to shorter videos over the 2009 respondentrsquos preferences for length where 31 percent preferred five to seven minutes and 28 percent preferred eight to 10 minutes
Figure 28 What do you feel is the ideal length of a video in number of minutes
0
10
20
30
40
More than15 minutes
11 to 15minutes
8 to 10minutes
5 to 7minutes
2 to 4minutes
Less than2 minutes
6 5
19
38
24
8
Figure 27 What do you feel is the ideal length of a podcastaudio file in number of minutes
0
10
20
30
40
More than15 minutes
11 to 15minutes
8 to 10minutes
5 to 7minutes
2 to 4minutes
Less than2 minutes
4
15
36
26
13
6
22
The Emergence of Embedded Audio and Video in Written Collateral Over the past 12 months Eccolo has participated in an emerging trend in marketing collateral embedding audio and video files into digital versions of written documents such as white papers and case studies We therefore asked respondents if they had consumed any written collateral that contained embedded audio andor video files A significant proportion of themmdash45 percentmdashsaid they had done so
Respondents were most likely to encounter embedded files in case studies (66 percent) followed by white papers (55 percent) and brochures (48 percent) (Figure 29)
Perhaps the most dramatic of our findings in this part of the survey was the overwhelming percentage of respondents who clicked through to these embedded files 93 percent Twenty-five percent clicked through to video files six percent clicked through to audio files and 62 percent clicked through to both audio and video (Figure 30)
And most importantly when respondents were asked whether the inclusion of audio or video files positively or negatively affected the overall influence of the written collateral 80 percent indicated that they viewed it either ldquovery positivelyrdquo or ldquopositivelyrdquo (Figure 31)
0
10
20
30
40
50
60
70
80
OtherBrochuresCase studiesWhite paper
55
66
48
1
Figure 29 Which types of written collateral have you consumed that included embedded audio or video
23
In particular decision makers felt this trend was positive 83 percent ranked it as very positively or positively affecting the overall influence of the written collateral compared to 74 percent of influencers (Figure 32)
The size of company also mattered when it came to the perceived influence of embedded files with enterprises more likely to indicate that it was very positive (26 percent) compared to middle-market (14 percent) or small firms (15 percent) On a related note small businesses were more likely to say that embedded files had no influence at allmdash33 percent versus 15 percent of middle-market and 15 percent of enterprise firms (Figure 33)
0
10
20
30
40
50
60
70
80
NeitherBoth audiovideoAudio onlyVideo only
25
6
62
7
Figure 30 Did you click through or open any of the video or audio files embedded in the collateral
0
10
20
30
40
50
60
70
Very negativelyNegativelyNo influencePositivelyVery positively
18
62
18
1 1
Figure 31 How did the inclusion of embedded audio and video files affect the overall influence of the written collateral
24
These results support Eccolorsquos belief that interactivity is becoming ldquotable stakesrdquo for written marketing communications collateral Given the preference that purchasers have already expressed for consuming collateral at their desktop (see Figure 22) marketers that donrsquot experiment with embedded ausio video and other multimedia formats as well as links off to other communications and social media channels risk delivering assets that seem obsolete and old-fashioned
Figure 32 How did the inclusion of embedded audio and video files affect the overall influence of the written collateral
(decision makers versus influencers)
0
20
40
60
80
Very NegativelyNegativelyNo InfluencePositivelyVery Positively
24
59
66
15
26
1 0 018
Decision maker Influencer
0
10
20
30
40
50
60
70
80
Very negativelyNegativelyNo influencePositivelyVery positively
15 14
26
52
69
59
33
15 15
0 1 0 0 1 0
Small business Mid-market Enterprise
Figure 33 How did the inclusion of embedded audio and video files affect the overall influence of the written collateral
(small business vs mid-market vs enterprise)
25
The Channel EffectLast year we added a section to our annual survey that investigated how channel affects the perceived influence of collateral We defined channel as the specific avenue through which the respondent receives contentmdashwhether from a personal contact from a corporate Web site or from a sales representative for example
One fact immediately stood out in 2009 most respondents receive written collateral through the corporate Web site (Figure 34) This did not change in 2010 with 71 percent of respondents finding white papers through such sites 65 percent getting brochuresdata sheets through that channel and 56 percent acquiring case studies in that way
The next most frequently used channel for receiving a white paper in 2010 was a download from a direct response campaign (59 percent) which implies that this should be considered an important means of distribution for marketers This was followed by forwarded by a sales repcompany contact (54 percent) obtained from a personal contact (52 percent) accessed via social media (39 percent) and absorbed through webinars (34 percent) In 2009 podcasts and video collateral differed from written content when it came to how respondents ldquofoundrdquo them but that difference
0
10
20
30
40
50
60
70
80
Mentioned ina webinar
Linked to ordiscussed in
onlinesocial media
Linked in toan RSS feed
Forwarded bysales rep
company contact
BrowsingcorporateWeb site
Downloadedfrom
direct responsecampaign
Forwardedfrom
personalcontact
White papers Case studies Podcasts Videos Brochures
5253
46
34
37
59
71
5655
6665
54
4241
38
27
23
31
39
31
39
29
23
34
20
23
20
12
21
15
44
38
45
34 34
Figure 34 Through which channels have you received collateral
26
has vanished Last year podcasts were almost equally acquired from a personal contact or from a corporate Web site (48 percent and 49 percent respectively) However this year the corporate Web site trumped the personal contact channel (55 percent to 46 percent) And this was even more dramatically the case for video with only 34 percent of respondents indicating they had been forwarded a video by a personal contact while 66 percent found video on corporate Web sites This trend underscores the importance of the corporate Web site across all collateral types
When we examined the comparative influence of these various channels another interesting fact emerged although a piece of collateral referred to or forwarded by a personal contact was most frequently cited as the most influential channel for all types of collateral browsing the corporate Web site was the second most frequently cited answer (Figure 35) When you consider that the corporate Web site is clearly the most frequently used channel for collateral delivery coupled with its high perceived influence you understand why we recommend that you make investing in and frequently refreshing your Web site a priority
0
10
20
30
40
50
60
70
80
Mentioned ina webinar
Linked to ordiscussed in
onlinesocial media
Linked in toan RSS feed
Forwarded bysales rep
company contact
BrowsingcorporateWeb site
Downloadedfrom
direct responsecampaign
Forwardedfrom
personalcontact
White papers Case studies Podcasts Videos Brochures
73
79
767677
41
38
424343
6060
53
61
69
37
33
28
39
46
2220
31
1716
35
42
3836
31 31
27
33
29
19
Figure 35 Positive influence by channel
27
Marketing Collateral in the Sales CycleThe relationship between collateral and actual sales is an important one How do the various types of collateralmdashwhite papers case studies brochuresmdashimpact sales When should you deliver a white paper case study podcast or video to drive potential purchasers to the next step in the sales cycle Is there a way to time delivery of specific collateral types to nurture leads more effectively
For the purposes of this survey we defined the various stages of the technology evaluation and purchase process as
bull Pre-salemdashConsidering solutions and vendors
bull Initial salemdashReviewing vendor qualifications capabilities and RFP responses
bull Mid-salemdashReviewing details of the solution with one vendor
bull Final salemdashCustomization negotiation and procurement
In our 2008 survey results we saw that respondents most frequently consumed each collateral type for the first time in the pre-sale process by a significant margin that is before they send out RFPs or initiate discussions with specific vendors In that first Eccolo B2B survey white papers were read by 61 percent of respondents during this phase case studies by 48 percent podcasts by 53 percent video by 51 percent and brochuresdata sheets by 62 percent
0
10
20
30
40
50
60
70
Final sales processMid-sales processInitial sales processPre-sales process
White papers Case studies Podcasts Videos Brochures
53
49
41
49
31
3435
30
25
13
21
2018
11
4 3 4 3 4
60
Figure 36 In which phase of the purchasing cycle did you FIRST consume each type of collateral
28
Our 2010 survey indicates that these habits are shifting While the majority of respondents still consume most collateral for the first time in the pre-sales phase more respondents now indicate they first consumed collateral in either the initial sales or mid-sales phases than they did in 2008 For example the percentage of respondents who first consumed a white paper during the pre-sales process dropped to 53 percent the percentage that listened to a podcast dropped down to 41 percent (Figure 36) In both cases respondents appeared to move their first consumption of those types of collateral down to the next two stages of the sales process
When we further segmented the 2010 data to compare the habits of influencers to decision makers we observed some additional interesting trends across the board influencers tend to consume content earlier in the sales cycle than decision makers (Figure 37)
0 10 20 30 40 50 60 70 80
Final salesprocess
Mid-salesprocess
Initial salesprocess
Pre-salesprocess
Final salesprocess
Mid-salesprocess
Initial salesprocess
Pre-salesprocess
White papers Case studies Podcasts Videos Brochures
63
58
41
6458
4752
65
2526
3830
23
915
1417
9
2111
2
4542
3647
56
3339
3430
27
1614
2319
12
65
74
5
25
26
35
20
4
Infl
uen
cers
Deci
sio
n M
akers
Figure 37 In which phase of the purchasing cycle did you FIRST consume each type of collateral (influencers vs decision makers)
29
Likewise respondents from small businesses consume collateral for the first time during the pre-sales stage at much higher rates than respondents from middle-market or large companies For example 70 percent of small businesses consume white papers for the first time during this stage compared to just 40 percent of middle-market firms and 56 percent of large enterprises (Figure 38)
Small Business Mid-market Enterprise
0
10
20
30
40
50
60
70
80
Final sales processMid-sales processInitial Sales ProcessPre-sales Process
70
40
56
16
38
29
9
17
12
5 53
Figure 38 In which phase of the purchasing cycle did you FIRST consume white papers in 2010
As in previous years we find the data around use of collateral in the sales cycle interesting in the way it potentially sheds light on the relationship between influencers and decion makers We believe we are seeing the influencerrsquos role in terms of considering potential technology purchases and the subsequent sharing of that collatera and other information with decision makers a bit later in the cycle
30
BEST PRACTICES FOR THE REAL WORLD
As in previous years we conclude our delivery of the survey results by providing what we consider to be actionable advice that marketing professionals can apply right now to improve the quality and impact of their communications assets
1 Create white papers This is a repeating theme but one that is definitely worth saying once again white papers are frequently consumed and considered highly influential over the technology purchase Take advantage by creating a few well-written papers that clearly outline strategic advancements your solutions and products are aligned with Leverage your work by chunking up the main points into best practice documents blog posts ldquohow tordquo guides and other materials to support your broader campaign needs
2 Embed multimedia files Start with short video or audio clips to keep overall file sizes low but jump on this trend Once you get your feet under you you can advance to interactive charts and graphs Flash elements and other media types Donrsquot ignore the opportunity to be among the first to take advantage of this evolving practice
3 Consider all content to be social content We know that tech purchasers share content and that they consider materials forwarded from a personal contact to be very influential Plan all content and collateral assets from the perspective of stimulating discussion and sharing Think about interactivity links to discussion boards and user groups and point to blog posts and other communications channels in all materials
4 Deliver all content assets digitally and be prepared to have end users print them While the majority of respondents view collateral assets on the desktop a respectable number still enjoy printing out the materials they download and will further share print materials with others Avoid cross-page spreads and column designs that are hard to read digitally and remember to provide clear URLs for any links away from the materials for those reading print versions
5 Merchandise content on the Web Your company Web site is the most frequent location for obtaining content and it ranks second only to personal contacts in terms of influence Make the most of this channel by merchandising featured content and assets on landing pages and microsites that extend the thought leadership and discussion begun in your collateral Remember potential purchasers interact with your content before they interact with you so ensure viewers can easily see all the other channels through which they can engage with you all in one fun-filled information portal
31
CONCLUSIONAs we wrap up this yearrsquos annual survey report we find ourselves coming back to some basic advice that has been a theme of this section in each previous report plan
Eccolo believes that the requirement of content strategymdashidentifying communication topics and thoughtfully planning the assets required to achieve goalsmdashis relevant at every level of the marketing organization The proliferation of online channels and ever more sophisticated lead generation systems require a steady stream of fresh relevant content to successfully engage purchasers Itrsquos very easy to be distracted by looming deadlines and shifting priorities but creating a content strategy and identifying a clear development roadmap that describes topic format and channel is essential if you truly want to improve results
And the opportunity to improve results is significant Well-planned development cycles can shorten time to market reduce costs and ensure a consistent message across all external assets Further organizations that show a healthy respect for content planning and development from the top down will experience the entire enterprise shifting to a more responsive stance These companies are tuned toward deeper customer conversations that align with the end userrsquos preferences for sales and marketing information and by the very style of their collateral assets signal a positive experience for the potential buyer
Engage With UsEccolo Media welcomes your feedback on this report Email us at infoeccolomediacom with specific feedback or visit our blog at httpeccolomediatypepadcom to join in our ongoing discussion of best practices in content strategy
ACKNOWLEDGEMENTSWe would like to acknowledge the participation of the following team members for their efforts in bringing the Eccolo Media 2010 B2B Technology Collateral Survey Report to life Maite Figueroa Alice LaPlante Lorie Loe Courtney Love and Michael Sudol
32
ABOUT ECCOLO MEDIAEccolo Media specializes in strategic marketing insight and content development for some of the worldrsquos best-known technology companies An agency of exceptional writers Eccolo combines deep experience with ongoing research to identify and apply best practices for producing remarkable content The agency helps align clientsrsquo marketing needs with their key business goals by bringing a proactive innovative approach to the planning and execution of collateral in both traditional and new media channels Founded in 2007 Eccolo Media is headquartered in San Francisco California and fulfills a wide range of project needs throughout the Americas and EMEA Visit our Web site at wwweccolomediacom
ABOUT EMEDIA - Our Marketing Sponsoremedia has specialized in generating B2B sales leads and building demand since 1999 We reach more than 35 million decision makers across over 80 niche-oriented audiences within the following B2B areasInformation Technology ElectronicsSupply ChainLogistics Occupational HealthCorporate Finance Environmental ManagementHuman Resources Project ManagementMarketingSales PackagingConvertingB2B Events Construction amp ArchitectsManufacturing Professional DevelopmentSmall Business Design EngineersProcurement Control EngineersHospitality Management PrintingHealthcare Tech
emediarsquos expertise and personal service permit effective implementation of Guaranteed Cost-per-Lead programs for our clientsrsquo offers and collateral Or we can drive highly targeted traffic to clientsrsquo web pages
Contact emedia at 800-782-6167 630-288-8480 or inquiriesemediausacom
ACCELERATED B2B LEAD GENERATION mdash ON DEMAND
wwwemediausacom

17
2010 these numbers shifted substantially toward a preference for streaming this year 57 percent of respondents preferred streaming versus 43 percent that favored downloading these types of files
This brings the method of consumption of audio files more in line with respondentsrsquo preferences for streaming video Sixty-four percent of 2010 respondents preferred to watch video streamed live from the source versus 36 percent that preferred to download it to a desktop or mobile device (Figure 22)
However whether streamed or downloaded 92 percent of podcast listeners and 96 percent of video viewers still consumed content on the desktop This is a critical finding that has remained consistent from year to year given that the desktop is the platform of choice for consuming all types of content marketers should ensure that all written content leverages links to other files and other communication channels as much as possible giving technology purchasers the option of drilling down to more details as desired
All Collateral Has Viral PotentialWe continue to be interested in the fact that all collateral is highly viral Technology purchasers routinely share collateral with the vast majority of 2010 respondents (89 percent) sharing the white papers they read with others as seen in Figure 23 Nearly as many (87 percent) share case studies followed by podcasts (84 percent) and then brochuresdata sheets and video (80 percent each)
White papers are still the most viral with 34 percent of respondents sharing them with three or more people Thirty-two percent of respondents shared podcasts with three or more people and 28 percent shared case studies with as many Lagging slightly behind were video (25 percent) and brochuresdata sheets (23 percent)
0
20
40
60
80
Downloaded tomobile device
then listented toviewed
Downloaded todesktop
then listened
Streamed fromlive source
5764
35 32
84
Podcasts Videos
Figure 22 Did you consume this content online or did you download before viewinglistening
18
Another interesting development although all collateral is shared primarily in digital form more 2010 respondents say that they share written collateralmdashwhite papers case studies and brochuresdata sheetsmdashin both digital and printed forms (Figure 24) than did respondents to the 2009 survey For example whereas the percentage of respondents who shared digitalelectronic versions of white papers actually declined in the past yearmdashfrom 60 percent to 51 percentmdashthe percentage of respondents who shared white papers in both digital and printed form increased from 30 percent to 37 percent We therefore caution marketers not to discount the viral nature of hard copy content as it clearly still is considered useful by a significant percentage of respondents
In 2009 influencers were more likely to share only digital copy and decision makers were more likely to share both printed and digital content However in 2010 this is no longer the case and these two respondent types are now in parity on this issue
0
5
10
15
20
25
30
35
White papers Case studies Podcasts Videos Brochures
5 or more
43210
11
13
16
20 20
23
28
25 25
30
33
31
27
30
19
14
17
12
6 6
9
7
5
8 8
6 6 6
12
27
Figure 23 On average how many other decision makers or influencers in your organization did you share each piece of collateral with
19
Preferences For Length Are ChangingEccolo Media has established best practices for serving up marketing collateral in small well-written packages Our survey results over the past three years have reinforced our belief that this serves marketers best However this year we observed subtleties in the survey results that indicated respondents may be adjusting their preferences for longer collateral length
White papersWersquove stated repeatedly that white papers are a highly influential collateral consumed at a high frequency by both decision makers and influencers But marketing communications professionals continue to debate the ideal length of a white paper how do they give the right amount of informationmdashnot too much and not too little As Figure 25 shows the majority of respondents (55 percent) felt six pages or less to be the ideal number However this percentage is 10 points less than last yearrsquos 65 percent
Figure 25 What do you feel is the ideal length for a white paper in number of pages
0
10
20
30
40
50
More than10 pages
10 pages8 pages6 pages4 pages
21
34
27
13
5
Figure 24 In what format did you share collateral
0
10
20
30
40
50
60
70
BrochuresCasestudies
Whitepapers
51
37
52
12
35
12
49
19
32
Digitalelectronic version Hard copy Both
20
Simultaneously the percentage of respondents who preferred white papers of just four pages dropped from 24 percent down to 21 percent and the percentage of respondents who leaned toward eight pages increased from 21 percent to 27 percent This indicates that the ldquoideal lengthrdquo is shifting toward longer rather than shorter white papers
There were no general differences in length preferences between decision makers and influencers but technology purchasers from small companies tend to prefer shorter white papers with 31 percent preferring four pages or less compared to 19 percent of enterprise and 18 percent of mid-market companies that said the same
Case StudiesIn 2008 most respondents reported the ideal length of a case study to be two pages or approximately 800 to 1000 words Yet in 2009 we received different responses That year the largest proportion of respondents (39 percent) indicated that four is the ideal number of pages for a written case study This yearrsquos 2010 survey backed up last yearrsquos numbers with 37 percent preferring four pages and virtually identical percentages of respondents preferring two pages or less (35 percent) or six pages or more (28 percent) as seen in Figure 26
In general the larger the company the longer they prefer their case studies to be with the largest percentage of respondents from small companies (33 percent) preferring two-page case studies the largest percentage from middle-market firms (40 percent) and large enterprises (39 percent) preferring four-page case studies
Figure 26 What do you feel is the ideal number of pages for a case studysuccess story
0
10
20
30
40
50
More than6 pages
6 pages4 pages2 pages1 page
8
27
37
19
9
21
Podcasts The ideal length of a podcast decreased in 2010 Figure 27 shows that the greatest number of respondents (36 percent) selected five to seven minutes as the ideal length Most respondents (81 percent) prefer podcasts that are 10 minutes or less in length and in general the smaller the company the shorter they prefer their podcasts to be
Video The majority of 2010 respondents (38 percent) indicated that the ideal length of video content is five to seven minutes while 24 percent preferred videos of eight to 10 minutes (Figure 28) These results indicate a slight trending to shorter videos over the 2009 respondentrsquos preferences for length where 31 percent preferred five to seven minutes and 28 percent preferred eight to 10 minutes
Figure 28 What do you feel is the ideal length of a video in number of minutes
0
10
20
30
40
More than15 minutes
11 to 15minutes
8 to 10minutes
5 to 7minutes
2 to 4minutes
Less than2 minutes
6 5
19
38
24
8
Figure 27 What do you feel is the ideal length of a podcastaudio file in number of minutes
0
10
20
30
40
More than15 minutes
11 to 15minutes
8 to 10minutes
5 to 7minutes
2 to 4minutes
Less than2 minutes
4
15
36
26
13
6
22
The Emergence of Embedded Audio and Video in Written Collateral Over the past 12 months Eccolo has participated in an emerging trend in marketing collateral embedding audio and video files into digital versions of written documents such as white papers and case studies We therefore asked respondents if they had consumed any written collateral that contained embedded audio andor video files A significant proportion of themmdash45 percentmdashsaid they had done so
Respondents were most likely to encounter embedded files in case studies (66 percent) followed by white papers (55 percent) and brochures (48 percent) (Figure 29)
Perhaps the most dramatic of our findings in this part of the survey was the overwhelming percentage of respondents who clicked through to these embedded files 93 percent Twenty-five percent clicked through to video files six percent clicked through to audio files and 62 percent clicked through to both audio and video (Figure 30)
And most importantly when respondents were asked whether the inclusion of audio or video files positively or negatively affected the overall influence of the written collateral 80 percent indicated that they viewed it either ldquovery positivelyrdquo or ldquopositivelyrdquo (Figure 31)
0
10
20
30
40
50
60
70
80
OtherBrochuresCase studiesWhite paper
55
66
48
1
Figure 29 Which types of written collateral have you consumed that included embedded audio or video
23
In particular decision makers felt this trend was positive 83 percent ranked it as very positively or positively affecting the overall influence of the written collateral compared to 74 percent of influencers (Figure 32)
The size of company also mattered when it came to the perceived influence of embedded files with enterprises more likely to indicate that it was very positive (26 percent) compared to middle-market (14 percent) or small firms (15 percent) On a related note small businesses were more likely to say that embedded files had no influence at allmdash33 percent versus 15 percent of middle-market and 15 percent of enterprise firms (Figure 33)
0
10
20
30
40
50
60
70
80
NeitherBoth audiovideoAudio onlyVideo only
25
6
62
7
Figure 30 Did you click through or open any of the video or audio files embedded in the collateral
0
10
20
30
40
50
60
70
Very negativelyNegativelyNo influencePositivelyVery positively
18
62
18
1 1
Figure 31 How did the inclusion of embedded audio and video files affect the overall influence of the written collateral
24
These results support Eccolorsquos belief that interactivity is becoming ldquotable stakesrdquo for written marketing communications collateral Given the preference that purchasers have already expressed for consuming collateral at their desktop (see Figure 22) marketers that donrsquot experiment with embedded ausio video and other multimedia formats as well as links off to other communications and social media channels risk delivering assets that seem obsolete and old-fashioned
Figure 32 How did the inclusion of embedded audio and video files affect the overall influence of the written collateral
(decision makers versus influencers)
0
20
40
60
80
Very NegativelyNegativelyNo InfluencePositivelyVery Positively
24
59
66
15
26
1 0 018
Decision maker Influencer
0
10
20
30
40
50
60
70
80
Very negativelyNegativelyNo influencePositivelyVery positively
15 14
26
52
69
59
33
15 15
0 1 0 0 1 0
Small business Mid-market Enterprise
Figure 33 How did the inclusion of embedded audio and video files affect the overall influence of the written collateral
(small business vs mid-market vs enterprise)
25
The Channel EffectLast year we added a section to our annual survey that investigated how channel affects the perceived influence of collateral We defined channel as the specific avenue through which the respondent receives contentmdashwhether from a personal contact from a corporate Web site or from a sales representative for example
One fact immediately stood out in 2009 most respondents receive written collateral through the corporate Web site (Figure 34) This did not change in 2010 with 71 percent of respondents finding white papers through such sites 65 percent getting brochuresdata sheets through that channel and 56 percent acquiring case studies in that way
The next most frequently used channel for receiving a white paper in 2010 was a download from a direct response campaign (59 percent) which implies that this should be considered an important means of distribution for marketers This was followed by forwarded by a sales repcompany contact (54 percent) obtained from a personal contact (52 percent) accessed via social media (39 percent) and absorbed through webinars (34 percent) In 2009 podcasts and video collateral differed from written content when it came to how respondents ldquofoundrdquo them but that difference
0
10
20
30
40
50
60
70
80
Mentioned ina webinar
Linked to ordiscussed in
onlinesocial media
Linked in toan RSS feed
Forwarded bysales rep
company contact
BrowsingcorporateWeb site
Downloadedfrom
direct responsecampaign
Forwardedfrom
personalcontact
White papers Case studies Podcasts Videos Brochures
5253
46
34
37
59
71
5655
6665
54
4241
38
27
23
31
39
31
39
29
23
34
20
23
20
12
21
15
44
38
45
34 34
Figure 34 Through which channels have you received collateral
26
has vanished Last year podcasts were almost equally acquired from a personal contact or from a corporate Web site (48 percent and 49 percent respectively) However this year the corporate Web site trumped the personal contact channel (55 percent to 46 percent) And this was even more dramatically the case for video with only 34 percent of respondents indicating they had been forwarded a video by a personal contact while 66 percent found video on corporate Web sites This trend underscores the importance of the corporate Web site across all collateral types
When we examined the comparative influence of these various channels another interesting fact emerged although a piece of collateral referred to or forwarded by a personal contact was most frequently cited as the most influential channel for all types of collateral browsing the corporate Web site was the second most frequently cited answer (Figure 35) When you consider that the corporate Web site is clearly the most frequently used channel for collateral delivery coupled with its high perceived influence you understand why we recommend that you make investing in and frequently refreshing your Web site a priority
0
10
20
30
40
50
60
70
80
Mentioned ina webinar
Linked to ordiscussed in
onlinesocial media
Linked in toan RSS feed
Forwarded bysales rep
company contact
BrowsingcorporateWeb site
Downloadedfrom
direct responsecampaign
Forwardedfrom
personalcontact
White papers Case studies Podcasts Videos Brochures
73
79
767677
41
38
424343
6060
53
61
69
37
33
28
39
46
2220
31
1716
35
42
3836
31 31
27
33
29
19
Figure 35 Positive influence by channel
27
Marketing Collateral in the Sales CycleThe relationship between collateral and actual sales is an important one How do the various types of collateralmdashwhite papers case studies brochuresmdashimpact sales When should you deliver a white paper case study podcast or video to drive potential purchasers to the next step in the sales cycle Is there a way to time delivery of specific collateral types to nurture leads more effectively
For the purposes of this survey we defined the various stages of the technology evaluation and purchase process as
bull Pre-salemdashConsidering solutions and vendors
bull Initial salemdashReviewing vendor qualifications capabilities and RFP responses
bull Mid-salemdashReviewing details of the solution with one vendor
bull Final salemdashCustomization negotiation and procurement
In our 2008 survey results we saw that respondents most frequently consumed each collateral type for the first time in the pre-sale process by a significant margin that is before they send out RFPs or initiate discussions with specific vendors In that first Eccolo B2B survey white papers were read by 61 percent of respondents during this phase case studies by 48 percent podcasts by 53 percent video by 51 percent and brochuresdata sheets by 62 percent
0
10
20
30
40
50
60
70
Final sales processMid-sales processInitial sales processPre-sales process
White papers Case studies Podcasts Videos Brochures
53
49
41
49
31
3435
30
25
13
21
2018
11
4 3 4 3 4
60
Figure 36 In which phase of the purchasing cycle did you FIRST consume each type of collateral
28
Our 2010 survey indicates that these habits are shifting While the majority of respondents still consume most collateral for the first time in the pre-sales phase more respondents now indicate they first consumed collateral in either the initial sales or mid-sales phases than they did in 2008 For example the percentage of respondents who first consumed a white paper during the pre-sales process dropped to 53 percent the percentage that listened to a podcast dropped down to 41 percent (Figure 36) In both cases respondents appeared to move their first consumption of those types of collateral down to the next two stages of the sales process
When we further segmented the 2010 data to compare the habits of influencers to decision makers we observed some additional interesting trends across the board influencers tend to consume content earlier in the sales cycle than decision makers (Figure 37)
0 10 20 30 40 50 60 70 80
Final salesprocess
Mid-salesprocess
Initial salesprocess
Pre-salesprocess
Final salesprocess
Mid-salesprocess
Initial salesprocess
Pre-salesprocess
White papers Case studies Podcasts Videos Brochures
63
58
41
6458
4752
65
2526
3830
23
915
1417
9
2111
2
4542
3647
56
3339
3430
27
1614
2319
12
65
74
5
25
26
35
20
4
Infl
uen
cers
Deci
sio
n M
akers
Figure 37 In which phase of the purchasing cycle did you FIRST consume each type of collateral (influencers vs decision makers)
29
Likewise respondents from small businesses consume collateral for the first time during the pre-sales stage at much higher rates than respondents from middle-market or large companies For example 70 percent of small businesses consume white papers for the first time during this stage compared to just 40 percent of middle-market firms and 56 percent of large enterprises (Figure 38)
Small Business Mid-market Enterprise
0
10
20
30
40
50
60
70
80
Final sales processMid-sales processInitial Sales ProcessPre-sales Process
70
40
56
16
38
29
9
17
12
5 53
Figure 38 In which phase of the purchasing cycle did you FIRST consume white papers in 2010
As in previous years we find the data around use of collateral in the sales cycle interesting in the way it potentially sheds light on the relationship between influencers and decion makers We believe we are seeing the influencerrsquos role in terms of considering potential technology purchases and the subsequent sharing of that collatera and other information with decision makers a bit later in the cycle
30
BEST PRACTICES FOR THE REAL WORLD
As in previous years we conclude our delivery of the survey results by providing what we consider to be actionable advice that marketing professionals can apply right now to improve the quality and impact of their communications assets
1 Create white papers This is a repeating theme but one that is definitely worth saying once again white papers are frequently consumed and considered highly influential over the technology purchase Take advantage by creating a few well-written papers that clearly outline strategic advancements your solutions and products are aligned with Leverage your work by chunking up the main points into best practice documents blog posts ldquohow tordquo guides and other materials to support your broader campaign needs
2 Embed multimedia files Start with short video or audio clips to keep overall file sizes low but jump on this trend Once you get your feet under you you can advance to interactive charts and graphs Flash elements and other media types Donrsquot ignore the opportunity to be among the first to take advantage of this evolving practice
3 Consider all content to be social content We know that tech purchasers share content and that they consider materials forwarded from a personal contact to be very influential Plan all content and collateral assets from the perspective of stimulating discussion and sharing Think about interactivity links to discussion boards and user groups and point to blog posts and other communications channels in all materials
4 Deliver all content assets digitally and be prepared to have end users print them While the majority of respondents view collateral assets on the desktop a respectable number still enjoy printing out the materials they download and will further share print materials with others Avoid cross-page spreads and column designs that are hard to read digitally and remember to provide clear URLs for any links away from the materials for those reading print versions
5 Merchandise content on the Web Your company Web site is the most frequent location for obtaining content and it ranks second only to personal contacts in terms of influence Make the most of this channel by merchandising featured content and assets on landing pages and microsites that extend the thought leadership and discussion begun in your collateral Remember potential purchasers interact with your content before they interact with you so ensure viewers can easily see all the other channels through which they can engage with you all in one fun-filled information portal
31
CONCLUSIONAs we wrap up this yearrsquos annual survey report we find ourselves coming back to some basic advice that has been a theme of this section in each previous report plan
Eccolo believes that the requirement of content strategymdashidentifying communication topics and thoughtfully planning the assets required to achieve goalsmdashis relevant at every level of the marketing organization The proliferation of online channels and ever more sophisticated lead generation systems require a steady stream of fresh relevant content to successfully engage purchasers Itrsquos very easy to be distracted by looming deadlines and shifting priorities but creating a content strategy and identifying a clear development roadmap that describes topic format and channel is essential if you truly want to improve results
And the opportunity to improve results is significant Well-planned development cycles can shorten time to market reduce costs and ensure a consistent message across all external assets Further organizations that show a healthy respect for content planning and development from the top down will experience the entire enterprise shifting to a more responsive stance These companies are tuned toward deeper customer conversations that align with the end userrsquos preferences for sales and marketing information and by the very style of their collateral assets signal a positive experience for the potential buyer
Engage With UsEccolo Media welcomes your feedback on this report Email us at infoeccolomediacom with specific feedback or visit our blog at httpeccolomediatypepadcom to join in our ongoing discussion of best practices in content strategy
ACKNOWLEDGEMENTSWe would like to acknowledge the participation of the following team members for their efforts in bringing the Eccolo Media 2010 B2B Technology Collateral Survey Report to life Maite Figueroa Alice LaPlante Lorie Loe Courtney Love and Michael Sudol
32
ABOUT ECCOLO MEDIAEccolo Media specializes in strategic marketing insight and content development for some of the worldrsquos best-known technology companies An agency of exceptional writers Eccolo combines deep experience with ongoing research to identify and apply best practices for producing remarkable content The agency helps align clientsrsquo marketing needs with their key business goals by bringing a proactive innovative approach to the planning and execution of collateral in both traditional and new media channels Founded in 2007 Eccolo Media is headquartered in San Francisco California and fulfills a wide range of project needs throughout the Americas and EMEA Visit our Web site at wwweccolomediacom
ABOUT EMEDIA - Our Marketing Sponsoremedia has specialized in generating B2B sales leads and building demand since 1999 We reach more than 35 million decision makers across over 80 niche-oriented audiences within the following B2B areasInformation Technology ElectronicsSupply ChainLogistics Occupational HealthCorporate Finance Environmental ManagementHuman Resources Project ManagementMarketingSales PackagingConvertingB2B Events Construction amp ArchitectsManufacturing Professional DevelopmentSmall Business Design EngineersProcurement Control EngineersHospitality Management PrintingHealthcare Tech
emediarsquos expertise and personal service permit effective implementation of Guaranteed Cost-per-Lead programs for our clientsrsquo offers and collateral Or we can drive highly targeted traffic to clientsrsquo web pages
Contact emedia at 800-782-6167 630-288-8480 or inquiriesemediausacom
ACCELERATED B2B LEAD GENERATION mdash ON DEMAND
wwwemediausacom

18
Another interesting development although all collateral is shared primarily in digital form more 2010 respondents say that they share written collateralmdashwhite papers case studies and brochuresdata sheetsmdashin both digital and printed forms (Figure 24) than did respondents to the 2009 survey For example whereas the percentage of respondents who shared digitalelectronic versions of white papers actually declined in the past yearmdashfrom 60 percent to 51 percentmdashthe percentage of respondents who shared white papers in both digital and printed form increased from 30 percent to 37 percent We therefore caution marketers not to discount the viral nature of hard copy content as it clearly still is considered useful by a significant percentage of respondents
In 2009 influencers were more likely to share only digital copy and decision makers were more likely to share both printed and digital content However in 2010 this is no longer the case and these two respondent types are now in parity on this issue
0
5
10
15
20
25
30
35
White papers Case studies Podcasts Videos Brochures
5 or more
43210
11
13
16
20 20
23
28
25 25
30
33
31
27
30
19
14
17
12
6 6
9
7
5
8 8
6 6 6
12
27
Figure 23 On average how many other decision makers or influencers in your organization did you share each piece of collateral with
19
Preferences For Length Are ChangingEccolo Media has established best practices for serving up marketing collateral in small well-written packages Our survey results over the past three years have reinforced our belief that this serves marketers best However this year we observed subtleties in the survey results that indicated respondents may be adjusting their preferences for longer collateral length
White papersWersquove stated repeatedly that white papers are a highly influential collateral consumed at a high frequency by both decision makers and influencers But marketing communications professionals continue to debate the ideal length of a white paper how do they give the right amount of informationmdashnot too much and not too little As Figure 25 shows the majority of respondents (55 percent) felt six pages or less to be the ideal number However this percentage is 10 points less than last yearrsquos 65 percent
Figure 25 What do you feel is the ideal length for a white paper in number of pages
0
10
20
30
40
50
More than10 pages
10 pages8 pages6 pages4 pages
21
34
27
13
5
Figure 24 In what format did you share collateral
0
10
20
30
40
50
60
70
BrochuresCasestudies
Whitepapers
51
37
52
12
35
12
49
19
32
Digitalelectronic version Hard copy Both
20
Simultaneously the percentage of respondents who preferred white papers of just four pages dropped from 24 percent down to 21 percent and the percentage of respondents who leaned toward eight pages increased from 21 percent to 27 percent This indicates that the ldquoideal lengthrdquo is shifting toward longer rather than shorter white papers
There were no general differences in length preferences between decision makers and influencers but technology purchasers from small companies tend to prefer shorter white papers with 31 percent preferring four pages or less compared to 19 percent of enterprise and 18 percent of mid-market companies that said the same
Case StudiesIn 2008 most respondents reported the ideal length of a case study to be two pages or approximately 800 to 1000 words Yet in 2009 we received different responses That year the largest proportion of respondents (39 percent) indicated that four is the ideal number of pages for a written case study This yearrsquos 2010 survey backed up last yearrsquos numbers with 37 percent preferring four pages and virtually identical percentages of respondents preferring two pages or less (35 percent) or six pages or more (28 percent) as seen in Figure 26
In general the larger the company the longer they prefer their case studies to be with the largest percentage of respondents from small companies (33 percent) preferring two-page case studies the largest percentage from middle-market firms (40 percent) and large enterprises (39 percent) preferring four-page case studies
Figure 26 What do you feel is the ideal number of pages for a case studysuccess story
0
10
20
30
40
50
More than6 pages
6 pages4 pages2 pages1 page
8
27
37
19
9
21
Podcasts The ideal length of a podcast decreased in 2010 Figure 27 shows that the greatest number of respondents (36 percent) selected five to seven minutes as the ideal length Most respondents (81 percent) prefer podcasts that are 10 minutes or less in length and in general the smaller the company the shorter they prefer their podcasts to be
Video The majority of 2010 respondents (38 percent) indicated that the ideal length of video content is five to seven minutes while 24 percent preferred videos of eight to 10 minutes (Figure 28) These results indicate a slight trending to shorter videos over the 2009 respondentrsquos preferences for length where 31 percent preferred five to seven minutes and 28 percent preferred eight to 10 minutes
Figure 28 What do you feel is the ideal length of a video in number of minutes
0
10
20
30
40
More than15 minutes
11 to 15minutes
8 to 10minutes
5 to 7minutes
2 to 4minutes
Less than2 minutes
6 5
19
38
24
8
Figure 27 What do you feel is the ideal length of a podcastaudio file in number of minutes
0
10
20
30
40
More than15 minutes
11 to 15minutes
8 to 10minutes
5 to 7minutes
2 to 4minutes
Less than2 minutes
4
15
36
26
13
6
22
The Emergence of Embedded Audio and Video in Written Collateral Over the past 12 months Eccolo has participated in an emerging trend in marketing collateral embedding audio and video files into digital versions of written documents such as white papers and case studies We therefore asked respondents if they had consumed any written collateral that contained embedded audio andor video files A significant proportion of themmdash45 percentmdashsaid they had done so
Respondents were most likely to encounter embedded files in case studies (66 percent) followed by white papers (55 percent) and brochures (48 percent) (Figure 29)
Perhaps the most dramatic of our findings in this part of the survey was the overwhelming percentage of respondents who clicked through to these embedded files 93 percent Twenty-five percent clicked through to video files six percent clicked through to audio files and 62 percent clicked through to both audio and video (Figure 30)
And most importantly when respondents were asked whether the inclusion of audio or video files positively or negatively affected the overall influence of the written collateral 80 percent indicated that they viewed it either ldquovery positivelyrdquo or ldquopositivelyrdquo (Figure 31)
0
10
20
30
40
50
60
70
80
OtherBrochuresCase studiesWhite paper
55
66
48
1
Figure 29 Which types of written collateral have you consumed that included embedded audio or video
23
In particular decision makers felt this trend was positive 83 percent ranked it as very positively or positively affecting the overall influence of the written collateral compared to 74 percent of influencers (Figure 32)
The size of company also mattered when it came to the perceived influence of embedded files with enterprises more likely to indicate that it was very positive (26 percent) compared to middle-market (14 percent) or small firms (15 percent) On a related note small businesses were more likely to say that embedded files had no influence at allmdash33 percent versus 15 percent of middle-market and 15 percent of enterprise firms (Figure 33)
0
10
20
30
40
50
60
70
80
NeitherBoth audiovideoAudio onlyVideo only
25
6
62
7
Figure 30 Did you click through or open any of the video or audio files embedded in the collateral
0
10
20
30
40
50
60
70
Very negativelyNegativelyNo influencePositivelyVery positively
18
62
18
1 1
Figure 31 How did the inclusion of embedded audio and video files affect the overall influence of the written collateral
24
These results support Eccolorsquos belief that interactivity is becoming ldquotable stakesrdquo for written marketing communications collateral Given the preference that purchasers have already expressed for consuming collateral at their desktop (see Figure 22) marketers that donrsquot experiment with embedded ausio video and other multimedia formats as well as links off to other communications and social media channels risk delivering assets that seem obsolete and old-fashioned
Figure 32 How did the inclusion of embedded audio and video files affect the overall influence of the written collateral
(decision makers versus influencers)
0
20
40
60
80
Very NegativelyNegativelyNo InfluencePositivelyVery Positively
24
59
66
15
26
1 0 018
Decision maker Influencer
0
10
20
30
40
50
60
70
80
Very negativelyNegativelyNo influencePositivelyVery positively
15 14
26
52
69
59
33
15 15
0 1 0 0 1 0
Small business Mid-market Enterprise
Figure 33 How did the inclusion of embedded audio and video files affect the overall influence of the written collateral
(small business vs mid-market vs enterprise)
25
The Channel EffectLast year we added a section to our annual survey that investigated how channel affects the perceived influence of collateral We defined channel as the specific avenue through which the respondent receives contentmdashwhether from a personal contact from a corporate Web site or from a sales representative for example
One fact immediately stood out in 2009 most respondents receive written collateral through the corporate Web site (Figure 34) This did not change in 2010 with 71 percent of respondents finding white papers through such sites 65 percent getting brochuresdata sheets through that channel and 56 percent acquiring case studies in that way
The next most frequently used channel for receiving a white paper in 2010 was a download from a direct response campaign (59 percent) which implies that this should be considered an important means of distribution for marketers This was followed by forwarded by a sales repcompany contact (54 percent) obtained from a personal contact (52 percent) accessed via social media (39 percent) and absorbed through webinars (34 percent) In 2009 podcasts and video collateral differed from written content when it came to how respondents ldquofoundrdquo them but that difference
0
10
20
30
40
50
60
70
80
Mentioned ina webinar
Linked to ordiscussed in
onlinesocial media
Linked in toan RSS feed
Forwarded bysales rep
company contact
BrowsingcorporateWeb site
Downloadedfrom
direct responsecampaign
Forwardedfrom
personalcontact
White papers Case studies Podcasts Videos Brochures
5253
46
34
37
59
71
5655
6665
54
4241
38
27
23
31
39
31
39
29
23
34
20
23
20
12
21
15
44
38
45
34 34
Figure 34 Through which channels have you received collateral
26
has vanished Last year podcasts were almost equally acquired from a personal contact or from a corporate Web site (48 percent and 49 percent respectively) However this year the corporate Web site trumped the personal contact channel (55 percent to 46 percent) And this was even more dramatically the case for video with only 34 percent of respondents indicating they had been forwarded a video by a personal contact while 66 percent found video on corporate Web sites This trend underscores the importance of the corporate Web site across all collateral types
When we examined the comparative influence of these various channels another interesting fact emerged although a piece of collateral referred to or forwarded by a personal contact was most frequently cited as the most influential channel for all types of collateral browsing the corporate Web site was the second most frequently cited answer (Figure 35) When you consider that the corporate Web site is clearly the most frequently used channel for collateral delivery coupled with its high perceived influence you understand why we recommend that you make investing in and frequently refreshing your Web site a priority
0
10
20
30
40
50
60
70
80
Mentioned ina webinar
Linked to ordiscussed in
onlinesocial media
Linked in toan RSS feed
Forwarded bysales rep
company contact
BrowsingcorporateWeb site
Downloadedfrom
direct responsecampaign
Forwardedfrom
personalcontact
White papers Case studies Podcasts Videos Brochures
73
79
767677
41
38
424343
6060
53
61
69
37
33
28
39
46
2220
31
1716
35
42
3836
31 31
27
33
29
19
Figure 35 Positive influence by channel
27
Marketing Collateral in the Sales CycleThe relationship between collateral and actual sales is an important one How do the various types of collateralmdashwhite papers case studies brochuresmdashimpact sales When should you deliver a white paper case study podcast or video to drive potential purchasers to the next step in the sales cycle Is there a way to time delivery of specific collateral types to nurture leads more effectively
For the purposes of this survey we defined the various stages of the technology evaluation and purchase process as
bull Pre-salemdashConsidering solutions and vendors
bull Initial salemdashReviewing vendor qualifications capabilities and RFP responses
bull Mid-salemdashReviewing details of the solution with one vendor
bull Final salemdashCustomization negotiation and procurement
In our 2008 survey results we saw that respondents most frequently consumed each collateral type for the first time in the pre-sale process by a significant margin that is before they send out RFPs or initiate discussions with specific vendors In that first Eccolo B2B survey white papers were read by 61 percent of respondents during this phase case studies by 48 percent podcasts by 53 percent video by 51 percent and brochuresdata sheets by 62 percent
0
10
20
30
40
50
60
70
Final sales processMid-sales processInitial sales processPre-sales process
White papers Case studies Podcasts Videos Brochures
53
49
41
49
31
3435
30
25
13
21
2018
11
4 3 4 3 4
60
Figure 36 In which phase of the purchasing cycle did you FIRST consume each type of collateral
28
Our 2010 survey indicates that these habits are shifting While the majority of respondents still consume most collateral for the first time in the pre-sales phase more respondents now indicate they first consumed collateral in either the initial sales or mid-sales phases than they did in 2008 For example the percentage of respondents who first consumed a white paper during the pre-sales process dropped to 53 percent the percentage that listened to a podcast dropped down to 41 percent (Figure 36) In both cases respondents appeared to move their first consumption of those types of collateral down to the next two stages of the sales process
When we further segmented the 2010 data to compare the habits of influencers to decision makers we observed some additional interesting trends across the board influencers tend to consume content earlier in the sales cycle than decision makers (Figure 37)
0 10 20 30 40 50 60 70 80
Final salesprocess
Mid-salesprocess
Initial salesprocess
Pre-salesprocess
Final salesprocess
Mid-salesprocess
Initial salesprocess
Pre-salesprocess
White papers Case studies Podcasts Videos Brochures
63
58
41
6458
4752
65
2526
3830
23
915
1417
9
2111
2
4542
3647
56
3339
3430
27
1614
2319
12
65
74
5
25
26
35
20
4
Infl
uen
cers
Deci
sio
n M
akers
Figure 37 In which phase of the purchasing cycle did you FIRST consume each type of collateral (influencers vs decision makers)
29
Likewise respondents from small businesses consume collateral for the first time during the pre-sales stage at much higher rates than respondents from middle-market or large companies For example 70 percent of small businesses consume white papers for the first time during this stage compared to just 40 percent of middle-market firms and 56 percent of large enterprises (Figure 38)
Small Business Mid-market Enterprise
0
10
20
30
40
50
60
70
80
Final sales processMid-sales processInitial Sales ProcessPre-sales Process
70
40
56
16
38
29
9
17
12
5 53
Figure 38 In which phase of the purchasing cycle did you FIRST consume white papers in 2010
As in previous years we find the data around use of collateral in the sales cycle interesting in the way it potentially sheds light on the relationship between influencers and decion makers We believe we are seeing the influencerrsquos role in terms of considering potential technology purchases and the subsequent sharing of that collatera and other information with decision makers a bit later in the cycle
30
BEST PRACTICES FOR THE REAL WORLD
As in previous years we conclude our delivery of the survey results by providing what we consider to be actionable advice that marketing professionals can apply right now to improve the quality and impact of their communications assets
1 Create white papers This is a repeating theme but one that is definitely worth saying once again white papers are frequently consumed and considered highly influential over the technology purchase Take advantage by creating a few well-written papers that clearly outline strategic advancements your solutions and products are aligned with Leverage your work by chunking up the main points into best practice documents blog posts ldquohow tordquo guides and other materials to support your broader campaign needs
2 Embed multimedia files Start with short video or audio clips to keep overall file sizes low but jump on this trend Once you get your feet under you you can advance to interactive charts and graphs Flash elements and other media types Donrsquot ignore the opportunity to be among the first to take advantage of this evolving practice
3 Consider all content to be social content We know that tech purchasers share content and that they consider materials forwarded from a personal contact to be very influential Plan all content and collateral assets from the perspective of stimulating discussion and sharing Think about interactivity links to discussion boards and user groups and point to blog posts and other communications channels in all materials
4 Deliver all content assets digitally and be prepared to have end users print them While the majority of respondents view collateral assets on the desktop a respectable number still enjoy printing out the materials they download and will further share print materials with others Avoid cross-page spreads and column designs that are hard to read digitally and remember to provide clear URLs for any links away from the materials for those reading print versions
5 Merchandise content on the Web Your company Web site is the most frequent location for obtaining content and it ranks second only to personal contacts in terms of influence Make the most of this channel by merchandising featured content and assets on landing pages and microsites that extend the thought leadership and discussion begun in your collateral Remember potential purchasers interact with your content before they interact with you so ensure viewers can easily see all the other channels through which they can engage with you all in one fun-filled information portal
31
CONCLUSIONAs we wrap up this yearrsquos annual survey report we find ourselves coming back to some basic advice that has been a theme of this section in each previous report plan
Eccolo believes that the requirement of content strategymdashidentifying communication topics and thoughtfully planning the assets required to achieve goalsmdashis relevant at every level of the marketing organization The proliferation of online channels and ever more sophisticated lead generation systems require a steady stream of fresh relevant content to successfully engage purchasers Itrsquos very easy to be distracted by looming deadlines and shifting priorities but creating a content strategy and identifying a clear development roadmap that describes topic format and channel is essential if you truly want to improve results
And the opportunity to improve results is significant Well-planned development cycles can shorten time to market reduce costs and ensure a consistent message across all external assets Further organizations that show a healthy respect for content planning and development from the top down will experience the entire enterprise shifting to a more responsive stance These companies are tuned toward deeper customer conversations that align with the end userrsquos preferences for sales and marketing information and by the very style of their collateral assets signal a positive experience for the potential buyer
Engage With UsEccolo Media welcomes your feedback on this report Email us at infoeccolomediacom with specific feedback or visit our blog at httpeccolomediatypepadcom to join in our ongoing discussion of best practices in content strategy
ACKNOWLEDGEMENTSWe would like to acknowledge the participation of the following team members for their efforts in bringing the Eccolo Media 2010 B2B Technology Collateral Survey Report to life Maite Figueroa Alice LaPlante Lorie Loe Courtney Love and Michael Sudol
32
ABOUT ECCOLO MEDIAEccolo Media specializes in strategic marketing insight and content development for some of the worldrsquos best-known technology companies An agency of exceptional writers Eccolo combines deep experience with ongoing research to identify and apply best practices for producing remarkable content The agency helps align clientsrsquo marketing needs with their key business goals by bringing a proactive innovative approach to the planning and execution of collateral in both traditional and new media channels Founded in 2007 Eccolo Media is headquartered in San Francisco California and fulfills a wide range of project needs throughout the Americas and EMEA Visit our Web site at wwweccolomediacom
ABOUT EMEDIA - Our Marketing Sponsoremedia has specialized in generating B2B sales leads and building demand since 1999 We reach more than 35 million decision makers across over 80 niche-oriented audiences within the following B2B areasInformation Technology ElectronicsSupply ChainLogistics Occupational HealthCorporate Finance Environmental ManagementHuman Resources Project ManagementMarketingSales PackagingConvertingB2B Events Construction amp ArchitectsManufacturing Professional DevelopmentSmall Business Design EngineersProcurement Control EngineersHospitality Management PrintingHealthcare Tech
emediarsquos expertise and personal service permit effective implementation of Guaranteed Cost-per-Lead programs for our clientsrsquo offers and collateral Or we can drive highly targeted traffic to clientsrsquo web pages
Contact emedia at 800-782-6167 630-288-8480 or inquiriesemediausacom
ACCELERATED B2B LEAD GENERATION mdash ON DEMAND
wwwemediausacom

19
Preferences For Length Are ChangingEccolo Media has established best practices for serving up marketing collateral in small well-written packages Our survey results over the past three years have reinforced our belief that this serves marketers best However this year we observed subtleties in the survey results that indicated respondents may be adjusting their preferences for longer collateral length
White papersWersquove stated repeatedly that white papers are a highly influential collateral consumed at a high frequency by both decision makers and influencers But marketing communications professionals continue to debate the ideal length of a white paper how do they give the right amount of informationmdashnot too much and not too little As Figure 25 shows the majority of respondents (55 percent) felt six pages or less to be the ideal number However this percentage is 10 points less than last yearrsquos 65 percent
Figure 25 What do you feel is the ideal length for a white paper in number of pages
0
10
20
30
40
50
More than10 pages
10 pages8 pages6 pages4 pages
21
34
27
13
5
Figure 24 In what format did you share collateral
0
10
20
30
40
50
60
70
BrochuresCasestudies
Whitepapers
51
37
52
12
35
12
49
19
32
Digitalelectronic version Hard copy Both
20
Simultaneously the percentage of respondents who preferred white papers of just four pages dropped from 24 percent down to 21 percent and the percentage of respondents who leaned toward eight pages increased from 21 percent to 27 percent This indicates that the ldquoideal lengthrdquo is shifting toward longer rather than shorter white papers
There were no general differences in length preferences between decision makers and influencers but technology purchasers from small companies tend to prefer shorter white papers with 31 percent preferring four pages or less compared to 19 percent of enterprise and 18 percent of mid-market companies that said the same
Case StudiesIn 2008 most respondents reported the ideal length of a case study to be two pages or approximately 800 to 1000 words Yet in 2009 we received different responses That year the largest proportion of respondents (39 percent) indicated that four is the ideal number of pages for a written case study This yearrsquos 2010 survey backed up last yearrsquos numbers with 37 percent preferring four pages and virtually identical percentages of respondents preferring two pages or less (35 percent) or six pages or more (28 percent) as seen in Figure 26
In general the larger the company the longer they prefer their case studies to be with the largest percentage of respondents from small companies (33 percent) preferring two-page case studies the largest percentage from middle-market firms (40 percent) and large enterprises (39 percent) preferring four-page case studies
Figure 26 What do you feel is the ideal number of pages for a case studysuccess story
0
10
20
30
40
50
More than6 pages
6 pages4 pages2 pages1 page
8
27
37
19
9
21
Podcasts The ideal length of a podcast decreased in 2010 Figure 27 shows that the greatest number of respondents (36 percent) selected five to seven minutes as the ideal length Most respondents (81 percent) prefer podcasts that are 10 minutes or less in length and in general the smaller the company the shorter they prefer their podcasts to be
Video The majority of 2010 respondents (38 percent) indicated that the ideal length of video content is five to seven minutes while 24 percent preferred videos of eight to 10 minutes (Figure 28) These results indicate a slight trending to shorter videos over the 2009 respondentrsquos preferences for length where 31 percent preferred five to seven minutes and 28 percent preferred eight to 10 minutes
Figure 28 What do you feel is the ideal length of a video in number of minutes
0
10
20
30
40
More than15 minutes
11 to 15minutes
8 to 10minutes
5 to 7minutes
2 to 4minutes
Less than2 minutes
6 5
19
38
24
8
Figure 27 What do you feel is the ideal length of a podcastaudio file in number of minutes
0
10
20
30
40
More than15 minutes
11 to 15minutes
8 to 10minutes
5 to 7minutes
2 to 4minutes
Less than2 minutes
4
15
36
26
13
6
22
The Emergence of Embedded Audio and Video in Written Collateral Over the past 12 months Eccolo has participated in an emerging trend in marketing collateral embedding audio and video files into digital versions of written documents such as white papers and case studies We therefore asked respondents if they had consumed any written collateral that contained embedded audio andor video files A significant proportion of themmdash45 percentmdashsaid they had done so
Respondents were most likely to encounter embedded files in case studies (66 percent) followed by white papers (55 percent) and brochures (48 percent) (Figure 29)
Perhaps the most dramatic of our findings in this part of the survey was the overwhelming percentage of respondents who clicked through to these embedded files 93 percent Twenty-five percent clicked through to video files six percent clicked through to audio files and 62 percent clicked through to both audio and video (Figure 30)
And most importantly when respondents were asked whether the inclusion of audio or video files positively or negatively affected the overall influence of the written collateral 80 percent indicated that they viewed it either ldquovery positivelyrdquo or ldquopositivelyrdquo (Figure 31)
0
10
20
30
40
50
60
70
80
OtherBrochuresCase studiesWhite paper
55
66
48
1
Figure 29 Which types of written collateral have you consumed that included embedded audio or video
23
In particular decision makers felt this trend was positive 83 percent ranked it as very positively or positively affecting the overall influence of the written collateral compared to 74 percent of influencers (Figure 32)
The size of company also mattered when it came to the perceived influence of embedded files with enterprises more likely to indicate that it was very positive (26 percent) compared to middle-market (14 percent) or small firms (15 percent) On a related note small businesses were more likely to say that embedded files had no influence at allmdash33 percent versus 15 percent of middle-market and 15 percent of enterprise firms (Figure 33)
0
10
20
30
40
50
60
70
80
NeitherBoth audiovideoAudio onlyVideo only
25
6
62
7
Figure 30 Did you click through or open any of the video or audio files embedded in the collateral
0
10
20
30
40
50
60
70
Very negativelyNegativelyNo influencePositivelyVery positively
18
62
18
1 1
Figure 31 How did the inclusion of embedded audio and video files affect the overall influence of the written collateral
24
These results support Eccolorsquos belief that interactivity is becoming ldquotable stakesrdquo for written marketing communications collateral Given the preference that purchasers have already expressed for consuming collateral at their desktop (see Figure 22) marketers that donrsquot experiment with embedded ausio video and other multimedia formats as well as links off to other communications and social media channels risk delivering assets that seem obsolete and old-fashioned
Figure 32 How did the inclusion of embedded audio and video files affect the overall influence of the written collateral
(decision makers versus influencers)
0
20
40
60
80
Very NegativelyNegativelyNo InfluencePositivelyVery Positively
24
59
66
15
26
1 0 018
Decision maker Influencer
0
10
20
30
40
50
60
70
80
Very negativelyNegativelyNo influencePositivelyVery positively
15 14
26
52
69
59
33
15 15
0 1 0 0 1 0
Small business Mid-market Enterprise
Figure 33 How did the inclusion of embedded audio and video files affect the overall influence of the written collateral
(small business vs mid-market vs enterprise)
25
The Channel EffectLast year we added a section to our annual survey that investigated how channel affects the perceived influence of collateral We defined channel as the specific avenue through which the respondent receives contentmdashwhether from a personal contact from a corporate Web site or from a sales representative for example
One fact immediately stood out in 2009 most respondents receive written collateral through the corporate Web site (Figure 34) This did not change in 2010 with 71 percent of respondents finding white papers through such sites 65 percent getting brochuresdata sheets through that channel and 56 percent acquiring case studies in that way
The next most frequently used channel for receiving a white paper in 2010 was a download from a direct response campaign (59 percent) which implies that this should be considered an important means of distribution for marketers This was followed by forwarded by a sales repcompany contact (54 percent) obtained from a personal contact (52 percent) accessed via social media (39 percent) and absorbed through webinars (34 percent) In 2009 podcasts and video collateral differed from written content when it came to how respondents ldquofoundrdquo them but that difference
0
10
20
30
40
50
60
70
80
Mentioned ina webinar
Linked to ordiscussed in
onlinesocial media
Linked in toan RSS feed
Forwarded bysales rep
company contact
BrowsingcorporateWeb site
Downloadedfrom
direct responsecampaign
Forwardedfrom
personalcontact
White papers Case studies Podcasts Videos Brochures
5253
46
34
37
59
71
5655
6665
54
4241
38
27
23
31
39
31
39
29
23
34
20
23
20
12
21
15
44
38
45
34 34
Figure 34 Through which channels have you received collateral
26
has vanished Last year podcasts were almost equally acquired from a personal contact or from a corporate Web site (48 percent and 49 percent respectively) However this year the corporate Web site trumped the personal contact channel (55 percent to 46 percent) And this was even more dramatically the case for video with only 34 percent of respondents indicating they had been forwarded a video by a personal contact while 66 percent found video on corporate Web sites This trend underscores the importance of the corporate Web site across all collateral types
When we examined the comparative influence of these various channels another interesting fact emerged although a piece of collateral referred to or forwarded by a personal contact was most frequently cited as the most influential channel for all types of collateral browsing the corporate Web site was the second most frequently cited answer (Figure 35) When you consider that the corporate Web site is clearly the most frequently used channel for collateral delivery coupled with its high perceived influence you understand why we recommend that you make investing in and frequently refreshing your Web site a priority
0
10
20
30
40
50
60
70
80
Mentioned ina webinar
Linked to ordiscussed in
onlinesocial media
Linked in toan RSS feed
Forwarded bysales rep
company contact
BrowsingcorporateWeb site
Downloadedfrom
direct responsecampaign
Forwardedfrom
personalcontact
White papers Case studies Podcasts Videos Brochures
73
79
767677
41
38
424343
6060
53
61
69
37
33
28
39
46
2220
31
1716
35
42
3836
31 31
27
33
29
19
Figure 35 Positive influence by channel
27
Marketing Collateral in the Sales CycleThe relationship between collateral and actual sales is an important one How do the various types of collateralmdashwhite papers case studies brochuresmdashimpact sales When should you deliver a white paper case study podcast or video to drive potential purchasers to the next step in the sales cycle Is there a way to time delivery of specific collateral types to nurture leads more effectively
For the purposes of this survey we defined the various stages of the technology evaluation and purchase process as
bull Pre-salemdashConsidering solutions and vendors
bull Initial salemdashReviewing vendor qualifications capabilities and RFP responses
bull Mid-salemdashReviewing details of the solution with one vendor
bull Final salemdashCustomization negotiation and procurement
In our 2008 survey results we saw that respondents most frequently consumed each collateral type for the first time in the pre-sale process by a significant margin that is before they send out RFPs or initiate discussions with specific vendors In that first Eccolo B2B survey white papers were read by 61 percent of respondents during this phase case studies by 48 percent podcasts by 53 percent video by 51 percent and brochuresdata sheets by 62 percent
0
10
20
30
40
50
60
70
Final sales processMid-sales processInitial sales processPre-sales process
White papers Case studies Podcasts Videos Brochures
53
49
41
49
31
3435
30
25
13
21
2018
11
4 3 4 3 4
60
Figure 36 In which phase of the purchasing cycle did you FIRST consume each type of collateral
28
Our 2010 survey indicates that these habits are shifting While the majority of respondents still consume most collateral for the first time in the pre-sales phase more respondents now indicate they first consumed collateral in either the initial sales or mid-sales phases than they did in 2008 For example the percentage of respondents who first consumed a white paper during the pre-sales process dropped to 53 percent the percentage that listened to a podcast dropped down to 41 percent (Figure 36) In both cases respondents appeared to move their first consumption of those types of collateral down to the next two stages of the sales process
When we further segmented the 2010 data to compare the habits of influencers to decision makers we observed some additional interesting trends across the board influencers tend to consume content earlier in the sales cycle than decision makers (Figure 37)
0 10 20 30 40 50 60 70 80
Final salesprocess
Mid-salesprocess
Initial salesprocess
Pre-salesprocess
Final salesprocess
Mid-salesprocess
Initial salesprocess
Pre-salesprocess
White papers Case studies Podcasts Videos Brochures
63
58
41
6458
4752
65
2526
3830
23
915
1417
9
2111
2
4542
3647
56
3339
3430
27
1614
2319
12
65
74
5
25
26
35
20
4
Infl
uen
cers
Deci
sio
n M
akers
Figure 37 In which phase of the purchasing cycle did you FIRST consume each type of collateral (influencers vs decision makers)
29
Likewise respondents from small businesses consume collateral for the first time during the pre-sales stage at much higher rates than respondents from middle-market or large companies For example 70 percent of small businesses consume white papers for the first time during this stage compared to just 40 percent of middle-market firms and 56 percent of large enterprises (Figure 38)
Small Business Mid-market Enterprise
0
10
20
30
40
50
60
70
80
Final sales processMid-sales processInitial Sales ProcessPre-sales Process
70
40
56
16
38
29
9
17
12
5 53
Figure 38 In which phase of the purchasing cycle did you FIRST consume white papers in 2010
As in previous years we find the data around use of collateral in the sales cycle interesting in the way it potentially sheds light on the relationship between influencers and decion makers We believe we are seeing the influencerrsquos role in terms of considering potential technology purchases and the subsequent sharing of that collatera and other information with decision makers a bit later in the cycle
30
BEST PRACTICES FOR THE REAL WORLD
As in previous years we conclude our delivery of the survey results by providing what we consider to be actionable advice that marketing professionals can apply right now to improve the quality and impact of their communications assets
1 Create white papers This is a repeating theme but one that is definitely worth saying once again white papers are frequently consumed and considered highly influential over the technology purchase Take advantage by creating a few well-written papers that clearly outline strategic advancements your solutions and products are aligned with Leverage your work by chunking up the main points into best practice documents blog posts ldquohow tordquo guides and other materials to support your broader campaign needs
2 Embed multimedia files Start with short video or audio clips to keep overall file sizes low but jump on this trend Once you get your feet under you you can advance to interactive charts and graphs Flash elements and other media types Donrsquot ignore the opportunity to be among the first to take advantage of this evolving practice
3 Consider all content to be social content We know that tech purchasers share content and that they consider materials forwarded from a personal contact to be very influential Plan all content and collateral assets from the perspective of stimulating discussion and sharing Think about interactivity links to discussion boards and user groups and point to blog posts and other communications channels in all materials
4 Deliver all content assets digitally and be prepared to have end users print them While the majority of respondents view collateral assets on the desktop a respectable number still enjoy printing out the materials they download and will further share print materials with others Avoid cross-page spreads and column designs that are hard to read digitally and remember to provide clear URLs for any links away from the materials for those reading print versions
5 Merchandise content on the Web Your company Web site is the most frequent location for obtaining content and it ranks second only to personal contacts in terms of influence Make the most of this channel by merchandising featured content and assets on landing pages and microsites that extend the thought leadership and discussion begun in your collateral Remember potential purchasers interact with your content before they interact with you so ensure viewers can easily see all the other channels through which they can engage with you all in one fun-filled information portal
31
CONCLUSIONAs we wrap up this yearrsquos annual survey report we find ourselves coming back to some basic advice that has been a theme of this section in each previous report plan
Eccolo believes that the requirement of content strategymdashidentifying communication topics and thoughtfully planning the assets required to achieve goalsmdashis relevant at every level of the marketing organization The proliferation of online channels and ever more sophisticated lead generation systems require a steady stream of fresh relevant content to successfully engage purchasers Itrsquos very easy to be distracted by looming deadlines and shifting priorities but creating a content strategy and identifying a clear development roadmap that describes topic format and channel is essential if you truly want to improve results
And the opportunity to improve results is significant Well-planned development cycles can shorten time to market reduce costs and ensure a consistent message across all external assets Further organizations that show a healthy respect for content planning and development from the top down will experience the entire enterprise shifting to a more responsive stance These companies are tuned toward deeper customer conversations that align with the end userrsquos preferences for sales and marketing information and by the very style of their collateral assets signal a positive experience for the potential buyer
Engage With UsEccolo Media welcomes your feedback on this report Email us at infoeccolomediacom with specific feedback or visit our blog at httpeccolomediatypepadcom to join in our ongoing discussion of best practices in content strategy
ACKNOWLEDGEMENTSWe would like to acknowledge the participation of the following team members for their efforts in bringing the Eccolo Media 2010 B2B Technology Collateral Survey Report to life Maite Figueroa Alice LaPlante Lorie Loe Courtney Love and Michael Sudol
32
ABOUT ECCOLO MEDIAEccolo Media specializes in strategic marketing insight and content development for some of the worldrsquos best-known technology companies An agency of exceptional writers Eccolo combines deep experience with ongoing research to identify and apply best practices for producing remarkable content The agency helps align clientsrsquo marketing needs with their key business goals by bringing a proactive innovative approach to the planning and execution of collateral in both traditional and new media channels Founded in 2007 Eccolo Media is headquartered in San Francisco California and fulfills a wide range of project needs throughout the Americas and EMEA Visit our Web site at wwweccolomediacom
ABOUT EMEDIA - Our Marketing Sponsoremedia has specialized in generating B2B sales leads and building demand since 1999 We reach more than 35 million decision makers across over 80 niche-oriented audiences within the following B2B areasInformation Technology ElectronicsSupply ChainLogistics Occupational HealthCorporate Finance Environmental ManagementHuman Resources Project ManagementMarketingSales PackagingConvertingB2B Events Construction amp ArchitectsManufacturing Professional DevelopmentSmall Business Design EngineersProcurement Control EngineersHospitality Management PrintingHealthcare Tech
emediarsquos expertise and personal service permit effective implementation of Guaranteed Cost-per-Lead programs for our clientsrsquo offers and collateral Or we can drive highly targeted traffic to clientsrsquo web pages
Contact emedia at 800-782-6167 630-288-8480 or inquiriesemediausacom
ACCELERATED B2B LEAD GENERATION mdash ON DEMAND
wwwemediausacom

20
Simultaneously the percentage of respondents who preferred white papers of just four pages dropped from 24 percent down to 21 percent and the percentage of respondents who leaned toward eight pages increased from 21 percent to 27 percent This indicates that the ldquoideal lengthrdquo is shifting toward longer rather than shorter white papers
There were no general differences in length preferences between decision makers and influencers but technology purchasers from small companies tend to prefer shorter white papers with 31 percent preferring four pages or less compared to 19 percent of enterprise and 18 percent of mid-market companies that said the same
Case StudiesIn 2008 most respondents reported the ideal length of a case study to be two pages or approximately 800 to 1000 words Yet in 2009 we received different responses That year the largest proportion of respondents (39 percent) indicated that four is the ideal number of pages for a written case study This yearrsquos 2010 survey backed up last yearrsquos numbers with 37 percent preferring four pages and virtually identical percentages of respondents preferring two pages or less (35 percent) or six pages or more (28 percent) as seen in Figure 26
In general the larger the company the longer they prefer their case studies to be with the largest percentage of respondents from small companies (33 percent) preferring two-page case studies the largest percentage from middle-market firms (40 percent) and large enterprises (39 percent) preferring four-page case studies
Figure 26 What do you feel is the ideal number of pages for a case studysuccess story
0
10
20
30
40
50
More than6 pages
6 pages4 pages2 pages1 page
8
27
37
19
9
21
Podcasts The ideal length of a podcast decreased in 2010 Figure 27 shows that the greatest number of respondents (36 percent) selected five to seven minutes as the ideal length Most respondents (81 percent) prefer podcasts that are 10 minutes or less in length and in general the smaller the company the shorter they prefer their podcasts to be
Video The majority of 2010 respondents (38 percent) indicated that the ideal length of video content is five to seven minutes while 24 percent preferred videos of eight to 10 minutes (Figure 28) These results indicate a slight trending to shorter videos over the 2009 respondentrsquos preferences for length where 31 percent preferred five to seven minutes and 28 percent preferred eight to 10 minutes
Figure 28 What do you feel is the ideal length of a video in number of minutes
0
10
20
30
40
More than15 minutes
11 to 15minutes
8 to 10minutes
5 to 7minutes
2 to 4minutes
Less than2 minutes
6 5
19
38
24
8
Figure 27 What do you feel is the ideal length of a podcastaudio file in number of minutes
0
10
20
30
40
More than15 minutes
11 to 15minutes
8 to 10minutes
5 to 7minutes
2 to 4minutes
Less than2 minutes
4
15
36
26
13
6
22
The Emergence of Embedded Audio and Video in Written Collateral Over the past 12 months Eccolo has participated in an emerging trend in marketing collateral embedding audio and video files into digital versions of written documents such as white papers and case studies We therefore asked respondents if they had consumed any written collateral that contained embedded audio andor video files A significant proportion of themmdash45 percentmdashsaid they had done so
Respondents were most likely to encounter embedded files in case studies (66 percent) followed by white papers (55 percent) and brochures (48 percent) (Figure 29)
Perhaps the most dramatic of our findings in this part of the survey was the overwhelming percentage of respondents who clicked through to these embedded files 93 percent Twenty-five percent clicked through to video files six percent clicked through to audio files and 62 percent clicked through to both audio and video (Figure 30)
And most importantly when respondents were asked whether the inclusion of audio or video files positively or negatively affected the overall influence of the written collateral 80 percent indicated that they viewed it either ldquovery positivelyrdquo or ldquopositivelyrdquo (Figure 31)
0
10
20
30
40
50
60
70
80
OtherBrochuresCase studiesWhite paper
55
66
48
1
Figure 29 Which types of written collateral have you consumed that included embedded audio or video
23
In particular decision makers felt this trend was positive 83 percent ranked it as very positively or positively affecting the overall influence of the written collateral compared to 74 percent of influencers (Figure 32)
The size of company also mattered when it came to the perceived influence of embedded files with enterprises more likely to indicate that it was very positive (26 percent) compared to middle-market (14 percent) or small firms (15 percent) On a related note small businesses were more likely to say that embedded files had no influence at allmdash33 percent versus 15 percent of middle-market and 15 percent of enterprise firms (Figure 33)
0
10
20
30
40
50
60
70
80
NeitherBoth audiovideoAudio onlyVideo only
25
6
62
7
Figure 30 Did you click through or open any of the video or audio files embedded in the collateral
0
10
20
30
40
50
60
70
Very negativelyNegativelyNo influencePositivelyVery positively
18
62
18
1 1
Figure 31 How did the inclusion of embedded audio and video files affect the overall influence of the written collateral
24
These results support Eccolorsquos belief that interactivity is becoming ldquotable stakesrdquo for written marketing communications collateral Given the preference that purchasers have already expressed for consuming collateral at their desktop (see Figure 22) marketers that donrsquot experiment with embedded ausio video and other multimedia formats as well as links off to other communications and social media channels risk delivering assets that seem obsolete and old-fashioned
Figure 32 How did the inclusion of embedded audio and video files affect the overall influence of the written collateral
(decision makers versus influencers)
0
20
40
60
80
Very NegativelyNegativelyNo InfluencePositivelyVery Positively
24
59
66
15
26
1 0 018
Decision maker Influencer
0
10
20
30
40
50
60
70
80
Very negativelyNegativelyNo influencePositivelyVery positively
15 14
26
52
69
59
33
15 15
0 1 0 0 1 0
Small business Mid-market Enterprise
Figure 33 How did the inclusion of embedded audio and video files affect the overall influence of the written collateral
(small business vs mid-market vs enterprise)
25
The Channel EffectLast year we added a section to our annual survey that investigated how channel affects the perceived influence of collateral We defined channel as the specific avenue through which the respondent receives contentmdashwhether from a personal contact from a corporate Web site or from a sales representative for example
One fact immediately stood out in 2009 most respondents receive written collateral through the corporate Web site (Figure 34) This did not change in 2010 with 71 percent of respondents finding white papers through such sites 65 percent getting brochuresdata sheets through that channel and 56 percent acquiring case studies in that way
The next most frequently used channel for receiving a white paper in 2010 was a download from a direct response campaign (59 percent) which implies that this should be considered an important means of distribution for marketers This was followed by forwarded by a sales repcompany contact (54 percent) obtained from a personal contact (52 percent) accessed via social media (39 percent) and absorbed through webinars (34 percent) In 2009 podcasts and video collateral differed from written content when it came to how respondents ldquofoundrdquo them but that difference
0
10
20
30
40
50
60
70
80
Mentioned ina webinar
Linked to ordiscussed in
onlinesocial media
Linked in toan RSS feed
Forwarded bysales rep
company contact
BrowsingcorporateWeb site
Downloadedfrom
direct responsecampaign
Forwardedfrom
personalcontact
White papers Case studies Podcasts Videos Brochures
5253
46
34
37
59
71
5655
6665
54
4241
38
27
23
31
39
31
39
29
23
34
20
23
20
12
21
15
44
38
45
34 34
Figure 34 Through which channels have you received collateral
26
has vanished Last year podcasts were almost equally acquired from a personal contact or from a corporate Web site (48 percent and 49 percent respectively) However this year the corporate Web site trumped the personal contact channel (55 percent to 46 percent) And this was even more dramatically the case for video with only 34 percent of respondents indicating they had been forwarded a video by a personal contact while 66 percent found video on corporate Web sites This trend underscores the importance of the corporate Web site across all collateral types
When we examined the comparative influence of these various channels another interesting fact emerged although a piece of collateral referred to or forwarded by a personal contact was most frequently cited as the most influential channel for all types of collateral browsing the corporate Web site was the second most frequently cited answer (Figure 35) When you consider that the corporate Web site is clearly the most frequently used channel for collateral delivery coupled with its high perceived influence you understand why we recommend that you make investing in and frequently refreshing your Web site a priority
0
10
20
30
40
50
60
70
80
Mentioned ina webinar
Linked to ordiscussed in
onlinesocial media
Linked in toan RSS feed
Forwarded bysales rep
company contact
BrowsingcorporateWeb site
Downloadedfrom
direct responsecampaign
Forwardedfrom
personalcontact
White papers Case studies Podcasts Videos Brochures
73
79
767677
41
38
424343
6060
53
61
69
37
33
28
39
46
2220
31
1716
35
42
3836
31 31
27
33
29
19
Figure 35 Positive influence by channel
27
Marketing Collateral in the Sales CycleThe relationship between collateral and actual sales is an important one How do the various types of collateralmdashwhite papers case studies brochuresmdashimpact sales When should you deliver a white paper case study podcast or video to drive potential purchasers to the next step in the sales cycle Is there a way to time delivery of specific collateral types to nurture leads more effectively
For the purposes of this survey we defined the various stages of the technology evaluation and purchase process as
bull Pre-salemdashConsidering solutions and vendors
bull Initial salemdashReviewing vendor qualifications capabilities and RFP responses
bull Mid-salemdashReviewing details of the solution with one vendor
bull Final salemdashCustomization negotiation and procurement
In our 2008 survey results we saw that respondents most frequently consumed each collateral type for the first time in the pre-sale process by a significant margin that is before they send out RFPs or initiate discussions with specific vendors In that first Eccolo B2B survey white papers were read by 61 percent of respondents during this phase case studies by 48 percent podcasts by 53 percent video by 51 percent and brochuresdata sheets by 62 percent
0
10
20
30
40
50
60
70
Final sales processMid-sales processInitial sales processPre-sales process
White papers Case studies Podcasts Videos Brochures
53
49
41
49
31
3435
30
25
13
21
2018
11
4 3 4 3 4
60
Figure 36 In which phase of the purchasing cycle did you FIRST consume each type of collateral
28
Our 2010 survey indicates that these habits are shifting While the majority of respondents still consume most collateral for the first time in the pre-sales phase more respondents now indicate they first consumed collateral in either the initial sales or mid-sales phases than they did in 2008 For example the percentage of respondents who first consumed a white paper during the pre-sales process dropped to 53 percent the percentage that listened to a podcast dropped down to 41 percent (Figure 36) In both cases respondents appeared to move their first consumption of those types of collateral down to the next two stages of the sales process
When we further segmented the 2010 data to compare the habits of influencers to decision makers we observed some additional interesting trends across the board influencers tend to consume content earlier in the sales cycle than decision makers (Figure 37)
0 10 20 30 40 50 60 70 80
Final salesprocess
Mid-salesprocess
Initial salesprocess
Pre-salesprocess
Final salesprocess
Mid-salesprocess
Initial salesprocess
Pre-salesprocess
White papers Case studies Podcasts Videos Brochures
63
58
41
6458
4752
65
2526
3830
23
915
1417
9
2111
2
4542
3647
56
3339
3430
27
1614
2319
12
65
74
5
25
26
35
20
4
Infl
uen
cers
Deci
sio
n M
akers
Figure 37 In which phase of the purchasing cycle did you FIRST consume each type of collateral (influencers vs decision makers)
29
Likewise respondents from small businesses consume collateral for the first time during the pre-sales stage at much higher rates than respondents from middle-market or large companies For example 70 percent of small businesses consume white papers for the first time during this stage compared to just 40 percent of middle-market firms and 56 percent of large enterprises (Figure 38)
Small Business Mid-market Enterprise
0
10
20
30
40
50
60
70
80
Final sales processMid-sales processInitial Sales ProcessPre-sales Process
70
40
56
16
38
29
9
17
12
5 53
Figure 38 In which phase of the purchasing cycle did you FIRST consume white papers in 2010
As in previous years we find the data around use of collateral in the sales cycle interesting in the way it potentially sheds light on the relationship between influencers and decion makers We believe we are seeing the influencerrsquos role in terms of considering potential technology purchases and the subsequent sharing of that collatera and other information with decision makers a bit later in the cycle
30
BEST PRACTICES FOR THE REAL WORLD
As in previous years we conclude our delivery of the survey results by providing what we consider to be actionable advice that marketing professionals can apply right now to improve the quality and impact of their communications assets
1 Create white papers This is a repeating theme but one that is definitely worth saying once again white papers are frequently consumed and considered highly influential over the technology purchase Take advantage by creating a few well-written papers that clearly outline strategic advancements your solutions and products are aligned with Leverage your work by chunking up the main points into best practice documents blog posts ldquohow tordquo guides and other materials to support your broader campaign needs
2 Embed multimedia files Start with short video or audio clips to keep overall file sizes low but jump on this trend Once you get your feet under you you can advance to interactive charts and graphs Flash elements and other media types Donrsquot ignore the opportunity to be among the first to take advantage of this evolving practice
3 Consider all content to be social content We know that tech purchasers share content and that they consider materials forwarded from a personal contact to be very influential Plan all content and collateral assets from the perspective of stimulating discussion and sharing Think about interactivity links to discussion boards and user groups and point to blog posts and other communications channels in all materials
4 Deliver all content assets digitally and be prepared to have end users print them While the majority of respondents view collateral assets on the desktop a respectable number still enjoy printing out the materials they download and will further share print materials with others Avoid cross-page spreads and column designs that are hard to read digitally and remember to provide clear URLs for any links away from the materials for those reading print versions
5 Merchandise content on the Web Your company Web site is the most frequent location for obtaining content and it ranks second only to personal contacts in terms of influence Make the most of this channel by merchandising featured content and assets on landing pages and microsites that extend the thought leadership and discussion begun in your collateral Remember potential purchasers interact with your content before they interact with you so ensure viewers can easily see all the other channels through which they can engage with you all in one fun-filled information portal
31
CONCLUSIONAs we wrap up this yearrsquos annual survey report we find ourselves coming back to some basic advice that has been a theme of this section in each previous report plan
Eccolo believes that the requirement of content strategymdashidentifying communication topics and thoughtfully planning the assets required to achieve goalsmdashis relevant at every level of the marketing organization The proliferation of online channels and ever more sophisticated lead generation systems require a steady stream of fresh relevant content to successfully engage purchasers Itrsquos very easy to be distracted by looming deadlines and shifting priorities but creating a content strategy and identifying a clear development roadmap that describes topic format and channel is essential if you truly want to improve results
And the opportunity to improve results is significant Well-planned development cycles can shorten time to market reduce costs and ensure a consistent message across all external assets Further organizations that show a healthy respect for content planning and development from the top down will experience the entire enterprise shifting to a more responsive stance These companies are tuned toward deeper customer conversations that align with the end userrsquos preferences for sales and marketing information and by the very style of their collateral assets signal a positive experience for the potential buyer
Engage With UsEccolo Media welcomes your feedback on this report Email us at infoeccolomediacom with specific feedback or visit our blog at httpeccolomediatypepadcom to join in our ongoing discussion of best practices in content strategy
ACKNOWLEDGEMENTSWe would like to acknowledge the participation of the following team members for their efforts in bringing the Eccolo Media 2010 B2B Technology Collateral Survey Report to life Maite Figueroa Alice LaPlante Lorie Loe Courtney Love and Michael Sudol
32
ABOUT ECCOLO MEDIAEccolo Media specializes in strategic marketing insight and content development for some of the worldrsquos best-known technology companies An agency of exceptional writers Eccolo combines deep experience with ongoing research to identify and apply best practices for producing remarkable content The agency helps align clientsrsquo marketing needs with their key business goals by bringing a proactive innovative approach to the planning and execution of collateral in both traditional and new media channels Founded in 2007 Eccolo Media is headquartered in San Francisco California and fulfills a wide range of project needs throughout the Americas and EMEA Visit our Web site at wwweccolomediacom
ABOUT EMEDIA - Our Marketing Sponsoremedia has specialized in generating B2B sales leads and building demand since 1999 We reach more than 35 million decision makers across over 80 niche-oriented audiences within the following B2B areasInformation Technology ElectronicsSupply ChainLogistics Occupational HealthCorporate Finance Environmental ManagementHuman Resources Project ManagementMarketingSales PackagingConvertingB2B Events Construction amp ArchitectsManufacturing Professional DevelopmentSmall Business Design EngineersProcurement Control EngineersHospitality Management PrintingHealthcare Tech
emediarsquos expertise and personal service permit effective implementation of Guaranteed Cost-per-Lead programs for our clientsrsquo offers and collateral Or we can drive highly targeted traffic to clientsrsquo web pages
Contact emedia at 800-782-6167 630-288-8480 or inquiriesemediausacom
ACCELERATED B2B LEAD GENERATION mdash ON DEMAND
wwwemediausacom

21
Podcasts The ideal length of a podcast decreased in 2010 Figure 27 shows that the greatest number of respondents (36 percent) selected five to seven minutes as the ideal length Most respondents (81 percent) prefer podcasts that are 10 minutes or less in length and in general the smaller the company the shorter they prefer their podcasts to be
Video The majority of 2010 respondents (38 percent) indicated that the ideal length of video content is five to seven minutes while 24 percent preferred videos of eight to 10 minutes (Figure 28) These results indicate a slight trending to shorter videos over the 2009 respondentrsquos preferences for length where 31 percent preferred five to seven minutes and 28 percent preferred eight to 10 minutes
Figure 28 What do you feel is the ideal length of a video in number of minutes
0
10
20
30
40
More than15 minutes
11 to 15minutes
8 to 10minutes
5 to 7minutes
2 to 4minutes
Less than2 minutes
6 5
19
38
24
8
Figure 27 What do you feel is the ideal length of a podcastaudio file in number of minutes
0
10
20
30
40
More than15 minutes
11 to 15minutes
8 to 10minutes
5 to 7minutes
2 to 4minutes
Less than2 minutes
4
15
36
26
13
6
22
The Emergence of Embedded Audio and Video in Written Collateral Over the past 12 months Eccolo has participated in an emerging trend in marketing collateral embedding audio and video files into digital versions of written documents such as white papers and case studies We therefore asked respondents if they had consumed any written collateral that contained embedded audio andor video files A significant proportion of themmdash45 percentmdashsaid they had done so
Respondents were most likely to encounter embedded files in case studies (66 percent) followed by white papers (55 percent) and brochures (48 percent) (Figure 29)
Perhaps the most dramatic of our findings in this part of the survey was the overwhelming percentage of respondents who clicked through to these embedded files 93 percent Twenty-five percent clicked through to video files six percent clicked through to audio files and 62 percent clicked through to both audio and video (Figure 30)
And most importantly when respondents were asked whether the inclusion of audio or video files positively or negatively affected the overall influence of the written collateral 80 percent indicated that they viewed it either ldquovery positivelyrdquo or ldquopositivelyrdquo (Figure 31)
0
10
20
30
40
50
60
70
80
OtherBrochuresCase studiesWhite paper
55
66
48
1
Figure 29 Which types of written collateral have you consumed that included embedded audio or video
23
In particular decision makers felt this trend was positive 83 percent ranked it as very positively or positively affecting the overall influence of the written collateral compared to 74 percent of influencers (Figure 32)
The size of company also mattered when it came to the perceived influence of embedded files with enterprises more likely to indicate that it was very positive (26 percent) compared to middle-market (14 percent) or small firms (15 percent) On a related note small businesses were more likely to say that embedded files had no influence at allmdash33 percent versus 15 percent of middle-market and 15 percent of enterprise firms (Figure 33)
0
10
20
30
40
50
60
70
80
NeitherBoth audiovideoAudio onlyVideo only
25
6
62
7
Figure 30 Did you click through or open any of the video or audio files embedded in the collateral
0
10
20
30
40
50
60
70
Very negativelyNegativelyNo influencePositivelyVery positively
18
62
18
1 1
Figure 31 How did the inclusion of embedded audio and video files affect the overall influence of the written collateral
24
These results support Eccolorsquos belief that interactivity is becoming ldquotable stakesrdquo for written marketing communications collateral Given the preference that purchasers have already expressed for consuming collateral at their desktop (see Figure 22) marketers that donrsquot experiment with embedded ausio video and other multimedia formats as well as links off to other communications and social media channels risk delivering assets that seem obsolete and old-fashioned
Figure 32 How did the inclusion of embedded audio and video files affect the overall influence of the written collateral
(decision makers versus influencers)
0
20
40
60
80
Very NegativelyNegativelyNo InfluencePositivelyVery Positively
24
59
66
15
26
1 0 018
Decision maker Influencer
0
10
20
30
40
50
60
70
80
Very negativelyNegativelyNo influencePositivelyVery positively
15 14
26
52
69
59
33
15 15
0 1 0 0 1 0
Small business Mid-market Enterprise
Figure 33 How did the inclusion of embedded audio and video files affect the overall influence of the written collateral
(small business vs mid-market vs enterprise)
25
The Channel EffectLast year we added a section to our annual survey that investigated how channel affects the perceived influence of collateral We defined channel as the specific avenue through which the respondent receives contentmdashwhether from a personal contact from a corporate Web site or from a sales representative for example
One fact immediately stood out in 2009 most respondents receive written collateral through the corporate Web site (Figure 34) This did not change in 2010 with 71 percent of respondents finding white papers through such sites 65 percent getting brochuresdata sheets through that channel and 56 percent acquiring case studies in that way
The next most frequently used channel for receiving a white paper in 2010 was a download from a direct response campaign (59 percent) which implies that this should be considered an important means of distribution for marketers This was followed by forwarded by a sales repcompany contact (54 percent) obtained from a personal contact (52 percent) accessed via social media (39 percent) and absorbed through webinars (34 percent) In 2009 podcasts and video collateral differed from written content when it came to how respondents ldquofoundrdquo them but that difference
0
10
20
30
40
50
60
70
80
Mentioned ina webinar
Linked to ordiscussed in
onlinesocial media
Linked in toan RSS feed
Forwarded bysales rep
company contact
BrowsingcorporateWeb site
Downloadedfrom
direct responsecampaign
Forwardedfrom
personalcontact
White papers Case studies Podcasts Videos Brochures
5253
46
34
37
59
71
5655
6665
54
4241
38
27
23
31
39
31
39
29
23
34
20
23
20
12
21
15
44
38
45
34 34
Figure 34 Through which channels have you received collateral
26
has vanished Last year podcasts were almost equally acquired from a personal contact or from a corporate Web site (48 percent and 49 percent respectively) However this year the corporate Web site trumped the personal contact channel (55 percent to 46 percent) And this was even more dramatically the case for video with only 34 percent of respondents indicating they had been forwarded a video by a personal contact while 66 percent found video on corporate Web sites This trend underscores the importance of the corporate Web site across all collateral types
When we examined the comparative influence of these various channels another interesting fact emerged although a piece of collateral referred to or forwarded by a personal contact was most frequently cited as the most influential channel for all types of collateral browsing the corporate Web site was the second most frequently cited answer (Figure 35) When you consider that the corporate Web site is clearly the most frequently used channel for collateral delivery coupled with its high perceived influence you understand why we recommend that you make investing in and frequently refreshing your Web site a priority
0
10
20
30
40
50
60
70
80
Mentioned ina webinar
Linked to ordiscussed in
onlinesocial media
Linked in toan RSS feed
Forwarded bysales rep
company contact
BrowsingcorporateWeb site
Downloadedfrom
direct responsecampaign
Forwardedfrom
personalcontact
White papers Case studies Podcasts Videos Brochures
73
79
767677
41
38
424343
6060
53
61
69
37
33
28
39
46
2220
31
1716
35
42
3836
31 31
27
33
29
19
Figure 35 Positive influence by channel
27
Marketing Collateral in the Sales CycleThe relationship between collateral and actual sales is an important one How do the various types of collateralmdashwhite papers case studies brochuresmdashimpact sales When should you deliver a white paper case study podcast or video to drive potential purchasers to the next step in the sales cycle Is there a way to time delivery of specific collateral types to nurture leads more effectively
For the purposes of this survey we defined the various stages of the technology evaluation and purchase process as
bull Pre-salemdashConsidering solutions and vendors
bull Initial salemdashReviewing vendor qualifications capabilities and RFP responses
bull Mid-salemdashReviewing details of the solution with one vendor
bull Final salemdashCustomization negotiation and procurement
In our 2008 survey results we saw that respondents most frequently consumed each collateral type for the first time in the pre-sale process by a significant margin that is before they send out RFPs or initiate discussions with specific vendors In that first Eccolo B2B survey white papers were read by 61 percent of respondents during this phase case studies by 48 percent podcasts by 53 percent video by 51 percent and brochuresdata sheets by 62 percent
0
10
20
30
40
50
60
70
Final sales processMid-sales processInitial sales processPre-sales process
White papers Case studies Podcasts Videos Brochures
53
49
41
49
31
3435
30
25
13
21
2018
11
4 3 4 3 4
60
Figure 36 In which phase of the purchasing cycle did you FIRST consume each type of collateral
28
Our 2010 survey indicates that these habits are shifting While the majority of respondents still consume most collateral for the first time in the pre-sales phase more respondents now indicate they first consumed collateral in either the initial sales or mid-sales phases than they did in 2008 For example the percentage of respondents who first consumed a white paper during the pre-sales process dropped to 53 percent the percentage that listened to a podcast dropped down to 41 percent (Figure 36) In both cases respondents appeared to move their first consumption of those types of collateral down to the next two stages of the sales process
When we further segmented the 2010 data to compare the habits of influencers to decision makers we observed some additional interesting trends across the board influencers tend to consume content earlier in the sales cycle than decision makers (Figure 37)
0 10 20 30 40 50 60 70 80
Final salesprocess
Mid-salesprocess
Initial salesprocess
Pre-salesprocess
Final salesprocess
Mid-salesprocess
Initial salesprocess
Pre-salesprocess
White papers Case studies Podcasts Videos Brochures
63
58
41
6458
4752
65
2526
3830
23
915
1417
9
2111
2
4542
3647
56
3339
3430
27
1614
2319
12
65
74
5
25
26
35
20
4
Infl
uen
cers
Deci
sio
n M
akers
Figure 37 In which phase of the purchasing cycle did you FIRST consume each type of collateral (influencers vs decision makers)
29
Likewise respondents from small businesses consume collateral for the first time during the pre-sales stage at much higher rates than respondents from middle-market or large companies For example 70 percent of small businesses consume white papers for the first time during this stage compared to just 40 percent of middle-market firms and 56 percent of large enterprises (Figure 38)
Small Business Mid-market Enterprise
0
10
20
30
40
50
60
70
80
Final sales processMid-sales processInitial Sales ProcessPre-sales Process
70
40
56
16
38
29
9
17
12
5 53
Figure 38 In which phase of the purchasing cycle did you FIRST consume white papers in 2010
As in previous years we find the data around use of collateral in the sales cycle interesting in the way it potentially sheds light on the relationship between influencers and decion makers We believe we are seeing the influencerrsquos role in terms of considering potential technology purchases and the subsequent sharing of that collatera and other information with decision makers a bit later in the cycle
30
BEST PRACTICES FOR THE REAL WORLD
As in previous years we conclude our delivery of the survey results by providing what we consider to be actionable advice that marketing professionals can apply right now to improve the quality and impact of their communications assets
1 Create white papers This is a repeating theme but one that is definitely worth saying once again white papers are frequently consumed and considered highly influential over the technology purchase Take advantage by creating a few well-written papers that clearly outline strategic advancements your solutions and products are aligned with Leverage your work by chunking up the main points into best practice documents blog posts ldquohow tordquo guides and other materials to support your broader campaign needs
2 Embed multimedia files Start with short video or audio clips to keep overall file sizes low but jump on this trend Once you get your feet under you you can advance to interactive charts and graphs Flash elements and other media types Donrsquot ignore the opportunity to be among the first to take advantage of this evolving practice
3 Consider all content to be social content We know that tech purchasers share content and that they consider materials forwarded from a personal contact to be very influential Plan all content and collateral assets from the perspective of stimulating discussion and sharing Think about interactivity links to discussion boards and user groups and point to blog posts and other communications channels in all materials
4 Deliver all content assets digitally and be prepared to have end users print them While the majority of respondents view collateral assets on the desktop a respectable number still enjoy printing out the materials they download and will further share print materials with others Avoid cross-page spreads and column designs that are hard to read digitally and remember to provide clear URLs for any links away from the materials for those reading print versions
5 Merchandise content on the Web Your company Web site is the most frequent location for obtaining content and it ranks second only to personal contacts in terms of influence Make the most of this channel by merchandising featured content and assets on landing pages and microsites that extend the thought leadership and discussion begun in your collateral Remember potential purchasers interact with your content before they interact with you so ensure viewers can easily see all the other channels through which they can engage with you all in one fun-filled information portal
31
CONCLUSIONAs we wrap up this yearrsquos annual survey report we find ourselves coming back to some basic advice that has been a theme of this section in each previous report plan
Eccolo believes that the requirement of content strategymdashidentifying communication topics and thoughtfully planning the assets required to achieve goalsmdashis relevant at every level of the marketing organization The proliferation of online channels and ever more sophisticated lead generation systems require a steady stream of fresh relevant content to successfully engage purchasers Itrsquos very easy to be distracted by looming deadlines and shifting priorities but creating a content strategy and identifying a clear development roadmap that describes topic format and channel is essential if you truly want to improve results
And the opportunity to improve results is significant Well-planned development cycles can shorten time to market reduce costs and ensure a consistent message across all external assets Further organizations that show a healthy respect for content planning and development from the top down will experience the entire enterprise shifting to a more responsive stance These companies are tuned toward deeper customer conversations that align with the end userrsquos preferences for sales and marketing information and by the very style of their collateral assets signal a positive experience for the potential buyer
Engage With UsEccolo Media welcomes your feedback on this report Email us at infoeccolomediacom with specific feedback or visit our blog at httpeccolomediatypepadcom to join in our ongoing discussion of best practices in content strategy
ACKNOWLEDGEMENTSWe would like to acknowledge the participation of the following team members for their efforts in bringing the Eccolo Media 2010 B2B Technology Collateral Survey Report to life Maite Figueroa Alice LaPlante Lorie Loe Courtney Love and Michael Sudol
32
ABOUT ECCOLO MEDIAEccolo Media specializes in strategic marketing insight and content development for some of the worldrsquos best-known technology companies An agency of exceptional writers Eccolo combines deep experience with ongoing research to identify and apply best practices for producing remarkable content The agency helps align clientsrsquo marketing needs with their key business goals by bringing a proactive innovative approach to the planning and execution of collateral in both traditional and new media channels Founded in 2007 Eccolo Media is headquartered in San Francisco California and fulfills a wide range of project needs throughout the Americas and EMEA Visit our Web site at wwweccolomediacom
ABOUT EMEDIA - Our Marketing Sponsoremedia has specialized in generating B2B sales leads and building demand since 1999 We reach more than 35 million decision makers across over 80 niche-oriented audiences within the following B2B areasInformation Technology ElectronicsSupply ChainLogistics Occupational HealthCorporate Finance Environmental ManagementHuman Resources Project ManagementMarketingSales PackagingConvertingB2B Events Construction amp ArchitectsManufacturing Professional DevelopmentSmall Business Design EngineersProcurement Control EngineersHospitality Management PrintingHealthcare Tech
emediarsquos expertise and personal service permit effective implementation of Guaranteed Cost-per-Lead programs for our clientsrsquo offers and collateral Or we can drive highly targeted traffic to clientsrsquo web pages
Contact emedia at 800-782-6167 630-288-8480 or inquiriesemediausacom
ACCELERATED B2B LEAD GENERATION mdash ON DEMAND
wwwemediausacom

23
In particular decision makers felt this trend was positive 83 percent ranked it as very positively or positively affecting the overall influence of the written collateral compared to 74 percent of influencers (Figure 32)
The size of company also mattered when it came to the perceived influence of embedded files with enterprises more likely to indicate that it was very positive (26 percent) compared to middle-market (14 percent) or small firms (15 percent) On a related note small businesses were more likely to say that embedded files had no influence at allmdash33 percent versus 15 percent of middle-market and 15 percent of enterprise firms (Figure 33)
0
10
20
30
40
50
60
70
80
NeitherBoth audiovideoAudio onlyVideo only
25
6
62
7
Figure 30 Did you click through or open any of the video or audio files embedded in the collateral
0
10
20
30
40
50
60
70
Very negativelyNegativelyNo influencePositivelyVery positively
18
62
18
1 1
Figure 31 How did the inclusion of embedded audio and video files affect the overall influence of the written collateral
24
These results support Eccolorsquos belief that interactivity is becoming ldquotable stakesrdquo for written marketing communications collateral Given the preference that purchasers have already expressed for consuming collateral at their desktop (see Figure 22) marketers that donrsquot experiment with embedded ausio video and other multimedia formats as well as links off to other communications and social media channels risk delivering assets that seem obsolete and old-fashioned
Figure 32 How did the inclusion of embedded audio and video files affect the overall influence of the written collateral
(decision makers versus influencers)
0
20
40
60
80
Very NegativelyNegativelyNo InfluencePositivelyVery Positively
24
59
66
15
26
1 0 018
Decision maker Influencer
0
10
20
30
40
50
60
70
80
Very negativelyNegativelyNo influencePositivelyVery positively
15 14
26
52
69
59
33
15 15
0 1 0 0 1 0
Small business Mid-market Enterprise
Figure 33 How did the inclusion of embedded audio and video files affect the overall influence of the written collateral
(small business vs mid-market vs enterprise)
25
The Channel EffectLast year we added a section to our annual survey that investigated how channel affects the perceived influence of collateral We defined channel as the specific avenue through which the respondent receives contentmdashwhether from a personal contact from a corporate Web site or from a sales representative for example
One fact immediately stood out in 2009 most respondents receive written collateral through the corporate Web site (Figure 34) This did not change in 2010 with 71 percent of respondents finding white papers through such sites 65 percent getting brochuresdata sheets through that channel and 56 percent acquiring case studies in that way
The next most frequently used channel for receiving a white paper in 2010 was a download from a direct response campaign (59 percent) which implies that this should be considered an important means of distribution for marketers This was followed by forwarded by a sales repcompany contact (54 percent) obtained from a personal contact (52 percent) accessed via social media (39 percent) and absorbed through webinars (34 percent) In 2009 podcasts and video collateral differed from written content when it came to how respondents ldquofoundrdquo them but that difference
0
10
20
30
40
50
60
70
80
Mentioned ina webinar
Linked to ordiscussed in
onlinesocial media
Linked in toan RSS feed
Forwarded bysales rep
company contact
BrowsingcorporateWeb site
Downloadedfrom
direct responsecampaign
Forwardedfrom
personalcontact
White papers Case studies Podcasts Videos Brochures
5253
46
34
37
59
71
5655
6665
54
4241
38
27
23
31
39
31
39
29
23
34
20
23
20
12
21
15
44
38
45
34 34
Figure 34 Through which channels have you received collateral
26
has vanished Last year podcasts were almost equally acquired from a personal contact or from a corporate Web site (48 percent and 49 percent respectively) However this year the corporate Web site trumped the personal contact channel (55 percent to 46 percent) And this was even more dramatically the case for video with only 34 percent of respondents indicating they had been forwarded a video by a personal contact while 66 percent found video on corporate Web sites This trend underscores the importance of the corporate Web site across all collateral types
When we examined the comparative influence of these various channels another interesting fact emerged although a piece of collateral referred to or forwarded by a personal contact was most frequently cited as the most influential channel for all types of collateral browsing the corporate Web site was the second most frequently cited answer (Figure 35) When you consider that the corporate Web site is clearly the most frequently used channel for collateral delivery coupled with its high perceived influence you understand why we recommend that you make investing in and frequently refreshing your Web site a priority
0
10
20
30
40
50
60
70
80
Mentioned ina webinar
Linked to ordiscussed in
onlinesocial media
Linked in toan RSS feed
Forwarded bysales rep
company contact
BrowsingcorporateWeb site
Downloadedfrom
direct responsecampaign
Forwardedfrom
personalcontact
White papers Case studies Podcasts Videos Brochures
73
79
767677
41
38
424343
6060
53
61
69
37
33
28
39
46
2220
31
1716
35
42
3836
31 31
27
33
29
19
Figure 35 Positive influence by channel
27
Marketing Collateral in the Sales CycleThe relationship between collateral and actual sales is an important one How do the various types of collateralmdashwhite papers case studies brochuresmdashimpact sales When should you deliver a white paper case study podcast or video to drive potential purchasers to the next step in the sales cycle Is there a way to time delivery of specific collateral types to nurture leads more effectively
For the purposes of this survey we defined the various stages of the technology evaluation and purchase process as
bull Pre-salemdashConsidering solutions and vendors
bull Initial salemdashReviewing vendor qualifications capabilities and RFP responses
bull Mid-salemdashReviewing details of the solution with one vendor
bull Final salemdashCustomization negotiation and procurement
In our 2008 survey results we saw that respondents most frequently consumed each collateral type for the first time in the pre-sale process by a significant margin that is before they send out RFPs or initiate discussions with specific vendors In that first Eccolo B2B survey white papers were read by 61 percent of respondents during this phase case studies by 48 percent podcasts by 53 percent video by 51 percent and brochuresdata sheets by 62 percent
0
10
20
30
40
50
60
70
Final sales processMid-sales processInitial sales processPre-sales process
White papers Case studies Podcasts Videos Brochures
53
49
41
49
31
3435
30
25
13
21
2018
11
4 3 4 3 4
60
Figure 36 In which phase of the purchasing cycle did you FIRST consume each type of collateral
28
Our 2010 survey indicates that these habits are shifting While the majority of respondents still consume most collateral for the first time in the pre-sales phase more respondents now indicate they first consumed collateral in either the initial sales or mid-sales phases than they did in 2008 For example the percentage of respondents who first consumed a white paper during the pre-sales process dropped to 53 percent the percentage that listened to a podcast dropped down to 41 percent (Figure 36) In both cases respondents appeared to move their first consumption of those types of collateral down to the next two stages of the sales process
When we further segmented the 2010 data to compare the habits of influencers to decision makers we observed some additional interesting trends across the board influencers tend to consume content earlier in the sales cycle than decision makers (Figure 37)
0 10 20 30 40 50 60 70 80
Final salesprocess
Mid-salesprocess
Initial salesprocess
Pre-salesprocess
Final salesprocess
Mid-salesprocess
Initial salesprocess
Pre-salesprocess
White papers Case studies Podcasts Videos Brochures
63
58
41
6458
4752
65
2526
3830
23
915
1417
9
2111
2
4542
3647
56
3339
3430
27
1614
2319
12
65
74
5
25
26
35
20
4
Infl
uen
cers
Deci
sio
n M
akers
Figure 37 In which phase of the purchasing cycle did you FIRST consume each type of collateral (influencers vs decision makers)
29
Likewise respondents from small businesses consume collateral for the first time during the pre-sales stage at much higher rates than respondents from middle-market or large companies For example 70 percent of small businesses consume white papers for the first time during this stage compared to just 40 percent of middle-market firms and 56 percent of large enterprises (Figure 38)
Small Business Mid-market Enterprise
0
10
20
30
40
50
60
70
80
Final sales processMid-sales processInitial Sales ProcessPre-sales Process
70
40
56
16
38
29
9
17
12
5 53
Figure 38 In which phase of the purchasing cycle did you FIRST consume white papers in 2010
As in previous years we find the data around use of collateral in the sales cycle interesting in the way it potentially sheds light on the relationship between influencers and decion makers We believe we are seeing the influencerrsquos role in terms of considering potential technology purchases and the subsequent sharing of that collatera and other information with decision makers a bit later in the cycle
30
BEST PRACTICES FOR THE REAL WORLD
As in previous years we conclude our delivery of the survey results by providing what we consider to be actionable advice that marketing professionals can apply right now to improve the quality and impact of their communications assets
1 Create white papers This is a repeating theme but one that is definitely worth saying once again white papers are frequently consumed and considered highly influential over the technology purchase Take advantage by creating a few well-written papers that clearly outline strategic advancements your solutions and products are aligned with Leverage your work by chunking up the main points into best practice documents blog posts ldquohow tordquo guides and other materials to support your broader campaign needs
2 Embed multimedia files Start with short video or audio clips to keep overall file sizes low but jump on this trend Once you get your feet under you you can advance to interactive charts and graphs Flash elements and other media types Donrsquot ignore the opportunity to be among the first to take advantage of this evolving practice
3 Consider all content to be social content We know that tech purchasers share content and that they consider materials forwarded from a personal contact to be very influential Plan all content and collateral assets from the perspective of stimulating discussion and sharing Think about interactivity links to discussion boards and user groups and point to blog posts and other communications channels in all materials
4 Deliver all content assets digitally and be prepared to have end users print them While the majority of respondents view collateral assets on the desktop a respectable number still enjoy printing out the materials they download and will further share print materials with others Avoid cross-page spreads and column designs that are hard to read digitally and remember to provide clear URLs for any links away from the materials for those reading print versions
5 Merchandise content on the Web Your company Web site is the most frequent location for obtaining content and it ranks second only to personal contacts in terms of influence Make the most of this channel by merchandising featured content and assets on landing pages and microsites that extend the thought leadership and discussion begun in your collateral Remember potential purchasers interact with your content before they interact with you so ensure viewers can easily see all the other channels through which they can engage with you all in one fun-filled information portal
31
CONCLUSIONAs we wrap up this yearrsquos annual survey report we find ourselves coming back to some basic advice that has been a theme of this section in each previous report plan
Eccolo believes that the requirement of content strategymdashidentifying communication topics and thoughtfully planning the assets required to achieve goalsmdashis relevant at every level of the marketing organization The proliferation of online channels and ever more sophisticated lead generation systems require a steady stream of fresh relevant content to successfully engage purchasers Itrsquos very easy to be distracted by looming deadlines and shifting priorities but creating a content strategy and identifying a clear development roadmap that describes topic format and channel is essential if you truly want to improve results
And the opportunity to improve results is significant Well-planned development cycles can shorten time to market reduce costs and ensure a consistent message across all external assets Further organizations that show a healthy respect for content planning and development from the top down will experience the entire enterprise shifting to a more responsive stance These companies are tuned toward deeper customer conversations that align with the end userrsquos preferences for sales and marketing information and by the very style of their collateral assets signal a positive experience for the potential buyer
Engage With UsEccolo Media welcomes your feedback on this report Email us at infoeccolomediacom with specific feedback or visit our blog at httpeccolomediatypepadcom to join in our ongoing discussion of best practices in content strategy
ACKNOWLEDGEMENTSWe would like to acknowledge the participation of the following team members for their efforts in bringing the Eccolo Media 2010 B2B Technology Collateral Survey Report to life Maite Figueroa Alice LaPlante Lorie Loe Courtney Love and Michael Sudol
32
ABOUT ECCOLO MEDIAEccolo Media specializes in strategic marketing insight and content development for some of the worldrsquos best-known technology companies An agency of exceptional writers Eccolo combines deep experience with ongoing research to identify and apply best practices for producing remarkable content The agency helps align clientsrsquo marketing needs with their key business goals by bringing a proactive innovative approach to the planning and execution of collateral in both traditional and new media channels Founded in 2007 Eccolo Media is headquartered in San Francisco California and fulfills a wide range of project needs throughout the Americas and EMEA Visit our Web site at wwweccolomediacom
ABOUT EMEDIA - Our Marketing Sponsoremedia has specialized in generating B2B sales leads and building demand since 1999 We reach more than 35 million decision makers across over 80 niche-oriented audiences within the following B2B areasInformation Technology ElectronicsSupply ChainLogistics Occupational HealthCorporate Finance Environmental ManagementHuman Resources Project ManagementMarketingSales PackagingConvertingB2B Events Construction amp ArchitectsManufacturing Professional DevelopmentSmall Business Design EngineersProcurement Control EngineersHospitality Management PrintingHealthcare Tech
emediarsquos expertise and personal service permit effective implementation of Guaranteed Cost-per-Lead programs for our clientsrsquo offers and collateral Or we can drive highly targeted traffic to clientsrsquo web pages
Contact emedia at 800-782-6167 630-288-8480 or inquiriesemediausacom
ACCELERATED B2B LEAD GENERATION mdash ON DEMAND
wwwemediausacom

24
These results support Eccolorsquos belief that interactivity is becoming ldquotable stakesrdquo for written marketing communications collateral Given the preference that purchasers have already expressed for consuming collateral at their desktop (see Figure 22) marketers that donrsquot experiment with embedded ausio video and other multimedia formats as well as links off to other communications and social media channels risk delivering assets that seem obsolete and old-fashioned
Figure 32 How did the inclusion of embedded audio and video files affect the overall influence of the written collateral
(decision makers versus influencers)
0
20
40
60
80
Very NegativelyNegativelyNo InfluencePositivelyVery Positively
24
59
66
15
26
1 0 018
Decision maker Influencer
0
10
20
30
40
50
60
70
80
Very negativelyNegativelyNo influencePositivelyVery positively
15 14
26
52
69
59
33
15 15
0 1 0 0 1 0
Small business Mid-market Enterprise
Figure 33 How did the inclusion of embedded audio and video files affect the overall influence of the written collateral
(small business vs mid-market vs enterprise)
25
The Channel EffectLast year we added a section to our annual survey that investigated how channel affects the perceived influence of collateral We defined channel as the specific avenue through which the respondent receives contentmdashwhether from a personal contact from a corporate Web site or from a sales representative for example
One fact immediately stood out in 2009 most respondents receive written collateral through the corporate Web site (Figure 34) This did not change in 2010 with 71 percent of respondents finding white papers through such sites 65 percent getting brochuresdata sheets through that channel and 56 percent acquiring case studies in that way
The next most frequently used channel for receiving a white paper in 2010 was a download from a direct response campaign (59 percent) which implies that this should be considered an important means of distribution for marketers This was followed by forwarded by a sales repcompany contact (54 percent) obtained from a personal contact (52 percent) accessed via social media (39 percent) and absorbed through webinars (34 percent) In 2009 podcasts and video collateral differed from written content when it came to how respondents ldquofoundrdquo them but that difference
0
10
20
30
40
50
60
70
80
Mentioned ina webinar
Linked to ordiscussed in
onlinesocial media
Linked in toan RSS feed
Forwarded bysales rep
company contact
BrowsingcorporateWeb site
Downloadedfrom
direct responsecampaign
Forwardedfrom
personalcontact
White papers Case studies Podcasts Videos Brochures
5253
46
34
37
59
71
5655
6665
54
4241
38
27
23
31
39
31
39
29
23
34
20
23
20
12
21
15
44
38
45
34 34
Figure 34 Through which channels have you received collateral
26
has vanished Last year podcasts were almost equally acquired from a personal contact or from a corporate Web site (48 percent and 49 percent respectively) However this year the corporate Web site trumped the personal contact channel (55 percent to 46 percent) And this was even more dramatically the case for video with only 34 percent of respondents indicating they had been forwarded a video by a personal contact while 66 percent found video on corporate Web sites This trend underscores the importance of the corporate Web site across all collateral types
When we examined the comparative influence of these various channels another interesting fact emerged although a piece of collateral referred to or forwarded by a personal contact was most frequently cited as the most influential channel for all types of collateral browsing the corporate Web site was the second most frequently cited answer (Figure 35) When you consider that the corporate Web site is clearly the most frequently used channel for collateral delivery coupled with its high perceived influence you understand why we recommend that you make investing in and frequently refreshing your Web site a priority
0
10
20
30
40
50
60
70
80
Mentioned ina webinar
Linked to ordiscussed in
onlinesocial media
Linked in toan RSS feed
Forwarded bysales rep
company contact
BrowsingcorporateWeb site
Downloadedfrom
direct responsecampaign
Forwardedfrom
personalcontact
White papers Case studies Podcasts Videos Brochures
73
79
767677
41
38
424343
6060
53
61
69
37
33
28
39
46
2220
31
1716
35
42
3836
31 31
27
33
29
19
Figure 35 Positive influence by channel
27
Marketing Collateral in the Sales CycleThe relationship between collateral and actual sales is an important one How do the various types of collateralmdashwhite papers case studies brochuresmdashimpact sales When should you deliver a white paper case study podcast or video to drive potential purchasers to the next step in the sales cycle Is there a way to time delivery of specific collateral types to nurture leads more effectively
For the purposes of this survey we defined the various stages of the technology evaluation and purchase process as
bull Pre-salemdashConsidering solutions and vendors
bull Initial salemdashReviewing vendor qualifications capabilities and RFP responses
bull Mid-salemdashReviewing details of the solution with one vendor
bull Final salemdashCustomization negotiation and procurement
In our 2008 survey results we saw that respondents most frequently consumed each collateral type for the first time in the pre-sale process by a significant margin that is before they send out RFPs or initiate discussions with specific vendors In that first Eccolo B2B survey white papers were read by 61 percent of respondents during this phase case studies by 48 percent podcasts by 53 percent video by 51 percent and brochuresdata sheets by 62 percent
0
10
20
30
40
50
60
70
Final sales processMid-sales processInitial sales processPre-sales process
White papers Case studies Podcasts Videos Brochures
53
49
41
49
31
3435
30
25
13
21
2018
11
4 3 4 3 4
60
Figure 36 In which phase of the purchasing cycle did you FIRST consume each type of collateral
28
Our 2010 survey indicates that these habits are shifting While the majority of respondents still consume most collateral for the first time in the pre-sales phase more respondents now indicate they first consumed collateral in either the initial sales or mid-sales phases than they did in 2008 For example the percentage of respondents who first consumed a white paper during the pre-sales process dropped to 53 percent the percentage that listened to a podcast dropped down to 41 percent (Figure 36) In both cases respondents appeared to move their first consumption of those types of collateral down to the next two stages of the sales process
When we further segmented the 2010 data to compare the habits of influencers to decision makers we observed some additional interesting trends across the board influencers tend to consume content earlier in the sales cycle than decision makers (Figure 37)
0 10 20 30 40 50 60 70 80
Final salesprocess
Mid-salesprocess
Initial salesprocess
Pre-salesprocess
Final salesprocess
Mid-salesprocess
Initial salesprocess
Pre-salesprocess
White papers Case studies Podcasts Videos Brochures
63
58
41
6458
4752
65
2526
3830
23
915
1417
9
2111
2
4542
3647
56
3339
3430
27
1614
2319
12
65
74
5
25
26
35
20
4
Infl
uen
cers
Deci
sio
n M
akers
Figure 37 In which phase of the purchasing cycle did you FIRST consume each type of collateral (influencers vs decision makers)
29
Likewise respondents from small businesses consume collateral for the first time during the pre-sales stage at much higher rates than respondents from middle-market or large companies For example 70 percent of small businesses consume white papers for the first time during this stage compared to just 40 percent of middle-market firms and 56 percent of large enterprises (Figure 38)
Small Business Mid-market Enterprise
0
10
20
30
40
50
60
70
80
Final sales processMid-sales processInitial Sales ProcessPre-sales Process
70
40
56
16
38
29
9
17
12
5 53
Figure 38 In which phase of the purchasing cycle did you FIRST consume white papers in 2010
As in previous years we find the data around use of collateral in the sales cycle interesting in the way it potentially sheds light on the relationship between influencers and decion makers We believe we are seeing the influencerrsquos role in terms of considering potential technology purchases and the subsequent sharing of that collatera and other information with decision makers a bit later in the cycle
30
BEST PRACTICES FOR THE REAL WORLD
As in previous years we conclude our delivery of the survey results by providing what we consider to be actionable advice that marketing professionals can apply right now to improve the quality and impact of their communications assets
1 Create white papers This is a repeating theme but one that is definitely worth saying once again white papers are frequently consumed and considered highly influential over the technology purchase Take advantage by creating a few well-written papers that clearly outline strategic advancements your solutions and products are aligned with Leverage your work by chunking up the main points into best practice documents blog posts ldquohow tordquo guides and other materials to support your broader campaign needs
2 Embed multimedia files Start with short video or audio clips to keep overall file sizes low but jump on this trend Once you get your feet under you you can advance to interactive charts and graphs Flash elements and other media types Donrsquot ignore the opportunity to be among the first to take advantage of this evolving practice
3 Consider all content to be social content We know that tech purchasers share content and that they consider materials forwarded from a personal contact to be very influential Plan all content and collateral assets from the perspective of stimulating discussion and sharing Think about interactivity links to discussion boards and user groups and point to blog posts and other communications channels in all materials
4 Deliver all content assets digitally and be prepared to have end users print them While the majority of respondents view collateral assets on the desktop a respectable number still enjoy printing out the materials they download and will further share print materials with others Avoid cross-page spreads and column designs that are hard to read digitally and remember to provide clear URLs for any links away from the materials for those reading print versions
5 Merchandise content on the Web Your company Web site is the most frequent location for obtaining content and it ranks second only to personal contacts in terms of influence Make the most of this channel by merchandising featured content and assets on landing pages and microsites that extend the thought leadership and discussion begun in your collateral Remember potential purchasers interact with your content before they interact with you so ensure viewers can easily see all the other channels through which they can engage with you all in one fun-filled information portal
31
CONCLUSIONAs we wrap up this yearrsquos annual survey report we find ourselves coming back to some basic advice that has been a theme of this section in each previous report plan
Eccolo believes that the requirement of content strategymdashidentifying communication topics and thoughtfully planning the assets required to achieve goalsmdashis relevant at every level of the marketing organization The proliferation of online channels and ever more sophisticated lead generation systems require a steady stream of fresh relevant content to successfully engage purchasers Itrsquos very easy to be distracted by looming deadlines and shifting priorities but creating a content strategy and identifying a clear development roadmap that describes topic format and channel is essential if you truly want to improve results
And the opportunity to improve results is significant Well-planned development cycles can shorten time to market reduce costs and ensure a consistent message across all external assets Further organizations that show a healthy respect for content planning and development from the top down will experience the entire enterprise shifting to a more responsive stance These companies are tuned toward deeper customer conversations that align with the end userrsquos preferences for sales and marketing information and by the very style of their collateral assets signal a positive experience for the potential buyer
Engage With UsEccolo Media welcomes your feedback on this report Email us at infoeccolomediacom with specific feedback or visit our blog at httpeccolomediatypepadcom to join in our ongoing discussion of best practices in content strategy
ACKNOWLEDGEMENTSWe would like to acknowledge the participation of the following team members for their efforts in bringing the Eccolo Media 2010 B2B Technology Collateral Survey Report to life Maite Figueroa Alice LaPlante Lorie Loe Courtney Love and Michael Sudol
32
ABOUT ECCOLO MEDIAEccolo Media specializes in strategic marketing insight and content development for some of the worldrsquos best-known technology companies An agency of exceptional writers Eccolo combines deep experience with ongoing research to identify and apply best practices for producing remarkable content The agency helps align clientsrsquo marketing needs with their key business goals by bringing a proactive innovative approach to the planning and execution of collateral in both traditional and new media channels Founded in 2007 Eccolo Media is headquartered in San Francisco California and fulfills a wide range of project needs throughout the Americas and EMEA Visit our Web site at wwweccolomediacom
ABOUT EMEDIA - Our Marketing Sponsoremedia has specialized in generating B2B sales leads and building demand since 1999 We reach more than 35 million decision makers across over 80 niche-oriented audiences within the following B2B areasInformation Technology ElectronicsSupply ChainLogistics Occupational HealthCorporate Finance Environmental ManagementHuman Resources Project ManagementMarketingSales PackagingConvertingB2B Events Construction amp ArchitectsManufacturing Professional DevelopmentSmall Business Design EngineersProcurement Control EngineersHospitality Management PrintingHealthcare Tech
emediarsquos expertise and personal service permit effective implementation of Guaranteed Cost-per-Lead programs for our clientsrsquo offers and collateral Or we can drive highly targeted traffic to clientsrsquo web pages
Contact emedia at 800-782-6167 630-288-8480 or inquiriesemediausacom
ACCELERATED B2B LEAD GENERATION mdash ON DEMAND
wwwemediausacom

25
The Channel EffectLast year we added a section to our annual survey that investigated how channel affects the perceived influence of collateral We defined channel as the specific avenue through which the respondent receives contentmdashwhether from a personal contact from a corporate Web site or from a sales representative for example
One fact immediately stood out in 2009 most respondents receive written collateral through the corporate Web site (Figure 34) This did not change in 2010 with 71 percent of respondents finding white papers through such sites 65 percent getting brochuresdata sheets through that channel and 56 percent acquiring case studies in that way
The next most frequently used channel for receiving a white paper in 2010 was a download from a direct response campaign (59 percent) which implies that this should be considered an important means of distribution for marketers This was followed by forwarded by a sales repcompany contact (54 percent) obtained from a personal contact (52 percent) accessed via social media (39 percent) and absorbed through webinars (34 percent) In 2009 podcasts and video collateral differed from written content when it came to how respondents ldquofoundrdquo them but that difference
0
10
20
30
40
50
60
70
80
Mentioned ina webinar
Linked to ordiscussed in
onlinesocial media
Linked in toan RSS feed
Forwarded bysales rep
company contact
BrowsingcorporateWeb site
Downloadedfrom
direct responsecampaign
Forwardedfrom
personalcontact
White papers Case studies Podcasts Videos Brochures
5253
46
34
37
59
71
5655
6665
54
4241
38
27
23
31
39
31
39
29
23
34
20
23
20
12
21
15
44
38
45
34 34
Figure 34 Through which channels have you received collateral
26
has vanished Last year podcasts were almost equally acquired from a personal contact or from a corporate Web site (48 percent and 49 percent respectively) However this year the corporate Web site trumped the personal contact channel (55 percent to 46 percent) And this was even more dramatically the case for video with only 34 percent of respondents indicating they had been forwarded a video by a personal contact while 66 percent found video on corporate Web sites This trend underscores the importance of the corporate Web site across all collateral types
When we examined the comparative influence of these various channels another interesting fact emerged although a piece of collateral referred to or forwarded by a personal contact was most frequently cited as the most influential channel for all types of collateral browsing the corporate Web site was the second most frequently cited answer (Figure 35) When you consider that the corporate Web site is clearly the most frequently used channel for collateral delivery coupled with its high perceived influence you understand why we recommend that you make investing in and frequently refreshing your Web site a priority
0
10
20
30
40
50
60
70
80
Mentioned ina webinar
Linked to ordiscussed in
onlinesocial media
Linked in toan RSS feed
Forwarded bysales rep
company contact
BrowsingcorporateWeb site
Downloadedfrom
direct responsecampaign
Forwardedfrom
personalcontact
White papers Case studies Podcasts Videos Brochures
73
79
767677
41
38
424343
6060
53
61
69
37
33
28
39
46
2220
31
1716
35
42
3836
31 31
27
33
29
19
Figure 35 Positive influence by channel
27
Marketing Collateral in the Sales CycleThe relationship between collateral and actual sales is an important one How do the various types of collateralmdashwhite papers case studies brochuresmdashimpact sales When should you deliver a white paper case study podcast or video to drive potential purchasers to the next step in the sales cycle Is there a way to time delivery of specific collateral types to nurture leads more effectively
For the purposes of this survey we defined the various stages of the technology evaluation and purchase process as
bull Pre-salemdashConsidering solutions and vendors
bull Initial salemdashReviewing vendor qualifications capabilities and RFP responses
bull Mid-salemdashReviewing details of the solution with one vendor
bull Final salemdashCustomization negotiation and procurement
In our 2008 survey results we saw that respondents most frequently consumed each collateral type for the first time in the pre-sale process by a significant margin that is before they send out RFPs or initiate discussions with specific vendors In that first Eccolo B2B survey white papers were read by 61 percent of respondents during this phase case studies by 48 percent podcasts by 53 percent video by 51 percent and brochuresdata sheets by 62 percent
0
10
20
30
40
50
60
70
Final sales processMid-sales processInitial sales processPre-sales process
White papers Case studies Podcasts Videos Brochures
53
49
41
49
31
3435
30
25
13
21
2018
11
4 3 4 3 4
60
Figure 36 In which phase of the purchasing cycle did you FIRST consume each type of collateral
28
Our 2010 survey indicates that these habits are shifting While the majority of respondents still consume most collateral for the first time in the pre-sales phase more respondents now indicate they first consumed collateral in either the initial sales or mid-sales phases than they did in 2008 For example the percentage of respondents who first consumed a white paper during the pre-sales process dropped to 53 percent the percentage that listened to a podcast dropped down to 41 percent (Figure 36) In both cases respondents appeared to move their first consumption of those types of collateral down to the next two stages of the sales process
When we further segmented the 2010 data to compare the habits of influencers to decision makers we observed some additional interesting trends across the board influencers tend to consume content earlier in the sales cycle than decision makers (Figure 37)
0 10 20 30 40 50 60 70 80
Final salesprocess
Mid-salesprocess
Initial salesprocess
Pre-salesprocess
Final salesprocess
Mid-salesprocess
Initial salesprocess
Pre-salesprocess
White papers Case studies Podcasts Videos Brochures
63
58
41
6458
4752
65
2526
3830
23
915
1417
9
2111
2
4542
3647
56
3339
3430
27
1614
2319
12
65
74
5
25
26
35
20
4
Infl
uen
cers
Deci
sio
n M
akers
Figure 37 In which phase of the purchasing cycle did you FIRST consume each type of collateral (influencers vs decision makers)
29
Likewise respondents from small businesses consume collateral for the first time during the pre-sales stage at much higher rates than respondents from middle-market or large companies For example 70 percent of small businesses consume white papers for the first time during this stage compared to just 40 percent of middle-market firms and 56 percent of large enterprises (Figure 38)
Small Business Mid-market Enterprise
0
10
20
30
40
50
60
70
80
Final sales processMid-sales processInitial Sales ProcessPre-sales Process
70
40
56
16
38
29
9
17
12
5 53
Figure 38 In which phase of the purchasing cycle did you FIRST consume white papers in 2010
As in previous years we find the data around use of collateral in the sales cycle interesting in the way it potentially sheds light on the relationship between influencers and decion makers We believe we are seeing the influencerrsquos role in terms of considering potential technology purchases and the subsequent sharing of that collatera and other information with decision makers a bit later in the cycle
30
BEST PRACTICES FOR THE REAL WORLD
As in previous years we conclude our delivery of the survey results by providing what we consider to be actionable advice that marketing professionals can apply right now to improve the quality and impact of their communications assets
1 Create white papers This is a repeating theme but one that is definitely worth saying once again white papers are frequently consumed and considered highly influential over the technology purchase Take advantage by creating a few well-written papers that clearly outline strategic advancements your solutions and products are aligned with Leverage your work by chunking up the main points into best practice documents blog posts ldquohow tordquo guides and other materials to support your broader campaign needs
2 Embed multimedia files Start with short video or audio clips to keep overall file sizes low but jump on this trend Once you get your feet under you you can advance to interactive charts and graphs Flash elements and other media types Donrsquot ignore the opportunity to be among the first to take advantage of this evolving practice
3 Consider all content to be social content We know that tech purchasers share content and that they consider materials forwarded from a personal contact to be very influential Plan all content and collateral assets from the perspective of stimulating discussion and sharing Think about interactivity links to discussion boards and user groups and point to blog posts and other communications channels in all materials
4 Deliver all content assets digitally and be prepared to have end users print them While the majority of respondents view collateral assets on the desktop a respectable number still enjoy printing out the materials they download and will further share print materials with others Avoid cross-page spreads and column designs that are hard to read digitally and remember to provide clear URLs for any links away from the materials for those reading print versions
5 Merchandise content on the Web Your company Web site is the most frequent location for obtaining content and it ranks second only to personal contacts in terms of influence Make the most of this channel by merchandising featured content and assets on landing pages and microsites that extend the thought leadership and discussion begun in your collateral Remember potential purchasers interact with your content before they interact with you so ensure viewers can easily see all the other channels through which they can engage with you all in one fun-filled information portal
31
CONCLUSIONAs we wrap up this yearrsquos annual survey report we find ourselves coming back to some basic advice that has been a theme of this section in each previous report plan
Eccolo believes that the requirement of content strategymdashidentifying communication topics and thoughtfully planning the assets required to achieve goalsmdashis relevant at every level of the marketing organization The proliferation of online channels and ever more sophisticated lead generation systems require a steady stream of fresh relevant content to successfully engage purchasers Itrsquos very easy to be distracted by looming deadlines and shifting priorities but creating a content strategy and identifying a clear development roadmap that describes topic format and channel is essential if you truly want to improve results
And the opportunity to improve results is significant Well-planned development cycles can shorten time to market reduce costs and ensure a consistent message across all external assets Further organizations that show a healthy respect for content planning and development from the top down will experience the entire enterprise shifting to a more responsive stance These companies are tuned toward deeper customer conversations that align with the end userrsquos preferences for sales and marketing information and by the very style of their collateral assets signal a positive experience for the potential buyer
Engage With UsEccolo Media welcomes your feedback on this report Email us at infoeccolomediacom with specific feedback or visit our blog at httpeccolomediatypepadcom to join in our ongoing discussion of best practices in content strategy
ACKNOWLEDGEMENTSWe would like to acknowledge the participation of the following team members for their efforts in bringing the Eccolo Media 2010 B2B Technology Collateral Survey Report to life Maite Figueroa Alice LaPlante Lorie Loe Courtney Love and Michael Sudol
32
ABOUT ECCOLO MEDIAEccolo Media specializes in strategic marketing insight and content development for some of the worldrsquos best-known technology companies An agency of exceptional writers Eccolo combines deep experience with ongoing research to identify and apply best practices for producing remarkable content The agency helps align clientsrsquo marketing needs with their key business goals by bringing a proactive innovative approach to the planning and execution of collateral in both traditional and new media channels Founded in 2007 Eccolo Media is headquartered in San Francisco California and fulfills a wide range of project needs throughout the Americas and EMEA Visit our Web site at wwweccolomediacom
ABOUT EMEDIA - Our Marketing Sponsoremedia has specialized in generating B2B sales leads and building demand since 1999 We reach more than 35 million decision makers across over 80 niche-oriented audiences within the following B2B areasInformation Technology ElectronicsSupply ChainLogistics Occupational HealthCorporate Finance Environmental ManagementHuman Resources Project ManagementMarketingSales PackagingConvertingB2B Events Construction amp ArchitectsManufacturing Professional DevelopmentSmall Business Design EngineersProcurement Control EngineersHospitality Management PrintingHealthcare Tech
emediarsquos expertise and personal service permit effective implementation of Guaranteed Cost-per-Lead programs for our clientsrsquo offers and collateral Or we can drive highly targeted traffic to clientsrsquo web pages
Contact emedia at 800-782-6167 630-288-8480 or inquiriesemediausacom
ACCELERATED B2B LEAD GENERATION mdash ON DEMAND
wwwemediausacom

26
has vanished Last year podcasts were almost equally acquired from a personal contact or from a corporate Web site (48 percent and 49 percent respectively) However this year the corporate Web site trumped the personal contact channel (55 percent to 46 percent) And this was even more dramatically the case for video with only 34 percent of respondents indicating they had been forwarded a video by a personal contact while 66 percent found video on corporate Web sites This trend underscores the importance of the corporate Web site across all collateral types
When we examined the comparative influence of these various channels another interesting fact emerged although a piece of collateral referred to or forwarded by a personal contact was most frequently cited as the most influential channel for all types of collateral browsing the corporate Web site was the second most frequently cited answer (Figure 35) When you consider that the corporate Web site is clearly the most frequently used channel for collateral delivery coupled with its high perceived influence you understand why we recommend that you make investing in and frequently refreshing your Web site a priority
0
10
20
30
40
50
60
70
80
Mentioned ina webinar
Linked to ordiscussed in
onlinesocial media
Linked in toan RSS feed
Forwarded bysales rep
company contact
BrowsingcorporateWeb site
Downloadedfrom
direct responsecampaign
Forwardedfrom
personalcontact
White papers Case studies Podcasts Videos Brochures
73
79
767677
41
38
424343
6060
53
61
69
37
33
28
39
46
2220
31
1716
35
42
3836
31 31
27
33
29
19
Figure 35 Positive influence by channel
27
Marketing Collateral in the Sales CycleThe relationship between collateral and actual sales is an important one How do the various types of collateralmdashwhite papers case studies brochuresmdashimpact sales When should you deliver a white paper case study podcast or video to drive potential purchasers to the next step in the sales cycle Is there a way to time delivery of specific collateral types to nurture leads more effectively
For the purposes of this survey we defined the various stages of the technology evaluation and purchase process as
bull Pre-salemdashConsidering solutions and vendors
bull Initial salemdashReviewing vendor qualifications capabilities and RFP responses
bull Mid-salemdashReviewing details of the solution with one vendor
bull Final salemdashCustomization negotiation and procurement
In our 2008 survey results we saw that respondents most frequently consumed each collateral type for the first time in the pre-sale process by a significant margin that is before they send out RFPs or initiate discussions with specific vendors In that first Eccolo B2B survey white papers were read by 61 percent of respondents during this phase case studies by 48 percent podcasts by 53 percent video by 51 percent and brochuresdata sheets by 62 percent
0
10
20
30
40
50
60
70
Final sales processMid-sales processInitial sales processPre-sales process
White papers Case studies Podcasts Videos Brochures
53
49
41
49
31
3435
30
25
13
21
2018
11
4 3 4 3 4
60
Figure 36 In which phase of the purchasing cycle did you FIRST consume each type of collateral
28
Our 2010 survey indicates that these habits are shifting While the majority of respondents still consume most collateral for the first time in the pre-sales phase more respondents now indicate they first consumed collateral in either the initial sales or mid-sales phases than they did in 2008 For example the percentage of respondents who first consumed a white paper during the pre-sales process dropped to 53 percent the percentage that listened to a podcast dropped down to 41 percent (Figure 36) In both cases respondents appeared to move their first consumption of those types of collateral down to the next two stages of the sales process
When we further segmented the 2010 data to compare the habits of influencers to decision makers we observed some additional interesting trends across the board influencers tend to consume content earlier in the sales cycle than decision makers (Figure 37)
0 10 20 30 40 50 60 70 80
Final salesprocess
Mid-salesprocess
Initial salesprocess
Pre-salesprocess
Final salesprocess
Mid-salesprocess
Initial salesprocess
Pre-salesprocess
White papers Case studies Podcasts Videos Brochures
63
58
41
6458
4752
65
2526
3830
23
915
1417
9
2111
2
4542
3647
56
3339
3430
27
1614
2319
12
65
74
5
25
26
35
20
4
Infl
uen
cers
Deci
sio
n M
akers
Figure 37 In which phase of the purchasing cycle did you FIRST consume each type of collateral (influencers vs decision makers)
29
Likewise respondents from small businesses consume collateral for the first time during the pre-sales stage at much higher rates than respondents from middle-market or large companies For example 70 percent of small businesses consume white papers for the first time during this stage compared to just 40 percent of middle-market firms and 56 percent of large enterprises (Figure 38)
Small Business Mid-market Enterprise
0
10
20
30
40
50
60
70
80
Final sales processMid-sales processInitial Sales ProcessPre-sales Process
70
40
56
16
38
29
9
17
12
5 53
Figure 38 In which phase of the purchasing cycle did you FIRST consume white papers in 2010
As in previous years we find the data around use of collateral in the sales cycle interesting in the way it potentially sheds light on the relationship between influencers and decion makers We believe we are seeing the influencerrsquos role in terms of considering potential technology purchases and the subsequent sharing of that collatera and other information with decision makers a bit later in the cycle
30
BEST PRACTICES FOR THE REAL WORLD
As in previous years we conclude our delivery of the survey results by providing what we consider to be actionable advice that marketing professionals can apply right now to improve the quality and impact of their communications assets
1 Create white papers This is a repeating theme but one that is definitely worth saying once again white papers are frequently consumed and considered highly influential over the technology purchase Take advantage by creating a few well-written papers that clearly outline strategic advancements your solutions and products are aligned with Leverage your work by chunking up the main points into best practice documents blog posts ldquohow tordquo guides and other materials to support your broader campaign needs
2 Embed multimedia files Start with short video or audio clips to keep overall file sizes low but jump on this trend Once you get your feet under you you can advance to interactive charts and graphs Flash elements and other media types Donrsquot ignore the opportunity to be among the first to take advantage of this evolving practice
3 Consider all content to be social content We know that tech purchasers share content and that they consider materials forwarded from a personal contact to be very influential Plan all content and collateral assets from the perspective of stimulating discussion and sharing Think about interactivity links to discussion boards and user groups and point to blog posts and other communications channels in all materials
4 Deliver all content assets digitally and be prepared to have end users print them While the majority of respondents view collateral assets on the desktop a respectable number still enjoy printing out the materials they download and will further share print materials with others Avoid cross-page spreads and column designs that are hard to read digitally and remember to provide clear URLs for any links away from the materials for those reading print versions
5 Merchandise content on the Web Your company Web site is the most frequent location for obtaining content and it ranks second only to personal contacts in terms of influence Make the most of this channel by merchandising featured content and assets on landing pages and microsites that extend the thought leadership and discussion begun in your collateral Remember potential purchasers interact with your content before they interact with you so ensure viewers can easily see all the other channels through which they can engage with you all in one fun-filled information portal
31
CONCLUSIONAs we wrap up this yearrsquos annual survey report we find ourselves coming back to some basic advice that has been a theme of this section in each previous report plan
Eccolo believes that the requirement of content strategymdashidentifying communication topics and thoughtfully planning the assets required to achieve goalsmdashis relevant at every level of the marketing organization The proliferation of online channels and ever more sophisticated lead generation systems require a steady stream of fresh relevant content to successfully engage purchasers Itrsquos very easy to be distracted by looming deadlines and shifting priorities but creating a content strategy and identifying a clear development roadmap that describes topic format and channel is essential if you truly want to improve results
And the opportunity to improve results is significant Well-planned development cycles can shorten time to market reduce costs and ensure a consistent message across all external assets Further organizations that show a healthy respect for content planning and development from the top down will experience the entire enterprise shifting to a more responsive stance These companies are tuned toward deeper customer conversations that align with the end userrsquos preferences for sales and marketing information and by the very style of their collateral assets signal a positive experience for the potential buyer
Engage With UsEccolo Media welcomes your feedback on this report Email us at infoeccolomediacom with specific feedback or visit our blog at httpeccolomediatypepadcom to join in our ongoing discussion of best practices in content strategy
ACKNOWLEDGEMENTSWe would like to acknowledge the participation of the following team members for their efforts in bringing the Eccolo Media 2010 B2B Technology Collateral Survey Report to life Maite Figueroa Alice LaPlante Lorie Loe Courtney Love and Michael Sudol
32
ABOUT ECCOLO MEDIAEccolo Media specializes in strategic marketing insight and content development for some of the worldrsquos best-known technology companies An agency of exceptional writers Eccolo combines deep experience with ongoing research to identify and apply best practices for producing remarkable content The agency helps align clientsrsquo marketing needs with their key business goals by bringing a proactive innovative approach to the planning and execution of collateral in both traditional and new media channels Founded in 2007 Eccolo Media is headquartered in San Francisco California and fulfills a wide range of project needs throughout the Americas and EMEA Visit our Web site at wwweccolomediacom
ABOUT EMEDIA - Our Marketing Sponsoremedia has specialized in generating B2B sales leads and building demand since 1999 We reach more than 35 million decision makers across over 80 niche-oriented audiences within the following B2B areasInformation Technology ElectronicsSupply ChainLogistics Occupational HealthCorporate Finance Environmental ManagementHuman Resources Project ManagementMarketingSales PackagingConvertingB2B Events Construction amp ArchitectsManufacturing Professional DevelopmentSmall Business Design EngineersProcurement Control EngineersHospitality Management PrintingHealthcare Tech
emediarsquos expertise and personal service permit effective implementation of Guaranteed Cost-per-Lead programs for our clientsrsquo offers and collateral Or we can drive highly targeted traffic to clientsrsquo web pages
Contact emedia at 800-782-6167 630-288-8480 or inquiriesemediausacom
ACCELERATED B2B LEAD GENERATION mdash ON DEMAND
wwwemediausacom

27
Marketing Collateral in the Sales CycleThe relationship between collateral and actual sales is an important one How do the various types of collateralmdashwhite papers case studies brochuresmdashimpact sales When should you deliver a white paper case study podcast or video to drive potential purchasers to the next step in the sales cycle Is there a way to time delivery of specific collateral types to nurture leads more effectively
For the purposes of this survey we defined the various stages of the technology evaluation and purchase process as
bull Pre-salemdashConsidering solutions and vendors
bull Initial salemdashReviewing vendor qualifications capabilities and RFP responses
bull Mid-salemdashReviewing details of the solution with one vendor
bull Final salemdashCustomization negotiation and procurement
In our 2008 survey results we saw that respondents most frequently consumed each collateral type for the first time in the pre-sale process by a significant margin that is before they send out RFPs or initiate discussions with specific vendors In that first Eccolo B2B survey white papers were read by 61 percent of respondents during this phase case studies by 48 percent podcasts by 53 percent video by 51 percent and brochuresdata sheets by 62 percent
0
10
20
30
40
50
60
70
Final sales processMid-sales processInitial sales processPre-sales process
White papers Case studies Podcasts Videos Brochures
53
49
41
49
31
3435
30
25
13
21
2018
11
4 3 4 3 4
60
Figure 36 In which phase of the purchasing cycle did you FIRST consume each type of collateral
28
Our 2010 survey indicates that these habits are shifting While the majority of respondents still consume most collateral for the first time in the pre-sales phase more respondents now indicate they first consumed collateral in either the initial sales or mid-sales phases than they did in 2008 For example the percentage of respondents who first consumed a white paper during the pre-sales process dropped to 53 percent the percentage that listened to a podcast dropped down to 41 percent (Figure 36) In both cases respondents appeared to move their first consumption of those types of collateral down to the next two stages of the sales process
When we further segmented the 2010 data to compare the habits of influencers to decision makers we observed some additional interesting trends across the board influencers tend to consume content earlier in the sales cycle than decision makers (Figure 37)
0 10 20 30 40 50 60 70 80
Final salesprocess
Mid-salesprocess
Initial salesprocess
Pre-salesprocess
Final salesprocess
Mid-salesprocess
Initial salesprocess
Pre-salesprocess
White papers Case studies Podcasts Videos Brochures
63
58
41
6458
4752
65
2526
3830
23
915
1417
9
2111
2
4542
3647
56
3339
3430
27
1614
2319
12
65
74
5
25
26
35
20
4
Infl
uen
cers
Deci
sio
n M
akers
Figure 37 In which phase of the purchasing cycle did you FIRST consume each type of collateral (influencers vs decision makers)
29
Likewise respondents from small businesses consume collateral for the first time during the pre-sales stage at much higher rates than respondents from middle-market or large companies For example 70 percent of small businesses consume white papers for the first time during this stage compared to just 40 percent of middle-market firms and 56 percent of large enterprises (Figure 38)
Small Business Mid-market Enterprise
0
10
20
30
40
50
60
70
80
Final sales processMid-sales processInitial Sales ProcessPre-sales Process
70
40
56
16
38
29
9
17
12
5 53
Figure 38 In which phase of the purchasing cycle did you FIRST consume white papers in 2010
As in previous years we find the data around use of collateral in the sales cycle interesting in the way it potentially sheds light on the relationship between influencers and decion makers We believe we are seeing the influencerrsquos role in terms of considering potential technology purchases and the subsequent sharing of that collatera and other information with decision makers a bit later in the cycle
30
BEST PRACTICES FOR THE REAL WORLD
As in previous years we conclude our delivery of the survey results by providing what we consider to be actionable advice that marketing professionals can apply right now to improve the quality and impact of their communications assets
1 Create white papers This is a repeating theme but one that is definitely worth saying once again white papers are frequently consumed and considered highly influential over the technology purchase Take advantage by creating a few well-written papers that clearly outline strategic advancements your solutions and products are aligned with Leverage your work by chunking up the main points into best practice documents blog posts ldquohow tordquo guides and other materials to support your broader campaign needs
2 Embed multimedia files Start with short video or audio clips to keep overall file sizes low but jump on this trend Once you get your feet under you you can advance to interactive charts and graphs Flash elements and other media types Donrsquot ignore the opportunity to be among the first to take advantage of this evolving practice
3 Consider all content to be social content We know that tech purchasers share content and that they consider materials forwarded from a personal contact to be very influential Plan all content and collateral assets from the perspective of stimulating discussion and sharing Think about interactivity links to discussion boards and user groups and point to blog posts and other communications channels in all materials
4 Deliver all content assets digitally and be prepared to have end users print them While the majority of respondents view collateral assets on the desktop a respectable number still enjoy printing out the materials they download and will further share print materials with others Avoid cross-page spreads and column designs that are hard to read digitally and remember to provide clear URLs for any links away from the materials for those reading print versions
5 Merchandise content on the Web Your company Web site is the most frequent location for obtaining content and it ranks second only to personal contacts in terms of influence Make the most of this channel by merchandising featured content and assets on landing pages and microsites that extend the thought leadership and discussion begun in your collateral Remember potential purchasers interact with your content before they interact with you so ensure viewers can easily see all the other channels through which they can engage with you all in one fun-filled information portal
31
CONCLUSIONAs we wrap up this yearrsquos annual survey report we find ourselves coming back to some basic advice that has been a theme of this section in each previous report plan
Eccolo believes that the requirement of content strategymdashidentifying communication topics and thoughtfully planning the assets required to achieve goalsmdashis relevant at every level of the marketing organization The proliferation of online channels and ever more sophisticated lead generation systems require a steady stream of fresh relevant content to successfully engage purchasers Itrsquos very easy to be distracted by looming deadlines and shifting priorities but creating a content strategy and identifying a clear development roadmap that describes topic format and channel is essential if you truly want to improve results
And the opportunity to improve results is significant Well-planned development cycles can shorten time to market reduce costs and ensure a consistent message across all external assets Further organizations that show a healthy respect for content planning and development from the top down will experience the entire enterprise shifting to a more responsive stance These companies are tuned toward deeper customer conversations that align with the end userrsquos preferences for sales and marketing information and by the very style of their collateral assets signal a positive experience for the potential buyer
Engage With UsEccolo Media welcomes your feedback on this report Email us at infoeccolomediacom with specific feedback or visit our blog at httpeccolomediatypepadcom to join in our ongoing discussion of best practices in content strategy
ACKNOWLEDGEMENTSWe would like to acknowledge the participation of the following team members for their efforts in bringing the Eccolo Media 2010 B2B Technology Collateral Survey Report to life Maite Figueroa Alice LaPlante Lorie Loe Courtney Love and Michael Sudol
32
ABOUT ECCOLO MEDIAEccolo Media specializes in strategic marketing insight and content development for some of the worldrsquos best-known technology companies An agency of exceptional writers Eccolo combines deep experience with ongoing research to identify and apply best practices for producing remarkable content The agency helps align clientsrsquo marketing needs with their key business goals by bringing a proactive innovative approach to the planning and execution of collateral in both traditional and new media channels Founded in 2007 Eccolo Media is headquartered in San Francisco California and fulfills a wide range of project needs throughout the Americas and EMEA Visit our Web site at wwweccolomediacom
ABOUT EMEDIA - Our Marketing Sponsoremedia has specialized in generating B2B sales leads and building demand since 1999 We reach more than 35 million decision makers across over 80 niche-oriented audiences within the following B2B areasInformation Technology ElectronicsSupply ChainLogistics Occupational HealthCorporate Finance Environmental ManagementHuman Resources Project ManagementMarketingSales PackagingConvertingB2B Events Construction amp ArchitectsManufacturing Professional DevelopmentSmall Business Design EngineersProcurement Control EngineersHospitality Management PrintingHealthcare Tech
emediarsquos expertise and personal service permit effective implementation of Guaranteed Cost-per-Lead programs for our clientsrsquo offers and collateral Or we can drive highly targeted traffic to clientsrsquo web pages
Contact emedia at 800-782-6167 630-288-8480 or inquiriesemediausacom
ACCELERATED B2B LEAD GENERATION mdash ON DEMAND
wwwemediausacom

29
Likewise respondents from small businesses consume collateral for the first time during the pre-sales stage at much higher rates than respondents from middle-market or large companies For example 70 percent of small businesses consume white papers for the first time during this stage compared to just 40 percent of middle-market firms and 56 percent of large enterprises (Figure 38)
Small Business Mid-market Enterprise
0
10
20
30
40
50
60
70
80
Final sales processMid-sales processInitial Sales ProcessPre-sales Process
70
40
56
16
38
29
9
17
12
5 53
Figure 38 In which phase of the purchasing cycle did you FIRST consume white papers in 2010
As in previous years we find the data around use of collateral in the sales cycle interesting in the way it potentially sheds light on the relationship between influencers and decion makers We believe we are seeing the influencerrsquos role in terms of considering potential technology purchases and the subsequent sharing of that collatera and other information with decision makers a bit later in the cycle
30
BEST PRACTICES FOR THE REAL WORLD
As in previous years we conclude our delivery of the survey results by providing what we consider to be actionable advice that marketing professionals can apply right now to improve the quality and impact of their communications assets
1 Create white papers This is a repeating theme but one that is definitely worth saying once again white papers are frequently consumed and considered highly influential over the technology purchase Take advantage by creating a few well-written papers that clearly outline strategic advancements your solutions and products are aligned with Leverage your work by chunking up the main points into best practice documents blog posts ldquohow tordquo guides and other materials to support your broader campaign needs
2 Embed multimedia files Start with short video or audio clips to keep overall file sizes low but jump on this trend Once you get your feet under you you can advance to interactive charts and graphs Flash elements and other media types Donrsquot ignore the opportunity to be among the first to take advantage of this evolving practice
3 Consider all content to be social content We know that tech purchasers share content and that they consider materials forwarded from a personal contact to be very influential Plan all content and collateral assets from the perspective of stimulating discussion and sharing Think about interactivity links to discussion boards and user groups and point to blog posts and other communications channels in all materials
4 Deliver all content assets digitally and be prepared to have end users print them While the majority of respondents view collateral assets on the desktop a respectable number still enjoy printing out the materials they download and will further share print materials with others Avoid cross-page spreads and column designs that are hard to read digitally and remember to provide clear URLs for any links away from the materials for those reading print versions
5 Merchandise content on the Web Your company Web site is the most frequent location for obtaining content and it ranks second only to personal contacts in terms of influence Make the most of this channel by merchandising featured content and assets on landing pages and microsites that extend the thought leadership and discussion begun in your collateral Remember potential purchasers interact with your content before they interact with you so ensure viewers can easily see all the other channels through which they can engage with you all in one fun-filled information portal
31
CONCLUSIONAs we wrap up this yearrsquos annual survey report we find ourselves coming back to some basic advice that has been a theme of this section in each previous report plan
Eccolo believes that the requirement of content strategymdashidentifying communication topics and thoughtfully planning the assets required to achieve goalsmdashis relevant at every level of the marketing organization The proliferation of online channels and ever more sophisticated lead generation systems require a steady stream of fresh relevant content to successfully engage purchasers Itrsquos very easy to be distracted by looming deadlines and shifting priorities but creating a content strategy and identifying a clear development roadmap that describes topic format and channel is essential if you truly want to improve results
And the opportunity to improve results is significant Well-planned development cycles can shorten time to market reduce costs and ensure a consistent message across all external assets Further organizations that show a healthy respect for content planning and development from the top down will experience the entire enterprise shifting to a more responsive stance These companies are tuned toward deeper customer conversations that align with the end userrsquos preferences for sales and marketing information and by the very style of their collateral assets signal a positive experience for the potential buyer
Engage With UsEccolo Media welcomes your feedback on this report Email us at infoeccolomediacom with specific feedback or visit our blog at httpeccolomediatypepadcom to join in our ongoing discussion of best practices in content strategy
ACKNOWLEDGEMENTSWe would like to acknowledge the participation of the following team members for their efforts in bringing the Eccolo Media 2010 B2B Technology Collateral Survey Report to life Maite Figueroa Alice LaPlante Lorie Loe Courtney Love and Michael Sudol
32
ABOUT ECCOLO MEDIAEccolo Media specializes in strategic marketing insight and content development for some of the worldrsquos best-known technology companies An agency of exceptional writers Eccolo combines deep experience with ongoing research to identify and apply best practices for producing remarkable content The agency helps align clientsrsquo marketing needs with their key business goals by bringing a proactive innovative approach to the planning and execution of collateral in both traditional and new media channels Founded in 2007 Eccolo Media is headquartered in San Francisco California and fulfills a wide range of project needs throughout the Americas and EMEA Visit our Web site at wwweccolomediacom
ABOUT EMEDIA - Our Marketing Sponsoremedia has specialized in generating B2B sales leads and building demand since 1999 We reach more than 35 million decision makers across over 80 niche-oriented audiences within the following B2B areasInformation Technology ElectronicsSupply ChainLogistics Occupational HealthCorporate Finance Environmental ManagementHuman Resources Project ManagementMarketingSales PackagingConvertingB2B Events Construction amp ArchitectsManufacturing Professional DevelopmentSmall Business Design EngineersProcurement Control EngineersHospitality Management PrintingHealthcare Tech
emediarsquos expertise and personal service permit effective implementation of Guaranteed Cost-per-Lead programs for our clientsrsquo offers and collateral Or we can drive highly targeted traffic to clientsrsquo web pages
Contact emedia at 800-782-6167 630-288-8480 or inquiriesemediausacom
ACCELERATED B2B LEAD GENERATION mdash ON DEMAND
wwwemediausacom