east twin river targeted watershed
TRANSCRIPT
June 22, 2020 East Twin River Targeted Watershed Assessment: A Plan to Restore and Protect Wisconsin Waters, 2020
1 | 42
A Watershed Report
created by the Bureau
of Water Quality in
support of the Clean
Water Act.
EGAD # 3200-2018-28 Water Quality Bureau, Wisconsin DNR
Photo by: Mary Gansberg, East District Water Quality Biologist Wisconsin Department of Natural Resources
East Twin River Targeted Watershed Assessment: A Water Quality Report to
Restore Wisconsin Watersheds, 2020
East Twin River Watershed (TK02) HUC12: 070600050203, Monitored 2016
To learn more, see on Wisconsin’s TWA Projects Online! Read about East Twin River waters in Explore Wisconsin’s Waters Online!
PUBLIC REVIEW DRAFT – FOR PUBLIC COMMENT
East Twin River at Krok Road “Ditch” (Station ID 10030630)

June 22, 2020 East Twin River Targeted Watershed Assessment: A Water Quality Report to Restore Wisconsin Watersheds, 2020
2 | 42
Table of Contents
Targeted Watershed Assessment Study Summary .................................................................................................................................. 4
STUDY PURPOSE ............................................................................................................................................................................................... 4 ABOUT THE WATERSHED ..................................................................................................................................................................................... 4 BIOLOGICAL COMMUNITIES AND WATER QUALITY .................................................................................................................................................... 4 RECOMMENDATIONS .......................................................................................................................................................................................... 4
Wisconsin Water Quality Monitoring and Planning ................................................................................................................................. 5
BASIN/WATERSHED PARTNERS............................................................................................................................................................................. 5 REPORT ACKNOWLEDGEMENTS............................................................................................................................................................................. 5 LIST OF ABBREVIATIONS ...................................................................................................................................................................................... 6
Water Quality Plan Goals ........................................................................................................................................................................ 8
Resources ............................................................................................................................................................................................... 8
WATERSHED .................................................................................................................................................................................................... 8 LAND USE, SITE CHARACTERISTICS POPULATION ....................................................................................................................................................... 8 HYDROLOGY ..................................................................................................................................................................................................... 8 SOILS .............................................................................................................................................................................................................. 8 ECOLOGICAL LANDSCAPES ................................................................................................................................................................................... 8 HYDROGEOLOGY ............................................................................................................................................................................................... 9 TROUT WATERS ................................................................................................................................................................................................ 9 OUTSTANDING AND EXCEPTIONAL RESOURCE WATERS .............................................................................................................................................. 9 IMPAIRED WATERS ............................................................................................................................................................................................ 9
Monitoring Project Details .................................................................................................................................................................... 12
PURPOSE ....................................................................................................................................................................................................... 12 SITE SELECTION AND STUDY DESIGN .................................................................................................................................................................... 12
Monitoring included .............................................................................................................................................................................. 12 Monitored Streams ............................................................................................................................................................................... 12
METHODS, EQUIPMENT AND QUALITY ASSURANCE ................................................................................................................................................. 14 Water Chemistry Sampling ................................................................................................................................................................... 14 Continuous Temperature ...................................................................................................................................................................... 14 Ambient toxicity testing ........................................................................................................................................................................ 14 Macroinvertebrate Evaluation .............................................................................................................................................................. 14 Habitat Evaluation ................................................................................................................................................................................ 14 Fish Assemblage .................................................................................................................................................................................... 14
Project Results ...................................................................................................................................................................................... 15
WATER CHEMISTRY ......................................................................................................................................................................................... 16 Total Phosphorus .................................................................................................................................................................................. 16 Chloride ................................................................................................................................................................................................. 17 Ammonia ............................................................................................................................................................................................... 18 Chromium.............................................................................................................................................................................................. 18
CONTINUOUS WATER TEMPERATURE ................................................................................................................................................................... 18 AMBIENT TOXICITY TESTING ............................................................................................................................................................................... 21
Fathead Minnow (Pimephales promelas) Toxicity: ............................................................................................................................... 21 Water Flea (Ceriodaphnia dubia) Toxicity: ............................................................................................................................................ 21 Green Algae (Selenastrum capricornutum) Toxicity: ............................................................................................................................. 21
MACROINVERTEBRATES .................................................................................................................................................................................... 22 HABITAT ASSESSMENTS .................................................................................................................................................................................... 23 FISH NATURAL COMMUNITIES ............................................................................................................................................................................ 24 FISHERIES ASSEMBLAGE ................................................................................................................................................................................... 25 FISH CONDITION ............................................................................................................................................................................................. 25
Discussion ............................................................................................................................................................................................. 27
IMPAIRMENT STATUS ....................................................................................................................................................................................... 27
June 22, 2020 East Twin River Targeted Watershed Assessment: A Water Quality Report to Restore Wisconsin Watersheds, 2020
3 | 42
WATER TEMPERATURE ..................................................................................................................................................................................... 27 Recommendations ................................................................................................................................................................................ 29
Appendix A. Whole Effluent Toxicity (WET) Testing methods ................................................................................................................ 31
Appendix B: Toxicity Test Rests in Tables .............................................................................................................................................. 32
Appendix C: References ........................................................................................................................................................................ 34
Appendix D. Blue Iris Environmental Report of Findings, Biological Survey of East Twin River, Kewaunee County 2009 ........................ 35
Appendix E: Water Quality Standards Attainment Table ....................................................................................................................... 37
Figures
Figure 1. East Twin R. Watershed (TK02). ......................................................................................................................................................... 4 Figure 2 The East Twin River Watershed .......................................................................................................................................................... 8 Figure 3. Land use in the East Twin River watershed (TK02). ........................................................................................................................... 8 Figure 4. Ecological Landscapes of the East Twin River Watershed (TK02). ..................................................................................................... 9 Figure 5. Trout streams East Twin River Watershed ......................................................................................................................................... 9 Figure 6. Monitoring sites in the East Twin River watershed (TK02). ............................................................................................................. 12 Figure 7. Map of upper East Twin River watershed along with sampling station IDs. .................................................................................... 13 Figure 8. Local Streets and Monitoring Stations. ............................................................................................................................................ 15 Figure 9. Total phosphorus 2011/2012 and 2017. Bars indicate median values during each field season; error bars indicate the 90% confidence interval. ........................................................................................................................................................................................ 16 Figure 10. Chloride from all stations from sampling taken in 2011/2012 and 2017. ...................................................................................... 17 Figure 11. Total ammonia from all stations in 2017. Bars .............................................................................................................................. 18 Figure 12 . Average daily temperature values at all stations sampled during 2011. ...................................................................................... 19 Figure 13. Average daily temperature values at all stations sampled during 2017. ....................................................................................... 19 Figure 14: Percentage of exceedance values of the Wisconsin Admin. Code for acute temperature criteria ................................................ 20 Figure 15. Average of all average daily temperature values for each field station monitored in 2011 and 2017 ......................................... 20
Tables
Table 1. Trout streams in the East Twin River Watershed (TK02). .................................................................................................................... 9 Table 2. ORW/ERWs in the East Twin River Watershed (TK02). ....................................................................................................................... 9 Table 3. Impaired waters in the East Twin River Watershed (TK02). .............................................................................................................. 10 Table 4. Monitoring Stations in the East Twin River Targeted Watershed Assessment ................................................................................. 12 Table 5. Monitoring Stations and Parameters Studied. .................................................................................................................................. 13 Table 6. Macroinvertebrate Values and Condition ......................................................................................................................................... 22 Table 7. Habitat Values and Condition ........................................................................................................................................................... 23 Table 8. Fish and Habitat Data ....................................................................................................................................................................... 24 Table 9. Fish Inventory of the East Twin and Unnamed Tributaries ............................................................................................................... 25 Table 10: Small Stream Fish IBI Scores for all years of study .......................................................................................................................... 26 Table 11: Reference Tables for Fish IBI and Habitat Values ............................................................................................................................ 26 Table 12: Stream classification temperature ranges from Lyons, et. al., 2009. .............................................................................................. 26
June 22, 2020 East Twin River Targeted Watershed Assessment: A Plan to Restore and Protect Wisconsin Waters, 2020
4 | 42
Targeted Watershed Assessment Study Summary
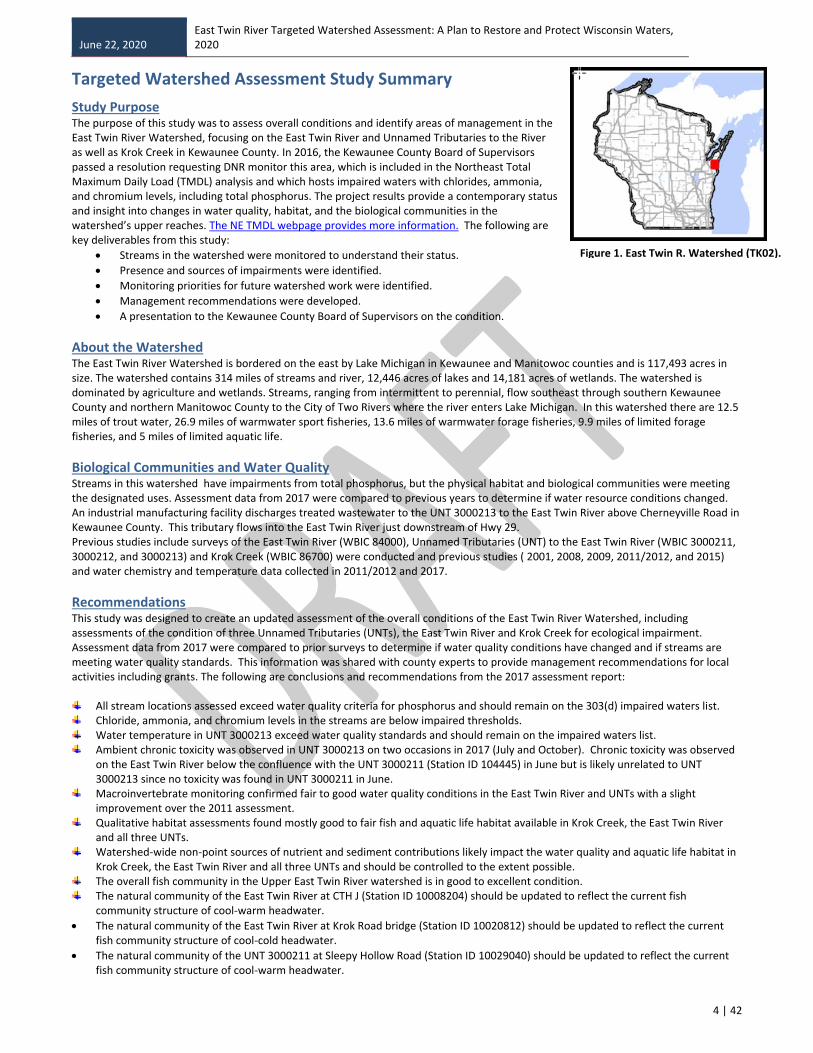
Study Purpose The purpose of this study was to assess overall conditions and identify areas of management in the East Twin River Watershed, focusing on the East Twin River and Unnamed Tributaries to the River as well as Krok Creek in Kewaunee County. In 2016, the Kewaunee County Board of Supervisors passed a resolution requesting DNR monitor this area, which is included in the Northeast Total Maximum Daily Load (TMDL) analysis and which hosts impaired waters with chlorides, ammonia, and chromium levels, including total phosphorus. The project results provide a contemporary status and insight into changes in water quality, habitat, and the biological communities in the watershed’s upper reaches. The NE TMDL webpage provides more information. The following are key deliverables from this study:
• Streams in the watershed were monitored to understand their status.
• Presence and sources of impairments were identified.
• Monitoring priorities for future watershed work were identified.
• Management recommendations were developed.
• A presentation to the Kewaunee County Board of Supervisors on the condition.
About the Watershed The East Twin River Watershed is bordered on the east by Lake Michigan in Kewaunee and Manitowoc counties and is 117,493 acres in size. The watershed contains 314 miles of streams and river, 12,446 acres of lakes and 14,181 acres of wetlands. The watershed is dominated by agriculture and wetlands. Streams, ranging from intermittent to perennial, flow southeast through southern Kewaunee County and northern Manitowoc County to the City of Two Rivers where the river enters Lake Michigan. In this watershed there are 12.5 miles of trout water, 26.9 miles of warmwater sport fisheries, 13.6 miles of warmwater forage fisheries, 9.9 miles of limited forage fisheries, and 5 miles of limited aquatic life.
Biological Communities and Water Quality Streams in this watershed have impairments from total phosphorus, but the physical habitat and biological communities were meeting the designated uses. Assessment data from 2017 were compared to previous years to determine if water resource conditions changed. An industrial manufacturing facility discharges treated wastewater to the UNT 3000213 to the East Twin River above Cherneyville Road in Kewaunee County. This tributary flows into the East Twin River just downstream of Hwy 29. Previous studies include surveys of the East Twin River (WBIC 84000), Unnamed Tributaries (UNT) to the East Twin River (WBIC 3000211, 3000212, and 3000213) and Krok Creek (WBIC 86700) were conducted and previous studies ( 2001, 2008, 2009, 2011/2012, and 2015) and water chemistry and temperature data collected in 2011/2012 and 2017.
Recommendations This study was designed to create an updated assessment of the overall conditions of the East Twin River Watershed, including assessments of the condition of three Unnamed Tributaries (UNTs), the East Twin River and Krok Creek for ecological impairment. Assessment data from 2017 were compared to prior surveys to determine if water quality conditions have changed and if streams are meeting water quality standards. This information was shared with county experts to provide management recommendations for local activities including grants. The following are conclusions and recommendations from the 2017 assessment report:
All stream locations assessed exceed water quality criteria for phosphorus and should remain on the 303(d) impaired waters list. Chloride, ammonia, and chromium levels in the streams are below impaired thresholds. Water temperature in UNT 3000213 exceed water quality standards and should remain on the impaired waters list. Ambient chronic toxicity was observed in UNT 3000213 on two occasions in 2017 (July and October). Chronic toxicity was observed
on the East Twin River below the confluence with the UNT 3000211 (Station ID 104445) in June but is likely unrelated to UNT 3000213 since no toxicity was found in UNT 3000211 in June.
Macroinvertebrate monitoring confirmed fair to good water quality conditions in the East Twin River and UNTs with a slight improvement over the 2011 assessment.
Qualitative habitat assessments found mostly good to fair fish and aquatic life habitat available in Krok Creek, the East Twin River and all three UNTs.
Watershed-wide non-point sources of nutrient and sediment contributions likely impact the water quality and aquatic life habitat in Krok Creek, the East Twin River and all three UNTs and should be controlled to the extent possible.
The overall fish community in the Upper East Twin River watershed is in good to excellent condition. The natural community of the East Twin River at CTH J (Station ID 10008204) should be updated to reflect the current fish
community structure of cool-warm headwater.
• The natural community of the East Twin River at Krok Road bridge (Station ID 10020812) should be updated to reflect the current fish community structure of cool-cold headwater.
• The natural community of the UNT 3000211 at Sleepy Hollow Road (Station ID 10029040) should be updated to reflect the current fish community structure of cool-warm headwater.
Figure 1. East Twin R. Watershed (TK02).

June 22, 2020 East Twin River Targeted Watershed Assessment: A Water Quality Report to Restore Wisconsin Watersheds, 2020
5 | 42
Wisconsin Water Quality Monitoring and Planning
This Water Quality Management Plan was created under the state’s Planning and Water Resources Monitoring programs. The plan reflects Water Quality Bureau and Water Resources Monitoring Strategy goals and priorities and fulfills Areawide Water Quality Management Planning milestones under the Clean Water Act. Condition information and resource management recommendations support and guide program priorities for the plan area. This plan is approved by the Wisconsin DNR and is a formal update to the Twin-Door-Kewaunee Areawide Water Quality Management Plan and Wisconsin’s Statewide Areawide Water Quality Management Plan This plan will be forwarded to USEPA for certification as a formal plan update. _____________________________________ __________________ Mary Gansberg, Water Quality Biologist, East District Date _____________________________________ __________________ Marsha Burzynski, Water Quality Field Supervisor, East District Date ____________________________________ __________________ Greg Searle, Water Quality Field Operations Director Date _____________________________________ __________________ Timothy Asplund, Water Quality Monitoring Section Chief Date
Basin/Watershed Partners • Kewaunee Land and Water Conservation Department
Report Acknowledgements • Mary Gansberg, Primary Author and Investigator, East District, Wisconsin DNR
• Amanda Smith, Program Support, Water Quality Bureau, Wisconsin DNR
• Lisa Helmuth, Program Coordinator, Water Quality Bureau, Wisconsin DNR This document is available electronically on the DNR’s website. The Wisconsin Department of Natural Resources provides equal opportunity in its employment, programs, services, and functions under an Affirmative Action Plan. If you have any questions, please write to Equal Opportunity Office, Department of the Interior, Washington, D.C. 20240. This publication is available in alternate format (large print, Braille, audio tape, etc.) upon request. Please call 608-267-7694 for more information. Wisconsin Department of Natural Resources 101 S. Webster Street • PO Box 7921 • Madison, Wisconsin 53707-7921 608-266-2621
WDNR PUB- WY-066-2015 EGAD # 3200-2018-28
June 22, 2020 East Twin River Targeted Watershed Assessment: A Water Quality Report to Restore Wisconsin Watersheds, 2020
6 | 42
List of Abbreviations AEL: Aquatic Entomology Laboratory at UW – Stevens Point: the primary laboratory for analysis of macroinvertebrate taxonomy in the State of Wisconsin. BMP: Best Management Practice. A land management practice used to prevent or reduce nonpoint source pollution such as runoff, total suspended solids, or excess nutrients. DATCP: Wisconsin Department of Agriculture, Trade and Consumer Protection – the state agency in partnership with DNR responsible for a variety of land and water related programs. DNR: Department of Natural Resources. Wisconsin Department of Natural Resources is an agency of the State of Wisconsin created to preserve, protect, manage, and support natural resources. END: Endangered Species - Wisconsin species designated as rare or unique due to proximity to the farthest extent of their natural range or due to anthropogenic deleterious impacts on the landscape or both. ERW: Exceptional Resource Water- Wisconsin’s designation under state water quality standards to waters with exceptional quality and which may be provided a higher level of protection through various programs and processes. FMDB: Fisheries Management Database – or Fish Database – the state’s repository for fish taxonomy and auto-calculated metrics involving fish assemblage condition and related. FIBI: Fish Index of biological integrity (Fish IBI). An Index of Biological Integrity (IBI) is a scientific tool used to gauge water condition based on biological data. Results indicate condition and provide insight into potential degradation sources. In Wisconsin, specific fish IBI tools are developed for specific natural communities. Therefore, biologists must review and confirm the natural community to use the correct fish IBI tool. HUC: Hydrologic Unit Code. A sequence of numbers that represent one of a series of nested hydrologic catchments delineated by a consortium of agencies including USGS, USFS, and Wisconsin DNR. MIBI: Macroinvertebrate Index of biological integrity. The mIBI is the primary tool used to assess stream macroinvertebrate community condition. NC: Natural Community. A system of categorizing water based on inherent physical, hydrologic, and biological components. Streams and Lakes have uniquely derived systems that result in specific natural community designations for each lake and river segment in the state. These designations dictate the appropriate assessment tools which improves the condition result, reflecting detailed nuances reflecting the modeling and analysis work foundational to the assessment systems. Monitoring Seq. No. Monitoring sequence number refers to a unique identification code generated by the Surface Water Integrated Monitoring System (SWIMS), which holds much of the state’s water quality monitoring data except for fisheries taxonomy and habitat data. MDM: Maximum Daily Averages – maximum daily average is a calculated metric that may be used for temperature, dissolved oxygen and related chemistry parameters to characterize water condition. NC: Natural Community. A system of categorizing water based on inherent physical, hydrologic, and biological components. Streams and Lakes have uniquely derived systems that result in specific natural community designations for each lake and river segment in the state. These designations dictate the appropriate assessment tools which improves the condition result, reflecting detailed nuances reflecting the modeling and analysis work foundational to the assessment systems. mg/L: milligrams per liter - a volumetric measure typically used in chemistry analysis characterizations. NOAA: National Oceanic and Atmospheric Administration – a federal agency responsible for water / aquatic related activities involve the open waters, seas and Great Lakes. ND: No detection – a term used typically in analytical settings to identify when a parameter or chemical constituent was not present at levels higher than the limit of detection. NRCS: USDA Natural Resources Conservation Service - the federal agency providing local support and land management outreach work with landowners and partners such as state agencies.
June 22, 2020 East Twin River Targeted Watershed Assessment: A Water Quality Report to Restore Wisconsin Watersheds, 2020
7 | 42
ORW: Outstanding Resource Water- Wisconsin’s designation under state water quality standards to waters with outstanding quality and which may be provided a higher level of protection through various programs and processes. SC: Species of Special Concern- species designated as special concern due to proximity to the farthest extent of their natural range or due to anthropogenic deleterious impacts on the landscape, or both. SWIMS ID. Surface Water Integrated Monitoring System (SWIMS) identification number is the unique monitoring station identification number for the location of monitoring data. TDP: Total Dissolved Phosphorus – an analyzed chemistry parameter collected in aquatic systems positively correlated with excess productivity and eutrophication in Wisconsin waters. TMDL: Total Maximum Daily Load – a technical report required for impaired waters Clean Water Act. TMDLs identify sources, sinks and impairments associated with the pollutant causing documented impairments. TP: Total Phosphorus - an analyzed chemical parameter collected in aquatic systems frequently positively correlated with excess productivity and eutrophication in many of Wisconsin’s waters. TWA: Targeted Watershed Assessment. A monitoring study design centered on catchments or watersheds that uses a blend of geometric study design and targeted site selection to gather baseline data and additional collection work for unique and site-specific concerns for complex environmental questions including effectiveness monitoring of management actions, evaluation surveys for site specific criteria or permits, protection projects, and generalized watershed planning studies. TSS: Total suspended solids – an analyzed physical parameter collected in aquatic systems that is frequently positively correlated with excess productivity, reduced water clarity, reduced dissolved oxygen and degraded biological communities. WATERS ID. The Waterbody Assessment, Tracking, and Electronic Reporting System Identification Code. The WATERS ID is a unique numerical sequence number assigned by the WATERS system, also known as “Assessment Unit ID code.” This code is used to identify unique stream segments or lakes assessed and stored in the WATERS system. WBIC: Water Body Identification Code. WDNR’s unique identification codes assigned to water features in the state. The lines and information allow the user to execute spatial and tabular queries about the data, make maps, and perform flow analysis and network traces. WSLH: Wisconsin State Laboratory of Hygiene– the state’s certified laboratory that provides a wide range of analytical services including toxicology, chemistry, and data sharing. WQC: Water quality criteria – a component of Wisconsin’s water quality standards that provide numerical endpoints for specific chemical, physical, and biological constituents.
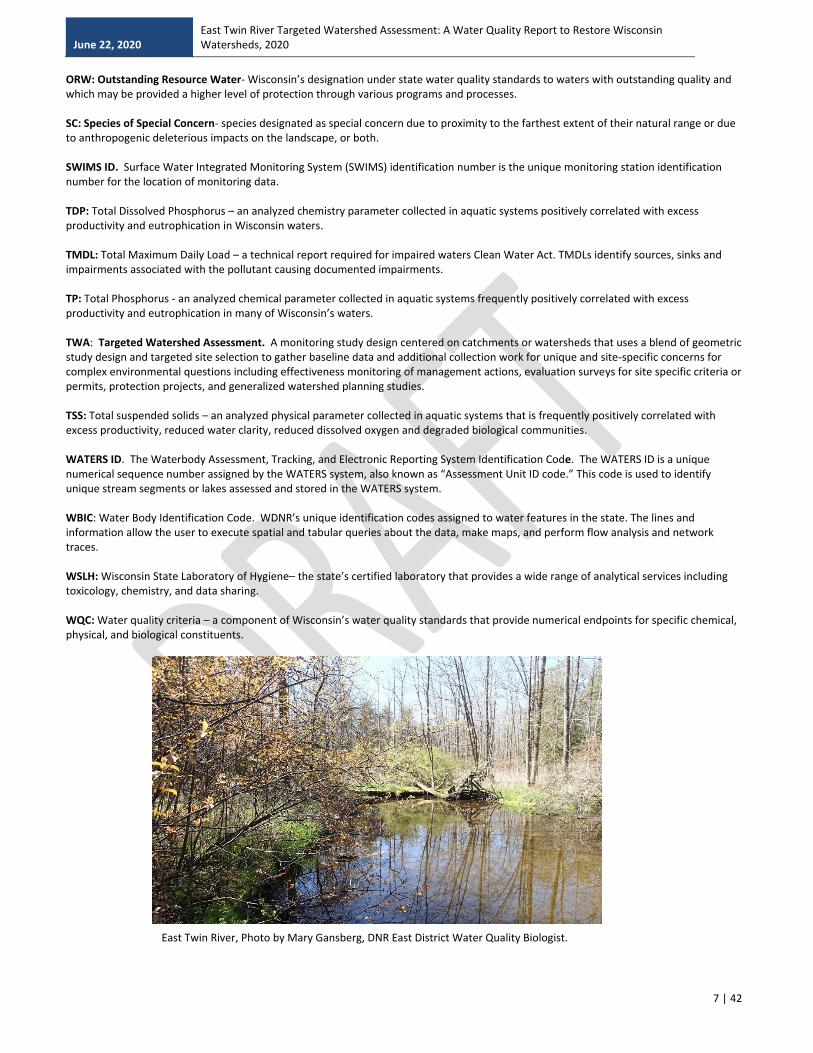
East Twin River, Photo by Mary Gansberg, DNR East District Water Quality Biologist.
June 22, 2020 East Twin River Targeted Watershed Assessment: A Water Quality Report to Restore Wisconsin Watersheds, 2020
8 | 42
Water Quality Plan Goals
The purpose of this study was to determine the contemporary status and potential recent changes in water quality, habitat, and the biological communities in the upper reaches of the East Twin River watershed. This plan is designed to present monitoring study results, identify issues, or concerns in the area found during the project, and to make recommendations to improve or protect water quality consistent with Clean Water Act guidelines and state water quality standards.
Resources
Watershed The East Twin River Watershed is bordered on the east by Lake Michigan in Kewaunee and Manitowoc counties and is 117,493 acres in size. The watershed contains 314 miles of streams and river, 12,446 acres of lakes and 14,181 acres of wetlands. The watershed is dominated by agriculture and wetlands. Streams in the East Twin Watershed flow southeastward through southern Kewaunee County and northern Manitowoc County to the City of Two Rivers where the river enters Lake Michigan. Streams within the watershed range from intermittent to perennial. Of the 98.9 stream miles in the basin, 67.9 miles designated fish and aquatic life uses specified. In this watershed there are 12.5 miles of trout water, 26.9 miles of warmwater sport fisheries, 13.6 miles of warmwater forage fisheries, 9.9 miles of limited forage fisheries, and 5 miles of limited aquatic life waters.
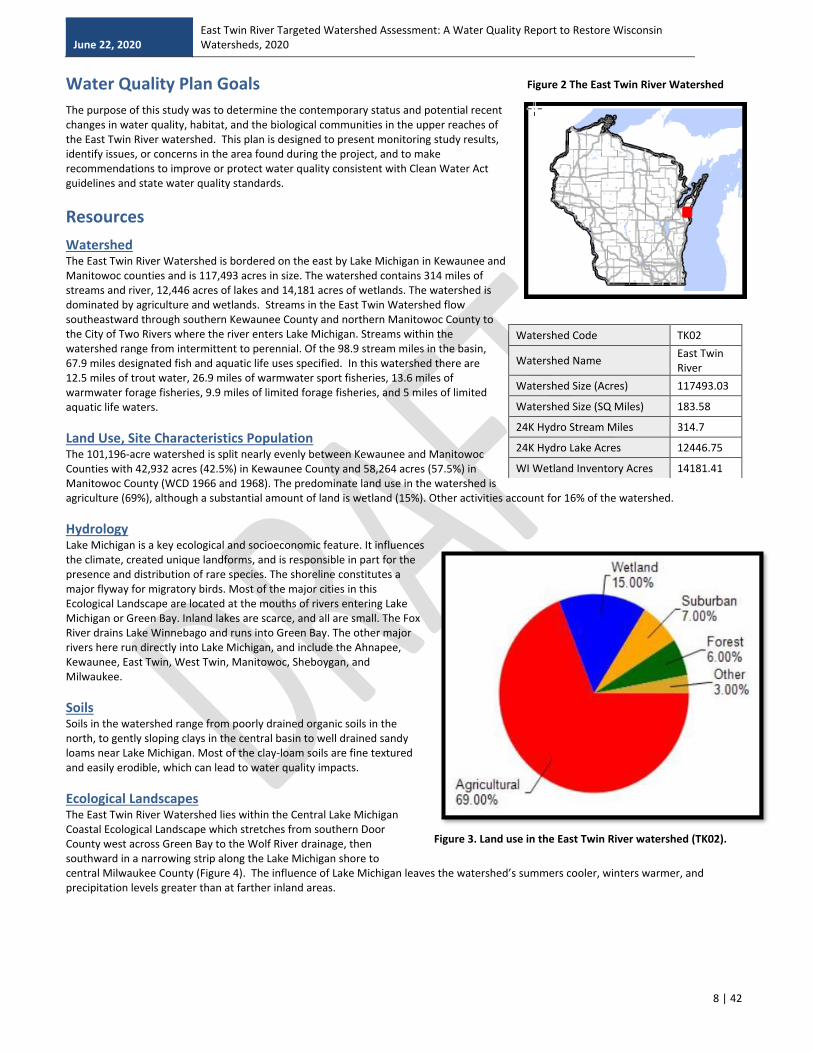
Land Use, Site Characteristics Population The 101,196-acre watershed is split nearly evenly between Kewaunee and Manitowoc Counties with 42,932 acres (42.5%) in Kewaunee County and 58,264 acres (57.5%) in Manitowoc County (WCD 1966 and 1968). The predominate land use in the watershed is agriculture (69%), although a substantial amount of land is wetland (15%). Other activities account for 16% of the watershed.
Hydrology Lake Michigan is a key ecological and socioeconomic feature. It influences the climate, created unique landforms, and is responsible in part for the presence and distribution of rare species. The shoreline constitutes a major flyway for migratory birds. Most of the major cities in this Ecological Landscape are located at the mouths of rivers entering Lake Michigan or Green Bay. Inland lakes are scarce, and all are small. The Fox River drains Lake Winnebago and runs into Green Bay. The other major rivers here run directly into Lake Michigan, and include the Ahnapee, Kewaunee, East Twin, West Twin, Manitowoc, Sheboygan, and Milwaukee.
Soils Soils in the watershed range from poorly drained organic soils in the north, to gently sloping clays in the central basin to well drained sandy loams near Lake Michigan. Most of the clay-loam soils are fine textured and easily erodible, which can lead to water quality impacts.
Ecological Landscapes The East Twin River Watershed lies within the Central Lake Michigan Coastal Ecological Landscape which stretches from southern Door County west across Green Bay to the Wolf River drainage, then southward in a narrowing strip along the Lake Michigan shore to central Milwaukee County (Figure 4). The influence of Lake Michigan leaves the watershed’s summers cooler, winters warmer, and precipitation levels greater than at farther inland areas.
Watershed Code TK02
Watershed Name East Twin River
Watershed Size (Acres) 117493.03
Watershed Size (SQ Miles) 183.58
24K Hydro Stream Miles 314.7
24K Hydro Lake Acres 12446.75
WI Wetland Inventory Acres 14181.41
Figure 2 The East Twin River Watershed
Figure 3. Land use in the East Twin River watershed (TK02).

June 22, 2020 East Twin River Targeted Watershed Assessment: A Water Quality Report to Restore Wisconsin Watersheds, 2020
9 | 42
Hydrogeology Dolomites and shales underlie the glacial deposits that blanket virtually all of the Central Lake Michigan Coastal Ecological Landscape. The dolomite Niagara Escarpment is the major bedrock feature, running across the entire landscape from northeast to southwest. Series of dolomite cliffs provide critical habitat for rare terrestrial snails, bats, and specialized plants. The primary glacial landforms are ground moraine, outwash, and lake plain. The topography is generally rolling where the surface is underlain by ground moraine, variable over areas of outwash, and nearly level where lacustrine deposits are present. Important soils include clays, loams, sands, and gravels. Certain landforms, such as sand spits, clay bluffs, beach and dune complexes, and ridge and swale systems, are associated only with the shorelines of Lake Michigan and Green Bay. Historically areas of poorly drained glacial lake plain supported wet forests of tamarack, white cedar, black ash, red maple, and elm. Emergent marshes and wet meadows were common in and adjacent to lower Green Bay, while Lake Michigan shoreline areas featured beaches, dunes, interdunal wetlands, marshes, and highly diverse ridge and swale vegetation. Small patches of prairie and oak savanna were present in the southwestern portion of this landscape.
Trout Waters DNR trout streams in this watershed are listed in Table 1. High quality trout waters (Class I) have sufficient natural reproduction to sustain populations of wild trout, at or near carry capacity. Class II streams may have some natural reproduction, but not enough to utilize available food and space. Stocking maintains a sport fishery but these streams have good survival and carryover of adult trout, often producing some fish larger than average size. Class III are marginal trout habitat with no natural reproduction occurring. There is no carryover of trout from one year to the next. Table 1. Trout streams in the East Twin River Watershed (TK02).
Water Name WBIC Start Mile
End Mile
Trout Class
East Twin River 84000 26.4 34.18 Class II
East Twin River 84000 34.18 40.91 Class I
Jambo Creek 84300 0 3.91 Class II
Tisch Mills Creek 85500 0 2.26 Class II
Outstanding and Exceptional Resource Waters Wisconsin Outstanding Resource Waters (ORWs, Table 2) and Exceptional Resource Waters (ERWs) provide outstanding recreational opportunities, support valuable fisheries and wildlife habitat, have good water quality, and are not significantly impacted by human activities. The East Twin River is an exceptional resource water from mile 34.18 to 49.90, which is also the Class I Trout Stream section. Table 2. ORW/ERWs in the East Twin River Watershed (TK02).
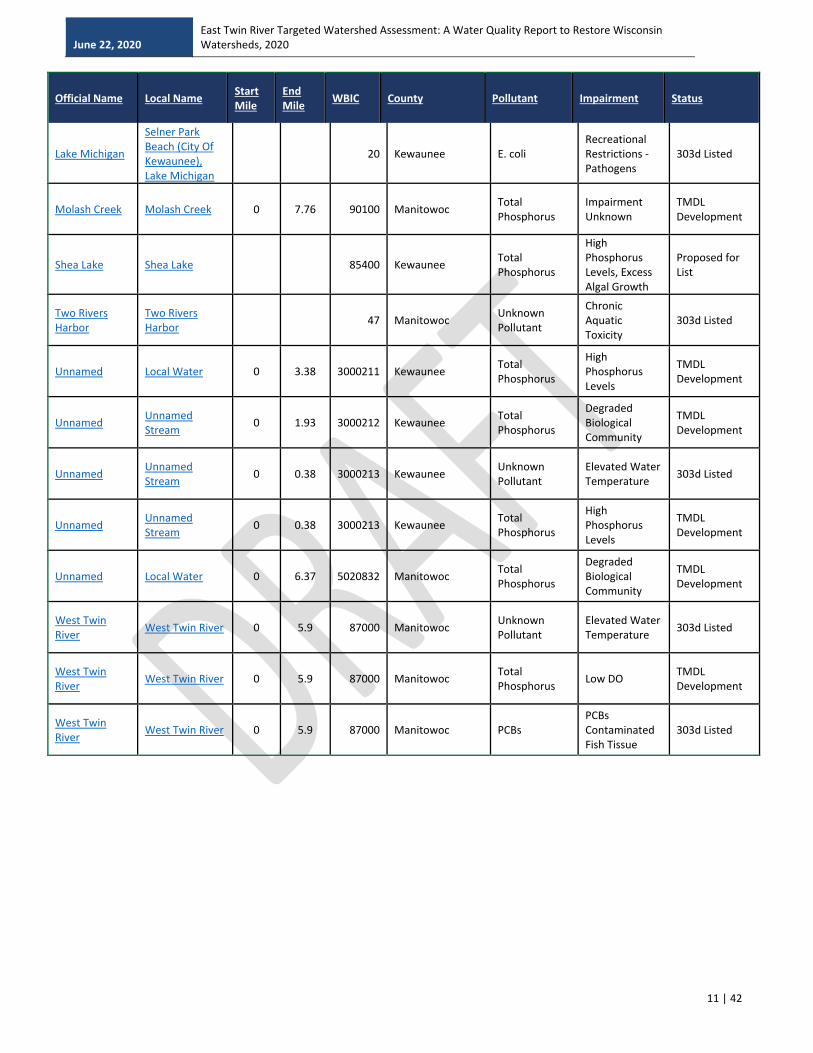
Impaired Waters Section 303(d) of the Clean Water Act requires states to publish a list of waters that do not meet water quality standards. This “Impaired Waters List” reflects waters that are newly added or removed based on new information. Impaired waters in this watershed are impaired for historical discharges and runoff issues (Table 3). The headwaters of the East Twin River down to CTH B are currently on the Clean Water Act Section 303(d) list of impaired waters for phosphorus. The UNTs 3000211, 3000212 and 3000213 in their entirety are on the impaired waters list for phosphorus. UNT 3000213 is on the impaired waters list for water temperature.
Water Name WBIC ORW/ERW Start Mile End Mile
East Twin River 84000 ERW 34.18 40.91
Figure 4. Ecological Landscapes of the East
Twin River Watershed (TK02).
Figure 5. Trout streams East Twin River Watershed

June 22, 2020 East Twin River Targeted Watershed Assessment: A Water Quality Report to Restore Wisconsin Watersheds, 2020
10 | 42
Table 3. Impaired waters in the East Twin River Watershed (TK02).
Official Name Local Name
Start Mile
End Mile
WBIC County Pollutant Impairment Status
East Twin River East Twin River 0 10.49 84000 Manitowoc Total Phosphorus
Impairment Unknown
TMDL Development
East Twin River East Twin River 0 10.49 84000 Manitowoc Mercury Mercury Contaminated Fish Tissue
303d Listed
East Twin River East Twin River 0 10.49 84000 Manitowoc PCBs PCBs Contaminated Fish Tissue
303d Listed
East Twin River East Twin River 10.49 26.4 84000 Kewaunee, Manitowoc
Total Phosphorus
Impairment Unknown
TMDL Development
East Twin River East Twin River 26.4 34.18 84000 Kewaunee Total Phosphorus
Impairment Unknown
TMDL Development
East Twin River East Twin River 34.18 40.91 84000 Kewaunee Total Phosphorus
Degraded Biological Community
TMDL Development
Harpt Lake Harpt Lake 84600 Manitowoc Total Phosphorus
High Phosphorus Levels
TMDL Development
Jambo Creek Jambo Creek 8.1 10.1 84300 Kewaunee Total Phosphorus
Impairment Unknown
TMDL Development
Krok Creek Krok Creek 0 0.68 86700 Kewaunee Total Phosphorus
Degraded Biological Community
TMDL Development
Krok Creek Krok Creek 0.68 3.33 86700 Kewaunee Total Phosphorus
Degraded Biological Community
TMDL Development
Lake Michigan
Point Beach State Park Beach, Lake Michigan
0 1.51 20 Manitowoc E. coli NA Water Delisted
Lake Michigan
Neshota Park Beach, Lake Michigan
0 0.68 20 Manitowoc E. coli NA Water Delisted
Lake Michigan Lake Michigan 0 261.05 20
Door, Kenosha, Kewaunee, Manitowoc, Milwaukee, Ozaukee, Racine, Sheboygan
Mercury Mercury Contaminated Fish Tissue
303d Listed
Lake Michigan Lake Michigan 0 261.05 20
Door, Kenosha, Kewaunee, Manitowoc, Milwaukee, Ozaukee, Racine, Sheboygan
PCBs PCBs Contaminated Fish Tissue
303d Listed
June 22, 2020 East Twin River Targeted Watershed Assessment: A Water Quality Report to Restore Wisconsin Watersheds, 2020
11 | 42
Official Name Local Name
Start Mile
End Mile
WBIC County Pollutant Impairment Status
Lake Michigan
Selner Park Beach (City Of Kewaunee), Lake Michigan
20 Kewaunee E. coli Recreational Restrictions - Pathogens
303d Listed
Molash Creek Molash Creek 0 7.76 90100 Manitowoc Total Phosphorus
Impairment Unknown
TMDL Development
Shea Lake Shea Lake 85400 Kewaunee Total Phosphorus
High Phosphorus Levels, Excess Algal Growth
Proposed for List
Two Rivers Harbor
Two Rivers Harbor
47 Manitowoc Unknown Pollutant
Chronic Aquatic Toxicity
303d Listed
Unnamed Local Water 0 3.38 3000211 Kewaunee Total Phosphorus
High Phosphorus Levels
TMDL Development
Unnamed
Unnamed Stream
0 1.93 3000212 Kewaunee Total Phosphorus
Degraded Biological Community
TMDL Development
Unnamed
Unnamed Stream
0 0.38 3000213 Kewaunee Unknown Pollutant
Elevated Water Temperature
303d Listed
Unnamed
Unnamed Stream
0 0.38 3000213 Kewaunee Total Phosphorus
High Phosphorus Levels
TMDL Development
Unnamed Local Water 0 6.37 5020832 Manitowoc Total Phosphorus
Degraded Biological Community
TMDL Development
West Twin River
West Twin River 0 5.9 87000 Manitowoc Unknown Pollutant
Elevated Water Temperature
303d Listed
West Twin River
West Twin River 0 5.9 87000 Manitowoc Total Phosphorus
Low DO TMDL Development
West Twin River
West Twin River 0 5.9 87000 Manitowoc PCBs PCBs Contaminated Fish Tissue
303d Listed

June 22, 2020 East Twin River Targeted Watershed Assessment: A Water Quality Report to Restore Wisconsin Watersheds, 2020
12 | 42
Monitoring Project Details
Purpose This targeted watershed assessment was designed to sample streams that may be impaired. This assessment provided biological, habitat, and chemistry data for site specific determinations of conditions which was used to compare with previous monitoring conducted in 2011.
Site Selection and Study Design This study involved the collection of fish community, macroinvertebrate, water chemistry, and qualitative habitat data at several sites in the watershed. The upper reaches of the East Twin River, Unnamed Tributaries, and Krok Creek were monitored at 13 locations. Parameters included habitat assessments, aquatic toxicity (WET), continuous water temperature, invertebrates, water chemistry grab samples, and fish surveys. Habitat assessments were conducted at all 13 locations one time in the summer of 2017. Aquatic toxicity samples were collected at 5 locations at the same time the water chemistry samples are collected. Continuous temperature monitors (HOBO's) will be installed at 6 sites for the entire 2017 summer. Macroinvertebrates were collected at 9 locations in fall 2017. Water samples were collected to analyze chloride, total phosphorus, and ammonia from monthly samples, May through October, at 8 sites. Fish surveys were conducted by DNR Fisheries staff.
Monitoring included • Six monthly water chemistry samples during the growing season for total phosphorus, chloride, and ammonia.
• Continuous temperature meters at seven locations during the growing season.
• Quantitative and qualitative habitat assessments.
• Fish surveys at five locations.
• Macroinvertebrate samples at nine locations.
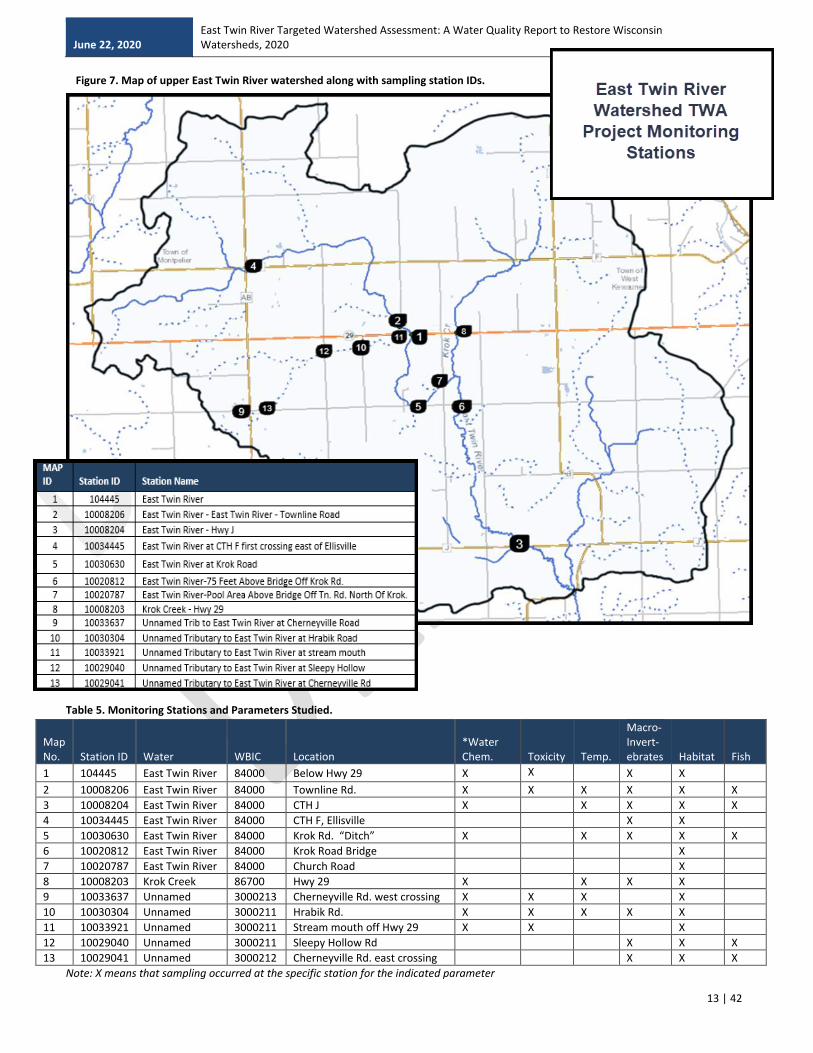
Monitored Streams Studied streams include the East Twin River (WBIC 84000), Unnamed Tributaries (UNT) to the East Twin River (WBIC 3000211, 3000212, and 3000213), Krok Creek (WBIC 86700), and East Twin River at Krok Road “Ditch” (Station ID 10030630). Previous evaluations of conditions of the same streams in the Upper East Twin River watershed’s current report were conducted in 2001, 2008, 2009, 2011/2012, and 2015. Table 4. Monitoring Stations in the East Twin River Targeted Watershed Assessment
Waterbody (WBIC)
MAP
ID Station ID Station Name
East Twin River (84000)
1 104445 East Twin River Below Hwy 29
2 10008206 East Twin River - Townline Road
3 10008204 East Twin River - Hwy J
4 10034445 East Twin River at CTH F first crossing east of Ellisville
5 10030630 East Twin River at Krok Road
6 10020812 East Twin River-75 Feet Above Bridge Off Krok Rd.
7 10020787 East Twin River-Pool Area Above Bridge Off Tn. Rd. North Of Krok.
Krok Creek (96700) 8 10008203 Krok Creek - Hwy 29
Unnamed (3000213) 9 10033637 Un Trib to East Twin River at Cherneyville Road (West Crossing)
Unnamed (3000211)
10 10030304 Un Tributary to East Twin River at Hrabik Road
11 10033921 Un Tributary to East Twin River at stream mouth
12 10029040 Un Tributary to East Twin River at Sleepy Hollow
Unnamed (3000212) 13 10029041 Un Tributary to East Twin River at Cherneyville Rd (East Crossing)
Figure 6. Monitoring sites in the East Twin River watershed (TK02).
June 22, 2020 East Twin River Targeted Watershed Assessment: A Water Quality Report to Restore Wisconsin Watersheds, 2020
13 | 42
Table 5. Monitoring Stations and Parameters Studied.
Map No. Station ID Water WBIC Location
*Water Chem.
Toxicity Temp.
Macro- Invert- ebrates Habitat Fish
1 104445 East Twin River 84000 Below Hwy 29 X X X X
2 10008206 East Twin River 84000 Townline Rd. X X X X X X
3 10008204 East Twin River 84000 CTH J X X X X X
4 10034445 East Twin River 84000 CTH F, Ellisville X X
5 10030630 East Twin River 84000 Krok Rd. “Ditch” X X X X X
6 10020812 East Twin River 84000 Krok Road Bridge X
7 10020787 East Twin River 84000 Church Road X
8 10008203 Krok Creek 86700 Hwy 29 X X X X
9 10033637 Unnamed 3000213 Cherneyville Rd. west crossing X X X X
10 10030304 Unnamed 3000211 Hrabik Rd. X X X X X
11 10033921 Unnamed 3000211 Stream mouth off Hwy 29 X X X
12 10029040 Unnamed 3000211 Sleepy Hollow Rd X X X
13 10029041 Unnamed 3000212 Cherneyville Rd. east crossing X X X
Note: X means that sampling occurred at the specific station for the indicated parameter
Figure 7. Map of upper East Twin River watershed along with sampling station IDs.
June 22, 2020 East Twin River Targeted Watershed Assessment: A Water Quality Report to Restore Wisconsin Watersheds, 2020
14 | 42
Methods, Equipment and Quality Assurance Monitoring was conducted at several locations along the reaches of the East Twin River and the Unnamed Tributaries to the East Twin River (Table 2) following DNR Field Procedures Manuals and guidelines for proper collection and preservation techniques and included the following assessments.
Water Chemistry Sampling Grab samples were collected once per month throughout the growing season (May through October) at four sites in the East Twin River, one site in Krok Creek, one site in the unnamed stream (3000213), and two sites in the unnamed stream (3000211). Water sampling dates were selected in the spring for all sampling events to eliminate bias. Samples were sent to be analyzed for total phosphorus, ammonia, and chloride contents at the Wisconsin State Laboratory of Hygiene. One additional sample was taken from Unnamed Tributary (300212) and sent to be analyzed for chromium at the Wisconsin State Laboratory of Hygiene.
• Guidelines and Procedures for Surface Water Grab Sampling (Dec. 2005 Version 3)
Continuous Temperature Water temperature data loggers (HOBO brand) were placed in East Twin River, Unnamed Tributary to East Twin River (3000213 and 3000211), and Krok Creek from May to October 2017. The loggers recorded temperature every hour.
• Guidelines and Standard Procedures for Continuous Temperature Monitoring Wisconsin DNR May 2004 (Version 1)
Ambient toxicity testing Grab Samples were collected throughout the growing season (May through October) at two locations on the East Twin River and three locations on the Unnamed Tributary. The samples were delivered to the Wisconsin State Laboratory of Hygiene to be tested for acute and chronic toxicity using zooplankton, minnows, and algae.
Macroinvertebrate Evaluation Macroinvertebrate samples were obtained by kick sampling and collecting using a D-frame net at nine monitoring locations along the reaches of the East Twin River and the Unnamed Tributaries to the East Twin River. Samples were preserved and sent to the University of Wisconsin-Stevens Point for analyses. The Hilsenhoff biotic Index (HBI) and Macroinvertebrate Indices of Biotic Integrity (M-IBI) were calculated for each sample collected. HBI is a measure of organic pollution with scores from 0 (excellent) to 10 (very poor). M-IBI uses several metrics to assess overall stream conditions with scores from 10 (excellent) to 0 (poor).
• Guidelines for Collecting Macroinvertebrate Samples in Wadeable Streams
• Wadeable Macroinvertebrate Field Data Report Form 3200-081 (R 08/14)
Habitat Evaluation Aquatic life habitat was evaluated at several sites along the East Twin River and the Unnamed Tributaries to the East Twin River and recorded on the Wadeable Stream Qualitative Fish Habitat form. The host of variables measured included depth and width parameters, bottom characteristics, plant growth, percent shading from vegetation, fish cover, streambank erosion and surrounding land use. A score based on habitat evaluation of 100 (excellent) to 0 (poor) was assigned to each location assessed.
• Guidelines for Qualitative Physical Habitat Evaluation of Wadeable Streams
• Qualitative Habitat Rating less that 10m Form (3600-532A) (R 6/07)
Fish Assemblage The method for fish collection was conducted by electroshocking a section of stream with a minimum station length of 35 times the mean stream width (Lyons, 1992). A backpack shocker with a single probe was used at all five of the locations surveyed. Fish were identified and the number of each species present was tallied. The Index of Biotic Integrity (F-IMI) based on the fish community at each sampling location was calculated. F-IBI scores range from 100 (excellent) to 0 (poor) which relates community structure to community health to water quality. The fisheries assemblage was collected with the following methods:
• Wadeable Stream Fish Community Evaluation Form 3600-230 (R 7/00)
• Guidelines for Assessing Fish Communities of Wadeable Streams in Wisconsin
June 22, 2020 East Twin River Targeted Watershed Assessment: A Water Quality Report to Restore Wisconsin Watersheds, 2020
15 | 42
Project Results
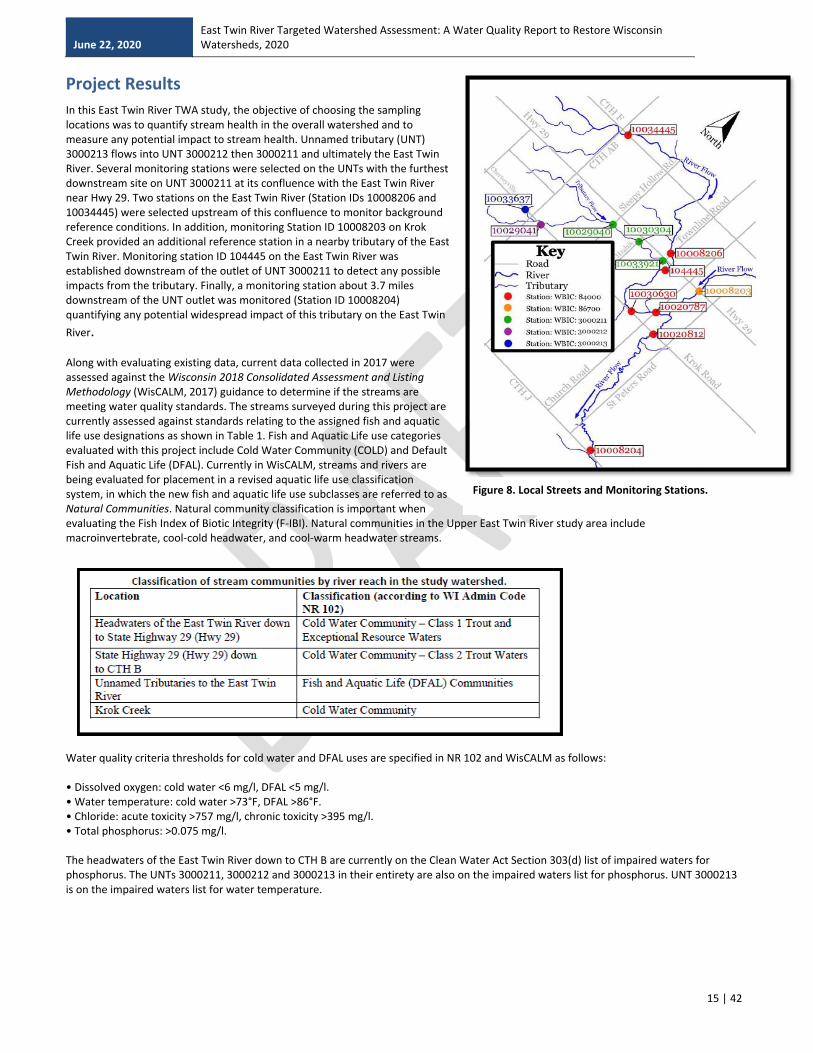
In this East Twin River TWA study, the objective of choosing the sampling locations was to quantify stream health in the overall watershed and to measure any potential impact to stream health. Unnamed tributary (UNT) 3000213 flows into UNT 3000212 then 3000211 and ultimately the East Twin River. Several monitoring stations were selected on the UNTs with the furthest downstream site on UNT 3000211 at its confluence with the East Twin River near Hwy 29. Two stations on the East Twin River (Station IDs 10008206 and 10034445) were selected upstream of this confluence to monitor background reference conditions. In addition, monitoring Station ID 10008203 on Krok Creek provided an additional reference station in a nearby tributary of the East Twin River. Monitoring station ID 104445 on the East Twin River was established downstream of the outlet of UNT 3000211 to detect any possible impacts from the tributary. Finally, a monitoring station about 3.7 miles downstream of the UNT outlet was monitored (Station ID 10008204) quantifying any potential widespread impact of this tributary on the East Twin
River. Along with evaluating existing data, current data collected in 2017 were assessed against the Wisconsin 2018 Consolidated Assessment and Listing Methodology (WisCALM, 2017) guidance to determine if the streams are meeting water quality standards. The streams surveyed during this project are currently assessed against standards relating to the assigned fish and aquatic life use designations as shown in Table 1. Fish and Aquatic Life use categories evaluated with this project include Cold Water Community (COLD) and Default Fish and Aquatic Life (DFAL). Currently in WisCALM, streams and rivers are being evaluated for placement in a revised aquatic life use classification system, in which the new fish and aquatic life use subclasses are referred to as Natural Communities. Natural community classification is important when evaluating the Fish Index of Biotic Integrity (F-IBI). Natural communities in the Upper East Twin River study area include macroinvertebrate, cool-cold headwater, and cool-warm headwater streams.
Water quality criteria thresholds for cold water and DFAL uses are specified in NR 102 and WisCALM as follows: • Dissolved oxygen: cold water <6 mg/l, DFAL <5 mg/l. • Water temperature: cold water >73°F, DFAL >86°F. • Chloride: acute toxicity >757 mg/l, chronic toxicity >395 mg/l. • Total phosphorus: >0.075 mg/l. The headwaters of the East Twin River down to CTH B are currently on the Clean Water Act Section 303(d) list of impaired waters for phosphorus. The UNTs 3000211, 3000212 and 3000213 in their entirety are also on the impaired waters list for phosphorus. UNT 3000213 is on the impaired waters list for water temperature.
Figure 8. Local Streets and Monitoring Stations.
June 22, 2020 East Twin River Targeted Watershed Assessment: A Water Quality Report to Restore Wisconsin Watersheds, 2020
16 | 42
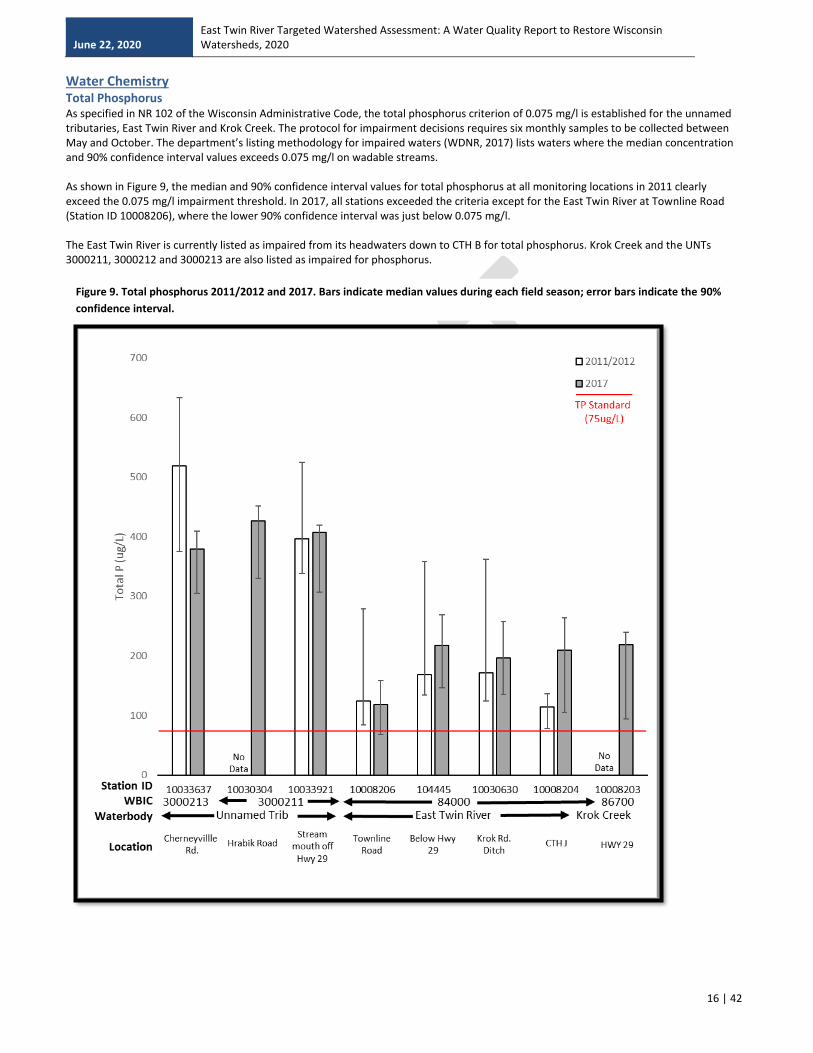
Water Chemistry Total Phosphorus As specified in NR 102 of the Wisconsin Administrative Code, the total phosphorus criterion of 0.075 mg/l is established for the unnamed tributaries, East Twin River and Krok Creek. The protocol for impairment decisions requires six monthly samples to be collected between May and October. The department’s listing methodology for impaired waters (WDNR, 2017) lists waters where the median concentration and 90% confidence interval values exceeds 0.075 mg/l on wadable streams. As shown in Figure 9, the median and 90% confidence interval values for total phosphorus at all monitoring locations in 2011 clearly exceed the 0.075 mg/l impairment threshold. In 2017, all stations exceeded the criteria except for the East Twin River at Townline Road (Station ID 10008206), where the lower 90% confidence interval was just below 0.075 mg/l. The East Twin River is currently listed as impaired from its headwaters down to CTH B for total phosphorus. Krok Creek and the UNTs 3000211, 3000212 and 3000213 are also listed as impaired for phosphorus.
Figure 9. Total phosphorus 2011/2012 and 2017. Bars indicate median values during each field season; error bars indicate the 90%
confidence interval.
June 22, 2020 East Twin River Targeted Watershed Assessment: A Water Quality Report to Restore Wisconsin Watersheds, 2020
17 | 42
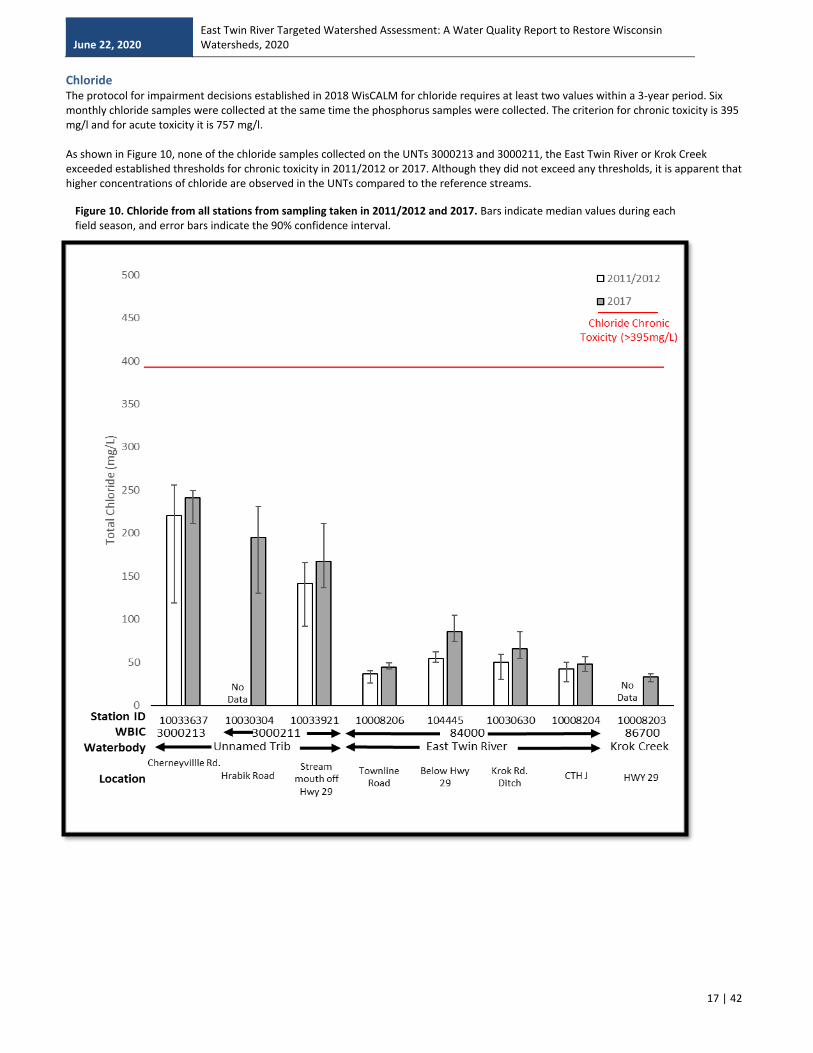
Chloride The protocol for impairment decisions established in 2018 WisCALM for chloride requires at least two values within a 3-year period. Six monthly chloride samples were collected at the same time the phosphorus samples were collected. The criterion for chronic toxicity is 395 mg/l and for acute toxicity it is 757 mg/l. As shown in Figure 10, none of the chloride samples collected on the UNTs 3000213 and 3000211, the East Twin River or Krok Creek exceeded established thresholds for chronic toxicity in 2011/2012 or 2017. Although they did not exceed any thresholds, it is apparent that higher concentrations of chloride are observed in the UNTs compared to the reference streams.
Figure 10. Chloride from all stations from sampling taken in 2011/2012 and 2017. Bars indicate median values during each field season, and error bars indicate the 90% confidence interval.

June 22, 2020 East Twin River Targeted Watershed Assessment: A Water Quality Report to Restore Wisconsin Watersheds, 2020
18 | 42
Ammonia Figure 11 displays total ammonia results from 2017. Six monthly samples were collected at the same locations and times as the other water samples. Ammonia was not collected in 2011 and 2012. The data suggest none of the ammonia sample results were high enough to cause ammonia toxicity to aquatic life according to the methods of the Environmental Protection Agency (2013) and Wisconsin Administrative Code NR105.
Chromium Six monthly water samples were collected at one location on UNT 3000213 (Station ID 10033637). Three sampling events did not detect chromium but the other three samples document levels slightly above the detection limit of 1.0 ug/l (1.48, 1.32, and 1.7 ug/l). As specified in Wisconsin Administrative Code NR 105, the chronic criterion for chromium is 326 ug/l. Thus, the low levels detected would not be considered toxic to aquatic life.
Continuous Water Temperature Water temperatures were logged hourly at three stations on the East Twin River and one each on UNTs 3000211 and 3000213 in 2011. The same stations plus the addition of one on Krok Creek were monitored in 2017. Average daily temperature throughout each field season by Station ID are summarized in Figure 13 for 2011 data and in Figure 12 for 2017 data.
Figure 11. Total ammonia from all stations in 2017. Bars indicate median values during field season, and error bars indicate the 90% confidence interval.
June 22, 2020 East Twin River Targeted Watershed Assessment: A Water Quality Report to Restore Wisconsin Watersheds, 2020
19 | 42
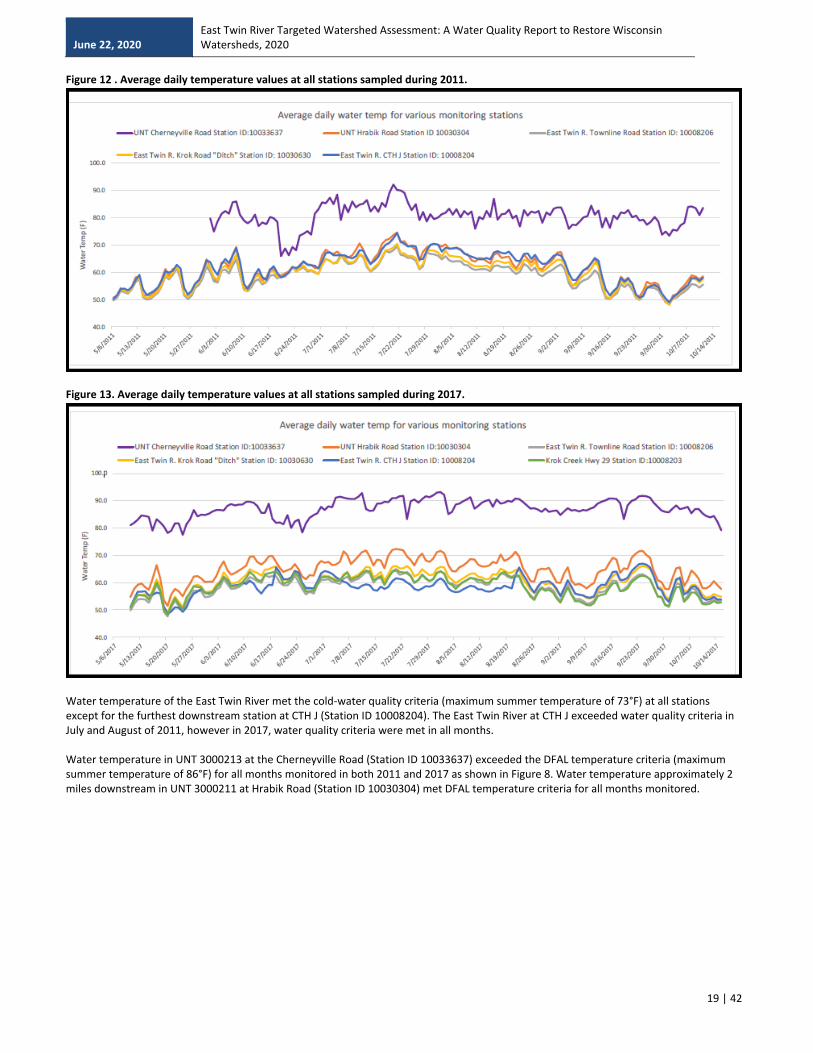
Figure 12 . Average daily temperature values at all stations sampled during 2011.
Figure 13. Average daily temperature values at all stations sampled during 2017.
Water temperature of the East Twin River met the cold-water quality criteria (maximum summer temperature of 73°F) at all stations except for the furthest downstream station at CTH J (Station ID 10008204). The East Twin River at CTH J exceeded water quality criteria in July and August of 2011, however in 2017, water quality criteria were met in all months. Water temperature in UNT 3000213 at the Cherneyville Road (Station ID 10033637) exceeded the DFAL temperature criteria (maximum summer temperature of 86°F) for all months monitored in both 2011 and 2017 as shown in Figure 8. Water temperature approximately 2 miles downstream in UNT 3000211 at Hrabik Road (Station ID 10030304) met DFAL temperature criteria for all months monitored.

June 22, 2020 East Twin River Targeted Watershed Assessment: A Water Quality Report to Restore Wisconsin Watersheds, 2020
20 | 42
Figure 14: Percentage of exceedance values of the Wisconsin Admin. Code for acute temperature criteria for UNT at Cherneyville Road (Station ID 10033637). All values were greater than 10% of daily maximum values, indicating an exceedance of acute criteria for every month of the record.
Water temperatures were warmer at UNT 3000213 and 3000211 in 2017 than 2011 (Figure 9). Otherwise, temperatures collected in 2017 at all other sites were similar to temperatures in 2011. Figure 15. Average of all average daily temperature values for each field station monitored in 2011 and 2017 between June 1 and October 15th of each calendar year. Error bars indicate standard deviation of all averaged daily values.

June 22, 2020 East Twin River Targeted Watershed Assessment: A Water Quality Report to Restore Wisconsin Watersheds, 2020
21 | 42
Ambient Toxicity Testing Fathead Minnow (Pimephales promelas) Toxicity: Acute Toxicity:
• 2011: No acute toxicity observed at any sampling sites.
• 2017: No acute toxicity observed at any sampling sites.
Chronic Toxicity:
• 2011: Chronic toxicity was found in UNT 3000213 Cherneyville Road (Station ID
10033637) in May and June of that year.
• 2017: No chronic toxicity as indicated by statistical differences between fish growth in
surface water samples and controls, was found at any of the sites.
o However, on two occasions survival and growth was noticeably lower in the surface water than in control treatments
in the chronic fathead minnow toxicity test.
o In June, survival in the sample collected in the UNT 3000213 (Station ID 10033637) was 15% lower than the control. In
September, survival at the same site was 21% lower than the control. Growth was also lower than at any of the other
sites on both of these dates, although these differences were not found to be statistically significant.
Water Flea (Ceriodaphnia dubia) Toxicity: Acute Toxicity:
• 2011: Acute toxicity was observed in May at UNT 3000213, Cherneyville Road (Station
ID 10033637).
• 2017: No acute toxicity observed at any sampling sites.
Chronic Toxicity:
• 2011: Chronic toxicity was found in UNT 3000213, Cherneyville Road (Station ID
10033637) and in UNT 3000211, Hrabik Road (Station ID 10030304) in May. Chronic
toxicity was also found in UNT 3000211 at the stream mouth (Station ID 1033921), and
in the East Twin River below this confluence (Station ID 104445), and at the Townline
Road site (Station ID 10008206) in July.
• 2017: Chronic toxicity was found in two samples collected during the field season.
Reproduction was found to be significantly lower in June at the East Twin River below
the confluence of UNT 3000211 (Station ID 104445) and at the UNT 3000213 (Station
ID 10033637) in October. The October sample showed both significantly lower reproduction and lowered survival (20% lower
than the control).
Green Algae (Selenastrum capricornutum) Toxicity: Chronic Toxicity: Tables associated with toxicity measurements can be found in Appendix B.
• 2011: Chronic toxicity was found at UNT 3000213 (Station ID 10033637) and at
the UNT 3000211 at Hrabik Road (Station ID 10030304) in June. Chronic
toxicity was also found at the East Twin River below UNT 3000211 at Station ID
104445 in July, however, the reduction in growth of this sample was below the
level of concern normally used for algae tests (50% of the control).
• 2017: UNT 3000213 (Station ID 10033637) showed noticeably lower green
algae growth in the July and August samples, although only the July sample
was found to be statistically different from the control.
Ceriodaphnia dubia (http://www.amaab.org/)
Selenastrum capricornutum UTEX Culture Collection
Fathead Minnow https://www.situbiosciences.com
June 22, 2020 East Twin River Targeted Watershed Assessment: A Water Quality Report to Restore Wisconsin Watersheds, 2020
22 | 42
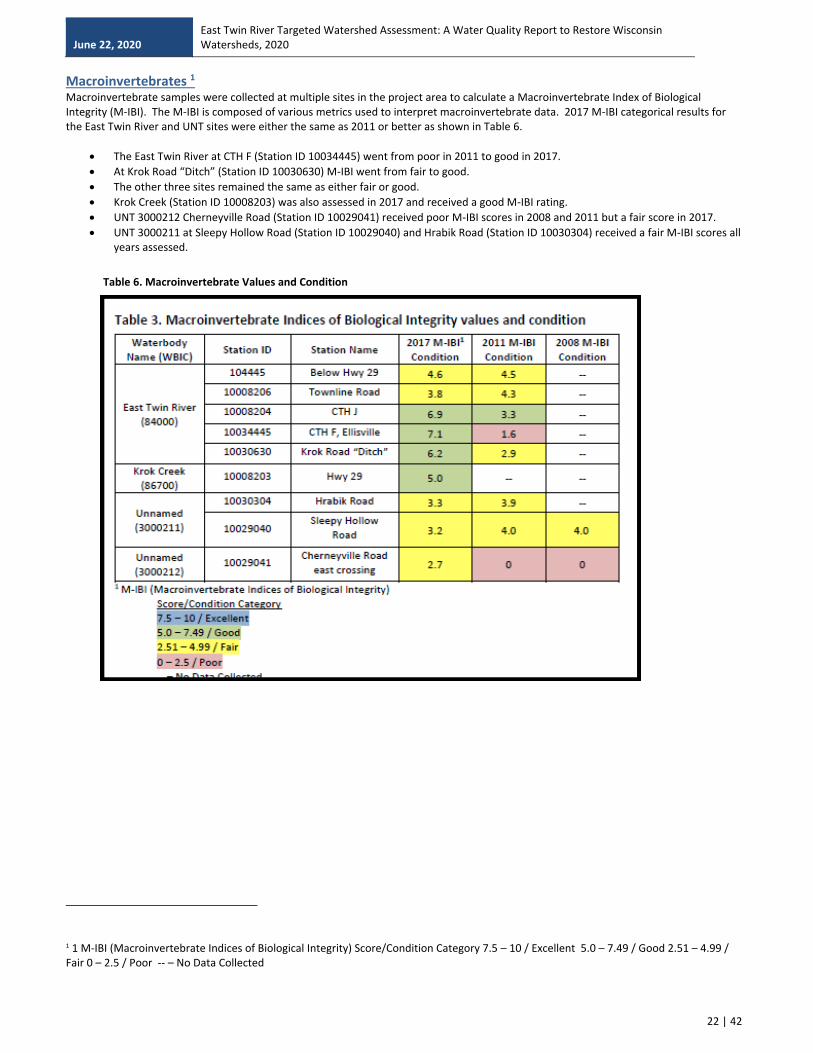
Macroinvertebrates 1 Macroinvertebrate samples were collected at multiple sites in the project area to calculate a Macroinvertebrate Index of Biological Integrity (M-IBI). The M-IBI is composed of various metrics used to interpret macroinvertebrate data. 2017 M-IBI categorical results for the East Twin River and UNT sites were either the same as 2011 or better as shown in Table 6.
• The East Twin River at CTH F (Station ID 10034445) went from poor in 2011 to good in 2017.
• At Krok Road “Ditch” (Station ID 10030630) M-IBI went from fair to good.
• The other three sites remained the same as either fair or good.
• Krok Creek (Station ID 10008203) was also assessed in 2017 and received a good M-IBI rating.
• UNT 3000212 Cherneyville Road (Station ID 10029041) received poor M-IBI scores in 2008 and 2011 but a fair score in 2017.
• UNT 3000211 at Sleepy Hollow Road (Station ID 10029040) and Hrabik Road (Station ID 10030304) received a fair M-IBI scores all years assessed.
1 1 M-IBI (Macroinvertebrate Indices of Biological Integrity) Score/Condition Category 7.5 – 10 / Excellent 5.0 – 7.49 / Good 2.51 – 4.99 / Fair 0 – 2.5 / Poor -- – No Data Collected
Table 6. Macroinvertebrate Values and Condition
June 22, 2020 East Twin River Targeted Watershed Assessment: A Water Quality Report to Restore Wisconsin Watersheds, 2020
23 | 42
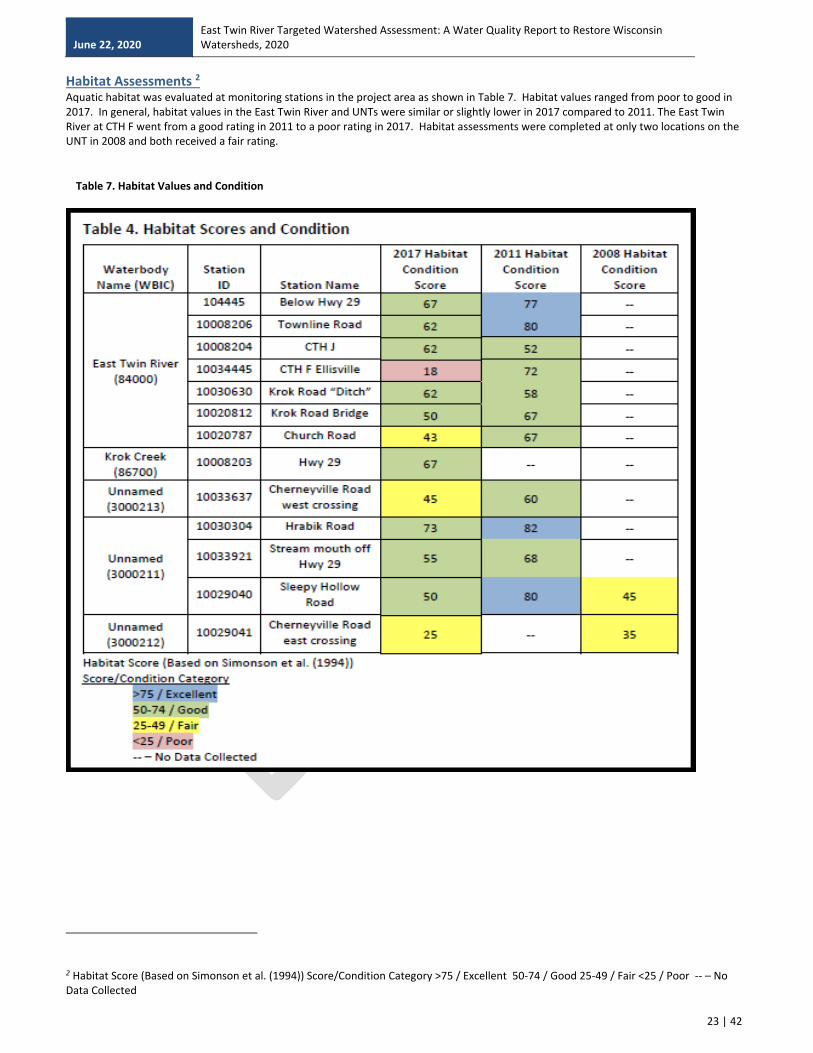
Habitat Assessments 2 Aquatic habitat was evaluated at monitoring stations in the project area as shown in Table 7. Habitat values ranged from poor to good in 2017. In general, habitat values in the East Twin River and UNTs were similar or slightly lower in 2017 compared to 2011. The East Twin River at CTH F went from a good rating in 2011 to a poor rating in 2017. Habitat assessments were completed at only two locations on the UNT in 2008 and both received a fair rating.
2 Habitat Score (Based on Simonson et al. (1994)) Score/Condition Category >75 / Excellent 50-74 / Good 25-49 / Fair <25 / Poor -- – No Data Collected
Table 7. Habitat Values and Condition

June 22, 2020 East Twin River Targeted Watershed Assessment: A Water Quality Report to Restore Wisconsin Watersheds, 2020
24 | 42
Fish Natural Communities • Based on fish survey data available, the modeled and verified natural community (Table 8) of the East Twin River was a cool-cold
headwater at both Townline Road (Station ID 10008206) and Krok Road “Ditch” (Station ID 10030630). The modeled natural community at CTH J (Station ID 10008204) was warm headwater but verified as a cool-warm headwater based on the fish assemblage. The modeled natural community at Krok Road bridge (Station ID 10020812) was cool-warm headwater but verified as cool-cold headwater.
• UNT 3000212 at Cherneyville Road (Station ID 10029041) was modeled as a macroinvertebrate stream but due to lack of fish no verification was completed.
• UNT 3000211 at Sleepy Hollow Road (Station ID 10029040) was modeled as a cool-cold headwater but was verified as a cool-warm headwater based on the fish community.
Table 8. Fish and Habitat Data
Station ID Station Name Modeled Natural Community
Confirmed Natural Community
FIBI Used
FIBI Value Condition
Habitat Values
10008206 East Twin R - Townline Road CCHW CCHW SS IBI 80 62
10008204 East Twin R - Hwy J WH CWHW SS IBI 100 62
10030630 East Twin R - Krok Road CCHW CCHW SS IBI 100 67
10020812 East Twin R - 75 Ft US Bridge Krok Rd. CWHW CCHW W SS IBI -- 50
10033637 UNT to East Twin - Cherneyville Rd Macroinvert N/A SS IBI -- 45
10029040 UNT to East Twin R - Sleepy hollow CCHW CWHW SS IBI 80 50
Photo: East Twin River at Townline Road (SWIMS Station 10008206)

June 22, 2020 East Twin River Targeted Watershed Assessment: A Water Quality Report to Restore Wisconsin Watersheds, 2020
25 | 42
Fisheries Assemblage 3 Fish surveys were completed at multiple sites in the project area (Table 5). The Fish Index of Biological Integrity (F-IBI) was calculated and the scores over multiple years are presented in Table. In 2017, fish surveys were completed at three locations on the East Twin River and two on the UNTs 3000211 and 3000212. Table 9. Fish Inventory of the East Twin and Unnamed Tributaries
Previous fisheries and habitat reports are available on the WDNR website: http://dnr.wi.gov/topic/Fishing/reports/index.html
Fish Condition Fish Index of biological integrity (F-IBI) scores indicate the East Twin River at Townline Road (Station ID 10008206) was in good condition (in 2017). In previous years, fish IBI scores were fair to excellent. In 2017 F-IBI score in the East Twin River at Krok Road “Ditch” (Station ID 10030630) was excellent and had also received excellent to fair scores in previous surveys. A fish survey conducted in the East Twin River at Krok Road bridge (Station ID 10020812) received a good rating in 2015. F-IBI scores were excellent all years surveyed at CTH J (Station ID 10008204). F-IBI scores rated the UNT 3000211 at Sleepy Hollow Road (Station ID 10029040) as good in 2017 and excellent in 2008. Surveys in 2008 and 2017 did not result in enough fish captured at Cherneyville Road east crossing (Station ID 10029041) to calculate an F-IBI score.
3 1 F-IBI (Fish Indices of Biological Integrity) Score/Condition Category 91 -100 / Excellent 61 - 90 / Good 31 - 60 / Fair 0 - 30 / Poor -- – No Data Collected NA – Not enough fish to calculate IBI
June 22, 2020 East Twin River Targeted Watershed Assessment: A Water Quality Report to Restore Wisconsin Watersheds, 2020
26 | 42
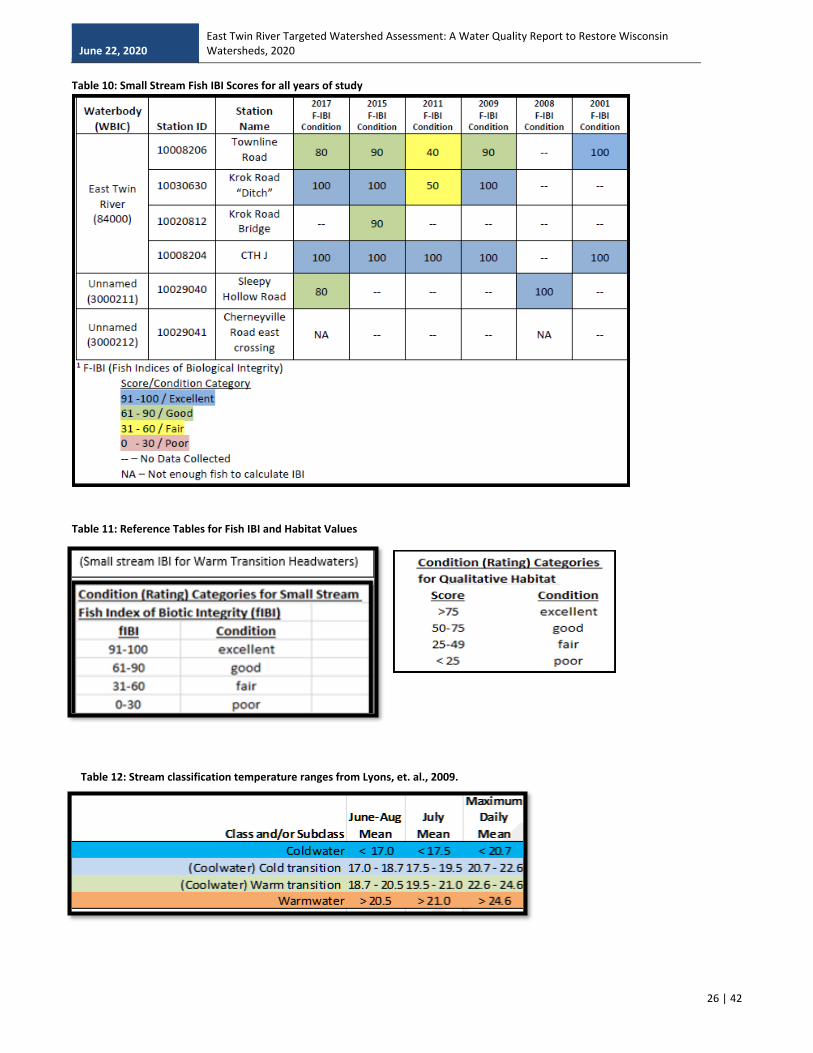
Table 10: Small Stream Fish IBI Scores for all years of study
Table 11: Reference Tables for Fish IBI and Habitat Values
Table 12: Stream classification temperature ranges from Lyons, et. al., 2009.
June 22, 2020 East Twin River Targeted Watershed Assessment: A Water Quality Report to Restore Wisconsin Watersheds, 2020
27 | 42
Discussion
This study assessed the condition of the East Twin River, its unnamed tributaries and Krok Creek for ecological status. Overall stream health was determined by evaluating chemical, physical and biological parameters against Wisconsin Assessment and Listing Methodology Guidelines. Assessment data from 2017 were compared to prior survey data to determine if water quality conditions have changed and if streams are meeting water quality standards.
Impairment Status Sampling data confirm that the East Twin River, Krok Creek and the unnamed tributaries 3000212, 3000213 and
3000211 in their entirety are on the impaired waters list for phosphorus. Chloride, ammonia and chromium concentrations all met water quality standards. Based off the data collected, these
water quality constituents do not pose a threat to aquatic life in the streams assessed. Despite non-point source influences throughout the entire watershed, the phosphorus and chloride concentrations
were the highest in UNT 3000213.
Water Temperature Water temperature of the East Twin River at all stations except at CTH J met cold water quality criteria. East Twin River at CTH J (Station ID 10008204) exceeded water quality criteria in July and August of 2011, however in 2017, the water quality criteria were met in all months. During July and August of 2011 when cold water criteria for temperature was not met, the daily maximum temperature was exceeded 12 and 8 days respectively by 0.7-3.3°C. Taking into consideration the accuracy of +/- 0.53°C of the continuous data collection meters, it can only be assumed that 9 and 2 days respectively did not meet the cold criteria for temperature. This leaves only the month of July in 2011 that did not fully meet cold water criteria for temperature on the East Twin River at CTH J. This single month of failing to meet cold water criteria could be sufficient to propose this segment of the East Twin River to be listed as impaired for temperature. However, this is not recommended. Based on knowledge of this stream and its location at the lower reaches of the East Twin River Class II trout waters, it is likely this segment is naturally on the transition between a cold and warm classification. Water monitoring data confirm that UNT 3000213 clearly exceed water quality standards for temperature and should remain on the impaired waters list. Temperatures at Cherneyville Road (Station ID 10033637) exceeded the DFAL temperature criteria for all months monitored in both 2011 and 2017. Water temperature approximately 2 miles downstream in UNT 3000211 at Hrabik Road (Station ID 10030304) met DFAL temperature criteria for all months monitored. Ambient acute toxicity was not observed in 2017 at any station monitored although chronic toxicity was observed in the UNT 3000213 (Station ID 10033637) in July and October and in the East Twin River below Hwy 29 (Station ID 104445) in June. In comparison, acute toxicity was observed in 2011 in UNT 3000213 (Station ID 10033637) in May. Chronic toxicity was observed in UNT 3000213 in May and June and in the UNT 3000211, Hrabik Road (Station ID 10030304) in May. However, chronic toxicity was also observed in the East Twin River at Townline Road (Station ID 10008206), below Hwy 29 (Station ID 104445), and at the mouth of the UNT 3000211 (Station ID 10033921) in July indicating possible larger-scale watershed problems. The macroinvertebrate communities indicate that water quality conditions in the East Twin River is in fair to good condition both upstream and downstream from the confluence of UNT 3000211. The macroinvertebrate communities indicate fair to poor water quality condition in the upper reaches of UNT 3000212 at Cherneyville Road (Station ID 10029041) and fair conditions at two sites on UNT 3000211 at Sleepy Hollow Road (Station ID 10029040) and Hrabik Road (Station ID 10030304). Substrate type and watershed-wide non-point sources of nutrient and sediment contributions likely impact the water quality and macroinvertebrate habitat in both the East Twin River and the UNTs. Blue Iris Environmental, Inc. conducted a cursory evaluation of the stream inhabitants of the East Twin River at three locations on July 1, 2009 (West, 2009). The full survey report is provided in Appendix C. Although a variety of taxa were noted at each of the three locations and ranged from abundant to present, the survey technique used was not meant to create a M-IBI value and therefore it is not possible to rate the overall stream health based on the 2009 results. The taxa Plecoptera (Stonefly) was observed in this survey and in 2017 by the WDNR at the Krok Road site while Ephemeroptera (mayfly) were only observed in 2009 at that site. Stoneflies are considered intolerant to pollution.
June 22, 2020 East Twin River Targeted Watershed Assessment: A Water Quality Report to Restore Wisconsin Watersheds, 2020
28 | 42
Fish and aquatic life habitat was assessed at multiple locations in the watershed. Qualitative habitat is rated based on riparian buffer width, amount of bank erosion, percent of pools, riffle and runs, substrate type and cover for adult fish. These metrics combined give an overall score for available habitat. In general, habitat in the East Twin River can be considered in good condition. At Church Road (Station ID 10020787) the extensive amount of fine sediment and lack of riffles limit a variety of habitat and therefore it only received a fair score. East Twin River at CTH F (Station ID 10008204) received a poor score since the stream is extremely small and shallow at this location. A previous good score in 2011 showed deeper water and less fine sediment accumulation. The fish indices of biological integrity (F-IBI) and the macroinvertebrate indices of biological integrity (M-IBI) were used to determine whether current water quality conditions support the Fish and Aquatic Life designated uses. Natural communities are defined for streams and rivers using model-predicted flow and temperature ranges associated with specific fish and/or macroinvertebrate communities. Segments are initially classified into natural communities based on landscape-scale statistical models that predict long-term flows and temperatures from watershed characteristics such as watershed size, surficial and bedrock geology, topography, climate, and land cover. These predictions represent the realistic potential Natural Community of the segment under current land-cover and climate conditions in the absence of significant site-specific human impacts, such as local riparian degradation. Correct natural community classification is currently a critical step in applying the correct F-IBI to evaluate water quality influences on the fish community and to provide an accurate bio-assessment. Misclassified streams could be assessed with the incorrect IBI, and their environmental condition may be misjudged. The Department has a guidance document that can correct misclassifications (Lyons, 2013). The procedures were followed to correctly assign a natural community at all fish surveys stations so the correct application of the IBI was used. The East Twin River from its headwaters downstream towards CTH J aligns with a cool cold headwater stream classification in that it is a small perennial stream with cool to cold summer water temperatures. Coldwater fish range from absent to abundant, transitional fish from common to dominant, and warmwater fish from absent to common. Small-stream fish range from very common to dominant (50-100% of individuals), medium-stream fish from absent to very common (0-50% of individuals), and large-river fish from absent to uncommon (0-10% of individuals). As the East Twin River approaches CTH J the stream begins a transition from a cool-cold headwater towards a cool-warm headwater stream with cool to warm summer temperatures. Coldwater fish range from absent to common, transitional fish from common to dominant, and warmwater fish from absent to abundant. Small-stream fish range from very common to dominant, medium-stream fish from absent to very common, and large-river fish from absent to uncommon. The natural community verification of the East Twin River at CTH J can place the stream in either a cool-cold headwater or a cool-warm headwater stream based on the percentage of coldwater and warmwater fish species observed. The percentage catch of coldwater species is outside the range for a cool-warm headwater stream and the percentage catch of warmwater species is outside the range of a cold-cold headwater stream. Based upon available fish data, classification as a Class II trout stream, and continuous water temperature data the East Twin River at CTH J is best represented and is verified as a cool-warm headwater stream. UNT 3000211 at Sleepy Hollow Road (Station ID 10029040) has a verified natural community classification as a cool-warm headwater stream. The modeled natural community classification as a cool-cold headwater stream is likely inaccurate based on fish surveys conducted in 2008 and 2017. The fish community in this stream aligns with a cool-warm headwater stream. In any given year, the number of coldwater species may range from absent to common in these headwater streams. They are differentiated by the percent of the overall catch consisting of coldwater, transitional, and warmwater species. In 2008, four mottled sculpin, a cold-water intolerant species, were observed and made up 2% of the total catch. In 2017, mottled sculpin were absent. The remainder of the catch in both years was almost entirely transitional species which are common to abundant in both cool-warm and cool-cold headwater streams. It is also important to note that a high percentage of species captured in both years were tolerant of environmental degradation and outside the expected range for either stream community. This is a significant indicator when there is an absence of intolerant species observed in surveys. However, in both years, intolerant species were observed (mottled sculpin or redside dace). The capture of the species in this survey allows a new natural community classification to be assigned and indicates human-caused impacts are likely not a significant factor in the overall fish community structure. UNT 3000212 at Cherneyville Road (Station ID 10029041) was classified as a macroinvertebrate stream which is consistent with surveys conducted in 2008 and 2017 in that it had a low abundance of fish. These macroinvertebrate streams are very small, almost always intermittent streams with a wide range of summer temperatures. No or few fish (< 25 per 100 m of wetted length) are present, but a variety of aquatic invertebrates may be common, at least seasonally. M-IBI in 2017 supported this by receiving a fair rating at this
June 22, 2020 East Twin River Targeted Watershed Assessment: A Water Quality Report to Restore Wisconsin Watersheds, 2020
29 | 42
location. The low abundance of fish surveyed on this site does not indicate an aquatic life impairment, only that this stream is not conducive to supporting a fish community throughout the year and that a macroinvertebrate stream classification system is justified. The overall fish community in the Upper East Twin River watershed is in good to excellent condition. Two key metrics that provide insight into the index include number of intolerant species and number of tolerant species. Up to four species intolerant of environmental degradation have been captured in surveys throughout the years surveyed with no decline in abundance or elimination from sites. The intolerant species observed include brook trout, mottled sculpin, reside dace, and brook lamprey. Of these, both the brook trout and mottled sculpin are considered coldwater species. It is also important to note that throughout all survey stations and years, a degraded tolerant fish community was not observed indicating human based influence of degradation did not significantly alter the fish community assemblage. In 2006, a significant fish kill of multiple species occurred from a wastewater treatment plant failure at the current location of Agropur, Inc. (Trega Foods) facility. This kill was documented in the East Twin River from the confluence of UNT 3000211 downstream to the confluence of Krok Creek. No pre-fish kill data exists for this stretch of the East Twin River but 84 dead brook trout ranging in size from 4-14” were collected representing 3+ year classes of brook trout. This generally represents a catch per effort mile of 41.4 through this stretch of river. Post fish-kill surveys were conducted at Krok Road “Ditch” (Station ID 10030630) and zero brook trout were captured 2009 and 2011. In 2015, one 8.2” brook trout was captured representing one year class. In 2017, three brook trout ranging in size between 2.5-7.9” were captured representing two year classes. The catch per effort mile for these surveys were 15.3 and 48.3 respectively. The current brook trout size structure and year class distribution may indicate that the population has not fully recovered, however it does appear based on population density that the brook trout population is on a track for recovery. Furthermore, based on the F-IBI ratings of good to excellent, it appears the overall fish community has recovered from the fish kill of 2006. Note that the additional surveys above and beyond the normal DNR fish survey schedule was conducted to assess brook trout population recovery from this incident. Conclusions and Recommendations This study assessed the condition of three UNTs, the East Twin River and Krok Creek for ecological impairment. Assessment data from 2017 were compared to prior surveys to determine if water quality conditions have changed and if streams are meeting water quality standards.
Recommendations
All stream locations assessed exceed water quality criteria for phosphorus and should remain on the 303(d) impaired
waters list. Chloride, ammonia, and chromium levels in the streams are below impaired thresholds. Water temperature in UNT 3000213 exceed water quality standards and should remain on the impaired waters list. Ambient chronic toxicity was observed in UNT 3000213 on two occasions in 2017 (July and October). Chronic toxicity
was observed on the East Twin River below the confluence with the UNT 3000211 (Station ID 104445) in June but is likely unrelated to UNT 3000213 since no toxicity was found in UNT 3000211 in June.
Macroinvertebrate monitoring confirmed fair to good water quality conditions in the East Twin River and UNTs with a slight improvement over the 2011 assessment.
Qualitative habitat assessments found mostly good to fair fish and aquatic life habitat available in Krok Creek, the East Twin River and all three UNTs.
Watershed-wide non-point sources of nutrient and sediment contributions likely impact the water quality and aquatic life habitat in Krok Creek, the East Twin River and all three UNTs and should be controlled to the extent possible.
The overall fish community in the Upper East Twin River watershed is in good to excellent condition. The natural community of the East Twin River at CTH J (Station ID 10008204) should be updated to reflect the current
fish community structure of cool-warm headwater. The natural community of the East Twin River at Krok Road bridge (Station ID 10020812) should be updated to reflect
the current fish community structure of cool-cold headwater. The natural community of the UNT 3000211 at Sleepy Hollow Road (Station ID 10029040) should be updated to
reflect the current fish community structure of cool-warm headwater.

June 22, 2020 East Twin River Targeted Watershed Assessment: A Water Quality Report to Restore Wisconsin Watersheds, 2020
30 | 42
East Twin River, Photo by Mary Gansberg, WDNR.

June 22, 2020 East Twin River Targeted Watershed Assessment: A Water Quality Report to Restore Wisconsin Watersheds, 2020
P a g e 31 | 42
Appendix A. Whole Effluent Toxicity (WET) Testing methods
Ambient Acute Ceriodaphnia dubia Toxicity Test This method is used for measuring the short-term, static-renewal acute toxicity of water samples to the freshwater cladoceran Ceriodaphnia dubia. During this test, C. dubia that are less than 24 hours old are continuously exposed for 48 hours to 100% samples of East Twin River water as well as a laboratory water control. The lab water control is either moderately hard water (MHW) or dechlorinated Madison tap water depending on which water the C. dubia were cultured in. There are 4 replicates set per treatment and each replicate has five C. dubia. Therefore, each acute treatment has 20 C. dubia exposed in the acute test. The test solutions are renewed after 24 hours. There is no food provided to the C. dubia after setting the acute test. Light is provided 16 hours a day and the test is conducted at 20°C. A 2.5% CO2 treatment is used to control pH drift during the test. Survival is recorded daily. The percent survival per replicate is used to determine statistical difference (p ≥ 0.05 is not significant) between the treatments (river samples and the control) using SAS®. This method is based on EPA Test Method 2002 and the State of Wisconsin Aquatic Life Toxicity Testing Methods Manual, Ed. 2.
Ambient Chronic Ceriodaphnia dubia Toxicity Test This method is used for measuring the short-term, static-renewal chronic toxicity of water samples to the freshwater cladoceran Ceriodaphnia dubia. During this test, C. dubia that are less than 24 hours old are continuously exposed for seven days to 100% samples of East Twin River water as well as a laboratory water control. The lab water control is either moderately hard water (MHW) or dechlorinated Madison tap water. There are 10 replicates with one female C. dubia set for both the control and all the East Twin River samples. The test solutions are renewed daily and each test beaker is supplied with food which includes YFC and algae. Light is provided 16 hours a day and the test is conducted at 25°C. A 2.5% CO2 treatment is used to control pH drift during the test. Survival and reproduction are recorded daily. The mean neonates per female in 3 broods is used to determine statistical difference (p ≥ 0.05 is not significant) between the treatments (all river samples and the control) using SAS®. This method is based on EPA Test Method 1002 and the State of Wisconsin Aquatic Life Toxicity Testing Methods Manual, Edition 2.
Ambient Acute Pimephales Promelas Toxicity Test This method is used for measuring the short-term, static-renewal acute toxicity of water samples to the freshwater minnow Pimephales promelas (fathead minnow). During this test, juvenile (4-14 day old) P. promelas are continuously exposed for 96 hours to 100% samples of East Twin River water as well as a lab water control. The lab water control for this test is always dechlorinated Madison tap water which is the water the fish are cultured in. There are 4 replicates of 10 fish each per treatment. Therefore, each acute P. promelas treatment has 40 fish that are exposed. Treatments are renewed daily with fresh test solutions for the duration of the test period. Each test beaker is fed brine shrimp on day 2 (after ~48 hours). Light is provided 16 hours a day and the test is conducted at 20°C. A 2.5% CO2 treatment is used to control pH drift during the test. Survival is monitored each day when the solutions are renewed. The percent survival per replicate is used to determine statistical difference (p ≥ 0.05 is not significant) between the treatments (river samples and the control) using SAS®. This method is based on EPA Test Method 2000 and the State of Wisconsin Aquatic Life Toxicity Testing Methods Manual, Edition 2.
Ambient Chronic Pimephales Promelas Toxicity Test This method is used for measuring the short-term, static-renewal chronic toxicity of water samples to the freshwater minnow Pimephales promelas (fathead minnow). During this test, larval (≤24 hour old) P. promelas are continuously exposed for 7 days to 100% samples of East Twin River water as well as a lab water control. The lab water control for this test is always dechlorinated Madison tap water. There are 10 replicates for each treatment and each replicate is set with two fish. Therefore, 20 fish are exposed per chronic treatment. When the test is shut down 2 replicates are combined for weighing purposes so that there are 5 replicate weight results. Treatments are renewed daily with fresh test solution for the duration of the test period. Each test beaker is fed brine shrimp 2-3 times per day. Light is provided 16 hours a day and the test is conducted at 25°C. A 2.5% CO2 treatment is used to control pH drift during the test. Survival is monitored each day when the solutions are renewed. Survival and growth (dry weight) are measured at the end of the test to determine if there is an effect on the minnows. Statistical significance of mean dry weight per replicate for all treatments (East Twin River water samples and lab control) is determined using SAS®(p ≥ 0.05 not significant). This method is based on EPA Test Method 1000 and the State of Wisconsin Aquatic Life Toxicity Testing Methods Manual, Edition 2.
Ambient Chronic Selenastrum capricornutum Toxicity Test D During this test, algal cells are continuously exposed for 96 hours to 100% East Twin River water samples and a moderately hard water control. Light and shaking are provided 24 hours a day and the test is conducted at 25°C. River water is filtered through a GF/A filter prior to test preparation to remove indigenous algae. Nutrients are added to all test solutions to stimulate algal growth. Four replicates of each treatment are set on a microplate which is measured using a plate reader at the end of the test. Chlorophyll content (relative fluorescent units) at 96 hours is compared between all treatments to assess the impact on growth. Algal growth (chlorophyll content measured as RFU) is assessed using SAS® (p ≥ 0.05 is not significant) to determine statistically significant differences. This method is based on EPA method 1003.0 and the State of Wisconsin Aquatic Life Toxicity Testing Methods Manual, Edition 2.

June 22, 2020 East Twin River Targeted Watershed Assessment: A Water Quality Report to Restore Wisconsin Watersheds, 2020
32 | 42
Chemistry Alkalinity and hardness of East Twin River samples and lab water is measured on samples collected and preserved on the initial set day. East Twin River ammonia levels are also determined using preserved sample from the initial day. All test waters have pH, dissolved oxygen and conductivity measured on fresh test solutions prior to renewal. After renewal, the water is measured for pH and DO.
Appendix B: Toxicity Test Rests in Tables
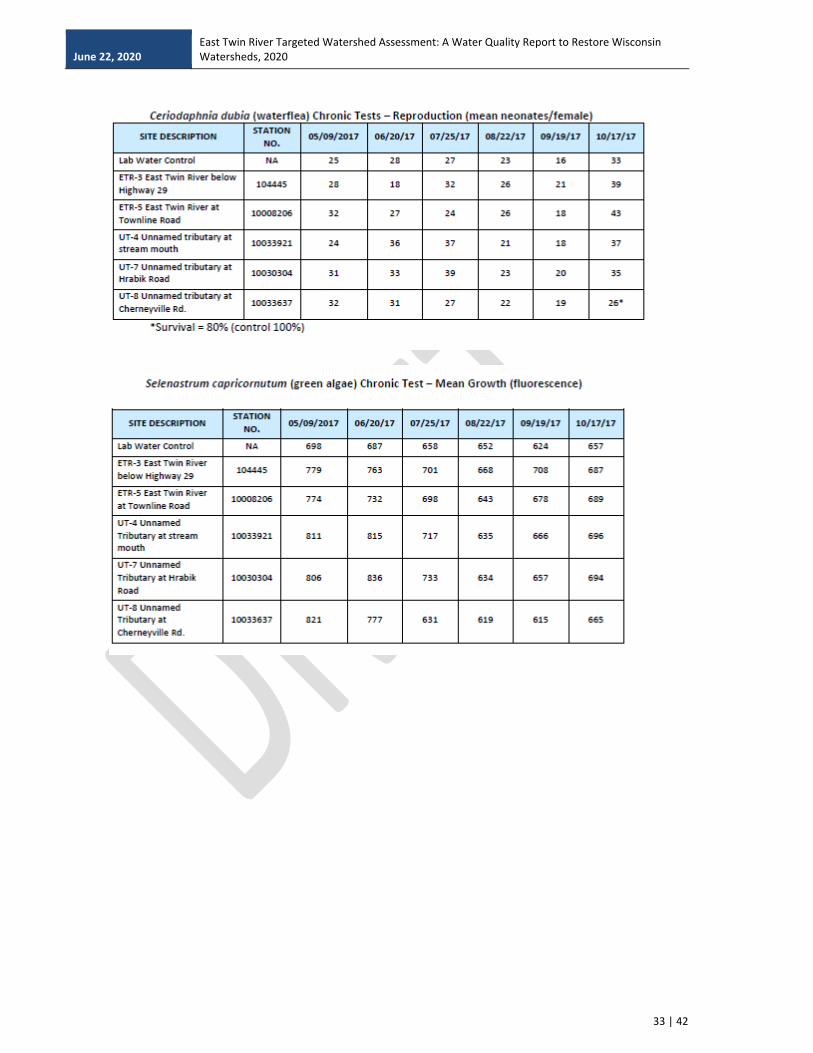
June 22, 2020 East Twin River Targeted Watershed Assessment: A Water Quality Report to Restore Wisconsin Watersheds, 2020
33 | 42

June 22, 2020 East Twin River Targeted Watershed Assessment: A Water Quality Report to Restore Wisconsin Watersheds, 2020
34 | 42
Appendix C: References
Gansberg, M. 2009. Fish and Aquatic Life Use Designation Summary-Unnamed Tributary to East Twin River – Cherneyville Road (WBIC 3000211). Gansberg, M. 2009. Fish and Aquatic Life Use Designation Summary-Unnamed Tributary to East Twin River – Sleepy Hollow Road (WBIC 3000212). Gansberg, M., Hogler, S. 2012. Water Quality Surveys of the East Twin River (84000) and Unnamed Tributary (3000211, 3000212, & 3000213) to the East Twin River, Kewaunee County – 2011 and 2012. Hogler, S., Surendonk, S. 2009. Upper East Twin River Trout Survey. Hogler, S., Surendonk, S., Lange, R. 2015. East Twin River Trout Survey. Hogler, S., Cahow, J. 2001. East Twin River Baseline Monitoring Report. Lyons, J. 1992. Using the Index of Biotic Integrity (IBI) to Measure Environmental Quality in Warmwater Streams of Wisconsin U.S. Department of Agriculture, Forest Service, North Central Forest Experiment Station, General Technical Report NC-149. St. Paul, Minnesota. Lyons, J., Wang, L., Simonson, T.D., 1996. Development and validation of an index of biotic integrity for coldwater streams in Wisconsin. N. Am. J. Fish. Manage. 16, 241–256. Lyons, J. 2013. Methodology for Using Field Data to Identify and Correct Wisconsin Stream “Natural Community” Misclassifications. Version 4, May 16, 2013. Simonson T.D., J. Lyons and P.D. Kanehl. 1994. Guidelines for Evaluating Fish Habitat in Wisconsin Streams. U.S. Department of Agriculture, Forest Service, North Central Forest Experiment Station, General Technical Report NC-164. U.S. Environmental Protection Agency. 2013. Aquatic Life Ambient Water Quality Criteria for Ammonia – Freshwater. Retrieved January 31st, 2018 from https://www.epa.gov/sites/production/files/2015-08/documents/aquatic-life-ambient-water-quality-criteria-for-ammonia-freshwater-2013.pdf Weigel, B.M. 2003. Development of stream macroinvertebrate models that predict watershed and local stressors in Wisconsin. Journal of the North American Benthological Society 22:123–142. West, W. 2009. Report of Findings, Biological Survey of East Twin River, Kewaunee County, WI. Blue Iris Environmental, Inc. Wisconsin Department of Natural Resources. 2017. Wisconsin 2018 Consolidated Assessment and Listing Methodology (WisCALM) for CWA Section 303(d) and 305(b) Integrated Reporting. 3200-2017-02. Wisconsin Department of Natural Resources. 2005. Surface Water Assessment Team, Guidelines and Procedures for Surface Water Grab Sampling, Version 3. Wisconsin Department of Natural Resources. 2004. Guidelines for Designating Fish & Aquatic Life Uses for Wisconsin Surface Waters. PUBL-WT-807-04 First Edition. Wisconsin Department of Natural Resources. 2000. Guidelines for Collecting Macroinvertebrate Samples from Wadable Streams. Wisconsin Department of Natural Resources. 2007. Guidelines for Qualitative Physical Habitat Evaluations of Wadeable Streams. Wisconsin Department of Natural Resources. 2001.Guidelines for Assessing Fish Communities of Wadable Streams in Wisconsin. Wisconsin Department of Natural Resources. 2004. Guidelines and Standard Procedures for Continuous Temperature Monitoring, Version 1. Wisconsin Department of Natural Resources. 2008. State of Wisconsin Aquatic Life Toxicity Testing Methods Manual, 2nd Edition.

June 22, 2020 East Twin River Targeted Watershed Assessment: A Water Quality Report to Restore Wisconsin Watersheds, 2020
35 | 42
Appendix D. Blue Iris Environmental Report of Findings, Biological Survey of East Twin River, Kewaunee County 2009

June 22, 2020 East Twin River Targeted Watershed Assessment: A Water Quality Report to Restore Wisconsin Watersheds, 2020
P a g e 36 | 42
Summary of Findings:
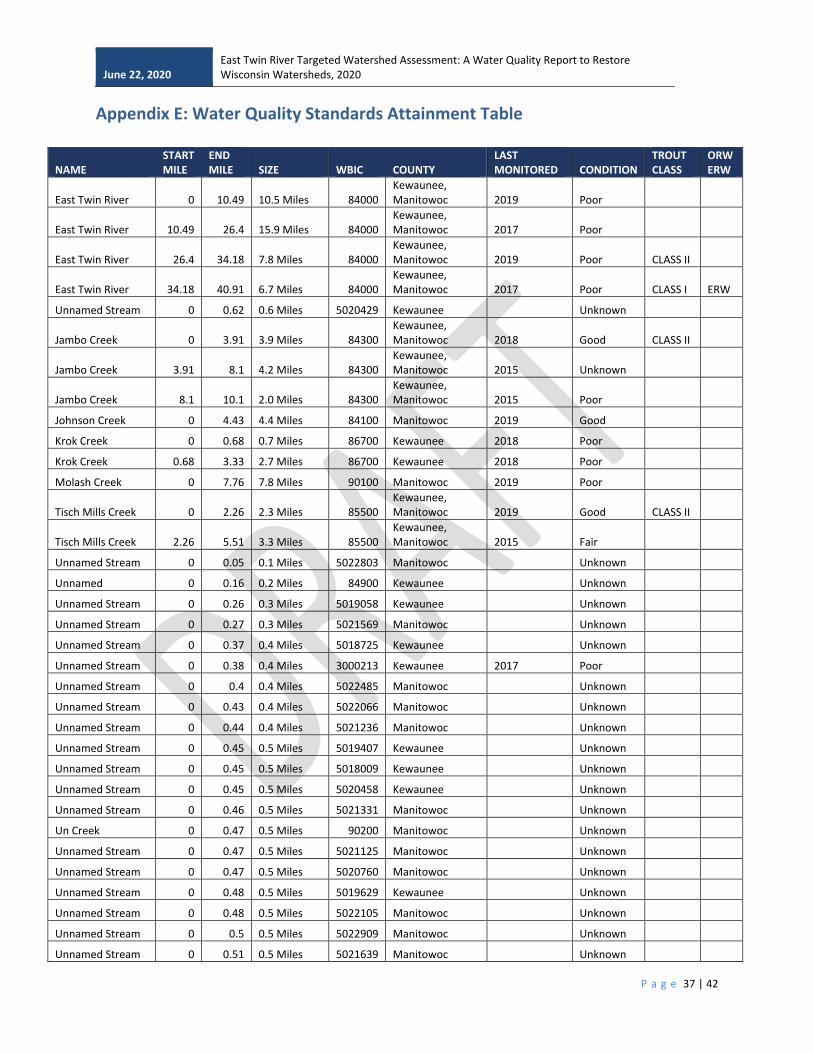
June 22, 2020 East Twin River Targeted Watershed Assessment: A Water Quality Report to Restore Wisconsin Watersheds, 2020
P a g e 37 | 42
Appendix E: Water Quality Standards Attainment Table
NAME START MILE
END MILE SIZE WBIC COUNTY
LAST MONITORED CONDITION
TROUT CLASS
ORW ERW
East Twin River 0 10.49 10.5 Miles 84000 Kewaunee, Manitowoc 2019 Poor
East Twin River 10.49 26.4 15.9 Miles 84000 Kewaunee, Manitowoc 2017 Poor
East Twin River 26.4 34.18 7.8 Miles 84000 Kewaunee, Manitowoc 2019 Poor CLASS II
East Twin River 34.18 40.91 6.7 Miles 84000 Kewaunee, Manitowoc 2017 Poor CLASS I ERW
Unnamed Stream 0 0.62 0.6 Miles 5020429 Kewaunee Unknown
Jambo Creek 0 3.91 3.9 Miles 84300 Kewaunee, Manitowoc 2018 Good CLASS II
Jambo Creek 3.91 8.1 4.2 Miles 84300 Kewaunee, Manitowoc 2015 Unknown
Jambo Creek 8.1 10.1 2.0 Miles 84300 Kewaunee, Manitowoc 2015 Poor
Johnson Creek 0 4.43 4.4 Miles 84100 Manitowoc 2019 Good
Krok Creek 0 0.68 0.7 Miles 86700 Kewaunee 2018 Poor
Krok Creek 0.68 3.33 2.7 Miles 86700 Kewaunee 2018 Poor
Molash Creek 0 7.76 7.8 Miles 90100 Manitowoc 2019 Poor
Tisch Mills Creek 0 2.26 2.3 Miles 85500 Kewaunee, Manitowoc 2019 Good CLASS II
Tisch Mills Creek 2.26 5.51 3.3 Miles 85500 Kewaunee, Manitowoc 2015 Fair
Unnamed Stream 0 0.05 0.1 Miles 5022803 Manitowoc Unknown
Unnamed 0 0.16 0.2 Miles 84900 Kewaunee Unknown
Unnamed Stream 0 0.26 0.3 Miles 5019058 Kewaunee Unknown
Unnamed Stream 0 0.27 0.3 Miles 5021569 Manitowoc Unknown
Unnamed Stream 0 0.37 0.4 Miles 5018725 Kewaunee Unknown
Unnamed Stream 0 0.38 0.4 Miles 3000213 Kewaunee 2017 Poor
Unnamed Stream 0 0.4 0.4 Miles 5022485 Manitowoc Unknown
Unnamed Stream 0 0.43 0.4 Miles 5022066 Manitowoc Unknown
Unnamed Stream 0 0.44 0.4 Miles 5021236 Manitowoc Unknown
Unnamed Stream 0 0.45 0.5 Miles 5019407 Kewaunee Unknown
Unnamed Stream 0 0.45 0.5 Miles 5018009 Kewaunee Unknown
Unnamed Stream 0 0.45 0.5 Miles 5020458 Kewaunee Unknown
Unnamed Stream 0 0.46 0.5 Miles 5021331 Manitowoc Unknown
Un Creek 0 0.47 0.5 Miles 90200 Manitowoc Unknown
Unnamed Stream 0 0.47 0.5 Miles 5021125 Manitowoc Unknown
Unnamed Stream 0 0.47 0.5 Miles 5020760 Manitowoc Unknown
Unnamed Stream 0 0.48 0.5 Miles 5019629 Kewaunee Unknown
Unnamed Stream 0 0.48 0.5 Miles 5022105 Manitowoc Unknown
Unnamed Stream 0 0.5 0.5 Miles 5022909 Manitowoc Unknown
Unnamed Stream 0 0.51 0.5 Miles 5021639 Manitowoc Unknown

June 22, 2020 East Twin River Targeted Watershed Assessment: A Water Quality Report to Restore Wisconsin Watersheds, 2020
38 | 42
NAME START MILE
END MILE SIZE WBIC COUNTY
LAST MONITORED CONDITION
TROUT CLASS
ORW ERW
Unnamed Stream 0 0.53 0.5 Miles 5021226 Manitowoc Unknown
Unnamed Stream 0 0.53 0.5 Miles 5020629 Manitowoc Unknown
Unnamed Stream 0 0.54 0.5 Miles 5021209 Manitowoc Unknown
Unnamed Stream 0 0.55 0.6 Miles 5019540 Kewaunee Unknown
Unnamed Stream 0 0.55 0.6 Miles 5018817 Kewaunee Unknown
Unnamed Stream 0 0.55 0.6 Miles 5021245 Manitowoc Unknown
Unnamed Stream 0 0.56 0.6 Miles 5019717 Kewaunee Unknown
Unnamed Stream 0 0.56 0.6 Miles 5022249 Manitowoc Unknown
Unnamed Stream 0 0.57 0.6 Miles 5019988 Kewaunee Unknown
Unnamed Stream 0 0.57 0.6 Miles 5022757 Manitowoc Unknown
Unnamed Stream 0 0.58 0.6 Miles 5020900 Manitowoc Unknown
Unnamed Stream 0 0.58 0.6 Miles 5020513 Manitowoc Unknown
Unnamed Stream 0 0.58 0.6 Miles 5021866 Manitowoc Unknown
Unnamed Stream 0 0.61 0.6 Miles 5020376 Kewaunee Unknown
Unnamed Stream 0 0.62 0.6 Miles 5022414 Manitowoc Unknown
Unnamed Stream 0 0.63 0.6 Miles 5019454 Kewaunee Unknown
Unnamed Stream 0 0.64 0.6 Miles 5018931 Kewaunee Unknown
Unnamed Stream 0 0.65 0.7 Miles 5021565 Manitowoc Unknown
Unnamed Stream 0 0.65 0.7 Miles 5021444 Manitowoc Unknown
Unnamed Stream 0 0.65 0.7 Miles 5019139 Kewaunee Unknown
Unnamed Stream 0 0.65 0.7 Miles 5020242 Kewaunee Unknown
Unnamed Stream 0 0.65 0.7 Miles 5021439 Manitowoc Unknown
Unnamed Stream 0 0.67 0.7 Miles 5021205 Manitowoc Unknown
Unnamed Stream 0 0.68 0.7 Miles 5022209 Manitowoc Unknown
Unnamed Stream 0 0.68 0.7 Miles 5021583 Manitowoc Unknown
Unnamed Stream 0 0.68 0.7 Miles 5021594 Manitowoc Unknown
Unnamed Stream 0 0.68 0.7 Miles 5022656 Manitowoc Unknown
Unnamed Stream 0 0.69 0.7 Miles 5020540 Manitowoc Unknown
Unnamed Stream 0 0.7 0.7 Miles 5021932 Manitowoc Unknown
Unnamed Stream 0 0.71 0.7 Miles 5022731 Manitowoc Unknown
Unnamed Stream 0 0.74 0.7 Miles 5022483 Manitowoc Unknown
Unnamed Stream 0 0.75 0.8 Miles 5020585 Manitowoc Unknown
Unnamed Stream 0 0.77 0.8 Miles 5019465 Kewaunee Unknown
Unnamed Stream 0 0.77 0.8 Miles 5019465 Kewaunee Unknown
Unnamed Stream 0 0.77 0.8 Miles 5019249 Kewaunee Unknown
Unnamed Stream 0 0.79 0.8 Miles 5020850 Manitowoc Unknown
Unnamed Stream 0 0.79 0.8 Miles 5019171 Kewaunee Unknown
Unnamed Stream 0 0.81 0.8 Miles 5019657 Kewaunee Unknown
Unnamed Stream 0 0.81 0.8 Miles 5018357 Kewaunee Unknown
Unnamed Stream 0 0.81 0.8 Miles 5021022 Manitowoc Unknown
Unnamed Stream 0 0.84 0.8 Miles 5020712 Manitowoc Unknown

June 22, 2020 East Twin River Targeted Watershed Assessment: A Water Quality Report to Restore Wisconsin Watersheds, 2020
39 | 42
NAME START MILE
END MILE SIZE WBIC COUNTY
LAST MONITORED CONDITION
TROUT CLASS
ORW ERW
Unnamed Stream 0 0.84 0.8 Miles 5020440 Kewaunee, Manitowoc Unknown
Unnamed Stream 0 0.84 0.8 Miles 5019654 Kewaunee Unknown
Unnamed Stream 0 0.84 0.8 Miles 5018914 Kewaunee Unknown
Unnamed Stream 0 0.84 0.8 Miles 5021741 Manitowoc Unknown
Unnamed Stream 0 0.85 0.9 Miles 5018807 Kewaunee Unknown
Unnamed Stream 0 0.85 0.9 Miles 5022169 Manitowoc Unknown
Unnamed Stream 0 0.86 0.9 Miles 5022061 Manitowoc Unknown
Unnamed Stream 0 0.87 0.9 Miles 5020992 Manitowoc Unknown
Unnamed Stream 0 0.88 0.9 Miles 5018221 Kewaunee Unknown
Unnamed Stream 0 0.88 0.9 Miles 5020837 Manitowoc Unknown
Unnamed Stream 0 0.88 0.9 Miles 5021140 Manitowoc Unknown
Unnamed Stream 0 0.9 0.9 Miles 5021677 Manitowoc Unknown
Unnamed Stream 0 0.9 0.9 Miles 5021647 Manitowoc Unknown
Unnamed Stream 0 0.91 0.9 Miles 5022641 Manitowoc Unknown
Unnamed Stream 0 0.94 0.9 Miles 5020742 Manitowoc Unknown
Unnamed Stream 0 0.95 1.0 Miles 5019622 Kewaunee Unknown
Unnamed Trib 22n, 24e, 31 Nesw 0 1 1.0 Miles 85700 Kewaunee Unknown
Unnamed Trib 22n, 23e, 24 Nenw 0 1 1.0 Miles 85800 Kewaunee Unknown
Unnamed Trib 21n, 24e, 4 Nwnw 0 1 1.0 Miles 86100 Manitowoc Unknown
Unnamed Trib 22n, 24e, 28 Nwnw 0 1 1.0 Miles 86200 Kewaunee Unknown
Unnamed Stream T21nr24e S25 0 1 1.0 Miles 90300 Manitowoc Unknown
Unnamed Trib T21n, R24e, S25 Nene 0 1 1.0 Miles 85100 Kewaunee Unknown
Unnamed Stream 0 1 1.0 Miles 5018987 Kewaunee Unknown
Unnamed Stream 0 1.05 1.1 Miles 5020087 Kewaunee Unknown
Unnamed Stream 0 1.05 1.1 Miles 5022763 Manitowoc Unknown
Unnamed Stream 0 1.09 1.1 Miles 5021696 Manitowoc Unknown
Unnamed Stream 0 1.11 1.1 Miles 5019992 Kewaunee Unknown
Unnamed Stream 0 1.13 1.1 Miles 5021396 Manitowoc Unknown
Unnamed Stream 0 1.15 1.2 Miles 5022902 Manitowoc Unknown
Unnamed Stream 0 1.16 1.2 Miles 5020362 Kewaunee Unknown
Unnamed Stream 0 1.18 1.2 Miles 5019705 Kewaunee Unknown
Unnamed Stream 0 1.18 1.2 Miles 5018985 Kewaunee Unknown
Unnamed Stream 0 1.19 1.2 Miles 5019081 Kewaunee Unknown
Unnamed Stream 0 1.19 1.2 Miles 5020393 Kewaunee Unknown
Unnamed Stream 0 1.23 1.2 Miles 5022182 Manitowoc Unknown
Unnamed Stream 0 1.23 1.2 Miles 5018530 Kewaunee Unknown

June 22, 2020 East Twin River Targeted Watershed Assessment: A Water Quality Report to Restore Wisconsin Watersheds, 2020
40 | 42
NAME START MILE
END MILE SIZE WBIC COUNTY
LAST MONITORED CONDITION
TROUT CLASS
ORW ERW
Unnamed Stream 0 1.25 1.3 Miles 5018636 Kewaunee Unknown
Unnamed Stream 0 1.27 1.3 Miles 5022014 Manitowoc Unknown
Unnamed Stream 0 1.27 1.3 Miles 5022202 Manitowoc Unknown
Unnamed Stream 0 1.28 1.3 Miles 5019355 Kewaunee Unknown
Unnamed Stream 0 1.31 1.3 Miles 5018644 Kewaunee Unknown
Unnamed Stream 0 1.35 1.4 Miles 5019833 Kewaunee Unknown
Unnamed Stream 0 1.37 1.4 Miles 5019180 Kewaunee Unknown
Unnamed Ditch 0 1.39 1.4 Miles 86600 Kewaunee Excellent
Unnamed Stream 0 1.4 1.4 Miles 5021653 Manitowoc Unknown
Unnamed Stream 0 1.42 1.4 Miles 5021000 Manitowoc Unknown
Unnamed Stream 0 1.42 1.4 Miles 5021772 Manitowoc Unknown
Unnamed Stream 0 1.44 1.4 Miles 5021894 Manitowoc Unknown
Unnamed Stream 0 1.44 1.4 Miles 5022445 Manitowoc Unknown
Unnamed Stream 0 1.45 1.5 Miles 5019806 Kewaunee Unknown
Unnamed Stream 0 1.45 1.5 Miles 5021266 Manitowoc Unknown
Unnamed Stream 0 1.49 1.5 Miles 5022214 Manitowoc Unknown
Unnamed Stream 0 1.54 1.5 Miles 5021512 Manitowoc Unknown
Unnamed Stream 0 1.57 1.6 Miles 5019251 Kewaunee Unknown
Unnamed Stream 0 1.62 1.6 Miles 5022364 Manitowoc Unknown
Unnamed Stream 0 1.63 1.6 Miles 5017856 Kewaunee Unknown
Unnamed Stream 0 1.65 1.7 Miles 5019016 Kewaunee Unknown
Unnamed Stream 0 1.7 1.7 Miles 5019920 Kewaunee Unknown
Unnamed Stream 0 1.7 1.7 Miles 5022207 Manitowoc Unknown
Unnamed Stream 0 1.72 1.7 Miles 5020126 Kewaunee 1985 Unknown
Unnamed Stream 0 1.77 1.8 Miles 5022248 Manitowoc Unknown
Unnamed Stream 0 1.88 1.9 Miles 5019231 Kewaunee Unknown
Unnamed Stream 0 1.91 1.9 Miles 5020884 Manitowoc Unknown
Unnamed Stream 0 1.93 1.9 Miles 3000212 Kewaunee 2017 Poor
Unnamed Stream 0 1.95 2.0 Miles 5019145 Kewaunee Unknown
Unnamed Stream 0 1.96 2.0 Miles 5021902 Manitowoc Unknown
Unnamed Trib T21n, R23e S09 Swsw 0 2 2.0 Miles 84500
Kewaunee, Manitowoc Unknown
Unnamed Trib 22n, 24e, 33 Swse 0 2 2.0 Miles 86500 Kewaunee Unknown
Unnamed Trib 23n, 23e, 22 Nene 0 2 2.0 Miles 86900 Kewaunee Unknown
Unnamed Stream 0 2.04 2.0 Miles 5022492 Manitowoc Unknown
Unnamed Trib 23n, 24e, 20 Nenw 0 2.05 2.1 Miles 86800 Kewaunee Unknown
Unnamed Stream 0 2.07 2.1 Miles 5020364 Kewaunee, Manitowoc Unknown
Unnamed Stream 0 2.07 2.1 Miles 5019298 Kewaunee Unknown
Unnamed Stream 0 2.17 2.2 Miles 5020155 Kewaunee Unknown
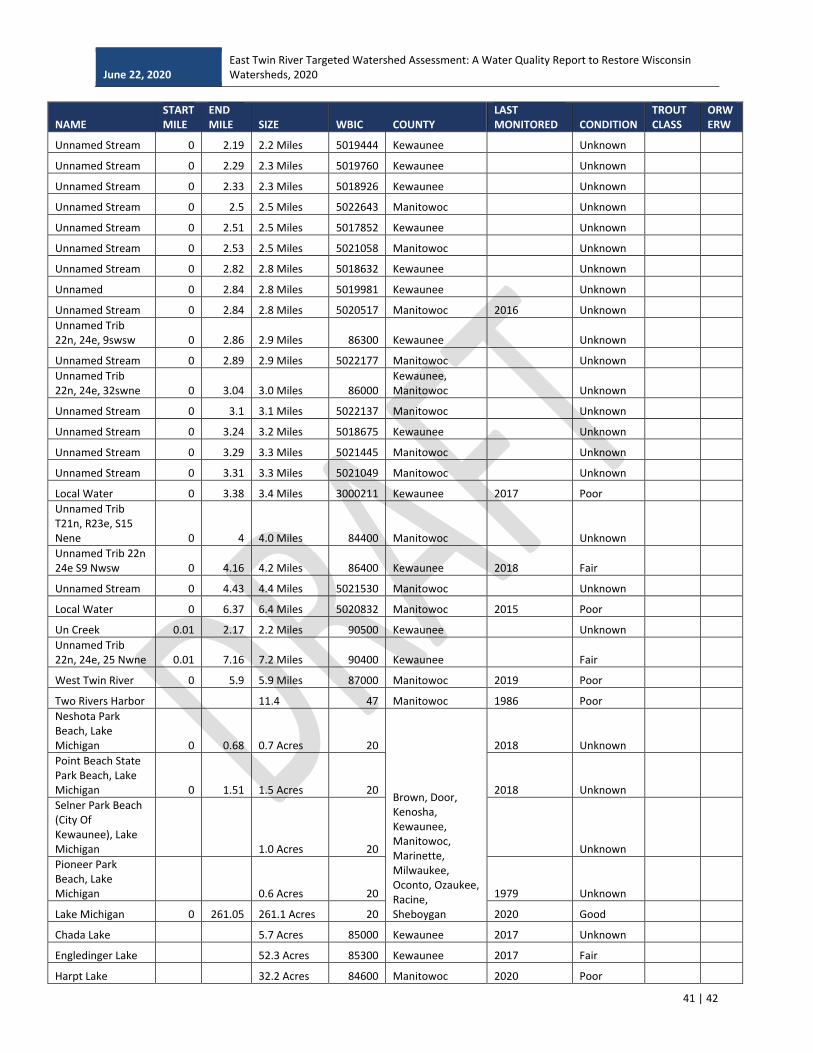
June 22, 2020 East Twin River Targeted Watershed Assessment: A Water Quality Report to Restore Wisconsin Watersheds, 2020
41 | 42
NAME START MILE
END MILE SIZE WBIC COUNTY
LAST MONITORED CONDITION
TROUT CLASS
ORW ERW
Unnamed Stream 0 2.19 2.2 Miles 5019444 Kewaunee Unknown
Unnamed Stream 0 2.29 2.3 Miles 5019760 Kewaunee Unknown
Unnamed Stream 0 2.33 2.3 Miles 5018926 Kewaunee Unknown
Unnamed Stream 0 2.5 2.5 Miles 5022643 Manitowoc Unknown
Unnamed Stream 0 2.51 2.5 Miles 5017852 Kewaunee Unknown
Unnamed Stream 0 2.53 2.5 Miles 5021058 Manitowoc Unknown
Unnamed Stream 0 2.82 2.8 Miles 5018632 Kewaunee Unknown
Unnamed 0 2.84 2.8 Miles 5019981 Kewaunee Unknown
Unnamed Stream 0 2.84 2.8 Miles 5020517 Manitowoc 2016 Unknown
Unnamed Trib 22n, 24e, 9swsw 0 2.86 2.9 Miles 86300 Kewaunee Unknown
Unnamed Stream 0 2.89 2.9 Miles 5022177 Manitowoc Unknown
Unnamed Trib 22n, 24e, 32swne 0 3.04 3.0 Miles 86000
Kewaunee, Manitowoc Unknown
Unnamed Stream 0 3.1 3.1 Miles 5022137 Manitowoc Unknown
Unnamed Stream 0 3.24 3.2 Miles 5018675 Kewaunee Unknown
Unnamed Stream 0 3.29 3.3 Miles 5021445 Manitowoc Unknown
Unnamed Stream 0 3.31 3.3 Miles 5021049 Manitowoc Unknown
Local Water 0 3.38 3.4 Miles 3000211 Kewaunee 2017 Poor
Unnamed Trib T21n, R23e, S15 Nene 0 4 4.0 Miles 84400 Manitowoc Unknown
Unnamed Trib 22n 24e S9 Nwsw 0 4.16 4.2 Miles 86400 Kewaunee 2018 Fair
Unnamed Stream 0 4.43 4.4 Miles 5021530 Manitowoc Unknown
Local Water 0 6.37 6.4 Miles 5020832 Manitowoc 2015 Poor
Un Creek 0.01 2.17 2.2 Miles 90500 Kewaunee Unknown
Unnamed Trib 22n, 24e, 25 Nwne 0.01 7.16 7.2 Miles 90400 Kewaunee Fair
West Twin River 0 5.9 5.9 Miles 87000 Manitowoc 2019 Poor
Two Rivers Harbor 11.4 47 Manitowoc 1986 Poor
Neshota Park Beach, Lake Michigan 0 0.68 0.7 Acres 20
Brown, Door, Kenosha, Kewaunee, Manitowoc, Marinette, Milwaukee, Oconto, Ozaukee, Racine, Sheboygan
2018 Unknown
Point Beach State Park Beach, Lake Michigan 0 1.51 1.5 Acres 20 2018 Unknown
Selner Park Beach (City Of Kewaunee), Lake Michigan 1.0 Acres 20 Unknown
Pioneer Park Beach, Lake Michigan 0.6 Acres 20 1979 Unknown
Lake Michigan 0 261.05 261.1 Acres 20 2020 Good
Chada Lake 5.7 Acres 85000 Kewaunee 2017 Unknown
Engledinger Lake 52.3 Acres 85300 Kewaunee 2017 Fair
Harpt Lake 32.2 Acres 84600 Manitowoc 2020 Poor
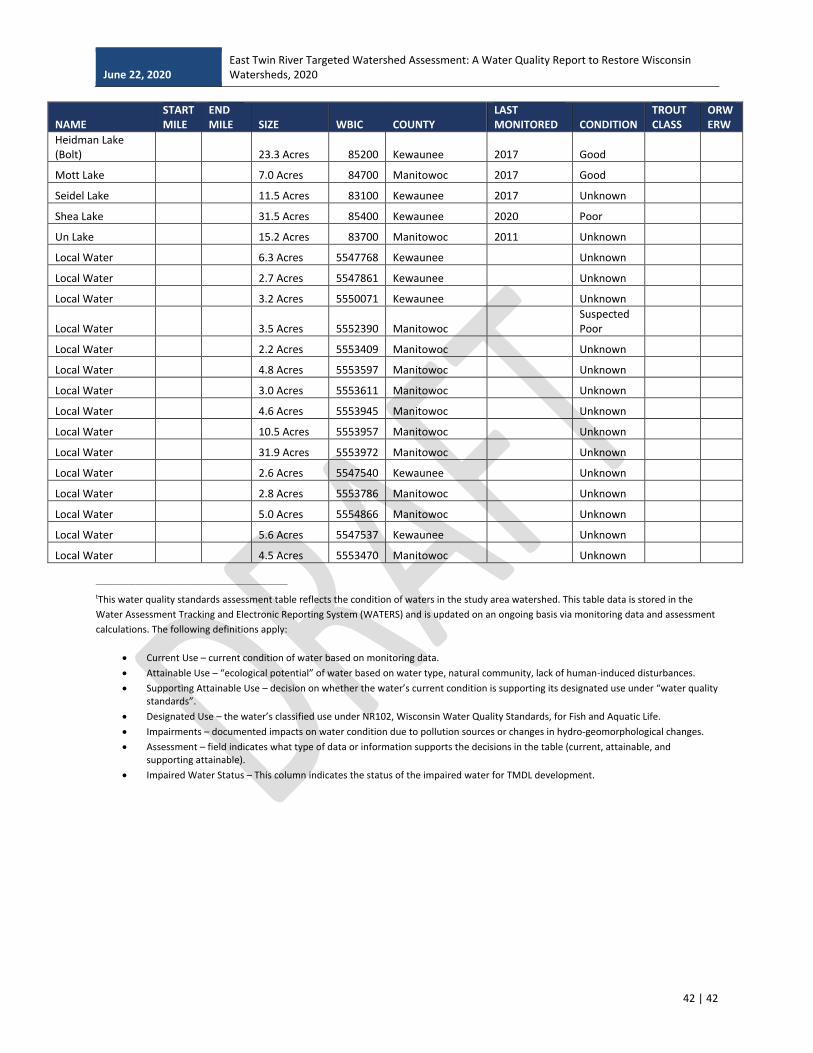
June 22, 2020 East Twin River Targeted Watershed Assessment: A Water Quality Report to Restore Wisconsin Watersheds, 2020
42 | 42
NAME START MILE
END MILE SIZE WBIC COUNTY
LAST MONITORED CONDITION
TROUT CLASS
ORW ERW
Heidman Lake (Bolt) 23.3 Acres 85200 Kewaunee 2017 Good
Mott Lake 7.0 Acres 84700 Manitowoc 2017 Good
Seidel Lake 11.5 Acres 83100 Kewaunee 2017 Unknown
Shea Lake 31.5 Acres 85400 Kewaunee 2020 Poor
Un Lake 15.2 Acres 83700 Manitowoc 2011 Unknown
Local Water 6.3 Acres 5547768 Kewaunee Unknown
Local Water 2.7 Acres 5547861 Kewaunee Unknown
Local Water 3.2 Acres 5550071 Kewaunee Unknown
Local Water 3.5 Acres 5552390 Manitowoc Suspected Poor
Local Water 2.2 Acres 5553409 Manitowoc Unknown
Local Water 4.8 Acres 5553597 Manitowoc Unknown
Local Water 3.0 Acres 5553611 Manitowoc Unknown
Local Water 4.6 Acres 5553945 Manitowoc Unknown
Local Water 10.5 Acres 5553957 Manitowoc Unknown
Local Water 31.9 Acres 5553972 Manitowoc Unknown
Local Water 2.6 Acres 5547540 Kewaunee Unknown
Local Water 2.8 Acres 5553786 Manitowoc Unknown
Local Water 5.0 Acres 5554866 Manitowoc Unknown
Local Water 5.6 Acres 5547537 Kewaunee Unknown
Local Water 4.5 Acres 5553470 Manitowoc Unknown
__________________________________________________________
tThis water quality standards assessment table reflects the condition of waters in the study area watershed. This table data is stored in the
Water Assessment Tracking and Electronic Reporting System (WATERS) and is updated on an ongoing basis via monitoring data and assessment
calculations. The following definitions apply:
• Current Use – current condition of water based on monitoring data.
• Attainable Use – “ecological potential” of water based on water type, natural community, lack of human-induced disturbances.
• Supporting Attainable Use – decision on whether the water’s current condition is supporting its designated use under “water quality standards”.
• Designated Use – the water’s classified use under NR102, Wisconsin Water Quality Standards, for Fish and Aquatic Life.
• Impairments – documented impacts on water condition due to pollution sources or changes in hydro-geomorphological changes.
• Assessment – field indicates what type of data or information supports the decisions in the table (current, attainable, and supporting attainable).
• Impaired Water Status – This column indicates the status of the impaired water for TMDL development.