*earnings inequality in the brazilian formal sector
TRANSCRIPT

03/03/2020
1
*Earnings inequality in the Brazilian formal sector: The role of firms, education and top incomes (J-Divergence)
Marcelo Neri (FGV Social)
Cecília Machado (FGV EPGE)
Valdemar Neto (FGV EPGE)
Key Reference: Alvarez, Benguria, Engbom and Moser (2018)
* 19 These slides https://www.cps.fgv.br/cps/bd/curso/19-J-divergence-measurements-ofeconomic-inequality.pdf
*** paper https://www.wider.unu.edu/publication/earnings-inequality-brazilian-formal-sector
Background of RAIS based Distributive Studies - Most of the analyses on Brazilian incomedistribution is based on household surveys in particular Pesquisa Nacional de Amostras a Domicílio(PNAD – IBGE), the main Brazilian National Household Survey). However, RAIS has a fewadvantages. First, it allows combining workers and firms information to understand formal wageinequality determinants. In particular, the incorporation of individual firms fixed effects explains thebulk of earnings distribution levels and changes (Alvarez et all 2017; Machado et all 2017). Second, itis the only nationwide data source available with long spells of panel data. This longitudinal aspectallows studying the mobility of workers across sectors and individual firms as well as the life-cycleprofile of these characteristics (Machado et al. 2017). Third, RAIS also offers the possibility ofanalyzing short run employment and wage dynamics because it contains information on a monthlybasis that allows aggregation to higher time measurement periods. This may facilitate internationaldata comparisons since the measurement unit varies across countries. Fourth, RAIS provides a uniqueperspective on certain policy related issues. The evaluation of legal employment quotas for PeopleWith Disabilities (PWD), and for the youth that requires certain shares of firms employment allocatedfor these groups is only possible using the establishment as the unit of information and unit of analysis(Neri et al. 2003). RAIS also allows to measure how biding are minimum wages in the bottom offormal employment earnings distribution (Engbom and Moser 2017). On the other extreme, RAISpermits to measure wages at the very upper tail of earnings distribution which has been drivinginequality in the US among other countries. And last, and perhaps most importantly, it allows to checkthe robustness of other types of data sources mentioned. In spite of all these advantages, RAIS wasvery little used up to know on understanding levels and changes in Brazilian earnings distribution.
03/03/2020
2
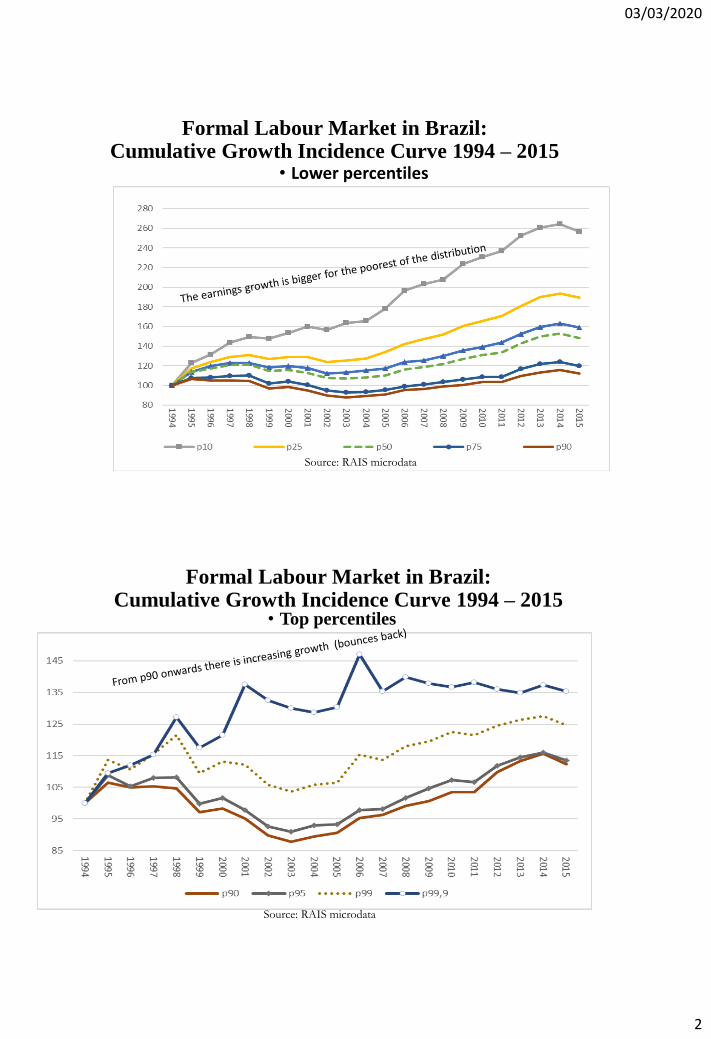
Formal Labour Market in Brazil:Cumulative Growth Incidence Curve 1994 – 2015
• Lower percentiles
Source: RAIS microdata
Formal Labour Market in Brazil:Cumulative Growth Incidence Curve 1994 – 2015
Source: RAIS microdata
• Top percentiles
03/03/2020
3
J-divergence (Jeffreys, 1946) measure is the simple sum of Theil T and Theil L indexes (J = T+L) expressed as:
T & L Theil (1967) indexes can be defined as:
Where xi is individual i income, N is population size and 𝜇 is mean income.
J-divergence measurements of economic inequality
J-Divergence can also be expressed in terms of its within and between groups components, in terms of the sum
of Theil-T and Theil-L respective components: J = T + L = T𝑒 + L𝑒 + σh=1𝑘 Yℎ Tℎ + σh=1
𝑘 πℎ Lℎ
6
www.fgv.br/fgvsocial
Fonte: FGV Social a partir dos microdados indivíduos e empresas identificados da RAIS/MTE
Gross Contribution to Inequality J-Divergence
Educati
on*Gender Age Firm size Sector
Type of
Firm
Individual
Firm
Levell 2015 32,81% 0,96% 10,82% 13,62% 8,63% 8,15% 64,7%
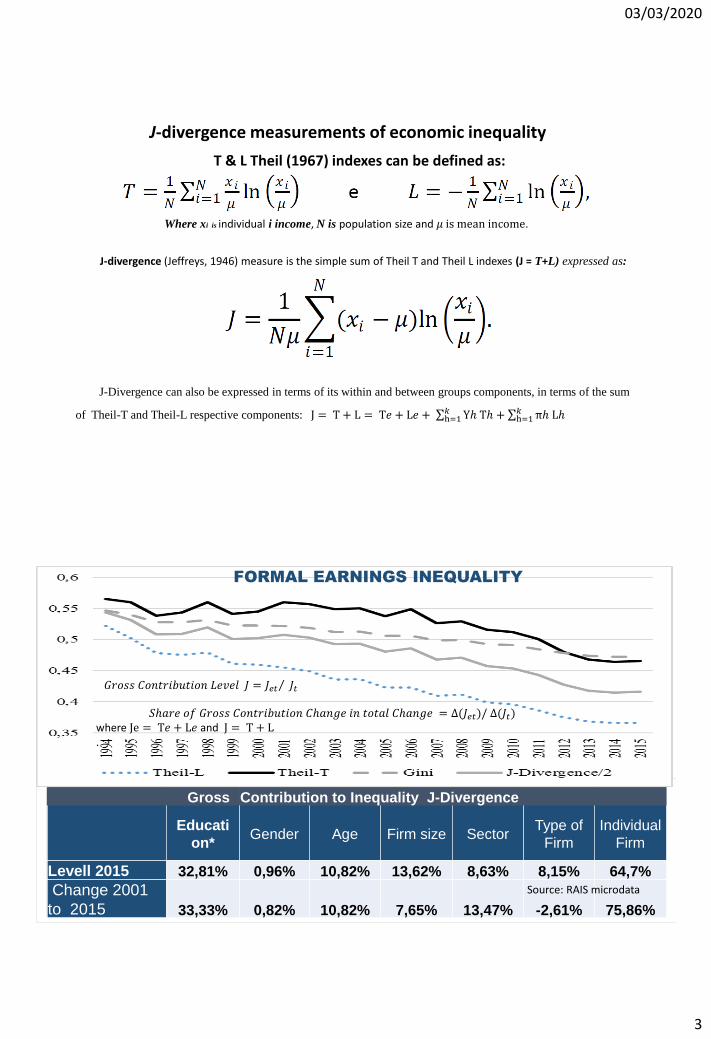
FORMAL EARNINGS INEQUALITY
Gross Contribution to Inequality J-Divergence
Educati
on*Gender Age Firm size Sector
Type of
Firm
Individual
Firm
Levell 2015 32,81% 0,96% 10,82% 13,62% 8,63% 8,15% 64,7%
Change 2001
to 2015 33,33% 0,82% 10,82% 7,65% 13,47% -2,61% 75,86%
Source: RAIS microdata
𝑆ℎ𝑎𝑟𝑒 𝑜𝑓 𝐺𝑟𝑜𝑠𝑠 𝐶𝑜𝑛𝑡𝑟𝑖𝑏𝑢𝑡𝑖𝑜𝑛 𝐶ℎ𝑎𝑛𝑔𝑒 𝑖𝑛 𝑡𝑜𝑡𝑎𝑙 𝐶ℎ𝑎𝑛𝑔𝑒 = ∆(𝐽𝑒𝑡)/ ∆(𝐽𝑡)where Je = T𝑒 + L𝑒 and J = T + L.
𝐺𝑟𝑜𝑠𝑠 𝐶𝑜𝑛𝑡𝑟𝑖𝑏𝑢𝑡𝑖𝑜𝑛 𝐿𝑒𝑣𝑒𝑙 𝐽 = Τ𝐽𝑒𝑡 𝐽𝑡

03/03/2020
4
T, L & J Contributions according to income level
With respect to the mean
Rohde (2016); Hecksher, Courseil and Silva (2017), Neri and Hecksher (2018); Morley (1999)
Key point: J-divergence implies in shares (Always non negative) for each income-bracket and individuals. It allowsto move from variables to specific groups (higher education, top 1% incomes, etc).
If we are interested only in contributions of groups situated in the top part of the income distribution the Theil –T could be used as well. The Theil-T presents always positive contributions to those above the mean (Morley 1999; Neri and Camargo 1999).
Specific Groups Contributions to Inequality: J-Divergence: Top 1% & 0.1% Incomes
inequality explained by the top 1% and 0.1% incomes rose 43.1% and 91%
Source: RAIS microdata
Gross Contribution to Inequality J-Divergence CATEGORIES
Level
2015
Education:
Completed
College
Firm Size:
>1000
Employees
Income
Brackets: Top
0,1%
Income
Brackets:
Top 1%
Income
Brackets:Top 5%
48,7% 34,8% 7,13% 27,57% 52,2%
J = T + L = T𝑒 + L𝑒 +
h=1
𝑘
Yℎ Tℎ +
h=1
𝑘
πℎ Lℎ
instead of summing all groups between groups component (ex: schooling),
choose a specific group among k groups (ex: individuals with college degree)
and compute its respective contribution from both between and within terms.

03/03/2020
5
Main Points (RAIS)Describes the evolution and the close causes of formal earnings inequality in the Brazilian formal sector using RAIS (33
million observations yearly.
RAIS allows to measure wages at the very upper tail of earnings distribution. In spite of overall inequality fall, the monotonic decrease of earnings increase goes until the 90 percentile, in the same direction not timing as PIT-based measures.
Gini of labor earnings in RAIS fell 12.5% between 1995 and 2015, concentration index from PNAD survey labor fell 19.3 per cent.
Main close determinants of inequality level. Schooling explains 32.8% of total inequality in 2015. Individual firm-effects reach 64.7%
Main determinants of inequality change. Schooling 33.3% of inequality between 2001-15. Individual firm-effects reach 75,9%!
J-Divergence allows to capture the role played by specific groups. We apply it to isolate the role of top incomes. Between 1995 and 2015
the share of inequality explained by the top 10%, 1% and 0.1% incomes rose 20.2 per cent, 43.1 per cent and 91 per cent, respectively.
Similarly, in spite of falling mean schooling returns, the share of inequality explained by those with high school diploma rises 29.5 %.
**J-divergence measurements of per capita income inequality
Rohde, N. (2016) – Summary: The paper uses a symmetric entropy statistic to study income inequality. The index quantifies the information content of a two-way message that transforms the empirical income distribution into an egalitarian reference distribution, and then back to the original. This allows the measure to be interpreted as an average of n income-to-mean divergences such that the inequality estimate can be broken down into contributions across population subgroups. Various properties of the index are analyzed and an application comparing the USA, Germany and Britain is provided. We focus on the sensitivity of inequality to the tails of the income distribution and show that the extreme right-hand tail accounts for a large and generally increasing proportion of total inequality. This result holds even if incomes are measured at the household level, averaged over a 5-year period and taken after government taxes and transfers.
Dominance of the richest in Brazilian income inequality: application of J-divergence to household and tax data Hecksher et al. (2017) ** Summary: The share of the income inequality explained by the 10% richest in Brazil is higher than 50%. Higher in Brazil than for the US (45%), Germany (44%) and Great Britain (41%). Inequality was measured using an index which is still not much used in the socioeconomic literature, the J-divergence. It can be defined as the sum of Theil’s T and L indices, but unlike these and the Gini index, can be easily decomposed as the sum of the individual contributions to the total inequality. Equivalised per capita household total monthly income PNAD were used to estimate the J-divergence from 1981 to 2015, and the corresponding shares of the inequality explained by each vintile of the income distribution. By integrating PNAD and income tax data for 2014, more than 50% of the resulting inequality of adult personal income is driven by the top percentile.

03/03/2020
6
J-Divergence of equivalent per capita Household (HH) income groups ,
Source: PNAD/IBGE from Hecksher et al. (2017)
1
𝑁σ𝑖=1𝑁 , σ𝑓=1
𝐹 𝑌if
*Equivalence Scales:F income sources (labor, rents,
social security, Bolsa Familia etcN household membersPer capita HH Income usual:
general case:
0 ≤ θ ≤ 1; θ 𝑖𝑠 aneconomy of scale parameter
1
𝑁θσ𝑖=1𝑁 , σ𝑓=1
𝐹 𝑌if
𝐼𝑓 θ = 1 per capita HH income
𝐼𝑓 θ = 0 Total HH income
𝐼𝑓 θ = 1/2 Equivalized per capita ,HH income – Square root rule
% Share of equivalent per capita income Groups in J-Divergence
Source: PNAD/IBGE from Hecksher et al. (2017)
The 10% richest get % share of J-Divergence :45% in the US44% in Germany41% in the U.K.
Theil-L 74 Gini 75 J-Div 82 Theil-T 87
Turning Point of Inequality of Household Per Capita Income(marginal income increases that lead to inequality increases)
Not very sensitive wrt lower end of distribution
The so-called square root rule
used in OECD countries
applies a theta equals to 0,5.
But 0,75 seems more realistic