earnings inequality: trends, explanations,...
TRANSCRIPT
Earnings inequality: Trends, explanations, implications
Winter School on Inequality and Social Welfare
Canazei, January 8-11, 2018
Cecilia García PeñalosaAix-Marseille School of Economics
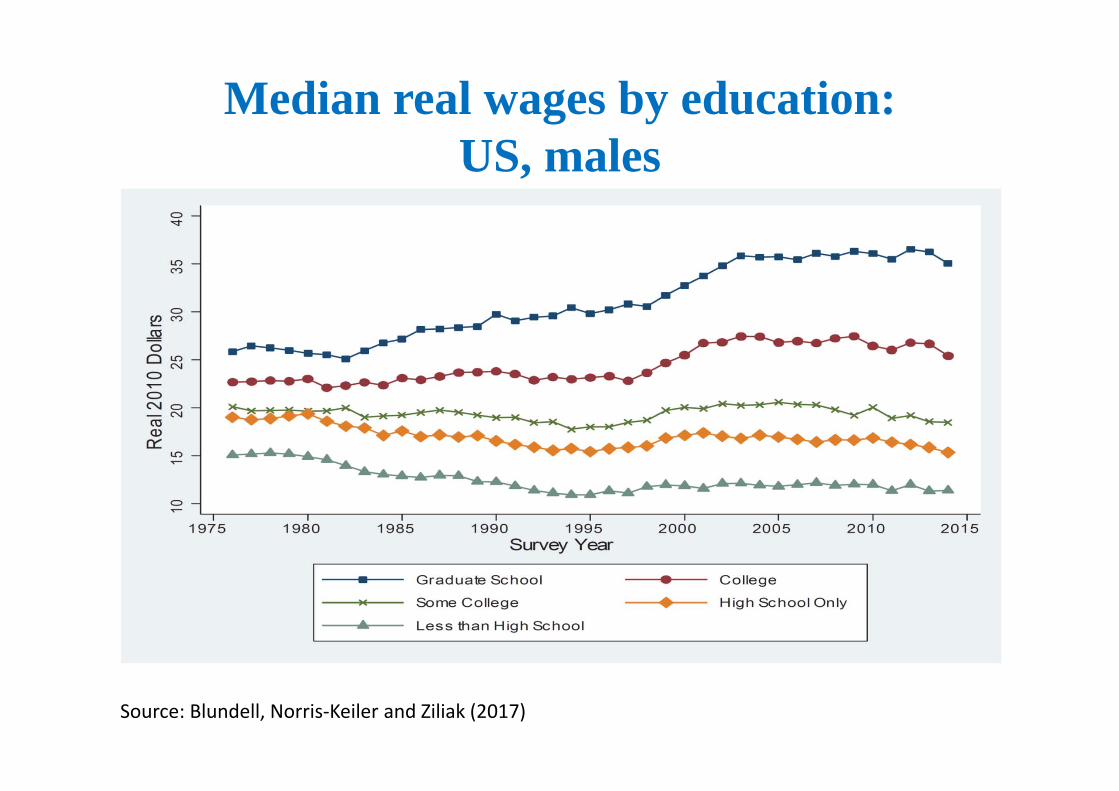
Median real wages by education: US, males
Source: Blundell, Norris‐Keiler and Ziliak (2017)
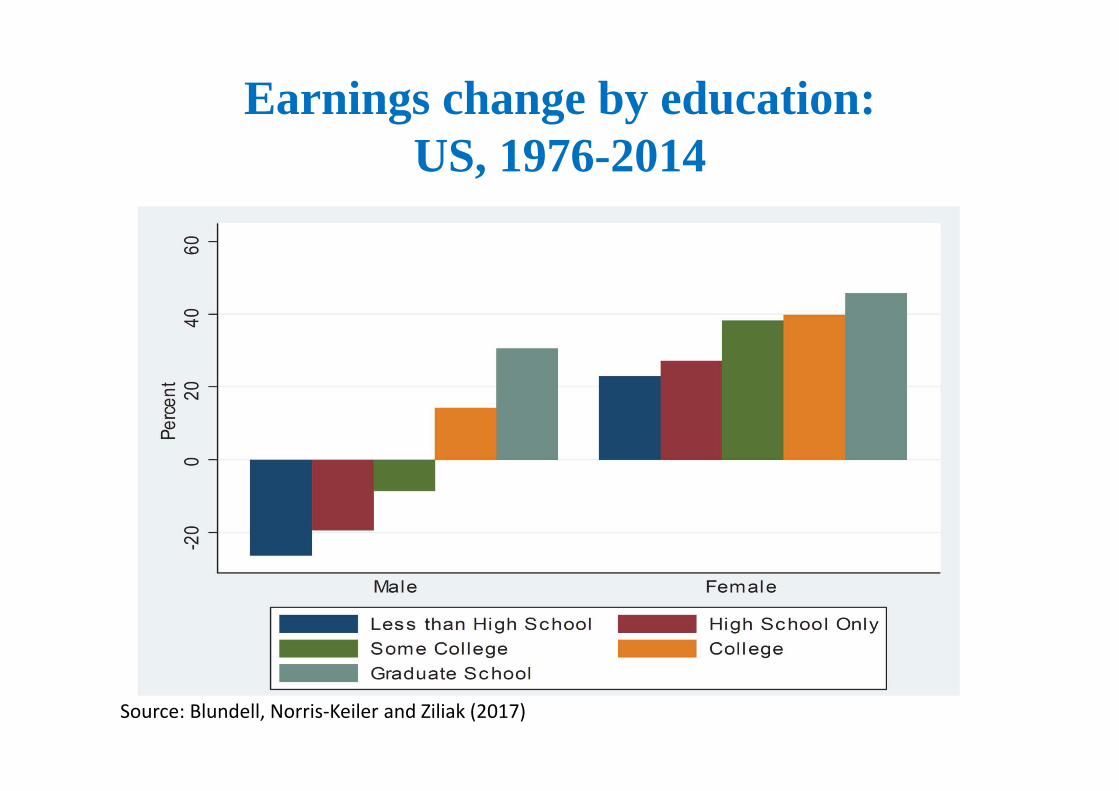
Earnings change by education: US, 1976-2014
Source: Blundell, Norris‐Keiler and Ziliak (2017)
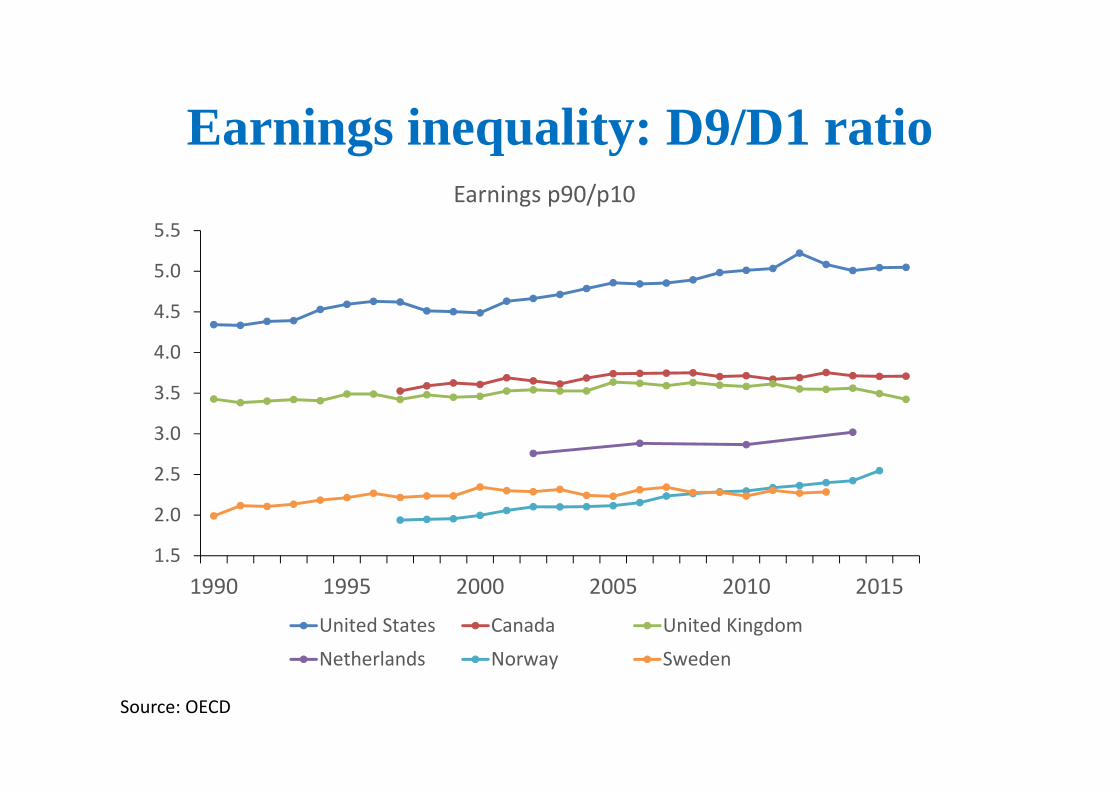
Earnings inequality: D9/D1 ratio
Source: OECD
1.5
2.0
2.5
3.0
3.5
4.0
4.5
5.0
5.5
1990 1995 2000 2005 2010 2015
Earnings p90/p10
United States Canada United Kingdom
Netherlands Norway Sweden
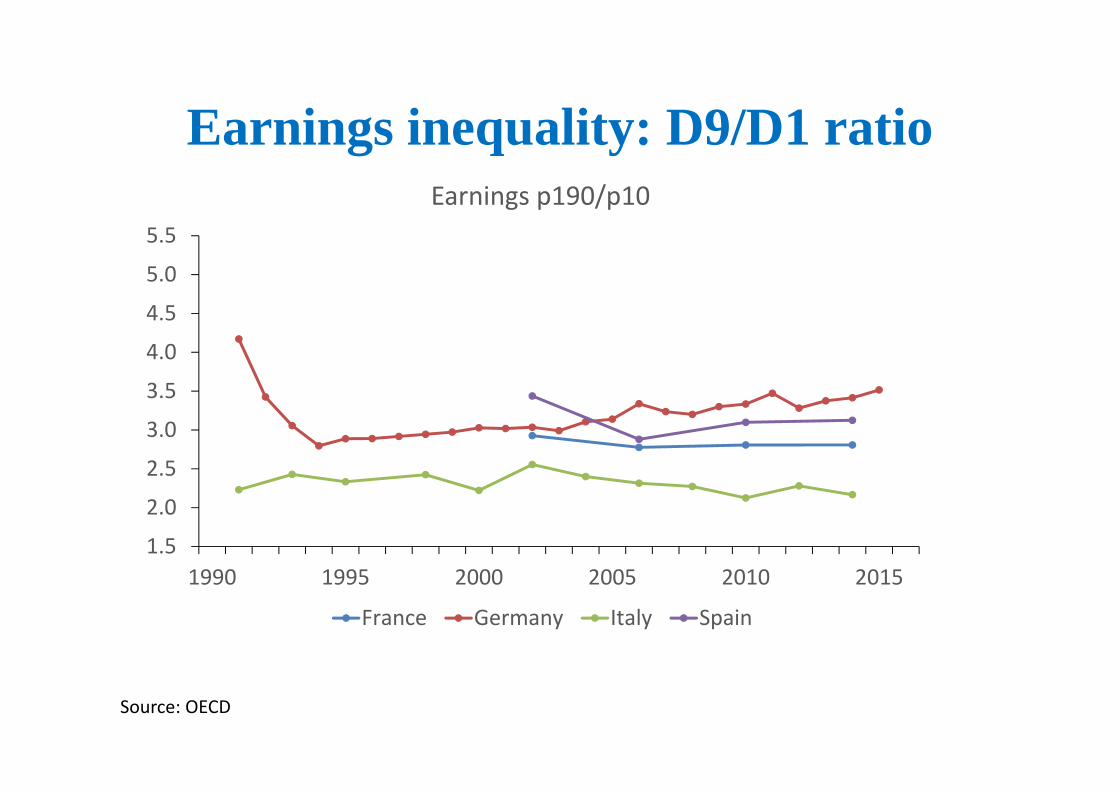
Earnings inequality: D9/D1 ratio
Source: OECD
1.5
2.0
2.5
3.0
3.5
4.0
4.5
5.0
5.5
1990 1995 2000 2005 2010 2015
Earnings p190/p10
France Germany Italy Spain
Plan of the talk• Causes of earnings dispersion
– Skill-biased technical change– Cyclical variations
• Consequences of earnings dispersion– Unusual shocks– Gender gaps
• Earnings and inequality in hours of work
Biased technical change?
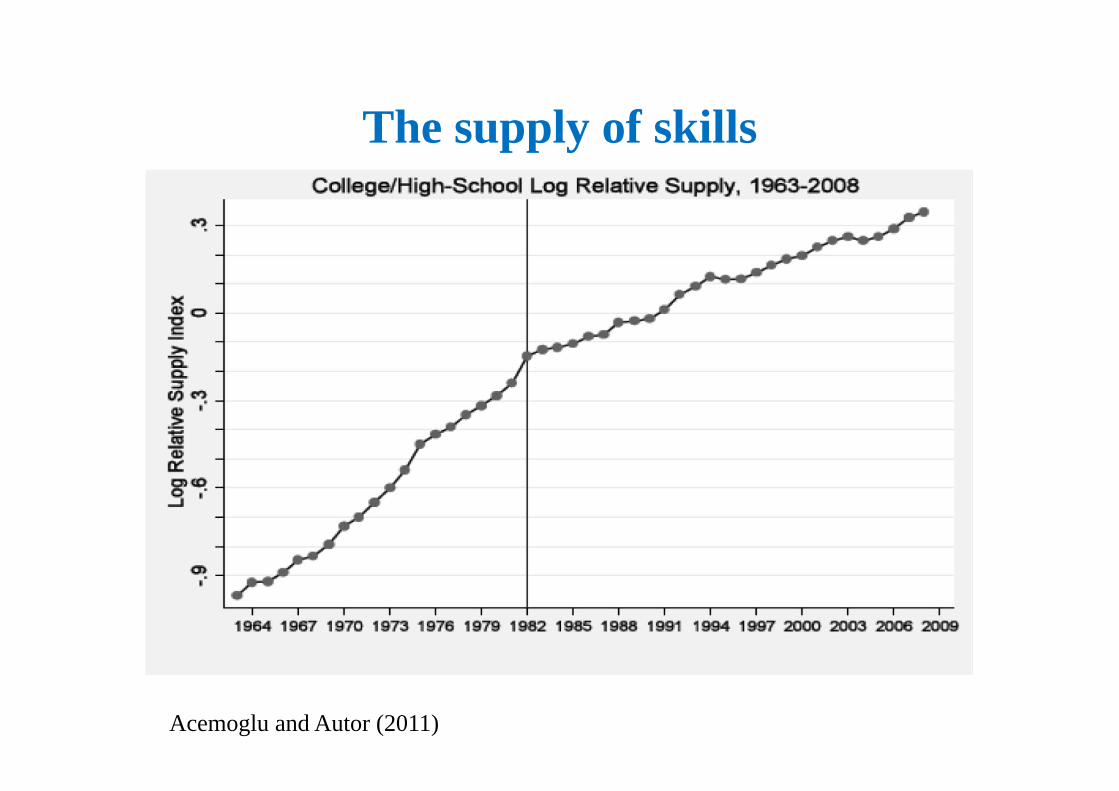
The supply of skills
Acemoglu and Autor (2011)
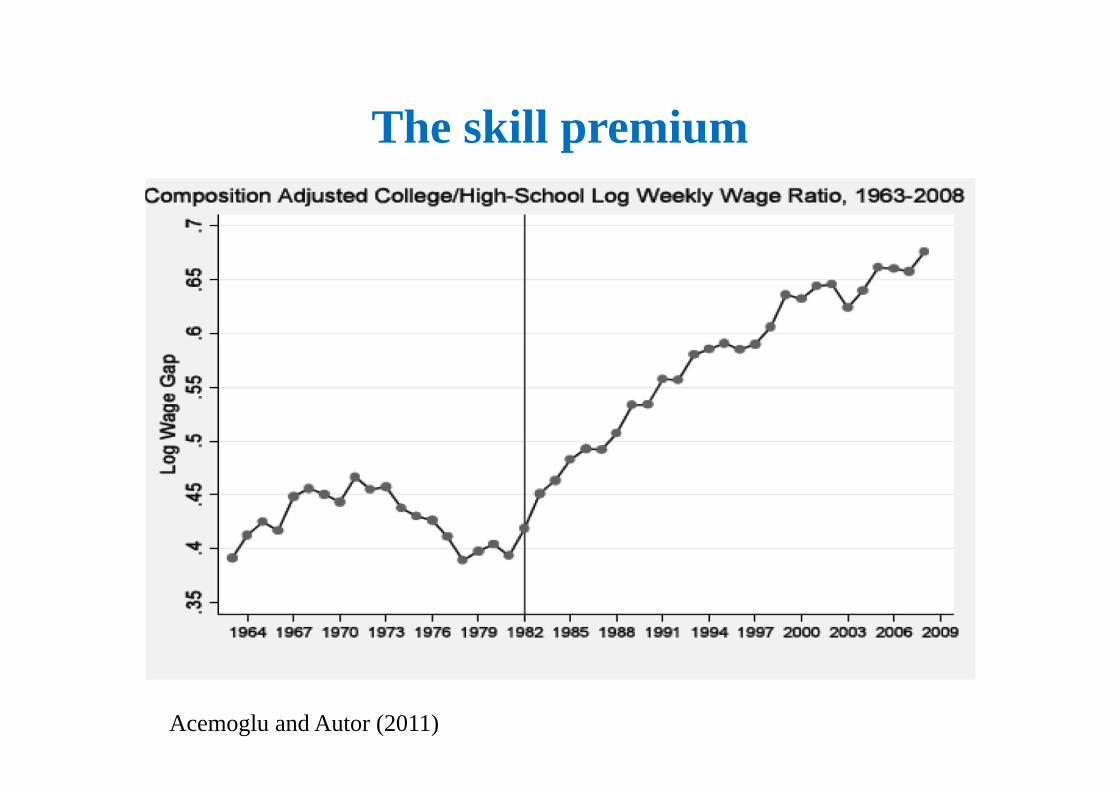
The skill premium
Acemoglu and Autor (2011)
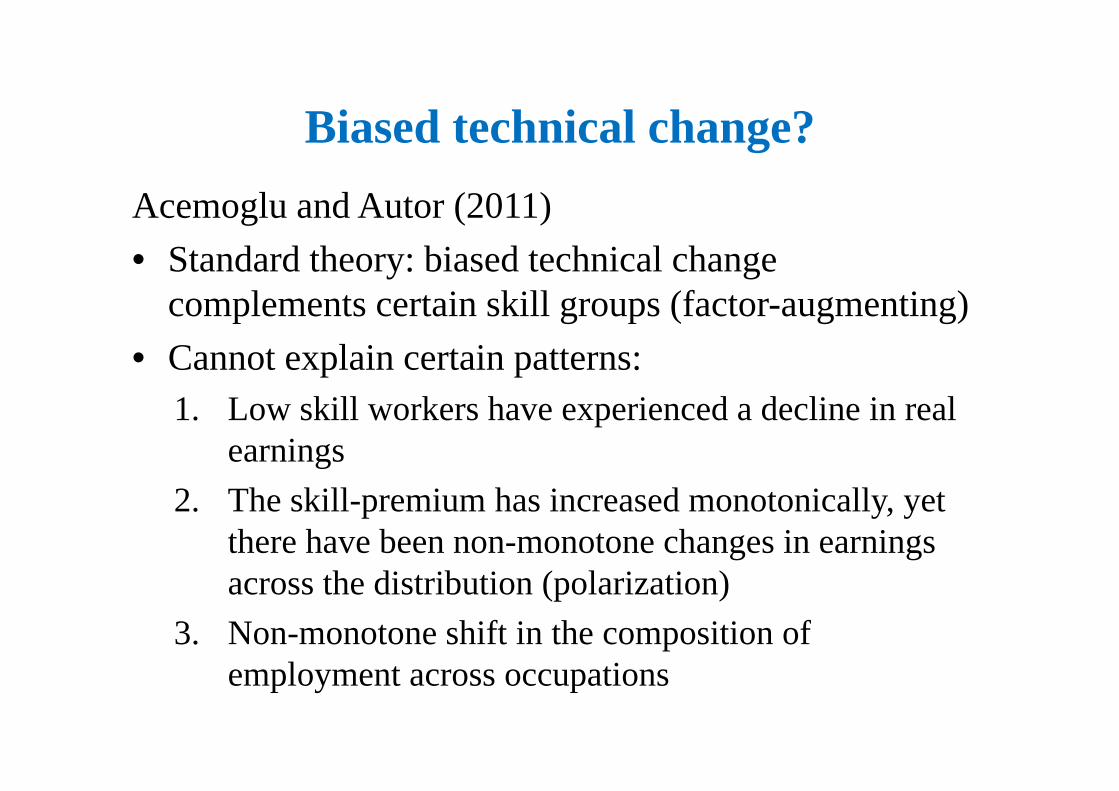
Biased technical change?Acemoglu and Autor (2011)• Standard theory: biased technical change
complements certain skill groups (factor-augmenting) • Cannot explain certain patterns:
1. Low skill workers have experienced a decline in real earnings
2. The skill-premium has increased monotonically, yet there have been non-monotone changes in earnings across the distribution (polarization)
3. Non-monotone shift in the composition of employment across occupations
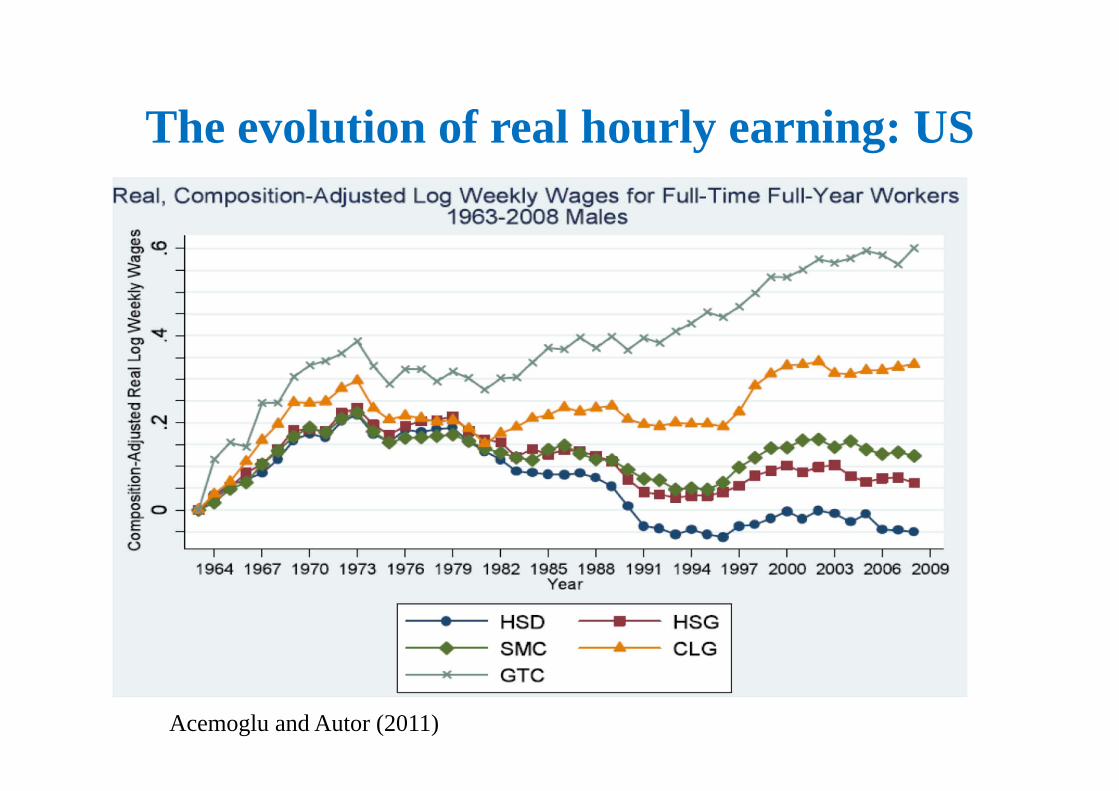
The evolution of real hourly earning: US
Acemoglu and Autor (2011)
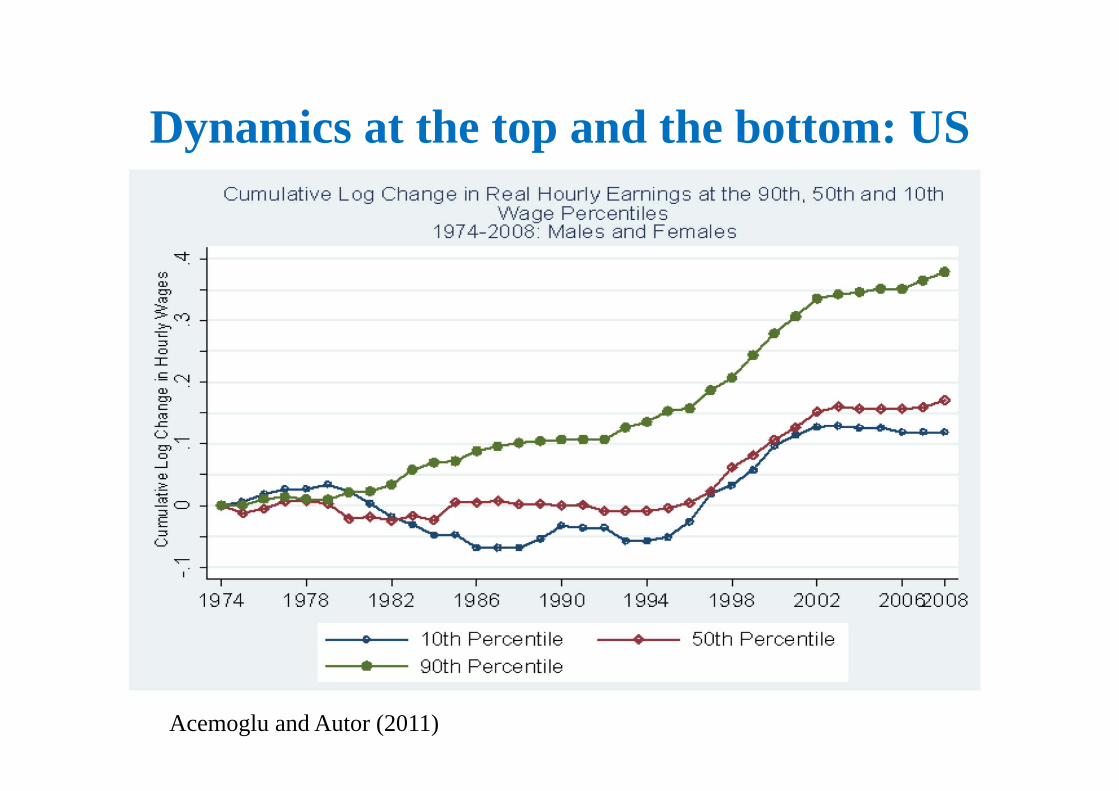
Dynamics at the top and the bottom: US
Acemoglu and Autor (2011)
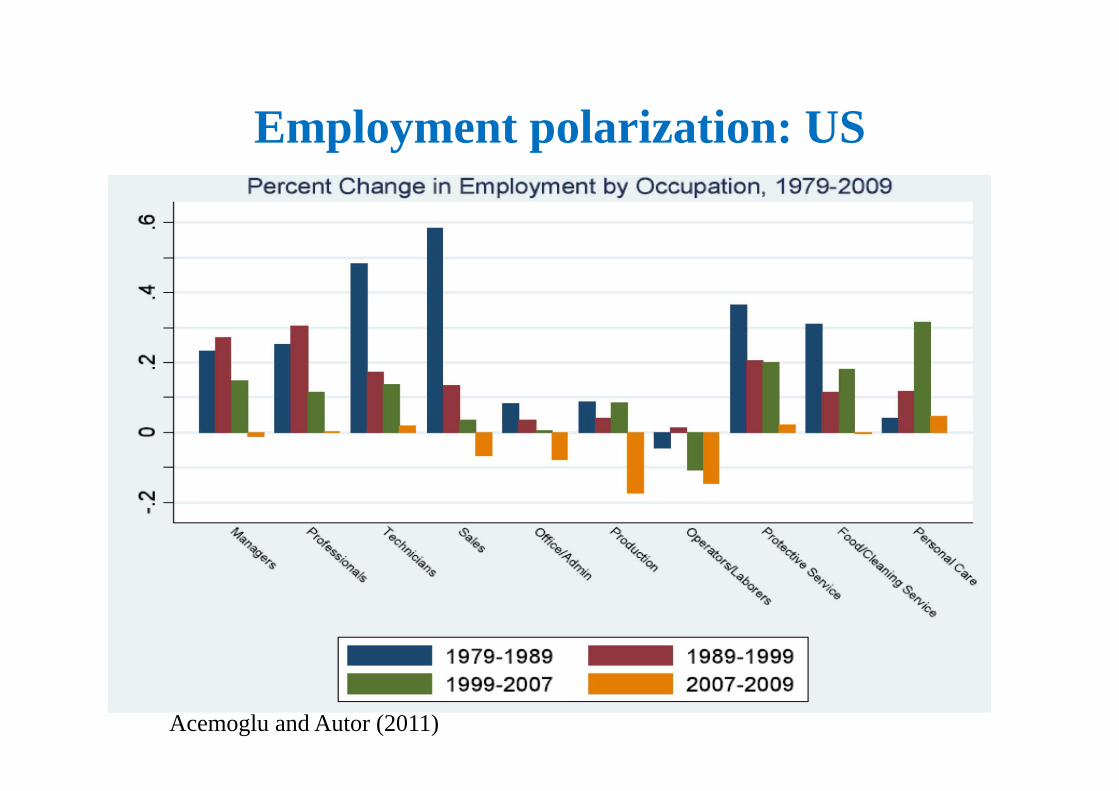
Employment polarization: US
Acemoglu and Autor (2011)
Tasks vs biased technical change• Think not only of skill levels but also of tasks• Single good produced by a continuum of tasks• Three skill levels (L, M and H) and comparative
advantage in the various tasks• Labour market equilibrium: two task-thresholds• Technological change: change the productivity of a
skill group in all tasks or in a particular task• In a task-based model technological change can
reduce the wages of certain categories of workers
Cyclical variations
Cyclical variationsBonhomme and Hospido (2017)
• Spain 1990-2010, male earnings• Earnings inequality strongly countercyclical• Wage sensitivity to the cycle has been strongest in
the middle of the earnings distribution
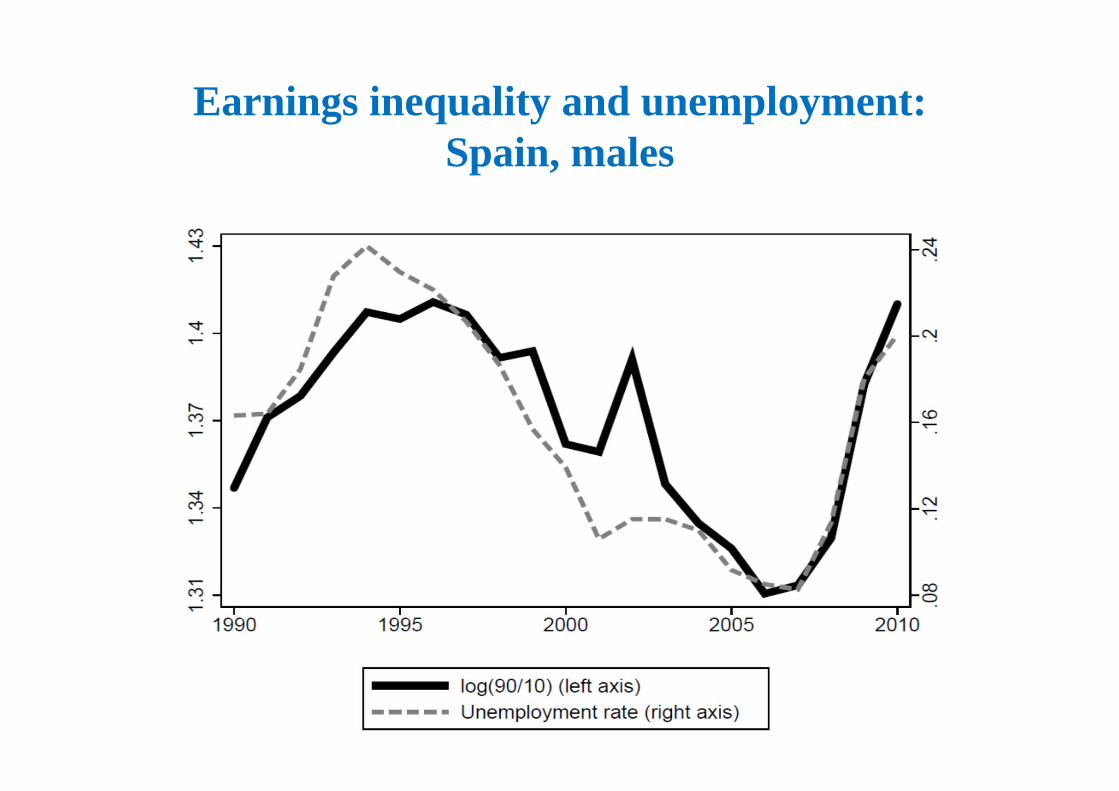
Earnings inequality and unemployment:Spain, males
Bonhomme and Hospido (2017)• From
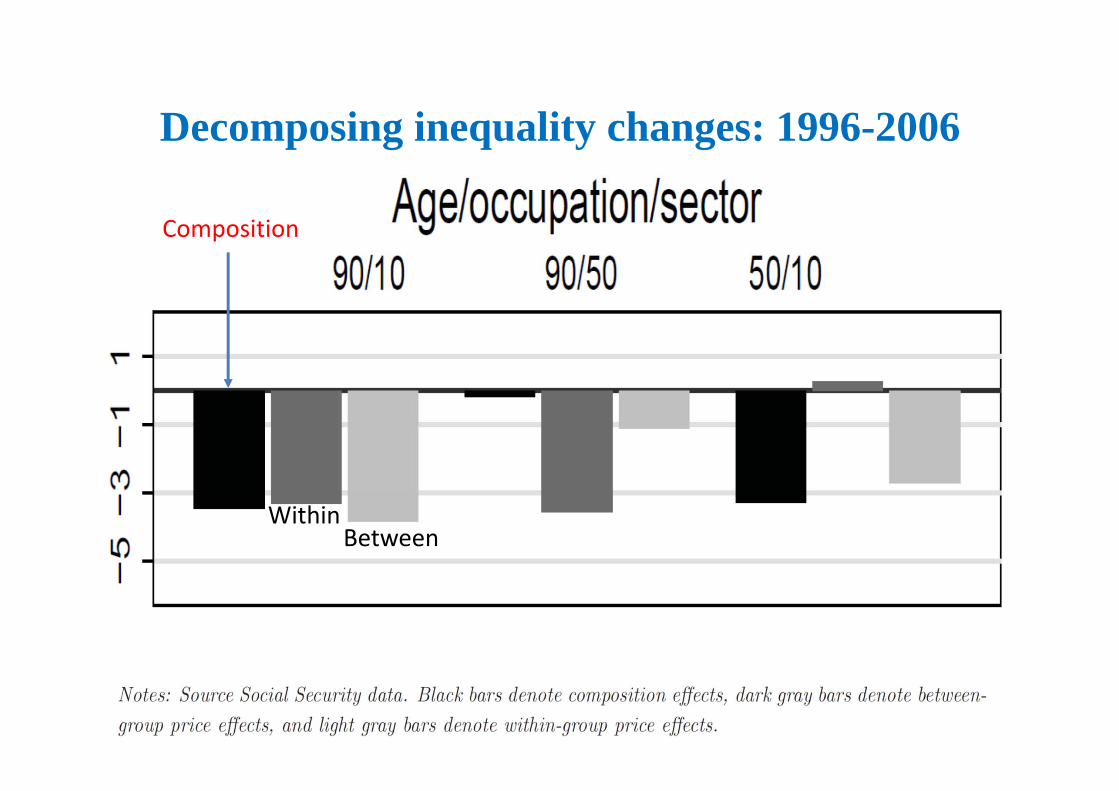
Decomposing inequality changes: 1996-2006
Composition
WithinBetween
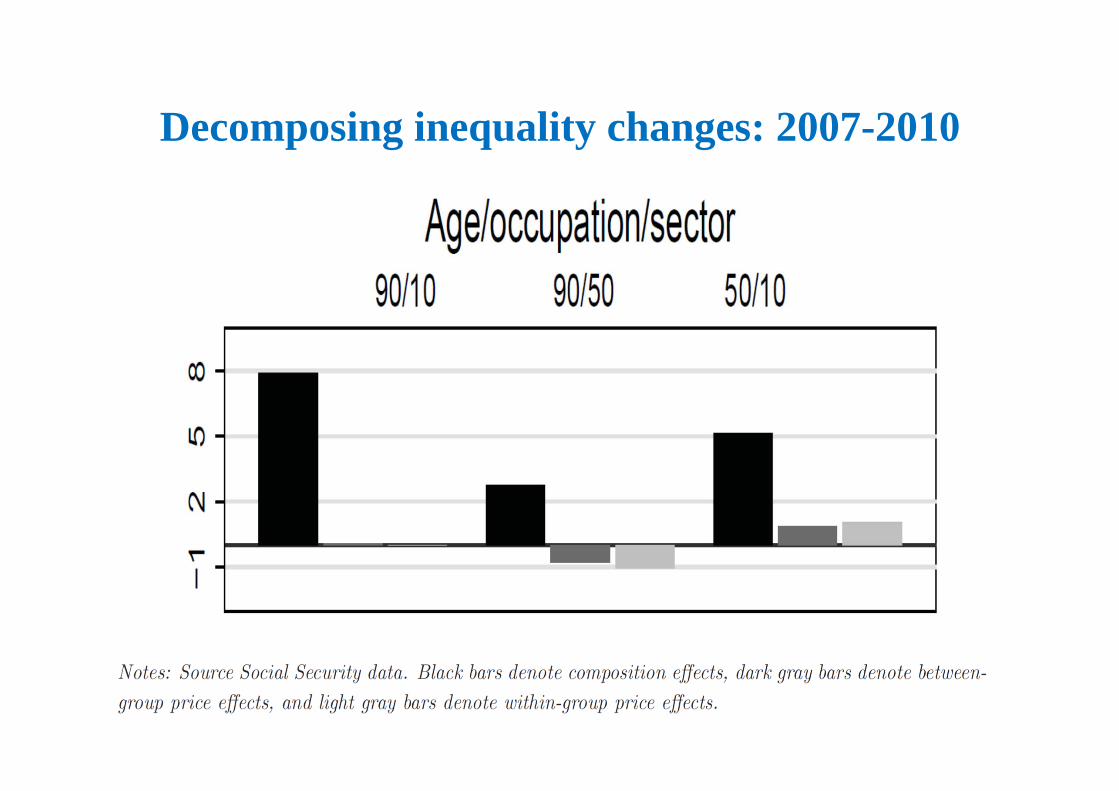
Decomposing inequality changes: 2007-2010
Earnings inequality and unusual shocks
Earnings inequality and unusual shocksArellano, Blundell and Bonhomme (2017)
• Consider alternative ways of modelling earnings persistence at the individual level
• Key element: impact of past shocks on current earnings can be altered by the size and sign of new shocks
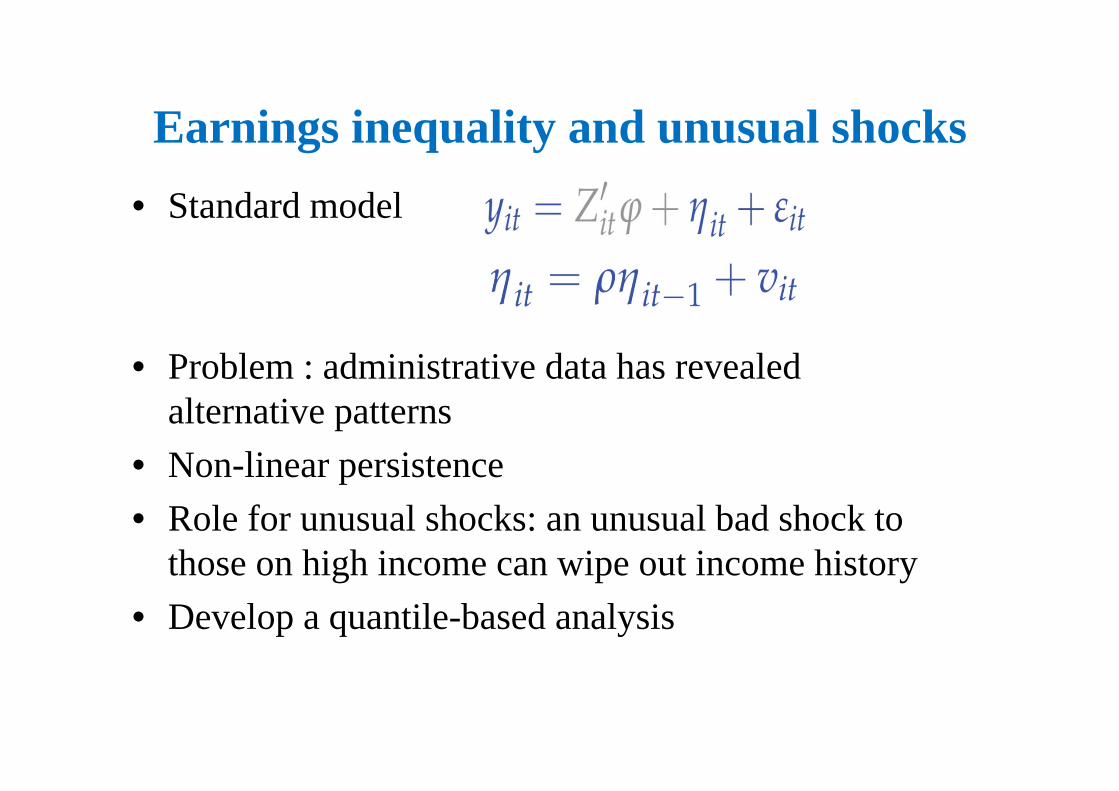
Earnings inequality and unusual shocks• Standard model
• Problem : administrative data has revealed alternative patterns
• Non-linear persistence• Role for unusual shocks: an unusual bad shock to
those on high income can wipe out income history• Develop a quantile-based analysis
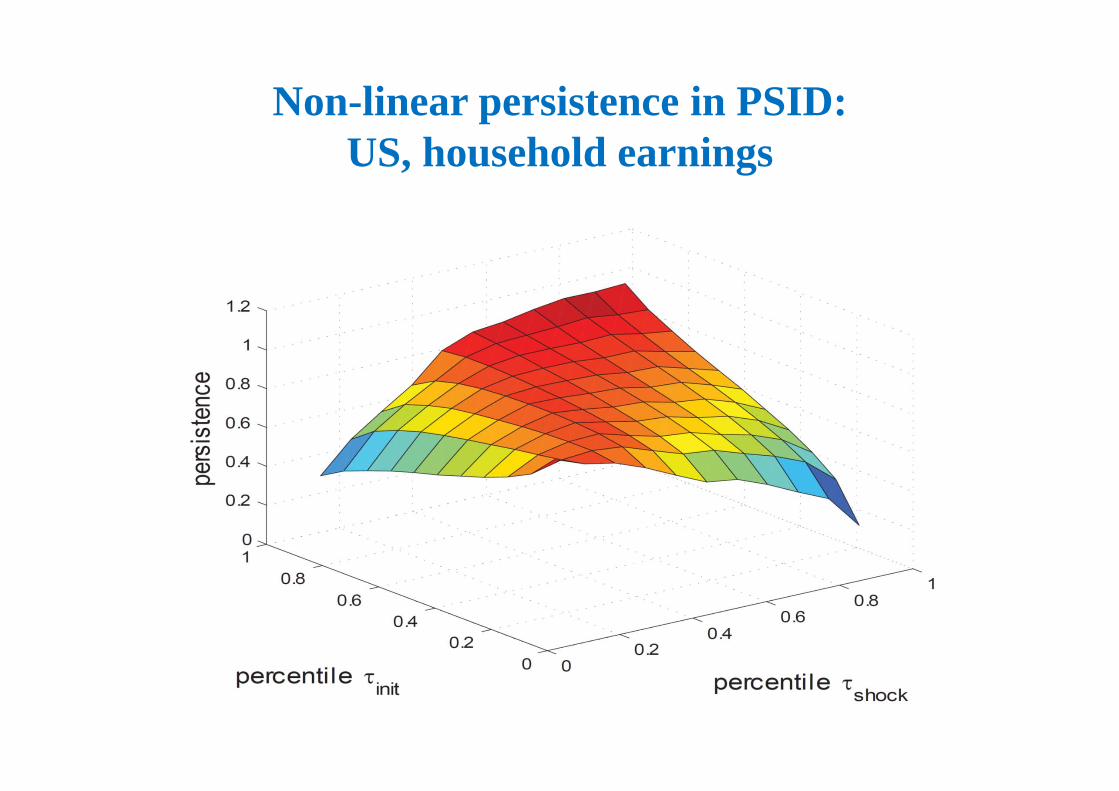
Non-linear persistence in PSID: US, household earnings
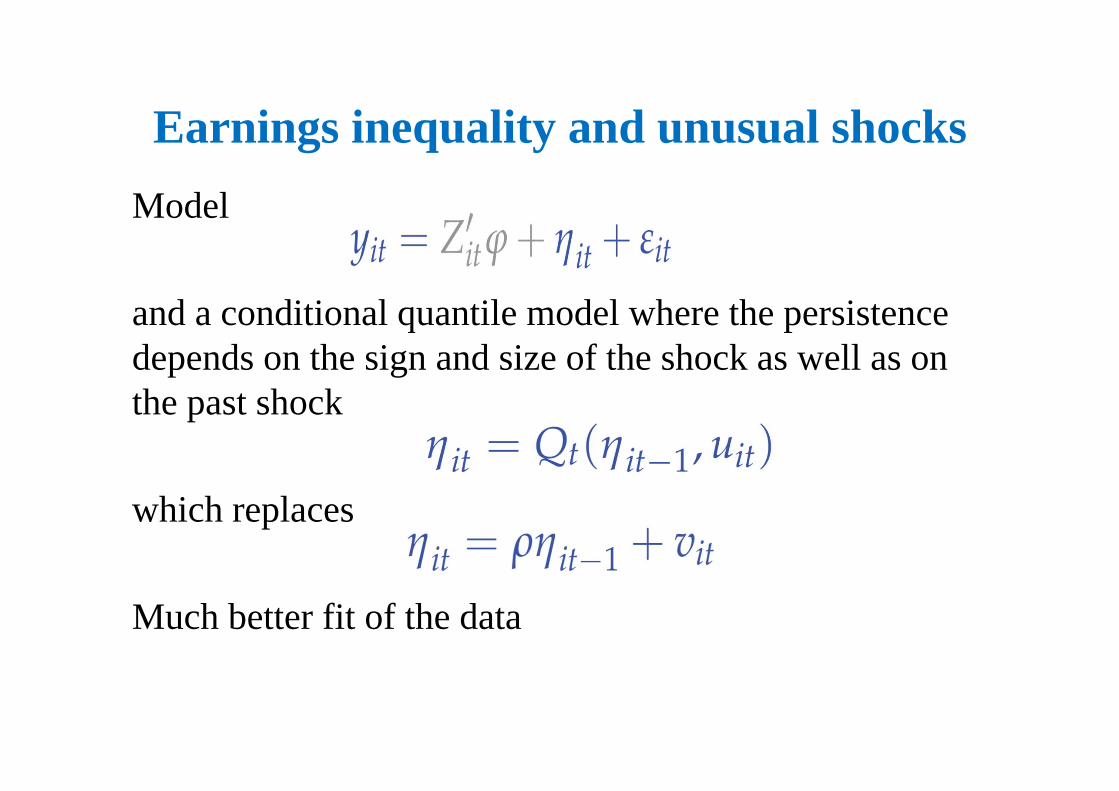
Earnings inequality and unusual shocksModel
and a conditional quantile model where the persistence depends on the sign and size of the shock as well as on the past shock
which replaces
Much better fit of the data
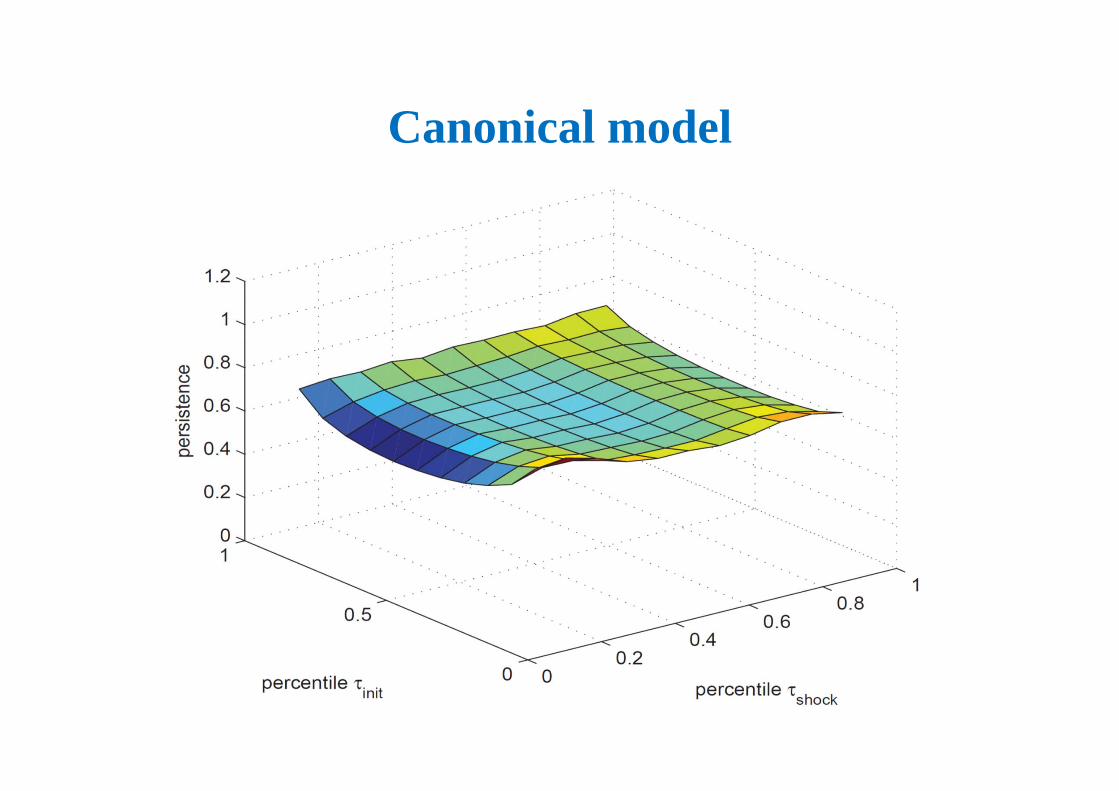
Canonical model
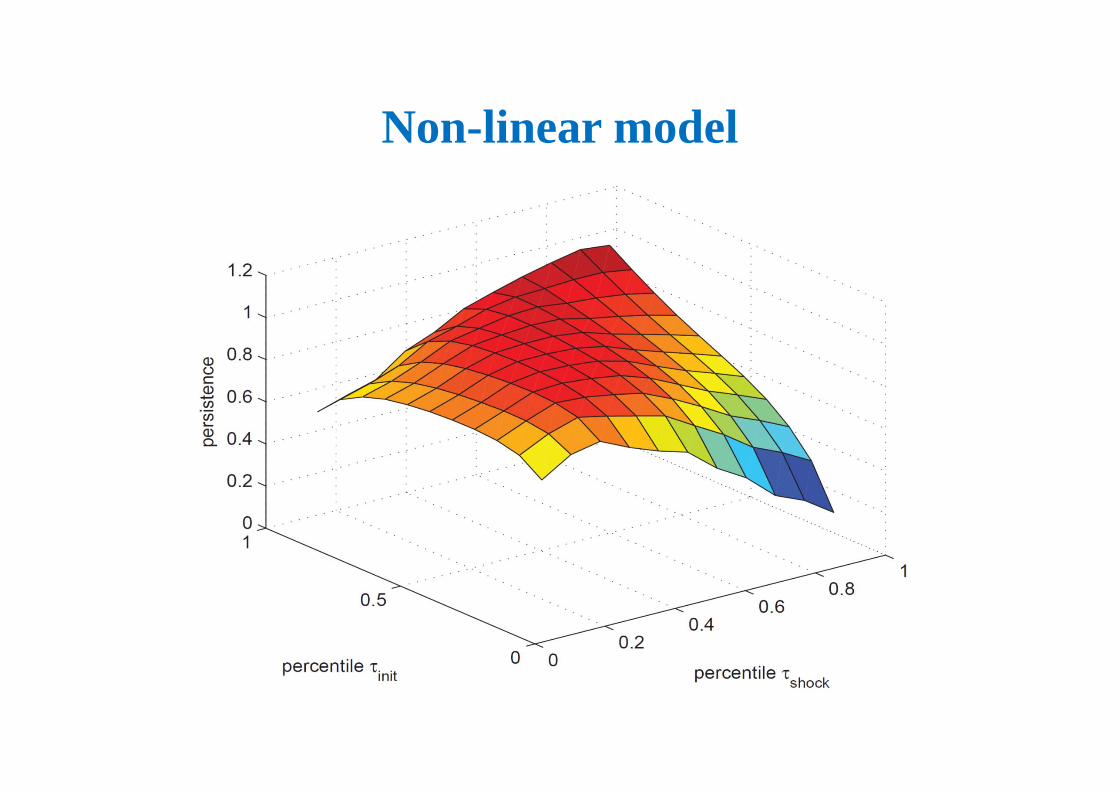
Non-linear model
Earnings Inequality and the Gender Pay Gap
Earnings Inequality and the Gender Pay Gap
Mulligan and Rubinstein (2008)• Implications of increasing wage inequality for the
gender earnings gap• Growing wage inequality within gender should cause
women to invest more in their market productivity and should differentially pull able women into the workforce.
• US data (CPS) for the 1970s and 1990s
Earnings Inequality and the Gender Pay Gap
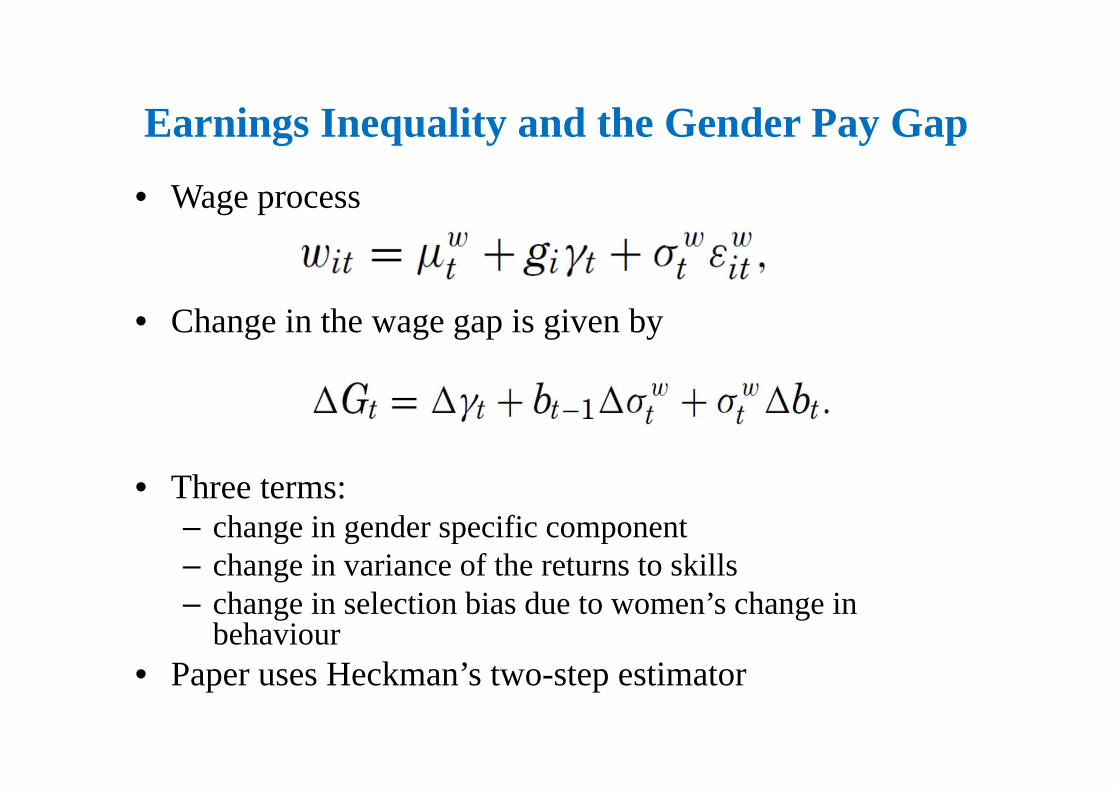
• Wage process
• Change in the wage gap is given by
• Three terms: – change in gender specific component – change in variance of the returns to skills– change in selection bias due to women’s change in
behaviour• Paper uses Heckman’s two-step estimator
Earnings Inequality and the Gender Pay Gap
Earnings Inequality and the Gender Pay Gap
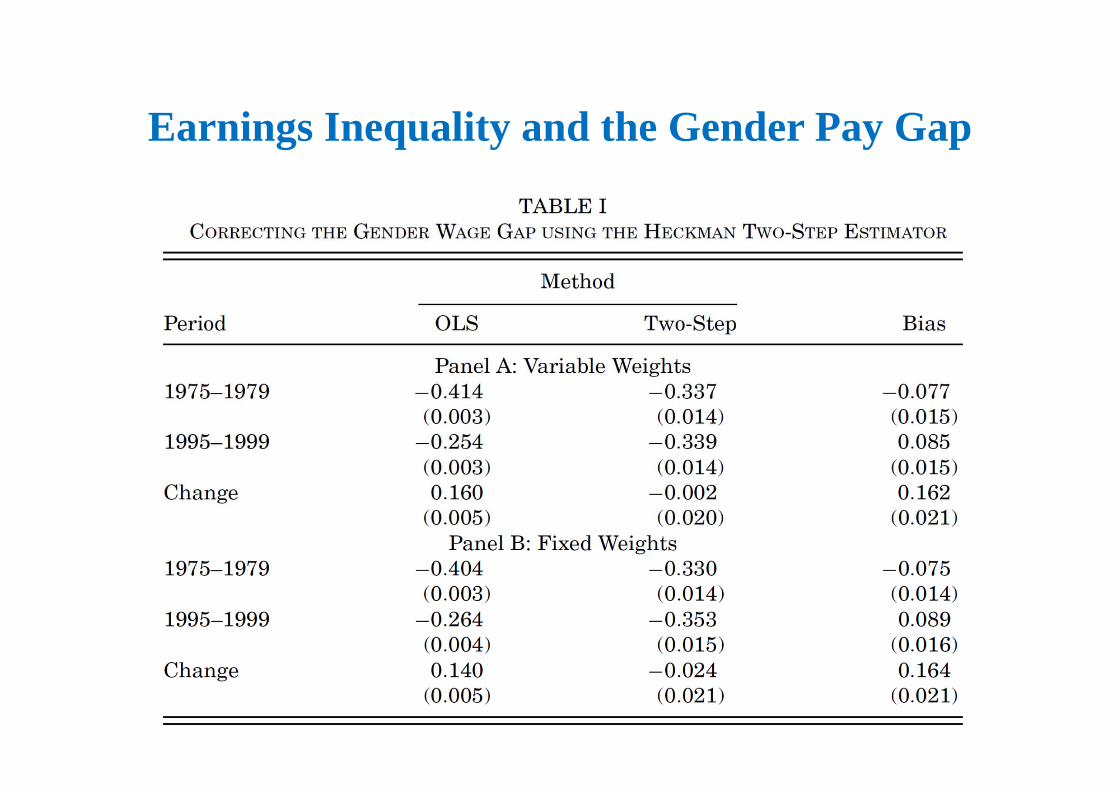
• Selection into the female workforce shifted– negative in the 1970s– positive in the 1990s
• Majority of the apparent narrowing of the gender wage gap reflects changes in female workforce composition
• Findings explain why greater earnings equality between genders coincided with growing inequality within gender
Earnings Inequality and the Gender Pay Gap
Fortin, Bell and Böhm (2017)• What is the effect of increasing earnings inequality at
the top of the distribution for the wage gap• Administrative annual earnings data from Canada,
Sweden, and the United Kingdom• Applies the approach used in the analysis of earnings
inequality in top incomes to the analysis of the gender pay gap.
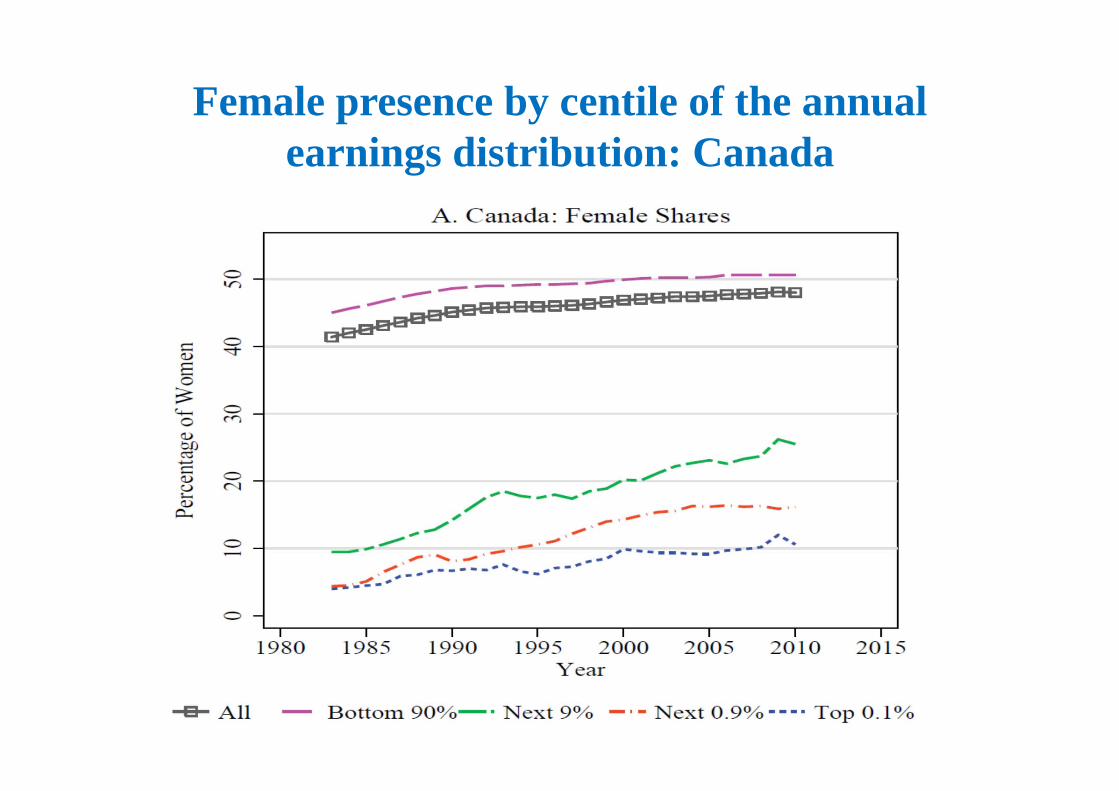
Female presence by centile of the annual earnings distribution: Canada
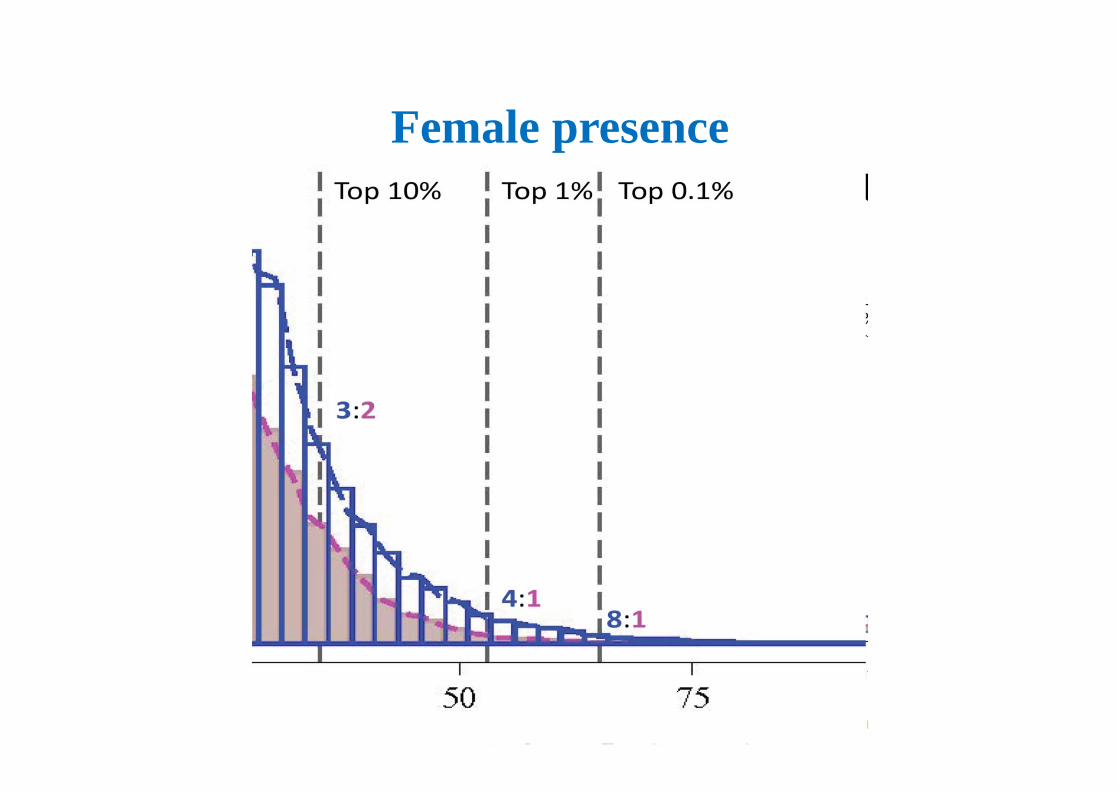
Female presence
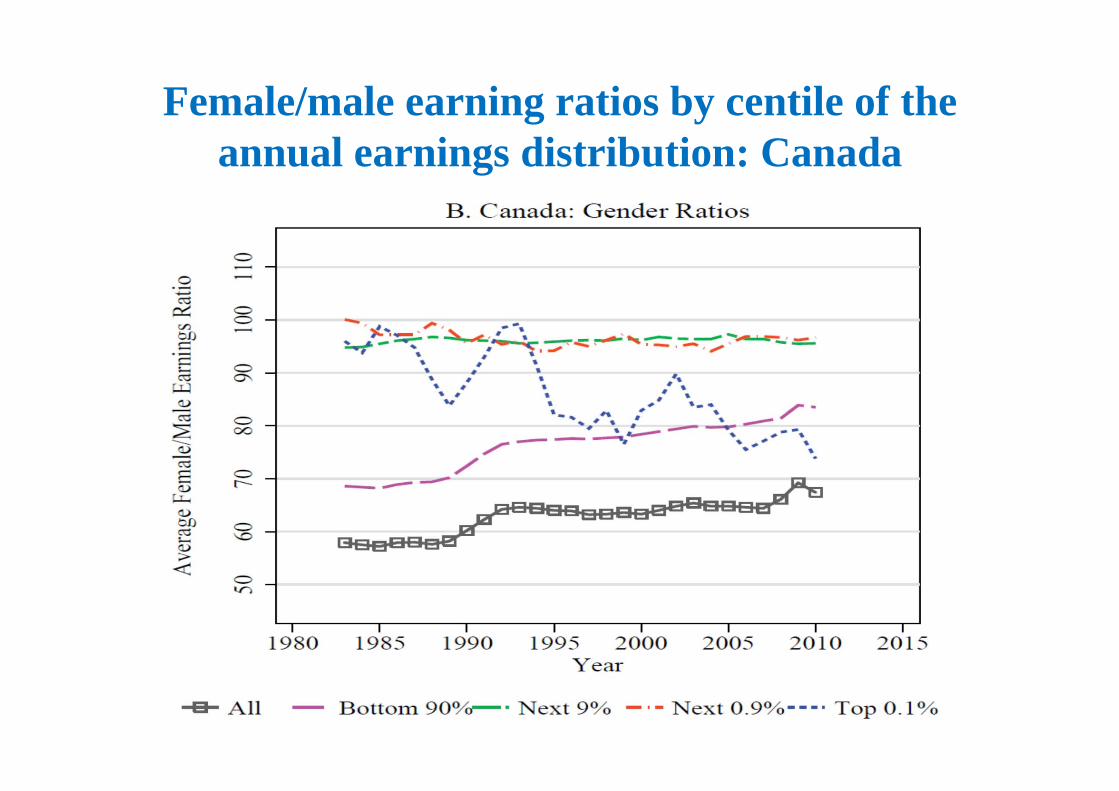
Female/male earning ratios by centile of the annual earnings distribution: Canada
Earnings Inequality and the Gender Pay Gap
• For close to 95% of women the gender earnings ratio is substantially more favourable than the overall ratio
• Women in the next 9% and next 0.9% face even more favourable gender ratio in the upper nineties.
• Glass ceiling effects seem to be increasing only for women in the top 0.1%.
• Increasing inequality in top incomes and the under-representation of women among top earners contributes to slower progress in the gender pay ratio.
Hours inequality
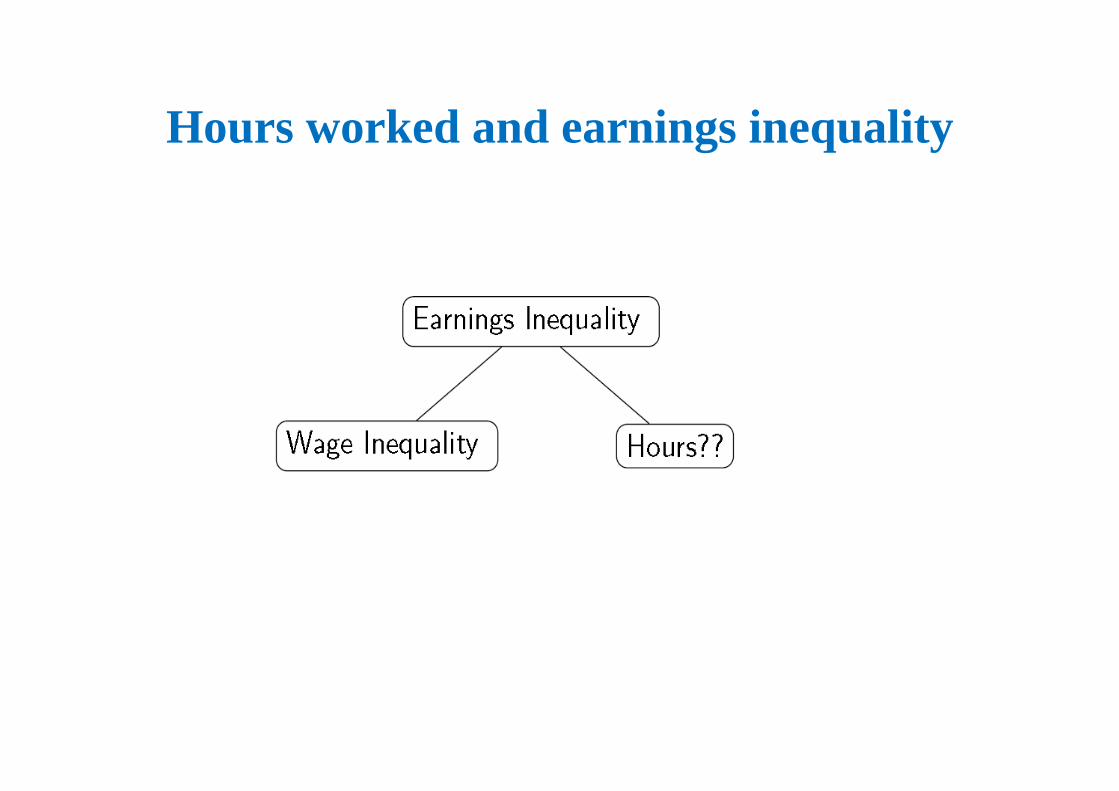
Hours worked and earnings inequality
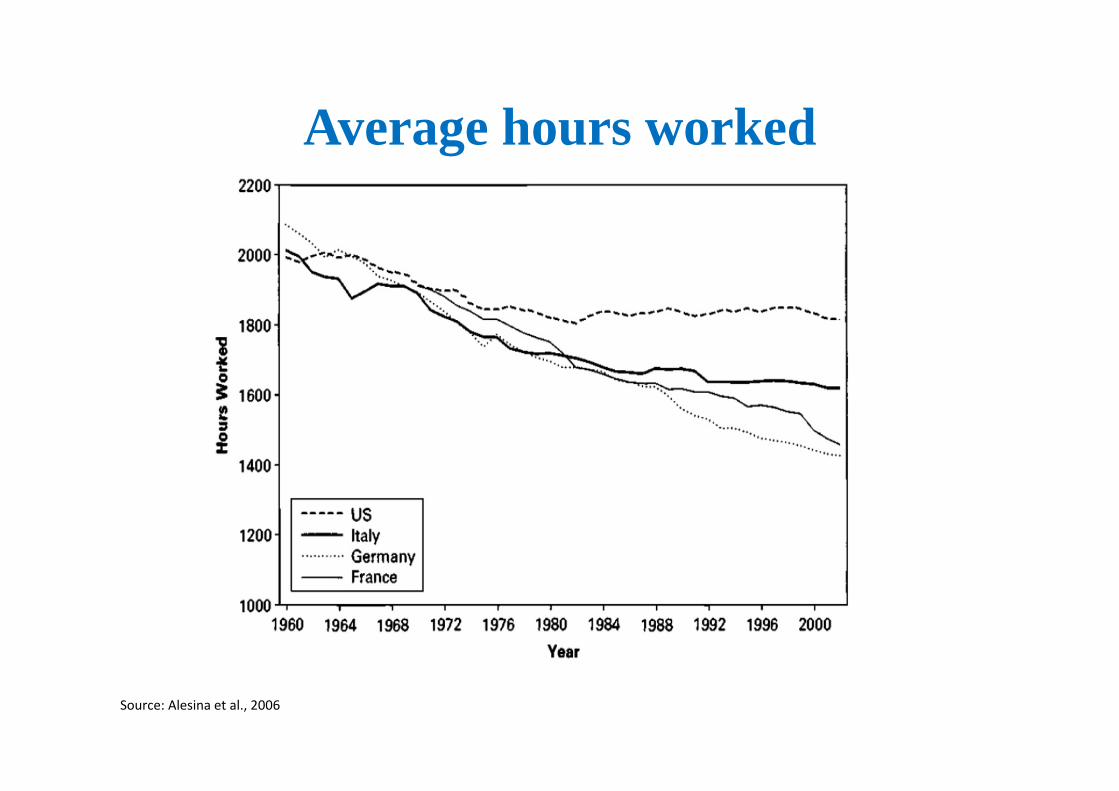
Source: Alesina et al., 2006
Average hours worked
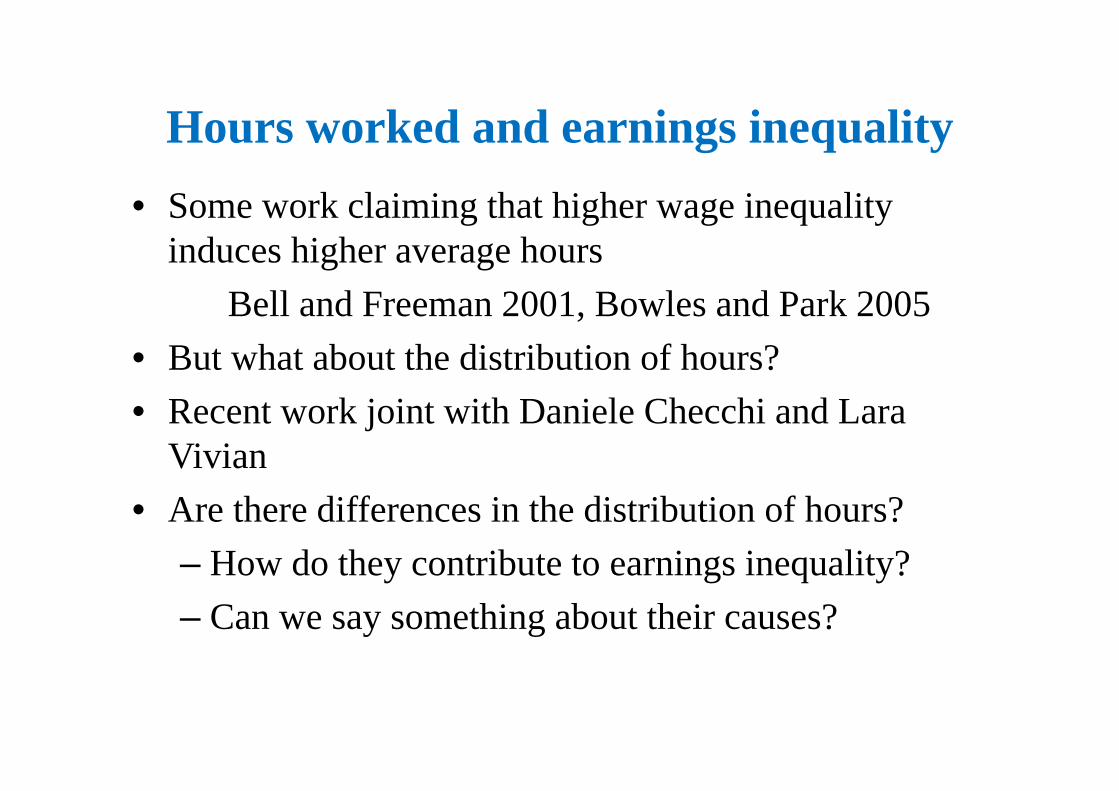
Hours worked and earnings inequality• Some work claiming that higher wage inequality
induces higher average hours Bell and Freeman 2001, Bowles and Park 2005
• But what about the distribution of hours?• Recent work joint with Daniele Checchi and Lara
Vivian• Are there differences in the distribution of hours?
– How do they contribute to earnings inequality?– Can we say something about their causes?
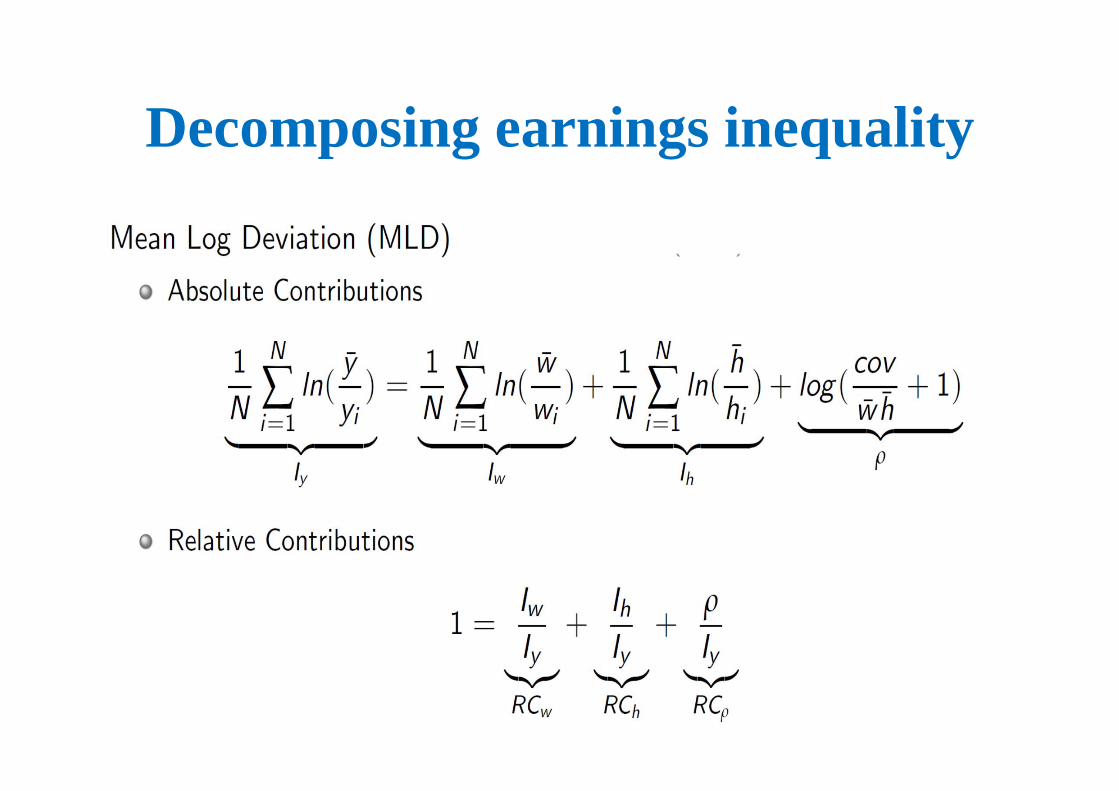
Decomposing earnings inequality
The data4 countries over the period 1990-2012
– US Current Population Survey– UK British Household Panel + Understanding Society– Germany German Socio-Economic Panel– France Labour Force Survey
Main variables– Gross weekly earnings in the main current job– Weekly usual hours worked in the main current job
including overtime (between 2 and 90 hours)– Hourly wage for the representative week considered– Prime-aged workers (25<age<55, no self-employed)
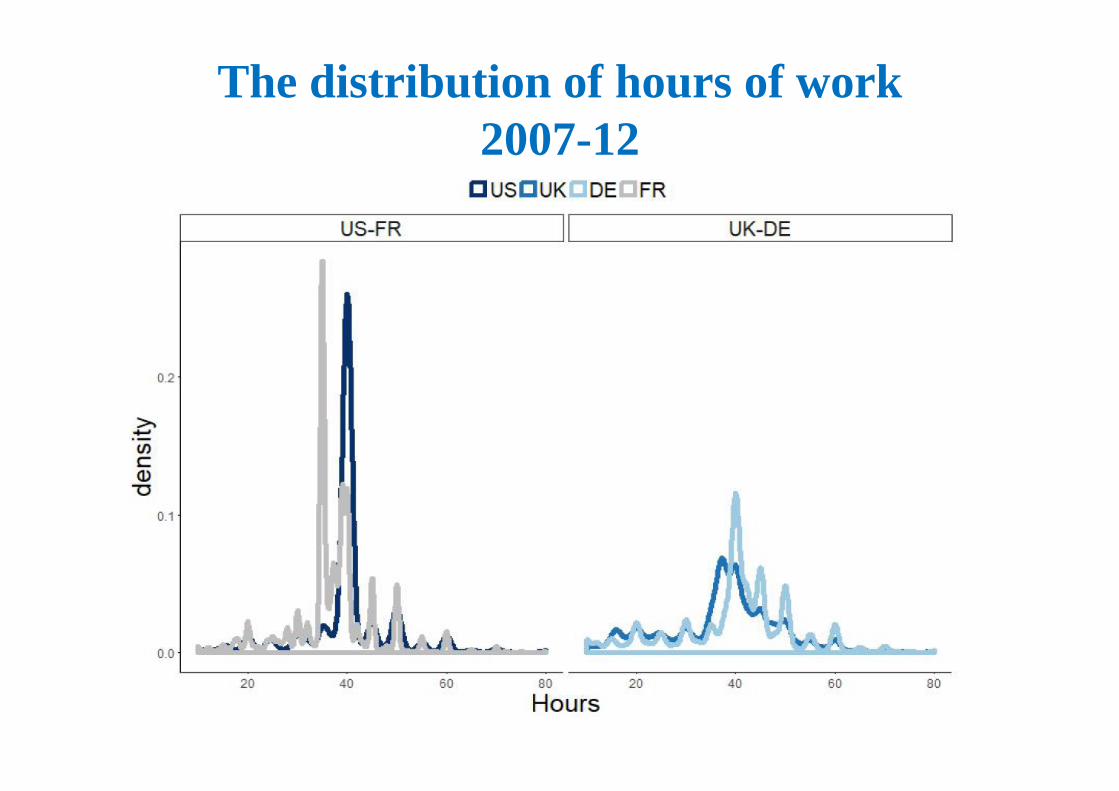
The distribution of hours of work2007-12
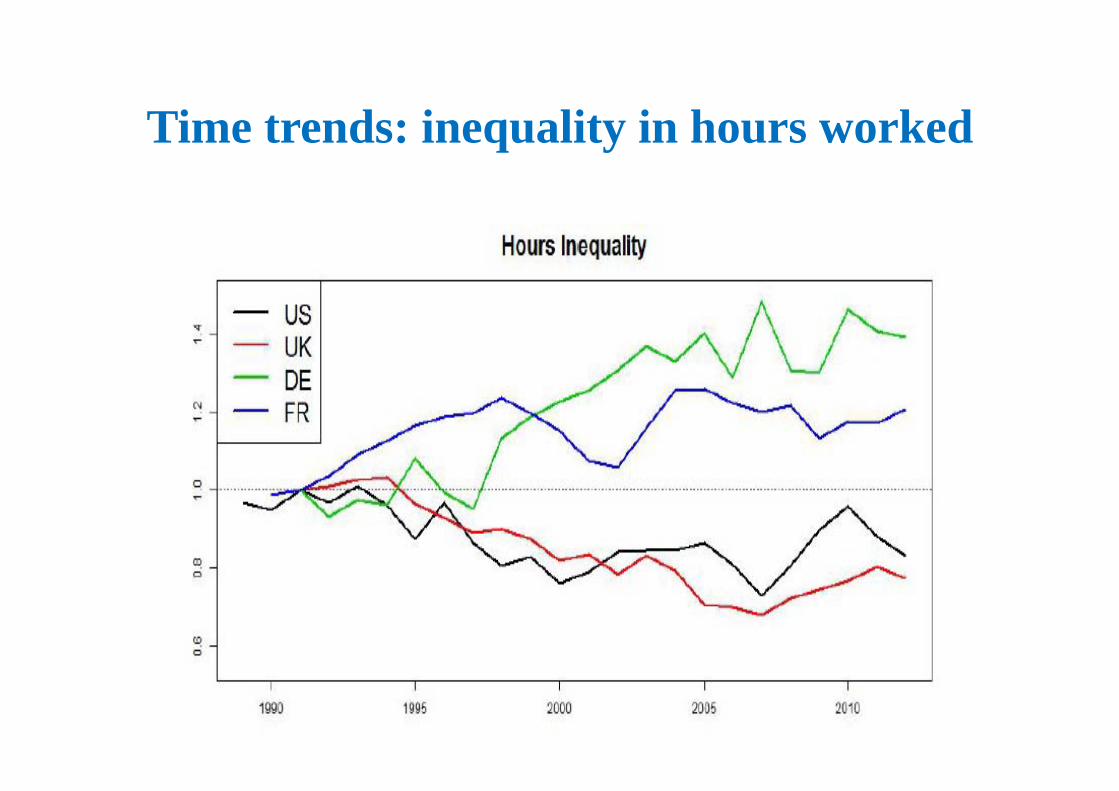
Time trends: inequality in hours worked
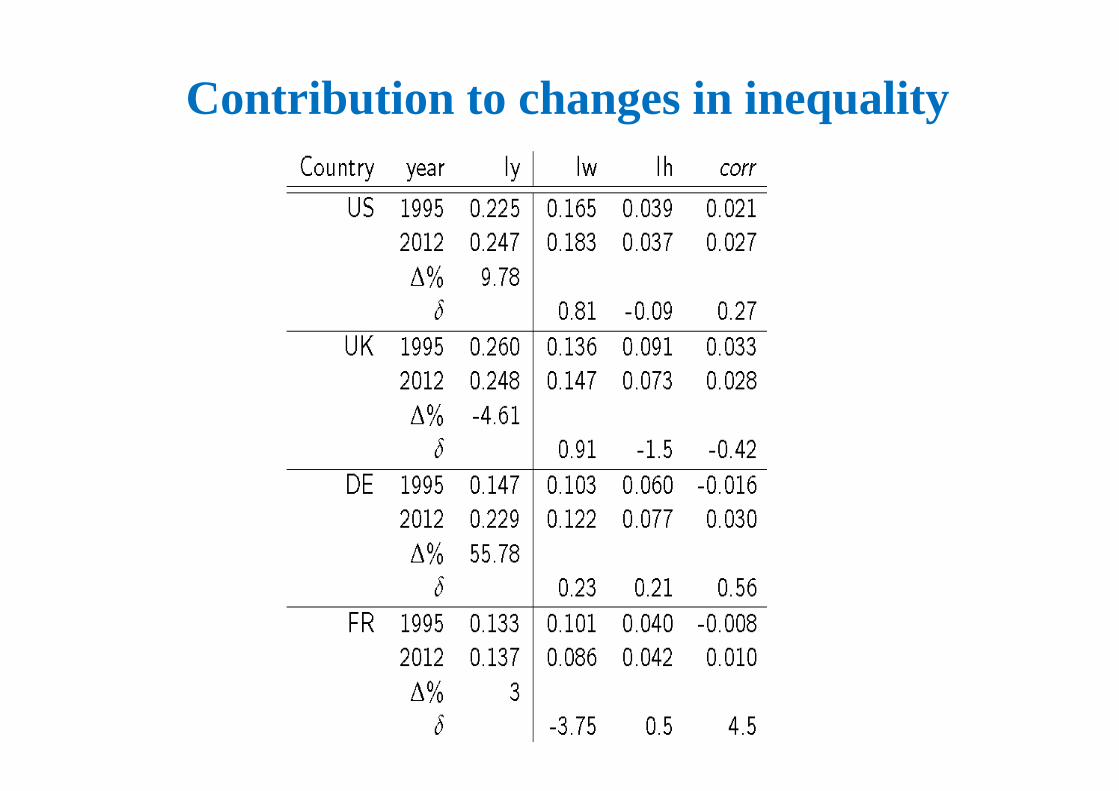
Contribution to changes in inequality
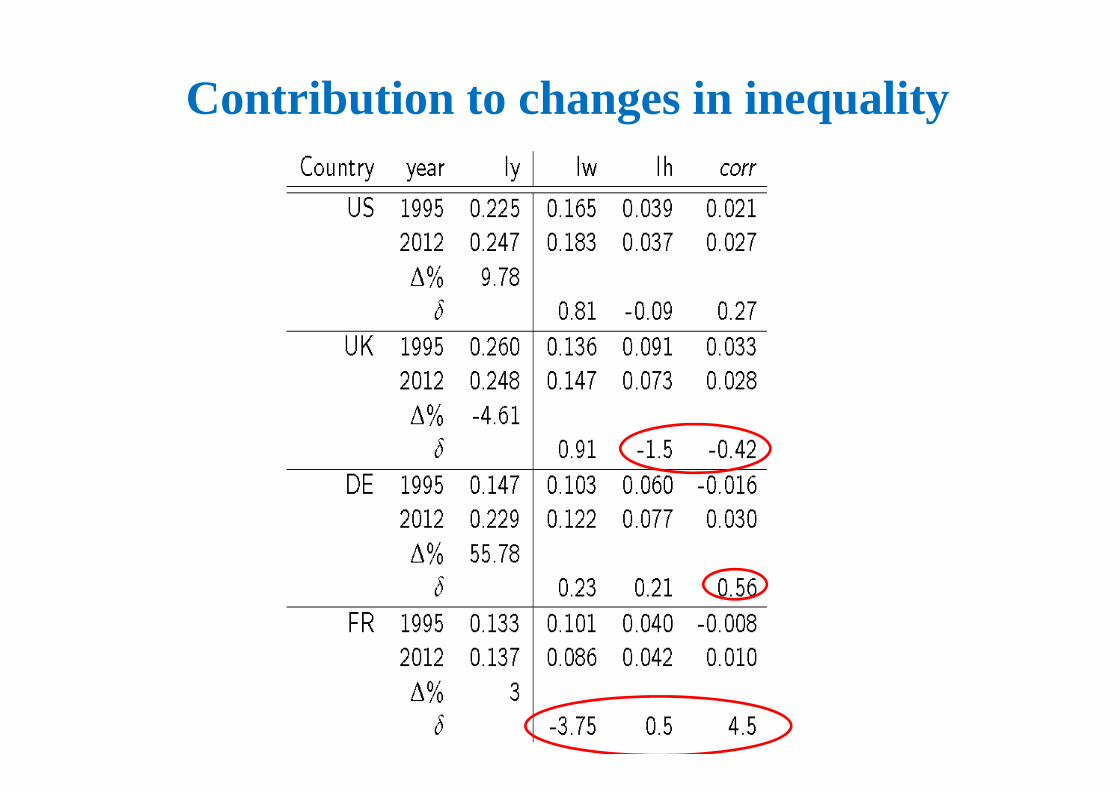
Contribution to changes in inequality
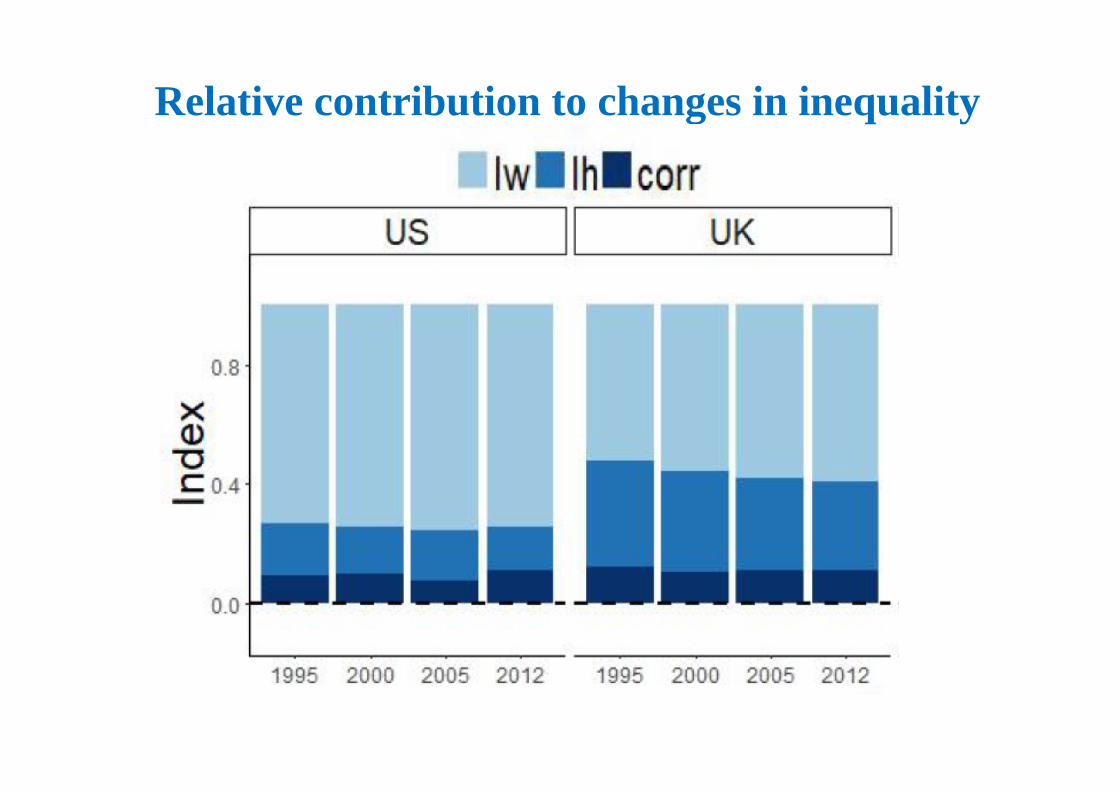
Relative contribution to changes in inequality
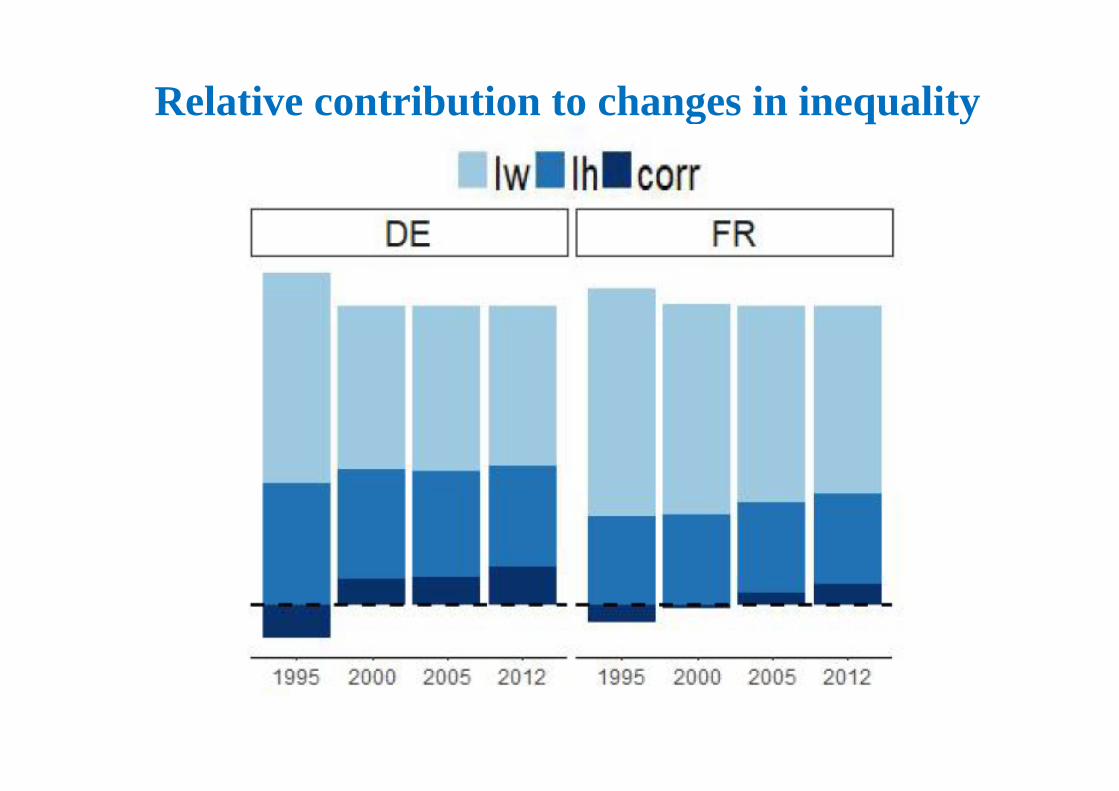
Relative contribution to changes in inequality
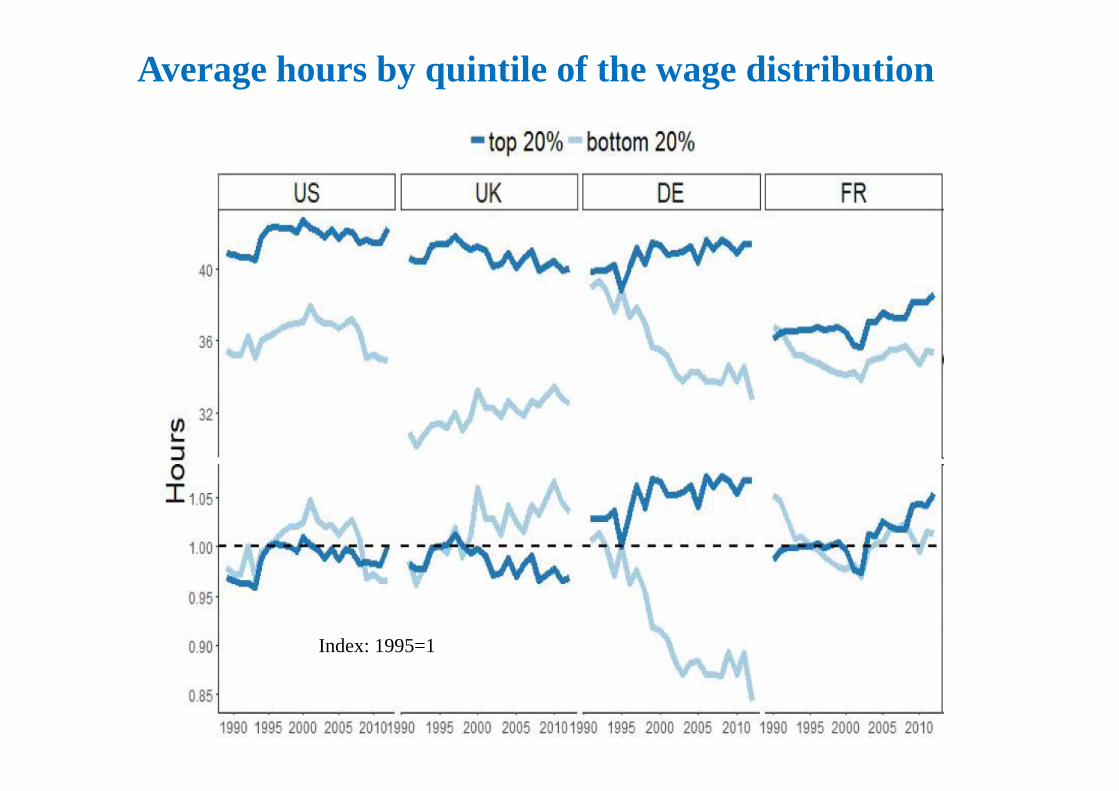
Average hours by quintile of the wage distribution
Index: 1995=1
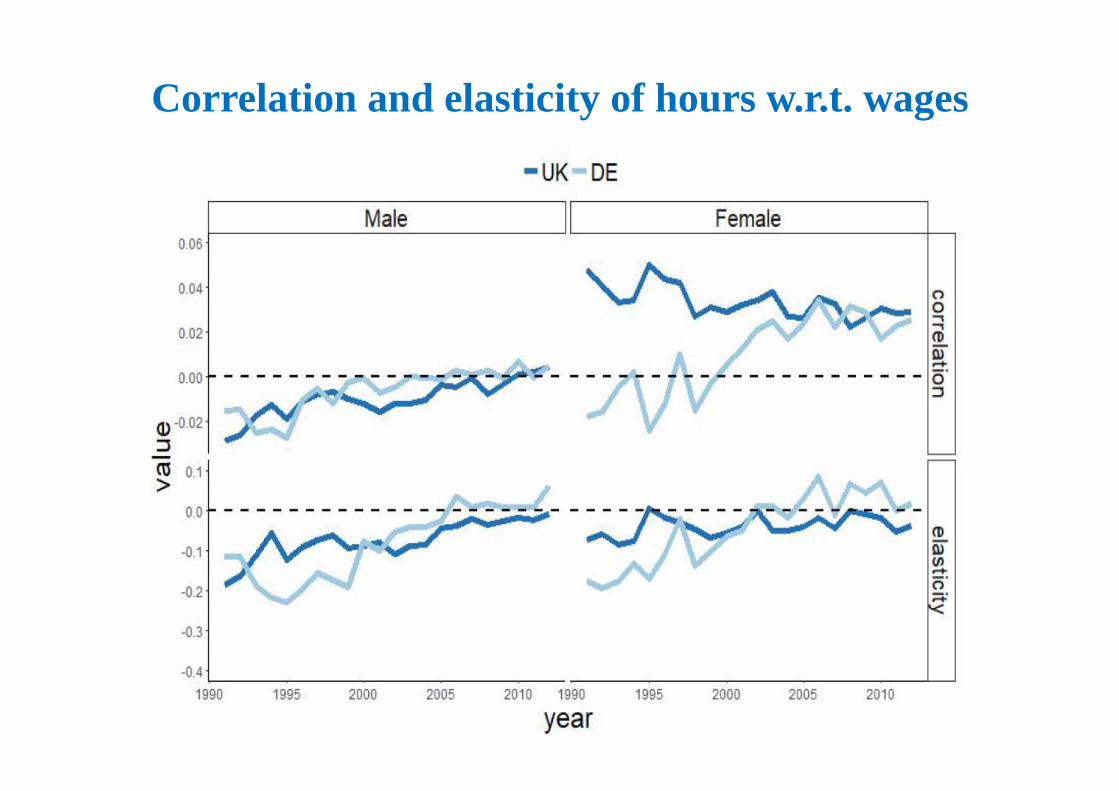
Correlation and elasticity of hours w.r.t. wages
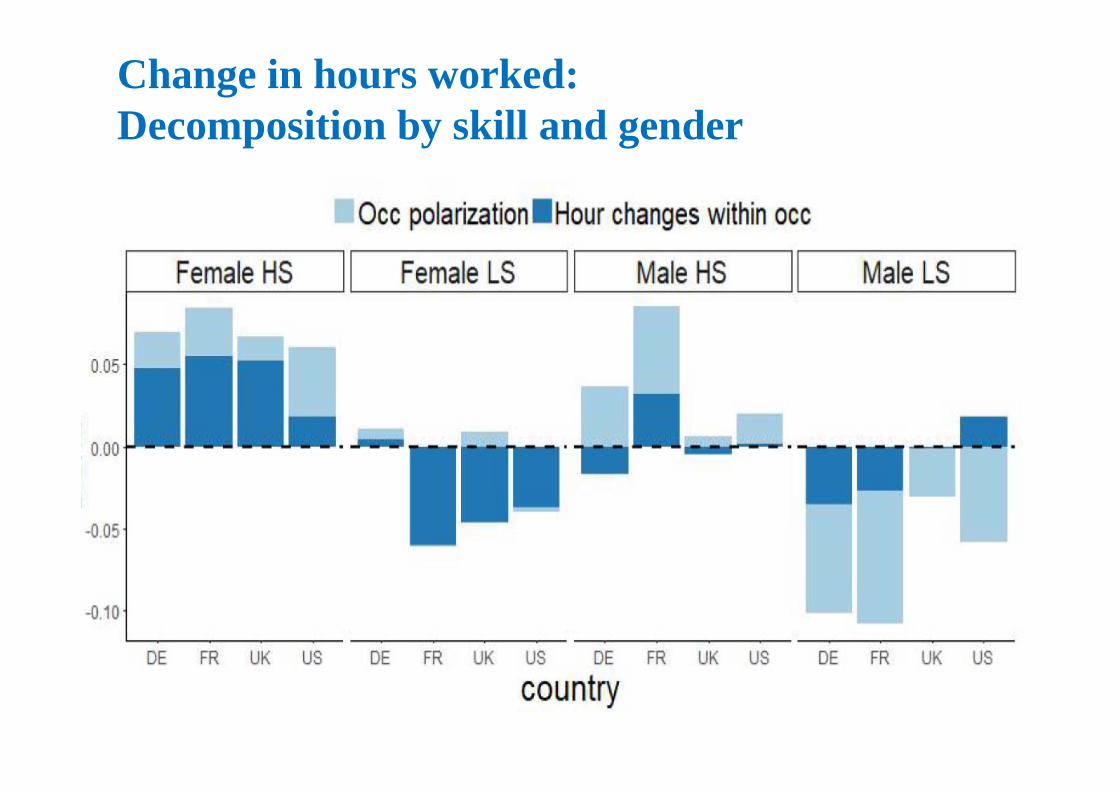
Change in hours worked:Decomposition by skill and gender
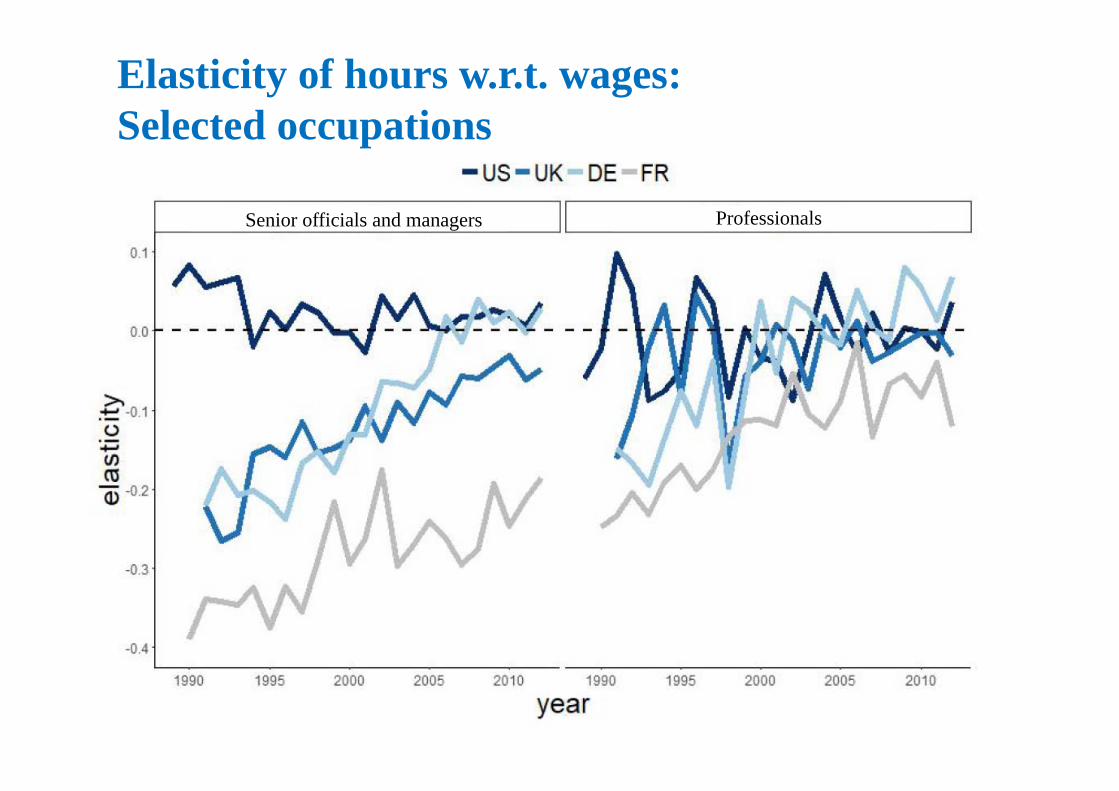
Elasticity of hours w.r.t. wages:Selected occupations
Senior officials and managers Professionals
Conclusions of the paper• Hours inequality contributes up to 50% of total
dispersion• Importance of change in the hours-wage correlation
In some countries, it has moved from having an equalizing effect to having an unequalising one
• Need to understand what determines hours worked– Are a low hours chosen?– Are they a characteristic of certain jobs?
• Caveat – are low hours always bad for equality? German case
Conclusions of the lecture• Earnings inequality surprisingly non-monotonic
– Very different story if we look at the skill premium or annual earnings
• Secular trends that need to be explained– still need for new theories (task?)
• Better data allows us to look at short-term effects – raised questions about the cyclicality of earnings
dispersion– What are the implications of this cyclicality?
Conclusions of the lecture• What are the implications of is this cyclicality?
– unusual shocks can have long-term impacts• Growing earnings dispersion has had consequences
for the gender ratio– changed the sign of the employment bias reducing
the gender gap– but increased this gap for top incomes
• Hours inequality contributes considerably to earnings dispersion – need to understand its dynamics
Additional tables and figures
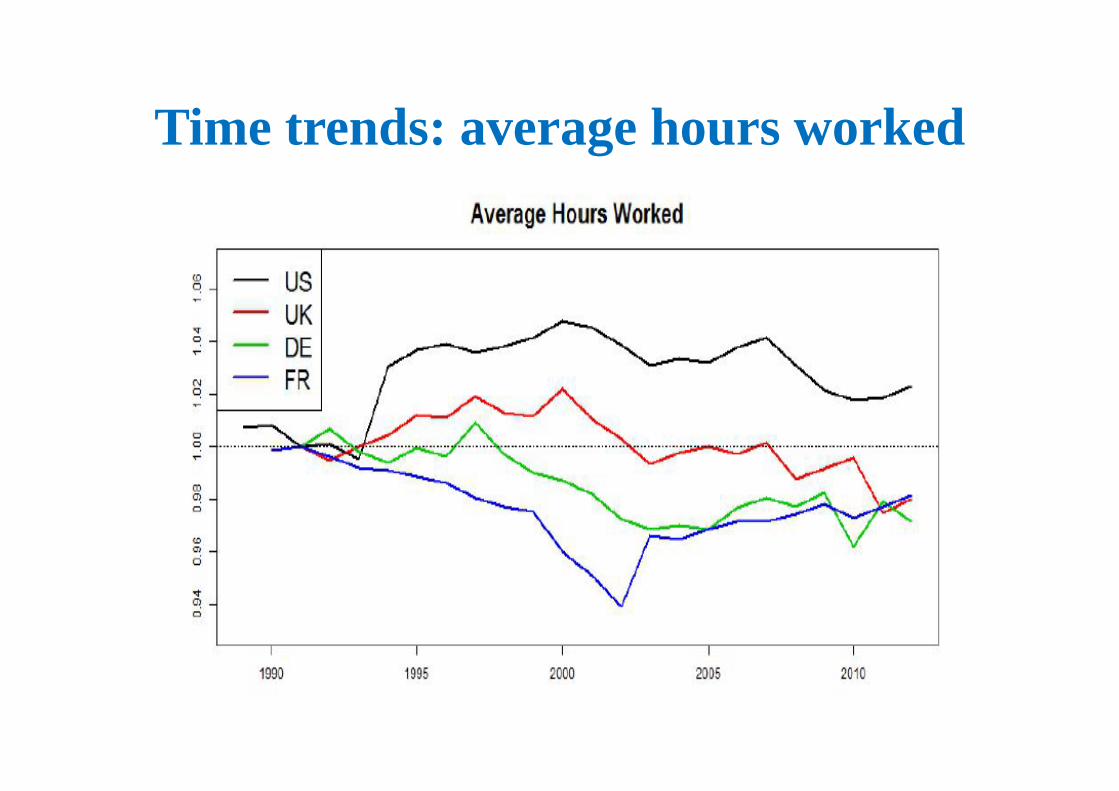
Time trends: average hours worked
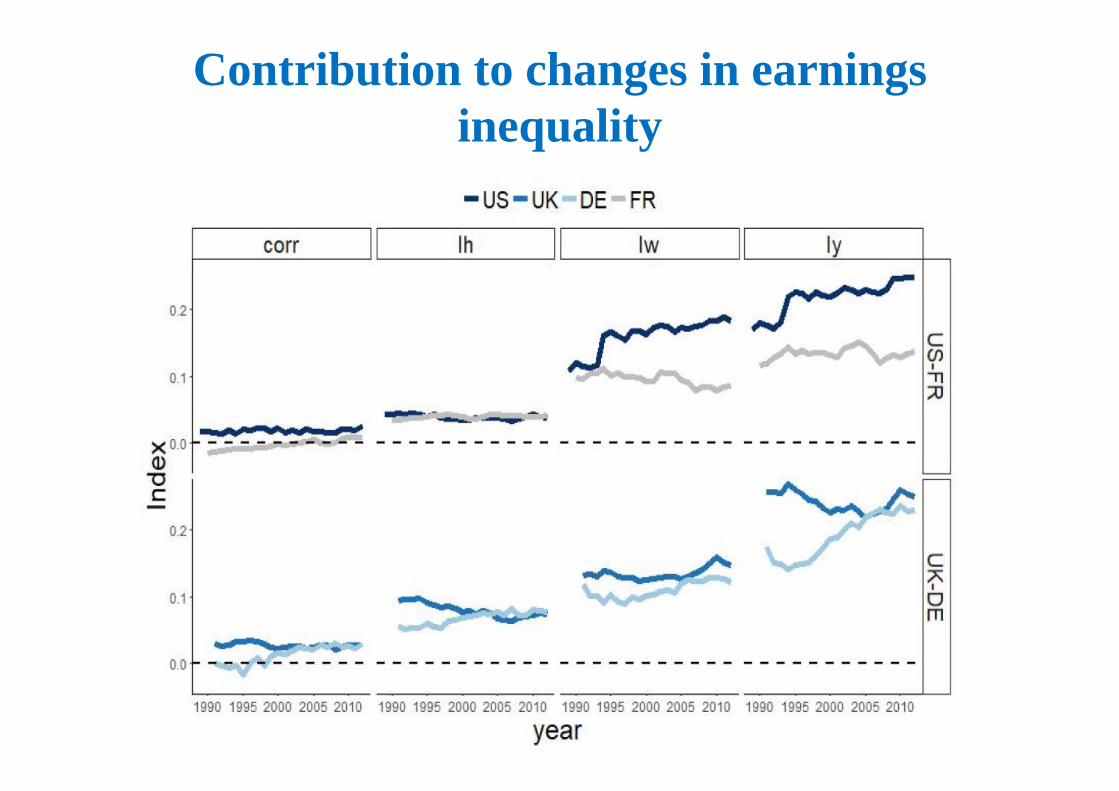
Contribution to changes in earnings inequality
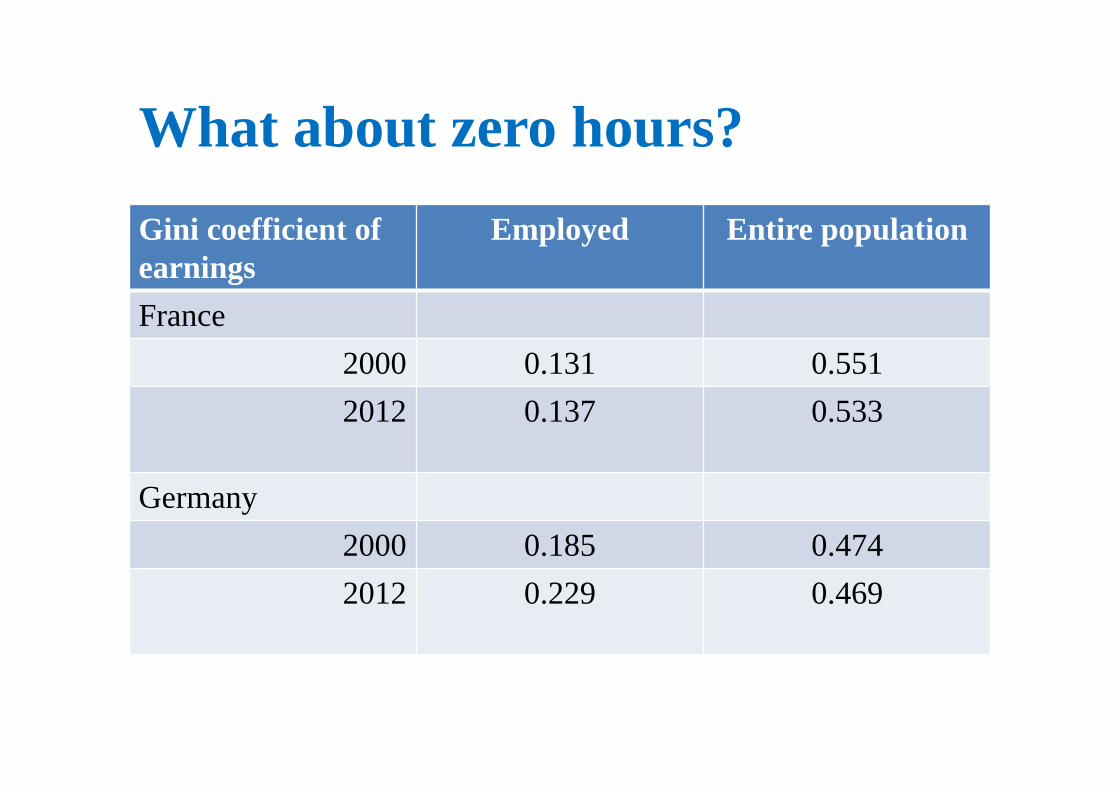
What about zero hours?Gini coefficient of earnings
Employed Entire population
France2000 0.131 0.5512012 0.137 0.533
Germany2000 0.185 0.4742012 0.229 0.469
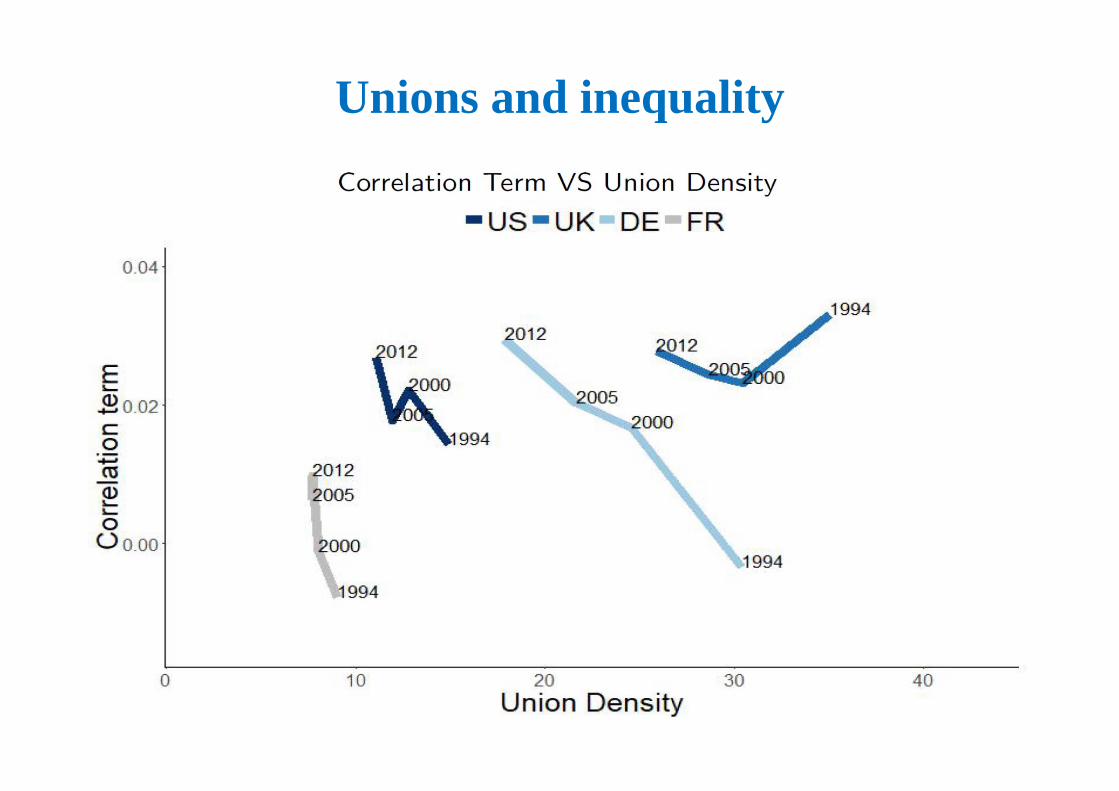
Unions and inequality