early release of selected estimates based on data from ... from the national health interview survey...
TRANSCRIPT

Early Release of Selected Estimates Based on Data From the 2015 National Health Interview Survey
Brian W. Ward, Ph.D., Tainya C. Clarke, Ph.D., Colleen N. Nugent, Ph.D., and Jeannine S. Schiller, M.P.H.Division of Health Interview Statistics, National Center for Health Statistics
About This Early Release In this release, the National Center for Health Statistics (NCHS) updates estimates for 15 selected health
measures based on data from the 2015 National Health Interview Survey (NHIS) and presents estimates from 1997 through 2014 for comparison. The 15 Early Release measures are being published prior to final dataediting and final weighting to provide access to the most recent information from NHIS. The estimates will beupdated as each new quarter of NHIS data becomes available.
Two additional periodical reports are published through the Early Release Program. Health Insurance Coverage: Early Release of Estimates From the National Health Interview Survey (1) is published quarterly and provides additional estimates of health insurance coverage. Wireless Substitution: Early Release of Estimates From the National Health Interview Survey (2) is published twice a year and provides selectedestimates of telephone coverage. Other Early Release reports and tabulations on special topics are released asneeded. In addition to these reports, preliminary microdata files containing selected NHIS variables areproduced as part of the Early Release Program. For each data collection year (January through December),these variables are made available in four files approximately 5 to 6 months following the completion of datacollection for the quarter. NHIS data users can analyze these files through the NCHS Research Data Centerwithout having to wait for the final annual NHIS microdata files to be released about June following the end ofthe data collection year.
The 15 measures included in the present report are lack of health insurance coverage and type ofcoverage, having a usual place to go for medical care, obtaining needed medical care, receipt of influenza vaccination, receipt of pneumococcal vaccination, obesity, leisure-time physical activity, current cigarettesmoking, alcohol consumption, human immunodeficiency virus (HIV) testing, general health status, personalcare needs, serious psychological distress, diagnosed diabetes, and asthma episodes and current asthma.Three of these measures (lack of health insurance coverage, leisure-time physical activity, and current cigarette smoking) are directly related to Healthy People 2020 (3) Leading Health Indicators.
For each selected health measure, a figure is presented showing the trend over time from 1997 through2015 for the total population, followed by figures and tables showing estimates by age group and sex, based on data from the 2015 NHIS. Estimates (which may be adjusted by age, sex, or both, where appropriate) alsoare provided for three race/ethnicity groups—Hispanic; non-Hispanic white, single race; and non-Hispanicblack, single race—using data from the 2015 NHIS. Some measures may include additional tables or figures.Key findings are highlighted by bullets, and data tables containing the values displayed in the figures, alongwith additional age-adjusted estimates, are included at the end of each section.
The NHIS questions used to define the selected health measures are provided in an Appendix. Technical Notes at the end of the report provide details on data source, transition to weights based on the 2000 and 2010 U.S. censuses, implementation of a new sample design, estimation procedures, significance testing,adjustment for age and sex, race/ethnicity categories, health insurance, influenza vaccination, alcohol consumption, HIV testing, and serious psychological distress.
Estimates based on 2015 data were calibrated to 2010 census-based population estimates for sex, age,and race/ethnicity of the U.S. civilian noninstitutionalized population. More information on weighting can befound in Technical Notes.
P ag e | 1 U.S. Department of Health and Human Services ● Centers for Disease Control and Prevention ● National Center for Health Statistics ● Released 05/16

Early Release of Selected Estimates Based on Data From the National Health Interview Survey, 2015
Lack of Health Insurance Coverage and Type of Coverage
Figure 1.1. Percentage of persons of all ages without health insurance coverage at the time of interview: United States, 1997–2015
0
5
10
15
20
1997 1998 1999 2000 2001 2002 2003 2004 2005 2006 2007 2008 2009 2010 2011 2012 2013 2014 2015
Percent 95% confidence interval
NOTES: Data are based on household interviews of a sample of the civilian noninstitutionalized population. A person was defined as uninsured if he or she did not have any private health insurance, Medicare, Medicaid, Children’s Health Insurance Program (CHIP), state-sponsored or other government-sponsored health plan, or military plan at the time of interview. A person was also defined as uninsured if he or she had only Indian Health Service coverage or had only a private plan that paid for one type of service, such as accidents or dental care. The data on health insurance status were edited using an automated system based on logic checks and keyword searches. For comparability, the estimates for all years were created using these same procedures. The resulting estimates of persons without health insurance coverage are generally 0.1–0.3 percentage point lower than those based on the editing procedures used for the final data files. The analyses exclude persons with unknown health insurance status (about 1% of respondents each year). See Technical Notes for more details.
DATA SOURCE: NCHS, National Health Interview Survey, 1997–2015, Family Core component.
For 2015, the percentage uninsured at the time of interview was 9.1% (95% confidence interval =8.70%–9.43%), which was lower than the 2014 estimate of 11.5%.
The percentage uninsured at the time of interview decreased from 16.0% in 2010 to 9.1% in 2015.
P ag e | 2 U.S. Department of Health and Human Services ● Centers for Disease Control and Prevention ● National Center for Health Statistics ● Released 05/16

Early Release of Selected Estimates Based on Data From the National Health Interview Survey, 2015
Table 1.1a. Number of persons without health insurance coverage at the time of interview, by age group: United States, 1997–2015
Year All ages Under 65 years 18–64 years Under 18 years
Number (millions)
1997 41.0 40.7 30.8 9.9
1998 39.3 39.0 30.0 9.1
1999 38.7 38.3 29.8 8.5
2000 41.3 40.8 32.0 8.9
2001 40.2 39.8 31.9 7.9
2002 41.5 41.1 33.5 7.6
2003 43.6 43.2 35.9 7.3
2004 (Method 11) 42.5 42.0 35.0 7.0
2004 (Method 21) 42.1 41.7 34.9 6.8
2005 41.2 41.0 34.4 6.5
2006 43.6 43.3 36.5 6.8
2007 43.1 42.8 36.3 6.5
2008 43.8 43.6 37.1 6.6
2009 46.3 46.0 40.0 6.1
2010 48.6 48.2 42.5 5.8
2011 46.3 45.9 40.7 5.2
2012 45.5 45.2 40.3 4.9
2013 44.8 44.3 39.6 4.8
2014 36.0 35.7 31.7 4.0
2015 28.6 28.4 25.1 3.3
See footnotes at end of table.
P ag e | 3 U.S. Department of Health and Human Services ● Centers for Disease Control and Prevention ● National Center for Health Statistics ● Released 05/16

Early Release of Selected Estimates Based on Data From the National Health Interview Survey, 2015
Table 1.1b. Percentage of persons without health insurance coverage at the time of the interview, by age group: United States, 1997–2015
Year All ages Under 65 years Under 65 years 18–64 years Under 18 years
Percent (95% Crude percent Age-adjusted Percent (95% Percent (95% confidence (95% confidence percent (95% confidence confidence
interval) interval) confidence interval) interval) interval)
15.4 17.4 17.2 18.9 13.9 1997 (15.0-15.8) (16.9-17.9) (16.8-17.7) (18.4-19.4) (13.2-14.6)
14.6 16.5 16.4 18.2 12.7 1998 (14.1-15.1) (16.0-17.0) (15.9-16.9) (17.7-18.7) (12.0-13.4)
14.2 16.0 16.0 17.8 11.8 1999 (13.8-14.6) (15.5-16.5) (15.5-16.5) (17.3-18.3) (11.2-12.4)
14.9 16.8 16.8 18.7 12.3 2000 (14.5-15.3) (16.3-17.2) (16.3-17.3) (18.1-19.2) (11.7-12.9)
14.3 16.2 16.2 18.3 11.0 2001 (13.8-14.8) (15.7-16.7) (15.7-16.7) (17.8-18.8) (10.3-11.7)
14.7 16.5 16.6 19.1 10.5 2002 (14.3-15.1) (16.0-16.9) (16.1-17.1) (18.6-19.6) (9.9-11.1)
15.2 17.2 17.3 20.1 10.1 2003 (14.8-15.7) (16.6-17.7) (16.8-17.8) (19.5-20.6) (9.4-10.7)
2004 14.7 16.6 16.7 19.4 9.6 (Method 11) (14.3-15.2) (16.1-17.0) (16.3-17.2) (18.9-19.9) (9.0-10.2)
2004 14.6 16.4 16.6 19.3 9.4 (Method 21) (14.2-15.0) (16.0-16.9) (16.2-17.1) (18.8-19.8) (8.8-10.0)
14.2 16.0 16.2 18.9 8.9 2005 (13.75-14.58) (15.53-16.46) (15.72-16.65) (18.34-19.38) (8.34-9.49)
14.8 16.8 17.0 19.8 9.3 2006 (14.34-15.34) (16.21-17.33) (16.44-17.57) (19.12-20.42) (8.60-9.92)
14.5 16.4 16.6 19.4 8.9 2007 (13.93-15.08) (15.76-17.05) (15.95-17.28) (18.68-20.09) (8.10-9.66)
14.7 16.7 16.9 19.7 8.9 2008 (14.04-15.27) (15.96-17.36) (16.24-17.63) (18.95-20.51) (8.04-9.73)
15.4 17.5 17.7 21.1 8.2 2009 (14.79-15.96) (16.80-18.12) (17.08-18.42) (20.38-21.83) (7.39-8.97)
16.0 18.2 18.5 22.3 7.8 2010 (15.46-16.52) (17.58-18.77) (17.87-19.07) (21.57-22.95) (7.12-8.39)
15.1 17.3 17.5 21.3 7.0 2011 (14.66-15.64) (16.69-17.82) (16.93-18.06) (20.58-21.92) (6.49-7.56)
14.7 16.9 17.1 20.9 6.6 2012 (14.29-15.21) (16.41-17.46) (16.59-17.62) (20.28-21.51) (6.07-7.13)
14.4 16.6 16.7 20.4 6.5 2013 (13.89-14.90) (15.97-17.15) (16.10-17.29) (19.66-21.12) (6.01-7.02)
11.5 13.3 13.4 16.3 5.5 2014 (11.06-11.94) (12.80-13.81) (12.92-13.97) (15.67-16.88) (4.93-6.00)
9.1 10.5 10.7 12.8 4.5 2015 (8.70-9.44) (10.11-10.96) (10.23-11.10) (12.29-13.36) (4.02-4.97)
1 In the third quarter of 2004, two questions were added to the National Health Interview Survey insurance section to reduce potential errors in reporting Medicare and Medicaid status. Persons aged 65 and over not reporting Medicare coverage were asked explicitly about Medicare coverage, and persons under age 65 with no reported coverage were asked explicitly about Medicaid coverage. Depending on responses to these two questions, respondents may have been reclassified. Estimates of uninsurance for 2004 are calculated both without the additional information from these new questions (Method 1) and with the responses to these new questions (Method 2). Beginning in 2005, all estimates are reported using Method 2. See Technical Notes for additional information.
NOTES: Data are based on household interviews of a sample of the civilian noninstitutionalized population. A person was defined as uninsured if he or she did not have any private health insurance, Medicare, Medicaid, Children’s Health Insurance Program (CHIP), state-sponsored or other government-sponsored health plan, or military plan at the time of interview. A person was also defined as uninsured if he or she had only Indian Health Service coverage or had only a private plan that paid for one type of service, such as accidents or dental care. The data on health insurance status were edited using an automated system based on logic checks and keyword searches. For comparability, the estimates for all
P ag e | 4 U.S. Department of Health and Human Services ● Centers for Disease Control and Prevention ● National Center for Health Statistics ● Released 05/16

Early Release of Selected Estimates Based on Data From the National Health Interview Survey, 2015
years were created using these same procedures. The resulting estimates of persons without health insurance coverage are generally 0.1–0.3 percentage point lower than those based on the editing procedures used for the final data files. In Table 1.1a, the number of uninsured persons is calculated as the percentage of uninsured persons multiplied by the total weighted population, including persons with unknown coverage. The age-specific numbers of uninsured may not add to their respective totals due to rounding. In Table 1.1b, age-adjusted estimates for persons under age 65 for this Healthy People 2020 Leading Health Indicator are adjusted using the projected 2000 U.S. population as the standard population and three age groups: under 18 years, 18–44, and 45–64. The analyses exclude persons with unknown health insurance status (about 1% of respondents each year). See Technical Notes for more details.
DATA SOURCE: NCHS, National Health Interview Survey, 1997–2015, Family Core component.
For 2015, the percentages uninsured at the time of interview by age group were 10.5% (28.4 million) forpersons under age 65, 12.8% (25.1 million) for persons aged 18–64, and 4.5% (3.3 million) for childrenunder age 18 years (Tables 1.1a and 1.1b).
For children under age 18 years, the percentage uninsured at the time of interview decreased from 13.9% in 1997 to 8.9% in 2005, then decreased again from 8.9% in 2008 to 4.5% in 2015 (Table 1.1b).
For adults aged 18–64, the percentage uninsured at the time of interview declined from 22.3% in 2010 to12.8% in 2015.
P ag e | 5 U.S. Department of Health and Human Services ● Centers for Disease Control and Prevention ● National Center for Health Statistics ● Released 05/16

Early Release of Selected Estimates Based on Data From the National Health Interview Survey, 2015
Table 1.2a. Percentage of persons under age 65 with public health plan coverage, by age group: United States, 1997–2015
Year Under 65 years 18–64 years Under 18 years
Percent (95% confidence interval)
13.6 10.2 21.4 1997 (13.1-14.1) (9.8-10.6) (20.5-22.4)
12.7 9.5 20.0 1998 (12.2-13.2) (9.1-9.9) (19.0-20.9)
12.4 9.0 20.4 1999 (12.0-12.9) (8.6-9.3) (19.5-21.4)
12.9 9.1 22.0 2000 (12.4-13.4) (8.7-9.4) (21.0-23.0)
13.6 9.4 23.6 2001 (13.1-14.1) (9.0-9.8) (22.6-24.5)
15.2 10.3 27.1 2002 (14.6-15.8) (9.9-10.7) (26.0-28.2)
16.0 10.9 28.6 2003 (15.4-16.6) (10.4-11.4) (27.4-29.7)
16.1 11.1 28.5 2004 (Method 11) (15.6-16.7) (10.6-11.5) (27.5-29.6)
16.2 11.1 28.7 2004 (Method 21) (15.7-16.8) (10.7-11.6) (27.7-29.8)
16.8 11.5 29.9 2005 (16.26-17.38) (11.12-11.98) (28.80-30.99)
18.1 12.4 32.3 2006 (17.40-18.77) (11.89-12.92) (30.94-33.64)
18.1 12.3 32.7 2007 (17.35-18.90) (11.72-12.95) (31.22-34.25)
19.3 13.4 34.2 2008 (18.45-20.09) (12.71-14.02) (32.70-35.78)
21.0 14.4 37.7 2009 (20.22-21.76) (13.84-15.05) (36.23-39.19)
22.0 15.0 39.8 2010 (21.21-22.71) (14.37-15.56) (38.34-41.22)
23.0 15.9 41.0 2011 (22.23-23.68) (15.34-16.47) (39.56-42.48)
23.5 16.4 42.1 2012 (22.81-24.25) (15.85-17.01) (40.64-43.47)
23.8 16.7 42.2 2013 (23.06-24.45) (16.14-17.32) (40.81-43.56)
24.5 17.7 42.2 2014 (23.75-25.16) (17.10-18.34) (40.95-43.50)
25.3 18.9 42.2 2015 (24.47-26.15) (18.23-19.65) (40.65-43.73)
See footnotes at end of table.
P ag e | 6 U.S. Department of Health and Human Services ● Centers for Disease Control and Prevention ● National Center for Health Statistics ● Released 05/16

Early Release of Selected Estimates Based on Data From the National Health Interview Survey, 2015
Table 1.2b. Percentage of persons under age 65 with private health insurance coverage, by age group: United States, 1997–2015
Year Under 65 years 18–64 years Under 18 years
Percent (95% confidence interval)
70.8 72.8 66.2 1997 (70.1-71.5) (72.2-73.4) (65.1-67.3)
72.0 73.5 68.5 1998 (71.3-72.7) (72.9-74.1) (67.4-69.5)
73.1 74.7 69.1 1999 (72.3-73.8) (74.1-75.4) (68.0-70.2)
71.8 73.8 67.1 2000 (71.1-72.5) (73.2-74.4) (66.1-68.2)
71.6 73.7 66.7 2001 (70.9-72.3) (73.1-74.4) (65.6-67.8)
69.8 72.3 63.9 2002 (69.0-70.6) (71.6-72.9) (62.7-65.1)
68.2 70.6 62.6 2003 (67.5-69.0) (69.9-71.3) (61.4-63.8)
68.6 70.9 63.1 2004 (Method 11) (67.9-69.4) (70.2-71.6) (61.9-64.3)
2004 (Method 21) ... ... ...
68.4 70.9 62.4 2005 (67.66-69.20) (70.18-71.58) (61.18-63.54)
66.5 69.2 59.7 2006 (65.54-67.41) (68.33-70.02) (58.32-61.14)
66.8 69.6 59.9 2007 (65.76-67.85) (68.64-70.47) (58.25-61.48)
65.4 68.1 58.3 2008 (64.21-66.49) (67.10-69.20) (56.61-59.91)
62.9 65.8 55.7 2009 (61.86-63.99) (64.83-66.69) (54.02-57.38)
61.2 64.1 53.8 2010 (60.20-62.17) (63.19-64.98) (52.31-55.26)
61.2 64.2 53.3 2011 (60.16-62.15) (63.34-65.09) (51.84-54.81)
61.0 64.1 52.8 2012 (60.04-61.87) (63.26-64.89) (51.40-54.25)
61.0 64.2 52.6 2013 (60.02-62.04) (63.33-65.17) (51.10-54.09)
63.6 67.3 53.7 2014 (62.66-64.47) (66.47-68.15) (52.34-55.00)
65.6 69.7 54.7 2015 (64.65-66.59) (68.88-70.58) (53.20-56.28)
…Category not applicable; see footnote 1 for more information. 1In the third quarter of 2004, two questions were added to the National Health Interview Survey (NHIS) insurance section to reduce potential errors in reporting Medicare and Medicaid status. Persons aged 65 and over not reporting Medicare coverage were asked explicitly about Medicare coverage, and persons under age 65 with no reported coverage were asked explicitly about Medicaid coverage. Depending on responses to these two questions, respondents may have been reclassified. Estimates of uninsurance for 2004 are calculated both without the additional information from these new questions (Method 1) and with the responses to these new questions (Method 2). In Table 1.1b, estimates of private insurance are not affected by the two additional questions. Beginning in 2005, all estimates are reported using Method 2. See Technical Notes for additional information.
NOTES: Data are based on household interviews of a sample of the civilian noninstitutionalized population. In Table 1.2a, “public health plan coverage” includes Medicare (disability), Medicaid, Children’s Health Insurance Program (CHIP), state-sponsored or other government-sponsored health plan, and military plans. In Table 1.2b, “private health insurance” includes persons who had any comprehensive private
P ag e | 7 U.S. Department of Health and Human Services ● Centers for Disease Control and Prevention ● National Center for Health Statistics ● Released 05/16

Early Release of Selected Estimates Based on Data From the National Health Interview Survey, 2015
insurance plan (including health maintenance and preferred provider organizations). These plans include those obtained through an employer, purchased directly, or purchased through local or community programs. Private coverage excludes plans that pay for only one type of service such as accidents or dental care. The data on type of coverage were edited using an automated system based on logic checks and keyword searches. For comparability, the estimates for all years were created using these same procedures. The resulting estimates of persons having public or private coverage are within 0.1–0.3 percentage point of those based on the editing procedures used for the final data files. The analyses exclude persons with unknown health insurance status (about 1% of respondents each year). See Technical Notes for more details.
DATA SOURCE: NCHS, National Health Interview Survey, 1997–2015, Family Core component.
For 2015, 25.3% of persons under age 65 were covered by public health plans (Table 1.2a) and 65.6% were covered by private health plans (Table 1.2b).
For children under age 18 years, the percentage with public health insurance coverage increased from 20.4% in 1999 to 42.2% in 2013. There was no change in the percentage of children under age 18 yearswith public health insurance coverage from 2013 to 2015. (Table 1.2a).
The percentage of adults aged 18–64 with public health insurance coverage increased from 15.0% in2010 to 18.9% in 2015 (Table 1.2a).
For children under age 18 years, the percentage with private health insurance coverage decreased from 69.1% in 1999 to 52.6% in 2013 (Table 1.2b).
The percentage of adults aged 18–64 with private health insurance coverage increased from 64.1% in 2010 to 69.7% in 2015 (Table 1.2b).
P ag e | 8 U.S. Department of Health and Human Services ● Centers for Disease Control and Prevention ● National Center for Health Statistics ● Released 05/16
Early Release of Selected Estimates Based on Data From the National Health Interview Survey, 2015
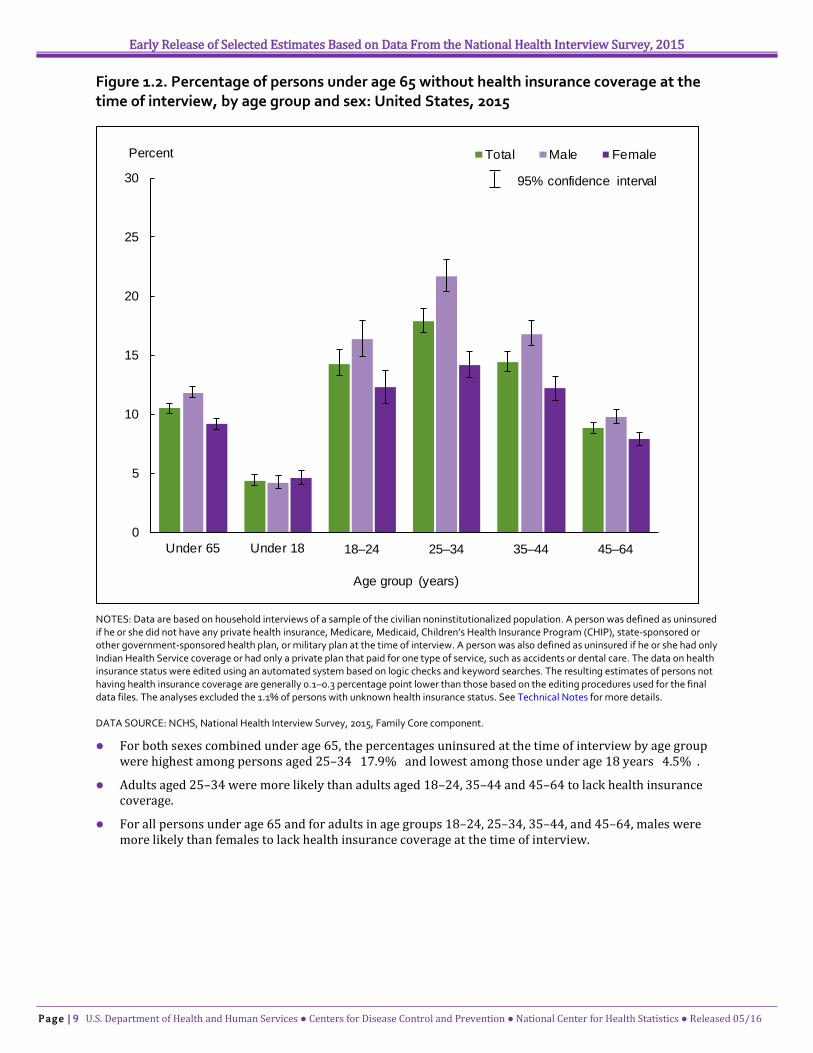
Figure 1.2. Percentage of persons under age 65 without health insurance coverage at the time of interview, by age group and sex: United States, 2015
0
5
10
15
20
25
30
Under 65 Under 18 18–24 25–34 35–44 45–64
Percent
Age group (years)
Total Male Female
95% confidence interval
NOTES: Data are based on household interviews of a sample of the civilian noninstitutionalized population. A person was defined as uninsured if he or she did not have any private health insurance, Medicare, Medicaid, Children’s Health Insurance Program (CHIP), state-sponsored or other government-sponsored health plan, or military plan at the time of interview. A person was also defined as uninsured if he or she had only Indian Health Service coverage or had only a private plan that paid for one type of service, such as accidents or dental care. The data on health insurance status were edited using an automated system based on logic checks and keyword searches. The resulting estimates of persons not having health insurance coverage are generally 0.1–0.3 percentage point lower than those based on the editing procedures used for the final data files. The analyses excluded the 1.1% of persons with unknown health insurance status. See Technical Notes for more details.
DATA SOURCE: NCHS, National Health Interview Survey, 2015, Family Core component.
For both sexes combined under age 65, the percentages uninsured at the time of interview by age groupwere highest among persons aged 25–34 (17.9%) and lowest among those under age 18 years (4.5%).
Adults aged 25–34 were more likely than adults aged 18–24, 35–44 and 45–64 to lack health insurance coverage.
For all persons under age 65 and for adults in age groups 18–24, 25–34, 35–44, and 45–64, males weremore likely than females to lack health insurance coverage at the time of interview.
P ag e | 9 U.S. Department of Health and Human Services ● Centers for Disease Control and Prevention ● National Center for Health Statistics ● Released 05/16

Early Release of Selected Estimates Based on Data From the National Health Interview Survey, 2015
Figure 1.3. Age-sex-adjusted percentage of persons of all ages without health insurance coverage at the time of interview, by race/ethnicity: United States, 2015
Percent
30
20
10
0
Non-Hispanic
95% confidence interval
Hispanic White Black
NOTES: Data are based on household interviews of a sample of the civilian noninstitutionalized population. A person was defined as uninsured if he or she did not have any private health insurance, Medicare, Medicaid, Children’s Health Insurance Program (CHIP), state-sponsored or other government-sponsored health plan, or military plan at the time of interview. A person was also defined as uninsured if he or she had only Indian Health Service coverage or had only a private plan that paid for one type of service, such as accidents or dental care. The data on health insurance status were edited using an automated system based on logic checks and keyword searches. The resulting estimates of persons not having health insurance coverage are generally 0.1–0.3 percentage point lower than those based on the editing procedures used for the final data files. The analyses exclude the 1.0% of persons with unknown health insurance status. Estimates are age-sex-adjusted using the projected 2000 U.S. population as the standard population and three age groups: under 18 years, 18–64, and 65 and over. See Technical Notes for more details.
DATA SOURCE: NCHS, National Health Interview Survey, 2015, Family Core component.
After adjustment for age and sex, the percentages uninsured at the time of interview by race/ethnicitywere 19.4% for Hispanic persons, 6.2% for non-Hispanic white persons, and 9.9% for non-Hispanic black persons.
Hispanic persons were the most likely to be uninsured at the time of interview, followed by non-Hispanicblack persons and non-Hispanic white persons. Non-Hispanic black persons were more likely to beuninsured than non-Hispanic white persons.
P ag e | 10 U.S. Department of Health and Human Services ● Centers for Disease Control and Prevention ● National Center for Health Statistics ● Released 05/16

Early Release of Selected Estimates Based on Data From the National Health Interview Survey, 2015
Data tables for Figures 1.1–1.3:
Data table for Figure 1.1. Percentage of persons of all ages without health insurance coverage at the time of interview: United States, 1997–2015
Year Percent 95% confidence interval
1997 15.4 15.0-15.8
1998 14.6 14.1-15.1
1999 14.2 13.8-14.6
2000 14.9 14.5-15.3
2001 14.3 13.8-14.8
2002 14.7 14.3-15.1
2003 15.2 14.8-15.7
2004 (Method 11) 14.7 14.3-15.2
2004 (Method 21) 14.6 14.2-15.0
2005 14.2 13.75-14.58
2006 14.8 14.34-15.34
2007 14.5 13.93-15.08
2008 14.7 14.04-15.27
2009 15.4 14.79-15.96
2010 16.0 15.46-16.52
2011 15.1 14.66-15.64
2012 14.7 14.29-15.21 2013 14.4 13.89-14.90 2014 11.5 11.06-11.94 2015 9.1 8.70-9.43
1In the third quarter of 2004, two questions were added to the National Health Interview Survey (NHIS) insurance section to reduce potential errors in reporting Medicare and Medicaid status. Persons aged 65 and over not reporting Medicare coverage were asked explicitly about Medicare coverage, and persons under age 65 with no reported coverage were asked explicitly about Medicaid coverage. Depending on responses to these two questions, respondents may have been reclassified. Estimates of uninsurance for 2004 are calculated both without the additional information from these new questions (Method 1) and with the responses to these new questions (Method 2). Beginning in 2005, all estimates are reported using Method 2. See Technical Notes for additional information.
NOTES: Data are based on household interviews of a sample of the civilian noninstitutionalized population. Beginning with 2012 data, NHIS transitioned to weights derived from the 2010 census. For 2003–2011 data, weights were derived from the 2000 census. In this Early Release, estimates for 2000–2002 were recalculated using weights derived from the 2000 census. For 1997–1999 data, weights were derived from the 1990 census. See Technical Notes for more details.
DATA SOURCE: NCHS, National Health Interview Survey, 1997–2015, Family Core component.
P ag e | 11 U.S. Department of Health and Human Services ● Centers for Disease Control and Prevention ● National Center for Health Statistics ● Released 05/16

Early Release of Selected Estimates Based on Data From the National Health Interview Survey, 2015
Data table for Figure 1.2. Percentage of persons under age 65 without health insurance coverage at the time of interview, by age group and sex: United States, 2015
Age (years) and sex Percent 95% confidence interval
Under 18, total 4.5 4.00-4.95
Under 18, male 4.3 3.73-4.83
Under 18, female 4.7 4.09-5.27
18–24, total 14.4 13.25-15.50
18–24, male 16.4 14.90-17.91
18–24, female 12.3 10.92-13.73
25–34, total 17.9 16.90-18.96
25–34, male 21.7 20.40-23.07
25–34, female 14.2 13.10-15.31
35–44, total 14.5 13.62-15.35
35–44, male 16.8 15.79-17.90
35–44, female 12.2 11.21-13.24
45–64, total 8.8 8.37-9.29
45–64, male 9.8 9.20-10.43
45–64, female 7.9 7.37-8.44
Under 65 (crude1), total 10.5 10.10-10.96
Under 65 (crude1), male 11.9 11.41-12.39
Under 65 (crude1), female 9.2 8.72-9.64
Under 65 (age-adjusted2), total 10.7 10.23-11.10
Under 65 (age-adjusted2), male 12.1 11.64-12.62
Under 65 (age-adjusted2), female 9.3 8.78-9.73
1Crude estimates are presented in the figure and are similar to those used to monitor the related Healthy People 2020 Leading Health Indicator—Proportion of persons with health insurance. 2Estimates are age-adjusted using the projected 2000 U.S. population as the standard population and three age groups: under 18 years, 18–44, and 45–64.
NOTE: Data are based on household interviews of a sample of the civilian noninstitutionalized population.
DATA SOURCE: NCHS, National Health Interview Survey, 2015, Family Core component.
Data table for Figure 1.3. Age-sex-adjusted percentage of persons of all ages without health insurance coverage at the time of interview, by race/ethnicity: United States, 2015
Age-sex-adjusted1 percent Age-adjusted2 percent Race/ethnicity (95% confidence interval) (95% confidence interval)
Hispanic or Latino 19.4 (18.38-20.35) 19.2 (18.25-20.20)
Not Hispanic or Latino, single race, white 6.2 (5.85-6.57) 6.5 (6.15-6.91)
Not Hispanic or Latino, single race, black 9.9 (9.10-10.76) 10.0 (9.16-10.82)
1Estimates are age-sex-adjusted using the projected 2000 U.S. population as the standard population and three age groups: under 18 years, 18–64, and 65 and over. 2Estimates for this Healthy People 2020 Leading Health Indicator are age adjusted using the projected 2000 U.S. population as the standard population and four age groups: under 18 years, 18–44, 45–64, and 65 and over.
NOTE: Data are based on household interviews of a sample of the civilian noninstitutionalized population.
DATA SOURCE: NCHS, National Health Interview Survey, 2015, Family Core component.
P ag e | 12 U.S. Department of Health and Human Services ● Centers for Disease Control and Prevention ● National Center for Health Statistics ● Released 05/16

Early Release of Selected Estimates Based on Data From the National Health Interview Survey, 2015
Usual place to go for medical care
Figure 2.1. Percentage of persons of all ages with a usual place to go for medical care: United States, 1997–2015
70
75
80
85
90
1997 1998 1999 2000 2001 2002 2003 2004 2005 2006 2007 2008 2009 2010 2011 2012 2013 2014 2015
Percent 95% confidence interval
NOTES: Data are based on household interviews of a sample of the civilian noninstitutionalized population. The usual place to go for medical care does not include a hospital emergency room. The analyses exclude persons with an unknown usual place to go for medical care (about 1.5% of respondents each year). See Technical Notes for more details.
DATA SOURCE: NCHS, National Health Interview Survey, 1997–2015, combined Sample Adult and Sample Child Core components.
For 2015, the percentage of persons who had a usual place to go for medical care was 87.8% (95%confidence interval = 87.26%–88.24%), which was not significantly different from the 2014 estimate of87.9%.
The percentage of persons of all ages who had a usual place to go for medical care decreased from 87.9%in 2003 to 85.4% in 2010, and then increased to 87.8% in 2015.
P ag e | 13 U.S. Department of Health and Human Services ● Centers for Disease Control and Prevention ● National Center for Health Statistics ● Released 05/16

Early Release of Selected Estimates Based on Data From the National Health Interview Survey, 2015
Figure 2.2. Percentage of persons of all ages with a usual place to go for medical care, by age group and sex: United States, 2015
40
50
60
70
80
90
100
All ages Under 18 18–24 25–44 45–64 65 and over
Percent Total Male Female
95% confidence interval
Age group (years)
NOTES: Data are based on household interviews of a sample of the civilian noninstitutionalized population. The usual place to go for medical care does not include a hospital emergency room. The analyses excluded the 0.8% of persons with an unknown usual place to go for medical care. See Technical Notes for more details.
DATA SOURCE: NCHS, National Health Interview Survey, 2015, combined Sample Adult and Sample Child Core components.
Persons aged 18–24 and 25–44 were least likely to have a usual place to go for medical care. Childrenunder age 18 years (95.6%) were more likely than adults in age groups 18–24 (75.4%), 25–44 (78.0%),and 45–64 (90.1%) to have a usual place to go for medical care.
Among those aged 25 and over, the percentage of persons having a usual place to go for medical careincreased with age.
For persons of all ages combined, as well as for age groups 18–24, 25–44 and 45–64, females were morelikely than males to have a usual place to go for medical care.
P ag e | 14 U.S. Department of Health and Human Services ● Centers for Disease Control and Prevention ● National Center for Health Statistics ● Released 05/16

50
Early Release of Selected Estimates Based on Data From the National Health Interview Survey, 2015
Figure 2.3. Age-sex-adjusted percentage of persons of all ages with a usual place to go for medical care, by race/ethnicity: United States, 2015
Percent 95% confidence interval
60
70
80
90
100
Hispanic White Black
Non-Hispanic
NOTES: Data are based on household interviews of a sample of the civilian noninstitutionalized population. The usual place to go for medical care does not include a hospital emergency room. The analyses exclude the 0.8% of persons with an unknown usual place to go for medical care. Estimates are age-sex-adjusted using the projected 2000 U.S. population as the standard population and five age groups: under 18 years, 18–24, 25–44, 45–64, and 65 and over. See Technical Notes for more details.
DATA SOURCE: NCHS, National Health Interview Survey, 2015, combined Sample Adult and Sample Child Core components.
After adjustment for age and sex, the percentages of persons with a usual place to go for medical care byrace/ethnicity were 82.6% for Hispanic persons, 88.8% for non-Hispanic white persons, and 86.7% fornon-Hispanic black persons.
Of the three race/ethnicity groups, Hispanic persons were the least likely to have a usual place to go formedical care, followed by non-Hispanic black and non-Hispanic white persons. Non-Hispanic blackpersons were less likely to have a usual place to go for medical care compared to non-Hispanic white persons.
P ag e | 15 U.S. Department of Health and Human Services ● Centers for Disease Control and Prevention ● National Center for Health Statistics ● Released 05/16

Early Release of Selected Estimates Based on Data From the National Health Interview Survey, 2015
Data tables for Figures 2.1–2.3:
Data table for Figure 2.1. Percentage of persons of all ages with a usual place to go for medical care: United States, 1997–2015
Year Crude1 percent (95% confidence interval) Age-adjusted2 percent (95% confidence interval)
1997 86.2 (85.8-86.7) 86.3 (85.9-86.7)
1998 87.4 (86.9-87.8) 87.4 (87.0-87.9)
1999 86.3 (85.9-86.7) 86.4 (86.0-86.8)
2000 87.0 (86.5-87.4) 87.0 (86.6-87.4)
2001 88.0 (87.6-88.5) 88.0 (87.6-88.5)
2002 87.6 (87.1-88.0) 87.6 (87.1-88.0)
2003 87.9 (87.4-88.4) 87.9 (87.4-88.4)
2004 86.8 (86.3-87.3) 86.8 (86.3-87.2)
2005 87.0 (86.56-87.50) 86.9 (86.47-87.41)
2006 86.3 (85.68-86.92) 86.2 (85.56-86.80)
2007 86.6 (85.97-87.19) 86.5 (85.84-87.06)
2008 86.4 (85.73-87.09) 86.2 (85.54-86.88)
2009 85.5 (84.91-86.12) 85.3 (84.65-85.90)
2010 85.4 (84.85-85.99) 85.1 (84.55-85.66)
2011 86.8 (86.29-87.33) 86.5 (85.99-87.04)
2012 85.8 (85.32-86.38) 85.5 (85.01-86.03)
2013 86.5 (85.99-87.07) 86.1 (85.63-86.67)
2014 87.9 (87.47-88.41) 87.6 (87.09-88.05)
2015 87.8 (87.26-88.24) 87.3 (86.80-87.77)
1Crude estimates are presented. 2Estimates are age-adjusted using the projected 2000 U.S. population as the standard population and five age groups: under 18 years, 18–24, 25–44, 45–64, and 65 and over.
NOTES: Data are based on household interviews of a sample of the civilian noninstitutionalized population. Beginning with 2012 data, the National Health Interview Survey transitioned to weights derived from the 2010 census. For 2003–2011 data, weights were derived from the 2000 census. In this Early Release, estimates for 2000–2002 were recalculated using weights derived from the 2000 census. For 1997–1999 data, weights were derived from the 1990 census. See Technical Notes for more details.
DATA SOURCE: NCHS, National Health Interview Survey, 1997–2015, combined Sample Adult and Sample Child Core components.
P ag e | 16 U.S. Department of Health and Human Services ● Centers for Disease Control and Prevention ● National Center for Health Statistics ● Released 05/16

Early Release of Selected Estimates Based on Data From the National Health Interview Survey, 2015
Data table for Figure 2.2. Percentage of persons of all ages with a usual place to go for medical care, by age group and sex: United States, 2015
Age (years) and sex Percent 95% confidence interval
Under 18, total 95.6 95.07-96.12
Under 18, male 95.7 95.07-96.41
Under 18, female 95.4 94.75-96.15
18–24, total 75.4 73.04-77.72
18–24, male 70.1 66.95-73.35
18–24, female 80.7 77.86-83.61
25–44, total 78.0 76.96-78.95
25–44, male 71.3 69.68-72.96
25–44, female 84.3 83.21-85.45
45–64, total 90.1 89.41-90.85
45–64, male 87.2 85.96-88.45
45–64, female 92.9 92.15-93.64
65 and over, total 96.4 95.82-96.89
65 and over, male 95.8 94.97-96.66
65 and over, female 96.8 96.16-97.42
All ages (crude1), total 87.8 87.26-88.24
All ages (crude1), male 84.6 83.86-85.36
All ages (crude1), female 90.7 90.23-91.27
All ages (age-adjusted2), total 87.3 86.80-87.77
All ages (age-adjusted2), male 84.1 83.40-84.85
All ages (age-adjusted2), female 90.3 89.80-90.86
1Crude estimates are presented. 2Estimates are age-adjusted using the projected 2000 U.S. population as the standard population and five age groups: under 18 years, 18–24, 25–44, 45–64, and 65 and over.
NOTE: Data are based on household interviews of a sample of the civilian noninstitutionalized population.
DATA SOURCE: NCHS, National Health Interview Survey, 2015, combined Sample Adult and Sample Child Core components.
Data table for Figure 2.3. Age-sex-adjusted percentage of persons of all ages with a usual place to go for medical care, by race/ethnicity: United States, 2015
Race/ethnicity Age-sex-adjusted1 percent (95% confidence interval)
Age-adjusted2 percent (95% confidence interval)
Hispanic or Latino 82.6 (81.43-83.78) 82.5 (81.30-83.73)
Not Hispanic or Latino, single race, white 88.8 (88.26-89.44) 88.8 (88.24-89.43)
Not Hispanic or Latino, single race, black 86.7 (85.47-87.94) 87.0 (85.83-88.22)
1Estimates are age-sex-adjusted the projected 2000 U.S. population as the standard population and using five age groups: under 18 years, 18– 24, 25–44, 45–64, and 65 and over. 2Estimates are age-adjusted using the projected 2000 U.S. population as the standard population and using five age groups: under 18, 18–24, 25–44, 45–64, and 65 and over.
NOTE: Data are based on household interviews of a sample of the civilian noninstitutionalized population.
DATA SOURCE: NCHS, National Health Interview Survey, 2015, combined Sample Adult and Sample Child Core components.
P ag e | 17 U.S. Department of Health and Human Services ● Centers for Disease Control and Prevention ● National Center for Health Statistics ● Released 05/16

Early Release of Selected Estimates Based on Data From the National Health Interview Survey, 2015
Failure to obtain needed medical care
Figure 3.1. Percentage of persons of all ages who failed to obtain needed medical care due to cost at some time during the past 12 months: United States, 1997–2015
0
2
4
6
8
1997 1998 1999 2000 2001 2002 2003 2004 2005 2006 2007 2008 2009 2010 2011 2012 2013 2014 2015
Percent 95% confidence interval
NOTES: Data are based on household interviews of a sample of the civilian noninstitutionalized population. The analyses exclude persons with unknown responses to the question on failure to obtain needed medical care due to cost (about 0.2% of respondents each year). See Technical Notes for more details.
DATA SOURCE: NCHS, National Health Interview Survey, 1997–2015, Family Core component.
For 2015, 4.5% (95% confidence interval = 4.29%–4.69%) of the population failed to obtain neededmedical care due to cost at some time during the past 12 months, which was lower than the 2014estimate of 5.3%.
The percentage of persons who failed to obtain needed medical care due to cost increased from 4.3% in1999 to 6.9% in 2009 and 2010, and then decreased to 4.5% in 2015.
P ag e | 18 U.S. Department of Health and Human Services ● Centers for Disease Control and Prevention ● National Center for Health Statistics ● Released 05/16

Early Release of Selected Estimates Based on Data From the National Health Interview Survey, 2015
Figure 3.2. Percentage of persons of all ages who failed to obtain needed medical care due to cost at some time during the past 12 months, by age group and sex: United States, 2015
0
2
4
6
8
All ages Under 18 18–64 65 and over
Percent Total Male Female
95% confidence interval
Age group (years)
NOTES: Data are based on household interviews of a sample of the civilian noninstitutionalized population. The analyses exclude the 0.1% of persons with unknown responses to the question on failure to obtain needed medical care due to cost. See Technical Notes for more details.
DATA SOURCE: NCHS, National Health Interview Survey, 2015, Family Core component.
For both sexes combined, the percentage of persons who failed to obtain needed medical care due to cost at some time during the past 12 months by age group was 1.4% for those under age 18 years, 6.2% forthose aged 18–64, and 2.3% for those aged 65 and over.
Adults aged 18–64 were more likely than children under age 18 years and adults aged 65 and over tohave failed to obtain needed medical care due to cost.
For persons of all ages, and adults aged 18–64 and 65 and over, females were more likely than males tohave failed to obtain needed medical care due to cost during the past 12 months.
P ag e | 19 U.S. Department of Health and Human Services ● Centers for Disease Control and Prevention ● National Center for Health Statistics ● Released 05/16

Early Release of Selected Estimates Based on Data From the National Health Interview Survey, 2015
Figure 3.3. Age-sex-adjusted percentage of persons of all ages who failed to obtain needed medical care due to cost at some time during the past 12 months, by race/ethnicity: United States, 2015
Percent 95% confidence interval 8
6
4
2
0 Hispanic White Black
Non-Hispanic
NOTES: Data are based on household interviews of a sample of the civilian noninstitutionalized population. The analyses exclude the 0.1% of persons with unknown responses to the question on failure to obtain needed medical care due to cost. Estimates are age-sex-adjusted using the projected 2000 U.S. population as the standard population and three age groups: under 18 years, 18–64, and 65 and over. See Technical Notes for more details.
DATA SOURCE: NCHS, National Health Interview Survey, 2015, Family Core component.
After adjustment for age and sex, 5.4% of Hispanic persons, 4.1% of non-Hispanic white persons, and 5.8% of non-Hispanic black persons failed to obtain needed medical care due to cost at some time duringthe year preceding the interview.
Of the three race/ethnicity groups, non-Hispanic black persons and Hispanic persons were more likely tohave failed to obtain needed medical care due to cost, compared with non-Hispanic white persons.
P ag e | 20 U.S. Department of Health and Human Services ● Centers for Disease Control and Prevention ● National Center for Health Statistics ● Released 05/16

Early Release of Selected Estimates Based on Data From the National Health Interview Survey, 2015
Data tables for Figures 3.1–3.3:
Data table for Figure 3.1. Percentage of persons of all ages who failed to obtain needed medical care due to cost at some time during the past 12 months: United States, 1997– 2015
Year Crude1 percent (95% confidence interval) Age-adjusted2 percent (95% confidence interval)
1997 4.5 (4.3-4.7) 4.5 (4.4-4.7)
1998 4.2 (4.0-4.4) 4.2 (4.0-4.4)
1999 4.3 (4.1-4.5) 4.3 (4.1-4.5)
2000 4.5 (4.3-4.7) 4.5 (4.2-4.7)
2001 4.7 (4.5-4.9) 4.7 (4.5-4.9)
2002 4.7 (4.5-4.9) 4.7 (4.5-4.9)
2003 5.3 (5.1-5.5) 5.2 (5.0-5.5)
2004 5.5 (5.2-5.7) 5.4 (5.2-5.6)
2005 5.3 (5.05-5.45) 5.2 (4.99-5.40)
2006 5.8 (5.49-6.07) 5.7 (5.42-6.00)
2007 5.8 (5.54-6.11) 5.8 (5.47-6.03)
2008 6.5 (6.17-6.87) 6.4 (6.09-6.78)
2009 6.9 (6.62-7.21) 6.8 (6.54-7.12)
2010 6.9 (6.64-7.20) 6.8 (6.56-7.10)
2011 6.5 (6.26-6.77) 6.4 (6.18-6.68)
2012 6.2 (5.96-6.45) 6.1 (5.89-6.36)
2013 5.9 (5.66-6.16) 5.8 (5.60-6.10)
2014 5.3 (5.03-5.50) 5.2 (4.98-5.44)
2015 4.5 (4.29-4.69) 4.4 (4.25-4.65)
1Crude estimates are presented. 2Estimates are age-adjusted using the projected 2000 U.S. population as the standard population and three age groups: under 18 years, 18–64, and 65 and over.
NOTES: Data are based on household interviews of a sample of the civilian noninstitutionalized population. Beginning with 2012 data, the National Health Interview Survey transitioned to weights derived from the 2010 census. For 2003–2011 data, weights were derived from the 2000 census. In this Early Release, estimates for 2000–2002 were recalculated using weights derived from the 2000 census. For 1997–1999 data, weights were derived from the 1990 census. See Technical Notes for more details.
DATA SOURCE: NCHS, National Health Interview Survey, 1997–2015, Family Core component.
P ag e | 21 U.S. Department of Health and Human Services ● Centers for Disease Control and Prevention ● National Center for Health Statistics ● Released 05/16

Early Release of Selected Estimates Based on Data From the National Health Interview Survey, 2015
Data table for Figure 3.2. Percentage of persons of all ages who failed to obtain needed medical care due to cost at some time during the past 12 months, by age group and sex: United States, 2015
Age (years) and sex Percent 95% confidence interval
Under 18 , total 1.4 1.14-1.59
Under 18 , male 1.4 1.12-1.74
Under 18 , female 1.3 1.07-1.53
18–64 , total 6.2 5.89-6.48
18–64 , male 5.6 5.22-5.91
18–64 , female 6.8 6.38-7.17
65 and over, total 2.3 2.01-2.56
65 and over, male 1.6 1.29-1.98
65 and over, female 2.8 2.39-3.21
All ages (crude1), total 4.5 4.29-4.69
All ages (crude1), male 4.0 3.81-4.26
All ages (crude1), female 4.9 4.65-5.20
All ages (age-adjusted2), total 4.4 4.25-4.65
All ages (age-adjusted2), male 4.0 3.78-4.23
All ages (age-adjusted2), female 4.9 4.59-5.14
1Crude estimates are presented. 2Estimates are age-adjusted using the projected 2000 U.S. population as the standard population and using three age groups: under 18 years, 18–64, and 65 and over.
NOTE: Data are based on household interviews of a sample of the civilian noninstitutionalized population.
DATA SOURCE: NCHS, National Health Interview Survey, 2015, Family Core component.
Data table for Figure 3.3. Age-sex-adjusted percentage of persons of all ages who failed to obtain needed medical care due to cost at some time during the past 12 months, by race/ethnicity: United States, 2015
Race/ethnicity Percent1 95% confidence interval
Hispanic or Latino 5.4 4.96-5.83
Not Hispanic or Latino, single race, white 4.1 3.81-4.31
Not Hispanic or Latino, single race, black 5.8 5.32-6.35
1Estimates are age-sex-adjusted using the projected 2000 U.S. population as the standard population and three age groups: under 18 years, 18–64, and 65 and over.
NOTE: Data are based on household interviews of a sample of the civilian noninstitutionalized population.
DATA SOURCE: NCHS, National Health Interview Survey, 2015, Family Core component.
P ag e | 22 U.S. Department of Health and Human Services ● Centers for Disease Control and Prevention ● National Center for Health Statistics ● Released 05/16

Early Release of Selected Estimates Based on Data From the National Health Interview Survey, 2015
Receipt of influenza vaccination
Figure 4.1. Percentage of adults aged 18 and over who received an influenza vaccination during the past 12 months, by age group and quarter: United States, 1997–2015
0
20
40
60
80
1997 1998 1999 2000 2001 2002 2003 2004 2005 2006 2007 2008 2009 2010 2011 2012 2013 2014 2015
Percent
65 and over
50–64
18–49
Year (quarter)
NOTES: Data are based on household interviews of a sample of the civilian noninstitutionalized population. National Health Interview Survey (NHIS) questions related to influenza vaccination have changed since 1997. Starting in 1997, respondents were asked if they had received a flu shot during the past 12 months. Beginning in 2003, respondents were also asked if they had received a flu vaccine sprayed in their nose during the past 12 months. In August 2010, questions were modified to reflect that, for the first time, the widely available influenza vaccine included protection against both seasonal and H1N1 types of influenza. NHIS Early Release influenza vaccination estimates have changed since 1997. Starting in 1997, Early Release influenza vaccination estimates covered receipt of an influenza shot only. Starting in 2005, Early Release influenza vaccination estimates covered seasonal influenza shot or seasonal intranasal influenza vaccination. Estimates based on data collected in quarters three and four of 2010 and quarters one and two of 2011 could be affected, to an unknown extent, by reports of H1N1 immunization without seasonal flu immunization for the period when the two were administered separately (October 2009–May 2010). Prevalence of influenza vaccination during the past 12 months is different from season-specific coverage (see http://www.cdc.gov/mmwr/preview/mmwrhtml/ss6204a1.htm?s_cid=ss6204a1_w; estimates available from: http://www.cdc.gov/flu/fluvaxview). Advisory Committee on Immunization Practices recommendations regarding who should receive an influenza vaccination have changed over the years, and changes in coverage estimates may reflect changes in recommendations (4–6). An influenza vaccine shortage occurred during the 2004–2005 influenza season (4). Delays in the availability of influenza shots also occurred in fall 2000 and, to a lesser extent, in fall 2001 (4–7). The analyses exclude those with unknown influenza vaccination status (about 3% of respondents each year). See Technical Notes for more details.
DATA SOURCE: NCHS, National Health Interview Survey, 1997–2015, Sample Adult Core component.
In the fourth quarter of 2015, the percentages of adults who had received an influenza vaccination duringthe past 12 months by age group were 65.8% for adults aged 65 and over, 46.0% for those aged 50–64,and 31.2% for those aged 18–49.
For age groups 18–49 and 50–64, the fourth-quarter estimate in 2015 was higher than, but not significantly different from, the fourth-quarter estimate in 2014.
For age group 65 and over, the fourth-quarter estimate in 2015 was lower than, but not significantlydifferent from, the fourth-quarter estimate in 2014.
P ag e | 23 U.S. Department of Health and Human Services ● Centers for Disease Control and Prevention ● National Center for Health Statistics ● Released 05/16

Early Release of Selected Estimates Based on Data From the National Health Interview Survey, 2015
Table 4.1a. Percentage of adults aged 50–64 who received an influenza vaccination during the past 12 months, by sex: United States, 1997–2015
Year Total Men Women
Percent (95% confidence interval)
1997 31.9 (30.5-33.3) 28.0 (26.1-29.9) 35.5 (33.6-37.4)
1998 33.1 (31.7-34.5) 29.0 (27.0-31.0) 37.0 (35.1-38.9)
1999 34.1 (32.8-35.4) 30.5 (28.6-32.4) 37.4 (35.5-39.3)
2000 34.6 (33.1-36.1) 31.9 (29.9-33.9) 37.2 (35.2-39.1)
2001 32.2 (30.9-33.5) 30.3 (28.3-32.2) 34.0 (32.2-35.8)
2002 34.0 (32.7-35.3) 30.7 (28.8-32.5) 37.2 (35.4-38.9)
2003 36.8 (35.4-38.2) 34.5 (32.6-36.3) 38.9 (37.0-40.9)
2004 35.9 (34.6-37.3) 33.3 (31.3-35.3) 38.5 (36.7-40.3)
2005 23.0 (21.93-24.10) 19.7 (18.11-21.36) 26.1 (24.61-27.52)
2006 33.2 (31.59-34.82) 29.9 (27.58-32.18) 36.3 (34.23-38.36)
2007 36.2 (34.56-37.93) 33.0 (30.94-35.05) 39.3 (36.93-41.64)
2008 39.4 (37.79-41.10) 36.3 (34.04-38.56) 42.4 (40.18-44.68)
2009 40.7 (39.31-42.07) 38.3 (36.23-40.30) 43.0 (40.92-45.03)
2010 41.2 (39.73-42.66) 37.5 (35.41-39.56) 44.7 (42.78-46.56)
2011 42.7 (41.31-44.08) 39.0 (36.95-41.00) 46.2 (44.23-48.16)
2012 42.7 (41.44-43.99) 38.5 (36.87-40.11) 46.7 (44.94-48.50)
2013 46.5 (45.05-47.97) 43.1 (40.92-45.35) 49.7 (47.88-51.43)
2014 45.5 (43.91-47.03) 41.0 (38.65-43.38) 49.6 (47.70-51.59)
2015 48.1 (46.46-49.79) 45.3 (43.12-47.50) 50.8 (48.59-52.92)
See notes at end of table.
P ag e | 24 U.S. Department of Health and Human Services ● Centers for Disease Control and Prevention ● National Center for Health Statistics ● Released 05/16

Early Release of Selected Estimates Based on Data From the National Health Interview Survey, 2015
Table 4.1b. Percentage of adults aged 65 and over who received an influenza vaccination during the past 12 months, by sex: United States, 1997–2015
Year Total Total Men Women
Crude percent (95% confidence
interval)
Age-adjusted percent (95% confidence
interval)1 Percent (95%
confidence interval) Percent (95%
confidence interval)
1997 63.2 (61.9-64.6) 63.1 (61.7-64.4) 64.8 (62.5-67.1) 62.1 (60.5-63.7)
1998 63.3 (61.9-64.7) 63.3 (61.9-64.6) 63.7 (61.5-65.9) 63.0 (61.2-64.8)
1999 65.7 (64.3-67.2) 65.1 (63.6-66.5) 67.2 (65.0-69.4) 64.6 (62.7-66.5)
2000 64.4 (63.0-65.9) 64.6 (63.2-66.0) 66.0 (63.8-68.3) 63.3 (61.6-65.0)
2001 63.1 (61.7-64.5) 63.2 (61.8-64.6) 64.8 (62.5-67.1) 61.8 (60.1-63.5)
2002 65.7 (64.3-67.2) 65.9 (64.5-67.3) 67.1 (64.7-69.5) 64.7 (62.8-66.6)
2003 65.5 (64.1-66.9) 65.6 (64.2-66.9) 66.0 (63.9-68.1) 65.1 (63.2-67.0)
2004 64.6 (63.2-66.1) 64.7 (63.2-66.1) 64.1 (61.9-66.3) 65.0 (63.3-66.7)
2005 59.7 (58.16-61.15) 59.7 (58.24-61.23) 58.9 (56.64-61.17) 60.2 (58.22-62.20)
2006 64.3 (62.39-66.19) 64.4 (62.51-66.32) 64.7 (62.04-67.43) 63.9 (61.65-66.24)
2007 66.7 (64.90-68.59) 66.8 (65.00-68.68) 66.7 (64.06-69.31) 66.8 (64.62-68.96)
2008 66.9 (65.08-68.80) 67.1 (65.31-68.89) 65.5 (62.74-68.33) 68.0 (65.94-70.07)
2009 66.7 (64.99-68.48) 67.0 (65.32-68.69) 67.3 (64.82-69.82) 66.3 (64.11-68.46)
2010 63.6 (61.99-65.29) 63.9 (62.26-65.50) 63.1 (60.76-65.52) 64.0 (61.79-66.26)
2011 67.0 (65.45-68.50) 67.2 (65.74-68.75) 66.3 (64.12-68.53) 67.5 (65.68-69.30)
2012 66.5 (64.98-67.96) 66.9 (65.46-68.38) 65.2 (63.17-67.29) 67.4 (65.56-69.34)
2013 67.9 (66.38-69.48) 68.4 (66.89-69.92) 66.4 (63.89-68.87) 69.2 (67.42-70.88)
2014 70.0 (68.62-71.38) 70.5 (69.09-71.86) 70.1 (67.94-72.31) 69.9 (68.23-71.59)
2015 69.1 (67.79-70.33) 69.4 (68.14-70.63) 70.4 (68.66-72.18) 68.0 (66.16-69.75)
1Estimates are age-adjusted using the projected 2000 U.S. population as the standard population and two age groups: 65–74 and 75 and over.
NOTES: Data are based on household interviews of a sample of the civilian noninstitutionalized population. National Health Interview Survey (NHIS) questions related to influenza vaccination have changed since 1997. Starting in 1997, respondents were asked if they had received a flu shot during the past 12 months. Beginning in 2003, respondents were also asked if they had received a flu vaccine sprayed in their nose during the past 12 months. In August 2010, questions were modified to reflect that, for the first time, the widely available influenza vaccine included protection against both seasonal and H1N1 types of influenza. NHIS Early Release influenza vaccination estimates have changed since 1997. Starting in 1997, Early Release influenza vaccination estimates covered receipt of an influenza shot only. Starting in 2005, Early Release influenza vaccination estimates covered seasonal influenza shot or seasonal intranasal influenza vaccination. Estimates based on data collected in quarters three and four of 2010 and quarters one and two of 2011 could be affected, to an unknown extent, by reports of H1N1 immunization without seasonal flu immunization for the period when the two were administered separately (October 2009–May 2010). Prevalence of influenza vaccination during the past 12 months is different from season-specific coverage (see http://www.cdc.gov/mmwr/preview/mmwrhtml/ss6204a1.htm?s_cid=ss6204a1_w; estimates available from: http://www.cdc.gov/flu/fluvaxview). Advisory Committee on Immunization Practices recommendations regarding who should receive an influenza vaccination have changed over the years and changes in coverage estimates may reflect changes in recommendations (4–6). An influenza vaccine shortage occurred during the 2004–2005 influenza season (4). Delays in the availability of influenza shots also occurred in fall 2000 and, to a lesser extent, in fall 2001 (4–7). The analyses exclude those with unknown influenza vaccination status (about 3% of respondents each year). See Technical Notes for more details.
DATA SOURCE: NCHS, National Health Interview Survey, 1997–2015, Sample Adult Core component.
For 2015, the percentage of adults aged 50–64 who had received an influenza vaccination during the past 12 months was 48.1% (Table 4.1a). This estimate was higher than the 2014 estimate of 45.5%. For thisage group, the percentage of adults who had received an influenza vaccination during the past 12 monthsincreased from 1997 to 2015.
For 2015, the percentage of adults who had received an influenza vaccination during the past 12 monthswas 69.1% for persons aged 65 and over (Table 4.1b). For this age group, the percentage of adults whohad received an influenza vaccination during the past 12 months increased from 1997 to 2015.
P ag e | 25 U.S. Department of Health and Human Services ● Centers for Disease Control and Prevention ● National Center for Health Statistics ● Released 05/16

Early Release of Selected Estimates Based on Data From the National Health Interview Survey, 2015
Figure 4.2. Percentage of persons who received an influenza vaccination during the past 12 months, by age group and sex: United States, 2015
0
20
40
60
80
6 months and over
6 months– 17 years
18–49 years 50–64 years 65 years and over
Percent Total Male Female
95% confidence interval
Age group
NOTES: Data are based on household interviews of a sample of the civilian noninstitutionalized population. Respondents were asked in separate questions if they had received a flu shot during the past 12 months or a flu vaccine sprayed in their nose during the past 12 months. For children 6 months–8 years, who require two doses of vaccine to be fully vaccinated if they have not previously received seasonal influenza vaccination, these questions do not indicate whether the vaccination was a child’s first or second dose. In August 2010, National Health Interview Survey influenza vaccination questions were modified to reflect that, for the first time, the widely available influenza vaccine included protection against both seasonal and H1N1 types of influenza. When interpreting influenza vaccination estimates, changes made to the influenza vaccination questions noted above should be taken into account. Prevalence of influenza vaccination during the past 12 months is different from season-specific coverage (see http://www.cdc.gov/mmwr/preview/mmwrhtml/ss6204a1.htm?s_cid=ss6204a1_w; estimates available from: http://www.cdc.gov/flu/fluvaxview). Advisory Committee on Immunization Practices recommendations regarding who should receive an influenza vaccination have changed over the years, and changes in coverage estimates may reflect changes in recommendations (5,8). The analyses exclude the 2.2% of persons with unknown influenza vaccination status. See Technical Notes for more details.
DATA SOURCE: NCHS, National Health Interview Survey, 2015, combined Sample Adult and Sample Child Core components.
For both sexes combined, the percentage of persons who had received an influenza vaccination duringthe past 12 months was highest among persons aged 65 and over (69.1%), and lowest among personsaged 18–49 (31.7%).
For persons aged 6 months and over, and for adults aged 18–49 and 50–64, females were more likelythan males to have received an influenza vaccination during the past 12 months.
P ag e | 26 U.S. Department of Health and Human Services ● Centers for Disease Control and Prevention ● National Center for Health Statistics ● Released 05/16

Early Release of Selected Estimates Based on Data From the National Health Interview Survey, 2015
Figure 4.3. Percentage of persons aged 6 months and over who received an influenza vaccination during the past 12 months, by age group and race/ethnicity: United States, 2015
0
10
20
30
40
50
60
Hispanic White Black
Percent 6 months–17 years 18 years and over
95% confidence interval
Non-Hispanic
NOTES: Data are based on household interviews of a sample of the civilian noninstitutionalized population. Respondents were asked in separate questions if they had received a flu shot during the past 12 months or a flu vaccine sprayed in their nose during the past 12 months. For children 6 months–8 years, who require two doses of vaccine to be fully vaccinated if they have not previously received seasonal influenza vaccination, these questions do not indicate whether the vaccination was a child’s first or second dose. In August 2010, questions were modified to reflect that, for the first time, the widely available influenza vaccine included protection against both seasonal and H1N1 types of influenza. When interpreting influenza vaccination estimates, changes made to the influenza vaccination questions noted above should be taken into account. Prevalence of influenza vaccination during the past 12 months is different from season-specific coverage (see http://www.cdc.gov/mmwr/preview/mmwrhtml/ss6204a1.htm?s_cid=ss6204a1_w; estimates available from: http://www.cdc.gov/flu/fluvaxview). Advisory Committee on Immunization Practices recommendations regarding who should receive an influenza vaccination have changed over the years, and changes in coverage estimates may reflect changes in recommendations (5). The analyses exclude the 2.2% of persons with unknown influenza vaccination status. See Technical Notes for more details.
DATA SOURCE: NCHS, National Health Interview Survey, 2015, combined Sample Adult and Sample Child Core components.
For children aged 6 months–17 years, the percentages by race/ethnicity who had received an influenza vaccination during the past 12 months were 50.7% for Hispanic children, 49.2% for non-Hispanic whitechildren, and 44.2% for non-Hispanic black children.
A lower percentage of non-Hispanic black children aged 6 months–17 years had received an influenza vaccination during the past 12 months compared to Hispanic and non-Hispanic white children aged 6months–17 years.
For adults aged 18 and over, the percentages who had received an influenza vaccination during the past 12 months were 31.1% for Hispanic adults, 46.9% for non-Hispanic white adults, and 36.0% for non-Hispanic black adults.
P ag e | 27 U.S. Department of Health and Human Services ● Centers for Disease Control and Prevention ● National Center for Health Statistics ● Released 05/16

Early Release of Selected Estimates Based on Data From the National Health Interview Survey, 2015
Non-Hispanic white adults were most likely to have received an influenza vaccination, followed by non-Hispanic black adults and Hispanic adults. Non-Hispanic black adults were more likely to have receivedan influenza vaccination than Hispanic adults.
P ag e | 28 U.S. Department of Health and Human Services ● Centers for Disease Control and Prevention ● National Center for Health Statistics ● Released 05/16

See notes at end of table.
Early Release of Selected Estimates Based on Data From the National Health Interview Survey, 2015
Data tables for Figures 4.1–4.3:
Data table for Figure 4.1. Percentage of adults aged 18 and over who received an influenza vaccination during the past 12 months, by age group and quarter: United States, 1997– 2015
Year and quarter 18–49 years 50–64 years 65 years and over
Percent (95% confidence interval)
1997, quarter 1 13.6 (12.5-14.6) 30.5 (27.8-33.2) 65.0 (62.3-67.6)
1997, quarter 2 14.5 (13.4-15.5) 31.3 (28.7-34.0) 63.7 (61.1-66.2)
1997, quarter 3 13.6 (12.6-14.6) 32.0 (29.3-34.6) 63.1 (60.3-65.9)
1997, quarter 4 15.6 (14.5-16.7) 33.6 (31.1-36.2) 61.2 (58.7-63.8)
1998, quarter 1 16.1 (14.8-17.3) 34.2 (31.3-37.1) 66.3 (63.2-69.4)
1998, quarter 2 15.3 (14.1-16.5) 32.8 (30.1-35.5) 64.0 (61.3-66.8)
1998, quarter 3 14.5 (13.3-15.6) 32.0 (29.3-34.6) 61.3 (58.5-64.0)
1998, quarter 4 16.0 (14.8-17.2) 33.5 (30.8-36.1) 61.6 (58.7-64.5)
1999, quarter 1 16.3 (14.8-17.7) 34.2 (31.1-37.3) 67.0 (64.0-70.1)
1999, quarter 2 16.0 (14.7-17.3) 32.6 (29.8-35.4) 66.1 (63.4-68.8)
1999, quarter 3 15.8 (14.5-17.1) 32.8 (30.1-35.5) 64.1 (61.2-67.0)
1999, quarter 4 17.6 (16.2-18.9) 36.7 (34.2-39.2) 65.7 (62.7-68.6)
2000, quarter 1 18.6 (17.2-19.9) 36.6 (33.7-39.4) 68.2 (65.3-71.0)
2000, quarter 2 18.0 (16.7-19.4) 38.5 (35.7-41.4) 68.1 (65.6-70.7)
2000, quarter 3 18.2 (16.9-19.4) 36.6 (33.7-39.5) 67.1 (64.4-69.8)
2000, quarter 4 13.6 (12.4-14.8) 26.6 (24.2-29.0) 54.3 (51.6-57.1)
2001, quarter 1 14.7 (13.4-16.0) 32.3 (29.6-35.0) 63.3 (60.2-66.3)
2001, quarter 2 15.9 (14.7-17.1) 32.6 (30.1-35.1) 65.4 (62.8-68.0)
2001, quarter 3 14.9 (13.9-15.9) 33.3 (30.7-35.8) 64.0 (61.1-66.8)
2001, quarter 4 14.5 (13.6-15.9) 30.6 (28.0-33.1) 59.6 (56.7-62.4)
2002, quarter 1 16.4 (15.2-17.7) 36.3 (33.6-38.9) 66.6 (63.8-69.4)
2002, quarter 2 16.0 (14.8-17.2) 33.0 (30.5-35.5) 67.8 (65.3-70.3)
2002, quarter 3 16.2 (14.9-17.5) 33.1 (30.6-35.6) 63.1 (60.5-65.8)
2002, quarter 4 16.4 (15.1-17.8) 33.8 (31.0-36.6) 65.5 (62.4-68.6)
2003, quarter 1 17.1 (15.7-18.4) 36.8 (34.2-39.4) 67.8 (65.0-70.6)
2003, quarter 2 17.2 (15.8-18.6) 36.8 (33.9-39.7) 65.4 (62.6-68.3)
2003, quarter 3 16.4 (15.2-17.6) 37.4 (34.9-39.9) 65.4 (62.8-67.9)
2003, quarter 4 16.7 (15.2-18.1) 36.1 (33.3-39.0) 63.3 (60.1-66.5)
2004, quarter 1 19.3 (17.9-20.8) 40.6 (38.0-43.3) 70.3 (67.5-73.0)
2004, quarter 2 20.9 (19.1-22.6) 40.0 (37.1-43.0) 69.5 (66.7-72.3)
2004, quarter 3 19.4 (18.2-20.7) 41.0 (38.4-43.6) 66.4 (63.6-69.2)
2004, quarter 4 12.0 (10.9-13.1) 22.3 (20.2-24.5) 52.4 (49.5-55.4)
2005, quarter 1 10.2 (9.03-11.41) 21.2 (19.05-23.42) 59.8 (56.66-62.90)
2005, quarter 2 10.3 (9.25-11.37) 21.1 (19.05-23.19) 62.0 (59.02-64.91)
2005, quarter 3 10.0 (9.03-11.03) 21.8 (19.64-24.01) 58.2 (55.42-60.97)
2005, quarter 4 12.4 (11.28-13.51) 27.8 (25.47-30.19) 58.7 (55.68-61.71)
P ag e | 29 U.S. Department of Health and Human Services ● Centers for Disease Control and Prevention ● National Center for Health Statistics ● Released 05/16

Early Release of Selected Estimates Based on Data From the National Health Interview Survey, 2015
Data table for Figure 4.1. Percentage of adults aged 18 and over who received an influenza vaccination during the past 12 months, by age group and quarter: United States, 1997– 2015 (Cont.)
Year and quarter 18–49 years 50–64 years 65 years and over
Percent (95% confidence interval)
2006, quarter 1 15.0 (13.69-16.36) 33.1 (29.95-36.20) 64.9 (61.65-68.15)
2006, quarter 2 16.2 (14.78-17.68) 31.8 (29.05-34.50) 66.6 (63.60-69.51)
2006, quarter 3 15.5 (13.56-17.47) 33.5 (29.45-37.51) 63.9 (58.90-68.84)
2006, quarter 4 15.4 (14.07-16.82) 34.5 (31.81-37.11) 61.9 (58.72-65.00)
2007, quarter 1 18.0 (16.36-19.63) 38.3 (35.28-41.39) 67.5 (64.47-70.62)
2007, quarter 2 16.7 (15.07-18.31) 36.2 (33.37-39.03) 68.8 (65.62-71.91)
2007, quarter 3 17.6 (15.47-19.74) 36.5 (32.10-40.95) 65.6 (60.90-70.39)
2007, quarter 4 18.7 (17.11-20.38) 34.0 (31.14-36.79) 65.1 (62.17-68.02)
2008, quarter 1 19.0 (17.41-20.56) 42.3 (39.12-45.57) 68.0 (64.78-71.21)
2008, quarter 2 19.5 (17.87-21.08) 39.8 (37.01-42.57) 67.4 (64.60-70.20)
2008, quarter 3 21.6 (19.95-23.26) 36.0 (33.10-38.86) 64.5 (61.09-68.00)
2008, quarter 4 19.4 (17.29-21.60) 39.7 (35.45-43.92) 67.8 (63.70-71.91)
2009, quarter 1 23.3 (20.81-25.78) 40.9 (37.05-44.67) 70.3 (66.08-74.59)
2009, quarter 2 22.5 (20.92-24.06) 42.5 (40.09-44.93) 64.8 (62.04-67.55)
2009, quarter 3 21.4 (19.81-22.98) 40.0 (37.13-42.82) 66.3 (63.03-69.48)
2009, quarter 4 24.5 (23.06-25.93) 39.5 (37.24-41.75) 65.5 (62.96-68.03)
2010, quarter 1 24.3 (22.45-26.17) 40.4 (37.81-43.05) 63.3 (60.51-66.04)
2010, quarter 2 23.3 (21.56-25.02) 42.7 (39.65-45.74) 64.6 (61.74-67.39)
2010, quarter 3 26.7 (24.81-28.64) 37.9 (35.02-40.69) 63.1 (59.87-66.39)
2010, quarter 4 25.1 (23.24-27.04) 43.8 (40.80-46.82) 63.6 (60.19-66.99)
2011, quarter 1 26.4 (24.86-27.93) 43.4 (40.61-46.17) 68.7 (66.01-71.37)
2011, quarter 2 26.9 (25.32-28.46) 41.7 (38.97-44.39) 69.4 (67.00-71.78)
2011, quarter 3 28.2 (26.47-29.87) 41.9 (39.23-44.57) 65.5 (62.59-68.50)
2011, quarter 4 27.5 (25.48-29.47) 43.8 (41.26-46.32) 64.3 (61.52-67.14)
2012, quarter 1 25.5 (23.78-27.25) 43.1 (40.28-46.00) 68.6 (65.62-71.63)
2012, quarter 2 27.9 (26.16-29.55) 42.5 (39.69-45.21) 69.4 (66.84-72.03)
2012, quarter 3 26.6 (24.68-28.54) 43.3 (40.95-45.73) 64.6 (61.86-67.32)
2012, quarter 4 25.2 (23.49-26.84) 41.9 (39.03-44.78) 63.4 (60.28-66.44)
2013, quarter 1 28.7 (26.90-30.51) 47.2 (44.43-49.88) 69.8 (66.84-72.70)
2013, quarter 2 31.5 (29.65-33.44) 48.1 (45.22-50.95) 69.1 (66.21-71.97)
2013, quarter 3 31.2 (29.45-32.96) 46.2 (43.58-48.90) 69.3 (66.30-72.20)
2013, quarter 4 27.0 (25.21-28.71) 44.6 (41.64-47.54) 63.7 (60.59-66.77)
2014, quarter 1 31.2 (29.29-33.06) 45.0 (42.03-47.95) 68.8 (65.96-71.63)
2014, quarter 2 31.6 (29.55-33.72) 48.2 (45.02-51.40) 72.2 (69.54-74.86)
2014, quarter 3 32.7 (30.64-34.67) 45.1 (42.11-48.11) 69.9 (67.35-72.48)
2014, quarter 4 29.3 (27.66-30.96) 43.6 (40.90-46.26) 69.1 (66.38-71.85)
2015, quarter 1 32.5 (30.48-34.43) 50.7 (47.82-53.52) 71.9 (69.48-74.34)
2015, quarter 2 33.3 (31.49-35.03) 47.6 (44.68-50.47) 71.4 (68.76-74.13)
2015, quarter 3 29.7 (27.83-31.62) 48.2 (45.07-51.38) 67.2 (64.35-69.96)
2015, quarter 4 31.2 (28.84-33.52) 46.0 (43.07-48.90) 65.8 (63.05-68.60)
NOTES: Data are based on household interviews of a sample of the civilian noninstitutionalized population. Beginning with 2012 data, the National Health Interview Survey transitioned to weights derived from the 2010 census. For 2003–2011 data, weights were derived from the
P ag e | 30 U.S. Department of Health and Human Services ● Centers for Disease Control and Prevention ● National Center for Health Statistics ● Released 05/16

Early Release of Selected Estimates Based on Data From the National Health Interview Survey, 2015
2000 census. In this Early Release, estimates for 2000–2002 were recalculated using weights derived from the 2000 census. For 1997–1999 data, weights were derived from the 1990 census. See Technical Notes for more details.
DATA SOURCE: NCHS, National Health Interview Survey, 1997–2015, Sample Adult Core component.
P ag e | 31 U.S. Department of Health and Human Services ● Centers for Disease Control and Prevention ● National Center for Health Statistics ● Released 05/16

Early Release of Selected Estimates Based on Data From the National Health Interview Survey, 2015
Data table for Figure 4.2. Percentage of persons who received an influenza vaccination during the past 12 months, by age group and sex: United States, 2015
Age (years) and sex Percent 95% confidence interval
6 months–4 years, total 54.8 52.10-57.51
6 months–4 years, male 54.7 51.40-58.02
6 months–4 years, female 54.9 51.14-58.69
5–11, total 52.7 50.57-54.78
5–11, male 52.4 49.40-55.39
5–11, female 53.0 49.90-56.02
12–17, total 42.1 40.12-44.16
12–17, male 41.0 38.25-43.68
12–17, female 43.4 40.61-46.20
6 months–17 years, total 49.6 48.14-50.96
6 months–17 years, male 48.9 47.12-50.75
6 months–17 years, female 50.2 48.23-52.16
18–49 , total 31.7 30.65-32.67
18–49 , male 26.5 25.10-27.86
18–49 , female 36.7 35.38-38.03
50–64, total 48.1 46.46-49.79
50–64, male 45.3 43.12-47.50
50–64, female 50.8 48.59-52.92
65 and over, total 69.1 67.79-70.33
65 and over, male 70.4 68.66-72.18
65 and over, female 68.0 66.16-69.75
6 months and over (crude1), total 44.6 43.83-45.30
6 months and over (crude1), male 41.5 40.54-42.46
6 months and over (crude1), female 47.5 46.52-48.47
18 and over (crude1), total 43.1 42.36-43.87
18 and over (crude1), male 39.2 38.15-40.25
18 and over (crude1), female 46.8 45.78-47.72
65 and over (age-adjusted2), total 69.4 68.14-70.63
65 and over (age-adjusted2), male 71.0 69.22-72.71
65 and over (age-adjusted2), female 68.2 66.40-69.91
1Crude estimates are presented. 2Estimates are age-adjusted using the projected 2000 U.S. population as the standard population and two age groups: 65–74 and 75 and over.
NOTE: Data are based on household interviews of a sample of the civilian noninstitutionalized population.
DATA SOURCE: NCHS, National Health Interview Survey, 2015, combined Sample Adult and Sample Child Core components.
P ag e | 32 U.S. Department of Health and Human Services ● Centers for Disease Control and Prevention ● National Center for Health Statistics ● Released 05/16

Early Release of Selected Estimates Based on Data From the National Health Interview Survey, 2015
Data table for Figure 4.3. Percentage of persons aged 6 months and over who received an influenza vaccination during the past 12 months, by age group and race/ethnicity: United States, 2015
Age and race/ethnicity Percent1 95% confidence interval
6 months–17 years, Hispanic or Latino 50.7 47.89-53.48
6 months–17 years, not Hispanic or Latino, single race, white 49.2 47.41-51.08
6 months–17 years, not Hispanic or Latino, single race, black 44.2 40.09-48.23
18 years and over, Hispanic or Latino 31.1 29.65-32.63
18 years and over, not Hispanic or Latino, single race, white 46.9 45.83-47.90
18 years and over, not Hispanic or Latino, single race, black 36.0 33.99-37.91
1Crude estimates are presented.
NOTE: Data are based on household interviews of a sample of the civilian noninstitutionalized population.
DATA SOURCE: NCHS, National Health Interview Survey, 2015, combined Sample Adult and Sample Child Core components.
P ag e | 33 U.S. Department of Health and Human Services ● Centers for Disease Control and Prevention ● National Center for Health Statistics ● Released 05/16

Early Release of Selected Estimates Based on Data From the National Health Interview Survey, 2015
Receipt of pneumococcal vaccination
Figure 5.1. Percentage of adults aged 65 and over who had ever received a pneumococcal vaccination: United States, 1997–2015
30
40
50
60
70
1997 1998 1999 2000 2001 2002 2003 2004 2005 2006 2007 2008 2009 2010 2011 2012 2013 2014 2015
Percent 95% confidence interval
NOTES: Data are based on household interviews of a sample of the civilian noninstitutionalized population. The analyses exclude those with unknown pneumococcal vaccination status (about 5% of respondents each year). Advisory Committee on Immunization Practices recommendations regarding who should receive pneumococcal vaccination have changed over the years, and changes in coverage estimates may reflect changes in recommendations. Of particular note, beginning in September 2014, all adults aged 65 and over are recommended to receive both the 13-valent pneumococcal conjugate vaccine (PCV13) and the 23-valent pneumococcal polysaccharide vaccine (PPSV23) in series (9-11). See Technical Notes for more details.
DATA SOURCE: NCHS, National Health Interview Survey, 1997–2015, Sample Adult Core component.
For 2015, the percentage of adults aged 65 and over who had ever received a pneumococcal vaccinationwas 63.5% (95% confidence interval = 62.00%–65.05%), which was higher than the 2014 estimate of61.3%.
The percentage of adults aged 65 and over who had ever received a pneumococcal vaccination increasedrapidly from 42.4% in 1997 to 53.1% in 2000, and then increased more slowly to 63.5% in 2015.
P ag e | 34 U.S. Department of Health and Human Services ● Centers for Disease Control and Prevention ● National Center for Health Statistics ● Released 05/16

Early Release of Selected Estimates Based on Data From the National Health Interview Survey, 2015
Figure 5.2. Percentage of adults aged 65 and over who had ever received a pneumococcal vaccination, by age group and sex: United States, 2015
Total Male Female Percent
80 95% confidence interval
60
40
20
0 65 and over 65–74 75 and over
Age group (years)
NOTES: Data are based on household interviews of a sample of the civilian noninstitutionalized population. The analyses exclude the 4.0% of adults aged 65 and over with unknown pneumococcal vaccination status. Advisory Committee on Immunization Practices recommendations regarding who should receive pneumococcal vaccination have changed over the years, and changes in coverage estimates may reflect changes in recommendations. Of particular note, beginning in September 2014, all adults aged 65 and over are recommended to receive both the 13-valent pneumococcal conjugate vaccine (PCV13) and the 23-valent pneumococcal polysaccharide vaccine (PPSV23) in series (9-11). See Technical Notes for more details.
DATA SOURCE: NCHS, National Health Interview Survey, 2015, Sample Adult Core component.
For both sexes combined, the percentages of adults by age group who had ever received a pneumococcalvaccination were 60.1% for persons aged 65–74 and 68.4% for persons aged 75 and over.
For both sexes combined, adults aged 75 and over were more likely than those aged 65–74 to have everreceived a pneumococcal vaccination. This pattern was found in both men and women.
P ag e | 35 U.S. Department of Health and Human Services ● Centers for Disease Control and Prevention ● National Center for Health Statistics ● Released 05/16

Early Release of Selected Estimates Based on Data From the National Health Interview Survey, 2015
Figure 5.3. Percentage of adults aged 65 and over who had ever received a pneumococcal vaccination, by race/ethnicity: United States, 2015
95% confidence interval Percent 80
60
40
20
0 Hispanic White Black
Non-Hispanic
NOTES: Data are based on household interviews of a sample of the civilian noninstitutionalized population. The analyses exclude the 4.0% of adults aged 65 and over with unknown pneumococcal vaccination status. Advisory Committee on Immunization Practices recommendations regarding who should receive pneumococcal vaccination have changed over the years, and changes in coverage estimates may reflect changes in recommendations. Of particular note, beginning in September 2014, all adults aged 65 and over are recommended to receive both the 13-valent pneumococcal conjugate vaccine (PCV13) and the 23-valent pneumococcal polysaccharide vaccine (PPSV23) in series (9-11). See Technical Notes for more details.
DATA SOURCE: NCHS, National Health Interview Survey, 2015, Sample Adult Core component.
The percentages of adults aged 65 and over by race/ethnicity who had ever received a pneumococcal vaccination were 41.3% for Hispanic persons, 68.0% for non-Hispanic white persons, and 50.2% for non-Hispanic black persons.
Of the three race/ethnicity groups, non-Hispanic white adults were most likely to have ever received a pneumococcal vaccination, followed by non-Hispanic black and Hispanic adults. Non-Hispanic black adults were more likely to have ever received a pneumococcal vaccination than Hispanic adults.
P ag e | 36 U.S. Department of Health and Human Services ● Centers for Disease Control and Prevention ● National Center for Health Statistics ● Released 05/16

Early Release of Selected Estimates Based on Data From the National Health Interview Survey, 2015
Data tables for Figures 5.1–5.3:
Data table for Figure 5.1. Percentage of adults aged 65 and over who had ever received a pneumococcal vaccination: United States, 1997–2015
Year Crude1 percent (95% confidence interval) Age-adjusted2 percent (95% confidence interval)
1997 42.4 (40.9-43.9) 42.6 (41.1-44.1)
1998 46.0 (44.5-47.5) 46.3 (44.8-47.8)
1999 49.7 (48.1-51.3) 49.9 (48.3-51.5)
2000 53.1 (51.5-54.7) 53.4 (51.8-55.0)
2001 54.0 (52.4-55.6) 54.2 (52.6-55.7)
2002 56.0 (54.5-57.5) 56.2 (54.8-57.7)
2003 55.6 (54.1-57.1) 55.7 (54.2-57.1)
2004 56.8 (55.3-58.3) 57.0 (55.5-58.5)
2005 56.2 (54.82-57.64) 56.3 (54.95-57.72)
2006 57.1 (55.25-58.88) 57.2 (55.43-59.04)
2007 57.7 (55.68-59.69) 57.8 (55.78-59.80)
2008 59.6 (57.68-61.48) 59.8 (57.98-61.64)
2009 60.6 (58.74-62.51) 61.0 (59.15-62.79)
2010 59.4 (57.61-61.17) 59.8 (58.02-61.51)
2011 62.3 (60.55-63.95) 62.7 (61.04-64.31)
2012 59.9 (58.29-61.49) 60.4 (58.86-62.01)
2013 59.7 (58.02-61.36) 60.4 (58.77-62.05)
2014 61.3 (59.88-62.80) 62.3 (60.82-63.70)
2015 63.5 (62.00-65.05) 64.1 (62.59-65.57)
1Crude estimates are presented. 2Estimates are age-adjusted using the projected 2000 U.S. population as the standard population and two age groups: 65–74 and 75 and over.
NOTES: Data are based on household interviews of a sample of the civilian noninstitutionalized population. Beginning with 2012 data, the National Health Interview Survey transitioned to weights derived from the 2010 census. For 2003–2011 data, weights were derived from the 2000 census. In this Early Release, estimates for 2000–2002 were recalculated using weights derived from the 2000 census. For 1997–1999 data, weights were derived from the 1990 census. See Technical Notes for more details.
DATA SOURCE: NCHS, National Health Interview Survey, 1997–2015, Sample Adult Core component.
P ag e | 37 U.S. Department of Health and Human Services ● Centers for Disease Control and Prevention ● National Center for Health Statistics ● Released 05/16

Early Release of Selected Estimates Based on Data From the National Health Interview Survey, 2015
Data table for Figure 5.2. Percentage of adults aged 65 and over who had ever received a pneumococcal vaccination, by age group and sex: United States, 2015
Age (years) and sex Percent 95% confidence interval
65–74, total 60.1 57.97-62.28
65–74, male 59.2 55.89-62.47
65–74, female 61.0 58.13-63.79
75 and over, total 68.4 66.29-70.52
75 and over, male 68.4 65.02-71.77
75 and over, female 68.4 65.98-70.85
65 and over (crude1), total 63.5 62.00-65.05
65 and over (crude1), male 62.7 60.29-65.16
65 and over (crude1), female 64.2 62.28-66.08
65 and over (age-adjusted2), total 64.1 62.59-65.57
65 and over (age-adjusted2), male 63.6 61.21-65.95
65 and over (age-adjusted2), female 64.5 62.68-66.35
1Crude estimates are presented. 2Estimates are age-adjusted using the projected 2000 U.S. population as the standard population and two age groups: 65–74 and 75 and over.
NOTE: Data are based on household interviews of a sample of the civilian noninstitutionalized population.
DATA SOURCE: NCHS, National Health Interview Survey, 2015, Sample Adult Core component.
Data table for Figure 5.3. Percentage of adults aged 65 and over who had ever received a pneumococcal vaccination, by race/ethnicity: United States, 2015
Race/ethnicity Crude1 percent
(95% confidence interval) Age-adjusted2 percent
(95% confidence interval)
Hispanic or Latino 41.3 (36.15-46.36) 42.1 (36.76-47.46)
Not Hispanic or Latino, single race, white 68.0 (66.34-69.69) 68.5 (66.80-70.11)
Not Hispanic or Latino, single race, black 50.2 (46.26-54.07) 50.7 (46.80-54.61)
1Crude estimates are presented. 2Estimates are age-adjusted using the projected 2000 U.S. population as the standard population and two age groups: 65–74 and 75 and over.
NOTE: Data are based on household interviews of a sample of the civilian noninstitutionalized population.
DATA SOURCE: NCHS, National Health Interview Survey, 2015, Sample Adult Core component.
P ag e | 38 U.S. Department of Health and Human Services ● Centers for Disease Control and Prevention ● National Center for Health Statistics ● Released 05/16

Early Release of Selected Estimates Based on Data From the National Health Interview Survey, 2015
Obesity
Figure 6.1. Prevalence of obesity among adults aged 20 and over: United States, 1997– 2015
10
15
20
25
30
35
1997199819992000200120022003200420052006200720082009201020112012201320142015
Percent 95% confidence interval
NOTES: Data are based on household interviews of a sample of the civilian noninstitutionalized population. Obesity is defined as a body mass index of 30 kg/m2 or more. The measure is based on self-reported height (m) and weight (kg). Estimates of obesity are restricted to adults aged 20 and over for consistency with the Healthy People 2020 (3) initiative. The analyses excluded people with unknown height or weight (about 6% of respondents each year). See Technical Notes for more details.
DATA SOURCE: NCHS, National Health Interview Survey, 1997–2015, Sample Adult Core component.
For 2015, 30.4% (95% confidence interval = 29.62%–31.27%) of U.S. adults aged 20 and over were obese. This was higher than, but not significantly different from, the 2014 estimate of 29.9%.
The prevalence of obesity among U.S. adults aged 20 and over increased from 19.4% in 1997 to 30.4% in 2015.
P ag e | 39 U.S. Department of Health and Human Services ● Centers for Disease Control and Prevention ● National Center for Health Statistics ● Released 05/16

Early Release of Selected Estimates Based on Data From the National Health Interview Survey, 2015
Figure 6.2. Prevalence of obesity among adults aged 20 and over, by age group and sex: United States, 2015
10
15
20
25
30
35
40
20 and over 20–39 40–59 60 and over
Percent Total Male Female
95% confidence interval
Age group (years)
NOTES: Data are based on household interviews of a sample of the civilian noninstitutionalized population. Obesity is defined as a body mass index ) of 30 kg/m2 or more. The measure is based on self-reported height (m) and weight (kg). Estimates of obesity are restricted to adults aged 20 and over for consistency with the Healthy People 2020 (3) initiative. The analyses exclude the 4.0% of persons with unknown height or weight. See Technical Notes for more details.
DATA SOURCE: NCHS, National Health Interview Survey, 2015, Sample Adult Core component.
For both sexes combined, the prevalence of obesity was highest among adults aged 40–59 (34.6%), followed by adults aged 60 and over (30.1%) and aged 20–39 (26.5%).
For the age group 40–59, the prevalence of obesity was higher among men than among women (36.3%vs. 33.0%).
P ag e | 40 U.S. Department of Health and Human Services ● Centers for Disease Control and Prevention ● National Center for Health Statistics ● Released 05/16

Early Release of Selected Estimates Based on Data From the National Health Interview Survey, 2015
Figure 6.3. Age-adjusted prevalence of obesity among adults aged 20 and over, by sex and race/ethnicity: United States, 2015
Percent Male Female
95% confidence interval
50
40
30
20
10
0 Hispanic White Black
Non-Hispanic
NOTES: Data are based on household interviews of a sample of the civilian noninstitutionalized population. Obesity is defined as a body mass index of 30 kg/m2 or more. The measure is based on self-reported height (m) and weight (kg). Estimates of obesity are restricted to adults aged 20 and over for consistency with the Healthy People 2020 (3) initiative. The analyses exclude the 4.0% of persons with unknown height or weight. Estimates are age-adjusted using the projected 2000 U.S. population as the standard population and five age groups: 20–24, 25–34, 35–44, 45–64, and 65 and over. See Technical Notes for more details.
DATA SOURCE: NCHS, National Health Interview Survey, 2015, Sample Adult Core component.
Non-Hispanic black women (45.0%) were most likely to be obese, followed by Hispanic women (32.6%)and non-Hispanic white women (27.2%).
Non-Hispanic black men (35.1%) were more likely to be obese compared with non-Hispanic white men(30.2%).
P ag e | 41 U.S. Department of Health and Human Services ● Centers for Disease Control and Prevention ● National Center for Health Statistics ● Released 05/16

Early Release of Selected Estimates Based on Data From the National Health Interview Survey, 2015
Data tables for Figures 6.1–6.3:
Data table for Figure 6.1. Prevalence of obesity among adults aged 20 and over: United States, 1997–2015
Year Crude1 percent (95% confidence interval) Age-adjusted2 percent (95% confidence interval)
1997 19.4 (18.9-19.9) 19.5 (18.9-20.0)
1998 20.6 (20.1-21.1) 20.6 (20.0-21.1)
1999 21.5 (20.9-22.1) 21.5 (20.9-22.1)
2000 21.8 (21.2-22.4) 21.8 (21.2-22.3)
2001 23.0 (22.4-23.6) 22.9 (22.3-23.5)
2002 23.9 (23.3-24.6) 23.8 (23.2-24.5)
2003 23.7 (23.1-24.3) 23.5 (22.9-24.2)
2004 24.5 (23.9-25.1) 24.3 (23.8-25.0)
2005 25.4 (24.77-26.09) 25.3 (24.66-25.96)
2006 26.4 (25.62-27.09) 26.2 (25.44-26.90)
2007 26.7 (25.82-27.50) 26.6 (25.78-27.49)
2008 27.6 (26.80-28.50) 27.5 (26.69-28.36)
2009 28.0 (27.20-28.76) 27.9 (27.13-28.71)
2010 28.4 (27.74-29.09) 28.3 (27.58-28.94)
2011 28.7 (28.01-29.42) 28.7 (27.96-29.35)
2012 28.9 (28.14-29.61) 28.7 (27.94-29.43)
2013 29.0 (28.13-29.78) 28.9 (28.06-29.78)
2014 29.9 (29.13-30.65) 29.8 (28.98-30.52)
2015 30.4 (29.62-31.27) 30.2 (29.40-31.08)
1Crude estimates are presented. 2Estimates are age-adjusted using the projected 2000 U.S. population as the standard population and seven age groups: 20–29, 30–39, 40–49, 50–59, 60–69, 70–79, and 80 and over.
NOTES: Data are based on household interviews of a sample of the civilian noninstitutionalized population. Beginning with 2012 data, the National Health Interview Survey transitioned to weights derived from the 2010 census. For 2003–2011 data, weights were derived from the 2000 census. In this Early Release, estimates for 2000–2002 were recalculated using weights derived from the 2000 census. For 1997–1999 data, weights were derived from the 1990 census. See Technical Notes for more details.
DATA SOURCE: NCHS, National Health Interview Survey, 1997–2015, Sample Adult Core component.
P ag e | 42 U.S. Department of Health and Human Services ● Centers for Disease Control and Prevention ● National Center for Health Statistics ● Released 05/16

Early Release of Selected Estimates Based on Data From the National Health Interview Survey, 2015
Data table for Figure 6.2. Prevalence of obesity among adults aged 20 and over, by age group and sex: United States, 2015
Age (years) and sex Percent 95% confidence interval
20–39, total 26.5 25.33-27.69
20–39, male 26.2 24.55-27.85
20–39, female 26.8 25.22-28.44
40–59, total 34.6 33.35-35.89
40–59, male 36.3 34.55-38.08
40–59, female 33.0 31.32-34.59
60 and over, total 30.1 28.84-31.42
60 and over, male 29.9 27.98-31.76
60 and over, female 30.4 28.69-32.03
20 and over (crude1), total 30.4 29.62-31.27
20 and over (crude1), male 30.9 29.83-31.90
20 and over (crude1), female 30.0 29.01-31.07
20 and over (age-adjusted2), total 30.2 29.40-31.08
20 and over (age-adjusted2), male 30.7 29.61-31.71
20 and over (age-adjusted2), female 29.8 28.77-30.85
1Crude estimates are presented. 2Estimates are age-adjusted using the projected 2000 U.S. population as the standard population and seven age groups: 20–29, 30–39, 40–49, 50–59, 60–69, 70–79, and 80 and over.
NOTE: Data are based on household interviews of a sample of the civilian noninstitutionalized population.
DATA SOURCE: NCHS, National Health Interview Survey, 2015, Sample Adult Core component.
Data table for Figure 6.3. Age-adjusted prevalence of obesity among adults aged 20 and over, by sex and race/ethnicity: United States, 2015
Sex and race/ethnicity Percent1 95% confidence interval
Male, Hispanic or Latino 32.0 29.44-34.57
Male, not Hispanic or Latino, single race, white 30.2 28.78-31.52
Male, not Hispanic or Latino, single race, black 35.1 31.82-38.31
Female, Hispanic or Latino 32.6 30.35-34.78
Female, not Hispanic or Latino, single race, white 27.2 25.97-28.53
Female, not Hispanic or Latino, single race, black 45.0 42.28-47.73
1Estimates are age-adjusted using the projected 2000 U.S. population as the standard population and five age groups: 20–24, 25–34, 35–44, 45–64, and 65 and over.
NOTE: Data are based on household interviews of a sample of the civilian noninstitutionalized population.
DATA SOURCE: NCHS, National Health Interview Survey, 2015, Sample Adult Core component.
P ag e | 43 U.S. Department of Health and Human Services ● Centers for Disease Control and Prevention ● National Center for Health Statistics ● Released 05/16

Early Release of Selected Estimates Based on Data From the National Health Interview Survey, 2015
Leisure-time physical activity
Figure 7.1. Percentage of adults aged 18 and over who met 2008 federal physical activity guidelines for aerobic activity through leisure-time aerobic activity: United States, 1997– 2015
30
35
40
45
50
55
1997 1998 1999 2000 2001 2002 2003 2004 2005 2006 2007 2008 2009 2010 2011 2012 2013 2014 2015
Percent 95% confidence interval
NOTES: Data are based on household interviews of a sample of the civilian noninstitutionalized population. Estimates in this figure are limited to leisure-time physical activity only. This measure reflects an estimate of leisure-time aerobic activity motivated by the 2008 federal Physical Activity Guidelines for Americans, which are being used for Healthy People 2020 Objectives (3). The 2008 guidelines refer to any kind of aerobic activity, not just leisure-time aerobic activity, so the leisure-time aerobic activity estimates in this figure may underestimate the percentage of adults who met the 2008 guidelines for aerobic activity. This figure presents the percentage of adults who met the 2008 federal guidelines for aerobic activity. The 2008 federal guidelines recommend that for substantial health benefits, adults perform at least 150 minutes a week of moderate-intensity aerobic physical activity, or 75 minutes a week of vigorous-intensity aerobic physical activity, or an equivalent combination of moderate- and vigorous-intensity aerobic activity. The 2008 guidelines state that aerobic activity should be performed in episodes of at least 10 minutes and preferably should be spread throughout the week. The 2008 guidelines were applied to leisure-time activity data starting with 1997 to derive the aerobic activity estimates in this figure, allowing trend analysis. The analyses exclude persons with unknown physical activity participation (about 3% of respondents each year). See Technical Notes for more details.
DATA SOURCE: NCHS, National Health Interview Survey, 1997–2015, Sample Adult Core component.
For 2015, 49.0% (95% confidence interval = 47.98%–49.95%) of U.S. adults aged 18 and over met the2008 federal physical activity guidelines for aerobic activity (based on leisure-time activity). Thispercentage was not significantly different from the 2014 estimate (49.2%).
The annual percentage of adults aged 18 and over who met the 2008 federal physical activity guidelinesfor aerobic activity (based on leisure-time activity) increased from 41.4% in 2006 to 49.5% in 2012, andhas since remained stable through 2015.
P ag e | 44 U.S. Department of Health and Human Services ● Centers for Disease Control and Prevention ● National Center for Health Statistics ● Released 05/16

Early Release of Selected Estimates Based on Data From the National Health Interview Survey, 2015
Figure 7.2. Percentage of adults aged 18 and over who met 2008 federal physical activity guidelines for aerobic activity through leisure-time aerobic activity, by age group and sex: United States, 2015
0
20
40
60
80
18 and over 18–24 25–64 65–74 75 and over
Percent Total Male Female
Age group (years)
95% confidence interval
NOTES: Data are based on household interviews of a sample of the civilian noninstitutionalized population. Estimates in this figure are limited to leisure-time physical activity only. This measure reflects an estimate of leisure-time aerobic activity motivated by the 2008 federal Physical Activity Guidelines for Americans, which are being used for Healthy People 2020 Objectives (3). The 2008 guidelines refer to any kind of aerobic activity, not just leisure-time aerobic activity, so the leisure-time aerobic activity estimates in this figure may underestimate the percentage of adults who met the 2008 guidelines for aerobic activity. This figure presents the percentage of adults who met the 2008 federal guidelines for aerobic activity. The 2008 federal guidelines recommend that for substantial health benefits, adults perform at least 150 minutes a week of moderate-intensity aerobic physical activity, or 75 minutes a week of vigorous-intensity aerobic physical activity, or an equivalent combination of moderate- and vigorous-intensity aerobic activity. The 2008 guidelines state that aerobic activity should be performed in episodes of at least 10 minutes and preferably should be spread throughout the week. The analyses exclude the 1.4% of persons with unknown physical activity participation. See Technical Notes for more details.
DATA SOURCE: NCHS, National Health Interview Survey, 2015, Sample Adult Core component.
For both sexes combined, as age increased, the percentage of adults who met the 2008 federal physical activity guidelines for aerobic activity (based on leisure-time activity) decreased.
For adults aged 18 and over and for age groups 18–24, 25–64, 65–74, and 75 and over, women were lesslikely than men to meet the 2008 federal physical activity guidelines for aerobic activity (based onleisure-time activity).
P ag e | 45 U.S. Department of Health and Human Services ● Centers for Disease Control and Prevention ● National Center for Health Statistics ● Released 05/16

Early Release of Selected Estimates Based on Data From the National Health Interview Survey, 2015
Figure 7.3. Age-sex-adjusted percentage of adults aged 18 and over who met 2008 federal physical activity guidelines for aerobic activity through leisure-time aerobic activity, by race/ethnicity: United States, 2015
0
10
20
30
40
50
60
Percent 95% confidence interval
Hispanic White Black
Non-Hispanic
NOTES: Data are based on household interviews of a sample of the civilian noninstitutionalized population. Estimates in this figure are limited to leisure-time physical activity only. This measure reflects an estimate of leisure-time aerobic activity motivated by the 2008 federal Physical Activity Guidelines for Americans, which are being used for Healthy People 2020 Objectives (3). The 2008 guidelines refer to any kind of aerobic activity, not just leisure-time aerobic activity, so the leisure-time aerobic activity estimates in this figure may underestimate the percentage of adults who met the 2008 guidelines for aerobic activity. This figure presents the percentage of adults who met the 2008 federal guidelines for aerobic activity. The 2008 federal guidelines recommend that for substantial health benefits, adults perform at least 150 minutes a week of moderate-intensity aerobic physical activity, or 75 minutes a week of vigorous-intensity aerobic physical activity, or an equivalent combination of moderate- and vigorous-intensity aerobic activity. The 2008 guidelines state that aerobic activity should be performed in episodes of at least 10 minutes and preferably should be spread throughout the week. The analyses exclude the 1.4% of persons with unknown physical activity participation. Estimates are age-sex-adjusted using the projected 2000 U.S. population as the standard population and five age groups: 18–24, 25–34, 35–44, 45–64, and 65 and over. See Technical Notes for more details.
DATA SOURCE: NCHS, National Health Interview Survey, 2015, Sample Adult Core component.
The age-sex-adjusted percentages of adults by race/ethnicity who met the 2008 federal physical activityguidelines for aerobic activity (based on leisure-time activity) were 43.0% for Hispanic adults, 52.9% fornon-Hispanic white adults and 42.4% for non-Hispanic black adults.
Non-Hispanic white adults were more likely to meet the 2008 federal physical activity guidelines foraerobic activity (based on leisure-time activity) compared with Hispanic adults and non-Hispanic blackadults.
P ag e | 46 U.S. Department of Health and Human Services ● Centers for Disease Control and Prevention ● National Center for Health Statistics ● Released 05/16

Early Release of Selected Estimates Based on Data From the National Health Interview Survey, 2015
Figure 7.4. Percentage of adults aged 18 and over who met 2008 federal physical activity guidelines for both aerobic and muscle-strengthening activities through leisure-time aerobic and muscle-strengthening activities: United States, 1997–2015
0
5
10
15
20
25
1997 1998 1999 2000 2001 2002 2003 2004 2005 2006 2007 2008 2009 2010 2011 2012 2013 2014 2015
Percent
95% confidence interval
NOTES: Data are based on household interviews of a sample of the civilian noninstitutionalized population. Estimates in this figure are limited to leisure-time physical activity only. This measure reflects an estimate of leisure-time aerobic and muscle-strengthening activities motivated by the 2008 federal Physical Activity Guidelines for Americans, which are being used for Healthy People 2020 Objectives (3). The 2008 guidelines refer to any kind of aerobic and muscle-strengthening activities, not just leisure-time aerobic and muscle-strengthening activities, so the leisure-time aerobic and muscle-strengthening activity estimates in this figure may underestimate the percentage of adults who met the 2008 guidelines for aerobic and muscle-strengthening activities. This figure presents the percentage of adults who met the 2008 federal guidelines for both aerobic activity and muscle strengthening. The 2008 federal guidelines recommend that for substantial health benefits, adults perform at least 150 minutes a week of moderate-intensity aerobic physical activity, or 75 minutes a week of vigorous-intensity aerobic physical activity, or an equivalent combination of moderate- and vigorous-intensity aerobic activity. The 2008 guidelines state that aerobic activity should be performed in episodes of at least 10 minutes and preferably should be spread throughout the week. The 2008 guidelines also recommend that adults perform muscle-strengthening activities that are of moderate or high intensity and involve all major muscle groups on 2 or more days a week because these activities provide additional health benefits. The National Health Interview Survey estimates are based on number of times per week, which may or may not be the same as number of days per week. The 2008 guidelines were applied to both leisure-time activity and muscle-strengthening data starting with 1997 to derive the aerobic activity and muscle-strengthening estimates in this figure, allowing trend analysis. The analyses exclude persons with unknown physical activity participation (about 3% of respondents each year). See Technical Notes for more details.
DATA SOURCE: NCHS, National Health Interview Survey, 1997–2015, Sample Adult Core component.
In 2015, 20.9% (95% confidence interval = 20.20%–21.66%) of U.S. adults aged 18 and over met the2008 federal physical activity guidelines for both aerobic and muscle-strengthening activities (based onleisure-time activities). This percentage was not significantly different from the 2014 estimate of 20.8%.
The annual percentage of adults aged 18 and over who met the 2008 federal physical activity guidelinesfor both aerobic and muscle-strengthening activities (based on leisure-time activities) increased from 16.0% in 2006 to 20.4% in 2010, and has since remained stable through 2015.
P ag e | 47 U.S. Department of Health and Human Services ● Centers for Disease Control and Prevention ● National Center for Health Statistics ● Released 05/16

Early Release of Selected Estimates Based on Data From the National Health Interview Survey, 2015
Figure 7.5. Percentage of adults aged 18 and over who met 2008 federal physical activity guidelines for both aerobic and muscle-strengthening activities through leisure-time aerobic and muscle-strengthening activities, by age group and sex: United States, 2015
0
10
20
30
40
50
18 and over 18–24 25–64 65–74 75 and over
Percent Total Male Female
Age group (years)
95% confidence interval
NOTES: Data are based on household interviews of a sample of the civilian noninstitutionalized population. Estimates in this figure are limited to leisure-time physical activity only. This measure reflects an estimate of leisure-time aerobic and muscle-strengthening activities motivated by the 2008 federal Physical Activity Guidelines for Americans, which are being used for Healthy People 2020 Objectives (3). The 2008 guidelines refer to any kind of aerobic and muscle-strengthening activities, not just leisure-time aerobic and muscle-strengthening activities, so the leisure-time aerobic and muscle-strengthening activity estimates in this figure may underestimate the percentage of adults who met the 2008 guidelines for aerobic and muscle-strengthening activities. This figure presents the percentage of adults who met the 2008 federal guidelines for both aerobic activity and muscle strengthening. The 2008 federal guidelines recommend that for substantial health benefits, adults perform at least 150 minutes a week of moderate-intensity aerobic physical activity, or 75 minutes a week of vigorous-intensity aerobic physical activity, or an equivalent combination of moderate- and vigorous-intensity aerobic activity. The 2008 guidelines state that aerobic activity should be performed in episodes of at least 10 minutes and preferably should be spread throughout the week. The 2008 guidelines also recommend that adults perform muscle-strengthening activities that are of moderate or high intensity and involve all major muscle groups on 2 or more days a week because these activities provide additional health benefits. The National Health Interview Survey estimates are based on number of times per week, which may not be the same as number of days per week. The analyses exclude the 1.6% of persons with unknown physical activity participation. See Technical Notes for more details.
DATA SOURCE: NCHS, National Health Interview Survey, 2015, Sample Adult Core component.
For both sexes combined, as age increased, the percentage of adults who met the 2008 federal physical activity guidelines for both aerobic and muscle-strengthening activities (based on leisure-time activities)decreased.
For adults aged 18 and over and age groups 18–24 and 25–64, women were less likely to meet the 2008federal physical activity guidelines for both aerobic and muscle-strengthening activities (based onleisure-time activities) compared with men.
P ag e | 48 U.S. Department of Health and Human Services ● Centers for Disease Control and Prevention ● National Center for Health Statistics ● Released 05/16

Early Release of Selected Estimates Based on Data From the National Health Interview Survey, 2015
Figure 7.6. Age-sex-adjusted percentage of adults aged 18 and over who met 2008 federal physical activity guidelines for both aerobic and muscle-strengthening activities through leisure-time aerobic and muscle-strengthening activities, by race/ethnicity: United States, 2015
0
5
10
15
20
25
30
Percent 95% confidence interval
Hispanic White Black
Non-Hispanic
NOTES: Data are based on household interviews of a sample of the civilian noninstitutionalized population. Estimates in this figure are limited to leisure-time physical activity only. This measure reflects an estimate of leisure-time aerobic and muscle-strengthening activities motivated by the 2008 federal Physical Activity Guidelines for Americans, which are being used for Healthy People 2020 Objectives (3). The 2008 guidelines refer to any kind of aerobic and muscle-strengthening activities, not just leisure-time aerobic and muscle-strengthening activities, so the leisure-time aerobic and muscle-strengthening activity estimates in this figure may underestimate the percentage of adults who met the 2008 guidelines for aerobic and muscle-strengthening activities. This figure presents the percentage of adults who met the 2008 federal guidelines for both aerobic activity and muscle strengthening. The 2008 federal guidelines recommend that for substantial health benefits, adults perform at least 150 minutes a week of moderate-intensity aerobic physical activity, or 75 minutes a week of vigorous-intensity aerobic physical activity, or an equivalent combination of moderate- and vigorous-intensity aerobic activity. The 2008 guidelines state that aerobic activity should be performed in episodes of at least 10 minutes and preferably should be spread throughout the week. The 2008 guidelines also recommend that adults perform muscle-strengthening activities that are of moderate or high intensity and involve all major muscle groups on 2 or more days a week because these activities provide additional health benefits. The National Health Interview Survey estimates are based on number of times per week, which may not be the same as number of days per week. The analyses exclude the 1.6% of persons with unknown physical activity participation. Estimates are age-sex-adjusted using the projected 2000 U.S. population as the standard population and five age groups: 18–24, 25–34, 35–44, 45–64, and 65 and over. See Technical Notes for more details.
DATA SOURCE: NCHS, National Health Interview Survey, 2015, Sample Adult Core component.
The age-sex-adjusted percentages of adults by race/ethnicity who met the 2008 federal physical activityguidelines for both aerobic and muscle-strengthening activities (based on leisure-time activities) were16.4% for Hispanic adults, 23.3% for non-Hispanic white adults and 20.2% for non-Hispanic black adults.
Non-Hispanic white adults were the most likely to meet the 2008 federal physical activity guidelines forboth aerobic and muscle-strengthening activities (based on leisure-time activities), followed by non-Hispanic black adults and Hispanic adults. Non-Hispanic black adults were more likely to meet the 2008
P ag e | 49 U.S. Department of Health and Human Services ● Centers for Disease Control and Prevention ● National Center for Health Statistics ● Released 05/16

Early Release of Selected Estimates Based on Data From the National Health Interview Survey, 2015
federal activity guidelines for both aerobic and muscle-strengthening activities (based on leisure-timeactivities) than Hispanic adults.
P ag e | 50 U.S. Department of Health and Human Services ● Centers for Disease Control and Prevention ● National Center for Health Statistics ● Released 05/16

Early Release of Selected Estimates Based on Data From the National Health Interview Survey, 2015
Data tables for Figures 7.1–7.6:
Data table for Figure 7.1. Percentage of adults aged 18 and over who met 2008 federal physical activity guidelines for aerobic activity through leisure-time aerobic activity: United States, 1997–2015
Year Crude1 percent (95% confidence interval) Age-adjusted2 percent (95% confidence interval)
1997 43.6 (42.5-44.6) 43.3 (42.2-44.3)
1998 40.3 (39.5-41.1) 40.1 (39.3-40.9)
1999 41.1 (40.3-41.9) 40.9 (40.2-41.7)
2000 42.4 (41.6-43.2) 42.3 (41.5-43.1)
2001 43.0 (42.2-43.8) 42.9 (42.1-43.7)
2002 43.0 (42.1-43.9) 42.9 (42.1-43.8)
2003 43.4 (42.5-44.3) 43.3 (42.4-44.2)
2004 41.7 (40.8-42.6) 41.6 (40.8-42.5)
2005 41.0 (40.18-41.89) 41.1 (40.21-41.90)
2006 41.4 (40.31-42.42) 41.4 (40.37-42.47)
2007 41.5 (40.36-42.63) 41.5 (40.33-42.59)
2008 43.4 (42.33-44.47) 43.5 (42.43-44.58)
2009 47.0 (46.05-47.95) 47.2 (46.25-48.16)
2010 46.9 (45.96-47.78) 47.1 (46.20-47.98)
2011 48.4 (47.42-49.30) 48.7 (47.76-49.61)
2012 49.5 (48.51-50.49) 49.9 (48.92-50.87)
2013 49.3 (48.38-50.28) 49.9 (48.95-50.84)
2014 49.2 (48.21-50.24) 49.8 (48.78-50.82)
2015 49.0 (47.98-49.95) 49.7 (48.72-50.69)
1Crude estimates are presented. 2Estimates for this Healthy People 2020 Leading Health Indicator are age-adjusted using the projected 2000 U.S. population as the standard population and five age groups: 18–24, 25–34, 35–44, 45–64, and 65 and over.
NOTES: Data are based on household interviews of a sample of the civilian noninstitutionalized population. Beginning with 2012 data, the National Health Interview Survey transitioned to weights derived from the 2010 census. For 2003–2011 data, weights were derived from the 2000 census. In this Early Release, estimates for 2000–2002 were recalculated using weights derived from the 2000 census. For 1997–1999 data, weights were derived from the 1990 census. See Technical Notes for more details.
DATA SOURCE: NCHS, National Health Interview Survey, 1997–2015, Sample Adult Core component.
P ag e | 51 U.S. Department of Health and Human Services ● Centers for Disease Control and Prevention ● National Center for Health Statistics ● Released 05/16

Early Release of Selected Estimates Based on Data From the National Health Interview Survey, 2015
Data table for Figure 7.2. Percentage of adults aged 18 and over who met 2008 federal physical activity guidelines for aerobic activity through leisure-time aerobic activity, by age group and sex: United States, 2015
Age (years) and sex Percent 95% confidence interval
18–24, total 59.0 56.30-61.61
18–24, male 64.3 60.45-68.12
18–24, female 53.6 50.24-56.88
25–64, total 50.6 49.58-51.69
25–64, male 53.1 51.71-54.59
25–64, female 48.2 46.96-49.53
65–74, total 43.3 41.13-45.38
65–74, male 47.1 43.93-50.28
65–74, female 39.9 37.12-42.66
75 and over, total 27.1 25.13-29.02
75 and over, male 30.9 27.85-34.02
75 and over, female 24.3 21.96-26.68
18 and over (crude1), total 49.0 47.98-49.95
18 and over (crude1), male 52.4 51.13-53.67
18 and over (crude1), female 45.8 44.60-46.95
18 and over (age-adjusted2), total 49.7 48.72-50.69
18 and over (age-adjusted2), male 52.9 51.62-54.20
18 and over (age-adjusted2), female 46.7 45.55-47.89
1Crude estimates are presented. 2Estimates for this Healthy People 2020 Leading Health Indicator are age-adjusted using the projected 2000 U.S. population as the standard population and five age groups: 18–24, 25–34, 35–44, 45–64, and 65 and over.
NOTE: Data are based on household interviews of a sample of the civilian noninstitutionalized population.
DATA SOURCE: NCHS, National Health Interview Survey, 2015, Sample Adult Core component.
Data table for Figure 7.3. Adjusted percentage of adults aged 18 and over who met 2008 federal physical activity guidelines for aerobic activity through leisure-time aerobic activity, by race/ethnicity: United States, 2015
Race/ethnicity Age-sex-adjusted1 percent (95% confidence interval)
Age-adjusted2 percent (95% confidence interval)
Hispanic or Latino 43.0 (41.14-44.83) 43.0 (41.20-44.90)
Not Hispanic or Latino, single race, white 52.9 (51.64-54.19) 53.0 (51.70-54.23)
Not Hispanic or Latino, single race, black 42.4 (40.43-44.28) 41.8 (39.98-43.69)
1Estimates are age-sex-adjusted using the projected 2000 U.S. population as the standard population and five age groups: 18–24, 25–34, 35– 44, 45–64, and 65 and over. 2Estimates for this Healthy People 2020 Leading Health Indicator are age-adjusted using the projected 2000 U.S. population as the standard population and five age groups: 18–24, 25–34, 35–44, 45–64, and 65 and over.
NOTE: Data are based on household interviews of a sample of the civilian noninstitutionalized population.
DATA SOURCE: NCHS, National Health Interview Survey, 2015, Sample Adult Core component.
P ag e | 52 U.S. Department of Health and Human Services ● Centers for Disease Control and Prevention ● National Center for Health Statistics ● Released 05/16

Early Release of Selected Estimates Based on Data From the National Health Interview Survey, 2015
Data table for Figure 7.4. Percentage of adults aged 18 and over who met 2008 federal physical activity guidelines for both aerobic and muscle-strengthening activities through leisure-time aerobic and muscle-strengthening activities: United States, 1997–2015
Year Crude1 percent (95% confidence interval) Age-adjusted2 percent (95% confidence interval)
1997 16.3 (15.5-17.1) 16.1 (15.3-16.9)
1998 14.5 (14.0-15.1) 14.4 (13.9-14.9)
1999 15.2 (14.6-15.8) 15.0 (14.5-15.6)
2000 15.1 (14.5-15.7) 15.0 (14.5-15.6)
2001 16.6 (16.1-17.2) 16.5 (16.0-17.1)
2002 16.8 (16.2-17.4) 16.7 (16.2-17.3)
2003 16.9 (16.3-17.6) 16.9 (16.3-17.5)
2004 16.1 (15.5-16.7) 16.1 (15.5-16.7)
2005 16.5 (15.96-17.13) 16.6 (15.99-17.14)
2006 16.0 (15.30-16.80) 16.1 (15.37-16.87)
2007 16.5 (15.79-17.19) 16.5 (15.83-17.20)
2008 18.1 (17.38-18.91) 18.2 (17.49-19.00)
2009 18.8 (18.14-19.56) 19.0 (18.32-19.75)
2010 20.4 (19.69-21.06) 20.6 (19.90-21.25)
2011 20.5 (19.79-21.31) 20.8 (20.05-21.56)
2012 20.2 (19.45-20.99) 20.6 (19.79-21.31)
2013 20.4 (19.65-21.10) 20.7 (19.99-21.45)
2014 20.8 (20.01-21.60) 21.2 (20.43-22.06)
2015 20.9 (20.20-21.66) 21.4 (20.69-22.17)
1Crude estimates are presented. 2Estimates for this Healthy People 2020 Leading Health Indicator are age-adjusted using the projected 2000 U.S. population as the standard population and five age groups: 18–24, 25–34, 35–44, 45–64, and 65 and over.
NOTES: Data are based on household interviews of a sample of the civilian noninstitutionalized population. Beginning with 2012 data, the National Health Interview Survey transitioned to weights derived from the 2010 census. For 2003–2011 data, weights were derived from the 2000 census. In this Early Release, estimates for 2000–2002 were recalculated using weights derived from the 2000 census. For 1997–1999 data, weights were derived from the 1990 census. See Technical Notes for more details.
DATA SOURCE: NCHS, National Health Interview Survey, 1997–2015, Sample Adult Core component.
P ag e | 53 U.S. Department of Health and Human Services ● Centers for Disease Control and Prevention ● National Center for Health Statistics ● Released 05/16

Early Release of Selected Estimates Based on Data From the National Health Interview Survey, 2015
Data table for Figure 7.5. Percentage of adults aged 18 and over who met 2008 federal physical activity guidelines for both aerobic and muscle-strengthening activities through leisure-time aerobic and muscle-strengthening activities, by age group and sex: United States, 2015
Age (years) and sex Percent 95% confidence interval
18–24, total 29.8 27.28-32.23
18–24, male 37.3 33.59-40.92
18–24, female 22.2 19.34-24.99
25–64, total 21.7 20.89-22.42
25–64, male 25.2 24.11-26.36
25–64, female 18.3 17.31-19.21
65–74, total 15.5 13.70-17.21
65–74, male 15.7 13.48-17.92
65–74, female 15.2 12.83-17.65
75 and over, total 8.7 7.32-10.02
75 and over, male 9.4 7.49-11.22
75 and over, female 8.2 6.48-9.89
18 and over (crude1), total 20.9 20.20-21.66
18 and over (crude1), male 24.7 23.56-25.75
18 and over (crude1), female 17.5 16.63-18.31
18 and over (age-adjusted2), total 21.4 20.69-22.17
18 and over (age-adjusted2), male 25.1 24.02-26.19
18 and over (age-adjusted2), female 17.9 17.01-18.73
1Crude estimates are presented. 2Estimates for this Healthy People 2020 Leading Health Indicator are age-adjusted using the projected 2000 U.S. population as the standard population and five age groups: 18–24, 25–34, 35–44, 45–64, and 65 and over.
NOTE: Data are based on household interviews of a sample of the civilian noninstitutionalized population.
DATA SOURCE: NCHS, National Health Interview Survey, 2015, Sample Adult Core component.
Data table for Figure 7.6. Adjusted percentage of adults aged 18 and over who met 2008 federal physical activity guidelines for both aerobic and muscle-strengthening activities through leisure-time aerobic and muscle-strengthening activities, by race/ethnicity: United States, 2015
Race/ethnicity Age-sex-adjusted1 percent (95% confidence interval)
Age-adjusted2 percent (95% confidence interval)
Hispanic or Latino 16.4 (15.16-17.62) 16.5 (15.24-17.69)
Not Hispanic or Latino, single race, white 23.3 (22.34-24.31) 23.3 (22.34-24.32)
Not Hispanic or Latino, single race, black 20.2 (18.53-21.91) 19.7 (18.02-21.31)
1Estimates are age-sex-adjusted using the projected 2000 U.S. population as the standard population and five age groups: 18–24, 25–34, 35– 44, 45–64, and 65 and over. 2Estimates for this Healthy People 2020 Leading Health Indicator are age-adjusted using the projected 2000 U.S. population as the standard population and five age groups: 18–24, 25–34, 35–44, 45–64, and 65 and over.
NOTE: Data are based on household interviews of a sample of the civilian noninstitutionalized population.
DATA SOURCE: NCHS, National Health Interview Survey, 2015, Sample Adult Core component.
P ag e | 54 U.S. Department of Health and Human Services ● Centers for Disease Control and Prevention ● National Center for Health Statistics ● Released 05/16

Early Release of Selected Estimates Based on Data From the National Health Interview Survey, 2015
Current smoking
Figure 8.1. Prevalence of current cigarette smoking among adults aged 18 and over: United States, 1997–2015
10
15
20
25
30
1997199819992000200120022003200420052006200720082009201020112012201320142015
Percent 95% confidence interval
NOTES: Data are based on household interviews of a sample of the civilian noninstitutionalized population. Current cigarette smokers were defined as those who had smoked more than 100 cigarettes in their lifetime and now smoke every day or some days. The analyses exclude persons with unknown cigarette smoking status (about 2% of respondents each year). See Technical Notes for more details.
DATA SOURCE: NCHS, National Health Interview Survey, 1997–2015, Sample Adult Core component.
For 2015, the percentage of adults aged 18 and over who were current cigarette smokers was 15.1% (95% confidence interval = 14.46%–15.72%), which was lower than the 2014 estimate of 16.8%.
The prevalence of current cigarette smoking among U.S. adults declined from 24.7% in 1997 to 15.1% in2015.
P ag e | 55 U.S. Department of Health and Human Services ● Centers for Disease Control and Prevention ● National Center for Health Statistics ● Released 05/16

Early Release of Selected Estimates Based on Data From the National Health Interview Survey, 2015
Figure 8.2. Percent distribution of cigarette smoking status among adults aged 18 and over, by sex: United States, 2015
Total Male Female Percent
80 95% confidence interval
60
40
20
0 Never Former Current
Smoking status
NOTES: Data are based on household interviews of a sample of the civilian noninstitutionalized population. Current cigarette smokers were defined as those who had smoked more than 100 cigarettes in their lifetime and now smoke every day or some days. The analyses exclude the 0.4% of persons with unknown smoking status. See Technical Notes for more details.
DATA SOURCE: NCHS, National Health Interview Survey, 2015, Sample Adult Core component.
The percentage of current cigarette smokers was higher for men (16.7%) than for women (13.6%).
The percentage of former cigarette smokers was higher for men (25.0%) than for women (18.9%).
The percentage of those who had never smoked cigarettes was higher for women (67.5%) than for men (58.3%).
P ag e | 56 U.S. Department of Health and Human Services ● Centers for Disease Control and Prevention ● National Center for Health Statistics ● Released 05/16

Early Release of Selected Estimates Based on Data From the National Health Interview Survey, 2015
Figure 8.3. Prevalence of current cigarette smoking among adults aged 18 and over, by age group and sex: United States, 2015
0
5
10
15
20
25
30
18 and over 18–44 45–64 65 and over
Percent Total Male Female
95% confidence interval
Age group (years)
NOTES: Data are based on household interviews of a sample of the civilian noninstitutionalized population. Current cigarette smokers were defined as those who had smoked more than 100 cigarettes in their lifetime and now smoke every day or some days. The analyses exclude the 0.4% of persons with unknown cigarette smoking status. See Technical Notes for more details.
DATA SOURCE: NCHS, National Health Interview Survey, 2015, Sample Adult Core component.
For both sexes combined, the percentage of adults who were current cigarette smokers by age group waslower among adults aged 65 and over (8.4%) than among those aged 18–44 (16.5%) and 45–64 (16.9%).This pattern in current cigarette smoking by age group was seen in both men and women.
For adults aged 18 and over and age groups 18–44 and 65 and over, men were more likely than womento be current cigarette smokers.
P ag e | 57 U.S. Department of Health and Human Services ● Centers for Disease Control and Prevention ● National Center for Health Statistics ● Released 05/16

Early Release of Selected Estimates Based on Data From the National Health Interview Survey, 2015
Figure 8.4. Age-sex-adjusted prevalence of current cigarette smoking among adults aged 18 and over, by race/ethnicity: United States, 2015
Percent 95% confidence interval 30
25
20
15
10
5
0 Hispanic White Black
Non-Hispanic
NOTES: Data are based on household interviews of a sample of the civilian noninstitutionalized population. Current cigarette smokers were defined as those who had smoked more than 100 cigarettes in their lifetime and now smoke every day or some days. The analyses exclude the 0.4% of persons with unknown cigarette smoking status. Estimates are age-sex-adjusted using the projected 2000 U.S. population as the standard population and five age groups: 18–24, 25–34, 35–44, 45–64, and 65 and over. See Technical Notes for more details.
DATA SOURCE: NCHS, National Health Interview Survey, 2015, Sample Adult Core component.
The age-sex-adjusted prevalence of current cigarette smoking by race/ethnicity was 9.9% for Hispanicadults, 17.4% for non-Hispanic white adults, and 16.8% for non-Hispanic black adults.
Hispanic adults were less likely to be current cigarette smokers compared with non-Hispanic black adultsand non-Hispanic white adults.
P ag e | 58 U.S. Department of Health and Human Services ● Centers for Disease Control and Prevention ● National Center for Health Statistics ● Released 05/16
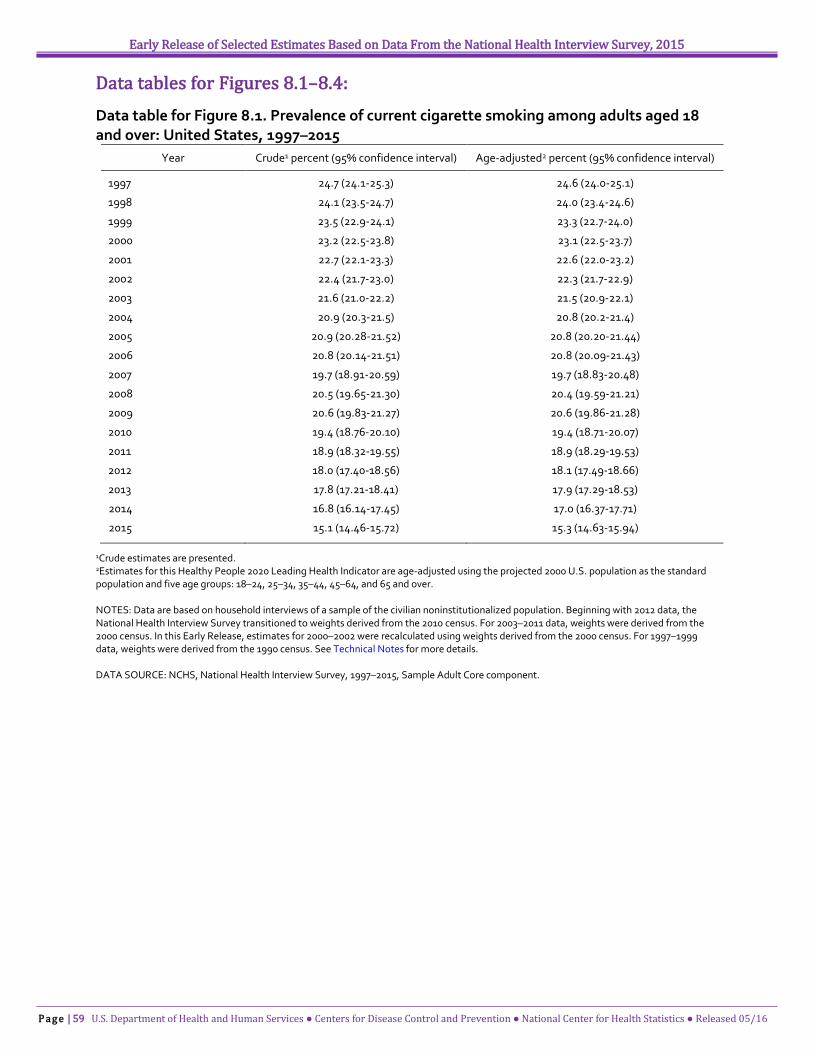
Early Release of Selected Estimates Based on Data From the National Health Interview Survey, 2015
Data tables for Figures 8.1–8.4:
Data table for Figure 8.1. Prevalence of current cigarette smoking among adults aged 18 and over: United States, 1997–2015
Year Crude1 percent (95% confidence interval) Age-adjusted2 percent (95% confidence interval)
1997 24.7 (24.1-25.3) 24.6 (24.0-25.1)
1998 24.1 (23.5-24.7) 24.0 (23.4-24.6)
1999 23.5 (22.9-24.1) 23.3 (22.7-24.0)
2000 23.2 (22.5-23.8) 23.1 (22.5-23.7)
2001 22.7 (22.1-23.3) 22.6 (22.0-23.2)
2002 22.4 (21.7-23.0) 22.3 (21.7-22.9)
2003 21.6 (21.0-22.2) 21.5 (20.9-22.1)
2004 20.9 (20.3-21.5) 20.8 (20.2-21.4)
2005 20.9 (20.28-21.52) 20.8 (20.20-21.44)
2006 20.8 (20.14-21.51) 20.8 (20.09-21.43)
2007 19.7 (18.91-20.59) 19.7 (18.83-20.48)
2008 20.5 (19.65-21.30) 20.4 (19.59-21.21)
2009 20.6 (19.83-21.27) 20.6 (19.86-21.28)
2010 19.4 (18.76-20.10) 19.4 (18.71-20.07)
2011 18.9 (18.32-19.55) 18.9 (18.29-19.53)
2012 18.0 (17.40-18.56) 18.1 (17.49-18.66)
2013 17.8 (17.21-18.41) 17.9 (17.29-18.53)
2014 16.8 (16.14-17.45) 17.0 (16.37-17.71)
2015 15.1 (14.46-15.72) 15.3 (14.63-15.94)
1Crude estimates are presented. 2Estimates for this Healthy People 2020 Leading Health Indicator are age-adjusted using the projected 2000 U.S. population as the standard population and five age groups: 18–24, 25–34, 35–44, 45–64, and 65 and over.
NOTES: Data are based on household interviews of a sample of the civilian noninstitutionalized population. Beginning with 2012 data, the National Health Interview Survey transitioned to weights derived from the 2010 census. For 2003–2011 data, weights were derived from the 2000 census. In this Early Release, estimates for 2000–2002 were recalculated using weights derived from the 2000 census. For 1997–1999 data, weights were derived from the 1990 census. See Technical Notes for more details.
DATA SOURCE: NCHS, National Health Interview Survey, 1997–2015, Sample Adult Core component.
P ag e | 59 U.S. Department of Health and Human Services ● Centers for Disease Control and Prevention ● National Center for Health Statistics ● Released 05/16

Early Release of Selected Estimates Based on Data From the National Health Interview Survey, 2015
Data table for Figure 8.2. Percent distribution of cigarette smoking status among adults aged 18 and over, by sex: United States, 2015
Smoking status and sex Percent 95% confidence interval
Never, total 63.0 62.12-63.97
Never, male 58.3 57.02-59.49
Never, female 67.5 66.44-68.55
Former, total 21.9 21.16-22.58
Former, male 25.0 24.04-26.02
Former, female 18.9 18.10-19.74
Current, total 15.1 14.46-15.72
Current, male 16.7 15.85-17.58
Current, female 13.6 12.85-14.30
NOTE: Data are based on household interviews of a sample of the civilian noninstitutionalized population.
DATA SOURCE: NCHS, National Health Interview Survey, 2015, Sample Adult Core component.
Data table for Figure 8.3. Prevalence of current cigarette smoking among adults aged 18 and over, by age group and sex: United States, 2015
Age (years) and sex Percent 95% confidence interval
18–44, total 16.5 15.53-17.47
18–44, male 18.5 17.11-19.94
18–44, female 14.5 13.43-15.62
45–64, total 16.9 15.92-17.90
45–64, male 17.8 16.45-19.16
45–64, female 16.1 14.81-17.33
65 and over, total 8.4 7.62-9.16
65 and over, male 9.7 8.48-10.93
65 and over, female 7.3 6.38-8.30
18 and over (crude1), total 15.1 14.46-15.72
18 and over (crude1), male 16.7 15.85-17.58
18 and over (crude1), female 13.6 12.85-14.30
18 and over (age-adjusted2), total 15.3 14.63-15.94
18 and over (age-adjusted2), male 16.8 15.92-17.69
18 and over (age-adjusted2), female 13.8 13.09-14.60
1Crude estimates are presented. 2Estimates for this Healthy People 2020 Leading Health Indicator are age-adjusted using the projected 2000 U.S. population as the standard population and five age groups: 18–24, 25–34, 35–44, 45–64, and 65 and over.
NOTE: Data are based on household interviews of a sample of the civilian noninstitutionalized population.
DATA SOURCE: NCHS, National Health Interview Survey, 2015, Sample Adult Core component.
P ag e | 60 U.S. Department of Health and Human Services ● Centers for Disease Control and Prevention ● National Center for Health Statistics ● Released 05/16

Early Release of Selected Estimates Based on Data From the National Health Interview Survey, 2015
Data table for Figure 8.4. Age-sex-adjusted prevalence of current cigarette smoking among adults aged 18 and over, by race/ethnicity: United States, 2015
Race/ethnicity Age-sex-adjusted1 percent (95% confidence interval)
Age-adjusted2 percent (95% confidence interval)
Hispanic or Latino 9.9 (8.95-10.78) 9.9 (9.01-10.85)
Not Hispanic or Latino, single race, white 17.4 (16.44-18.26) 17.4 (16.45-18.27)
Not Hispanic or Latino, single race, black 16.8 (15.37-18.28) 16.6 (15.14-18.00)
1Estimates are age-sex-adjusted using the projected 2000 U.S. population as the standard population and five age groups: 18–24, 25–34, 35– 44, 45–64, and 65 and over. 2Estimates for this Healthy People 2020 Leading Health Indicator are age-adjusted using the projected 2000 U.S. population as the standard population and five age groups: 18–24, 25–34, 35–44, 45–64, and 65 and over.
NOTE: Data are based on household interviews of a sample of the civilian noninstitutionalized population.
DATA SOURCE: NCHS, National Health Interview Survey, 2015, Sample Adult Core component.
P ag e | 61 U.S. Department of Health and Human Services ● Centers for Disease Control and Prevention ● National Center for Health Statistics ● Released 05/16

The p ercentage of men who had at least 1 heavy drinking day in the past year decreased from 31.6% in 1997 to 27.8% in 2006, and then increased to 32.4% in 2009. From 2009 through 2013, the percentage of men who had at least 1 heavy drinking day in the past year remained stable.
Early Release of Selected Estimates Based on Data From the National Health Interview Survey, 2015
Alcohol consumption
Figure 9.1. Percentage of adults aged 18 and over who had at least 1 heavy drinking day in the past year, by sex: United States, 1997–2015
0
5
10
15
20
25
30
35
40
1997 1998 1999 2000 2001 2002 2003 2004 2005 2006 2007 2008 2009 2010 2011 2012 2013 2014 2015
Percent Male Female
95% confidence interval
†
† For 1997–2013, the alcohol consumption estimates presented were for the percentage of adults aged 18 and over who had five or more drinks in 1 day at least once in the past year, regardless of sex. However, in the 2014 National Health Interview Survey (NHIS), the survey questions were changed; male and female respondents were asked about a different quantity of drinks consumed in a day in the past year. As a result, the estimates presented for 2014 and later (dashed line) were for men aged 18 and over who had five or more drinks in 1 day at least once in the past year and for women aged 18 and over who had four or more drinks in 1 day at least once in the past year. Differences observed in estimates for women based on the 2014 and later NHIS may be partially or fully attributable to these changes in the survey questions on alcohol consumption.
NOTES: Data are based on household interviews of a sample of the civilian noninstitutionalized population. The analyses exclude adults with unknown alcohol consumption (about 1% of respondents each year). See Technical Notes for more details.
DATA SOURCE: NCHS, National Health Interview Survey, 1997–2015, Sample Adult Core component.
For 2015, the percentage of men who had at least 1 heavy drinking day in the past year was 29.9% (95%confidence interval = 28.68%–31.18%). The percentage of women who had at least one heavy drinkingday in the past year was 17.4% (95% confidence interval = 16.56%–18.29%).
The percentage of men who had at least 1 heavy drinking day in the past year during 2015 (29.9%) was lower than, but not significantly different from, the 2014 estimate of 31.4%.
The p ercentage of women who had at least 1 heavy drinking day in the past year increased from 11.2% in 2004 to 14.5% in 2013.
P ag e | 62 U.S. Department of Health and Human Services ● Centers for Disease Control and Prevention ● National Center for Health Statistics ● Released 05/16

Early Release of Selected Estimates Based on Data From the National Health Interview Survey, 2015
The percentage of women who had at least 1 heavy drinking day in the past year during 2015 (17.4%) was lower than the 2014 estimate of 18.9%.
P ag e | 63 U.S. Department of Health and Human Services ● Centers for Disease Control and Prevention ● National Center for Health Statistics ● Released 05/16

Early Release of Selected Estimates Based on Data From the National Health Interview Survey, 2015
Figure 9.2. Percentage of adults aged 18 and over who had at least 1 heavy drinking day in the past year, by age group and sex: United States, 2015
0
10
20
30
40
50
18 and over 18–24 25–44 45–64 65 and over
Percent Total Male Female 95% confidence interval
Age group (years)
NOTES: Data are based on household interviews of a sample of the civilian noninstitutionalized population. Heavy drinking days are defined as days in which men consumed five or more drinks and women consumed four or more drinks. The analyses exclude the 1.0% of adults with unknown alcohol consumption. See Technical Notes for more details.
DATA SOURCE: NCHS, National Health Interview Survey, 2015, Sample Adult Core component.
For 2015, the percentage of adults who had at least 1 heavy drinking day in the past year was 23.4% (95% confidence interval = 22.52%–24.34%).
For both sexes combined, the percentage of adults who had at least 1 heavy drinking day in the past yearwas highest among adults aged 18–24 (30.1%) and 25–44 (33.2%), and decreased with increasing age after age 45. This pattern was found for both men and women.
For adults aged 18 and over and age groups 18–24, 25–44, 45–64, and 65 and over, men were more likelythan women to have had at least 1 heavy drinking day in the past year.
P ag e | 64 U.S. Department of Health and Human Services ● Centers for Disease Control and Prevention ● National Center for Health Statistics ● Released 05/16

Early Release of Selected Estimates Based on Data From the National Health Interview Survey, 2015
Figure 9.3. Age-sex-adjusted percentage of adults aged 18 and over who had at least 1 heavy drinking day in the past year, by race/ethnicity: United States, 2015
Percent 95% confidence interval 35
30
25
20
15
10
5
0 Hispanic White Black
Non-Hispanic
NOTES: Data are based on household interviews of a sample of the civilian noninstitutionalized population. Heavy drinking days are defined as days in which men consumed five or more drinks and women consumed four or more drinks. The analyses exclude the 1.0% of adults with unknown alcohol consumption. Estimates are age-sex-adjusted using the projected 2000 U.S. population as the standard population and four age groups: 18–24, 25–44, 45–64, and 65 and over. See Technical Notes for more details.
DATA SOURCE: NCHS, National Health Interview Survey, 2015, Sample Adult Core component.
The age-sex-adjusted percentages of adults by race/ethnicity who had at least 1 heavy drinking day in the past year were 21.1% for Hispanic adults, 28.7% for non-Hispanic white adults, and 16.6% for non-Hispanic black adults.
Non-Hispanic white adults were the most likely to have had at least 1 heavy drinking day in the past year, followed by Hispanic adults and non-Hispanic black adults. Hispanic adults were more likely to have hadat least 1 heavy drinking day in the past year compared to non-Hispanic black adults.
P ag e | 65 U.S. Department of Health and Human Services ● Centers for Disease Control and Prevention ● National Center for Health Statistics ● Released 05/16

Early Release of Selected Estimates Based on Data From the National Health Interview Survey, 2015
Data tables for Figures 9.1–9.3:
Data table for Figure 9.1. Percentage of adults aged 18 and over who had at least 1 heavy drinking day in the past year, by sex: United States, 1997–2015
Year and sex Crude1 percent (95% confidence interval) Age-adjusted2 percent (95% confidence interval)
1997, male 31.6 (30.6-32.5) 30.6 (29.7-31.5) 1997, female 12.1 (11.5-12.7) 12.2 (11.6-12.7) 1998, male 29.9 (28.9-30.9) 29.0 (28.1-29.9) 1998, female 11.4 (10.8-12.1) 11.5 (10.9-12.1) 1999, male 29.8 (28.7-30.9) 29.0 (28.0-30.0) 1999, female 11.7 (11.1-12.4) 11.8 (11.2-12.5) 2000, male 28.9 (27.9-29.9) 28.2 (27.2-29.2) 2000, female 10.6 (10.0-11.2) 10.8 (10.2-11.4) 2001, male 29.2 (28.3-30.2) 28.6 (27.7-29.4) 2001, female 11.6 (11.0-12.3) 11.9 (11.3-12.5) 2002, male 29.2 (28.2-30.3) 28.7 (27.7-29.7) 2002, female 11.5 (10.9-12.1) 11.8 (11.2-12.4) 2003, male 27.8 (26.7-28.8) 27.3 (26.3-28.3) 2003, female 11.3 (10.7-12.0) 11.6 (10.9-12.3) 2004, male 27.7 (26.6-28.8) 27.3 (26.2-28.4) 2004, female 11.2 (10.7-11.9) 11.6 (11.0-12.2) 2005, male 28.1 (27.14-29.15) 27.9 (26.91-28.81) 2005, female 11.6 (10.95-12.28) 12.0 (11.38-12.72) 2006, male 27.8 (26.54-29.01) 27.6 (26.38-28.72) 2006, female 12.1 (11.41-12.86) 12.6 (11.83-13.29) 2007, male 29.0 (27.58-30.44) 28.9 (27.56-30.27) 2007, female 12.4 (11.53-13.32) 13.0 (12.05-13.88) 2008, male 30.8 (29.38-32.24) 30.8 (29.42-32.19) 2008, female 13.8 (12.91-14.72) 14.5 (13.56-15.47) 2009, male 32.4 (31.05-33.80) 32.6 (31.20-33.91) 2009, female 13.8 (13.01-14.66) 14.5 (13.72-15.36) 2010, male 31.5 (30.36-32.66) 31.8 (30.64-32.89) 2010, female 14.6 (13.81-15.42) 15.4 (14.56-16.19) 2011, male 31.2 (30.08-32.28) 31.6 (30.54-32.67) 2011, female 13.6 (12.91-14.38) 14.4 (13.69-15.20) 2012, male 31.4 (30.28-32.52) 31.9 (30.80-33.06) 2012, female 14.2 (13.45-15.01) 15.2 (14.41-16.00) 2013, male 30.9 (29.82-32.01) 31.7 (30.60-32.71) 2013, female 14.5 (13.75-15.25) 15.6 (14.73-16.37) 2014, male3 31.4 (30.25-32.63) 32.3 (31.13-33.53) 2014, female3 18.9 (17.96-19.86) 20.2 (19.27-21.20) 2015, male3 29.9 (28.68-31.18) 30.8 (29.61-32.06) 2015, female3 17.4 (16.56-18.29) 18.6 (17.70-19.54)
1Crude estimates are presented. 2Estimates are age-adjusted using the projected 2000 U.S. population as the standard population and four age groups: 18–24, 25–44, 45–64, and 65 and over. 3For 1997–2013, the alcohol consumption estimates presented were for the percentage of adults aged 18 and over who had five or more drinks in 1 day at least once in the past year, regardless of sex. However, in the 2014 National Health Interview Survey (NHIS), the survey questions were changed; male and female respondents were asked about a different quantity of drinks consumed in a day in the past year. As a result, the estimates presented for 2014 and later were for men aged 18 and over who had five or more drinks in 1 day at least once in the past year and for women aged 18 and over who had four or more drinks in 1 day at least once in the past year. Differences observed in estimates for women based on the 2014 and earlier NHIS may be partially or fully attributable to these changes in the survey questions on alcohol consumption.
NOTES: Data are based on household interviews of a sample of the civilian noninstitutionalized population. Beginning with 2012 dataNHIS transitioned to weights derived from the 2010 census. For 2003–2011 data, weights were derived from the 2000 census. In this Early Release, estimates for 2000–2002 were recalculated using weights derived from the 2000 census. For 1997–1999 data, weights were derived from the 1990 census. See Technical Notes for more details.
DATA SOURCE: NCHS, National Health Interview Survey, 1997–2015, Sample Adult Core component.
P ag e | 66 U.S. Department of Health and Human Services ● Centers for Disease Control and Prevention ● National Center for Health Statistics ● Released 05/16
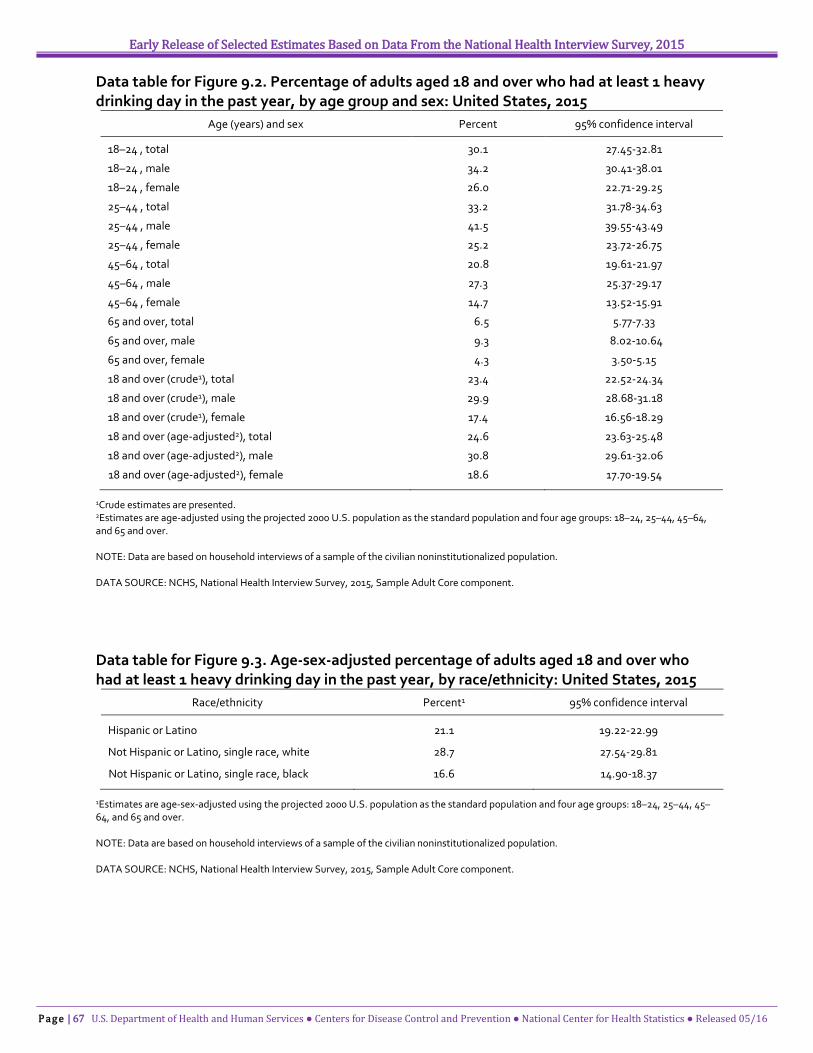
Early Release of Selected Estimates Based on Data From the National Health Interview Survey, 2015
Data table for Figure 9.2. Percentage of adults aged 18 and over who had at least 1 heavy drinking day in the past year, by age group and sex: United States, 2015
Age (years) and sex Percent 95% confidence interval
18–24 , total 30.1 27.45-32.81
18–24 , male 34.2 30.41-38.01
18–24 , female 26.0 22.71-29.25
25–44 , total 33.2 31.78-34.63
25–44 , male 41.5 39.55-43.49
25–44 , female 25.2 23.72-26.75
45–64 , total 20.8 19.61-21.97
45–64 , male 27.3 25.37-29.17
45–64 , female 14.7 13.52-15.91
65 and over, total 6.5 5.77-7.33
65 and over, male 9.3 8.02-10.64
65 and over, female 4.3 3.50-5.15
18 and over (crude1), total 23.4 22.52-24.34
18 and over (crude1), male 29.9 28.68-31.18
18 and over (crude1), female 17.4 16.56-18.29
18 and over (age-adjusted2), total 24.6 23.63-25.48
18 and over (age-adjusted2), male 30.8 29.61-32.06
18 and over (age-adjusted2), female 18.6 17.70-19.54
1Crude estimates are presented. 2Estimates are age-adjusted using the projected 2000 U.S. population as the standard population and four age groups: 18–24, 25–44, 45–64, and 65 and over.
NOTE: Data are based on household interviews of a sample of the civilian noninstitutionalized population.
DATA SOURCE: NCHS, National Health Interview Survey, 2015, Sample Adult Core component.
Data table for Figure 9.3. Age-sex-adjusted percentage of adults aged 18 and over who had at least 1 heavy drinking day in the past year, by race/ethnicity: United States, 2015
Race/ethnicity Percent1 95% confidence interval
Hispanic or Latino 21.1 19.22-22.99
Not Hispanic or Latino, single race, white 28.7 27.54-29.81
Not Hispanic or Latino, single race, black 16.6 14.90-18.37
1Estimates are age-sex-adjusted using the projected 2000 U.S. population as the standard population and four age groups: 18–24, 25–44, 45– 64, and 65 and over.
NOTE: Data are based on household interviews of a sample of the civilian noninstitutionalized population.
DATA SOURCE: NCHS, National Health Interview Survey, 2015, Sample Adult Core component.
P ag e | 67 U.S. Department of Health and Human Services ● Centers for Disease Control and Prevention ● National Center for Health Statistics ● Released 05/16

Early Release of Selected Estimates Based on Data From the National Health Interview Survey, 2015
Human immunodeficiency virus testing
Figure 10.1. Percentage of adults aged 18 and over who had ever been tested for HIV: United States, 1997–2015
15
20
25
30
35
40
45
1997199819992000200120022003200420052006200720082009201020112012201320142015
Percent 95% confidence interval
0
† ††
†The AIDS Knowledge and Attitudes section of the National Health Interview Survey (NHIS) was dropped in 2011; only the human immunodeficiency virus (HIV) testing question was retained, and it was moved to the Adult Access to Health Care and Utilization section of the Sample Adult questionnaire. HIV testing estimates based on 2011–2012 NHIS (dashed line) are not comparable with those from 2010 and earlier, or 2013 and later. Differences observed in estimates based on 2011–2012 NHIS and on 2010 and earlier NHIS or 2013 and later NHIS may be partially or fully attributable to these changes in placement of the HIV testing question in the NHIS questionnaire. ††In 2013, the HIV testing question was moved from the Adult Access to Care and Utilization section of the Sample Adult questionnaire to the Adult Selected Items section of the Sample Adult questionnaire. HIV testing estimates based on 2013 and later NHIS (dotted line) are not comparable with those from 2012 and earlier. Differences observed in estimates based on 2012 and earlier NHIS and on 2013 and later NHIS may be partially or fully attributable to these changes in placement of the HIV testing question in the NHIS questionnaire.
NOTES: Data are based on household interviews of a sample of the civilian noninstitutionalized population. Persons who received HIV testing solely as a result of blood donation were considered not to have been tested for HIV. The analyses exclude those with unknown HIV test status (about 5% of respondents each year). See Technical Notes for more details.
DATA SOURCE: NCHS, National Health Interview Survey, 1997–2015, Sample Adult Core component.
For 2015, the percentage of adults who had ever been tested for HIV was 38.6% (95% confidenceinterval = 37.66%–39.45%), which was higher than, but not significantly different from, the 2014estimate of 37.5%.
The percentage of adults who had ever had an HIV test increased from 31.8% in 1997 to 39.5% in 2010.
P ag e | 68 U.S. Department of Health and Human Services ● Centers for Disease Control and Prevention ● National Center for Health Statistics ● Released 05/16
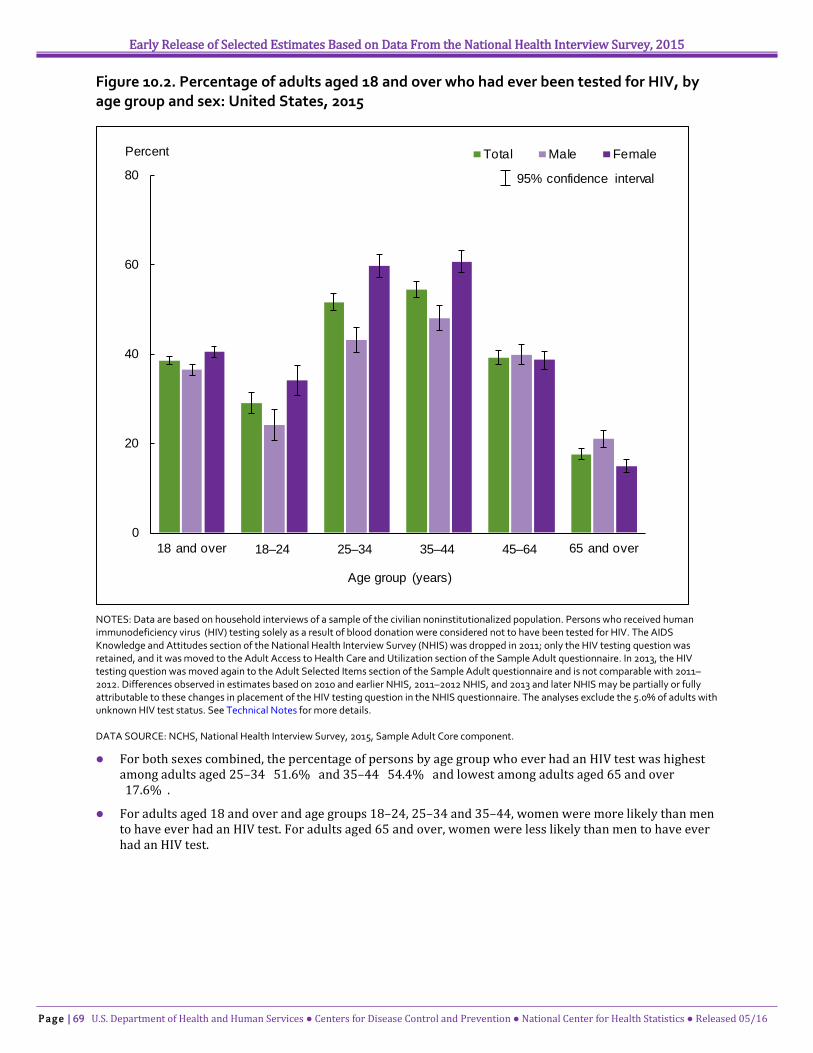
Early Release of Selected Estimates Based on Data From the National Health Interview Survey, 2015
Figure 10.2. Percentage of adults aged 18 and over who had ever been tested for HIV, by age group and sex: United States, 2015
0
20
40
60
80
18 and over 18–24 25–34 35–44 45–64 65 and over
Percent Total Male Female
95% confidence interval
Age group (years)
NOTES: Data are based on household interviews of a sample of the civilian noninstitutionalized population. Persons who received human immunodeficiency virus (HIV) testing solely as a result of blood donation were considered not to have been tested for HIV. The AIDS Knowledge and Attitudes section of the National Health Interview Survey (NHIS) was dropped in 2011; only the HIV testing question was retained, and it was moved to the Adult Access to Health Care and Utilization section of the Sample Adult questionnaire. In 2013, the HIV testing question was moved again to the Adult Selected Items section of the Sample Adult questionnaire and is not comparable with 2011– 2012. Differences observed in estimates based on 2010 and earlier NHIS, 2011–2012 NHIS, and 2013 and later NHIS may be partially or fully attributable to these changes in placement of the HIV testing question in the NHIS questionnaire. The analyses exclude the 5.0% of adults with unknown HIV test status. See Technical Notes for more details.
DATA SOURCE: NCHS, National Health Interview Survey, 2015, Sample Adult Core component.
For both sexes combined, the percentage of persons by age group who ever had an HIV test was highestamong adults aged 25–34 (51.6%) and 35–44 (54.4%) and lowest among adults aged 65 and over(17.6%).
For adults aged 18 and over and age groups 18–24, 25–34 and 35–44, women were more likely than mento have ever had an HIV test. For adults aged 65 and over, women were less likely than men to have everhad an HIV test.
P ag e | 69 U.S. Department of Health and Human Services ● Centers for Disease Control and Prevention ● National Center for Health Statistics ● Released 05/16
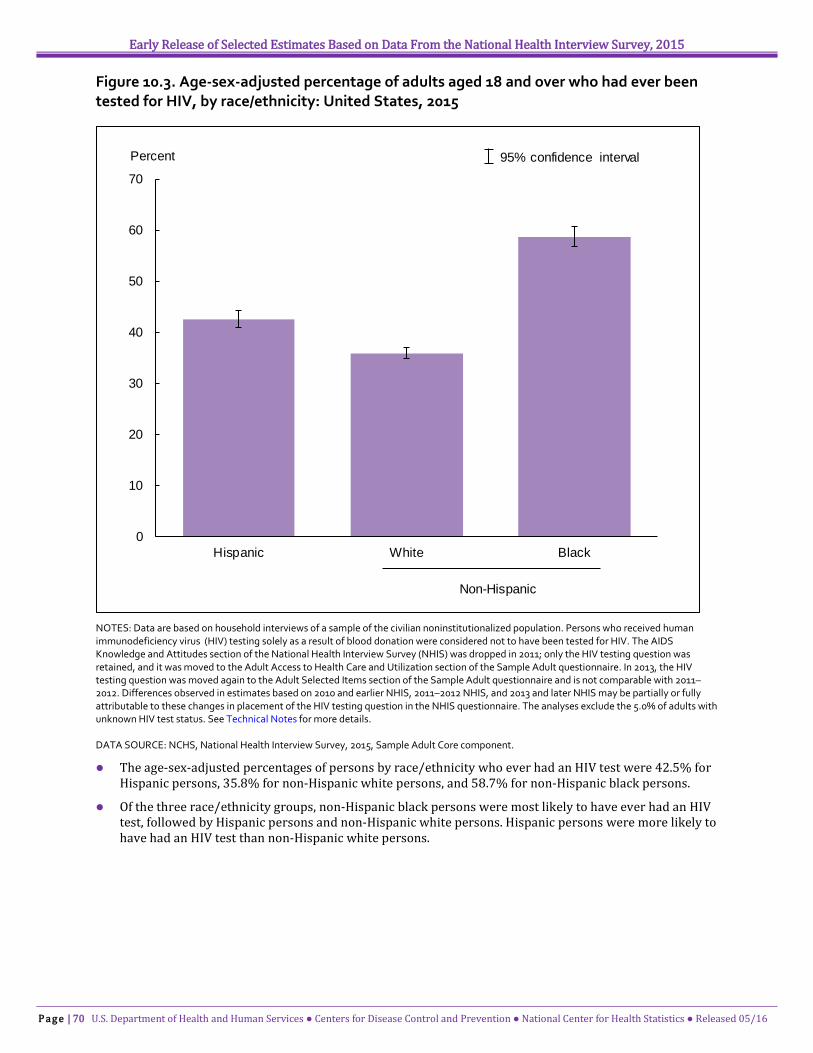
Early Release of Selected Estimates Based on Data From the National Health Interview Survey, 2015
Figure 10.3. Age-sex-adjusted percentage of adults aged 18 and over who had ever been tested for HIV, by race/ethnicity: United States, 2015
0
10
20
30
40
50
60
70
Percent 95% confidence interval
Hispanic White Black
Non-Hispanic
NOTES: Data are based on household interviews of a sample of the civilian noninstitutionalized population. Persons who received human immunodeficiency virus (HIV) testing solely as a result of blood donation were considered not to have been tested for HIV. The AIDS Knowledge and Attitudes section of the National Health Interview Survey (NHIS) was dropped in 2011; only the HIV testing question was retained, and it was moved to the Adult Access to Health Care and Utilization section of the Sample Adult questionnaire. In 2013, the HIV testing question was moved again to the Adult Selected Items section of the Sample Adult questionnaire and is not comparable with 2011– 2012. Differences observed in estimates based on 2010 and earlier NHIS, 2011–2012 NHIS, and 2013 and later NHIS may be partially or fully attributable to these changes in placement of the HIV testing question in the NHIS questionnaire. The analyses exclude the 5.0% of adults with unknown HIV test status. See Technical Notes for more details.
DATA SOURCE: NCHS, National Health Interview Survey, 2015, Sample Adult Core component.
The age-sex-adjusted percentages of persons by race/ethnicity who ever had an HIV test were 42.5% for Hispanic persons, 35.8% for non-Hispanic white persons, and 58.7% for non-Hispanic black persons.
Of the three race/ethnicity groups, non-Hispanic black persons were most likely to have ever had an HIVtest, followed by Hispanic persons and non-Hispanic white persons. Hispanic persons were more likely tohave had an HIV test than non-Hispanic white persons.
P ag e | 70 U.S. Department of Health and Human Services ● Centers for Disease Control and Prevention ● National Center for Health Statistics ● Released 05/16

Early Release of Selected Estimates Based on Data From the National Health Interview Survey, 2015
Data tables for Figures 10.1–10.3:
Data table for Figure 10.1. Percentage of adults aged 18 and over who had ever been tested for HIV: United States, 1997–2015
Year Crude1 percent (95% confidence interval) Age-adjusted2 percent (95% confidence interval)
1997 31.8 (31.1-32.5) 31.0 (30.4-31.6)
1998 30.2 (29.5-30.9) 29.6 (28.9-30.2)
1999 32.3 (31.6-33.0) 31.8 (31.1-32.5)
2000 32.1 (31.4-32.8) 31.8 (31.2-32.5)
2001 33.2 (32.5-34.0) 33.1 (32.4-33.7)
2002 34.5 (33.8-35.2) 34.5 (33.8-35.1)
2003 35.4 (34.7-36.1) 35.3 (34.7-36.0)
2004 34.6 (33.9-35.3) 34.8 (34.1-35.5)
2005 35.3 (34.58-36.01) 35.4 (34.73-36.10)
2006 35.8 (34.94-36.70) 36.1 (35.25-36.92)
2007 36.6 (35.59-37.62) 37.0 (35.28-38.79)
2008 38.7 (37.73-39.59) 39.2 (38.40-40.09)
2009 39.8 (38.70-40.84) 40.4 (39.36-41.40)
2010 39.5 (38.65-40.41) 40.3 (39.52-41.15)
20113 35.9 (35.14-36.72) 36.7 (35.97-37.51)
2012 34.8 (34.04-35.64) 35.8 (34.98-36.62)
20133 37.3 (36.33-38.20) 38.3 (37.42-39.25)
2014 37.5 (36.66-38.41) 38.8 (37.92-39.71)
2015 38.6 (37.66-39.45) 39.8 (38.95-40.73)
1Crude estimates are presented. 2Estimates are age-adjusted using the projected 2000 U.S. population as the standard population and five age groups: 18–24, 25–34, 35–44, 45–64, and 65 and over. 3The AIDS Knowledge and Attitudes section of the National Health Interview Survey (NHIS) was dropped in 2011; only the HIV testing question was retained, and it was moved to the Adult Access to Health Care and Utilization section of the Sample Adult questionnaire. In 2013, the HIV testing question was moved again to the Adult Selected Items section of the Sample Adult questionnaire. HIV testing estimates from these three periods (2010 and earlier, 2011–2012, and 2013 and later) are not comparable; differences observed in estimates may be partially or fully attributable to these changes in placement of the HIV testing question in the NHIS questionnaire.
NOTES: Data are based on household interviews of a sample of the civilian noninstitutionalized population. Beginning with 2012 data, NHIS transitioned to weights derived from the 2010 census. For 2003–2011 data, weights were derived from the 2000 census. In this Early Release, estimates for 2000–2002 were recalculated using weights derived from the 2000 census. For 1997–1999 data, weights were derived from the 1990 census. See Technical Notes for more details.
DATA SOURCE: NCHS, National Health Interview Survey, 1997–2015, Sample Adult Core component.
P ag e | 71 U.S. Department of Health and Human Services ● Centers for Disease Control and Prevention ● National Center for Health Statistics ● Released 05/16

Early Release of Selected Estimates Based on Data From the National Health Interview Survey, 2015
Data table for Figure 10.2. Percentage of adults aged 18 and over who had ever been tested for HIV, by age group and sex: United States, 2015
Age (years) and sex Percent 95% confidence interval
18–24 , total 29.1 26.69-31.42
18–24 , male 24.1 20.68-27.50
18–24 , female 34.1 30.70-37.55
25–34 , total 51.6 49.58-53.69
25–34 , male 43.2 40.31-45.99
25–34 , female 59.7 57.13-62.29
35–44 , total 54.4 52.66-56.22
35–44 , male 48.0 45.26-50.82
35–44 , female 60.6 58.18-63.05
45–64 , total 39.3 37.72-40.80
45–64 , male 39.9 37.67-42.10
45–64 , female 38.7 36.67-40.65
65 and over, total 17.6 16.26-18.90
65 and over, male 21.0 19.05-22.98
65 and over, female 14.9 13.34-16.36
18–64 , total 43.5 42.50-44.50
18–64 , male 39.8 38.49-41.05
18–64 , female 47.1 45.76-48.43
18 and over (crude1), total 38.6 37.66-39.45
18 and over (crude1), male 36.5 35.31-37.65
18 and over (crude1), female 40.5 39.31-41.65
18 and over (age-adjusted2), total 39.8 38.95-40.73
18 and over (age-adjusted2), male 37.0 35.84-38.20
18 and over (age-adjusted2), female 42.7 41.55-43.80
1Crude estimates are presented. 2Estimates are age-adjusted using the projected 2000 U.S. population as the standard population and five age groups: 18–24, 25–34, 35–44, 45–64, and 65 and over.
NOTES: Data are based on household interviews of a sample of the civilian noninstitutionalized population.
DATA SOURCE: NCHS, National Health Interview Survey, 2015, Sample Adult Core component.
P ag e | 72 U.S. Department of Health and Human Services ● Centers for Disease Control and Prevention ● National Center for Health Statistics ● Released 05/16

Early Release of Selected Estimates Based on Data From the National Health Interview Survey, 2015
Data table for Figure 10.3. Age-sex-adjusted percentage of adults aged 18 and over who had ever been tested for HIV, by race/ethnicity: United States, 2015
Race/ethnicity Percent1 95% confidence interval
Hispanic or Latino 42.5 40.80-44.18
Not Hispanic or Latino, single race, white 35.8 34.78-36.91
Not Hispanic or Latino, single race, black 58.7 56.83-60.65
1Estimates are age-sex-adjusted using the projected 2000 U.S. population as the standard population and five age groups: 18–24, 25–34, 35– 44, 45–64, and 65 and over.
NOTES: Data are based on household interviews of a sample of the civilian noninstitutionalized population.
DATA SOURCE: NCHS, National Health Interview Survey, 2015, Sample Adult Core component.
P ag e | 73 U.S. Department of Health and Human Services ● Centers for Disease Control and Prevention ● National Center for Health Statistics ● Released 05/16

Early Release of Selected Estimates Based on Data From the National Health Interview Survey, 2015
General health status
Figure 11.1. Percentage of persons of all ages who had excellent or very good health: United States, 1997–2015
40
45
50
55
60
65
70
1997 1998 1999 2000 2001 2002 2003 2004 2005 2006 2007 2008 2009 2010 2011 2012 2013 2014 2015
Percent 95% confidence interval
NOTES: Data are based on household interviews of a sample of the civilian noninstitutionalized population. Health status data were obtained by asking respondents to assess their own health and that of family members living in the same household as excellent, very good, good, fair, or poor. The analyses exclude persons with unknown health status (about 0.1% of respondents each year). See Technical Notes for more details.
DATA SOURCE: NCHS, National Health Interview Survey, 1997–2015, Family Core component.
For 2015, the percentage of persons who had excellent or very good health was 66.1% (95% confidenceinterval = 65.37%–66.73%), which was not significantly different from the 2014 estimate of 66.5%.
The percentage of persons who had excellent or very good health decreased from 68.5% in 1997 to 65.9% in 2006. Since 2006, the percentage of persons who had excellent or very good health hasremained stable.
P ag e | 74 U.S. Department of Health and Human Services ● Centers for Disease Control and Prevention ● National Center for Health Statistics ● Released 05/16

Early Release of Selected Estimates Based on Data From the National Health Interview Survey, 2015
Figure 11.2. Percent distribution of respondent-assessed health status for all ages, by sex: United States, 2015
0
10
20
30
40
Excellent Very good Good Fair Poor
Percent Total Male Female
95% confidence interval
Health status
NOTES: Data are based on household interviews of a sample of the civilian noninstitutionalized population. Health status data were obtained by asking respondents to assess their own health and that of family members living in the same household as excellent, very good, good, fair, or poor. The analyses exclude the 0.1% of persons with unknown health status. See Technical Notes for more details.
DATA SOURCE: NCHS, National Health Interview Survey, 2015, Family Core component.
For both sexes combined, most persons’ health was either excellent (35.9%) or very good (30.1%).Smaller percentages of persons had good (23.9%), fair (7.8%), or poor (2.3%) health.
Men were more likely to have excellent health compared with women. Women were more likely thanmen to have good, fair, or poor health.
P ag e | 75 U.S. Department of Health and Human Services ● Centers for Disease Control and Prevention ● National Center for Health Statistics ● Released 05/16

Early Release of Selected Estimates Based on Data From the National Health Interview Survey, 2015
Figure 11.3. Percentage of persons of all ages who had excellent or very good health, by age group and sex: United States, 2015
20
40
60
80
100
All ages Under 18 18–64 65 and over
Percent Total Male Female
Age group (years)
95% confidence interval
NOTES: Data are based on household interviews of a sample of the civilian noninstitutionalized population. Health status data were obtained by asking respondents to assess their own health and that of family members living in the same household as excellent, very good, good, fair, or poor. The analyses exclude the 0.1% of persons with unknown health status. See Technical Notes for more details.
DATA SOURCE: NCHS, National Health Interview Survey, 2015, Family Core component.
For both sexes combined, the percentage of persons with excellent or very good health decreased withage: 84.3% for those under age 18 years, 64.2% for those aged 18–64, and 44.8% for those aged 65 andover. This pattern was seen in both men and women.
For persons of all ages combined and for age group 18–64, men were more likely than women to have excellent or very good health.
P ag e | 76 U.S. Department of Health and Human Services ● Centers for Disease Control and Prevention ● National Center for Health Statistics ● Released 05/16

Early Release of Selected Estimates Based on Data From the National Health Interview Survey, 2015
Figure 11.4. Age-sex-adjusted percentage of persons of all ages who had excellent or very good health, by race/ethnicity: United States, 2015
Percent 95% confidence interval 80
70
60
50
40
30 Hispanic White Black
Non-Hispanic
NOTES: Data are based on household interviews of a sample of the civilian noninstitutionalized population. Health status data were obtained by asking respondents to assess their own health and that of family members living in the same household as excellent, very good, good, fair, or poor. The analyses exclude the 0.1% of persons with unknown health status. Estimates are age-sex adjusted using the projected 2000 U.S. population as the standard population and three age groups: under 18 years, 18–64, and 65 and over. See Technical Notes for more details.
DATA SOURCE: NCHS, National Health Interview Survey, 2015, Family Core component.
After adjustment for age and sex, the percentages of persons by race/ethnicity who had excellent or verygood health were 59.2% for Hispanic persons, 70.7% for non-Hispanic white persons, and 58.9% for non-Hispanic black persons.
Of the three race/ethnicity groups, non-Hispanic white persons were more likely to have excellent orvery good health than non-Hispanic black persons and Hispanic persons.
P ag e | 77 U.S. Department of Health and Human Services ● Centers for Disease Control and Prevention ● National Center for Health Statistics ● Released 05/16

Early Release of Selected Estimates Based on Data From the National Health Interview Survey, 2015
Data tables for Figures 11.1–11.4:
Data table for Figure 11.1. Percentage of persons of all ages who had excellent or very good health: United States, 1997–2015
Year Percent 95% confidence interval
1997 68.5 68.0-69.1
1998 69.1 68.6-69.6
1999 68.7 68.1-69.3
2000 68.3 67.7-68.8
2001 68.4 67.9-69.0
2002 67.4 66.8-68.0
2003 67.5 66.9-68.0
2004 66.5 66.0-67.1
2005 66.5 65.98-67.11
2006 65.9 65.25-66.61
2007 66.0 65.18-66.88
2008 66.0 65.30-66.79
2009 66.3 65.46-67.10
2010 65.7 64.95-66.35
2011 65.6 64.98-66.24
2012 65.8 65.19-66.41
2013 66.3 65.70-66.93
2014 66.5 65.85-67.08
2015 66.1 65.37-66.73
NOTES: Data are based on household interviews of a sample of the civilian noninstitutionalized population. Beginning with 2012 data, the National Health Interview Survey transitioned to weights derived from the 2010 census. For 2003–2011 data, weights were derived from the 2000 census. In this Early Release, estimates for 2000–2002 were recalculated using weights derived from the 2000 census. For 1997–1999 data, weights were derived from the 1990 census. See Technical Notes for more details.
DATA SOURCE: NCHS, National Health Interview Survey, 1997–2015, Family Core component.
P ag e | 78 U.S. Department of Health and Human Services ● Centers for Disease Control and Prevention ● National Center for Health Statistics ● Released 05/16

Early Release of Selected Estimates Based on Data From the National Health Interview Survey, 2015
Data table for Figure 11.2. Percent distribution of respondent-assessed health status, by sex for all ages: United States, 2015
Health status and sex Percent 95% confidence interval
Excellent, total 35.9 35.21-36.59
Excellent, male 36.7 35.95-37.54
Excellent, female 35.1 34.39-35.80
Very good, total 30.1 29.63-30.67
Very good, male 30.3 29.68-30.91
Very good, female 30.0 29.42-30.60
Good, total 23.9 23.35-24.38
Good, male 23.4 22.84-24.02
Good, female 24.3 23.71-24.87
Fair, total 7.8 7.53-8.05
Fair, male 7.4 7.08-7.73
Fair, female 8.2 7.84-8.48
Poor, total 2.3 2.16-2.43
Poor, male 2.1 1.96-2.29
Poor, female 2.4 2.28-2.62
NOTE: Data are based on household interviews of a sample of the civilian noninstitutionalized population.
DATA SOURCE: NCHS, National Health Interview Survey, 2015, Family Core component.
Data table for Figure 11.3. Percentage of persons of all ages who had excellent or very good health, by age group and sex: United States, 2015
Age (years) and sex Percent 95% confidence interval
Under 18, total 84.3 83.47-85.22
Under 18, male 84.0 82.90-85.05
Under 18, female 84.7 83.76-85.71
18–64 , total 64.2 63.47-64.98
18–64 , male 65.2 64.31-66.03
18–64 , female 63.3 62.49-64.15
65 and over, total 44.8 43.53-46.07
65 and over, male 45.1 43.58-46.53
65 and over, female 44.6 43.09-46.10
All ages (crude1), total 66.1 65.37-66.73
All ages (crude1), male 67.0 66.28-67.80
All ages (crude1), female 65.1 64.36-65.85
All ages (age-adjusted2), total 67.0 66.31-67.60
All ages (age-adjusted2), male 67.5 66.76-68.19
All ages (age-adjusted2), female 66.5 65.78-67.17
1Crude estimates are presented. 2Estimates are age adjusted using the projected 2000 U.S. population as the standard population and three age groups: under 18 years, 18–64, and 65 and over.
NOTE: Data are based on household interviews of a sample of the civilian noninstitutionalized population.
DATA SOURCE: NCHS, National Health Interview Survey, 2015, Family Core component.
P ag e | 79 U.S. Department of Health and Human Services ● Centers for Disease Control and Prevention ● National Center for Health Statistics ● Released 05/16

Early Release of Selected Estimates Based on Data From the National Health Interview Survey, 2015
Data table for Figure 11.4. Age-sex-adjusted percentage of persons of all ages who had excellent or very good health, by race/ethnicity: United States, 2015
Race/ethnicity Percent1 95% confidence interval
Hispanic or Latino 59.2 58.12-60.37
Not Hispanic or Latino, single race, white 70.7 69.88-71.48
Not Hispanic or Latino, single race, black 58.9 57.45-60.40
1Estimates are age-sex-adjusted using the projected 2000 U.S. population as the standard population and three age groups: under 18 years, 18–64, and 65 and over.
NOTE: Data are based on household interviews of a sample of the civilian noninstitutionalized population.
DATA SOURCE: NCHS, National Health Interview Survey, 2015, Family Core component.
P ag e | 80 U.S. Department of Health and Human Services ● Centers for Disease Control and Prevention ● National Center for Health Statistics ● Released 05/16

Early Release of Selected Estimates Based on Data From the National Health Interview Survey, 2015
Personal care needs
Figure 12.1. Percentage of adults aged 65 and over who needed help with personal care from other persons: United States, 1997–2015
0
2
4
6
8
10
1997 1998 1999 2000 2001 2002 2003 2004 2005 2006 2007 2008 2009 2010 2011 2012 2013 2014 2015
Percent 95% confidence interval
NOTES: Data are based on household interviews of a sample of the civilian noninstitutionalized population. Personal care needs, or activities of daily living, include eating, bathing, dressing, and getting around inside the person’s home. The analyses exclude persons with unknown information on personal care needs (less than 0.1% of respondents each year). See Technical Notes for more details.
DATA SOURCE: NCHS, National Health Interview Survey, 1997–2015, Family Core component.
For 2015, 6.9% (95% confidence interval = 6.39%–7.46%) of adults aged 65 and over needed help withpersonal care from other persons. This estimate was not significantly different from the 2014 estimate of6.5%.
From 1997–2015, no clear trend was seen in the percentage of older adults who needed help withpersonal care from other persons.
P ag e | 81 U.S. Department of Health and Human Services ● Centers for Disease Control and Prevention ● National Center for Health Statistics ● Released 05/16

Early Release of Selected Estimates Based on Data From the National Health Interview Survey, 2015
Figure 12.2. Percentage of adults aged 65 and over who needed help with personal care from other persons, by age group and sex: United States, 2015
Total Male Female Percent 35 95% confidence interval
30
25
20
15
10
5
0 65 and over 65–74 75–84 85 and over
Age group (years)
NOTES: Data are based on household interviews of a sample of the civilian noninstitutionalized population. Personal care needs, or activities of daily living (ADLs), include eating, bathing, dressing, and getting around inside the person’s home. See Technical Notes for more details.
DATA SOURCE: NCHS, National Health Interview Survey, 2015, Family Core component.
For both sexes combined, adults aged 85 and over (21.3%) were more than twice as likely as adults aged75–84 (8.4%) to need help with personal care from other persons; adults aged 85 and over were morethan six times as likely as adults aged 65–74 (3.4%) to need help with personal care from other persons.
For adults aged 65 and over, and age groups 65–74 and 75–84, women were more likely than men toneed help with personal care from other persons.
P ag e | 82 U.S. Department of Health and Human Services ● Centers for Disease Control and Prevention ● National Center for Health Statistics ● Released 05/16

Early Release of Selected Estimates Based on Data From the National Health Interview Survey, 2015
Figure 12.3. Age-sex-adjusted percentage of adults aged 65 and over who needed help with personal care from other persons, by race/ethnicity: United States, 2015
95% confidence interval Percent 20
15
10
5
0
Non-Hispanic
Hispanic White Black
NOTES: Data are based on household interviews of a sample of the civilian noninstitutionalized population. Personal care needs, or activities of daily living, include eating, bathing, dressing, and getting around inside the person’s home. Estimates are age-sex-adjusted using the projected 2000 U.S. population as the standard population and three age groups: 65–74, 75–84, and 85 and over. See Technical Notes for more details.
DATA SOURCE: NCHS, National Health Interview Survey, 2015, Family Core component.
The age-sex-adjusted percentages of adults aged 65 and over by race/ethnicity who needed help withpersonal care from other persons were 10.7% for Hispanic adults, 6.2% for non-Hispanic white adults,and 9.5% for non-Hispanic black adults.
Non-Hispanic white adults were less likely to need help with personal care from other persons thanHispanic adults and non-Hispanic black adults.
P ag e | 83 U.S. Department of Health and Human Services ● Centers for Disease Control and Prevention ● National Center for Health Statistics ● Released 05/16

Early Release of Selected Estimates Based on Data From the National Health Interview Survey, 2015
Data tables for Figures 12.1–12.3:
Data table for Figure 12.1. Percentage of adults aged 65 and over who needed help with personal care from other persons: United States, 1997–2015
Year Percent 95% confidence interval
1997 6.6 6.1-7.1
1998 6.3 5.9-6.8
1999 6.4 5.8-6.9
2000 6.4 5.9-6.9
2001 6.5 6.0-7.0
2002 6.2 5.7-6.7
2003 6.5 6.0-7.1
2004 6.3 5.8-6.8
2005 6.3 5.83-6.76
2006 6.1 5.44-6.69
2007 6.9 6.21-7.58
2008 6.4 5.84-7.03
2009 6.4 5.80-6.92
2010 7.0 6.43-7.62
2011 7.3 6.83-7.84
2012 6.4 5.91-6.82
2013 7.2 6.67-7.76
2014 6.5 5.98-6.93
2015 6.9 6.39-7.46
NOTES: Data are based on household interviews of a sample of the civilian noninstitutionalized population. Beginning with 2012 data, the National Health Interview Survey transitioned to weights derived from the 2010 census. For 2003–2011 data, weights were derived from the 2000 census. In this Early Release, estimates for 2000–2002 were recalculated using weights derived from the 2000 census. For 1997–1999 data, weights were derived from the 1990 census. See Technical Notes for more details.
DATA SOURCE: NCHS, National Health Interview Survey, 1997–2015, Family Core component.
P ag e | 84 U.S. Department of Health and Human Services ● Centers for Disease Control and Prevention ● National Center for Health Statistics ● Released 05/16

Early Release of Selected Estimates Based on Data From the National Health Interview Survey, 2015
Data table for Figure 12.2. Percentage of adults aged 65 and over who needed help with personal care from other persons, by age group and sex: United States, 2015
Age (years) and sex Percent 95% confidence interval
65–74 , total 3.4 2.89-3.82
65–74 , male 2.6 2.01-3.16
65–74 , female 4.0 3.35-4.69
75–84 , total 8.4 7.44-9.30
75–84 , male 5.9 4.61-7.17
75–84 , female 10.2 8.92-11.51
85 and over, total 21.3 19.04-23.64
85 and over, male 19.9 16.08-23.63
85 and over, female 22.3 19.42-25.16
65 and over (crude1), total 6.9 6.39-7.46
65 and over (crude1), male 5.3 4.57-5.98
65 and over (crude1), female 8.3 7.52-8.98
65 and over (age-adjusted2), total 7.3 6.79-7.89
65 and over (age-adjusted2), male 5.9 5.12-6.63
65 and over (age-adjusted2), female 8.5 7.73-9.19
1Crude estimates are presented. 2Estimates are age-adjusted using the projected 2000 U.S. population as the standard population and three age groups: 65–74, 75–84, and 85 and over.
NOTES: Data are based on household interviews of a sample of the civilian noninstitutionalized population. Beginning with 2012 data, the National Health Interview Survey transitioned to weights derived from the 2010 census. For 2003–2011 data, weights were derived from the 2000 census. In this Early Release, estimates for 2000–2002 were recalculated using weights derived from the 2000 census. For 1997–1999 data, weights were derived from the 1990 census. See Technical Notes for more details.
DATA SOURCE: NCHS, National Health Interview Survey, 2015, Family Core component.
Data table for Figure 12.3. Age-sex-adjusted percentage of adults aged 65 and over who needed help with personal care from other persons, by race/ethnicity: United States, 2015
Race/ethnicity Percent1 95% confidence interval
Hispanic or Latino 10.7 8.64-12.75
Not Hispanic or Latino, single race, white 6.2 5.62-6.76
Not Hispanic or Latino, single race, black 9.5 8.04-11.01
1Estimates are age-sex-adjusted using the projected 2000 U.S. population as the standard population and three age groups: 65–74, 75–84, and 85 and over.
NOTE: Data are based on household interviews of a sample of the civilian noninstitutionalized population.
DATA SOURCE: NCHS, National Health Interview Survey, 2015, Family Core component.
P ag e | 85 U.S. Department of Health and Human Services ● Centers for Disease Control and Prevention ● National Center for Health Statistics ● Released 05/16

Early Release of Selected Estimates Based on Data From the National Health Interview Survey, 2015
Serious psychological distress
Figure 13.1. Percentage of adults aged 18 and over who experienced serious psychological distress during the past 30 days: United States, 1997–2015
0
1
2
3
4
5
1997199819992000200120022003200420052006200720082009201020112012201320142015
Percent 95% confidence interval
†
†In 2013, the six psychological distress questions were moved to the Adult Selected Items section of the Sample Adult questionnaire (dashed line). Differences observed in estimates based on 2012 and earlier National Health Interview Surveys (NHIS) and 2013 and later NHIS may be partially or fully attributable to this change in placement of the six psychological distress questions in the NHIS questionnaire. Due to the higher-than-usual amount of missing data in the Adult Selected Items section, adults with missing data for any of the six psychological distress questions are excluded from the calculation of the serious psychological distress indicator for 2013 and later.
NOTES: Data are based on household interviews of a sample of the civilian noninstitutionalized population. Six psychological distress questions are included in the Sample Adult Core component of NHIS. These questions ask how often a respondent experienced certain symptoms of psychological distress during the past 30 days. The response codes (0–4) of the six items for each person are summed to yield a scale with a 0–24 range. A value of 13 or more for this scale is used here to define serious psychological distress (12). The analyses exclude those with unknown serious psychological distress status (about 4% of respondents in 2013 and later). See Technical Notes for more details.
DATA SOURCE: NCHS, National Health Interview Survey, 1997–2015, Sample Adult Core component.
For 2015, 3.6% (95% confidence interval = 3.28%–3.89%) of adults aged 18 and over had experiencedserious psychological distress during the past 30 days. This estimate was higher than the 2014 estimateof 3.1%.
The percentage of adults who had experienced serious psychological distress during the past 30 daysincreased from 2.7% in 2007 to 3.4% in 2011.
P ag e | 86 U.S. Department of Health and Human Services ● Centers for Disease Control and Prevention ● National Center for Health Statistics ● Released 05/16

Early Release of Selected Estimates Based on Data From the National Health Interview Survey, 2015
Figure 13.2. Percentage of adults aged 18 and over who experienced serious psychological distress during the past 30 days, by age group and sex: United States, 2015
0
2
4
6
8
18 and over 18–44 45–64 65 and over
Percent Total Male Female
Age group (years)
95% confidence interval
NOTES: Data are based on household interviews of a sample of the civilian noninstitutionalized population. Six psychological distress questions are included in the Sample Adult Core component of the National Health Interview Survey (NHIS). These questions ask how often a respondent experienced certain symptoms of psychological distress during the past 30 days. The response codes (0–4) of the six items for each person are summed to yield a scale with a 0–24 range. A value of 13 or more for this scale is used here to define serious psychological distress (12). In 2013, the six psychological distress questions were moved to the Adult Selected Items section of the Sample Adult questionnaire. Differences observed in estimates based on 2012 and earlier NHIS and 2013 and later NHIS may be partially or fully attributable to this change in placement of the six psychological distress questions in the NHIS questionnaire. The analyses exclude the 5.0% of persons with unknown serious psychological distress status. See Technical Notes for more details.
DATA SOURCE: NCHS, National Health Interview Survey, 2015, Sample Adult Core component.
For both sexes combined, the percentage of persons by age group who had experienced seriouspsychological distress during the past 30 days was 3.7% for adults aged 18–44, 4.1% for adults aged 45–64, and 2.5% for adults aged 65 and over.
For adults aged 18 and over and age groups 18–44, 45–64, and 65 and over, women were more likelythan men to have experienced serious psychological distress during the past 30 days.
P ag e | 87 U.S. Department of Health and Human Services ● Centers for Disease Control and Prevention ● National Center for Health Statistics ● Released 05/16
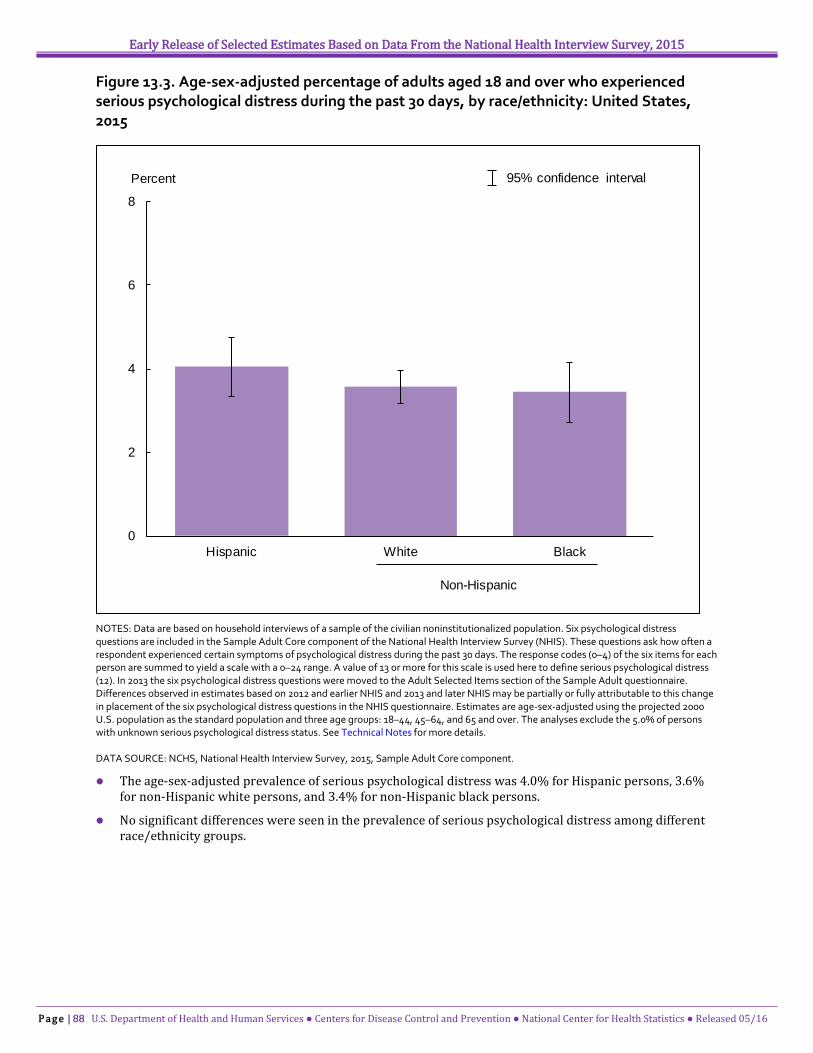
Early Release of Selected Estimates Based on Data From the National Health Interview Survey, 2015
Figure 13.3. Age-sex-adjusted percentage of adults aged 18 and over who experienced serious psychological distress during the past 30 days, by race/ethnicity: United States, 2015
0
2
4
6
8
Hispanic White Black
Percent 95% confidence interval
Non-Hispanic
NOTES: Data are based on household interviews of a sample of the civilian noninstitutionalized population. Six psychological distress questions are included in the Sample Adult Core component of the National Health Interview Survey (NHIS). These questions ask how often a respondent experienced certain symptoms of psychological distress during the past 30 days. The response codes (0–4) of the six items for each person are summed to yield a scale with a 0–24 range. A value of 13 or more for this scale is used here to define serious psychological distress (12). In 2013 the six psychological distress questions were moved to the Adult Selected Items section of the Sample Adult questionnaire. Differences observed in estimates based on 2012 and earlier NHIS and 2013 and later NHIS may be partially or fully attributable to this change in placement of the six psychological distress questions in the NHIS questionnaire. Estimates are age-sex-adjusted using the projected 2000 U.S. population as the standard population and three age groups: 18–44, 45–64, and 65 and over. The analyses exclude the 5.0% of persons with unknown serious psychological distress status. See Technical Notes for more details.
DATA SOURCE: NCHS, National Health Interview Survey, 2015, Sample Adult Core component.
The age-sex-adjusted prevalence of serious psychological distress was 4.0% for Hispanic persons, 3.6% for non-Hispanic white persons, and 3.4% for non-Hispanic black persons.
No significant differences were seen in the prevalence of serious psychological distress among different race/ethnicity groups.
P ag e | 88 U.S. Department of Health and Human Services ● Centers for Disease Control and Prevention ● National Center for Health Statistics ● Released 05/16

Early Release of Selected Estimates Based on Data From the National Health Interview Survey, 2015
Data tables for Figures 13.1–13.3:
Data table for Figure 13.1. Percentage of adults aged 18 and over who experienced serious psychological distress during the past 30 days: United States, 1997–2015
Year Crude1 percent (95% confidence interval) Age-adjusted2 percent (95% confidence interval)
1997 3.3 (3.1-3.5) 3.3 (3.1-3.6)
1998 3.0 (2.7-3.2) 3.0 (2.8-3.2)
1999 2.4 (2.2-2.6) 2.4 (2.2-2.6)
2000 2.7 (2.5-2.9) 2.7 (2.5-2.9)
2001 3.2 (2.9-3.4) 3.2 (2.9-3.4)
2002 3.0 (2.8-3.2) 3.0 (2.8-3.2)
2003 3.1 (2.9-3.4) 3.1 (2.9-3.4)
2004 3.1 (2.9-3.4) 3.0 (2.8-3.3)
2005 3.0 (2.74-3.20) 2.9 (2.72-3.17)
2006 3.0 (2.73-3.23) 2.9 (2.68-3.17)
2007 2.7 (2.43-2.98) 2.7 (2.39-2.93)
2008 3.1 (2.78-3.36) 3.0 (2.74-3.32)
2009 3.2 (2.93-3.52) 3.2 (2.90-3.49)
2010 3.3 (3.10-3.60) 3.3 (3.02-3.51)
2011 3.4 (3.16-3.62) 3.3 (3.08-3.54)
2012 3.0 (2.74-3.24) 2.9 (2.69-3.19)
20133 3.8 (3.54-4.13) 3.8 (3.47-4.06)
2014 3.1 (2.91-3.37) 3.1 (2.88-3.32)
2015 3.6 (3.28-3.89) 3.6 (3.29-3.91)
1Crude estimates are presented. 2Estimates are age-adjusted using the projected 2000 U.S. population as the standard population and three age groups: 18–44, 45–64, and 65 and over. 3In 2013, the six psychological distress questions were moved to the Adult Selected Items section of the Sample Adult questionnaire. Differences observed in estimates based on 2012 and earlier National Health Interview Surveys (NHIS) and 2013 and later NHIS may be partially or fully attributable to this change in placement of the six psychological distress questions in the NHIS questionnaire. Due to the higher than usual amount of missing data in the Adult Selected Items section, adults with missing data for any of the six psychological distress questions are excluded from the calculation of the serious psychological distress indicator for 2013 and later.
NOTES: Data are based on household interviews of a sample of the civilian noninstitutionalized population. Beginning with 2012 data, NHIS transitioned to weights derived from the 2010 census. For 2003–2011 data, weights were derived from the 2000 census. In this Early Release, estimates for 2000–2002 were recalculated using weights derived from the 2000 census. For 1997–1999 data, weights were derived from the 1990 census. See Technical Notes for more details.
DATA SOURCE: NCHS, National Health Interview Survey, 1997–2015, Sample Adult Core component.
P ag e | 89 U.S. Department of Health and Human Services ● Centers for Disease Control and Prevention ● National Center for Health Statistics ● Released 05/16

Early Release of Selected Estimates Based on Data From the National Health Interview Survey, 2015
Data table for Figure 13.2. Percentage of adults aged 18 and over who experienced serious psychological distress during the past 30 days, by age group and sex: United States, 2015
Age (years) and sex Percent 95% confidence interval
18–44, total 3.7 3.24-4.14
18–44, male 3.1 2.47-3.70
18–44, female 4.3 3.64-4.92
45–64, total 4.1 3.59-4.57
45–64, male 3.2 2.55-3.84
45–64, female 4.9 4.15-5.69
65 and over, total 2.5 1.95-2.96
65 and over, male 1.6 1.02-2.27
65 and over, female 3.1 2.38-3.82
18 and over (crude1), total 3.6 3.28-3.89
18 and over (crude1), male 2.9 2.44-3.29
18 and over (crude1), female 4.3 3.86-4.65
18 and over (age-adjusted2), total 3.6 3.29-3.91
18 and over (age-adjusted2), male 2.9 2.44-3.31
18 and over (age-adjusted2), female 4.3 3.86-4.68
1Crude estimates are presented. 2Estimates are age-adjusted using the projected 2000 U.S. population as the standard population and three age groups: 18–44, 45–64, and 65 and over.
NOTES: Data are based on household interviews of a sample of the civilian noninstitutionalized population. In 2013, the six psychological distress questions were moved to the Adult Selected Items section of the Sample Adult questionnaire. Differences observed in estimates based on 2012 and earlier National Health Interview Surveys (NHIS) and 2013 and later NHIS may be partially or fully attributable to this change in placement of the six psychological distress questions in the NHIS questionnaire.
DATA SOURCE: NCHS, National Health Interview Survey, 2015, Sample Adult Core component.
Data table for Figure 13.3. Age-sex-adjusted percentage of adults aged 18 and over who experienced serious psychological distress during the past 30 days, by race/ethnicity: United States, 2015
Race/ethnicity Percent1 95% confidence interval
Hispanic or Latino 4.0 3.35-4.75
Not Hispanic or Latino, single race, white 3.6 3.19-3.96
Not Hispanic or Latino, single race, black 3.4 2.72-4.17
1Estimates are age-sex-adjusted using the projected 2000 U.S. population as the standard population and using five age groups: 18–24, 25–34, 35–44, 45–64, and 65 and over.
NOTES: Data are based on household interviews of a sample of the civilian noninstitutionalized population. In 2013, the six psychological distress questions were moved to the Adult Selected Items section of the Sample Adult questionnaire. Differences observed in estimates based on 2012 and earlier National Health Interview Surveys (NHIS) and 2013 and later NHIS may be partially or fully attributable to this change in placement of the six psychological distress questions in the NHIS questionnaire.
DATA SOURCE: NCHS, National Health Interview Survey, 2015, Sample Adult Core component.
P ag e | 90 U.S. Department of Health and Human Services ● Centers for Disease Control and Prevention ● National Center for Health Statistics ● Released 05/16

Early Release of Selected Estimates Based on Data From the National Health Interview Survey, 2015
Diagnosed diabetes
Figure 14.1. Prevalence of diagnosed diabetes among adults aged 18 and over: United States, 1997–2015
0
2
4
6
8
10
12
1997 1998 1999 2000 2001 2002 2003 2004 2005 2006 2007 2008 2009 2010 2011 2012 2013 2014 2015
Percent 95% confidence interval
NOTES: Data are based on household interviews of a sample of the civilian noninstitutionalized population. Prevalence of diagnosed diabetes is based on self-report of ever having been diagnosed with diabetes by a doctor or other health professional. Persons reporting “borderline” diabetes status and women reporting diabetes only during pregnancy were not coded as having diabetes in the analyses. The analyses exclude persons with unknown diabetes status (about 0.1% of respondents each year). See Technical Notes for more details.
DATA SOURCE: NCHS, National Health Interview Survey, 1997–2015, Sample Adult Core component.
For 2015, 9.5% (95% confidence interval = 9.07%–10.02%) of adults aged 18 and over have beendiagnosed with diabetes. This percentage was not significantly different from the 2014 estimate of 9.1%.
The prevalence of diagnosed diabetes among adults aged 18 and over increased from 5.1% in 1997 to9.5% in 2015.
P ag e | 91 U.S. Department of Health and Human Services ● Centers for Disease Control and Prevention ● National Center for Health Statistics ● Released 05/16

Early Release of Selected Estimates Based on Data From the National Health Interview Survey, 2015
Figure 14.2. Prevalence of diagnosed diabetes among adults aged 18 and over, by age group and sex: United States, 2015
0
5
10
15
20
25
30
18 and over 18–44 45–54 55–64 65 and over
Percent Total Male Female
Age group (years)
95% confidence interval
NOTES: Data are based on household interviews of a sample of the civilian noninstitutionalized population. Prevalence of diagnosed diabetes is based on self-report of ever having been diagnosed with diabetes by a doctor or other health professional. Persons reporting “borderline” diabetes status and women reporting diabetes only during pregnancy were not coded as having diabetes in the analyses. The analyses exclude the 0.1% of persons with unknown diabetes status. See Technical Notes for more details.
DATA SOURCE: NCHS, National Health Interview Survey, 2015, Sample Adult Core component.
For both sexes combined, the prevalence of diagnosed diabetes increased with age. Adults aged 65 andover (21.7%) were more than 9 times as likely as those aged 18–44 (2.2%) to have been diagnosed withdiabetes. Men aged 65 and over (24.0%) were more than 12 times as likely as men aged 18–44 (1.9%) tohave been diagnosed with diabetes, while women aged 65 and over (19.8%) were more than 7 times aslikely as women aged 18–44 (2.5%) to have been diagnosed with diabetes.
For adults aged 45–54 and 65 and over, women were less likely than men to have been diagnosed withdiabetes. For adults aged 18–44, women were more likely than men to have been diagnosed withdiabetes.
P ag e | 92 U.S. Department of Health and Human Services ● Centers for Disease Control and Prevention ● National Center for Health Statistics ● Released 05/16

Early Release of Selected Estimates Based on Data From the National Health Interview Survey, 2015
Figure 14.3. Age-sex-adjusted prevalence of diagnosed diabetes among adults aged 18 and over, by race/ethnicity: United States, 2015
Percent 95% confidence interval 16
12
8
4
0 Hispanic White Black
Non-Hispanic
NOTES: Data are based on household interviews of a sample of the civilian noninstitutionalized population. Prevalence of diagnosed diabetes is based on self-report of ever having been diagnosed with diabetes by a doctor or other health professional. Persons reporting “borderline” diabetes status and women reporting diabetes only during pregnancy were not coded as having diabetes in the analyses. The analyses exclude the 0.1% of persons with unknown diabetes status. Estimates are age-sex-adjusted using the projected 2000 U.S. population as the standard population and using age groups: 18–44, 45–54, 55–64, and 65 and over. See Technical Notes for more details.
DATA SOURCE: NCHS, National Health Interview Survey, 2015, Sample Adult Core component.
The age-sex-adjusted prevalence of diagnosed diabetes was 11.9% for Hispanic persons, 7.2% for non-Hispanic white persons, and 12.5% for non-Hispanic black persons.
The prevalence of diagnosed diabetes was lower among non-Hispanic white persons than amongHispanic persons and non-Hispanic black persons.
P ag e | 93 U.S. Department of Health and Human Services ● Centers for Disease Control and Prevention ● National Center for Health Statistics ● Released 05/16

Early Release of Selected Estimates Based on Data From the National Health Interview Survey, 2015
Data tables for Figures 14.1–14.3:
Data table for Figure 14.1. Prevalence of diagnosed diabetes among adults aged 18 and over: United States, 1997–2015
Year Crude1 percent (95% confidence interval) Age-adjusted2 percent (95% confidence interval)
1997 5.1 (4.9-5.4) 5.3 (5.1-5.6)
1998 5.3 (5.0-5.6) 5.4 (5.1-5.7)
1999 5.4 (5.1-5.7) 5.5 (5.2-5.8)
2000 5.9 (5.6-6.2) 6.0 (5.7-6.3)
2001 6.4 (6.1-6.7) 6.4 (6.1-6.7)
2002 6.5 (6.2-6.8) 6.5 (6.2-6.8)
2003 6.6 (6.3-6.9) 6.5 (6.2-6.9)
2004 7.0 (6.7-7.4) 6.9 (6.6-7.3)
2005 7.4 (7.10-7.78) 7.3 (6.95-7.57)
2006 7.8 (7.35-8.20) 7.6 (7.15-7.96)
2007 7.8 (7.33-8.18) 7.5 (7.08-7.87)
2008 8.2 (7.81-8.64) 7.8 (7.43-8.19)
2009 9.0 (8.54-9.45) 8.5 (8.09-8.93)
2010 9.2 (8.73-9.59) 8.6 (8.21-8.97)
2011 8.9 (8.51-9.30) 8.3 (7.90-8.61)
2012 9.1 (8.68-9.46) 8.3 (7.93-8.66)
2013 9.3 (8.95-9.75) 8.5 (8.14-8.87)
2014 9.1 (8.71-9.56) 8.2 (7.86-8.57)
2015 9.5 (9.07-10.02) 8.5 (8.10-8.89)
1Crude estimates are presented. 2Estimates are age-adjusted using the projected 2000 U.S. population as the standard population and four age groups: 18–44, 45–54, 55–64, and 65 and over.
NOTES: Data are based on household interviews of a sample of the civilian noninstitutionalized population. Beginning with 2012 data, the National Health Interview Survey transitioned to weights derived from the 2010 census. For 2003–2011 data, weights were derived from the 2000 census. In this Early Release, estimates for 2000–2002 were recalculated using weights derived from the 2000 census. For 1997–1999 data, weights were derived from the 1990 census. See Technical Notes for more details.
DATA SOURCE: NCHS, National Health Interview Survey, 1997–2015, Sample Adult Core component.
P ag e | 94 U.S. Department of Health and Human Services ● Centers for Disease Control and Prevention ● National Center for Health Statistics ● Released 05/16

Early Release of Selected Estimates Based on Data From the National Health Interview Survey, 2015
Data table for Figure 14.2. Prevalence of diagnosed diabetes among adults aged 18 and over, by age group and sex: United States, 2015
Age (years) and sex Percent 95% confidence interval
18–44, total 2.2 1.86-2.51
18–44, male 1.9 1.45-2.26
18–44, female 2.5 2.03-2.99
45–54, total 9.8 8.83-10.81
45–54, male 11.3 9.71-12.97
45–54, female 8.4 7.13-9.61
55–64, total 15.8 14.56-17.14
55–64, male 16.3 14.16-18.48
55–64, female 15.4 13.76-17.07
65 and over, total 21.7 20.29-23.08
65 and over, male 24.0 22.02-26.06
65 and over, female 19.8 18.17-21.42
18 and over (crude1), total 9.5 9.07-10.02
18 and over (crude1), male 9.9 9.22-10.54
18 and over (crude1), female 9.2 8.62-9.84
18 and over (age-adjusted2), total 8.5 8.10-8.89
18 and over (age-adjusted2), male 9.1 8.51-9.60
18 and over (age-adjusted2), female 8.0 7.50-8.57
1Crude estimates are presented. 2Estimates are age-adjusted using the projected 2000 U.S. population as the standard population and four age groups: 18–44, 45–54, 55–64, and 65 and over.
NOTE: Data are based on household interviews of a sample of the civilian noninstitutionalized population.
DATA SOURCE: NCHS, National Health Interview Survey, 2015, Sample Adult Core component.
Data table for Figure 14.3. Age-sex-adjusted prevalence of diagnosed diabetes among adults aged 18 and over, by race/ethnicity: United States, 2015
Race/ethnicity Percent1 95% confidence interval
Hispanic or Latino 11.9 10.82-13.08
Not Hispanic or Latino, single race, white 7.2 6.76-7.66
Not Hispanic or Latino, single race, black 12.5 11.43-13.51
1Estimates are age-sex-adjusted using the projected 2000 U.S. population as the standard population and four age groups: 18–44, 45–54, 55–64, and 65 and over.
NOTE: Data are based on household interviews of a sample of the civilian noninstitutionalized population.
DATA SOURCE: NCHS, National Health Interview Survey, 2015, Sample Adult Core component.
P ag e | 95 U.S. Department of Health and Human Services ● Centers for Disease Control and Prevention ● National Center for Health Statistics ● Released 05/16

Early Release of Selected Estimates Based on Data From the National Health Interview Survey, 2015
Asthma
Figure 15.1. Percentage of persons of all ages who experienced an asthma episode in the past 12 months: United States, 1997–2015
0
1
2
3
4
5
6
1997199819992000200120022003200420052006200720082009201020112012201320142015
Percent 95% confidence interval
NOTES: Data are based on household interviews of a sample of the civilian noninstitutionalized population. Information on an episode of asthma or asthma attack during the past 12 months is self-reported by adults aged 18 and over. For children under age 18 years, the information is collected from an adult family member, usually a parent, who is knowledgeable about the child’s health. The analyses exclude people with unknown asthma episode status (about 0.1% of respondents each year). See Technical Notes for more details.
DATA SOURCE: NCHS, National Health Interview Survey, 1997–2015, combined Sample Adult and Sample Child Core components.
For 2015, the percentage of persons of all ages who experienced an asthma episode in the past 12 monthswas 3.8% (95% confidence interval = 3.57%–4.07%), which was not significantly different than the 2014estimate of 3.6%.
From 1997–2015, no clear trend was seen in the percentage of persons of all ages who experienced anasthma episode in the past 12 months.
P ag e | 96 U.S. Department of Health and Human Services ● Centers for Disease Control and Prevention ● National Center for Health Statistics ● Released 05/16

Early Release of Selected Estimates Based on Data From the National Health Interview Survey, 2015
Figure 15.2. Percentage of persons of all ages who experienced an asthma episode in the past 12 months, by age group and sex: United States, 2015
0
2
4
6
8
10
All ages Under 15 15–34 35 and over
Percent Total Male Female
Age group (years)
95% confidence interval
NOTES: Data are based on household interviews of a sample of the civilian noninstitutionalized population. Information on an episode of asthma or asthma attack during the past 12 months is self-reported by adults aged 18 and over. For children under age 18 years, the information is collected from an adult family member, usually a parent, who is knowledgeable about the child’s health. The analyses exclude the 0.1% of persons with unknown asthma episode status. See Technical Notes for more details.
DATA SOURCE: NCHS, National Health Interview Survey, 2015, combined Sample Adult and Sample Child Core components.
For males, the percentages of persons by age group who had an asthma episode in the past 12 monthswere higher among children under age 15 years (5.0%) than among persons aged 15–34 (2.6%) and 35and over (2.1%). For females, the percentage of persons who had an asthma episode in the past 12months was lower among children under age 15 years (3.3%) than among persons aged 15–34 (4.9%) and 35 and over (5.2%).
For persons of all ages and age groups 15–34 and 35 and over, the percentage of persons who had anasthma episode in the past 12 months was higher among females than among males. For persons under age 15 years, the percentage of persons who had an asthma episode in the past 12 months was higheramong males than among females.
P ag e | 97 U.S. Department of Health and Human Services ● Centers for Disease Control and Prevention ● National Center for Health Statistics ● Released 05/16

Early Release of Selected Estimates Based on Data From the National Health Interview Survey, 2015
Figure 15.3. Sex-adjusted percentage of persons of all ages who experienced an asthma episode in the past 12 months, by age group and race/ethnicity: United States, 2015
Percent Under 15 years 15 years and over
12 95% confidence interval
10
8
6
4
2
0 Hispanic White Black
Non-Hispanic
NOTES: Data are based on household interviews of a sample of the civilian noninstitutionalized population. Information on an episode of asthma or asthma attack during the past 12 months is self-reported by adults aged 18 years and over. For children under age 18 years, the information is collected from an adult family member, usually a parent, who is knowledgeable about the child’s health. The analyses exclude the less than 0.1% of persons with unknown asthma episode status. Additional estimates of asthma episodes in the past 12 months among persons with current asthma are provided in the Data table for Figure 15.3. See Technical Notes for more details.
DATA SOURCE: NCHS, National Health Interview Survey, 2015, combined Sample Adult and Sample Child Core components.
For children under age 15 years, the sex-adjusted percentages by race/ethnicity who had an asthma episode in the past 12 months were 4.2% for Hispanic children, 3.4% for non-Hispanic white children, and 6.5% for non-Hispanic black children.
For persons aged 15 and over, the sex-adjusted percentages who had an asthma episode in the past 12 months were 3.3% for Hispanic persons, 3.8% for non-Hispanic white persons, and 4.0% for non-Hispanic black persons.
After adjustment for sex, Hispanic children and non-Hispanic white children under age 15 were less likely to have had an asthma episode in the past 12 months than were non-Hispanic black children under age 15.
P ag e | 98 U.S. Department of Health and Human Services ● Centers for Disease Control and Prevention ● National Center for Health Statistics ● Released 05/16

Early Release of Selected Estimates Based on Data From the National Health Interview Survey, 2015
Figure 15.4. Prevalence of current asthma among persons of all ages: United States, 2001– 2015
0
2
4
6
8
10
2001 2002 2003 2004 2005 2006 2007 2008 2009 2010 2011 2012 2013 2014 2015
Percent 95% confidence interval
NOTES: Data are based on household interviews of a sample of the civilian noninstitutionalized population. Beginning in 2001, respondents were asked about current asthma in addition to the question regarding asthma episodes. Information on current asthma is self-reported by adults aged 18 and over. For children under age 18 years, the information is collected from an adult family member, usually a parent, who is knowledgeable about the child’s health. The analyses exclude persons with unknown current asthma status (about 0.2% of respondents each year). See Technical Notes for more details.
DATA SOURCE: NCHS, National Health Interview Survey, 2001–2015, combined Sample Adult and Sample Child Core components.
For 2015, 8.0% (95% confidence interval = 7.62%–8.30%) of persons of all ages currently had asthma.This was not significantly different than the 2014 estimate of 7.9%.
From 1997–2015, no clear trend was seen in the percentage of persons of all ages who currently hadasthma.
P ag e | 99 U.S. Department of Health and Human Services ● Centers for Disease Control and Prevention ● National Center for Health Statistics ● Released 05/16

Early Release of Selected Estimates Based on Data From the National Health Interview Survey, 2015
Figure 15.5. Prevalence of current asthma among persons of all ages, by age group and sex: United States, 2015
0
4
8
12
16
All ages Under 15 15–34 35 and over
Percent Total Male Female
Age group (years)
95% confidence interval
NOTES: Data are based on household interviews of a sample of the civilian noninstitutionalized population. Information on current asthma is self-reported by adults aged 18 and over. For children under age 18 years, the information is collected from an adult family member, usually a parent, who is knowledgeable about the child’s health. The analyses exclude the 0.2% of persons with unknown current asthma status. See Technical Notes for more details.
DATA SOURCE: NCHS, National Health Interview Survey, 2015, combined Sample Adult and Sample Child Core components.
For males, those under age 15 years (9.9%) were more likely to currently have asthma than werepersons aged 15–34 (6.5%) and 35 and over (5.3%). For females, those under age 15 years (6.7%) were less likely to currently have asthma than were those aged 15–34 (9.3%) and 35 and over (10.1%).
For persons of all ages and for persons aged 15–34 and 35 and over, the prevalence of current asthmawas higher among females than males. For persons under age 15 years, the prevalence of current asthma was higher among males than females.
P ag e | 100 U.S. Department of Health and Human Services ● Centers for Disease Control and Prevention ● National Center for Health Statistics ● Released 05/16

Early Release of Selected Estimates Based on Data From the National Health Interview Survey, 2015
Figure 15.6. Sex-adjusted prevalence of current asthma among persons of all ages, by age group and race/ethnicity: United States, 2015
0
2
4
6
8
10
12
14
16
18
20
22
Hispanic White Black
Percent Under 15 years 15 years and over
95% confidence interval
Non-Hispanic
NOTES: Data are based on household interviews of a sample of the civilian noninstitutionalized population. Information on current asthma is self-reported by adults aged 18 and over. For children under age 18 years, the information is collected from an adult family member, usually a parent, who is knowledgeable about the child’s health. The analyses exclude the 0.2% of persons with unknown current asthma status. See Technical Notes for more details.
DATA SOURCE: NCHS, National Health Interview Survey, 2015, combined Sample Adult and Sample Child Core components.
For children under age 15, the sex-adjusted prevalence of current asthma was higher among non-Hispanic black children (13.8%) than among Hispanic children (8.2%) and non-Hispanic white children(6.8%).
For persons aged 15 years and over, the sex-adjusted prevalence of current asthma was higher amongnon-Hispanic black persons (9.2%), and non-Hispanic white persons (8.1%) compared with Hispanicpersons (6.3%).
P ag e | 101 U.S. Department of Health and Human Services ● Centers for Disease Control and Prevention ● National Center for Health Statistics ● Released 05/16

Early Release of Selected Estimates Based on Data From the National Health Interview Survey, 2015
Data tables for Figures 15.1–15.6:
Data table for Figure 15.1. Percentage of persons of all ages who experienced an asthma episode in the past 12 months: United States, 1997–2015
Year Crude1 percent (95% confidence interval) Age-adjusted2 percent (95% confidence interval)
1997 4.2 (4.0-4.4) 4.2 (3.9-4.4)
1998 4.0 (3.7-4.2) 3.9 (3.7-4.2)
1999 3.9 (3.6-4.1) 3.9 (3.6-4.1)
2000 4.0 (3.8-4.2) 4.0 (3.8-4.2)
2001 4.3 (4.1-4.6) 4.3 (4.1-4.5)
2002 4.3 (4.0-4.5) 4.3 (4.0-4.5)
2003 3.9 (3.7-4.1) 3.9 (3.7-4.1)
2004 4.1 (3.8-4.3) 4.1 (3.8-4.3)
2005 4.2 (3.99-4.43) 4.2 (4.00-4.44)
2006 4.2 (3.96-4.52) 4.3 (3.98-4.54)
2007 4.2 (3.87-4.46) 4.2 (3.88-4.47)
2008 4.2 (3.91-4.48) 4.2 (3.93-4.50)
2009 4.2 (3.97-4.52) 4.3 (3.99-4.54)
2010 4.5 (4.24-4.77) 4.5 (4.25-4.78)
2011 4.3 (4.06-4.52) 4.3 (4.08-4.54)
2012 4.4 (4.15-4.63) 4.4 (4.17-4.65)
2013 3.8 (3.53-4.02) 3.8 (3.55-4.04)
2014 3.6 (3.36-3.85) 3.6 (3.37-3.88)
2015 3.8 (3.57-4.07) 3.8 (3.58-4.08)
1Crude estimates are presented. 2Estimates are age-adjusted using the projected 2000 U.S. population as the standard population and three age groups: 0–14, 15–34, and 35 and over.
NOTES: Data are based on household interviews of a sample of the civilian noninstitutionalized population. Beginning with 2012 data, the National Health Interview Survey transitioned to weights derived from the 2010 census. For 2003–2011 data, weights were derived from the 2000 census. In this Early Release, estimates for 2000–2002 were recalculated using weights derived from the 2000 census. For 1997–1999 data, weights were derived from the 1990 census. See Technical Notes for more details.
DATA SOURCE: NCHS, National Health Interview Survey, 1997–2015, combined Sample Adult and Sample Child Core components.
P ag e | 102 U.S. Department of Health and Human Services ● Centers for Disease Control and Prevention ● National Center for Health Statistics ● Released 05/16

Early Release of Selected Estimates Based on Data From the National Health Interview Survey, 2015
Data table for Figure 15.2. Percentage of persons of all ages who experienced an asthma episode in the past 12 months, by age group and sex: United States, 2015
Age (years) and sex Percent 95% confidence interval
Under 15, total 4.2 3.64-4.73
Under 15, male 5.0 4.16-5.91
Under 15, female 3.3 2.71-3.90
15–34 , total 3.7 3.21-4.28
15–34 , male 2.6 1.96-3.27
15–34 , female 4.9 4.06-5.68
35 and over, total 3.7 3.40-4.06
35 and over, male 2.1 1.70-2.47
35 and over, female 5.2 4.69-5.74
All ages (crude1), total 3.8 3.57-4.07
All ages (crude1), male 2.8 2.50-3.14
All ages (crude1), female 4.8 4.40-5.15
All ages (age-adjusted2), total 3.8 3.58-4.08
All ages (age-adjusted2), male 2.9 2.54-3.19
All ages (age-adjusted2), female 4.7 4.34-5.08
1Crude estimates are presented. 2Estimates are age-adjusted using the projected 2000 U.S. population as the standard population and three age groups: 0–14, 15–34, and 35 and over.
NOTE: Data are based on household interviews of a sample of the civilian noninstitutionalized population.
DATA SOURCE: NCHS, National Health Interview Survey, 2015, combined Sample Adult and Sample Child Core components.
Data table for Figure 15.3. Sex-adjusted percentage of persons who experienced an asthma episode in the past 12 months, among all persons and among persons with current asthma, by age group and race/ethnicity: United States, 2015
Age (years) and race/ethnicity All persons All persons with current asthma
Sex-adjusted percent1 (95% confidence interval)
Under 15, Hispanic or Latino 4.2 (3.27-5.05) 50.9 (42.98-58.77)
Under 15, not Hispanic or Latino, single race, white 3.4 (2.61-4.12) 49.7 (41.49-58.00)
Under 15, not Hispanic or Latino, single race, black 6.5 (4.83-8.24) 46.8 (37.66-55.95)
15 and over, Hispanic or Latino 3.3 (2.67-3.83) 49.1 (42.40-55.84)
15 and over, not Hispanic or Latino, single race, white 3.8 (3.48-4.22) 45.7 (42.24-49.13)
15 and over, not Hispanic or Latino, single race, black 4.0 (3.08-4.85) 41.5 (33.03-49.98)
1Estimates for all persons are presented. Estimates are sex-adjusted using the projected 2000 U.S. population as the standard population.
NOTE: Data are based on household interviews of a sample of the civilian noninstitutionalized population.
DATA SOURCE: NCHS, National Health Interview Survey, 2015, combined Sample Adult and Sample Child Core components.
P ag e | 103 U.S. Department of Health and Human Services ● Centers for Disease Control and Prevention ● National Center for Health Statistics ● Released 05/16

Early Release of Selected Estimates Based on Data From the National Health Interview Survey, 2015
Data table for Figure 15.4. Prevalence of current asthma among persons of all ages: United States, 2001–2015
Year Crude1 percent (95% confidence interval) Age-adjusted2 percent (95% confidence interval)
2001 7.6 (7.3-7.9) 7.6 (7.3-7.9)
2002 7.4 (7.1-7.7) 7.4 (7.1-7.7)
2003 7.1 (6.8-7.4) 7.1 (6.8-7.4)
2004 7.3 (7.0-7.6) 7.3 (7.1-7.7)
2005 7.8 (7.50-8.10) 7.8 (7.51-8.11)
2006 8.0 (7.61-8.41) 8.0 (7.62-8.43)
2007 7.9 (7.50-8.31) 7.9 (7.51-8.33)
2008 7.9 (7.48-8.27) 7.9 (7.51-8.30)
2009 8.4 (7.97-8.76) 8.4 (7.99-8.78)
2010 8.6 (8.19-8.94) 8.6 (8.20-8.95)
2011 8.6 (8.31-8.93) 8.6 (8.32-8.95)
2012 8.5 (8.12-8.86) 8.5 (8.15-8.88)
2013 7.4 (7.09-7.76) 7.4 (7.11-7.77)
2014 7.9 (7.49-8.24) 7.9 (7.52-8.27)
2015 8.0 (7.62-8.30) 8.0 (7.63-8.32)
1Crude estimates are presented. 2Estimates are age-adjusted using the projected 2000 U.S. population as the standard population and three age groups: 0–14, 15–34, and 35 and over.
NOTES: Data are based on household interviews of a sample of the civilian noninstitutionalized population. Beginning with 2012 data, the National Health Interview Survey transitioned to weights derived from the 2010 census. For 2003–2011 data, weights were derived from the 2000 census. In this Early Release, estimates for 2000–2002 were recalculated using weights derived from the 2000 census. For 1997–1999 data, weights were derived from the 1990 census. See Technical Notes for more details.
DATA SOURCE: NCHS, National Health Interview Survey, 2001–2015, combined Sample Adult and Sample Child Core components.
P ag e | 104 U.S. Department of Health and Human Services ● Centers for Disease Control and Prevention ● National Center for Health Statistics ● Released 05/16

Early Release of Selected Estimates Based on Data From the National Health Interview Survey, 2015
Data table for Figure 15.5. Prevalence of current asthma among persons of all ages, by age group and sex: United States, 2015
Age (years) and sex Percent 95% confidence interval
Under 15, total 8.4 7.57-9.15
Under 15, male 9.9 8.86-10.99
Under 15, female 6.7 5.82-7.64
15–34 , total 7.9 7.20-8.67
15–34 , male 6.5 5.63-7.43
15–34 , female 9.3 8.21-10.45
35 and over, total 7.8 7.38-8.28
35 and over, male 5.3 4.71-5.90
35 and over, female 10.1 9.43-10.81
All ages (crude1), total 8.0 7.62-8.30
All ages (crude1), male 6.6 6.10-7.05
All ages (crude1), female 9.3 8.78-9.78
All ages (age-adjusted2), total 8.0 7.63-8.32
All ages (age-adjusted2), male 6.6 6.16-7.11
All ages (age-adjusted2), female 9.2 8.68-9.67
1Crude estimates are presented. 2Estimates are age-adjusted using the projected 2000 U.S. population as the standard population and three age groups: 0–14, 15–34, and 35 and over.
NOTE: Data are based on household interviews of a sample of the civilian noninstitutionalized population.
DATA SOURCE: NCHS, National Health Interview Survey, 2015, combined Sample Adult and Sample Child Core components.
Data table for Figure 15.6. Sex-adjusted prevalence of current asthma among persons of all ages, by age group and race/ethnicity: United States, 2015
Age (years) and race/ethnicity Percent1 95% confidence interval
Under 15, Hispanic or Latino 8.2 7.03-9.38
Under 15, not Hispanic or Latino, single race, white 6.8 5.68-7.89
Under 15, not Hispanic or Latino, single race, black 13.8 11.30-16.26
15 and over, Hispanic or Latino 6.3 5.57-7.04
15 and over, not Hispanic or Latino, single race, white 8.1 7.62-8.65
15 and over, not Hispanic or Latino, single race, black 9.2 7.92-10.44
1Estimates are sex-adjusted using the projected 2000 U.S. population as the standard population.
NOTE: Data are based on household interviews of a sample of the civilian noninstitutionalized population.
DATA SOURCE: NCHS, National Health Interview Survey, 2015, combined Sample Adult and Sample Child Core components.
P ag e | 105 U.S. Department of Health and Human Services ● Centers for Disease Control and Prevention ● National Center for Health Statistics ● Released 05/16

Early Release of Selected Estimates Based on Data From the National Health Interview Survey, 2015
P ag e | 106 U.S. Department of Health and Human Services ● Centers for Disease Control and Prevention ● National Center for Health Statistics ● Released 05/16
References 1. Cohen RA, Martinez ME, Zammitti EP. Health insurance coverage: Early release of estimates from the
National Health Interview Survey, 2015. National Center for Health Statistics. May 2016. Available from: http://www.cdc.gov/nchs/nhis.htm. [A series of Internet-only reports released approximately quarterly beginning in January 2004.]
2. Blumberg SJ, Luke JV. Wireless substitution: Early release of estimates from the National Health Interview Survey, July–December 2015. National Center for Health Statistics. May 2016. Available from: http://www.cdc.gov/nchs/nhis.htm. [A series of Internet-only reports released approximately every 6 months beginning in May 2007.]
3. U.S. Department of Health and Human Services, Office of Disease Prevention and Health Promotion. Healthy People 2020. Washington, DC. Available from: http://www.healthypeople.gov/2020/default.aspx.
4. CDC. Notice to readers: Delayed influenza vaccine availability for 2001–02 season and supplemental recommendations of the Advisory Committee on Immunization Practices. MMWR 50(27):582–5. 2001. Available from: http://www.cdc.gov/mmwr/preview/mmwrhtml/mm5027a3.htm.
5. CDC. Prevention and control of influenza: Recommendations of the Advisory Committee on Immunization Practices (ACIP). MMWR 54(RR–8):1–40. 2005. Available from: http://www.cdc.gov/mmwr/PDF/rr/rr5408.pdf.
6. CDC. Notice to readers: Updated recommendations from the Advisory Committee on Immunization Practices in response to delays in supply of influenza vaccine for the 2000–01 season. MMWR 49(39):888–92. 2000. Available from: http://www.cdc.gov/mmwr/preview/mmwrhtml/mm4939a3.htm.
7. CDC. Prevention and control of influenza: Recommendations of the Advisory Committee on Immunization Practices (ACIP). MMWR 52(RR–8):1–36. 2003. Available from: http://www.cdc.gov/mmwr/PDF/rr/rr5208.pdf.
8. CDC. Prevention and control of influenza: Recommendations of the Advisory Committee on Immunization Practices (ACIP). MMWR 55(RR–10):1–42. 2006. Available from: http://www.cdc.gov/mmwr/PDF/rr/rr5510.pdf.
9. CDC. Prevention of pneumococcal disease: Recommendations of the Advisory Committee on Immunization Practices (ACIP). MMWR 46(RR-08):1-24. 1997. Available from: http://www.cdc.gov/mmwr/preview/mmwrhtml/00047135.htm.
10. CDC. Use of 13-valent pneumococcal conjugate vaccine and 23-valent pneumococcal polysaccharide vaccine for adults with immunocompromising conditions: Recommendations of the Advisory Committee on Immunization Practices (ACIP). MMWR 61(40):816-9. 2012. Available from: http://www.cdc.gov/mmwr/preview/mmwrhtml/mm6140a4.htm.
11. Tomczyk S, Bennett NM, Stoecker C, Gierke R, Moore MR, Whitney CG, Hadler S, Pilishvili T. Use of 13-valent pneumococcal conjugate vaccine and 23-valent pneumococcal polysaccharide vaccine among adults aged ≥65 years: Recommendations of the Advisory Committee on Immunization Practices (ACIP). MMWR 63(37):822-5. 2014. Available from: http://www.cdc.gov/mmwr/preview/mmwrhtml/mm6337a4.htm.
12. Kessler RC, Barker PR, Colpe LJ, Epstein JF, Gfroerer JC, Hiripi E, et al. Screening for serious mental illness in the general population. Arch Gen Psychiatry 60(2):184–9. 2003.
13. Ni H, Schiller J, Hao C, et al. Early release of selected estimates based on data from the January–March 2003 National Health Interview Survey. National Center for Health Statistics. 2003. Available from: http://www.cdc.gov/nchs/nhis.htm.
14. National Cancer Institute, Statistical Research and Applications Branch. Joinpoint Regression Program, version 4.0.4 [computer software]. 2013.
15. Klein RJ, Schoenborn CA. Age adjustment using the 2000 projected U.S. population. Healthy People Statistical Notes, no. 20. Hyattsville, MD: National Center for Health Statistics. 2001. Available from: http://www.cdc.gov/nchs/data/statnt/statnt20.pdf.
16. Office of Management and Budget. Revisions to the standards for the classification of federal data on race and ethnicity. Fed Regist 62(210):58782–90. 1997. Available from: http://www.whitehouse.gov/omb/fedreg_1997standards.
17. National Center for Health Statistics. Health, United States, 2003. Hyattsville, MD. 2003. Available from: http://www.cdc.gov/nchs/data/hus/hus03.pdf.
18. Cohen RA, Martinez ME. Impact of Medicare and Medicaid probe questions on health insurance estimates from the National Health Interview Survey, 2004. Health E-stats. National Center for Health Statistics. 2005. Available from: http://www.cdc.gov/nchs/data/hestat/impact04/impact04.htm.

Early Release of Selected Estimates Based on Data From the National Health Interview Survey, 2015
P ag e | 107 U.S. Department of Health and Human Services ● Centers for Disease Control and Prevention ● National Center for Health Statistics ● Released 05/16
19. Centers for Disease Control and Prevention. Surveillance of influenza vaccination coverage— United States, 2007–08 through 2011–12 influenza seasons. MMWR 62(SS-4):1–28. 2013. Available from: http://www.cdc.gov/mmwr/preview/mmwrhtml/ss6204a1.htm?s_cid=ss6204a1_w.
20. Ward BW, Clarke TC, Nugent CN, Schiller JS. Early release of selected estimates based on data from the 2015 National Health Interview Survey. National Center for Health Statistics. May 2016. Available from: http://www.cdc.gov/nchs/nhis.htm. [A series of Internet-only reports released approximately quarterly beginning in April 2001.]

Early Release of Selected Estimates Based on Data From the National Health Interview Survey, 2015
Appendix. 2015 National Health Interview Survey Questions Used to Define Selected Health Measures Alphanumeric codes refer directly to the question on the 2015 National Health Interview Survey that wasused to define the health measure. Lack of health insurance and type of coverageInformation from follow-up questions such as plan name(s) was used to reassign insurance status and type ofcoverage to avoid misclassification.
FHI.050 The next questions are about health insurance. Include health insurance obtained throughemployment or purchased directly as well as government programs like Medicare andMedicaid that provide Medical care or help pay medical bills.
[Are you/Is anyone in the family] covered by any kind of health insurance or some otherkind of health care plan?
(1) Yes (2) No (7) Refused (9) Don’t know
FHI.070 What kind of health insurance or health care coverage [do you/does person] have? INCLUDEthose that pay for only one type of service (nursing home care, accidents, or dental care).EXCLUDE private plans that only provide extra cash while hospitalized.
(01) Private health insurance(02) Medicare(03) Medi-Gap(04) Medicaid(05) SCHIP/ CHIP ([State] Children’s Health Insurance Program)(06) Military health care (TRICARE/VA/CHAMP–VA)(07) Indian Health Service(08) State-sponsored health plan(09) Other government program(10) Single service plan (e.g., dental, vision, prescriptions)(11) No coverage of any type(97) Refused(99) Don’t know
FHI.072 People covered by Medicare have a card that looks like this. [Are you/Is person] covered byMedicare?
(1) Yes(2) No(7) Refused(9) Don’t know
FHI.073 There is a program called Medicaid that pays for health care for persons in need. Inthis State it is also called [State name]. [Are you/Is person] covered by Medicaid?
(1) Yes(2) No(7) Refused(9) Don’t know
P ag e | 108 U.S. Department of Health and Human Services ● Centers for Disease Control and Prevention ● National Center for Health Statistics ● Released 05/16

Early Release of Selected Estimates Based on Data From the National Health Interview Survey, 2015
Usual place to go for medical careAAU.020 Is there a place that you USUALLY go to when you are sick or need advice about your health?
AND
CAU.020 Is there a place that [child] USUALLY goes when [he/she] is sick or you need advice about [his/her] health?
(1) Yes(2) There is NO place(3) There is MORE THAN ONE place(7) Refused(9) Don’t know
AAU.030 [If only one place] What kind of place is it - a clinic, doctor's office, emergency room, or someother place? [If more than one place] What kind of place do you go to most often - a clinic,doctor's office, emergency room, or some other place?
AND
CAU.030 [If only one place] What kind of place is it—a clinic, doctor’s office, emergency room, or some other place? [If more than one place] What kind of place does [child] go to most often—a clinic, doctor’s office, emergency room, or some other place?
(1) Clinic or health center(2) Doctor’s office or HMO (3) Hospital emergency room(4) Hospital outpatient department(5) Some other place(6) Doesn’t go to one place most often(7) Refused(9) Don’t know
Failure to obtain needed medical care FAU.030 DURING THE PAST 12 MONTHS, was there any time when [you/someone in the family]
needed medical care, but did not get it because [you/the family] couldn’t afford it?
(1) Yes(2) No(7) Refused(9) Don’t know
Receipt of influenza vaccinationAAU.310 DURING THE PAST 12 MONTHS, have you had a flu shot? A flu shot is usually given in the
fall and protects against influenza for the flu season.
AND
AAU.315 DURING THE PAST 12 MONTHS, have you had a flu vaccine sprayed in your nose by a doctoror other health professional? A health professional may have let you spray it. This vaccine isusually given in the fall and protects against influenza for the flu season.
AND
P ag e | 109 U.S. Department of Health and Human Services ● Centers for Disease Control and Prevention ● National Center for Health Statistics ● Released 05/16

Early Release of Selected Estimates Based on Data From the National Health Interview Survey, 2015
CFI.005 DURING THE PAST 12 MONTHS, has [child] had a flu vaccination? A flu vaccination is usuallygiven in the fall and protects against influenza for the flu season.
(1) Yes(2) No(7) Refused(9) Don’t know
Receipt of pneumococcal vaccinationAAU.320 Have you EVER had a pneumonia shot? This shot is usually given only once or twice in a
person’s lifetime and is different from the flu shot. It is also called the pneumococcal vaccine.
(1) Yes(2) No(7) Refused(9) Don’t know
ObesityAHB.190 How tall are you without shoes?
(02–07) 2–7 feet(97) Refused (99) Don’t know (M) Metric
AND
(00–11)0–11 inches(97) Refused (99) Don’t know
OR
(0–2) 0–2 meters (7) Refused (9) Don’t know
AND
(000–241) 0–241 centimeters (997) Refused (999) Don’t know
AHB.200 How much do you weigh without shoes?
(050–500) 50–500 pounds (997) Refused (999) Don’t know (M) Metric
OR
(022–226) 22–226 kilograms (997) Refused (999) Don’t know
P ag e | 110 U.S. Department of Health and Human Services ● Centers for Disease Control and Prevention ● National Center for Health Statistics ● Released 05/16

Early Release of Selected Estimates Based on Data From the National Health Interview Survey, 2015
Leisure-time physical activityThe next questions are about physical activities (exercise, sports, physically active hobbies...) that you may doin your LEISURE time.
AHB.090 How often do you do VIGOROUS leisure-time physical activities for AT LEAST 10 MINUTESthat cause HEAVY sweating or LARGE increases in breathing or heart rate?
Field Representative: Read if necessary: How many times per day, per week, per month, orper year do you do these activities?
Number of vigorous leisure-time physical activities
(000) Never (001–995) 1–995 time(s) (996) Unable to do this type activity (997) Refused (999) Don’t know
Time period for vigorous leisure-time physical activities
(0) Never(1) Per day(2) Per week(3) Per month(4) Per year(6) Unable to do this activity(7) Refused(9) Don’t know
AHB.100 About how long do you do these vigorous leisure-time physical activities each time?
Number for length of vigorous leisure-time physical activities
(001–995) 1–995 (997) Refused (999) Don’t know
Time period for length of vigorous leisure-time physical activities
(1) Minutes(2) Hours(7) Refused(9) Don’t know
P ag e | 111 U.S. Department of Health and Human Services ● Centers for Disease Control and Prevention ● National Center for Health Statistics ● Released 05/16

Early Release of Selected Estimates Based on Data From the National Health Interview Survey, 2015
AHB.110 How often do you do LIGHT OR MODERATE LEISURE-TIME physical activities for ATLEAST 10 MINUTES that cause ONLY LIGHT sweating or a SLIGHT to MODERATE increase in breathing or heart rate?
Field Representative: If necessary, prompt with: How many times per day, per week, permonth, or per year do you do these activities?
Number of light or moderate leisure-time physical activities
(000) Never (001–995) 1–995 time(s) (996) Unable to do this type activity (997) Refused (999) Don’t know
Time period for light or moderate leisure-time physical activities
(0) Never(1) Per day(2) Per week(3) Per month(4) Per year(6) Unable to do this activity(7) Refused(9) Don’t know
AHB.120 About how long do you do these light or moderate leisure-time physical activities each time?
Number for length of light or moderate leisure-time physical activities
(001–995) 1–995 (997) Refused (999) Don’t know
Time period for length of light or moderate leisure-time physical activities
(1) Minutes(2) Hours(7) Refused(9) Don’t know
P ag e | 112 U.S. Department of Health and Human Services ● Centers for Disease Control and Prevention ● National Center for Health Statistics ● Released 05/16

Early Release of Selected Estimates Based on Data From the National Health Interview Survey, 2015
AHB.130 How often do you do LEISURE-TIME physical activities specifically designed toSTRENGTHEN your muscles such as lifting weights or doing calisthenics? (Include all suchactivities even if you have mentioned them before.)
Number of times
(000) Never (001–995) 1–995 time(s) (996) Unable to do this type activity (997) Refused (999) Don't know
Time period for times per day, per week, per month, or per year
(0) Never(1) Per day(2) Per week(3) Per month(4) Per year(6) Unable to do this activity(7) Refused(9) Don’t know
Current cigarette smokingAHB.010 Have you smoked at least 100 cigarettes in your ENTIRE LIFE?
(1) Yes(2) No(7) Refused(9) Don’t know
AHB.030 Do you NOW smoke cigarettes every day, some days or not at all?
(1) Every day(2) Some days(3) Not at all(7) Refused(9) Don’t know
Alcohol consumptionAHB.150 In your ENTIRE LIFE, have you had at least 12 drinks of any type of alcoholic beverage?
(1) Yes(2) No(7) Refused(9) Don’t know
P ag e | 113 U.S. Department of Health and Human Services ● Centers for Disease Control and Prevention ● National Center for Health Statistics ● Released 05/16

Early Release of Selected Estimates Based on Data From the National Health Interview Survey, 2015
AHB.180 In the PAST YEAR, on how many DAYS did you have [5 or more/4 or more] drinks of anyalcoholic beverage?
NOTE: From 1997–2013, both men and women were asked about days in which they had 5or more drinks of any alcoholic beverage. Starting in 2014, this question was changed; men were still asked about days in which they had 5 or more drinks of any alcoholic beverage, butwomen were asked about days in which they had 4 or more drinks of any alcoholic beverage.
Number of days
(000) Never/None (001–365) 1–365 days (997) Refused (999) Don’t know
Time period for days per week, per month, or per year
(0) Never/None(1) Per week(2) Per month(3) Per year(7) Refused(9) Don’t know
Human immunodeficiency virus testingASI.400 Except for tests you may have had as part of blood donations, have you ever been tested for HIV?
(1) Yes(2) No(7) Refused(9) Don’t know
General health status FHS.500 Would you say [your/person’s] health in general is excellent, very good, good, fair, or poor?
(1) Excellent(2) Very good(3) Good(4) Fair(5) Poor(7) Refused(9) Don’t know
Personal care needs FHS.070 Because of a physical, mental, or emotional problem, [do you/does anyone in the family]
need the help of other persons with PERSONAL CARE NEEDS, such as eating, bathing,dressing, or getting around inside this home?
(1) Yes(2) No(7) Refused(9) Don’t know
P ag e | 114 U.S. Department of Health and Human Services ● Centers for Disease Control and Prevention ● National Center for Health Statistics ● Released 05/16
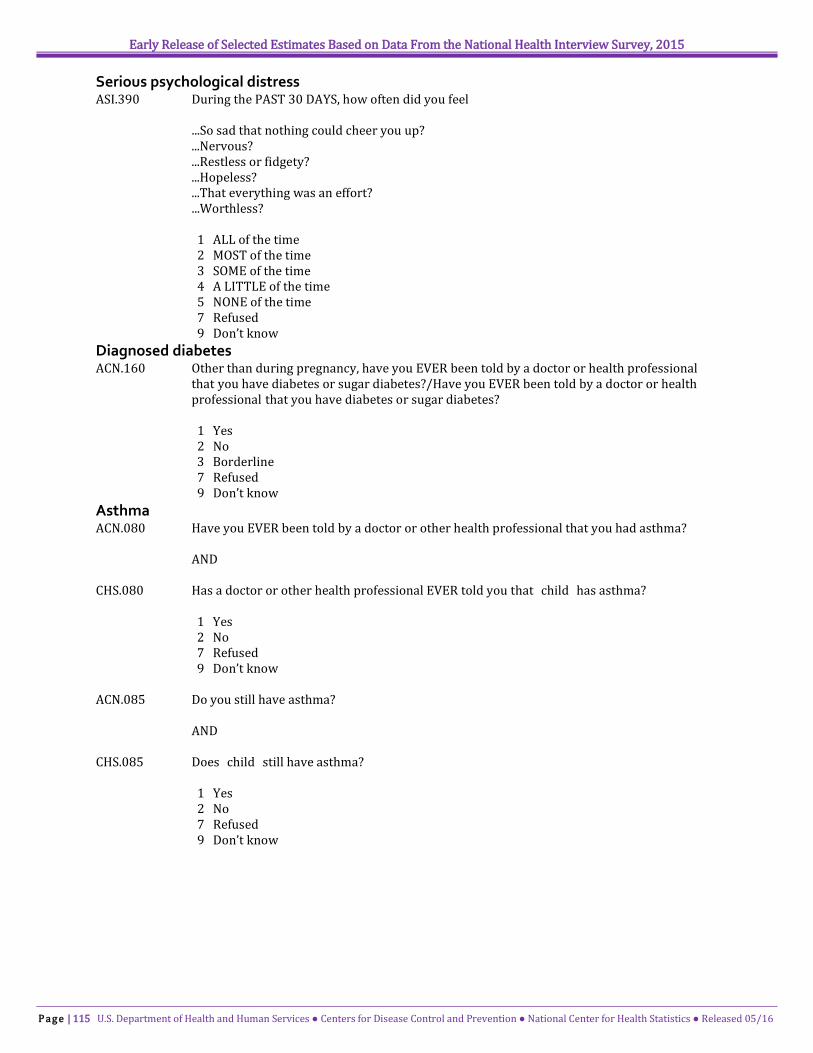
Early Release of Selected Estimates Based on Data From the National Health Interview Survey, 2015
Serious psychological distressASI.390 During the PAST 30 DAYS, how often did you feel
...So sad that nothing could cheer you up?
...Nervous?
...Restless or fidgety?
...Hopeless?
...That everything was an effort?
...Worthless?
(1) ALL of the time(2) MOST of the time(3) SOME of the time(4) A LITTLE of the time(5) NONE of the time(7) Refused(9) Don’t know
Diagnosed diabetesACN.160 Other than during pregnancy, have you EVER been told by a doctor or health professional
that you have diabetes or sugar diabetes?/Have you EVER been told by a doctor or healthprofessional that you have diabetes or sugar diabetes?
(1) Yes(2) No(3) Borderline(7) Refused(9) Don’t know
Asthma ACN.080 Have you EVER been told by a doctor or other health professional that you had asthma?
AND
CHS.080 Has a doctor or other health professional EVER told you that [child] has asthma?
(1) Yes(2) No(7) Refused(9) Don’t know
ACN.085 Do you still have asthma?
AND
CHS.085 Does [child] still have asthma?
(1) Yes(2) No(7) Refused(9) Don’t know
P ag e | 115 U.S. Department of Health and Human Services ● Centers for Disease Control and Prevention ● National Center for Health Statistics ● Released 05/16

Early Release of Selected Estimates Based on Data From the National Health Interview Survey, 2015
ACN.090 DURING THE PAST 12 MONTHS, have you had an episode of asthma or an asthma attack?
AND
CHS.090 DURING THE PAST 12 MONTHS, has [child] had an episode of asthma or an asthma attack?
(1) Yes(2) No(7) Refused(9) Don’t know
P ag e | 116 U.S. Department of Health and Human Services ● Centers for Disease Control and Prevention ● National Center for Health Statistics ● Released 05/16

Early Release of Selected Estimates Based on Data From the National Health Interview Survey, 2015
Technical Notes
Data source
Data used to produce this Early Release are derived from the three main components of the National HealthInterview Survey (NHIS) from 1997 through 2015: (a) the Family Core, which collects information on allfamily members in each household; (b) the Sample Child Core, which collects information on one randomlyselected child (the “sample child”) in each family with a child; and (c) the Sample Adult Core, which collectsinformation from one randomly selected adult (the “sample adult”) aged 18 or over in each family. Dataanalyses for the 2015 NHIS were based on 103,798 persons in the Family Core, 33,824 adults in the SampleAdult Core, and 12,345 children in the Sample Child Core. Visit the NHIS websiteat http://www.cdc.gov/nchs/nhis.htm for more information on the design, content, and use of NHIS.
Calibration of weights to independent population estimates
Estimates were calculated using the NHIS sample weights, which were calibrated to 2010 census-basedpopulation estimates for sex, age, and race/ethnicity of the U.S. civilian noninstitutionalized populationbeginning with 2012 NHIS data. NHIS weights were calibrated to 2000 census-based population estimates for NHIS data between 2003 and 2011. In Early Release reports prior to September 2003, the weights for 1997–2002 NHIS data were derived from 1990 census-based population estimates. The impact of the transitionfrom 1990 census-based population estimates to 2000 census-based population estimates was assessed fordata from the 2000–2002 NHIS by comparing estimates that used the 1990 census-based weights with thosethat used the 2000 census-based weights. The results were presented in Tables II and III in the Appendix ofthe September 2003 Early Release report on key health indicators (13). Although the changes for all selectedmeasures were no more than 1 percentage point, the 2000–2002 estimates for all measures were recalculated beginning with the 2003 Early Release report on key health indicators, up through the presentreport, using weights derived from the 2000 census. The NHIS data weighting procedure is described in moredetail at: http://www.cdc.gov/nchs/data/series/sr_02/sr02_130.pdf (1997–2005 NHIS) and http://www.cdc.gov/nchs/data/series/sr_02/sr02_165.pdf (2006–2015 NHIS).
Implementation of a new sample design
A new sample design was implemented with the 2006 NHIS. In addition to the continued oversampling ofblack and Hispanic persons carried out in the 1995–2005 NHIS sample design, persons of Asian descent areoversampled in the new design. Also, for the Sample Adult Core, a new level of oversampling began in 2006for persons aged 65 and over who are black, Hispanic, or Asian. These older adults are now more likely thanother adults in the family to be selected as the sample adult. Some of the differences between estimates for2006 and later and estimates for earlier years may be attributable to the new sample design. However, theimpact of the new design on estimates presented in this report is expected to be minimal.
Estimation procedures
NCHS creates weights for each calendar quarter of the NHIS sample. The NHIS data weighting procedures aredescribed in more detail at: http://www.cdc.gov/nchs/data/series/sr_02/sr02_130.pdf (1997–2005 NHIS) and http://www.cdc.gov/nchs/data/series/sr_02/sr02_165.pdf (2006–2015 NHIS). Because the estimatesfor 2015 are being released prior to final data editing and final weighting, they should be considered preliminary and may differ slightly from estimates that will be made later using the final 2015 data files.Estimates from the 1997–2014 NHIS are based on previous reports and are therefore also based onpreliminary data files and not final data files. Differences between estimates calculated using preliminarydata files and final data files are typically less than 0.1 percentage point. For 2008, differences may be as highas 1.5 percentage points because a larger-than-usual number of records were removed for insufficient qualityin the final data files. As mentioned previously, estimates for 2000–2002 were recalculated in this report using the 2000 census-based weights that were not included in the final files. See “Lack of Health Insurance Coverage and Type of Coverage” (Section 1 in this report) for details on special data editing for healthinsurance variables. For NHIS announcements and more detailed information, visit the NHIS website at: http://www.cdc.gov/nchs/nhis.htm.
Point estimates, and estimates of their variances, were calculated using the SUDAAN software package (RTIInternational, Research Triangle Park, NC) to account for the complex sample design of NHIS. The Taylorseries linearization method was chosen for variance estimation. All estimates shown meet the NCHS standard of having less than or equal to 30% relative standard error, unless otherwise noted. Point estimates in some
P ag e | 117 U.S. Department of Health and Human Services ● Centers for Disease Control and Prevention ● National Center for Health Statistics ● Released 05/16

Early Release of Selected Estimates Based on Data From the National Health Interview Survey, 2015
figures and tables are accompanied by 95% confidence intervals. Beginning with the June 2006 release,confidence intervals are shown to two decimal places to improve the precision of further calculations. TheJune 2007 Early Release report used final in-house design variables for estimating variance. Early Releasereports other than the June 2007 report use Early Release interim design variables to estimate variance.
Significance testing
Trends were assessed by using Joinpoint regression (14), which characterizes trends as joined linearsegments. A joinpoint is the year at which two segments with different slopes meet. Joinpoint software usesstatistical criteria to determine the fewest number of segments necessary to characterize a trend and theyear(s) when segments begin and end.
Differences between percentages or rates for current estimates were evaluated by using two-sidedsignificance tests at the 0.05 level. Terms such as “higher than,” “less than,” “more likely,” and “less likely”indicate a statistically significant difference, unless otherwise noted. Terms such as “similar” and “no difference” indicate that the statistics being compared were not significantly different. Lack of comment regarding the difference between any two statistics does not necessarily mean that the difference was tested and found to be not significant. Because of small sample sizes, estimates based on less than 1 year of data mayhave large variances, and caution should be used in analyzing these estimates. Patterns for such estimatesmay change as more data become available.
Adjustment for age and sex
Age-sex-adjusted percentages were calculated for three race/ethnicity groups. For the prevalence of obesity,only age-adjusted sex-specific percentages are presented because the race/ethnicity patterns in obesityprevalence differ by sex. Similarly, only sex-adjusted age-specific prevalences are presented for the asthmameasures because the race/ethnicity patterns in asthma episodes and current asthma differ by age. Direct standardization was used for adjustment, using the projected 2000 U.S. population as the standardpopulation (15) and using age groups that varied depending on the impact of age on the specific measure.Rates presented are crude rates unless otherwise stated.
Race/ethnicity categories
The race/ethnicity categories for data years beginning in 2003 are defined using the 1997 Revisions to the Standards for the Classification of Federal Data on Race and Ethnicity (16) promulgated by the U.S. Office ofManagement and Budget (OMB). Subsequent to the Early Releases based on data through 2002, thecategories “non-Hispanic white” and “non-Hispanic black” were changed to “not Hispanic white, single race”and “not Hispanic black, single race.” The term “Hispanic” was changed to “Hispanic or Latino,” and “black”was changed to “black or African American.” However, the text and figures in this report use shorter terms,for conciseness. For example, the category “not Hispanic or Latino, white, single race” in the tables is referredto as “non-Hispanic white” in the text. Race/ethnicity-specific estimates for years prior to 2003, released previously, were based on the 1977 OMB standards and therefore are not strictly comparable with estimatesfor 2003 and later. However, the changes in the OMB standards have little effect on the health estimatesreported here. See Tables XI and XII in Health, United States, 2003 (17) for a comparison of estimates forcigarette smoking and private health insurance coverage using both the 1977 and 1997 OMB standards. Inaddition, beginning with the 2003 NHIS (first incorporated in the September 2004 Early Release), NHISediting procedures were changed to maintain consistency with U.S. Census Bureau procedures for collectingand editing data on race/ethnicity. These changes reflect the elimination of “other race” as a separate raceresponse. This response category is treated as missing, and race is imputed if this was the only race response.In cases where “other race” was mentioned along with one or more OMB race groups, the “other race”response is dropped and the OMB race group information is retained. This change is not expected to have asubstantial effect on the estimates.
Health insurance
Additional estimates for health insurance can be found in the Early Release Program’s quarterly report,Health Insurance Coverage: Early Release of Estimates From the National Health Interview Survey, 2015 (1).
The data on health insurance status were edited using an automated system based on logic checks andkeyword searches. For comparability, the estimates for all years were created using these same procedures.
P ag e | 118 U.S. Department of Health and Human Services ● Centers for Disease Control and Prevention ● National Center for Health Statistics ● Released 05/16

Early Release of Selected Estimates Based on Data From the National Health Interview Survey, 2015
The resulting estimates of persons without health insurance coverage are generally 0.1–0.3 percentage point lower than those based on the editing procedures used for the final data files.
To reduce potential errors in reporting Medicare and Medicaid status, two questions were added to thehealth insurance section of NHIS beginning in the third quarter of 2004. Persons aged 65 and over not reporting Medicare coverage were asked explicitly about Medicare coverage. Persons under age 65 with no reported coverage were asked explicitly about Medicaid coverage. For the present report, estimates that exclude the two additional questions are labeled “Method 1,” and estimates that include the additionalquestions are labeled “Method 2.” Estimates for 1997–2003 in this report are generated using Method 1.Estimates for 2004 are presented using Method 2 in figures and both Method 1 and Method 2 in tables.Estimates for 2005 and beyond are calculated using Method 2. Statements about trends or comparisons for1997–2003 are based on estimates calculated using Method 1. Statements about trends or comparisons for2004–present are based on estimates calculated using Method 2. Statements about trends over groups ofyears from before 2004 to 2004 or later take both methodologies into account. Conclusions regarding trendsare not made in cases where using one method yields a different result than the same trend analysis using theother method. Note that although both methods may yield the same conclusion, the extent of the increasing ordecreasing trend may be larger using one method than with the other method.
Estimates for 2004 were calculated using both methods to assess the effect of adopting Method 2. From Julythrough December 2004 (third and fourth quarters combined), with the use of Method 2, the estimates(weighted) for persons without health insurance coverage decreased from 10.4% to 9.9% for persons underage 18, from 19.7% to 19.5% for adults aged 18–64, and from 1.7% to 1.2% for persons aged 65 and over.Also, with the use of Method 2, the estimates for public coverage increased from 28.1% to 29.6% for childrenunder age 18, from 11.3% to 11.4% for adults aged 18–64, and from 89.5% to 93.3% for persons aged 65 andover. The two additional questions had no impact on the estimates for private coverage. Additionalinformation on the impact of these two questions on health insurance estimates can be found in “Impact ofMedicare and Medicaid Probe Questions on Health Insurance Estimates from the National Health InterviewSurvey, 2004” (18).
Influenza vaccination
An error in calculating influenza vaccination rates occurred from the first quarter of 2005 through the firstquarter of 2007. The effect of this error on estimates was small. Compared with the original estimates,corrected estimates are slightly higher, usually by no more than 0.3 percentage point. The error has beencorrected for all estimates in this Early Release and had no perceptible impact on the graphs.
Responses to the influenza vaccination questions used to calculate the influenza vaccination estimatespresented in this report (see Appendix) cannot be used to determine when, during the preceding 12 months,the subject received the influenza vaccination. In addition, estimates are subject to recall error, which willvary depending on when the question is asked because the receipt of an influenza vaccination is seasonal. Theprevalence of influenza vaccination during the past 12 months may differ from season-specific coverage (19) (estimates available from: http://www.cdc.gov/flu/fluvaxview).
Alcohol consumption
From 1997–2013, the alcohol consumption estimates presented are for the percentage of adults aged 18 andover who had five or more drinks in 1 day at least once in the past year, regardless of sex. However, in 2014the survey questions were changed; male and female respondents were asked about a different quantity ofdrinks consumed in a day in the past year. As a result, the estimates presented for 2014 and later are for men aged 18 and over who had five or more drinks in 1 day at least once in the past year and women aged 18 andover who had four or more drinks in 1 day at least once in the past year. Differences observed in estimates for women based on the 2014 and later NHIS and 2013 and earlier NHIS may be partially or fully attributable tothese changes in the survey questions on alcohol consumption.
Human immunodeficiency virus (HIV) testing
From 1997 to 2010, the question on HIV testing was located in the AIDS Knowledge and Attitudes (ADS)section of the NHIS questionnaire. The question was preceded by questions that asked respondents whetherthey had donated blood to a blood bank since March 1985 and, if they had, whether they had donated bloodduring the past 12 months. The wording of the HIV testing question depended on the respondent’s answers tothe blood donation questions. Respondents who had donated blood were instructed to exclude tests they may
P ag e | 119 U.S. Department of Health and Human Services ● Centers for Disease Control and Prevention ● National Center for Health Statistics ● Released 05/16

Early Release of Selected Estimates Based on Data From the National Health Interview Survey, 2015
have had as part of blood donations before they were asked if they had ever been tested for HIV. Respondentswho had not donated blood were only asked if they had ever been tested for HIV. The ADS section was the last section fielded in the Sample Adult Core questionnaire and was preceded by the Adult Access to Health Careand Utilization (AAU) section.
In 2011, the ADS section was dropped from NHIS, with only the HIV testing question retained. The questionwas added to the AAU section and is preceded by questions on health insurance. Because no questions were asked about blood donations prior to the HIV testing question, the wording of the question was the same forall respondents. They were instructed to exclude tests they may have had as part of blood donations beforethey were asked if they had ever been tested for HIV. The AAU section is the last section fielded in the SampleAdult Core questionnaire, and the HIV testing question is the last question in the AAU section. Differencesobserved in estimates based on the 2010 and earlier NHIS and the 2011 and later NHIS may be partially orfully attributable to this change in placement of the HIV testing question on the NHIS questionnaire.
In 2013, the HIV testing question was removed from the AAU section and was added to the Adult SelectedItems (ASI) section, where it is preceded by questions on sexual orientation, worries related to financial matters, sleep, and psychological distress. Because no questions were asked about blood donations prior tothe HIV testing question, the wording of the question was the same for all respondents. They were instructed to exclude tests they may have had as part of blood donations before they were asked if they had ever beentested for HIV. Beginning in 2013, the ASI section is the last section fielded in the Sample Adult Corequestionnaire, and the HIV testing question is the second-to-last question in the ASI section (followed by aquestion asking adults who had not been tested why they had not been tested). Differences observed inestimates based on the 2012 and earlier NHIS and the 2013 and later NHIS may be partially or fullyattributable to this change in placement of the HIV testing question on the NHIS questionnaire.
Serious psychological distress
From 1997 to 2012, the six questions on psychological distress were located in the Adult Conditions (ACN)section of the Sample Adult Core questionnaire. The ACN section was preceded by the Adult Socio-Demographic (ASD) section. In 2013, the six psychological distress questions were moved from the ACNsection and added to the Adult Selected Items (ASI) section, where they were preceded by questions onsexual orientation, worries related to financial matters, and sleep. Beginning in 2013, the ASI section is thelast section fielded in the Sample Adult Core questionnaire. Due to the higher than usual amount of missingdata in the ASI section, adults with missing data for any of the six psychological distress questions areexcluded from the calculation of the serious psychological distress indicator for 2013 and later. Differencesobserved in estimates based on the 2012 and earlier NHIS and the 2013 and later NHIS may be partially orfully attributable to this change in placement of the six psychological distress questions on the NHISquestionnaire.
Early Release of NHIS Estimates
The NCHS Early Release Program updates and releases timely estimates by means of three Early Release reports. This Early Release of Selected Estimates (20) and a separate health insurance report (1) are releasedapproximately 5 to 6 months after National Health Interview Survey (NHIS) data collection has beencompleted for each quarter. A third report on wireless substitution (2) is released mid-year and again at theend of the year. New measures may be added as work continues and in response to changing data needs.Feedback on the Early Release mechanism and on the estimates is welcome (e-mail).
Announcements about Early Releases, other new data releases, publications, or corrections related to NHISwill be sent to members of the National Health Interview Survey (NHIS) researchers electronic mailing list.To join, visit: http://www.cdc.gov/subscribe.html.
Previous releases. A list of previous Early Release Program reports is availablefrom: http://www.cdc.gov/nchs/nhis/releases.htm.
Suggested Citation
Ward BW, Clarke TC, Nugent CN, Schiller JS. Early release of selected estimates based on data from the 2015National Health Interview Survey. National Center for Health Statistics. May 2016. Availablefrom: http://www.cdc.gov/nchs/nhis.htm.
P ag e | 120 U.S. Department of Health and Human Services ● Centers for Disease Control and Prevention ● National Center for Health Statistics ● Released 05/16