early cytoplasmic uncoating is associated with infectivity of … · early cytoplasmic uncoating is...
TRANSCRIPT

Early cytoplasmic uncoating is associated withinfectivity of HIV-1João I. Mamedea, Gianguido C. Ciancia, Meegan R. Andersona, and Thomas J. Hopea,1
aDepartment of Cell and Molecular Biology, Feinberg School of Medicine, Northwestern University, Chicago, IL 60611
Edited by John M. Coffin, Tufts University School of Medicine, Boston, MA, and approved July 14, 2017 (received for review May 5, 2017)
After fusion, HIV delivers its conical capsid into the cytoplasm. Torelease the contained reverse-transcribing viral genome, the capsidmust disassemble in a process termed uncoating. Defining thekinetics, dynamics, and cellular location of uncoating of virionsleading to infection has been confounded by defective, noninfec-tious particles and the stochastic minefield blocking access to hostDNA.We used live-cell fluorescent imaging of intravirion fluid phasemarkers to monitor HIV-1 uncoating at the individual particle level.We find that HIV-1 uncoating of particles leading to infection is acytoplasmic process that occurs ∼30 min postfusion. Most, but notall, of the capsid protein is rapidly shed in tissue culture and primarytarget cells, independent of entry pathway. Extended time-lapseimaging with less than one virion per cell allows identification ofinfected cells by Gag-GFP expression and directly links individualparticle behavior to infectivity, providing unprecedented insightsinto the biology of HIV infection.
HIV-1 early steps | HIV-1 uncoating | live-cell imaging
HIV is the etiological agent of the AIDS pandemic. To infecta target cell, HIV must complete a series of steps initiating
with fusion and release into the cytoplasm, followed by reversetranscription, nuclear translocation, and integration into the hostchromatin. After cell fusion, HIV delivers its conical core, referredto as the capsid, into the cytoplasm. The capsid, formed by CAprotein hexamers and pentamers, contains several viral and hostcell proteins as well as the viral genome (1), and is an interestingtarget for new antiviral therapies. The disassembly of this fullerenecone composed of CA is termed uncoating, and it is critical toinfection (2). Determinants in CA have been shown to influencemultiple steps of infection, such as nuclear translocation pathwayand preference of HIV sites of integration (3–8), and to influencehost responses, such as DNA sensing mediated by cyclic GMP-AMP synthase (cGAS) (9, 10).To date, there are disagreeing models for the timing and cellular
location of HIV-1 uncoating (11). An early model advocated foruncoating at viral fusion, based on the inability to detect CA as-sociated with purified reverse transcription complexes (RTCs) orpreintegration complexes (PICs) (12–14). The discovery ofTRIM5α and TRIM-CypA’s ability to target HIV-1 capsids andblock HIV-1 infection revealed the persistence of the viral cone inthe cytoplasm after fusion (15–23). Another model suggests thatCA is not shed from the RTC and that the intact capsid docks atthe nuclear pore (3, 5). This possibility is supported by the obser-vation that CA is a viral determinant in several important steps thatoccur in the nucleus, including nuclear import and integration siteselection of the viral genetic material in the host DNA (3–5, 24). Athird proposed model is that uncoating takes place in the cytoplasmas the reverse-transcribing viral genome is transported to the nu-cleus. This model is based on both fluorescence microscopy ob-servations and assays that exploit the impact on infection frommodulated TRIM5 susceptibility (25–29). The HIV-1 capsid un-coating dependence on microtubule stability also supports a cyto-plasmic uncoating (25, 26, 30–34). Recently, the importance anddependence on CA of most of the early steps of infection havebeen partially explained by the identification of a small amount ofCA that associates with the PIC in the nucleus (35–38). Because ofthe differences between these models, the kinetics, dynamics, and
cellular location of uncoating of infectious HIV-1 particles haveremained controversial topics (4, 25–29, 37, 39, 40).A major hurdle to the clarification of HIV-1 uncoating is that
most uncoating assays examine populations of viral particles.These populations include defective or noninfectious virionsand stochastic events leading to nonproductive aborted infection,which confounds data interpretation. These assays inevitably av-erage the behavior of different viral particle phenotypes. So far,the field has been unable to differentiate between defective orineffectual particles with an anomalous behavior and particles thatare associated with productive infection of a target cell. In thisstudy, we leverage a live-cell imaging assay to distinguish particlesassociated with infection and define their associated behavior. Westudy the behavior of individual labeled viral particles in cell lines,and primary cells that are HIV-1 targets of infection.
ResultsDevelopment of a Live-Cell Imaging Fluorescent Microscopy Assay toMeasure HIV-1 Capsid Integrity Loss. To observe the state of theintegrity of the HIV conical capsid, we use live-cell fluorescentimaging to monitor HIV-1 capsid integrity by tracking singleparticles that are dual-labeled with Gag-iGFP, a fluid phase marker,and with the viral genome complex labeled by mCherryVpr (25, 41).The loss of capsid integrity is observed as a loss of fluid phase GFPcontained within an intact conical capsid. Multiple groups haveshown that the generation of HIV-1 particles with a Gag-GFPpolyprotein (HIV-iGFP) releases free GFP after proteolytic viralmaturation. The liberated GFP then becomes an intravirion fluidphase marker (41–43). We previously demonstrated that a minoritysubset of the fluid phase GFP is trapped within the capsid structure(42, 44). This minority of fluid phase GFP trapped within capsidsallows the prefusion virions to be differentiated from postmembranefusion intact conical capsids and capsids that have lost their integritywhen particles are dual-labeled with a viral genome complex marker,
Significance
After fusion, HIV delivers its capsid formed of CA proteins into thecytoplasm. The regulated disassembly of the capsid (uncoating) iscritical to the timely exposure of the viral genome and infection.The timing of this process is controversial. Utilizing an intravirionGFP fluid phase marker with a live-cell imaging approach, wherewe use less than one virion per cell, we demonstrate that theuncoating of HIV-1 particles is an early cytoplasmic process takingplace∼30minutes after fusion, and dependent on ongoing reversetranscription. Early uncoating is observed in culture cells, primaryT cells, and macrophages with either HIV or pseudotyped enve-lope. Partial CA retention with the viral complex facilitates late CAfunctions, including nuclear import and integration site selection.
Author contributions: J.I.M., G.C.C., and T.J.H. designed research; J.I.M. and M.R.A. per-formed research; J.I.M. and T.J.H. contributed new reagents/analytic tools; J.I.M., G.C.C.,and T.J.H. analyzed data; and J.I.M., G.C.C., and T.J.H. wrote the paper.
The authors declare no conflict of interest.
This article is a PNAS Direct Submission.
Freely available online through the PNAS open access option.1To whom correspondence should be addressed. Email: [email protected].
This article contains supporting information online at www.pnas.org/lookup/suppl/doi:10.1073/pnas.1706245114/-/DCSupplemental.
www.pnas.org/cgi/doi/10.1073/pnas.1706245114 PNAS | Published online August 7, 2017 | E7169–E7178
MICRO
BIOLO
GY
PNASPL
US

such as mCherryVpr (Fig. 1A). The mCherryVpr is an effective toolto track RTCs as they initiate reverse transcription (14, 25). Here, weleverage the ability to detect the stepwise loss of the GFP fluid phasemarker to monitor loss of HIV-1 capsid integrity within living cellsusing time-lapse fluorescent microscopy (Fig. 1A).To determine the timing of HIV-1 capsid integrity loss after vi-
rion fusion, we initially used Chinese hamster ovary (CHOpgsa745)cells infected with vesicular stomatitis virus G glycoprotein (VSV-G)pseudotyped HIV-1–iGFP–mCherryVpr particles (Movie S1). Thismutant CHO cell line lacks expression of glycosaminoglycans,resulting in high efficiency of particle fusion and cytoplasmic entryupon cellular engagement (16). The analysis of a well-characterizedpreparation of virions (Fig. S1) that entered imaged cells revealsthat the majority of viral particles show a dramatic loss of most oftheir GFP, consistent with fusion within an endosome within∼30 min of cell engagement (Fig. 1 A and B). This considerableGFP loss is concurrent with fusion, as revealed by using viral
particles with S15-tdTomato–labeled membranes (Movie S2).However, as anticipated, a majority of the cytoplasmic viralcomplexes retain a subset of the GFP trapped within the intactcone. The level of residual GFP is lost from the mCherryVpr RTCmarker ∼30 min after fusion, revealing a dual-step loss of GFPfrom the viral complex.While this dual-step GFP loss represents the most common
phenotype, other viral behaviors are present (Figs. 1D and 2A).Some particles lose their entire GFP signal after fusion, likely due toincomplete formation of a mature and intact capsid (42). A notableminority population appears to fuse but does not lose the totality ofits GFP signal before the end of the data acquisition period(>120 min). We fit the GFP signal with a heuristic double-sigmoidequation (Fig. S2 B and C) to determine Δt: the time between thefirst drop in intensity (indicating fusion) and the subsequent loss ofthe remaining GFP (indicating capsid integrity loss). We find a me-dian postfusion capsid integrity loss of Δt = 25.0 ± 7.3 min (Fig. 1D).
Fig. 1. Live-cell imaging of HIV-iGFP reveals an early timing to capsid integrity loss associated with infection. (A) Time course of HIV-iGFP-mCherryVpr infectionreveals two independent GFP signal drops leading to complete loss of signal; the mCherryVpr signal is used to track HIV particles. A particle interacts with a targetcell; when fusion occurs, there is a first drop of the GFP signal; and when the capsid integrity is compromised, there is a complete loss of the GFP signal. (Scale bar:500 nm.) (B) Time-lapse quantification of mean particle intensity of GFP signal (green) and mCherryVpr (red). (C) Cells from a live imaging experiment over 22 hwere fixed and stained for p24/p55 (red) and Lamin-B (blue), and de novo signal of HIV-iGFP was also acquired (green). A single particle was able to fuse to thiscell, demonstrating a dual-drop phenotype, as shown in Movie S1. (Scale bar: 10 μm.) (D) Median time of capsid integrity loss is 25.0 min for dual-drop events:kinetics of iGFP-mCherryVpr particles that undergo total loss of GFP signal Δ(time of total integrity loss − time of fusion) (∼290 cells). Particles that lost all GFPsimultaneously to fusion were given a value of 0 (white circles), particles that kept GFP until the end of the time lapse were given a value of 120 min (green circles),particles that had two signal drops were given a value of Δ(time of total integrity loss − time of fusion) obtained with data fitting and were dual-labeled withmCherryVpr (black circles), and particles with two iGFP signal drops without mCherryVpr marker are shown as gray circles. (D, Right) Median time of capsidintegrity loss is 29.3 min for cells that became infected, only infected cells that presented one virus phenotype were plotted, and all cells that became infected hada dual-drop HIV-iGFP phenotype (∼4,000 cells). Medians are shown as gray horizontal bars. STDEV, standard deviation.
E7170 | www.pnas.org/cgi/doi/10.1073/pnas.1706245114 Mamede et al.
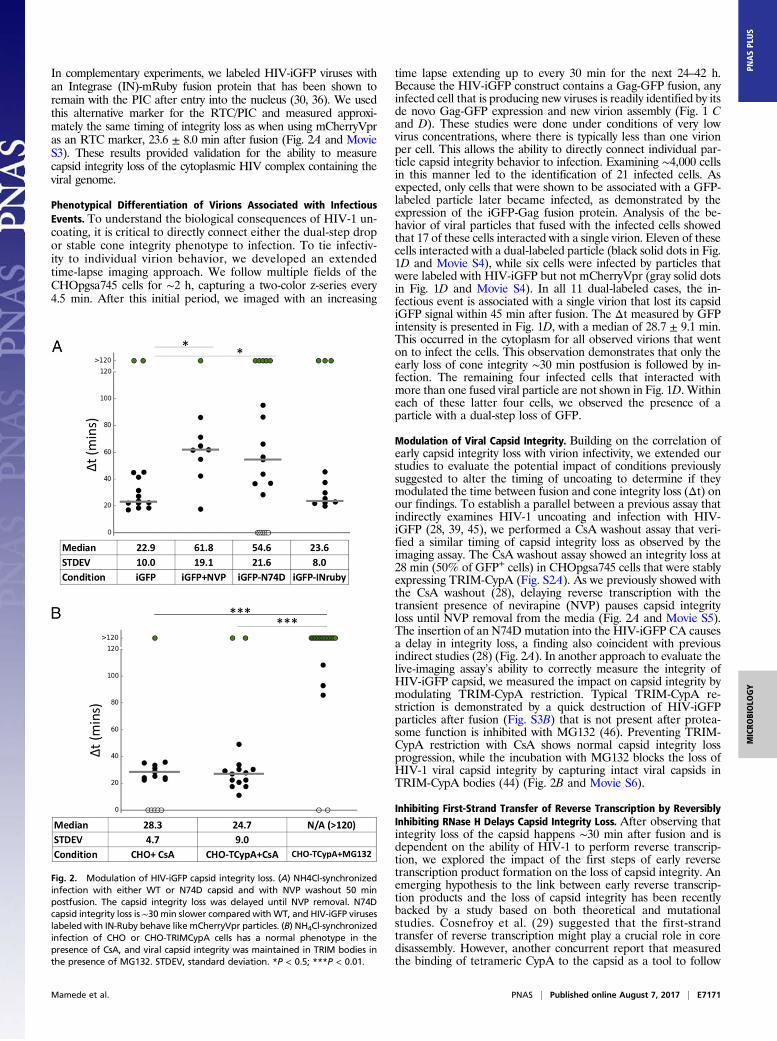
In complementary experiments, we labeled HIV-iGFP viruses withan Integrase (IN)-mRuby fusion protein that has been shown toremain with the PIC after entry into the nucleus (30, 36). We usedthis alternative marker for the RTC/PIC and measured approxi-mately the same timing of integrity loss as when using mCherryVpras an RTC marker, 23.6 ± 8.0 min after fusion (Fig. 2A and MovieS3). These results provided validation for the ability to measurecapsid integrity loss of the cytoplasmic HIV complex containing theviral genome.
Phenotypical Differentiation of Virions Associated with InfectiousEvents. To understand the biological consequences of HIV-1 un-coating, it is critical to directly connect either the dual-step dropor stable cone integrity phenotype to infection. To tie infectiv-ity to individual virion behavior, we developed an extendedtime-lapse imaging approach. We follow multiple fields of theCHOpgsa745 cells for ∼2 h, capturing a two-color z-series every4.5 min. After this initial period, we imaged with an increasing
time lapse extending up to every 30 min for the next 24–42 h.Because the HIV-iGFP construct contains a Gag-GFP fusion, anyinfected cell that is producing new viruses is readily identified by itsde novo Gag-GFP expression and new virion assembly (Fig. 1 Cand D). These studies were done under conditions of very lowvirus concentrations, where there is typically less than one virionper cell. This allows the ability to directly connect individual par-ticle capsid integrity behavior to infection. Examining ∼4,000 cellsin this manner led to the identification of 21 infected cells. Asexpected, only cells that were shown to be associated with a GFP-labeled particle later became infected, as demonstrated by theexpression of the iGFP-Gag fusion protein. Analysis of the be-havior of viral particles that fused with the infected cells showedthat 17 of these cells interacted with a single virion. Eleven of thesecells interacted with a dual-labeled particle (black solid dots in Fig.1D and Movie S4), while six cells were infected by particles thatwere labeled with HIV-iGFP but not mCherryVpr (gray solid dotsin Fig. 1D and Movie S4). In all 11 dual-labeled cases, the in-fectious event is associated with a single virion that lost its capsidiGFP signal within 45 min after fusion. The Δt measured by GFPintensity is presented in Fig. 1D, with a median of 28.7 ± 9.1 min.This occurred in the cytoplasm for all observed virions that wenton to infect the cells. This observation demonstrates that only theearly loss of cone integrity ∼30 min postfusion is followed by in-fection. The remaining four infected cells that interacted withmore than one fused viral particle are not shown in Fig. 1D. Withineach of these latter four cells, we observed the presence of aparticle with a dual-step loss of GFP.
Modulation of Viral Capsid Integrity. Building on the correlation ofearly capsid integrity loss with virion infectivity, we extended ourstudies to evaluate the potential impact of conditions previouslysuggested to alter the timing of uncoating to determine if theymodulated the time between fusion and cone integrity loss (Δt) onour findings. To establish a parallel between a previous assay thatindirectly examines HIV-1 uncoating and infection with HIV-iGFP (28, 39, 45), we performed a CsA washout assay that veri-fied a similar timing of capsid integrity loss as observed by theimaging assay. The CsA washout assay showed an integrity loss at28 min (50% of GFP+ cells) in CHOpgsa745 cells that were stablyexpressing TRIM-CypA (Fig. S2A). As we previously showed withthe CsA washout (28), delaying reverse transcription with thetransient presence of nevirapine (NVP) pauses capsid integrityloss until NVP removal from the media (Fig. 2A and Movie S5).The insertion of an N74D mutation into the HIV-iGFP CA causesa delay in integrity loss, a finding also coincident with previousindirect studies (28) (Fig. 2A). In another approach to evaluate thelive-imaging assay’s ability to correctly measure the integrity ofHIV-iGFP capsid, we measured the impact on capsid integrity bymodulating TRIM-CypA restriction. Typical TRIM-CypA re-striction is demonstrated by a quick destruction of HIV-iGFPparticles after fusion (Fig. S3B) that is not present after protea-some function is inhibited with MG132 (46). Preventing TRIM-CypA restriction with CsA shows normal capsid integrity lossprogression, while the incubation with MG132 blocks the loss ofHIV-1 viral capsid integrity by capturing intact viral capsids inTRIM-CypA bodies (44) (Fig. 2B and Movie S6).
Inhibiting First-Strand Transfer of Reverse Transcription by ReversiblyInhibiting RNase H Delays Capsid Integrity Loss. After observing thatintegrity loss of the capsid happens ∼30 min after fusion and isdependent on the ability of HIV-1 to perform reverse transcrip-tion, we explored the impact of the first steps of early reversetranscription product formation on the loss of capsid integrity. Anemerging hypothesis to the link between early reverse transcrip-tion products and the loss of capsid integrity has been recentlybacked by a study based on both theoretical and mutationalstudies. Cosnefroy et al. (29) suggested that the first-strandtransfer of reverse transcription might play a crucial role in coredisassembly. However, another concurrent report that measuredthe binding of tetrameric CypA to the capsid as a tool to follow
Fig. 2. Modulation of HIV-iGFP capsid integrity loss. (A) NH4Cl-synchronizedinfection with either WT or N74D capsid and with NVP washout 50 minpostfusion. The capsid integrity loss was delayed until NVP removal. N74Dcapsid integrity loss is ∼30 min slower compared with WT, and HIV-iGFP viruseslabeled with IN-Ruby behave like mCherryVpr particles. (B) NH4Cl-synchronizedinfection of CHO or CHO-TRIMCypA cells has a normal phenotype in thepresence of CsA, and viral capsid integrity was maintained in TRIM bodies inthe presence of MG132. STDEV, standard deviation. *P < 0.5; ***P < 0.01.
Mamede et al. PNAS | Published online August 7, 2017 | E7171
MICRO
BIOLO
GY
PNASPL
US

CA pointed to no correlation between first-strand transfer anduncoating (27). This study used a reverse transcription RnaseH–deficient mutant with no visible impact over time on the levels ofCypA binding to the capsid compared with WT (27). Using anRnaseH inhibitor specific to HIV-1 reverse transcription (7390;shown as 8b in ref. 47), we can block the first-strand transfer ofreverse transcription while allowing reverse transcription activity(Fig. S4). Using the CsA washout assay, we observe that the re-moval of the RnaseH inhibitor 105 min after fusion allows res-toration of a normal course of infection (Fig. 3A). The directmeasurement of the integrity of individual capsid cores in thepresence of RnaseH inhibitor showed a delay on capsid integrityloss. When the inhibitor 7390 was removed, capsid integrity losswas rapidly observed (Fig. 3). This finding supports the model thatchanges in HIV-1 capsid integrity are influenced by the occurrenceof first-strand transfer of the reverse transcription process withinan intact capsid core.
Early Capsid Integrity Loss Is Observed in Primary Blood Cells. Anadvantage of our live-cell imaging assay is that it can be applied todifferent cell types and viral tropisms. To extend our studies tomore biologically relevant cell types, we infected CD3/CD28-activated CD4+ T cells with replication-competent, CXCR4-tropicHIV–iGFP–NL4-3 labeled with mCherryVpr. Here, our live-imaging assay yields a median postfusion capsid integrity loss ofΔt = 22.8 ± 8.5 min (Fig. 4 and Movie S7). This result is consistentwith the early capsid integrity loss of Δt = 28.7 ± 9.1 min observedin CHOpgsa745 cells challenged with VSV-G pseudotyped virusesassociated with infection (Fig. 1D and Movie S4). Infection ofmonocyte-derived macrophages (MDMs) with VSV-G HIV-iGFPshows integrity loss with an average Δt = 17.2 ± 7.2 min (Fig. 4).Infection in MDMs might be expected to result in a slower capsidintegrity loss since it has been reported that macrophages haverelatively low dNTP concentrations (40, 48, 49) and delayedcompletion of reverse transcription (28). However, the imagingassay has suggested that capsid integrity loss is associated withearly reverse transcription, which might be less sensitive to dNTPconcentrations (29, 50). Consistent with this interpretation, weshow that the timing of capsid integrity loss in macrophages can bemodulated by transitory NVP treatment (Fig. 4). The clear delayof capsid integrity loss upon NVP treatment is present both inprimary and tissue culture cell lines, and therefore supports theconcept that HIV capsid integrity loss does not require the com-pletion of reverse transcription, but is influenced by the early stepsof provirus generation, to result in a successful infection.
Capsid Integrity Loss Happens Simultaneously with CA Shedding.These data demonstrate a loss of capsid integrity in infectiousparticles, as measured by total GFP loss from the viral capsid.However, monitoring capsid integrity cannot differentiate betweenleaking through a small hole in the capsid cone or a catastrophicloss of a majority of CA from the RTC. Historically, uncoating isdefined as a loss of the CA that forms the cone structure. How-ever, it is not anticipated that this loss is complete since a smallamount of CA has been shown to play a role in viral trafficking,microtubule association, nuclear pore translocation, and prefer-ential site of integration, and it has more recently been associatedwith HIV nuclear complexes (35–37). It is therefore crucial toassess the level of CA when the cone integrity is changing. Todirectly quantitate the loss of CA and compare it with capsid in-tegrity loss, we used time-lapse fluorescent imaging, followed bycorrelative fixed immunofluorescence structured illumination mi-croscopy (3D-SIM). We performed our HIV-iGFP live-imagingcapsid integrity assay and fixed the samples 40 min after NH4Cl-synchronized fusion. At this time point, we anticipated that ap-proximately half of the cores would remain intact. The sampleswere permeabilized and stained for CA, with DAPI counterstain.In Fig. 5A, we show anti-CA antibody staining of a represen-
tative particle that was observed to undergo a dual drop of GFPintensity (Movie S8). Measurement of CA levels of individualparticles that are intact, are fused, or have entered a cell and then
lost capsid integrity shows statistically significantly lower levels ofCA associated with the viral complex (Fig. 5 B and C). Theseobservations effectively and crucially link the step of capsid in-tegrity loss measured by complete loss of fluid phase GFP to theloss of most of the CA from the complex. This loss of the majorityof CA under the current experimental conditions is likely a con-sequence of the disassembly of much of the cone (i.e., uncoating).By measuring the distances to the plasma membrane and nuclearmembranes with a previously described method (25), we de-termine that all the uncoated viral complexes are located in thecytoplasm. We do not observe any viral complexes in nuclei at themoment of cone integrity loss. These findings are consistent with
Fig. 3. Transient inhibition of reverse transcription RNAseH activity results ina delay of capsid integrity loss. (A) CsA washout of CHO-TRIMCypA cells in theabsence of 7390 (black) and with 7390 washed out for all wells at 105 min(gray). (B) Δt for infection of CHO cells incubated and washed with DMSOmock (Left) and 7390 (Right); the capsid integrity loss was delayed in accor-dance with 7390 removal (50 min postaverage fusion of all particles). Mediansare shown as gray horizontal bars. (C) Mean particle intensity of GFP signal(green) and mCherryVpr (red) in the presence of 7390, followed by its washout(arrow) 50 min postfusion. STDEV, standard deviation. *P < 0.5.
E7172 | www.pnas.org/cgi/doi/10.1073/pnas.1706245114 Mamede et al.

capsid uncoating in the cytoplasm in accordance with findingslinking microtubule dependence on uncoating (25, 26, 30–34) (Fig.5 A and C).
To provide additional kinetic insight, and further technicalvalidation, where antibody binding will not be a factor of stainingor temporal detection, we used particles with a tetracysteinemotif inserted in CA and directly labeled with ReAsH (46).Labeling with CA-ReAsH, together with iRFP670-Vpr incor-poration into HIV-iGFP, generates triple-labeled particles, allow-ing the simultaneous detection of changes in both GFP and CA(Movie S9). The complete loss of GFP from the capsid and loss ofthe ability to detect CA-ReAsH signal happen quasi-simultaneously,and are well correlated in time (Rspearman = 0.62) (Fig. 5D). Al-though the CA-ReAsH signal suffers a big drop in signal concur-rently with capsid integrity loss and appears to be completely lostduring the live-imaging acquisition, fixation and CA staining 45 minpostfusion show small amounts of CA-ReAsH that are associatedwith the complex (Fig. 5E). The small amount of ReAsH signalcannot be efficiently detected in the less optimal conditions of live-cell imaging, but are readily detectable in the more optimal condi-tions of fixed-cell imaging. To ascertain that the CA-ReAsH signalloss is not due to photobleaching, we applied our analysis to virusesthat did not fuse, but were on the glass coverslip or on cell mem-branes in the same live-cell imaging experiments (Fig. S5). Theseunfused viruses were photostable well beyond the typical uncoatingtimes. We also performed photobleaching control analysis on sev-eral thousand virions that were spun onto glass and then imagedwith the same experimental conditions as the live-cell imaging ex-periments (Fig. S6 and SI Text). We find that photobleaching is asmooth monotonic process which cannot be the cause of the abruptCA-ReAsH signal loss we observe during uncoating.Together, two different approaches, correlative quantification
of immunostained CA levels in fixed cells and live-cell imaging ofReAsH-labeled CA, allowed the direct measurement of CAlevels within the viral complexes. Both approaches show a cor-relation between the loss of iGFP and a substantial, but partial,loss of CA.
CA Shedding Is an Early Cytoplasmic Event in Primary Cells. To de-termine if uncoating kinetics were similar in the more bi-ologically relevant context of the infection of primary T cells withan HIV envelope, we performed live-cell imaging experimentswith replicative HIV-iGFP with WTEnv (pNL4-3) followed by
fixation at 1 h after viral challenge with unsynchronized entry.The infected cells were then counterstained with DAPI andmAbs to p24. Quantification of p24 levels in the three differentpopulations (unfused particles, fused particles with intact cores,and complexes where core integrity is lost) shows distinct levelsof p24 associated with each population. This analysis reveals thecapsid integrity loss is coincidental with a statistically significantloss in CA that happens early after fusion and is a cytoplasmicprocess (Fig. 6 A and B) in activated primary CD4 T cells. Thelevels of p24 in the three populations defined by the GFP fluidphase marker in the primary CD4 T cells infected with an HIVenvelope (Fig. 6C) are similar to those observed during infectionof the CHO cells in an analogous experiment (Fig. 5B).We also performed complementary experiments where we in-
fected MDMs with VSV-G pseudotyped HIV-iGFP that wasdouble-labeled with IN-mRuby in the presence of Vpx virus-likeparticles (VLPs). The fusion was synchronized by the presence ofNH4Cl in the media. After starting the live-cell imaging, weallowed fusion to occur by removing the NH4Cl in the system andfixed the sample ∼50 min after fusion. Although macrophagesshowed a high particle deletion rate, as observed by the disap-pearance of several particles that fused into the cell in comparisonto cell lines or primary CD4 T cells, it was possible to capturerepresentative events of IN-mRuby–labeled particles that wereunfused or fused and particles where the capsid integrity was lost.Using the same CA staining conditions as for the CD4 T cells, itwas again observed within this small dataset that the complete lossof GFP also results in a reduction of the amount of CA in theparticles (Fig. 6 A, C, and D and Movie S10).Together, these experiments performed in primary cells that
are the natural targets of HIV show that HIV-1 uncoating occursat the moment of capsid integrity loss, which is also indicated byiGFP loss from particles in the cytoplasm.
DiscussionIn this study, we followed HIV-1 uncoating using a live-imagingapproach where we can analyze one viral particle per cell anddirectly connect the behavior of that particle to infection, asrevealed by the expression of the GFP-tagged Gag polyproteinafter integration. Most of what is currently known about HIV-1uncoating has come from in vitro biochemical approaches,mutation-based methods, and indirect observations that resultfrom cellular mechanisms of viral restriction. The approaches re-lated to restriction were limited by a lack of demonstration that theloss of sensitivity to restriction was a consequence of uncoating. Incontrast, in situ imaging of fixed or live cells was able to showchanges in CA amounts in postfusion particles (26–28, 36). Un-fortunately, these methods provided minimal kinetic informationand no ability to determine which behaviors of individual particlesled to a successful infection. This is because, typically, most ofthe HIV viral complexes within a cell are not able to infect a cell(51). In some cases, this is likely due to defects in the particle.However, the virus also faces a minefield of stochastic eventswhere restriction factors and innate antiviral responses, correctlycompleting reverse transcription, nuclear translocation, and cor-rect integration while avoiding recombination and autointegration,stand as obstacles to infection even though the viral function isnormal. For example, only one-third of the reverse-transcribed viralgenomes that reach the nucleus go on to integrate as requiredfor productive infection (52). This is a high rate of attrition that canbe a consequence of stochastic events rather than genetic defects(51). The only way to account for such stochastic events is directobservation of individual particles.The live-cell imaging method that was used in this study allowed
the ability to connect the detailed behavior of HIV-1 particles tocell infection. In this study, we show that the HIV-1 core loses itsintegrity and a majority of its CA protein ∼30 min after being re-leased into the cytoplasm after fusion. Uncoating of all observedparticles that go on to infect a cell is completed by 45 min afterfusion. By using a “one-particle, one-cell” approach, it was possibleto follow the actual fate of capsid, specifically in HIV-1 particles
Fig. 4. Early capsid integrity loss is observed in primary HIV target cells. In-fection of CD4+ T cells (WTEnv) and macrophages (VSV-G pseudotypes) resul-ted in a similar timing of capsid integrity loss. Uncoating in macrophages wasdelayed by NVP washout (washed 40 min postaverage fusion). Medians areshown as gray horizontal bars. STDEV, standard deviation. *P < 0.5.
Mamede et al. PNAS | Published online August 7, 2017 | E7173
MICRO
BIOLO
GY
PNASPL
US

Fig. 5. Quantification of CA in viral complexes links capsid integrity loss to uncoating. (A) Three-dimensional SIM superresolution imaging of cells fixed after liveimaging for 40 min. (Scale bar: 10 μm.) (Inset) Particle that showed two drops and complete GFP signal loss shows a positive signal for CA (green) and Vpr (red),using nuclear staining with DAPI (blue). (Scale bar: 250 nm.) (B) Mean intensity and signal-to-noise ratio of all live-imaged individual particles. Groups weredefined by their live-imaging GFP capsid integrity phenotype. Medians of the individual events are represented by the gray bars, and interquartile ranges areshown as error bars. (C) Particles with a complete loss of capsid integrity locate in the cytoplasm after measurement of the distance from the particle to plasmaand nuclear membranes [value of 1 means nuclear membrane location, value of 0 means located at the plasma membrane (PM)]. (D) HIV-iGFP-ReAsH-iRFP670Vprparticles were plotted by timing of complete loss of GFP (x axis) and timing of complete loss of ReAsH signal (y axis). (E) Three-dimensional SIM superresolutionimaging of cells that were fixed after live imaging for 45 min: p24 (green), Lamin-B (blue), and iRFP670Vpr (red). (Scale bar, 10 μm.) (Inset) Magnification rep-resents a particle where two intensity drops were observed, resulting in a complete loss of GFP signal. An uncoated particle fixed after live imaging that is positivefor p24 (green), CA-ReAsH (blue), and iRFP670Vpr (red) is shown (Scale bar: 200 nm.) *P < 0.5; **P < 0.1; ***P < 0.01.
E7174 | www.pnas.org/cgi/doi/10.1073/pnas.1706245114 Mamede et al.

that ultimately went on to infect a cell and begin producing Gagand budding virions. The observed infectious events in these in-fections at less than one particle per cell likely underrepresent thepotential infected cells within the cultures due to length of ob-servation time, cellular stress due to phototoxicity, and imperfectculture environment. In typical infectivity assays with reporterviruses, the experiments are run for 48 h to achieve maximal de-tection of infection. For these studies, we cultured the cells for upto 42 h, but often stopped earlier to preserve the observed cells forsubsequent correlative analysis. Likewise, cellular state in the ox-idative environment of phototoxicity and other cellular stresses ofcontinuous imaging probably negatively impacted the cellularenvironment experienced by the virus. It is also difficult to trans-late the outcomes typically observed at the population level downto the limited observations at the individual cell level. The de-velopment of automated image analysis will allow the behavior ofthousands of virions to be quantified to provide additional insightsinto the particle-to-infectivity ratio and the efficiency of the earlysteps of the HIV life cycle.Another important consideration in interpreting the one particle
per cell studies is the possibility of unlabeled viral particles that canbe generated by the cotransfection of multiple plasmids. This issueis potentially relevant because single-particle analysis showed thatthe HIV-iGFP particle populations with different viral complexmarkers (Vpr or IN) or envelopes (pNL4-3 WT or VSV-G) testedhere had 53–90% maturation in HIV-iGFP–labeled particles (Fig.S1). The viral preparations are generated by cotransfection of iGFP,a gag-pol expression vector, mCherryVpr, and VSV-G envelope,and, theoretically, unlabeled infectious particles could be present. Inour experimental setting, only the viral RNA expressed from theHIV-Gag-iGFP plasmids contains LTRs, ensuring that infectionwill be reported by newly produced Gag-GFP fusion proteins.Therefore, under the conditions of virus production used here, itseems unlikely that particles could be produced which contain theiGFP genomic RNA but not the iGFP GFP-tagged Gag.To validate this assumption, we performed RNA fluorescent in
situ hybridization (FISH) targeting GFP, whose coding sequenceis only present in the HIV-iGFP plasmid and genomic RNA (Fig.S1I). The analysis showed that ∼97% of the mature HIV particles(AG3+) containing iGFP genomic RNA are GFP-labeled (Fig. S1
G–I), while the control HIV-iCherry particles that were producedin similar fashion to HIV-iGFP were negative for GFP containingRNA (Fig. S1 G and I). In contrast, only 0.6% of the GFP− ma-ture particles contain iGFP genomic RNA. This analysis revealsthat there are no substantial populations of unlabeled viral par-ticles that could confound the analysis connecting timing of capsidintegrity loss and infectivity. Further supporting this viewpoint, wenever observed any infected cells (GFP+) that were not associatedwith iGFP-labeled particles, even under conditions where mostcells never associated with a fluorescently labeled viral particle.The HIV-iGFP construct allows the study of HIV-1 viral capsid
status over time and the detection of the production of new viralparticles that result from cell infection. The retention of cleavedGFP as a fluid phase marker inside of a virion and capsid uniquelyallows detection of both the fusion event and subsequent lossof capsid integrity (Fig. 1 A and B). To address the possibilityof GFP signal reduction in an acidic endosome in the case ofVSV-G pseudotyping (43), we measured fusion directly with S15-tdTomato (Movie S2) and indirectly by the observation that afterfusion, viruses are trapped in cytoplasmic TRIM bodies in thepresence of MG132 (Fig. 2B). In recent years, several groupshave discovered that it is possible to modulate “uncoating” of HIV-1 particles either by delaying or blocking reverse transcription, or byintroducing certain mutations into the CA protein that forms theconical core (2, 23, 28, 29, 53, 54). A well-established mechanismto disrupt HIV capsid stability is to exploit the mechanism ofTRIM5 restriction that recruits the proteasome to direct capsiddisruption (16, 44). Specifically, TRIMCypA restriction can bemodulated for the binding and disruption of the incoming viralcapsid by the presence of the CsA washout assay. We used thisability to switch TRIMCypA restriction on and off to demonstratethat using the iGFP fluid phase marker validated the systempresented here to monitor capsid integrity. In the absence ofTRIMCypA function, thanks to the presence of CsA, we observeda median Δt (time between fusion and integrity loss) of ∼25 min(Fig. 2B). This result is in accordance with nonrestrictive infection.In an experimental setting where TRIMCypA can bind to thecapsid but the proteasome-mediated capsid disruption is pre-vented by proteasome inhibitors, the HIV-iGFP capsids accumu-late in an intact form within TRIMCypA bodies (Fig. 2B).
Fig. 6. Quantification of CA in viral complexes inprimary cells shows a loss of CA after capsid integrityloss. (A) Mean particle intensity of GFP signal (green)and mCherryVpr (red) of an individually tracked,dual-labeled HIV-1 particle; the sample was fixedat 55 min and represents the same event as in B.(B) Three-dimensional SIM superresolution imagingof a CD4 T cell fixed after live imaging for 55 min.(Scale bar: 5 μm.) (Inset) Particle that showed twodrops and complete GFP signal loss shows a positivesignal for CA (green) and Vpr (red), using nuclearstaining with DAPI (blue) and cytoplasmic localiza-tion. (Scale bar: 100 nm.) (C) Mean intensity andsignal-to-noise ratio of all live-imaged particles thatwere individually tracked. Groups were defined bytheir live-imaging GFP capsid integrity phenotype.Medians of the individual events are represented bygray bars, and interquartile ranges are shown aserror bars. Open symbols show particles that chal-lenged CD4 T cells, and red symbols show represen-tative events measured from MDMs. (D) Three-dimensional SIM superresolution imaging of anMDM that was fixed after live imaging for 50 min.(Scale bar: 5 μm.) (Inset) Particle that showed twodrops and complete GFP signal loss shows a positivesignal for CA (green) and Vpr (red), using nuclearstaining with DAPI (blue) and cytoplasmic localiza-tion. (Scale bar: 100 nm.) *P < 0.5; ***P < 0.01.
Mamede et al. PNAS | Published online August 7, 2017 | E7175
MICRO
BIOLO
GY
PNASPL
US

Because TRIMCypA requires an intact capsid to be able to bindand restrict HIV-1 infection, we have shown that the temporalmeasurement of GFP retention within the cone is a suitablemethod to measure capsid integrity. This timing is consistent withthe CsA washout assay, which measured the time of loss of sen-sitivity to TRIM-CypA associated with virus infection (28), as wellas with other systems that supported early changes in the integrityof the cone (16, 26, 27, 39, 55).Recently, it was proposed that the ability of HIV-1 to escape
cytoplasmic innate immunity is due to the shielding of the reverse-transcribed DNA by the viral capsid (9, 10). These studies showedthat viral challenge to blood cells with a myeloid origin with theCA mutant N74D or P90A resulted in an antiviral state where thevirus cannot replicate. This was interpreted as the activation ofinnate sensors by the prematurely exposed reverse-transcribingHIV genome. However, this hypothesis is not compatible withan early cytoplasmic uncoating, as demonstrated here, or with thedemonstration that N74D uncoats with delayed kinetics. Here, weconfirm that the N74D mutation leads to delayed uncoating (Fig.2A), as originally revealed by the CsA washout assay (54). Theobservation that early uncoating is associated with infection callsfor a reinterpretation of the mechanisms leading to the antiviralstate described by Rasaiyaah et al. (10). Alternatively, it seemsmore likely that the induction of the antiviral state is caused byaccumulation of dead-end reverse transcription products thatcould be more susceptible to innate recognition, especially at thehigh multiplicity of infection (MOI) used in such study. Thispossibility has recently been explored with another assay to detectcapsid integrity in infected cells (56).Here, we showed that HIV-iGFP capsid integrity can be sus-
tained by the presence of NVP, a nonnucleoside reverse tran-scriptase inhibitor (Figs. 2A and 4). Strikingly, the removal of NVPfrom the live-imaging system results in a prompt loss of the in-tegrity of the cone. The swift capsid integrity loss after resumptionof reverse transcription supports a direct connection betweenuncoating and reverse transcription. The potential role of the in-terplay of reverse transcription and uncoating has been recentlysuggested to provide an enclosed environment facilitating first-strand transfer during HIV-1 reverse transcription (29). Withthe easy adaptability of our live-imaging fluorescence HIV-iGFPsystem, we tested this possibility in the transient presence of 7390,an RNase H activity inhibitor specific to HIV-1 reverse tran-scription (47) (Fig. 5B). The blocking of the RNase H-mediateddegradation of the RNA template results in an inability of thenewly synthesized ssDNA to anneal the complementary R regionon the 3′ LTR RNA template during the first-strand transfer.Both in our live-imaging system and by using the CsA washout, weobserved that the inhibition of RNase H activity delayed un-coating. The lack of an RNase H mutation to alter uncoating ki-netics when monitored by DsRed-CypA tetramer labeling of thecore remains a curious observation that raises questions related tothe averaging of a large number of particles that do not lead toinfection (27). We hypothesize that the contained environment ofan intact capsid could be advantageous to the first-strand transferbetween the DNA and RNA distinct and unlinked molecules.Within a constraining core, the two molecules would not diffuseaway from each other. These data suggest that uncoating isdelayed until first-strand transfer occurs, rather than the simpleinitiation of reverse transcription.Historically, it has been suggested that uncoating kinetics might
be distinct in different cell types or pathways leading to fusion. Theflexibility of the HIV-iGFP live-imaging assay allows for testingunder different experimental conditions, including different celltypes and particles containing different envelope proteins. Impor-tantly, we find that the general kinetics of uncoating are detectable∼30 min after fusion in the cell lines, primary CD4+ T cells, andmacrophages investigated here. Likewise, we find the same kineticsof uncoating with disparate envelopes, including X4 tropic HIVand VSV-G. Rather than cell type and entry pathway influencinguncoating, it appears that the efficiency of reverse transcription ismore important (Figs. 2–4 and 6). However, it is not clear that this
is how uncoating proceeds in other cell types. For example, it wasrecently reported that reverse transcription, nuclear localization, andloss of capsid took place at a slower rate in primary macrophages, asmonitored by specific labeling of the viral DNA (38). Other cir-cumstances in vivo may also show different kinetics of uncoating. Forexample, it was previously shown that virions can persist up to aweek in the cytoplasm of peripheral blood mononuclear cells(PBMCs), and when the cells were activated, it resulted in viralgrowth out of the cultures (57, 58). That being said, most HIVreplication studies are done in tissue culture systems similar to thoseused here and the presented results likely represent the series ofevents that takes place during the early phase of the HIV life cycle.A big technical challenge to study uncoating was the ability to
distinguish between integrity loss or a rearrangement of the capsidand the shedding of CA from the RTC. In this study, we observed acorrelation between the loss of the GFP that is trapped within anintact core and a significant loss of CA that is present in the viralcomplex. This simultaneous loss of iGFP and reduction of the levelsof CA, together with the observation that only early integrity loss ofthe capsid is associated with infection, allows us to describe uncoatingas an early cytoplasmic process that is influenced by the first-strandtransfer process of reverse transcription both in a cell line model andin primary cells that are known targets of HIV-1 (Figs. 5 and 6).Critically, the “one-virus, one-cell” method pioneered here
allowed us to identify that early uncoating is necessary for particleinfectivity. The stochastic nature of infectivity and the unavoidablepresence of defective particles have historically slowed progress inthe field. We believe that this live-imaging system will be able toprovide invaluable insight into host cofactor interactions withHIV, the cellular location and timing of specific events in HIV-1infection, and innate sensor immunity at play. The ability to di-rectly connect individual particle behavior through live-cell fluo-rescence microscopy to infectivity promises to bring clarity toour understanding of the early events of the HIV life cycle.
Materials and MethodsCells. HEK-293T and CHOpgsa745 cells were cultured in DMEM, 10% FBS,L-glutamine, MEM nonessential amino acids solution (MEM-NEAA), and anti-biotics. CHOpgsa745-TcypA cells were transduced and selected as reportedbefore (59). CD14+ cells were isolated from blood PBMCs with a Miltenyi BiotecMACS CD14 MicroBeads human kit (Fig. 4) or from blood with a StemCellTechnologies EasySep Human Monocyte Isolation Kit (Fig. 6) following manu-facturer instructions and differentiated to macrophages with macrophagecolony-stimulating factor (M-CSF) (50 ng/mL), being washed every 2–3 d for 14 dpreimaging. CD4+ T cells were isolated from blood with a StemCell Technolo-gies EasySep Human CD4+ T-Cell Enrichment Kit and activated with CD3/CD28 antibodies 1 or 2 d before live imaging. MDMs and CD4+ T cells werecultured in RPMI, 15% FBS, L-glutamine, and antibiotics. Stremlau cells wereused in TRIM capture assays as previously reported (42).
Plasmids. HIV-Gag-iGFPΔEnv, HIV-Gag-iGFPWTEnv, HIV-N74DGag-iGFP-ΔEnv,and HIV-Gag-iCherryΔEnv full proviruses (with or without a point mutationin Env), which have a coding GFP in between the MA and CA proteinscleavage maturation sites in gag reading frame (41), are based in pNL4-3HIV-1 plasmid. The psPAX2 was used as a Gag-Pol packaging vector thatprovided WT-Gag at a 1:1 ratio (Gag-iGFP/Gag-WT). Only HIV-Gag-iGFPplasmids contain LTRs. The pFSM-Gag plasmid was used for a tetracysteinemotif suitable for ReAsH labeling (46). The pHIV-GFP (used for CsA washout)and pCMV–VSV-G were previously described (28). The pmCherry-Vpr andpGFP-Vpr were previously described (25, 42), and iRFP670Vpr plasmid wasgenerated by replacing the mCherry sequence in pmCherry-Vpr byiRFP670 obtained from Addgene piRFP670-N1. The pLHA-owlTCypA-SN andpL57GPMoBeB sequences were previously described (59). The pGag-IN-mRuby was created by replacing GFP with the mRuby sequence; the origi-nal plasmid has been described elsewhere (36).
Virus Production. Viral particles were produced by polyethylenimine HEK-293Ttransfection, where DMEM medium was replaced 16 h posttransfection andviruses were collected 24 to 36 h posttransfection. HIV-iGFP-mCherryVpr viruseswere produced by transfection with 3 μg of HIV-Gag-iGFP, 3 μg of psPAX2, 4 μgof pCMV–VSV-G, and 1.5 μg of mCherryVpr plasmids. ReASH-labeled viruseswere produced by transfection with 3 μg of HIV-Gag-iGFP, 3 μg of pFSM-Gag,4 μg of pCMV–VSV-G and 1.5 μg of iRFP670Vpr. HIV-iGFP and Gag-IN-mRuby
E7176 | www.pnas.org/cgi/doi/10.1073/pnas.1706245114 Mamede et al.

were produced by transfection with 5 μg of HIV-Gag-iGFP, 3 μg of pGag-IN-mRuby, and 4 μg of pCMV–VSV-G. Viruses transducing CHOpgsa745 cells tostably express HA-owlTRIMCypA were produced as previously reported (59).
Reagents. CsA was used at 5 μM; NVP was obtained from the NIH repository ofthe NIH AIDS Reagent Program, Division of AIDS, National Institute of Allergyand Infectious Diseases, NIH, and used at 10 μM (dissolved in water accordingto NIH AIDS Reagent Program solubility limit); MG132 was used at 1 μg/mL;Polybrene was used at 10 μg/mL; Oxyfluor/OxyRase was used at a 1:200 di-lution; DL-lactate was used at 15 mM; and RnaseH inhibitor 7390 (shown as 8bin ref. 47) was used at 10 μM for live imaging and CsA washout experiments.
Western Blot Analysis. Viruses and whole-cell extracts were diluted withLaemmli buffer with β-mercaptoethanol, followed by boiling at 96 °C for5 min, and loaded into precast Mini-PROTEAN TGX (5–20% gradient) gels.Nitrocellulose membranes were incubated with 1:1,000 241D antibody (NIHAIDS Reagent Program) and IRDye700 anti-human antibody. TRIM-CypAexpression was measured with 3F10 (Roche) antibody and β-actin (Abcam),and with IRDye700 and IRDye800 secondary antibodies. Membranes wereimaged with an Odyssey system.
ReAsH Labeling. HIV-iGFP-tetracysteine-CA-iRFP670Vpr (VSV-G) viruses werelabeled for 2 h in a rotation chamber at 21 °C with TC-ReAsH II as describedelsewhere (60, 61), replacing β-mercaptoethanol incubation with DTT (1 mM).
Flow Cytometry. Singlet cells (forward scatter (FSC)-height (H) by width (W)and side scatter (SSC) H by W) for the diverse mentioned infections wereanalyzed using a BD Fortessa FACS for the percentage of GFP signal usingnoninfected cells as a control. Controls to the infection level of one-particle,one-cell conditions (Fig. S1) were done under the same conditions as theimaged plates (detailed in Live Imaging) but maintained in a 37 °C 5% CO2
incubator for 42 h. The cells in the plates (challenged with same amount ofvirus and viral incubation time, or without viruses) were detached with250 μL of trypsin and fixed with 250 μL of fix solution (4:1 PBS/10% form-aldehyde) before flow cytometry analysis.
CsA Washout Assay. CHOpgsa745-HA-owlTCypA cells were plated in 96-welldishes. Each experimental condition was performed in triplicate. Cells werespinoculated with HIV-GFP reporter virus and Polybrene for 1.5 h at 14 °C.Cells were washed with media at 37 °C and with CsA. CsA removal was doneat different time points, as shown in Fig. 3A and Fig. S2A. As shown in Fig.3A, the experiment was also exposed to RnaseH inhibitor 7390 incubation, inboth the inoculation and first wash media. After 105 min, RnaseH inhibitor7390 was removed from all reactions by replacement with warm media. Twodays after infection, cells were detached with 50 μL of trypsin and fixed with50 μL of fix solution (4:1 PBS/10% formaldehyde). The time of 50% un-coating was determined by curve fitting (28).
Live Imaging. A DeltaVision wide-field microscope (GE Life Sciences) equippedwith an electron-multiplying charge-coupled device (EM CCD) camera, solid stateillumination (SSI-LED) light path, or OMXDeltaVisionMicroscopy Imaging System(GE Life Sciences) equipped with complementary metal-oxide semiconductor(CMOS) cameras was used to acquire fluorescent values of HIV-iGFP viruses,tagged Vpr, or p24CA-ReaSH infecting cells plated in Delta T culture dishes. Cellswere kept in a 37 °C heated chamber, together with a blood gas mixture (5%CO2, 20% oxygen), throughout the imaging process. Oxyfluor and D-lactatewere in solution with Fluorobrite DMEM (or RPMI without phenol red) with 20%FBS, L-glutamine, and MEM-NEAA. When used, NH4Cl was used at a 10 mMconcentration to synchronize infection from 20 to 45 min postvirus incubation.All VSV-G pseudotyped infections were done with Polybrene concentration of5 μg/μL. Z-stacking spacing was set to 0.5 μm, with a total of 8- to 9-μm z-axisimaging. Experiments were done with the following emission conditions: GFP,10% transmission and 50-ms exposure; mCherry, 10% transmission and 55-msexposure (45 ms for Fig. 1 and 70 ms for Fig. 4); and brightfield, 32% trans-mission and 10-ms exposures (only a single Z in the middle of a cell is acquiredfor brightfield). Experiments illustrated in Fig. 5 were done with the followingemission conditions: GFP, 32% transmission and 30-ms exposure; mCherry, 32%transmission and 40-ms exposure. When applicable, ReAsH imaging was per-formed at 10% transmission and 80-ms exposure, iRFP670Vpr was imaged at32% transmission and 75-ms exposure, and IN-Ruby was imaged at 10%transmission 60-ms exposure. The number of experiments in each condition isdetailed in Statistics and Reproducibility. Nominal magnification was 100× forall experiments with the exception of the one-particle, one-cell experiments,where a magnification of 60× was used to analyze a higher number of cells.
CD4+ T cells were immobilized to Delta T culture dishes coated for 30 min withCell-TAK cell and tissue adhesive, according to manufacturer instructions.
Live Imaging Analysis. Z-stacks were deconvolved and z-projected usingSoftWorx (GE Life Sciences) before individual mCherryVpr or iRFP670Vprparticle tracking over time using Imaris software (Bitplane). Mean intensitiesof HIV-iGFP or p24CA-ReAsH individual channels were analyzed by fittingdiscrete time points to a double-sigmoid equation with in-house–made Pythonscripts using scipy curvefit optimization, which uses the Levenberg–Marquardtalgorithm (62). Centered particle video recordings were automatically gener-ated by in-house–made Python scripts using matplotlib, with the data analyzedand exported from Imaris (63).
Fluorescence Kinetics Fitting. When analyzing fluorescence signal to estimatethe timing of signal changes, it is important to avoid bias due to operator error.Data fitting provides reproducibility and precision. We therefore fit the fluo-rescence time series I(t) in these experiments to the following heuristicdouble-sigmoidal form:
IðtÞ= Imax − Imid
2erfcðs1ðt − t1ÞÞ+ Imid − Imin
2erfcðs2ðt − t2ÞÞ+ Imin,
where erfc(x) is the complementary error function, t1 estimates the time ofvirus-cell fusion, and t2 estimates the time of capsid integrity loss. We canthen obtain the fusion-to-integrity-loss interval Δt = t1 − t2, which we plot inFigs. 1, 2, and 4. The final goodness of fit was estimated in Python/SciPy bycalculating the Spearman correlation between the data and model. AllSpearman correlations were greater than 0.8, with P values <0.00001.
Post–Time-Lapse Fixed Imaging. Live-imaged cells were washed with PBS andreadily fixed with final 3.7% formaldehyde in piperazine-N,N′-bis (PIPES)buffer for 5 min, followed by three PBS washes. Cells were permeabilized for10 min in block buffer (10% normal donkey serum, 0.01% NaN3, 0.1% TritonX-100), followed by 241D and 71-31 mAbs (NIH AIDS Reagent Program) in-cubation at 1:1,000 for 1 h. The mAbs were washed three times with PBS andstained with anti-human AF647 antibodies (1:2,000) and DAPI (1:25,000) for30 min. Secondary antibodies were washed three times with PBS andmounted overnight on 40-mm-radius coverslips with ProlongGold antifade.Cells were found using brightfield and iGFP/mCherryVpr virus references inthe Deltavision microscope, followed by imaging in the superresolution 3D-SIM OMX DeltaVision Microscopy Imaging System. The synchronization ofboth microscopes’ trays was used to find the correct cells and viral particlesthat were previously live-imaged. Mean intensities of particles were ana-lyzed using ImageJ software (NIH) at the Z-slice that presented the highestp24CA staining signal for a given particle.
Virus on Glass. Viral preparations were spun on fibronectin-coated coverslipsat 2,400 × g (90 min). Staining was performed with the same fixation andpermeabilization as for cells (Fig. S1 E and F). In Fig. S1 G–I, Stellaris FISHProbes, using EGFP with Quasar 670 dye, were used following the protocolprovided by the manufacturer (70% ethanol permeabilization for 1 h andhybridization with a probe concentration of 500 nM for 5 h).
Statistics and Reproducibility. Datasets in Fig. 1D were obtained from fourindependent experiments totaling 48 fields of view for the 2-h experiments(all events) and from four independent experiments totaling 400 fields ofview for the >24-h experiments, where infection was directly linked to asingle virion. All dual-drop data points were assumed nonnormal, and theKruskal–Wallis test was performed (Fig. 2). The statistical null hypothesisshowed a significant difference between different conditions by Kruskal–Wallis test rejection. The P values of Dunn’s test of multiple comparisons forthe different experiment conditions are then shown in the figures. The sameanalysis was performed for the dataset represented in Fig. 3B and 6B for themeasurement of p24 intensities in the fixed samples. Each condition repre-sents three independent experiments totaling 48 fields of view, 20 fields ofview for the CD4 T-cell experiments, and 26 total fields of view for MDMs. Tocompare the simultaneous loss of GFP and ReAsH, and after performingdata-fitting to the experimental data for each channel (as described inFluorescence Kinetics Fitting), a nonparametric Spearman correlation co-efficient and P value were calculated, as shown in Fig. 3D. The presenteddata were obtained from five independent experiments. In Fig. 4B, all datawere assumed nonnormal, and a Mann–Whitney test was performedshowing statistical significance between the datasets obtained from threeindependent experiments (48 fields of view) that are represented in the plot.
Mamede et al. PNAS | Published online August 7, 2017 | E7177
MICRO
BIOLO
GY
PNASPL
US

ACKNOWLEDGMENTS. We thank B. K. Chen for the HIV-iGFP construct andM. A. Parniak for the RnaseH inhibitor 7390. The following reagents wereobtained through the NIH AIDS Reagent Program (Division of AIDS, NationalInstitute of Allergy and Infectious Diseases, NIH): anti–HIV-1 p24 mAb (71-31,241-D) fromDr. Susan Zolla-Pazner, mAb to HIV-1 p24 (AG3.0) fromDr. Jonathan
Allan, and NVP. We thank R. T. D’Aquila and E. M. Campbell for critical reviewof this manuscript. We thank the James B. Pendleton Charitable Trust and theThird Coast Center for AIDS Research (CFAR) (P30 AI117943) for imaging equip-ment support. This work was supported by NIH Grant P50 GM082545 (subcon-tract to T.J.H.).
1. Ganser-Pornillos BK, Cheng A, Yeager M (2007) Structure of full-length HIV-1 CA: Amodel for the mature capsid lattice. Cell 131:70–79.
2. Forshey BM, von Schwedler U, Sundquist WI, Aiken C (2002) Formation of a humanimmunodeficiency virus type 1 core of optimal stability is crucial for viral replication.J Virol 76:5667–5677.
3. Schaller T, et al. (2011) HIV-1 capsid-cyclophilin interactions determine nuclear importpathway, integration targeting and replication efficiency. PLoS Pathog 7:e1002439.
4. Lee K, et al. (2010) Flexible use of nuclear import pathways by HIV-1. Cell HostMicrobe 7:221–233.
5. Matreyek KA, Engelman A (2011) The requirement for nucleoporin NUP153 duringhuman immunodeficiency virus type 1 infection is determined by the viral capsid.J Virol 85:7818–7827.
6. Brass AL, et al. (2008) Identification of host proteins required for HIV infectionthrough a functional genomic screen. Science 319:921–926.
7. Marini B, et al. (2015) Nuclear architecture dictates HIV-1 integration site selection.Nature 521:227–231.
8. Lelek M, et al. (2015) Chromatin organization at the nuclear pore favours HIV repli-cation. Nat Commun 6:6483.
9. Lahaye X, et al. (2013) The capsids of HIV-1 and HIV-2 determine immune detection ofthe viral cDNA by the innate sensor cGAS in dendritic cells. Immunity 39:1132–1142.
10. Rasaiyaah J, et al. (2013) HIV-1 evades innate immune recognition through specificcofactor recruitment. Nature 503:402–405.
11. Campbell EM, Hope TJ (2015) HIV-1 capsid: The multifaceted key player in HIV-1 in-fection. Nat Rev Microbiol 13:471–483.
12. Miller MD, Farnet CM, Bushman FD (1997) Human immunodeficiency virus type 1 pre-integration complexes: Studies of organization and composition. J Virol 71:5382–5390.
13. Bukrinsky MI, et al. (1993) Association of integrase, matrix, and reverse transcriptaseantigens of human immunodeficiency virus type 1 with viral nucleic acids followingacute infection. Proc Natl Acad Sci USA 90:6125–6129.
14. Fassati A, Goff SP (2001) Characterization of intracellular reverse transcription com-plexes of human immunodeficiency virus type 1. J Virol 75:3626–3635.
15. Forshey BM, Shi J, Aiken C (2005) Structural requirements for recognition of thehuman immunodeficiency virus type 1 core during host restriction in owl monkeycells. J Virol 79:869–875.
16. Kutluay SB, Perez-Caballero D, Bieniasz PD (2013) Fates of retroviral core componentsduring unrestricted and TRIM5-restricted infection. PLoS Pathog 9:e1003214.
17. Li Y-L, et al. (2016) Primate TRIM5 proteins form hexagonal nets on HIV-1 capsids.eLife 5:e16269.
18. Sayah DM, Sokolskaja E, Berthoux L, Luban J (2004) Cyclophilin A retrotranspositioninto TRIM5 explains owl monkey resistance to HIV-1. Nature 430:569–573.
19. Sebastian S, Luban J (2005) TRIM5alpha selectively binds a restriction-sensitive ret-roviral capsid. Retrovirology 2:40.
20. Shi J, Aiken C (2006) Saturation of TRIM5 alpha-mediated restriction of HIV-1 in-fection depends on the stability of the incoming viral capsid. Virology 350:493–500.
21. Stremlau M, et al. (2006) Specific recognition and accelerated uncoating of retroviralcapsids by the TRIM5alpha restriction factor. Proc Natl Acad Sci USA 103:5514–5519.
22. Stremlau M, et al. (2004) The cytoplasmic body component TRIM5alpha restricts HIV-1infection in old world monkeys. Nature 427:848–853.
23. Yang Y, Fricke T, Diaz-Griffero F (2013) Inhibition of reverse transcriptase activityincreases stability of the HIV-1 core. J Virol 87:683–687.
24. Arhel NJ, et al. (2007) HIV-1 DNA Flap formation promotes uncoating of the pre-integration complex at the nuclear pore. EMBO J 26:3025–3037.
25. McDonald D, et al. (2002) Visualization of the intracellular behavior of HIV in livingcells. J Cell Biol 159:441–452.
26. Lukic Z, Dharan A, Fricke T, Diaz-Griffero F, Campbell EM (2014) HIV-1 uncoating isfacilitated by dynein and kinesin 1. J Virol 88:13613–13625.
27. Francis AC, Marin M, Shi J, Aiken C, Melikyan GB (2016) Time-resolved imaging ofsingle HIV-1 uncoating in vitro and in living cells. PLoS Pathog 12:e1005709.
28. Hulme AE, Perez O, Hope TJ (2011) Complementary assays reveal a relationship be-tween HIV-1 uncoating and reverse transcription. Proc Natl Acad Sci USA 108:9975–9980.
29. Cosnefroy O, Murray PJ, Bishop KN (2016) HIV-1 capsid uncoating initiates after thefirst strand transfer of reverse transcription. Retrovirology 13:58.
30. Dharan A, et al. (2016) KIF5B and Nup358 cooperatively mediate the nuclear importof HIV-1 during infection. PLoS Pathog 12:e1005700.
31. Jayappa KD, et al. (2015) Human immunodeficiency virus type 1 employs the cellulardynein light chain 1 protein for reverse transcription through interaction with itsintegrase protein. J Virol 89:3497–3511.
32. Malikov V, et al. (2015) HIV-1 capsids bind and exploit the kinesin-1 adaptor FEZ1 forinward movement to the nucleus. Nat Commun 6:6660.
33. Pawlica P, Berthoux L (2014) Cytoplasmic dynein promotes HIV-1 uncoating. Viruses 6:4195–4211.
34. Sabo Y, et al. (2013) HIV-1 induces the formation of stable microtubules to enhanceearly infection. Cell Host Microbe 14:535–546.
35. Chin CR, et al. (2015) Direct visualization of HIV-1 replication intermediates showsthat capsid and CPSF6 modulate HIV-1 intra-nuclear invasion and integration. CellRep 13:1717–1731.
36. HulmeAE, Kelley Z, Foley D, Hope TJ (2015) Complementary assays reveal a low level of CAassociated with viral complexes in the nuclei of HIV-1-infected cells. J Virol 89:5350–5361.
37. Peng K, et al. (2014) Quantitative microscopy of functional HIV post-entry complexesreveals association of replication with the viral capsid. eLife 3:e04114.
38. Stultz RD, Cenker JJ, McDonald D (2017) Imaging HIV-1 genomic DNA from entrythrough productive infection. J Virol 91:e00034-17.
39. Xu H, et al. (2013) Evidence for biphasic uncoating during HIV-1 infection from anovel imaging assay. Retrovirology 10:70.
40. Rivière L, Darlix J-L, Cimarelli A (2010) Analysis of the viral elements required in thenuclear import of HIV-1 DNA. J Virol 84:729–739.
41. Hübner W, et al. (2007) Sequence of human immunodeficiency virus type 1 (HIV-1)Gag localization and oligomerization monitored with live confocal imaging of areplication-competent, fluorescently tagged HIV-1. J Virol 81:12596–12607.
42. Yu Z, et al. (2013) Unclosed HIV-1 capsids suggest a curled sheet model of assembly.J Mol Biol 425:112–123.
43. Padilla-Parra S, et al. (2013) Fusion of mature HIV-1 particles leads to complete releaseof a gag-GFP-based content marker and raises the intraviral pH. PLoS One 8:e71002.
44. Wu X, Anderson JL, Campbell EM, Joseph AM, Hope TJ (2006) Proteasome inhibitorsuncouple rhesus TRIM5α restriction of HIV-1 reverse transcription and infection. ProcNatl Acad Sci USA 103:7465–7470.
45. Battivelli E, Lecossier D, Clavel F, Hance AJ (2013) Delaying reverse transcription doesnot increase sensitivity of HIV-1 to human TRIM5α. PLoS One 8:e52434.
46. Campbell EM, Perez O, Anderson JL, Hope TJ (2008) Visualization of a proteasome-independent intermediate during restriction of HIV-1 by rhesus TRIM5α. J Cell Biol180:549–561.
47. Ilina T, Labarge K, Sarafianos SG, Ishima R, Parniak MA (2012) Inhibitors of HIV-1 re-verse transcriptase-associated ribonuclease H activity. Biology (Basel) 1:521–541.
48. Arfi V, et al. (2008) Characterization of the early steps of infection of primary bloodmonocytes by human immunodeficiency virus type 1. J Virol 82:6557–6565.
49. Laguette N, et al. (2011) SAMHD1 is the dendritic- and myeloid-cell-specific HIV-1 re-striction factor counteracted by Vpx. Nature 474:654–657.
50. Zhang H, et al. (1996) Kinetic analysis of intravirion reverse transcription in the bloodplasma of human immunodeficiency virus type 1-infected individuals: Direct assess-ment of resistance to reverse transcriptase inhibitors in vivo. J Virol 70:628–634.
51. Thomas JA, Ott DE, Gorelick RJ (2007) Efficiency of human immunodeficiency virustype 1 postentry infection processes: Evidence against disproportionate numbers ofdefective virions. J Virol 81:4367–4370.
52. Butler SL, Hansen MS, Bushman FD (2001) A quantitative assay for HIV DNA in-tegration in vivo. Nat Med 7:631–634.
53. Ambrose Z, et al. (2012) Human immunodeficiency virus type 1 capsid mutation N74Dalters cyclophilin A dependence and impairs macrophage infection. J Virol 86:4708–4714.
54. Hulme AE, Kelley Z, Okocha EA, Hope TJ (2015) Identification of capsid mutations thatalter the rate of HIV-1 uncoating in infected cells. J Virol 89:643–651.
55. Perez-Caballero D, Hatziioannou T, Zhang F, Cowan S, Bieniasz PD (2005) Restrictionof human immunodeficiency virus type 1 by TRIM-CypA occurs with rapid kinetics andindependently of cytoplasmic bodies, ubiquitin, and proteasome activity. J Virol 79:15567–15572.
56. Da Silva Santos C, Tartour K, Cimarelli A (2016) A novel entry/uncoating assay revealsthe presence of at least two species of viral capsids during synchronized HIV-1 in-fection. PLoS Pathog 12:e1005897.
57. Zack JA, et al. (1990) HIV-1 entry into quiescent primary lymphocytes: Molecularanalysis reveals a labile, latent viral structure. Cell 61:213–222.
58. Zack JA, Haislip AM, Krogstad P, Chen IS (1992) Incompletely reverse-transcribedhuman immunodeficiency virus type 1 genomes in quiescent cells can function asintermediates in the retroviral life cycle. J Virol 66:1717–1725.
59. Mamede JI, Sitbon M, Battini J-L, Courgnaud V (2013) Heterogeneous susceptibility ofcirculating SIV isolate capsids to HIV-interacting factors. Retrovirology 10:77.
60. Lelek M, et al. (2012) Superresolution imaging of HIV in infected cells with FlAsH-PALM. Proc Natl Acad Sci USA 109:8564–8569.
61. Lelek M, Di Nunzio F, Zimmer C (2014) FlAsH-PALM: Super-resolution pointillist im-aging with FlAsH-tetracysteine labeling. Methods Mol Biol 1174:183–193.
62. van der Walt S, Colbert SC, Varoquaux G (2011) The NumPy array: A structure forefficient numerical computation. Comput Sci Eng 13:22–30.
63. Hunter JD (2007) Matplotlib: A 2D graphics environment. Comput Sci Eng 9:90–95.
E7178 | www.pnas.org/cgi/doi/10.1073/pnas.1706245114 Mamede et al.