e-government and administrative simplification for
TRANSCRIPT

CASE STUDY
E-GOVERNMENT AND ADMINISTRATIVE SIMPLIFICATION FOR BUSINESSES:
CHALLENGES AND OPPORTUNITIES FOR CENTRAL AND EASTERN
EUROPEAN COUNTRIES
/zavod14
@stirinajstZavod 14, zavod za sožitje in napredekCankarjeva 4 • 1000 Ljubljana
Dejan Ravšelj, Nina Tomaževič, Aleksander Aristovnik
Ljubljana,December 2020

Supported by Friedrich Naumann Foundation for Freedom
Aleksander Aristovnik, PhD, is an executive director of Zavod 14 and a Full Professor at the Department of Economics and Public Sector Management at the Faculty of Public Administration, University of Ljubljana, Slovenia. His research interests primarily encompass public sector economics and management, public finance, macroeconomics and economics of the EU. He has actively participated in around seventy international conferences and recently participated as the head or a member of numerous research projects financed by the Slovenian Research Agency (SRA).He has also published and reviewed many professional and scientific articles in domestic and international (ISI-cited) journals. He recently became a member of various international associations and organizations (e.g. EEA, INFER etc.) and served as a member of the Slovenian Officials’ Council.
Aleksander ARISTOVNIK
Dejan Ravšelj, PhD is a researcher at the Chair of Economics and Public Sector Management, Faculty of Public Administration, University of Ljubljana, Slovenia. His research areas are mainly associated with Business Economics, with a focus on the state-to-business relationship and consideration of economic and accounting issues. He is regularly involved in various domestic and international research projects that cover different research areas. He publishes professional and scientific articles and presents them at a range of domestic and international professional and scientific conferences.
Dejan RAVŠELJ
Nina Tomaževič, PhD, is an Assistant Professor at the Faculty of Public Administration, University of Ljubljana, Slovenia. She teaches Human Resources Management, Theory of Organization, Management in Public Sector, Social Responsibility and Sustainable Development. Her research interests encompass management, human resources management, social responsibility and business excellence. She is an author of numerous scientific and professional articles, monographs and parts of monographs and has actively participated in international and domestic conferences. She is a member of different project teams and professional and scientific associations.
Nina TOMAŽEVIČ

CASE STUDY 3Table of contents
1 Introduction
2 The definition and evolution of e-government concept 3 The role and development of e-government in the EU 3.1 The importance of e-government for the EU community 3.2 Trends of e-government development in the EU 3.3 Challenges and opportunities for Central and Eastern Europe countries 3.4 The role of digital government during and after the COVID-19 pandemic 3.5 Factors and key characteristics influencing e-government performance in the EU 4 The role of entrepreneurship in the EU economy
5 Administrative barriers to entrepreneurship and administrative simplification 5.1 Definition of administrative barriers to entrepreneurship 5.2 Most problematic barriers emphasized by the EU business sector 5.3 Administrative simplification in the EU 5.4 Policy measures to responsive and digitalized public administration
6 The role of e-government development for better business environment
7 Implications for Central and Eastern European countries
8 Conclusion
References
4
6
1010121619
22
25
2727283032
35
38
40
41

1. Introduction
A well-functioning public administration, together with public governance, play an important role in many aspects of contemporary society, such
as political, social and economic outcomes. Precisely, one of the important role of public administration is to deliver goods and services to citizens and businesses. In this context, effective governance is therefore considered as a driver of better service delivery in order to achieve a higher quality life for citizens as well as better business environment for companies. Contrarily, weak governance can deteriorate the business environment in terms of increasing business risks and administrative barriers in the business sector (Thanh & Hoai, 2019). It is therefore not surprising why good governance has often been used to explain the good economic performance as well as the well-being of a society over the last decades. However, despite the identified positive relationship between public governance and economic growth, the fact that the business sector often represents a channel through which public governance affects economic performance remain neglected (Ravšelj & Hodžić, 2020). Therefore, it is inevitable to establish such governance that ensures a more attractive and friendly business environment without unnecessary administrative barriers for the business sector, as this can act as an important driver of the overall economic development.
The business environment is nowadays characterized by volatility, uncertainty, complexity and ambiguity, all bringing challenges to business operations. It is
often associated with several unnecessary administrative barriers imposed by extensive, ever-changing and inconsistent legislation. In this context, it is often emphasized that economies with better legislation grow faster (Djankov et al., 2006). From the perspective of improving the business environment and becoming more economically competitive, lowering administrative barriers is one of the main prerequisites (Aristovnik & Obadić, 2015). Compliance with all relevant legislation is becoming increasingly complex. The extensive legal regulation and lengthy administrative procedures adopted in recent years due to Europeanization and globalization processes are ever more burdensome on enterprises. As emphasized by the existing literature, global processes, strong international competition, social, economic and political changes and the diffusion of information technology in the twenty-first century require public administration reform, mainly the modernization and mobilization of all forms of resources to improve individual and organizational effectiveness and efficiency (Segarra-Blasco et al., 2008).
Despite the stereotypical image of government as often referred as a slow-moving bureaucracy, unwilling or unable to change, the past several decades have been marked by developments challenging this view (European Commission, 2019). This was predominantly encouraged especially by the emergence and introduction of digital technologies, which profoundly affected social and economic realities. This applies also to public administration, including public governance. Namely, the transformational
CASE STUDY4

CASE STUDY 5role of the internet has a profound effect on relations between public administration, citizens and businesses. As a result, the internet opened the way for the emergence and development of new public administration model referred as Digital Era Governance (DEG) in which digital technologies represent the core of governments’ organizational structures (Wojciech, 2017). However, the observed rapid pace of the digital transformation of society in the recent years is raising the need for governments to urgently change their modus operandi (European Commission, 2019a). Namely, Digital Era Governance challenges public administration, requiring its internal and external opening, and lead to an administrative set-up characterized by simplification, automation of daily bureaucratic work and flexibility in delivering services (Wojciech, 2017).
According to the recent EU development strategies (i.e. European eGovernment Action Plan 2016-2020, Digital Single Market Strategy 2014-2019), it is obvious that the EU has recognised the importance of e-government and its implications for the entrepreneurship. The role of e-government and its innovative solutions has become even more important since the outbreak of the COVID-19 pandemic when face-to-face interactions are almost impossible due to the social distancing measures. In this context, the recent evidence shows a general growth in the development of e-government in the EU. However, despite their impressive progress in modernization and digitalization, governments in Central and Eastern European (CEE) countries or new EU member states (NMS) need to do much more to catch up with the average digital maturity level of the EU, as suggested by noticeable gap between them and old EU member states (OMS). Although NMS are eager to move forward with e-government, many of them face, especially in comparison with OMS, different
challenges related to multiple contextual factors such as resource limitations, a lack of digital infrastructure and insufficient capacities or capabilities. Moreover, some of these countries face also specific obstacles relating to issues such as digital inclusion, data privacy and cybersecurity (United Nations, 2020a).
Therefore, the main objective of the study is to provide the theoretical overview and to examine the secondary data on the situation of the following areas considering e-government development and admini-strative simplification for businesses in the EU:
• The definition and evolution of e-government concept;
• The role and development of e-government in the EU;
• The role of entrepreneurship in the EU economy;
• Administrative barriers to entrepreneurship and administrative simplification;
• The role of e-government development for better business environment;
• Policy implications for Central and Eastern European (CEE) countries.
The main purpose of the study in which the state-of-the-art in the field of e-government development and administrative simplification for businesses in the EU is examined, is to identify challenges and opportunities to improve the state of e-government, especially in the CEE countries or NMS. The findings of this study are not only interesting from the academic (research and debate) but also from the practical (suggestions for improvements) perspective. The research is carried out on literature review and analysis of the secondary data by different stakeholders, e.g. European Commission, United Nations, other international organisations, governments’ institutions and others.

CASE STUDY62. The definition and evolution of e-government concept
I n general, the transformation of digital government can be broadly defined as the process of incorporating ICT-enabled government innovations while changing the organisational
structures, documents and the provision of
services as well as the overall governance and policy systems (Charalabidis et al., 2009). Digital government relies on the use and reuse of data and analytics in order to simplify transactions for citizens, businesses as well as government agencies.
Figure 1: The OECD Digital Government Policy Framework
Source: OECD, 2020
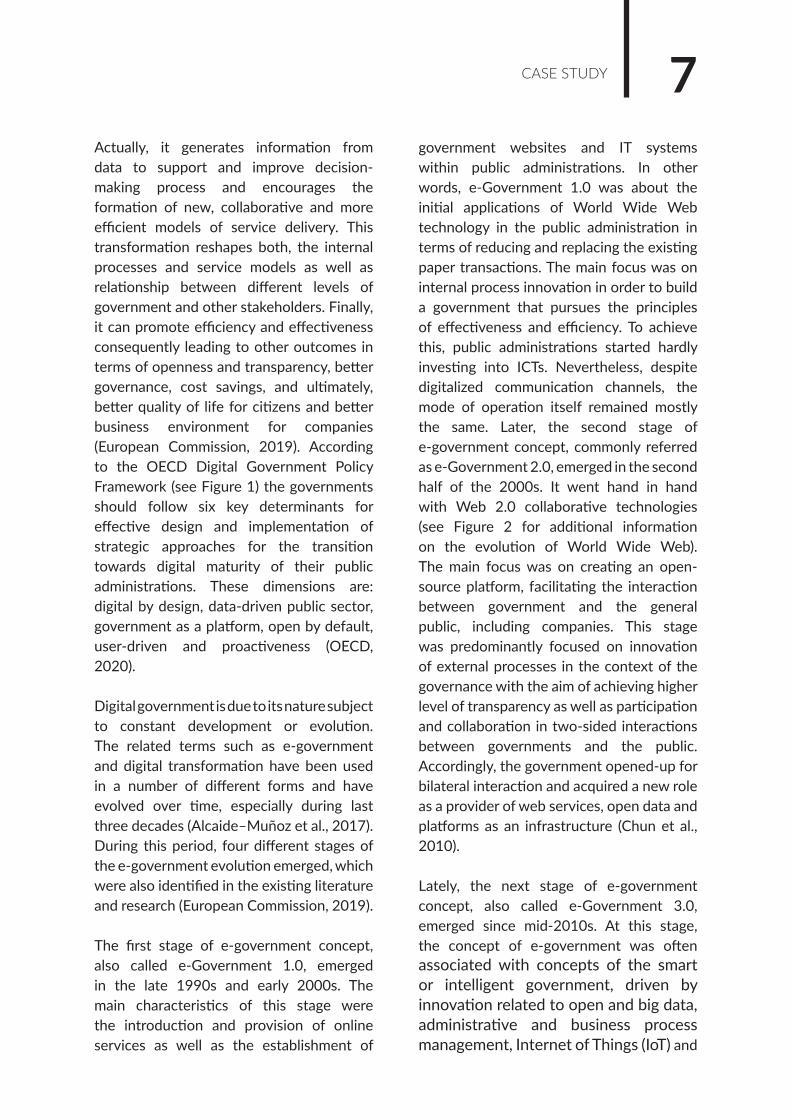
CASE STUDY 7Actually, it generates information from data to support and improve decision-making process and encourages the formation of new, collaborative and more efficient models of service delivery. This transformation reshapes both, the internal processes and service models as well as relationship between different levels of government and other stakeholders. Finally, it can promote efficiency and effectiveness consequently leading to other outcomes in terms of openness and transparency, better governance, cost savings, and ultimately, better quality of life for citizens and better business environment for companies (European Commission, 2019). According to the OECD Digital Government Policy Framework (see Figure 1) the governments should follow six key determinants for effective design and implementation of strategic approaches for the transition towards digital maturity of their public administrations. These dimensions are: digital by design, data-driven public sector, government as a platform, open by default, user-driven and proactiveness (OECD, 2020).
Digital government is due to its nature subject to constant development or evolution. The related terms such as e-government and digital transformation have been used in a number of different forms and have evolved over time, especially during last three decades (Alcaide–Muñoz et al., 2017). During this period, four different stages of the e-government evolution emerged, which were also identified in the existing literature and research (European Commission, 2019).
The first stage of e-government concept, also called e-Government 1.0, emerged in the late 1990s and early 2000s. The main characteristics of this stage were the introduction and provision of online services as well as the establishment of
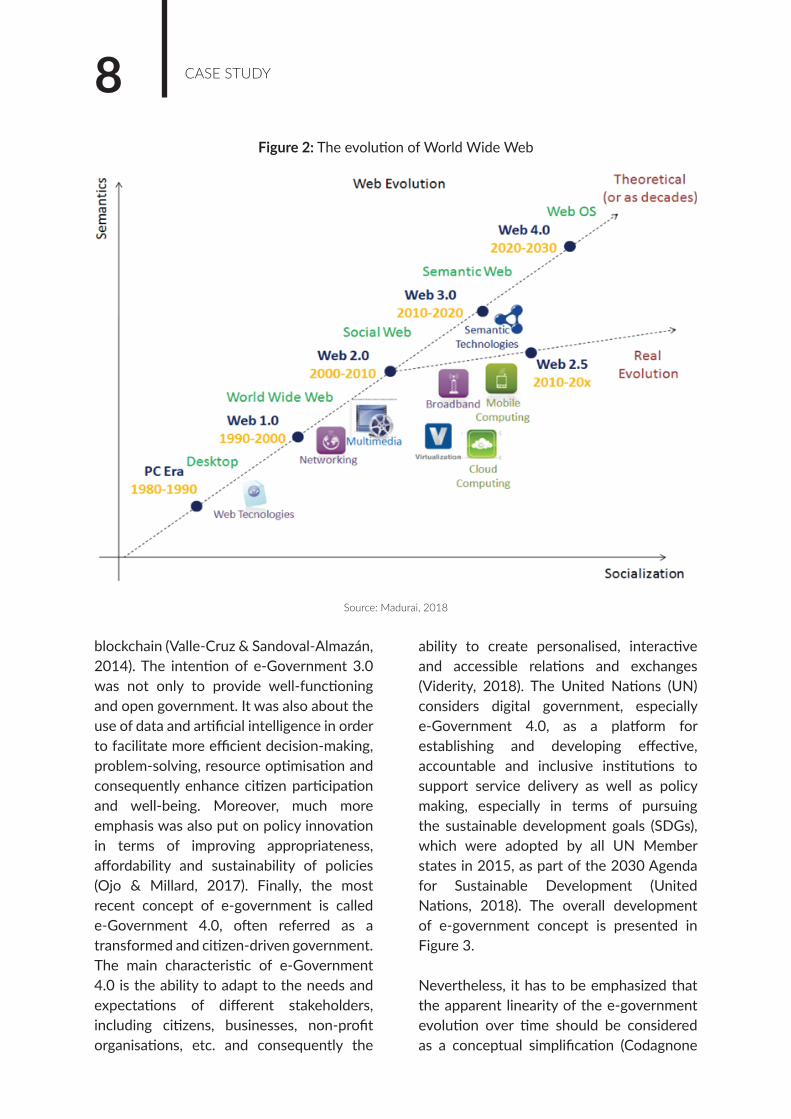
government websites and IT systems within public administrations. In other words, e-Government 1.0 was about the initial applications of World Wide Web technology in the public administration in terms of reducing and replacing the existing paper transactions. The main focus was on internal process innovation in order to build a government that pursues the principles of effectiveness and efficiency. To achieve this, public administrations started hardly investing into ICTs. Nevertheless, despite digitalized communication channels, the mode of operation itself remained mostly the same. Later, the second stage of e-government concept, commonly referred as e-Government 2.0, emerged in the second half of the 2000s. It went hand in hand with Web 2.0 collaborative technologies (see Figure 2 for additional information on the evolution of World Wide Web). The main focus was on creating an open-source platform, facilitating the interaction between government and the general public, including companies. This stage was predominantly focused on innovation of external processes in the context of the governance with the aim of achieving higher level of transparency as well as participation and collaboration in two-sided interactions between governments and the public. Accordingly, the government opened-up for bilateral interaction and acquired a new role as a provider of web services, open data and platforms as an infrastructure (Chun et al., 2010).
Lately, the next stage of e-government concept, also called e-Government 3.0, emerged since mid-2010s. At this stage, the concept of e-government was often associated with concepts of the smart or intelligent government, driven by innovation related to open and big data, administrative and business process management, Internet of Things (IoT) and
CASE STUDY8
blockchain (Valle-Cruz & Sandoval-Almazán, 2014). The intention of e-Government 3.0 was not only to provide well-functioning and open government. It was also about the use of data and artificial intelligence in order to facilitate more efficient decision-making, problem-solving, resource optimisation and consequently enhance citizen participation and well-being. Moreover, much more emphasis was also put on policy innovation in terms of improving appropriateness, affordability and sustainability of policies (Ojo & Millard, 2017). Finally, the most recent concept of e-government is called e-Government 4.0, often referred as a transformed and citizen-driven government. The main characteristic of e-Government 4.0 is the ability to adapt to the needs and expectations of different stakeholders, including citizens, businesses, non-profit organisations, etc. and consequently the
ability to create personalised, interactive and accessible relations and exchanges (Viderity, 2018). The United Nations (UN) considers digital government, especially e-Government 4.0, as a platform for establishing and developing effective, accountable and inclusive institutions to support service delivery as well as policy making, especially in terms of pursuing the sustainable development goals (SDGs), which were adopted by all UN Member states in 2015, as part of the 2030 Agenda for Sustainable Development (United Nations, 2018). The overall development of e-government concept is presented in Figure 3.
Nevertheless, it has to be emphasized that the apparent linearity of the e-government evolution over time should be considered as a conceptual simplification (Codagnone
Figure 2: The evolution of World Wide Web
Source: Madurai, 2018

CASE STUDY 9Figure 3: Development of e-government concept
Source: European Commission, 2019a
et al., 2015). Namely, practical experiences reveal that the evolution of e-government has been far from linear and thus its practical implementation is not necessarily aligned with the stages identified by the academic community. According to the OECD definition, digital government refers to the use of digital technologies, as an integrated part of governments’ modernisation strategies, to create public value (OECD, 2014). This definition is also in line with the definition of digital government of the European Commission, which have an important role in shaping the EU’s overall strategy (European Commission, 2019a). Although it is very difficult to verify the
development of e-government in practice, it should be followed by the internal and external opening of governments contributing to a far less complicated institutional political set-up characterised by automation and simplification of day-to-day bureaucratic work and flexibility in service delivery (Wojciech, 2017).

CASE STUDY103. The role and development of e-government in the EU
3.1 The importance of e-government for the EU community
The EU recognizes the digital transformation of government as an important element driving the success of the Digital Single Market – the EU strategy, which aim to provide effective and efficient access to the online services for both citizens and businesses. The main goal of the Digital Single Market is to eliminate existing digital
obstacles, reduce administrative barriers and finally increase the efficiency of interactions between governments and general public, including companies (European Commission, 2020a). The Digital Single Market Strategy is based on three main pillars, namely (see Figure 4): 1) access – better access for citizens and businesses to digital gods and services across Europe; 2) environment – creating the right conditions and a level playing field for digital networks and innovative services to flourish;
Figure 4: The main pillars of Digital Single Market Strategy
Source: European Commission, 2020b

CASE STUDY 11
Figure 5: Policy priorities of the eGovernment Action Plan 2016-2020
Source: European Commission, 2020c
and 3) economy & society – maximising the growth potential of the digital economy (European Commission, 2020b).
In order to accomplish this aim, the European Commission launched the eGovernment Action Plan 2016-2020 with an ambitious vision to make public administrations across the EU countries, efficient, open and inclusive, providing personalised borderless, end-to-end and user friendly digital public services to both citizens and businesses in the EU (European Commission, 2016). Moreover, it encourages innovative approaches to design and provide better services according to the needs of people and enterprises. Finally, it proposes that public administrations take advantage of the opportunities offered by the new digital environment to ease their interactions with stakeholders as well as with each other. For the purpose of achieving the aforementioned goals, the e-Government Action Plan 2016-2020 identifies three main policy priorities (see Figure 5). These refer to: 1) modernising public administrations using key digital enablers; 2) enabling mobility
of citizens and businesses by cross-border interoperability; and 3) facilitating digital interaction between administration and citizens/businesses for high-quality public services. (European Commission, 2020c).
Figure 6 presents major milestones of the Digital Single Market Strategy 2015-2019 since its launch in 2015. Since May 2015, EU policy-makers have made progress in various areas. In 2017 mobile roaming charges were abolished for mobile services (phone calls, texting, surfing online, etc.) within the EU. Later, in 2018, the EU adopted a new single set of rules on data protection and security, including common cybersecurity law. Finally, in 2020, countries across the EU started to coordinate their use of high-quality band enable the EU to innovate and adapt to developments of digital technologies. If these digital technologies are appropriate implemented in the administrative procedures and if EU governments tried to follow the eGovernment Action Plan as much as possible, they could save up to 5 billion EUR per year as of 2020.

CASE STUDY12Figure 6: Major milestones of the Digital Single Market Strategy 2015-2019
Source: European Commission, 2020d
The Digital Single Market Strategy 2015-2019 has been finished in 2019 and the eGovernment Action Plan 2016-2020 is coming to an end in 2020. This makes a unique opportunity to have a closer look at the development trends and current state of e-government in the EU.
3.2 Trends of e-government development in the EU
As mentioned before, e-government has been employed to mean everything from online government services to exchange of information and services electronically with citizens, businesses, and other arms of government. Traditionally, e-government has been considered as the use of ICTs for improving the efficiency of government agencies and providing government services online. Later, the framework of e-government
has broadened to include use of ICT by government for conducting a wide range of interactions with citizens and businesses as well as open government data and use of ICTs to enable innovation in governance. E-government can thus be defined as the use of ICTs to more effectively and efficiently deliver government services to citizens and businesses. It is the application of ICT in government operations, achieving public ends by digital means. The underlying principle of e-government, supported by an effective e-governance institutional framework, is to improve the internal workings of the public sector by reducing financial costs and transaction times so as to better integrate work flows and processes and enable effective resource utilization across the various public sector agencies aiming for sustainable solutions. Through innovation and e-government, governments around the world can be more efficient, provide better

CASE STUDY 13
Figure 7: E-Government Development Index in the EU-28 countries (2010-2020)
Source: United Nations, 2020b; own elaboration
services, respond to the demands of citizens for transparency and accountability, be more inclusive and thus restore the trust of citizens in their governments (United Nations, 2020b).Figure 7 presents the E-Government Development index (EDGI), which shows the state of e-government development in the EU-28 countries (EU) as well as the development of new EU member states (NMS) and old EU member states (OMS). Along with an assessment of the website development patterns in a country, the E-Government Development index incorporates the access characteristics, such as the infrastructure and educational levels, to reflect how a country is using information technologies to promote access and inclusion of its people. The e-Government development index is a composite measure of three important dimensions of e-government, namely: provision of online services, telecommunication connectivity and human capacity (United Nations, 2020b).
According to the presented e-government development trends in the period 2010-2020, it is evident that the EU-28 countries have improved the level of e-government during the last 10 years, since the degree of e-government has increased by 30.2%. Moreover, the comparison between new EU member states (NMS) and old EU member states (OMS) reveals that e-government development continues to advance in both geographical groups of the EU countries, whereby the OMS are in better position compared with NMS as suggested by average EDGI value increasing from 0.69 in 2010 to 0.87 in 2020. Although, the NMS have also improved their level of e-government, with the average EDGI value increasing rom 0.60 in 2010 to 0.82 in 2020, they are still lagging behind the OMS throughout the whole period 2010-2020. However, it can be observed that the gap between NMS and OMS in e-government development is narrowing during the period 2010-2020.

CASE STUDY14Finally, the comparison between NMS and OMS also reveals that the progress in enhancing e-government during the period 2010-2020 is higher in NMS (37.2%) than in OMS (26.8%).
Another important dimension of e-government is also e-participation (see Figure 8). Namely, promoting participation of the citizens and businesses is the cornerstone of socially inclusive governance. The goal of e-participation initiatives should be to improve the access of citizens and businesses to information and public services; and promote participation in public decision-making which impacts the well-being of society, in general, and the individual, in particular. The e-participation index is derived as a supplementary index and extends the dimension E-Government Development Index by focusing on the use of online services to facilitate provision of information by governments to citizens and businesses (e-information sharing), interaction with stakeholders (e-consultation), and engagement in decision-making processes (e-decision making) (United Nations, 2020b).
The overview of E-Participation Index in the period 2010-2020 reveals improvement in the e-participation across the EU-28. The level of e-participation during the last 10 years has increased during the last 10 years by 96.4% at the EU-28 level. Furthermore, the comparison between new EU member states (NMS) and old EU member states (OMS) reveals that the extent of e-participation continues to advance in both geographical groups of the EU countries, whereby the OMS are in better position compared with NMS as suggested by average EDGI value increasing from 0.48 in 2010 to 0.86 in 2020. Although, the NMS have also improved their level of e-government, with the average EDGI value increasing rom 0.32 in 2010 to 0.80 in 2020, they are still lagging behind the OMS throughout the whole period 2010-2020. However, it can be observed that the gap between NMS and OMS in e-government development is narrowing during the period 2010-2020. Finally, the comparison between NMS and OMS also reveals that the progress in enhancing e-government during the period 2010-2020 is higher in NMS (145.2%) than in OMS (78.2%).
Figure 8: E-Participation Index in the EU-28 countries (2010-2020)
Source: United Nations, 2020b; own elaboration

CASE STUDY 15
Source: United Nations, 2020b; own elaboration
Further, Figure 9 presents the position of the EU-28 countries according to both E-Government Development Index (x-axis) and E-Participation Index (y-axis) in 2020. According to this presentation, it is evident that there is a positive correlation between these two perspectives. Furthermore, based on this presentation, countries can be classified in four different groups according to their values of both indicators compared with the average values of E-Government Development Index (0.85) and E-Government Development Index (0.84) for the EU-28 in 2020, namely:
• Countries with relatively high scores of both indicators, E-Government Development Index and E-Participation Index (11 countries): Austria, Cyprus, Denmark, Estonia, Finland, France,
Netherlands, Poland, Slovenia, Spain and United Kingdom.
• Countries with relatively high scores of E-Government Development Index and relatively low scores of E-Participation Index (3 countries): Bulgaria, Croatia, and Ireland.
• Countries with relatively low scores of E-Government Development Index and relatively high scores of E-Participation Index (4 countries): Germany, Lithuania, Malta and Sweden.
• Countries with relatively low scores of both indicators, E-Government Development Index and E-Participation Index (10 countries): Belgium, Czech Republic, Greece, Hungary, Italy, Latvia, Luxembourg, Portugal, Romania and Slovakia.
Figure 9: E-Participation Index in the EU-28 countries (2010-2020)

CASE STUDY16The presented findings indicate that more than one third of the EU-28 countries have relatively bad position in terms of E-Government Development Index and E-Participation Index, which is very worrying. This holds true especially for new EU member states (NMS), having very low values for these two indicators.
3.3 Challenges and opportunities for Central and Eastern Europe countries
According to the presented results, governments around Central and Eastern Europe (CEE) are under pressure to enhance both e-digitalization and e-participation, increase efficiency, comply with regulations and ensure national security, but most of all they need to respond to their citizens’ growing demand for public services that are citizen-centric. They expect public services to be provided seamlessly, on demand, anywhere and anytime. There are a number of forces that are pushing governments to improve their delivery of public services (PwC, 2020):
• Greater citizen awareness and expectations – Citizens today are more aware of their rights to access information about public services, and have higher expectations of both the services and the user experience. They are increasingly demanding the same levels of service delivery they’re accustomed to getting in the private sector: “make it easy for me”, “give me a choice”, “deliver outcomes that suit me”.
• The digital revolution – The same technologies that are improving services and the user experience in the private sector, such as AI and the cloud, are opening up new possibilities for governments.
• Budgetary constraints – Governments face tighter budgets and the need to demonstrate value for money in respect of the taxes citizens pay.
• Global competition and the war for talent – Public sector efficiency and the availability of skilled resources is regarded as a key factor in evaluating investment decisions, hence global competition for investments as a means for economic growth is also driving the need for more effective public service delivery.
Expectations of citizens and businesses are driven by experiences with commercial online services, but the adoption by governments of comparable service standards may be slowed down by many potential obstacles: a lack of visible leadership at the top level, lack of thorough understanding of citizen and business needs, bureaucratised procedures, siloed processes, insufficient funds and gaps in relevant skills (PwC, 2020). Despite their impressive progress in modernisation and adoption of innovations, governments in CEE need to do much more to catch up with the average digital maturity level across Europe more broadly. Looking solely at the European Commission’s eGovernment Benchmark 2019 (European Commission, 2019b), compared to the EU average, the CEE region as a whole lags behind in all top-level benchmarks (see Figure 10).
Historically speaking, the year 1989 was a very special date in the history of Central and Eastern Europe (CEE). It has now been almost three decades since momentous changes in the countries of the region resulted in political transformation and the introduction of market-based economies. Coincidentally, it was about 1989 that British physicist Timothy Barnes-Lee was putting the finishing touches to a new system designed to help scientists share data across a then little-known platform. That platform
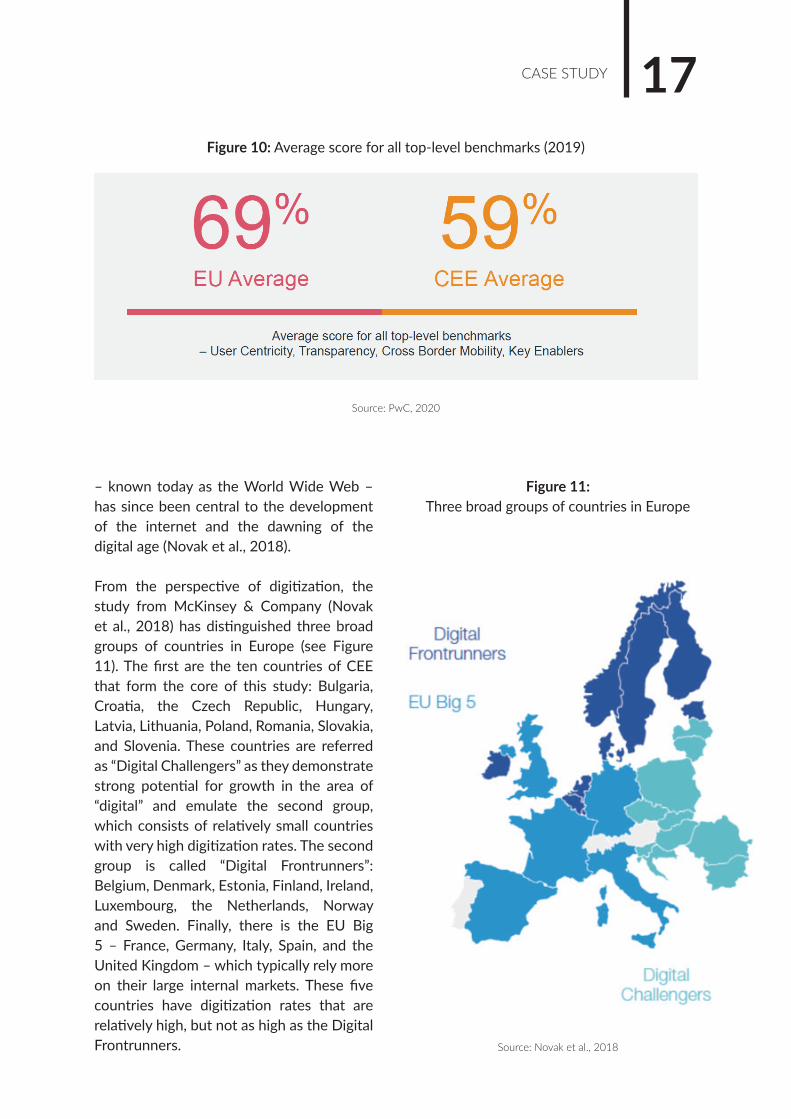
CASE STUDY 17Figure 10: Average score for all top-level benchmarks (2019)
Source: PwC, 2020
Source: Novak et al., 2018
– known today as the World Wide Web – has since been central to the development of the internet and the dawning of the digital age (Novak et al., 2018).
From the perspective of digitization, the study from McKinsey & Company (Novak et al., 2018) has distinguished three broad groups of countries in Europe (see Figure 11). The first are the ten countries of CEE that form the core of this study: Bulgaria, Croatia, the Czech Republic, Hungary, Latvia, Lithuania, Poland, Romania, Slovakia, and Slovenia. These countries are referred as “Digital Challengers” as they demonstrate strong potential for growth in the area of “digital” and emulate the second group, which consists of relatively small countries with very high digitization rates. The second group is called “Digital Frontrunners”: Belgium, Denmark, Estonia, Finland, Ireland, Luxembourg, the Netherlands, Norway and Sweden. Finally, there is the EU Big 5 – France, Germany, Italy, Spain, and the United Kingdom – which typically rely more on their large internal markets. These five countries have digitization rates that are relatively high, but not as high as the Digital Frontrunners.
Figure 11: Three broad groups of countries in Europe

CASE STUDY18Since the early 1990s, our group of Digital Challengers have enjoyed significant economic growth. Gross domestic product (GDP) per capita grew by 114% between 1996 and 2017. The main growth drivers during this period were traditional industries, dynamic exports, investments from abroad, labour-cost advantages, and funding from the EU. But now these drivers are beginning to weaken. The economies of CEE are generally undercapitalized compared to more advanced European economies. The capital stock, measured as total gross fixed assets per employee, is on average 60% lower here than for the EU Big 5. Workforce costs are also rising and
there are limited labour reserves left to plug into the economy, with unemployment in CEE at record low levels – on average 6.5% in 2017, compared to 7.6% in the EU as a whole. Working hours in the region are above the EU average, while productivity lags behind Western Europe. Moreover, the inflow of EU funds to CEE countries is likely to weaken after 2020. Clearly, CEE needs a new engine to drive its future economic growth (Novak et al., 2018).Based on this research, it is believed that digitization can be the answer to this challenge, becoming the region’s new growth engine. The current level of digitization in CEE is almost on a par with the largest
Figure 12: E-government penetration and uptake
Source: Novak et al., 2018

CASE STUDY 19EU countries. The pace of development of the digital economy and the existence of key enablers of digitization, such as high-quality primary, secondary, and higher education, digital infrastructure almost as good as in Digital Frontrunner countries, a milder “technology lock-in” than in Western and Northern Europe and a vibrant digital ecosystem, mean that CEE countries are well positioned to take advantage of the potential of digitization to boost their productivity – and, in so doing, increase the prosperity of their populations (Novak et al., 2018).
Digitizing public services has various benefits for citizens, businesses, and the government itself (see Figure 12). Digital government services can significantly reduce the administrative burden on citizens and firms. It also increases transparency about decisions and thus reduces the risk of corruption. On average, Digital Frontrunners lead the way in both penetration of digitization in the public sector and uptake of digitization by society. Close to 80% of the population in these countries access public services online. Among Digital Challengers, Latvia is well above average in terms of both penetration and uptake, with levels on par with Digital Frontrunners. Slovenia, the Czech Republic, and Slovakia, and Poland are in the middle of the spectrum, while Romania and Bulgaria have the furthest to go, with penetration rates below 25%. (Novak et al., 2018).
3.4 The role of digital government during and after the COVID-19 pandemic
During the COVID-19 crisis, ICT has played a vital role in promoting the health and safety of people and in keeping economies and societies working. Digital government
technologies, through information sharing and online services provision, have kept governments, citizens and businesses connected during the outbreak. Digital technologies have also enabled governments to make rapid policy decisions based on real-time data and analytics, to enhance the capacities of local authorities for better coordination, and to deploy evidence-based services to those who need them most (United Nations, 2020a).
E-government has stepped up its central role as a necessary element of communication, leadership and collaboration between policy makers and society, including businesses, during the COVID-19 pandemic. Digital technologies have enabled broader sharing of knowledge, encouraging collaborative research to find solutions and provide transparent guidance to governments, citizens and businesses. The same technologies have also been used for the rapid dissemination of false or questionable information, leading to concerns about privacy and security. Policy makers have been called upon to collect and process COVID-19-related data in an ethical, transparent, safe, interoperable, and secure manner that protects the privacy and data security of individuals. Overall, however, the benefits of using technology seem to have outweighed their drawbacks. In this context, digital government offices have also experienced rapid digital transformation during the COVID-19 pandemic. Accordingly, efforts in developing digital government strategies after the COVID-19 crisis should focus on improving data protection and global digital inclusion policies as well as on strengthening the policy and technical capabilities of public institutions. At the same time, governments need to strengthen common norms for knowledge sharing and collaboration beyond the COVID-19 pandemic (United Nations, 2020a).

CASE STUDY20Throughout the COVID-19 pandemic, governments have shared information through their national portals, mobile apps, and social media platforms. Namely, digital government technologies have kept governments, citizens and businesses connected during the outbreak, either through information sharing or online services delivery. These technologies have, for example, helped governments enforce stay-at-home measures by requiring movement permits from people through text messages, online applications or platforms. The use of technology has also enabled governments to make rapid policy decisions based on real-time data and analytics, enhancing the capacities of national and local authorities to better coordinate and deploy evidence-based services to those
who need them most. The vital need for accurate, useful and up-to-date information provided by governments has been amplified during the COVID-19 pandemic. A review of the national portals of 193 countries showed that by 25 March 2020, only 57% (110 countries) had put in place some kind of information on COVID-19. The percentage of countries providing such information and guidance reached roughly 86% (167 countries) by 8 April 2020. Finally, on 13 May nearly 97.5% (188 countries) had information about COVID-19 in their national portals. As the COVID-19 pandemic progressed, governments increased their level of information-sharing (see Figure 13). According to the data, in March 2020, countries focused on providing basic information related to general health
Figure 13: Percentage of government portals with Covid-19 information and world total confirmed Covid-19 cases
Source: United Nations, 2020a

CASE STUDY 21
Figure 14: Different levels of e-government information-sharing during COVID-19
Source: United Nations, 2020a
precautions and emergency numbers accompanied by public announcements on national portals (low level). As the crisis intensified, governments began extending their reach and started using more social media channels to report on COVID-19 statistics (e.g. total number of cases in a country, total fatalities, as well as reporting cases by jurisdictions) and provided some limited national policy updates (medium level) (United Nations, 2020a).
At a later stage in the COVID-19 crisis (see Figure 14), more governments started providing regular updates on policy developments and information on where people can receive social, financial or mental health support (high level). Some governments started using dedicated COVID-19 portals to centralize the information. However, other governments decided to continue using their national government portals to share extensive information on platforms that people are already familiar with. During the COVID-19
pandemic, policy makers were mobilized to engage in designing new services and apps as part of the crisis response. Some of these new services and apps went beyond information-sharing and included delivering food and other essential items to those most in need, thus optimizing the entire supply chain via digital government services. The analysis of government portals during COVID-19 demonstrated that policy makers utilized multiple digital communication channels and increased information-sharing by providing up-to-date public data. It is in the hands of governments to decide which channels are best suited to reach a wide audience and to provide accurate and timely information on the chosen platforms. During a national crisis, reliable and transparent information enables governments to act decisively, support people and businesses in making informed decisions about their daily routines, and give them a sense of support, which builds public trust (United Nations, 2020a).

CASE STUDY22Government partnerships with the private sector in the implementation of new technology applications have been shown to have a positive effect on the fight against the outbreak. In such contexts, it is necessary to have the appropriate legal and institutional structures in place to address the potential breaches of privacy and human rights concerns that their implementation might entail. Policymakers need to abide by the principle of data minimization and limited data collection, retaining and sharing only those personal data that are absolutely necessary and can justifiably be linked to the efforts to overcome the health crisis so that there is no question of surveillance misuse or the violation of data privacy. Digital government is not an end; it is a means to improving public service delivery, increasing engagement of citizens and businesses, enhancing transparency, accountability and inclusion, and ultimately making life better for all. The post-COVID-19 world will be different and much more digital than before. Accordingly, e-government has an increasingly important role to play in supporting countries. Governments will need to engage with stakeholders, including technology leaders and small and medium-sized enterprises, through effective partnerships. The way forward is a new “digital normal” in responding to global challenges and pursuing sustainable development (United Nations, 2020a).
3.5 Factors and key characteristics influencing e-government performance in the EU
Despite the fact that e-government development continues to advance across the EU countries, it is important to identify important factors and key characteristics influencing e-government performance in the EU. For this purpose, the two absolute
indicators of e-government performance (penetration and digitalisation) are taken into the account and compared with relative indicators (the users, governmental and digital context characteristics of a country). This approach is often referred as the benchlearning exercise, which allows matching and comparing the overall performance of countries with their own structural characteristics (European Commission, 2020a).
The analysis covers all of the EU-28 countries. The benchlearning exercise provides an in-depth overview of e-government performance in each country by looking at the phenomenon from two distinct aspects, represented by two individual indicators. The first indicator is penetration, reflecting the degree to which online channels are used by citizens, including businesses, to access government services. This can be also referred as the demand for online public services. Moreover, the second indicator is digitalisation, which reflects the online provision of public services based on the overall score of a country. Based on the two aforementioned absolute indicators, the EU-28 countries can be divided into four different subgroups (European Commission, 2020a):
• The first group (fruitful e-government) consists of countries having a high degree of both digitalisation and penetration.
• The second group (expandable e-government) includes countries with higher degrees of digitalisation and lower degrees of penetration.
• The third group (unexploited e-government) consists of countries having lower degrees of digitalisation and higher degrees of penetration.
• The fourth group (non-consolidated e-government) includes countries with a low degree of both digitalisation and penetration.

CASE STUDY 23The presented division or grouping of the EU countries can facilitate identification of key areas for improvement, providing countries’ important and evidence-based information on which areas should be on the priority list when the investing is concerned. Namely, with appropriate actions and investment decisions, countries can achieve higher degrees of overall e-government performance, consequently having a beneficial effect for citizens, companies and overall society. Accordingly, there exist several ways how to improve the extent of digitalisation and penetration. On the one hand, the extent of digitalisation can be increased by investing in policies aimed at improving transparency, user centricity, cross-border mobility and key enablers, i.e. the degree of the back-office and the front-office digitalisation). On the other hand, the extent of penetration can be increased by enhancing awareness of citizens and companies about e-government services that are currently available, while increasing the number of online users, or by automating procedures and demanding less forms from citizens and companies (European Commission, 2020a).
Nevertheless, the benchlearning exercise has a broader objective than just offering a simple overview of e-government performance in individual country. This approach, besides digitalisation and penetration aspect, additionally incorporates the comparison of the performance with several relative indicators. This can facilitate countries understanding of their current position in comparative perspective with other countries. This approach may suggest whether current bottlenecks prevail on the demand or supply side of the provision of digital service. With the inclusion of the relative indicators in the analysis, countries can obtain beneficial information about the degree of the national demand
and supply of e-government services in comparison with the overall digitalisation of their societies. This ensures that the performance of each country in terms of penetration and digitalisation is evaluated with respect to other countries with similar relative indicators. Accordingly, the higher a country performs on these relative indicators, the higher its e-government digitalisation and penetration are expected to be. Consequently, such approach allow countries having similar context but different extent of e-government to obtain good practices from one another. The analysis covers the following relative indicators (European Commission, 2020a):
• User characteristics, which cover elements that allow people to use online platforms and are evaluated analysing digital skills and ICT usage of users.
• Government characteristics, which represent the degree to which public administrations are perceived to be trustable and transparent. They are based on trust and non-corruption of public administration (quality) and the ability to be “open” to citizens’ suggestions and initiatives (openness).
• Context characteristics, which reveal the position of administered territories and cover the introduction of broadband networks (connectivity) and the incorporation of technology in the private sector (digital in the private sector).
Figure 15 presents the e-government performance across EU-28 countries in terms of the extent of penetration and digitalisation to their scores of the relative indicators, describing context and country characteristics. The scatterplot takes into the account two dimensions, namely 1) the degree of digitalisation (x-axis) and 2) the degree of penetration (y-axis). Moreover, arrows are used to indicate

CASE STUDY24where scores diverge from the scores that would be expected based on the values of the relative indicators with the following meanings: 1) arrow pointing upwards indicates outperformance on penetration; 2) arrow pointing downwards indicates underperformance on penetration; 3) arrow pointing rightwards indicates outperformance on digitalisation; and 4) arrow pointing leftwards indicates underperformance on digitalisation.
The results of the benchlearning exercise analysing e-government performance across EU-28 countries show that Denmark and France are outperforming in penetration, and remaining steadily on track in regard to digitalisation, while the United Kingdom and Romania are also outperforming in penetration but underperforming in their adoption of digitalisation. On the other side of the spectrum, Austria and Portugal are doing well in digitalisation and remaining on track in penetration, with
Malta also outperforming in digitalisation but falling short with an underperformance in penetration. Moreover, Bulgaria, Finland, Hungary, Luxembourg, the Netherlands, Poland, Slovenia, Slovakia and Sweden remain equally on track for both penetration and digitalisation. Falling slightly behind, Belgium, Cyprus and Italy are underperforming in penetration given their country characteristics, while they perform according to expectations in terms of digitalisation. Conversely, Croatia and Ireland show underperformance in their adoption of digitalisation, while performing in-line with penetration averages. Czech Republic, Germany and Greece are the only countries showing a relative performance below the European trend, with sub-optimal results in both penetration and digitalisation. Estonia, Latvia, Lithuania and Spain outperform in both penetration and digitalisation when compared to the EU countries with similar characteristics (European Commission, 2020a).
Figure 15: E-government performance across EU-28 countries
Source: European Commission, 2020a

CASE STUDY 25
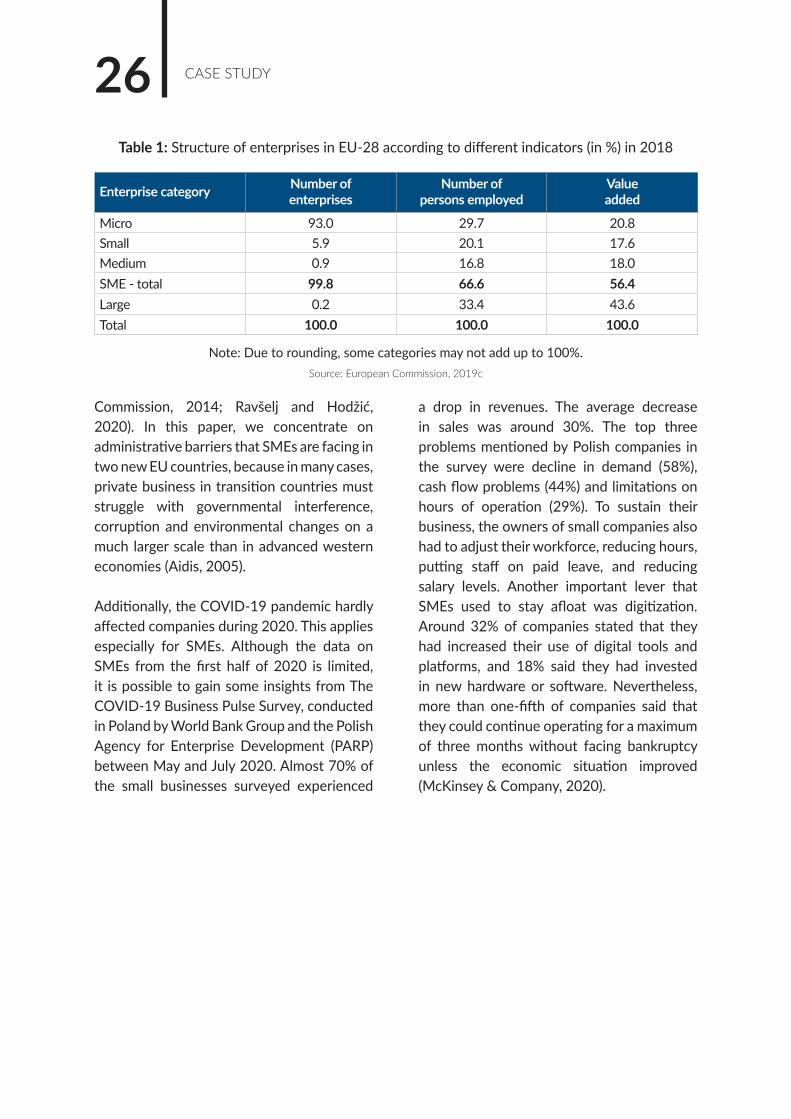
4. The role of entrepreneurship in the EU economyHuge importance of small and medium enterprises (SME) sector has made the EU follow active policy supporting entrepreneurship as well as small and medium enterprises (Obadić et al., 2020). Due to this fact, one of priorities identified by European Commission is support micro, small and medium enterprises in order to stimulate economic growth, create new jobs as well as promote economic and social cohesion (Samitowska, 2011). SMEs form the backbone of the European economy making a significant contribution to the non-financial business economy (see Table 1). In 2018, slightly more than 25 million of SMEs (99.8% of total registered enterprises) in the EU-28 area employed 97.7 million people (66.6% of total employment) and created 4,357 billion value added (56.4% of total value added generated). According to the size of SMEs, micro enterprises were the most common size of enterprise in 2018, accounting for 93.0% of total registered enterprises. They also contributed the largest shares of both employment and value added at 29.7% and 20.8% respectively. In recent years, SMEs have followed a solid growth path in the EU economy. In 2014-2018, SME employment increased by 8.2%, indicating their flexibility and ability of creating new jobs (Obadić and Aristovnik, 2016). Consequently, SME value added increased by 16.2% in this period. The main drivers of growth in SME value
added were micro enterprises, generating value-added growth of 18.3% in this period. Nevertheless, the growth in value added of large firms was even higher, at 19.5%. Most recently, in 2017-2018, SMEs in all EU Member States generated growth in both employment and value added, of 1.8% and 4.1% respectively. Micro enterprises grew fastest in 2017-2018, with a rise 2.6% in employment and 5.4% in value added. This meant they outperformed the growth in all other business size classes, including that of large enterprises (European Commission, 2019c).
Compared with large companies, SMEs often produce slightly weaker results, such as lower profitability, higher employee fluctuation, lower survival rates, less innovation success, lower investment capacity for development and improvement of employees, etc. (Szczepaǹski, 2016). This can partly be attributed to the existence of significant obstacles to the entry of new employees and growth, which is characteristic for most economies. Smaller companies are faced with disproportionately greater regulatory barriers compared to larger companies (Aristovnik and Obadić, 2015), and inefficient public administration, weak judicial capacity and legal uncertainty remain the main obstacle to industrial competitiveness and economic growth in EU member states (European
CASE STUDY26
Commission, 2014; Ravšelj and Hodžić, 2020). In this paper, we concentrate on administrative barriers that SMEs are facing in two new EU countries, because in many cases, private business in transition countries must struggle with governmental interference, corruption and environmental changes on a much larger scale than in advanced western economies (Aidis, 2005).
Additionally, the COVID-19 pandemic hardly affected companies during 2020. This applies especially for SMEs. Although the data on SMEs from the first half of 2020 is limited, it is possible to gain some insights from The COVID-19 Business Pulse Survey, conducted in Poland by World Bank Group and the Polish Agency for Enterprise Development (PARP) between May and July 2020. Almost 70% of the small businesses surveyed experienced
a drop in revenues. The average decrease in sales was around 30%. The top three problems mentioned by Polish companies in the survey were decline in demand (58%), cash flow problems (44%) and limitations on hours of operation (29%). To sustain their business, the owners of small companies also had to adjust their workforce, reducing hours, putting staff on paid leave, and reducing salary levels. Another important lever that SMEs used to stay afloat was digitization. Around 32% of companies stated that they had increased their use of digital tools and platforms, and 18% said they had invested in new hardware or software. Nevertheless, more than one-fifth of companies said that they could continue operating for a maximum of three months without facing bankruptcy unless the economic situation improved (McKinsey & Company, 2020).
Enterprise category Number ofenterprises
Number ofpersons employed
Valueadded
Micro 93.0 29.7 20.8Small 5.9 20.1 17.6Medium 0.9 16.8 18.0SME - total 99.8 66.6 56.4Large 0.2 33.4 43.6Total 100.0 100.0 100.0
Table 1: Structure of enterprises in EU-28 according to different indicators (in %) in 2018
Note: Due to rounding, some categories may not add up to 100%.Source: European Commission, 2019c
CASE STUDY 275. Administrative barriers to entrepreneurship and administrative simplification
5.1 Definition of administrative barriers to entrepreneurship
Administrative barriers represent a collective name for administrative obstacle, which should be differentiated from administrative burden (Obadić et al., 2020). Administrative barriers represent all the things that unjustifiable complicate business activities and operations of the company, as opposed to administrative burdens that can be broadly defined as all costs that results from mandatory obligations placed on businesses by public authorities on the basis of laws, degree or similar acts. Administrative burdens differ among European countries and include: (a) EU law and domestic legal acts required to transpose it into national law; (b) accounting and taxation requirements; as well as (c) sectoral and industrial specific laws reporting and coordinating obligations (Szczepaǹski, 2016). Administrative barriers represent costs to companies and citizens in fulfilling fundamental obligations based on government laws and regulations (European
Commission, 2014). It can be defined as (recurring) costs of administrative activities that companies have to perform in order to comply with their obligations imposed by central government regulation (UK Cabinet Office, 2006).
The imposition of the often severely restrictive regulatory obligations for small and medium-sized enterprises has led the European Commission to introduce special action plans in order to simplify and improve the regulatory environment. The main drivers behind „Better Regulation Programs“ presume that a stronger focus on reducing administrative burden on companies would lead to better policies, better implementation, better coordination and, finally, better government (UK Cabinet Office, 2006). In an official document “Better Regulation for Growth and Jobs in the European Union”, the Commission encourages Member States to continue to develop independently improved administrative regulations (European Commission, 2005). Within

CASE STUDY28the framework of the Lisbon Agenda, the European Commission has launched its “Better Regulation” program. In order to adopt this Agenda by the beginning of 2007, the Commission adopted the “Action Program for reducing administrative costs in the European Union”. The Action Plan was approved by the European Council, which emphasized the main goal for reducing administrative burdens which is arising from the EU law for 25% by 2012. Such a reduction could lead to an increase in GDP by 1.4% (European Commission, 2007).
The existing economic literature broadly classifies barriers to SMEs growth and development in three main categories: internal (for example, insufficient skills and resources at enterprise level), administrative (for example, tax systems, and complicated laws) and financial (mostly access to finance). The last comprehensive pre-crisis Eurobarometer survey from 2007, which was focused on the specific difficulties of small and medium-sized enterprises, showed that the biggest problems were: strict administrative regulations, low availability and the cost of appropriate human resources (almost a third of the company claimed to be faced with difficulties in the areas), insufficient infrastructure and limited access to finance (more than 20% of SMEs reported difficulties in this area) (Szczepaǹski, 2016). The facts show that small and medium-sized enterprises bear disproportionately greater regulatory and administrative barriers than large companies (Obadić et al., 2020).
5.2 Most problematic barriers emphasized by the EU business sector
Various studies conclude that for smaller entities the cost of coordination with regulatory burdens and requirements is
disproportionately high. The total cost of the administrative burdens as percentage of GDP varies across the EU members. Italy, Spain, Poland, Greece and Hungary reporting the highest levels (between 4.6% and 6.8% of GDP), while Finland, Sweden, the United Kingdom, Denmark and Ireland reporting the lowest (between 1.5% and 2.4% of GDP). The burden on SMEs is large due to frequent failure, which do not take the specific characteristics of small economies business into account when designing laws, as well as the nature of regulatory burdens. The duties and obligations are often the same for smaller and larger businesses, but small and medium-sized businesses are less efficient in solving regulations (for example, they invest less in IT support systems, but also in smaller businesses, entrepreneurs spend their valuable time on solving compliance and reporting) (Szczepaǹski, 2017). Experts estimate that while large companies pay 1.0 EUR per employee for regulatory obligations, small businesses pay for the same costs up to 10.0 EUR. Studies indicate that companies with fewer than ten employees has to face regulatory burden (measured per employee), that is almost double the burden of a business with more than 10 but less than 20 employees and almost three times as high as the burden of a company with more than 20 but fewer than 50 employees. For large companies, the burden per-employee is only one fifth or less of that of small enterprises. Uneven regulatory burden exist for several reasons, such as: (i) coordination with regulations has the characteristics of fixed costs (for example, information duties may be the same for small and large enterprises), (ii) small and medium enterprises are less efficient in dealing with regulations (for example, they invest less in specific computerization) and (iii) it is often entrepreneurs themselves that have to deal with regulations (Szczepaǹski, 2016).

CASE STUDY 29Figure 16: The biggest problems faced by small and medium-sized
enterprises in the EU-28 (2014-2019)
Source: European Commission, 2019d
Note: * The data are rounded.
For years, the European Parliament is stating in its resolutions that the specific obstacles faced by small and medium-sized enterprises are the result of their small size (Szczepaǹski, 2017). Since 2011, European Parliament has consistently being emphasizing that reducing administrative barriers, better access to financial opportunities and supporting the creation of a competitive environment is a key issue to enable successful business development and job creation (European Parliament, 2017). The European Commission (EC) and the European Central Bank (ECB) carry out joint annual surveys on enterprise financing access and also address the most critical issues that small and medium-sized enterprises are facing. Among the six biggest problems identified by enterprises in the period 2014-2019 are customer finding, availability of expert staff and managers, competition, regulation, production or labour costs and access to finance, and they are shown in Figure 16.
The ranking of all of the above-mentioned problems is calculated based on grades of respondents who were asked to assign a fixed set of problems. Accordingly, the problem with the highest importance is considered as the most pressing problem faced by SMEs. Considering all of the potential problems and time dimension, SMEs point out the availability of skilled staff or experienced managers and finding customers as the most frequent problems. Currently, the problem of availability of skilled staff or experienced managers represents the most pressing problems for SMEs. This problem has steadily increased every year since 2014 and now is considered as the most frequent problem for more than a quarter of SMEs (26%). The second most pressing problem is finding customers for products or services (22%). After 2016, this problem was in the phase of decline, meaning that the position of SMEs has improved in last years as the demand on their market is approaching the pre-crisis level. The third most pressing problem is represented by the costs of production or labour occupies

CASE STUDY30countries. It is one of the most effective methods for fighting against regulatory complexity and inflation. Governments are facing increasing and changing challenges and, in response, regulatory activities multiply red tape. There are many advantages in cutting red tape and maintaining administrative requirements better adapted to real needs and circumstances. Three key benefits should be underlined: 1) innovation can be encouraged through efficiency gains, 2) entrepreneurship can be favoured by fewer administrative burdens, releasing resources otherwise devoted to red tape, and 3) better public governance can be attained with more effective tools available for policy implementation. Visibility of cutting red tape policies has also been a support when launching reform. Administrative simplification can be very appealing politically as governments can gain constituency by reducing administrative costs to businesses and citizens, thus promoting a proactive and business enabling environment (OECD, 2009).
In some EU countries, especially CEE countries, some key challenges hampering the investment climate and thus their development are tackled through simplification. These challenges include business informality, high transaction costs (e.g. those linked to corruption), and lack of transparency, accountability and predictability of the public administration. This is important for business sector, especially for small and medium enterprises (SMEs), which are less equipped to face administrative burdens due to greater resource constraints. This becomes more relevant especially in the CEE countries because governments still play a large role in the economy. The competitiveness of SMEs is rather limited, constrained by the inhibitions that regulations impose on them. Moreover, burdensome administrative barriers may also reduce the attractiveness of a country
(12%), while the fourth and fifth problem are regulation (12%) and competition (12%). All of these three problems have been fairly stable since 2014. Finally, the problem related to the access to finance has dropped to be the least pressing of the all-possible problems identified (7%) as it has steadily declined in importance throughout the observed period. Nevertheless, there are still more than 12% of SMEs on the EU-28 level, pointing out regulation as their most frequent problem (Obadić et al., 2020).
5.3 Administrative simplification in the EU
Administrative simplification is designed to reduce regulatory complexity and uncertainty, and reduce unnecessary burdens created by bureaucracy and paperwork (European Commission, 2017). The challenge for governments is, on one hand, to balance their need to use administrative procedures as a source of information and as a tool for implementing public policies, and on the other, to minimise the interferences implied by these requirements in terms of the resources demanded to comply with them. Administrative simplification involves cutting red tape. Red tape originates from excessive regulation that can be redundant or bureaucratic, and thus hinder action or decision making. Red tape generally includes filling out unnecessary paperwork, and complying with excessive administrative procedures and requirements such as licences. Thus, administrative burdens refer to regulatory costs in the form of asking for permits, filling out forms, and reporting and notification requirements for the government. These can be harmful if they unnecessarily limit innovation, trade, investment and economic efficiency in general (OECD, 2009).Administrative simplification is currently high on the political and policy agenda in most
CASE STUDY 31to foreign investments and thus hamper entrepreneurial activity (OECD, 2009).
Defining and identifying challenges for administrative simplification is not an easy task since they link to broader policy issues that are difficult to tackle simultaneously. The main objectives in cutting red tape should be to improve the efficiency of administrative processes needed to undertake economic and social activities, provide a co-operative relation between public administration and citizens, and minimise cost interferences to businesses and citizens. Some of the key challenges to meet these objectives are (OECD, 2009):
• Build a constituency for administrative simplification. Without support from a network of partners at a high political level, but also at a technical level, reforms might not attain expected goals. This support should not be taken for granted and needs to be gained.
• Effective and efficient use of capacities and resources available. Consideration of opportunity costs and benefit cost analysis of reforms are needed to rank priorities.
• Manage institutional and organisational needs. Administrative simplification is not embedded in the mandate of all government institutions; it needs to be pushed forward in a co-ordinated manner. The establishment of administrative simplification units inside government and outside taskforces can help with co-ordination and keeping up the path of reforms.
• Ensure sound multilevel governance. Uncoordinated government efforts at different levels of government might multiply the adverse effects of red tape. The approach should take into account that even though administrative requirements emanate from different institutions, the end user should be able
to address all responsibilities using a common information source.
• Involve all stakeholders fairly in administrative simplification strategies. All relevant stakeholders and affected parties should be able to be involved in the administrative simplification reforms. This can also contribute to gaining constituency.
• Develop and improve measurement and evaluation mechanisms. The relevance of this challenge is two-folded: first, the strategies already in place need to be evaluated to ensure that their objectives are met, and second, there is still a lack of information on how red tape strategies impact and benefit public interest.
There exist various routes to simplification. There is not one single model that can be applied everywhere. Administrative simplification policies can be designed either on an ad hoc basis focused in a sector, or on a rather comprehensive and long term perspective. Usually first steps are based on the first type of approach, providing outcomes and instruments to continue in other fields and expanding to reach other policy areas. The administrative system is framed by institutions, policies and tools used by government. When cutting red tape, these elements need to be improved and their challenges tackled. In general, there are five main areas of work for cutting red tape, namely (OECD, 2009): 1) regulatory management reform to improve the framework of the administrative system; 2) organisational reengineering; 3) better information on the delivery of services and administrative requirements, and 4) co-ordination of multiple requirements stemming from the public administration and 5) use of information and communication technologies (ICTs). The latter is especially important in the context of e-government infrastructure.

CASE STUDY32
5.4 Policy measures to responsive and digitalized public administration
Under the responsive administration principle more than 60 policy measures were adopted/implemented during the current reference period (2018-Q1/2019) (see Figure 17). Overall, more than 465 policy measures have been adopted/implemented since 2011 at EU level under the responsive administration principle. The ‘once only’ principle has yet to be fully applied, with most EU Member States failing to sufficiently connect various public administration databases. However, most EU Member States now have a one-stop shop for SMEs, and an effective e-government infrastructure allowing SMEs to handle many administrative procedures online. More than half of EU Member States also have an SME envoy who is highly visible among SME stakeholders and plays a proactive role in advancing the interests of SMEs (European Commission, 2019e).
The presented measures can significantly improve the provision of public services to citizens and businesses. In this context, the digitization of public services brings benefits to all actors in the public sphere and as such should be treated as an imperative. In CEE there were almost 12 million new users of online services at the peak of the COVID-19 pandemic. Just 26% of these new users accessed digital services in the public sector and their satisfaction levels were lower than for other sectors. While the goal for governments during lockdown was to create new online services fast, we would now advise them to check the quality of those services and make sure that they are fully integrated with each other. Digital public services bring a whole array of benefits. Perhaps the most tangible is that they offer 24/7 availability and remove the need for physical contact - a pivotal factor in the context of the COVID-19 pandemic. Digital interactions and automatic case handling consume less of citizens’ time and reduce the
Figure 17: Policy measures adopted under the principle of responsive administration (2011-Q1/2019)
Source: European Commission, 2019e

CASE STUDY 33Figure 18: Development level of digital services in CEE countries (2019)
Source: McKinsey & Company, 2020
administrative burden on businesses, while also freeing up public resources. Moreover, improving public services can win the hearts of citizens: Statistics from several Western countries show that residents who are satisfied with public services are nine times more likely to trust the government overall. Looking at the CEE countries (see Figure 18), it appears that practically all of them have either already implemented digital services or are in the process of doing so. Slovenia, the Czech Republic, and Hungary lead the way, with Bulgaria, Romania, and Poland bringing up the rear. The three elements that CEE countries struggle with most are e-payments, e-invoices, and the interoperability of the data that they gather (McKinsey & Company, 2020).
However, many smart and validated digital public services exist in CEE. For example, the Hungarian government rolled out a multipurpose platform for local administration between 2017 and 2019,
replacing legacy technologies. The services include a real estate cadaster system, a local tax system, a records management system, and a commercial register. Another example is the “trusted profile” in Poland. This is an e-signature system in which users can log on to services using their online bank account details, providing access to social security, tax information, and company registration procedures. The aim is to provide a digital one-stop shop for government services. Similar to other EU states, CEE countries are obliged to digitize their services as part of the “Single Gateway” initiative launched by the European Commission. The key outputs of this initiative include providing information on different rules and rights that citizens and businesses have as part of the European Union single market. Through this project they will be able to access guidelines on how to carry out different administrative procedures, 21 of which will be fully available online by 2023. Furthermore, the “once-only principle” will be applied to enable cross-border exchange of

CASE STUDY34data: citizens will be able to request that their data be shared with public authorities from other EU states. Finally, the quality of online services will be verified and improved on the basis of user feedback, regularly analysed, and displayed on dashboards. However, simply moving public services online will not do the job. Accessing those services tends to be difficult: Citizens often have a hard time understanding the bureaucratic language, and navigating digital public services can be
confusing as each government agency has a different website and approach. Digitization efforts have frequently consisted of nothing more than giving citizens online access to documents that they then have to print out and either send off by mail or submit in person. Moreover, different sites may require setting up separate accounts and submitting the same information multiple times (McKinsey & Company, 2020).

CASE STUDY 35
6. The role of e-government development for better business environmentGood public governance is considered as an important factor contributing to better server delivery and consequently to achieve
a higher quality environment for citizens and businesses. Contrary, poor public governance can deteriorate the business
Figure 19: The relationship between e-government development and government effectiveness
Source: United Nations, 2020b; World Bank, 2020a; own elaboration

CASE STUDY36
environment as it can increase risks and impose administrative barriers, which hamper business sector (Thanh & Hoai, 2019). In this context, it is also emphasized that effective e-government facilitate companies, including SMEs, handling various administrative procedures online (European Commission, 2019e). Therefore, in order to identify the relationship between e-government and business environment a correlation analysis is performed by considering the relationship between E-Government Development Index and: 1) Government Effectiveness Index; 2) Regulatory Quality Index; and 3) Ease of Doing Business Index. The latest data for 2019/2020 is obtained from UN E-Government Knowledgebase (United Nations, 2020b), Worldwide Governance Indicators Database (World Bank, 2020a) and Doing Business Database (World Bank,
2020b). Figure 19 shows the relationship between E-Government development index and Government Effectiveness Index. Government effectiveness captures perceptions of the quality of public services, the quality of the civil service and the degree of its independence from political pressures, the quality of policy formulation and implementation, and the credibility of the government’s commitment to such policies (World Bank, 2020a). The correlation analysis reveals a positive and strong correlation (r=0.74) between e-government development and government effectiveness.
Moreover, the relationship between Government Development Index and Regulatory Quality Index is also examined. Regulatory quality captures perceptions of the ability of the government to formulate
Figure 20: The relationship between e-government development and regulatory quality
Source: United Nations, 2020b; World Bank, 2020a; own elaboration
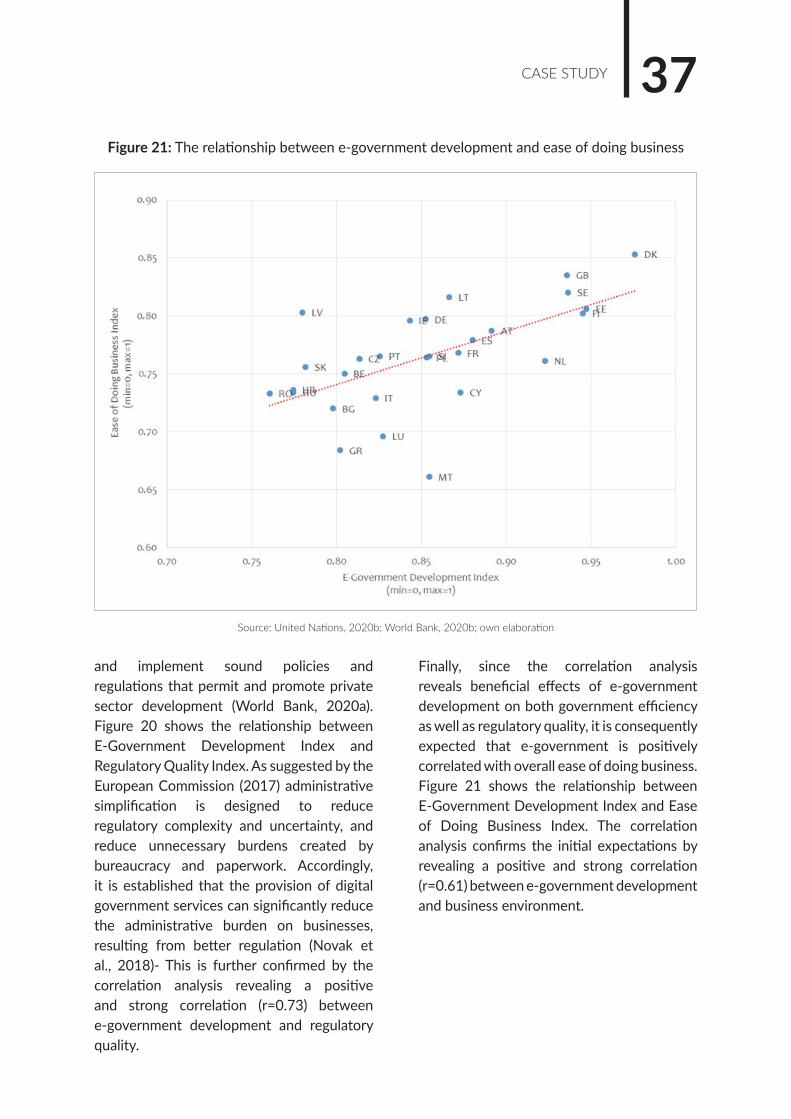
CASE STUDY 37
and implement sound policies and regulations that permit and promote private sector development (World Bank, 2020a). Figure 20 shows the relationship between E-Government Development Index and Regulatory Quality Index. As suggested by the European Commission (2017) administrative simplification is designed to reduce regulatory complexity and uncertainty, and reduce unnecessary burdens created by bureaucracy and paperwork. Accordingly, it is established that the provision of digital government services can significantly reduce the administrative burden on businesses, resulting from better regulation (Novak et al., 2018)- This is further confirmed by the correlation analysis revealing a positive and strong correlation (r=0.73) between e-government development and regulatory quality.
Finally, since the correlation analysis reveals beneficial effects of e-government development on both government efficiency as well as regulatory quality, it is consequently expected that e-government is positively correlated with overall ease of doing business. Figure 21 shows the relationship between E-Government Development Index and Ease of Doing Business Index. The correlation analysis confirms the initial expectations by revealing a positive and strong correlation (r=0.61) between e-government development and business environment.
Figure 21: The relationship between e-government development and ease of doing business
Source: United Nations, 2020b; World Bank, 2020b; own elaboration

CASE STUDY38
7. Implications for Central and Eastern European countries
A review and analysis of recent literature on e-government reveals that although the EU recognizes the importance of government digital transformation, Central and Eastern European (CEE) countries have not fully realized the potential of e-government as they should. Namely, despite their recent impressive progress in modernization and digitalization government they are still lagging behind old EU member states (OMS). The reasons for that can be found in different challenges the CEE countries are facing. These are especially related to multiple contextual factors such as resource limitations, a lack of digital infrastructure and insufficient capacities or capabilities. Moreover, some of these countries face also specific obstacles relating to issues such as digital inclusion, data privacy and cybersecurity (United Nations, 2020a). The role of e-government is can be additionally explained by its beneficial impact on overall business environment in which companies are operating. Moreover, the COVID-19 pandemic has added a sense of urgency, which changed the way that the introduction of digital technologies is perceived - from a longterm strategy to an immediate next step (McKinsey & Company, 2020). Therefore, a concrete actions are needed on the following levers:
• Digital policies and legal framework: An effective national digital transformation means that policymakers are designing regulation and policies that would allow the stale development of digital technologies as well as the ability for user to use them in a safe manner.
• Digital infrastructure: Access to the internet and connectivity are primary enablers for governments and businesses, which allow them to digitize their provision and use of services.
• Digital talent: Investing in digital talent is crucial to ensuring the employability of the current and future workforce.
• Digital culture: Digitalization should become a primary concern for policymakers and should be communicated as such to citizens and businesses.
By following the presented four levers, policymakers should address digital transformation by considering the following pillars:
• Digital government: Establish a digital government with a strong and clear vision to provide core public services to citizens and businesses through online platforms in real time. This needs enhanced digital or technical capabilities, modular IT

CASE STUDY 39
infrastructure and seamless exchange of data between various public agencies.
• Digital ecosystem and innovation: Establish an environment when digital business models and entrepreneurship can prosper. This can be accomplished by increasing collaboration between CEE governments and by promoting the digitalization of the existing businesses and allowing early access to capital for start-ups.
• Digital inclusion and human development: Enhance the digital talent pool by fostering digital skills among people, improving engagement in the labour market, allowing higher inflows of highly qualified migrants, offering e-solutions in healthcare and developing better tailored welfare schemes.
Following the presented guidelines, Central and Eastern European (CEE) countries would be on track to further reduce the gap them and old EU member states (OMS) and thus catch up with the average digital maturity level of the EU. This would also allow CEE governments to improve the provision of public e-services to citizens and businesses, which has also wider effects on entrepreneurship or the business environment as well as the society and economy as a whole. This is also important in the context of the current COVID-19 pandemic and for the time after it in the future.

CASE STUDY40
8. ConclusionDigital technologies profoundly affected social and economic realities, including public administration and public governance. The internet itself has fundamentally affected the relationship between public administrations, citizens and businesses. Consequently, it opened the way for the emergence and development of new public governance model called Digital Era Governance (DEG) in which digital technologies are in the heart of governments’ organizational structures (Wojciech, 2017). Additionally, the COVID-19 pandemic has accelerated the inevitable shift to online channels, creating more impetus for a far-reaching transformation of the economy and society in general (McKinsey & Company, 2020).
The study reveals that digital government and governance are today necessary to ensure fast and high-quality services for citizens and companies. The EU has therefore recognised the importance of e-government and its possible beneficial effects on the business environment in its recent development strategies (i.e. European eGovernment Action Plan 2016-2020, Digital Single Market Strategy 2014-2019, etc.). The review of the existing literature reveals that the EU has improved the level of e-government during the recent years. Moreover, the comparison between Central and Eastern European (CEE) countries or new EU member states and old EU member states (OMS) reveals that the progress of CEE countries in enhancing e-government development is higher than in OMS. However, CEE countries are still lagging behind OMS, meaning they need to do much more to catch up with them and consequently with the average digital maturity level of the EU. However, this
is challenging for CEE countries as they are facing different challenges related to multiple contextual factors such as resource limitations, a lack of digital infrastructure and insufficient capacities or capabilities. Moreover, some of these countries face also specific obstacles relating to issues such as digital inclusion, data privacy and cybersecurity (United Nations, 2020a).
From the perspective of users, the digitalization of public services has several benefits for citizens and businesses. Namely, digital government services can significantly reduce the administrative burden on citizens and companies. Moreover, it also increases transparency about decisions and thus reduces the risk of corruption (Novak et al., 2018). Accordingly, e-government development has consequently beneficial effect on administrative simplification and overall business environment. The results of simple correlation analysis reveals that e-government development positively affects government effectiveness, regulatory quality and ease of doing business.
Although CEE countries seem to have either already implemented digital services or are in the process of doing so, they struggle with e-payments, e-invoices and the interoperability of the data they gather. Therefore, it would be very beneficial for those countries to make some improvements in these areas in order to parry with other EU states and to achieve desirable level of digital maturity. This is of greatest importance from the perspective of the current COVID-19 pandemic as well as from the perspective of the coming uncertain times after the COVID-19 pandemic.

CASE STUDY 41
References 1. Aidis, R. (2005). Institutional barriers to small-and
medium-sized enterprise operations in transition countries. Small business economics, 25(4), 305-317.
2. Alcaide–Muñoz, L., Rodríguez–Bolívar, M. P., Cobo, M. J., & Herrera–Viedma, E. (2017). Analysing the scientific evolution of e-Government using a science mapping approach. Government information quarterly, 34(3), 545-555.
3. Aristovnik, A. & Obadić, A. (2015). The impact and efficiency of public administration excellence on fostering SMEs in EU countries. Amfiteatru Economic Journal, 17(39), 761-774.
4. Charalabidis, Y., Sarantis, D., & Askounis, D. (2009). Knowledge-Driven Project Management in Government Transformation. In Handbook of Research on ICT-Enabled Transformational Government: A Global Perspective (pp. 213-239). IGI Global.
5. Chun, S., Shulman, S., Sandoval, R., & Hovy, E. (2010). Government 2.0: Making connections between citizens, data and government. Information Polity, 15(1, 2), 1-9.
6. Codagnone, C., Misuraca, G., Savoldelli, A., & Lupiañez-Villanueva, F. (2015). Institutional isomorphism, policy networks, and the analytical depreciation of measurement indicators: The case of the EU e-government benchmarking. Telecommunications Policy, 39(3-4), 305-319.
7. Djankov, S., McLiesh, C., & Ramalho, R.M. (2006). Regulation and growth. Economics Letters, 92(3), 395-401.
8. European Commission. (2005). Better Regulation for Growth and Jobs in the European Union. Brussels: European Commission.
9. European Commission. (2007). Action programme for reducing administrative burdens in the European Union. Brussels: European Commission.
10. European Commission. (2014). Public administration scoreboard. Brussels: European Commission.
11. European Commission. (2016). EU eGovernment Action Plan 2016-2020 - Accelerating the digital transformation of government. Brussels: European Commission.
12. European Commission. (2017). Quality of Public Administration. Luxembourg: European Commission.
13. European Commission. (2019a). Exploring Digital Government transformation in the EU – Analysis of the state of the art and review of literature. Luxembourg: European Commission.
14. European Commission. (2019b). eGovernment Benchmark 2019: trust in government is increasingly important for people. Luxembourg: European Commission.
15. European Commission. (2019c). SBA fact sheets. Brussels: European Commission.
16. European Commission. (2019d). Survey on the access to finance of enterprises (SAFE) - Analytical Report 2019. Luxembourg: European Commission.
17. European Commission. (2019e). 2019 SBA Fact Sheet & Scoreboard. Brussels: European Commission.
18. European Commission. (2020a). eGovernment Benchmark 2020 - eGovernment that works for the people. Luxembourg: European Commission.
19. European Commission. (2020b). Shaping the Digital Single Market. Available at: https://ec.europa.eu/digital-single-market/en/shaping-digital-single-market#ThePillars.
20. European Commission. (2020c). European eGovernment Action Plan 2016-2020. Available at: https://ec.europa.eu/digital-single-market/en/european-egovernment-action-plan-2016-2020.
21. European Commission. (2020d). Tallinn Digital Summit - Completing the Digital Single Market State of Play. Available at: https://ec.europa.eu/commission/sites/beta-political/files/making-most-digital-factsheet-tallinn_en.pdf.
22. Digital Single Market - Making the most of the digital opportunities in Europe. Available at: https://ec.europa.eu/digital-single-market/en/news/digital-single-market-making-most-digital-opportunities-europe.
CASE STUDY4223. European Parliament. (2017). Small and Medium-
sized Enterprises: Fact Sheets on the European Union. Strasbourg: European Parliament.
24. Madurai, V. (2018). Web Evolution from 1.0 to 3.0. Available at: https://medium.com/@vivekmadurai/web-evolution-from-1-0-to-3-0-e84f2c06739.
25. McKinsey & Company. (2020). Digital Challengers in the next normal Central and Eastern Europe on a path to digitally-led growth. Bucharest: Digital McKinsey.
26. Novak, J., Purta, M., Marciniak, T., Ignatowicz, K., Rozenbaum, K., & Yearwood, K. (2018). The rise of digital challengers - How digitization can become the next growth engine for Central and Eastern Europe. Bucharest: Digital McKinsey.
27. Obadić, A., & Aristovnik, A. (2016). The Role of Public Administration Performance in improving the Business Environment for SMEs in the EU. Proceedings of 8th International Conference „An Enterprise Odyssey: Saving the Sinking Ship Through Human Capital, Zagreb, Croatia, 8-11 June 2016, 460-469.
28. Obadić, A., Ravšelj, D., & Aristovnik, A. (2020). Administrative Barriers in the Field of Employment in the EU: Empirical Evidence from Croatia and Slovenia. International Journal of Economics & Business Administration (IJEBA), 8(2), 533-553.
29. OECD. (2009). Overcoming barriers to administrative simplification strategies: guidance for policy makers. Paris: OECD.
30. OECD. (2014). Recommendation of the Council on Digital Government Strategies. Paris: OECD.
31. OECD. (2020). The OECD Digital Government Policy Framework - Six dimensions of a Digital Government. Paris: OECD.
32. Ojo, A., & Millard, J. (Eds.). (2017). Government 3.0–Next Generation Government Technology Infrastructure and Services: Roadmaps, Enabling Technologies & Challenges (Vol. 32). Springer.
33. PwC. (2020). Citizens at the centre: Building digital public services in CEE. Available at: https://www.pwc.com/c1/digitalpublicsector.
34. Ravšelj, D. & Hodžić, S. (2020). The Role of Public Governance Practices for Business R&D Activity in the EU. Central European Public Administration Review, 18(1), 125-141.
35. Ravšelj, D., & Hodžić, S. (2020). The role of public governance practices for business R&D activity in the EU. Cent. Eur. Pub. Admin. Rev., 18, 125-141.
36. Samitowska, W. (2011). Barriers to the development of entrepreneurship demonstrated by micro, small and medium enterprises in Poland. Economics & Sociology, 4(2), 42-49.
37. Szczepaǹski, M. (2016). Barriers to SME growth in Europe. Strasbourg: European Parliament.
38. Szczepaǹski, M. (2017). Helping European SMEs to grow: Start-up and scale-up initiatives for business ventures in the EU. Strasbourg: European Parliament.
39. Thanh, S. D., & Hoai, B. T. M. (2020). Local governance, private investment and economic growth: The case of Vietnamese provinces. Journal of Economic Development, 24(4), 4-28.
40. UK Cabinet Office. (2006). Administrative burdens - Routes to reduction. London: Better Regulation Executive.
41. United Nations. (2018). Resolution adopted by the General Assembly on 26 November 2018. New York: United Nations.
42. United Nations. (2020a). E-Government Survey 2020 - Digital Government in the Decade of Action for Sustainable Development. New York: United Nations.
43. United Nations. (2020b). UN E-Government Knowledgebase. Available at: https://publicadministration.un.org/egovkb.
44. Valle-Cruz, D., & Sandoval-Almazán, R. (2014, June). E-gov 4.0: a literature review towards the new government. In Proceedings of the 15th Annual International Conference on Digital Government Research (pp. 333-334).
45. Viderity. (2018). The Future of Digital Government. Available at: https://viderity.com/2018/10/09/the-future-of-digital-government/.
46. Wojciech, B. (2017). Digital Era Governance–a new chapter of public management theory and practice. MAZOWSZE Studia Regionalne, (22), 117-129.
47. World Bank. (2020a). Worldwide Governance Indicators. Washington: World Bank.
48. World Bank. (2020b). Doing Business 2020. Washington: World Bank.

CASE STUDY 43
Zavod 14, zavod za sožitje in napredek is a non-profit (ELF full member) organization and has its headquarters in Ljubljana (Slovenia). Zavod 14 promotes social liberal ideas (balancing between individual liberty and social justice) and protect liberal values (eg. democracy, the rule of law, social development, good governance etc.) Zavod 14`s mission is strengthening the civil society initiative, integration and cooperation of the interested public, transmission of perspectives of interested stakeholders to state and other institutions, cooperation in the preparation and implementation of politics, and contribution in joining the civil society initiative into international integrations.
/zavod14
@stirinajstZavod 14, zavod za sožitje in napredek
Cankarjeva 4 • 1000 Ljubljana
The publication is supported by the Friedrich Naumann Foundation for Freedom. The Friedrich Naumann Foundation for Freedom is not responsible for the content of this publication, or for any use that may be made of it. The views expressed herein are those of the author(s) of the publication alone. These views do not necessarily reflect those of the Friedrich Naumann Foundation for Freedom.